Blucksberg Mountain, SD Map & Demographics
Blucksberg Mountain Map
Blucksberg Mountain Overview
$41,018
PER CAPITA INCOME
$94,563
AVG FAMILY INCOME
$94,000
AVG HOUSEHOLD INCOME
0.32
INEQUALITY / GINI INDEX
619
TOTAL POPULATION
301
MALE POPULATION
318
FEMALE POPULATION
94.65
MALES / 100 FEMALES
105.65
FEMALES / 100 MALES
55.0
MEDIAN AGE
2.9
AVG FAMILY SIZE
3.0
AVG HOUSEHOLD SIZE
344
LABOR FORCE [ PEOPLE ]
59.2%
PERCENT IN LABOR FORCE
Income in Blucksberg Mountain
Income Overview in Blucksberg Mountain
Per Capita Income in Blucksberg Mountain is $41,018, while median incomes of families and households are $94,563 and $94,000 respectively.
| Characteristic | Number | Measure |
| Per Capita Income | 619 | $41,018 |
| Median Family Income | 201 | $94,563 |
| Mean Family Income | 201 | $119,212 |
| Median Household Income | 210 | $94,000 |
| Mean Household Income | 210 | $117,085 |
| Income Deficit | 201 | $0 |
| Wage / Income Gap (%) | 619 | 0.00% |
| Wage / Income Gap ($) | 619 | 100.00¢ per $1 |
| Gini / Inequality Index | 619 | 0.32 |
Earnings by Sex in Blucksberg Mountain
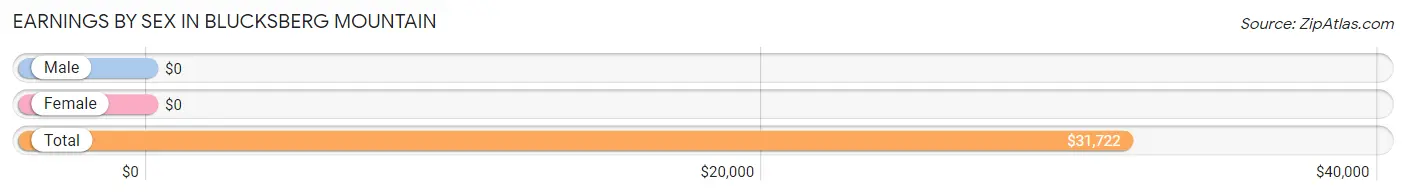
| Sex | Number | Average Earnings |
| Male | 209 (53.9%) | $0 |
| Female | 179 (46.1%) | $0 |
| Total | 388 (100.0%) | $31,722 |
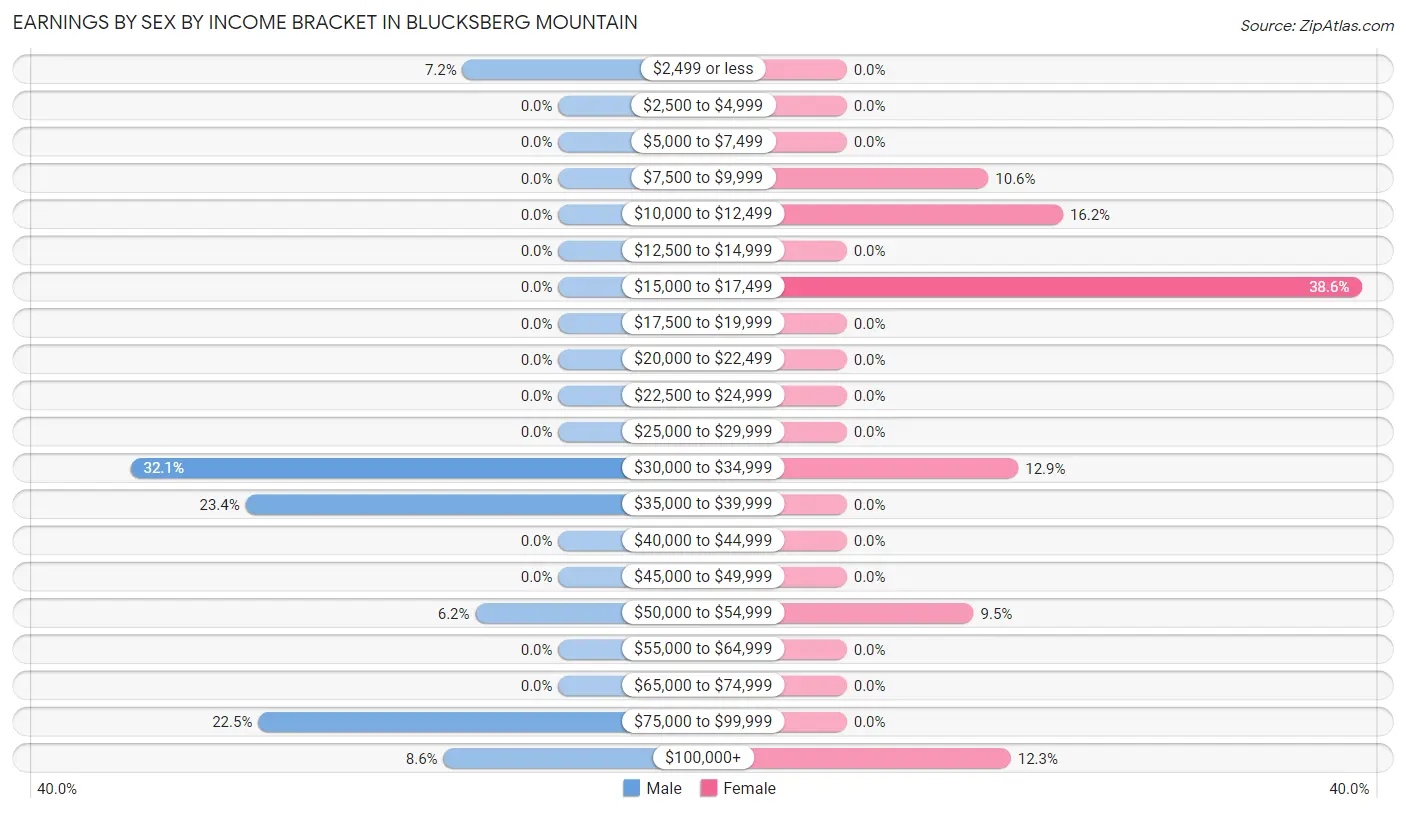
Earnings by Sex by Income Bracket in Blucksberg Mountain
The most common earnings brackets in Blucksberg Mountain are $30,000 to $34,999 for men (67 | 32.1%) and $15,000 to $17,499 for women (69 | 38.6%).
| Income | Male | Female |
| $2,499 or less | 15 (7.2%) | 0 (0.0%) |
| $2,500 to $4,999 | 0 (0.0%) | 0 (0.0%) |
| $5,000 to $7,499 | 0 (0.0%) | 0 (0.0%) |
| $7,500 to $9,999 | 0 (0.0%) | 19 (10.6%) |
| $10,000 to $12,499 | 0 (0.0%) | 29 (16.2%) |
| $12,500 to $14,999 | 0 (0.0%) | 0 (0.0%) |
| $15,000 to $17,499 | 0 (0.0%) | 69 (38.6%) |
| $17,500 to $19,999 | 0 (0.0%) | 0 (0.0%) |
| $20,000 to $22,499 | 0 (0.0%) | 0 (0.0%) |
| $22,500 to $24,999 | 0 (0.0%) | 0 (0.0%) |
| $25,000 to $29,999 | 0 (0.0%) | 0 (0.0%) |
| $30,000 to $34,999 | 67 (32.1%) | 23 (12.9%) |
| $35,000 to $39,999 | 49 (23.4%) | 0 (0.0%) |
| $40,000 to $44,999 | 0 (0.0%) | 0 (0.0%) |
| $45,000 to $49,999 | 0 (0.0%) | 0 (0.0%) |
| $50,000 to $54,999 | 13 (6.2%) | 17 (9.5%) |
| $55,000 to $64,999 | 0 (0.0%) | 0 (0.0%) |
| $65,000 to $74,999 | 0 (0.0%) | 0 (0.0%) |
| $75,000 to $99,999 | 47 (22.5%) | 0 (0.0%) |
| $100,000+ | 18 (8.6%) | 22 (12.3%) |
| Total | 209 (100.0%) | 179 (100.0%) |
Earnings by Sex by Educational Attainment in Blucksberg Mountain
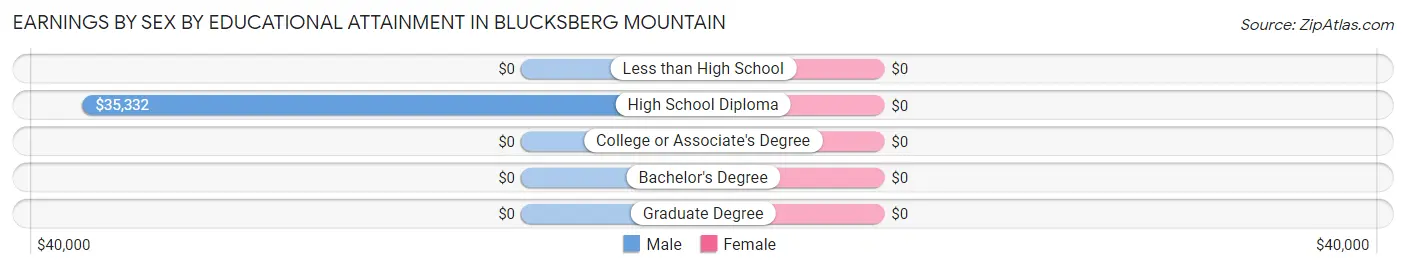
| Educational Attainment | Male Income | Female Income |
| Less than High School | - | - |
| High School Diploma | $35,332 | $0 |
| College or Associate's Degree | - | - |
| Bachelor's Degree | - | - |
| Graduate Degree | - | - |
| Total | - | - |
Family Income in Blucksberg Mountain
Family Income Brackets in Blucksberg Mountain
According to the Blucksberg Mountain family income data, there are 69 families falling into the $75,000 to $99,999 income range, which is the most common income bracket and makes up 34.3% of all families.
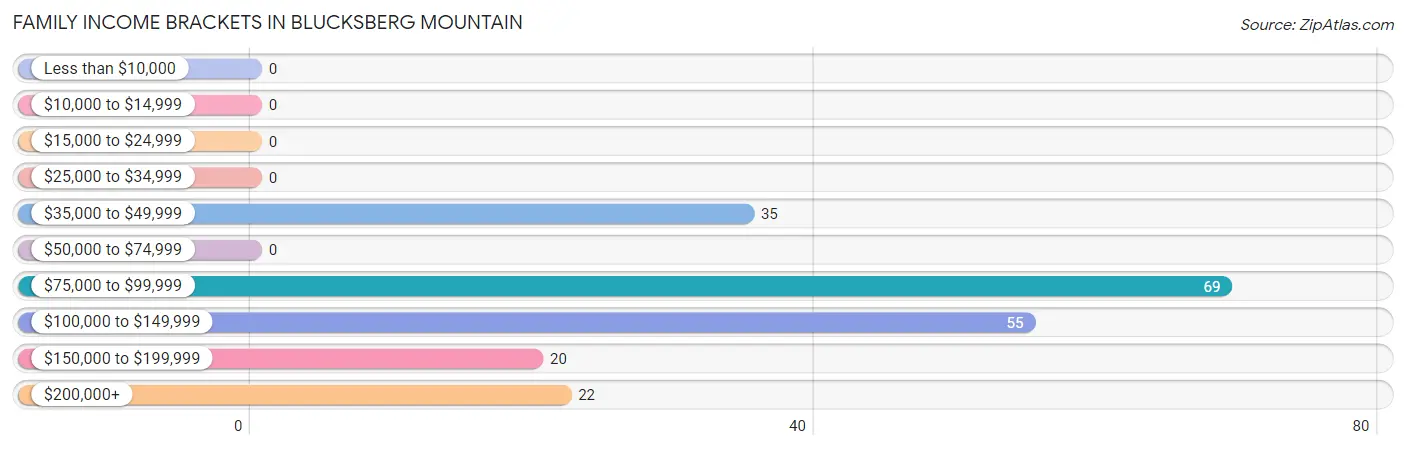
| Income Bracket | # Families | % Families |
| Less than $10,000 | 0 | 0.0% |
| $10,000 to $14,999 | 0 | 0.0% |
| $15,000 to $24,999 | 0 | 0.0% |
| $25,000 to $34,999 | 0 | 0.0% |
| $35,000 to $49,999 | 35 | 17.4% |
| $50,000 to $74,999 | 0 | 0.0% |
| $75,000 to $99,999 | 69 | 34.3% |
| $100,000 to $149,999 | 55 | 27.4% |
| $150,000 to $199,999 | 20 | 10.0% |
| $200,000+ | 22 | 10.9% |
Family Income by Famaliy Size in Blucksberg Mountain
2-person families (110 | 54.7%) account for the highest median family income in Blucksberg Mountain with $98,750 per family, while 2-person families (110 | 54.7%) have the highest median income of $49,375 per family member.
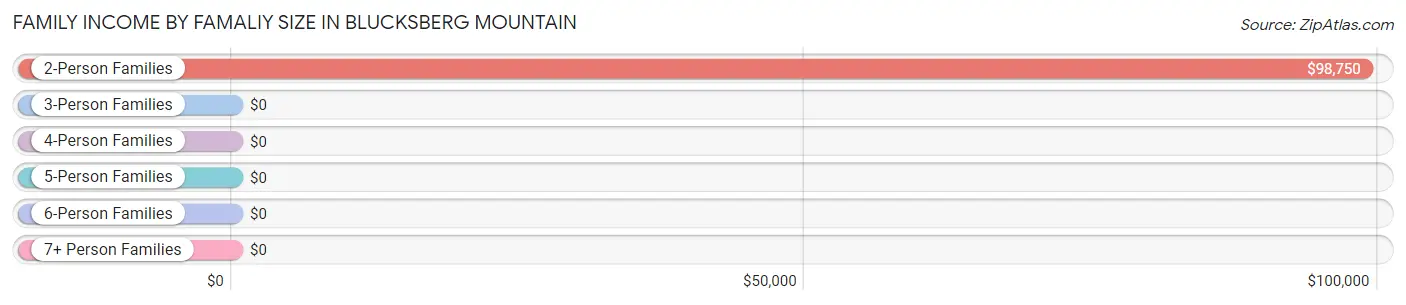
| Income Bracket | # Families | Median Income |
| 2-Person Families | 110 (54.7%) | $98,750 |
| 3-Person Families | 64 (31.8%) | $0 |
| 4-Person Families | 27 (13.4%) | $0 |
| 5-Person Families | 0 (0.0%) | $0 |
| 6-Person Families | 0 (0.0%) | $0 |
| 7+ Person Families | 0 (0.0%) | $0 |
| Total | 201 (100.0%) | $94,563 |
Family Income by Number of Earners in Blucksberg Mountain
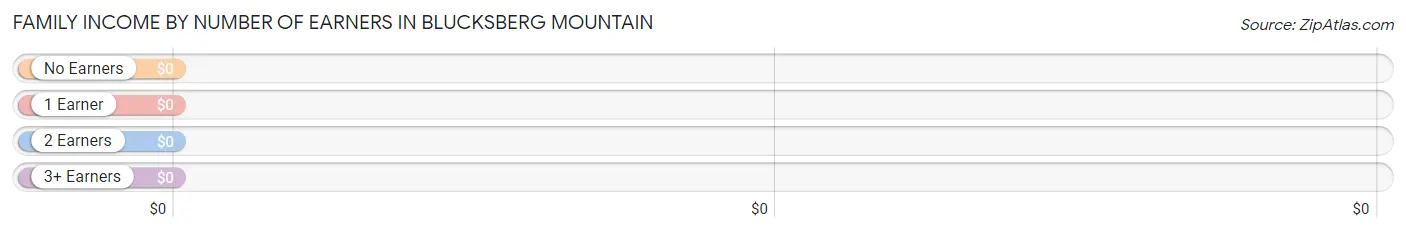
| Number of Earners | # Families | Median Income |
| No Earners | 55 (27.4%) | $0 |
| 1 Earner | 20 (10.0%) | $0 |
| 2 Earners | 62 (30.8%) | $0 |
| 3+ Earners | 64 (31.8%) | $0 |
| Total | 201 (100.0%) | $94,563 |
Household Income in Blucksberg Mountain
Household Income Brackets in Blucksberg Mountain
With 69 households falling in the category, the $75,000 to $99,999 income range is the most frequent in Blucksberg Mountain, accounting for 32.9% of all households.
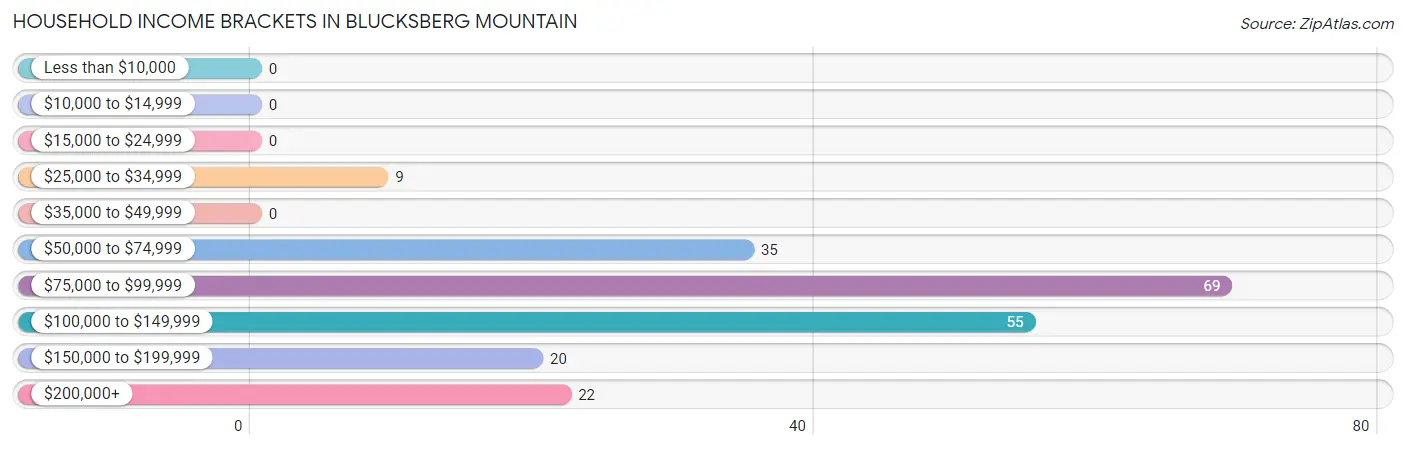
| Income Bracket | # Households | % Households |
| Less than $10,000 | 0 | 0.0% |
| $10,000 to $14,999 | 0 | 0.0% |
| $15,000 to $24,999 | 0 | 0.0% |
| $25,000 to $34,999 | 9 | 4.3% |
| $35,000 to $49,999 | 0 | 0.0% |
| $50,000 to $74,999 | 35 | 16.7% |
| $75,000 to $99,999 | 69 | 32.9% |
| $100,000 to $149,999 | 55 | 26.2% |
| $150,000 to $199,999 | 20 | 9.5% |
| $200,000+ | 22 | 10.5% |
Household Income by Householder Age in Blucksberg Mountain
The median household income in Blucksberg Mountain is $94,000, with the highest median household income of $84,796 found in the 45 to 64 years age bracket for the primary householder. A total of 108 households (51.4%) fall into this category.
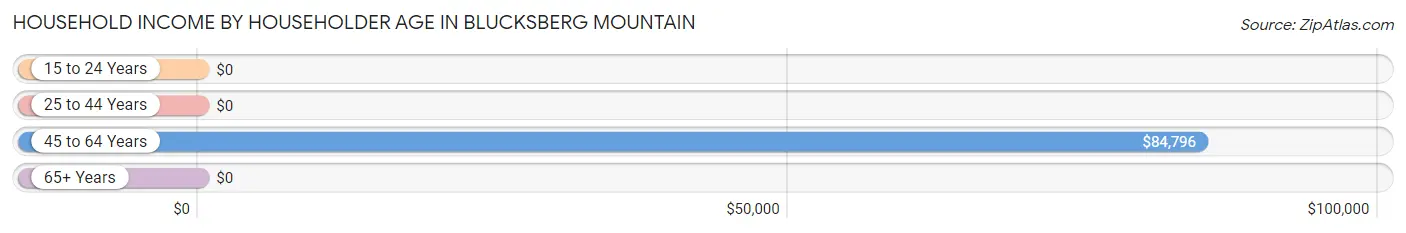
| Income Bracket | # Households | Median Income |
| 15 to 24 Years | 0 (0.0%) | $0 |
| 25 to 44 Years | 27 (12.9%) | $0 |
| 45 to 64 Years | 108 (51.4%) | $84,796 |
| 65+ Years | 75 (35.7%) | $0 |
| Total | 210 (100.0%) | $94,000 |
Poverty in Blucksberg Mountain
Income Below Poverty by Sex and Age in Blucksberg Mountain
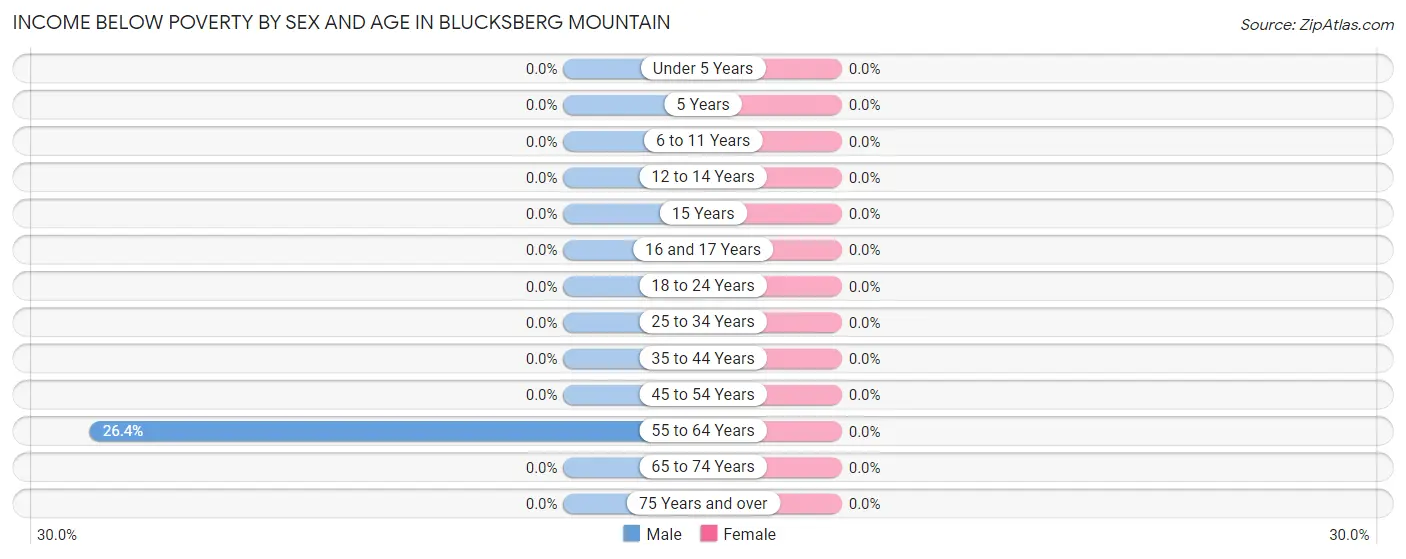
| Age Bracket | Male | Female |
| Under 5 Years | 0 (0.0%) | 0 (0.0%) |
| 5 Years | 0 (0.0%) | 0 (0.0%) |
| 6 to 11 Years | 0 (0.0%) | 0 (0.0%) |
| 12 to 14 Years | 0 (0.0%) | 0 (0.0%) |
| 15 Years | 0 (0.0%) | 0 (0.0%) |
| 16 and 17 Years | 0 (0.0%) | 0 (0.0%) |
| 18 to 24 Years | 0 (0.0%) | 0 (0.0%) |
| 25 to 34 Years | 0 (0.0%) | 0 (0.0%) |
| 35 to 44 Years | 0 (0.0%) | 0 (0.0%) |
| 45 to 54 Years | 0 (0.0%) | 0 (0.0%) |
| 55 to 64 Years | 34 (26.4%) | 0 (0.0%) |
| 65 to 74 Years | 0 (0.0%) | 0 (0.0%) |
| 75 Years and over | 0 (0.0%) | 0 (0.0%) |
| Total | 34 (11.3%) | 0 (0.0%) |
Income Above Poverty by Sex and Age in Blucksberg Mountain
According to the poverty statistics in Blucksberg Mountain, males aged under 5 years and females aged 16 and 17 years are the age groups that are most secure financially, with 100.0% of males and 100.0% of females in these age groups living above the poverty line.
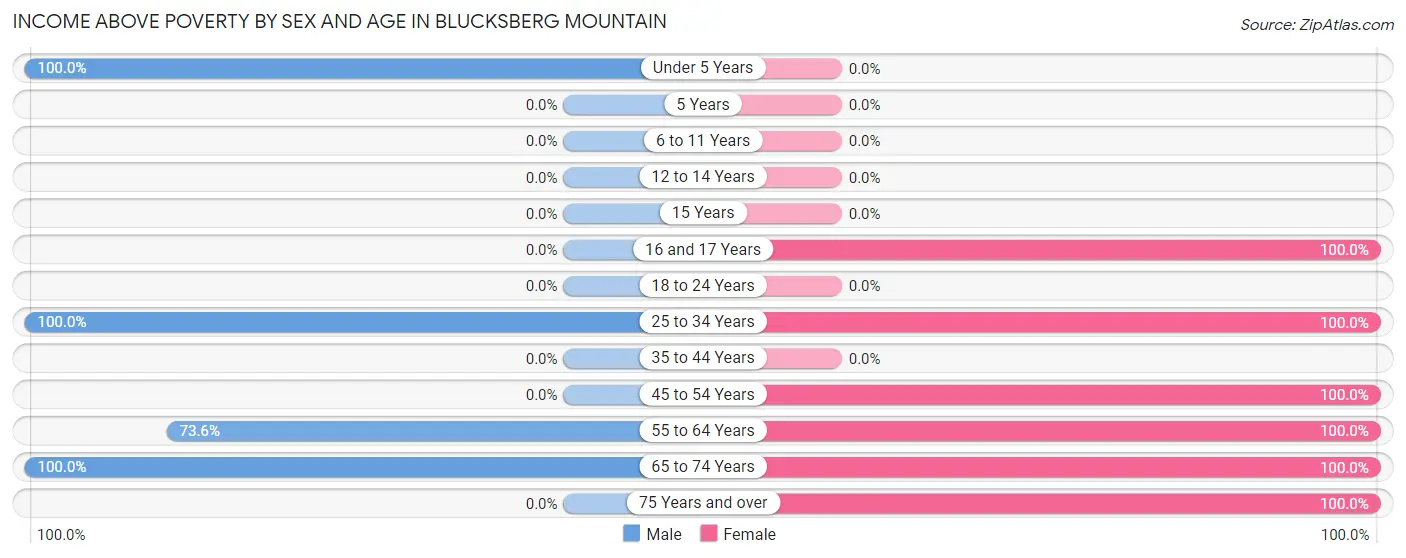
| Age Bracket | Male | Female |
| Under 5 Years | 38 (100.0%) | 0 (0.0%) |
| 5 Years | 0 (0.0%) | 0 (0.0%) |
| 6 to 11 Years | 0 (0.0%) | 0 (0.0%) |
| 12 to 14 Years | 0 (0.0%) | 0 (0.0%) |
| 15 Years | 0 (0.0%) | 0 (0.0%) |
| 16 and 17 Years | 0 (0.0%) | 19 (100.0%) |
| 18 to 24 Years | 0 (0.0%) | 0 (0.0%) |
| 25 to 34 Years | 94 (100.0%) | 29 (100.0%) |
| 35 to 44 Years | 0 (0.0%) | 0 (0.0%) |
| 45 to 54 Years | 0 (0.0%) | 131 (100.0%) |
| 55 to 64 Years | 95 (73.6%) | 58 (100.0%) |
| 65 to 74 Years | 40 (100.0%) | 46 (100.0%) |
| 75 Years and over | 0 (0.0%) | 35 (100.0%) |
| Total | 267 (88.7%) | 318 (100.0%) |
Income Below Poverty Among Married-Couple Families in Blucksberg Mountain
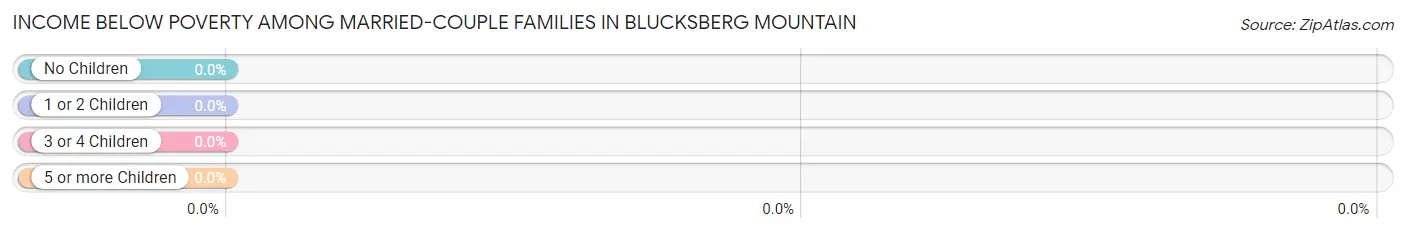
| Children | Above Poverty | Below Poverty |
| No Children | 124 (100.0%) | 0 (0.0%) |
| 1 or 2 Children | 42 (100.0%) | 0 (0.0%) |
| 3 or 4 Children | 0 (0.0%) | 0 (0.0%) |
| 5 or more Children | 0 (0.0%) | 0 (0.0%) |
| Total | 166 (100.0%) | 0 (0.0%) |
Income Below Poverty Among Single-Parent Households in Blucksberg Mountain
| Children | Single Father | Single Mother |
| No Children | 0 (0.0%) | 0 (0.0%) |
| 1 or 2 Children | 0 (0.0%) | 0 (0.0%) |
| 3 or 4 Children | 0 (0.0%) | 0 (0.0%) |
| 5 or more Children | 0 (0.0%) | 0 (0.0%) |
| Total | 0 (0.0%) | 0 (0.0%) |
Income Below Poverty Among Married-Couple vs Single-Parent Households in Blucksberg Mountain
| Children | Married-Couple Families | Single-Parent Households |
| No Children | 0 (0.0%) | 0 (0.0%) |
| 1 or 2 Children | 0 (0.0%) | 0 (0.0%) |
| 3 or 4 Children | 0 (0.0%) | 0 (0.0%) |
| 5 or more Children | 0 (0.0%) | 0 (0.0%) |
| Total | 0 (0.0%) | 0 (0.0%) |
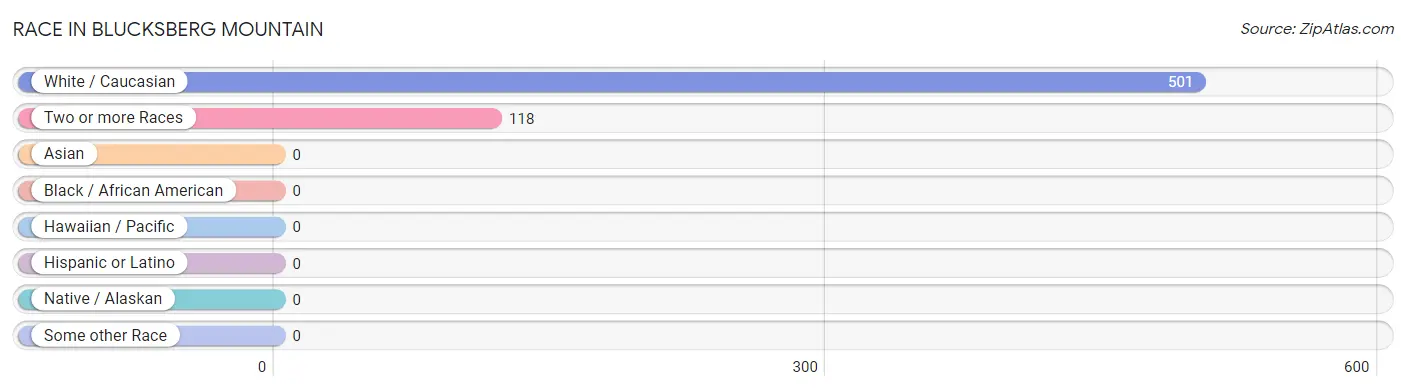
Race in Blucksberg Mountain
The most populous races in Blucksberg Mountain are White / Caucasian (501 | 80.9%), and Two or more Races (118 | 19.1%).
| Race | # Population | % Population |
| Asian | 0 | 0.0% |
| Black / African American | 0 | 0.0% |
| Hawaiian / Pacific | 0 | 0.0% |
| Hispanic or Latino | 0 | 0.0% |
| Native / Alaskan | 0 | 0.0% |
| White / Caucasian | 501 | 80.9% |
| Two or more Races | 118 | 19.1% |
| Some other Race | 0 | 0.0% |
| Total | 619 | 100.0% |
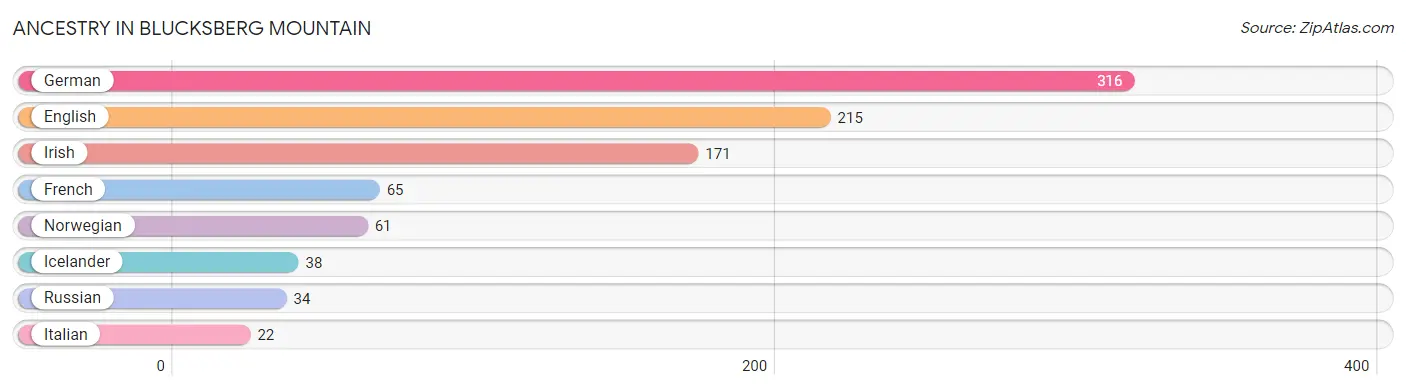
Ancestry in Blucksberg Mountain
The most populous ancestries reported in Blucksberg Mountain are German (316 | 51.0%), English (215 | 34.7%), Irish (171 | 27.6%), French (65 | 10.5%), and Norwegian (61 | 9.9%), together accounting for 133.8% of all Blucksberg Mountain residents.
| Ancestry | # Population | % Population |
| English | 215 | 34.7% |
| French | 65 | 10.5% |
| German | 316 | 51.0% |
| Icelander | 38 | 6.1% |
| Irish | 171 | 27.6% |
| Italian | 22 | 3.5% |
| Norwegian | 61 | 9.9% |
| Russian | 34 | 5.5% | View All 8 Rows |
Immigrants in Blucksberg Mountain
The most numerous immigrant groups reported in Blucksberg Mountain came from , and Canada (29 | 4.7%), together accounting for 4.7% of all Blucksberg Mountain residents.

| Immigration Origin | # Population | % Population |
| Canada | 29 | 4.7% | View All 1 Rows |
Sex and Age in Blucksberg Mountain
Sex and Age in Blucksberg Mountain
The most populous age groups in Blucksberg Mountain are 60 to 64 Years (96 | 31.9%) for men and 50 to 54 Years (108 | 34.0%) for women.
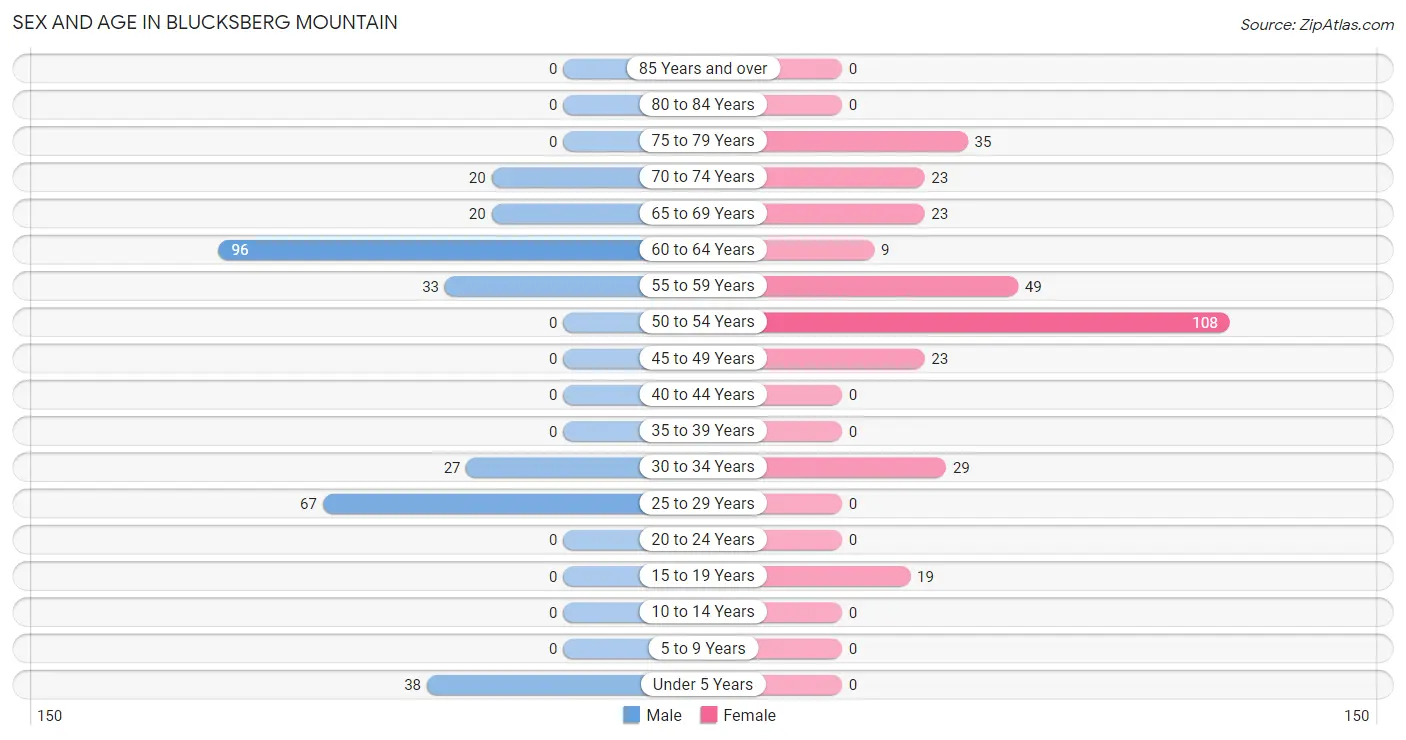
| Age Bracket | Male | Female |
| Under 5 Years | 38 (12.6%) | 0 (0.0%) |
| 5 to 9 Years | 0 (0.0%) | 0 (0.0%) |
| 10 to 14 Years | 0 (0.0%) | 0 (0.0%) |
| 15 to 19 Years | 0 (0.0%) | 19 (6.0%) |
| 20 to 24 Years | 0 (0.0%) | 0 (0.0%) |
| 25 to 29 Years | 67 (22.3%) | 0 (0.0%) |
| 30 to 34 Years | 27 (9.0%) | 29 (9.1%) |
| 35 to 39 Years | 0 (0.0%) | 0 (0.0%) |
| 40 to 44 Years | 0 (0.0%) | 0 (0.0%) |
| 45 to 49 Years | 0 (0.0%) | 23 (7.2%) |
| 50 to 54 Years | 0 (0.0%) | 108 (34.0%) |
| 55 to 59 Years | 33 (11.0%) | 49 (15.4%) |
| 60 to 64 Years | 96 (31.9%) | 9 (2.8%) |
| 65 to 69 Years | 20 (6.6%) | 23 (7.2%) |
| 70 to 74 Years | 20 (6.6%) | 23 (7.2%) |
| 75 to 79 Years | 0 (0.0%) | 35 (11.0%) |
| 80 to 84 Years | 0 (0.0%) | 0 (0.0%) |
| 85 Years and over | 0 (0.0%) | 0 (0.0%) |
| Total | 301 (100.0%) | 318 (100.0%) |
Families and Households in Blucksberg Mountain
Median Family Size in Blucksberg Mountain
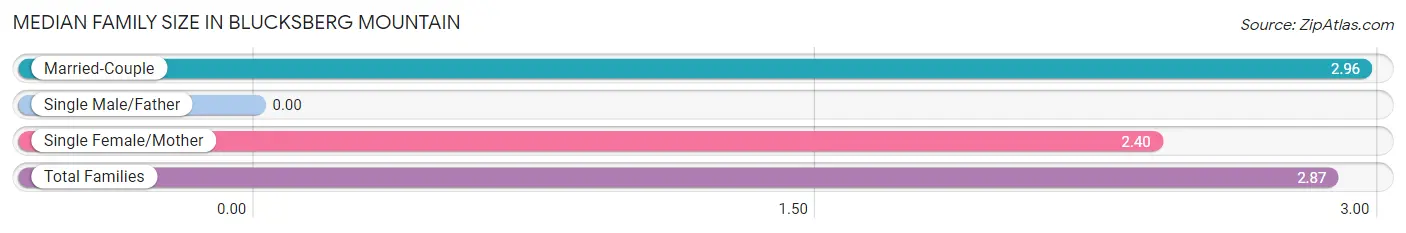
| Family Type | # Families | Family Size |
| Married-Couple | 166 (82.6%) | 2.96 |
| Single Male/Father | 0 (0.0%) | - |
| Single Female/Mother | 35 (17.4%) | 2.40 |
| Total Families | 201 (100.0%) | 2.87 |
Median Household Size in Blucksberg Mountain
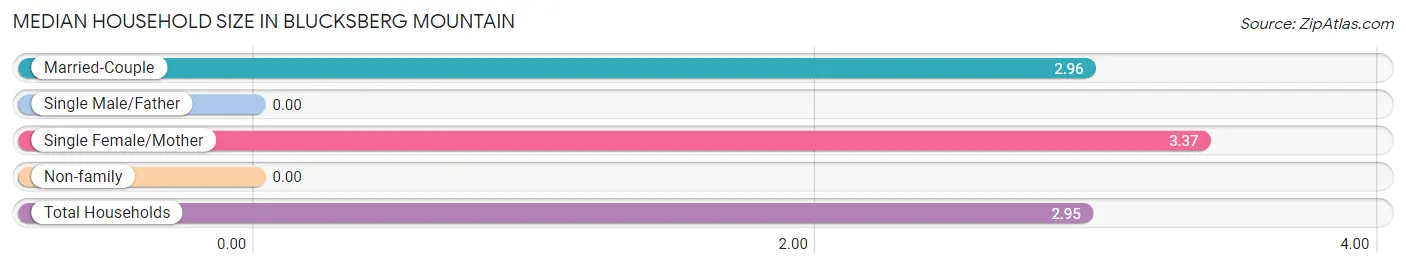
| Household Type | # Households | Household Size |
| Married-Couple | 166 (79.0%) | 2.96 |
| Single Male/Father | 0 (0.0%) | - |
| Single Female/Mother | 35 (16.7%) | 3.37 |
| Non-family | 9 (4.3%) | - |
| Total Households | 210 (100.0%) | 2.95 |
Household Size by Marriage Status in Blucksberg Mountain
Out of a total of 210 households in Blucksberg Mountain, 201 (95.7%) are family households, while 9 (4.3%) are nonfamily households. The most numerous type of family households are 3-person households, comprising 99, and the most common type of nonfamily households are 1-person households, comprising 9.
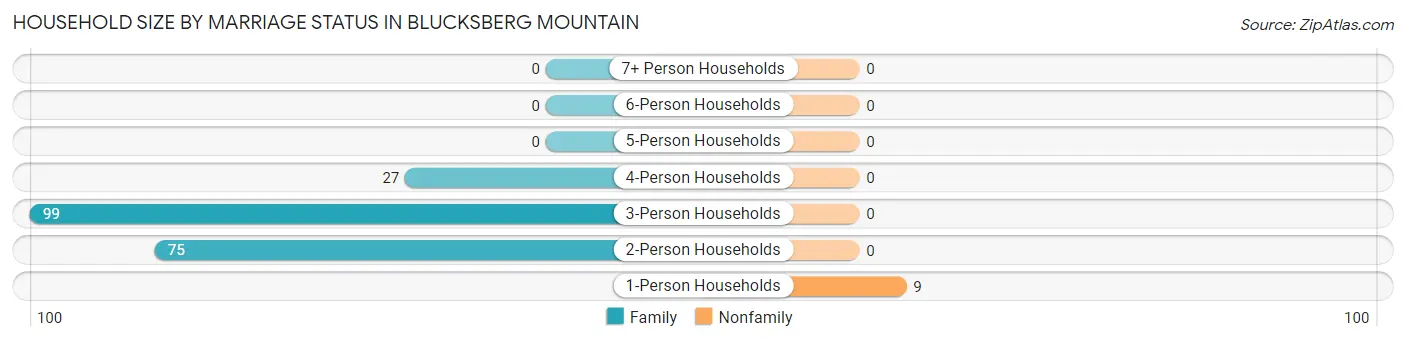
| Household Size | Family Households | Nonfamily Households |
| 1-Person Households | - | 9 (4.3%) |
| 2-Person Households | 75 (35.7%) | 0 (0.0%) |
| 3-Person Households | 99 (47.1%) | 0 (0.0%) |
| 4-Person Households | 27 (12.9%) | 0 (0.0%) |
| 5-Person Households | 0 (0.0%) | 0 (0.0%) |
| 6-Person Households | 0 (0.0%) | 0 (0.0%) |
| 7+ Person Households | 0 (0.0%) | 0 (0.0%) |
| Total | 201 (95.7%) | 9 (4.3%) |
Female Fertility in Blucksberg Mountain
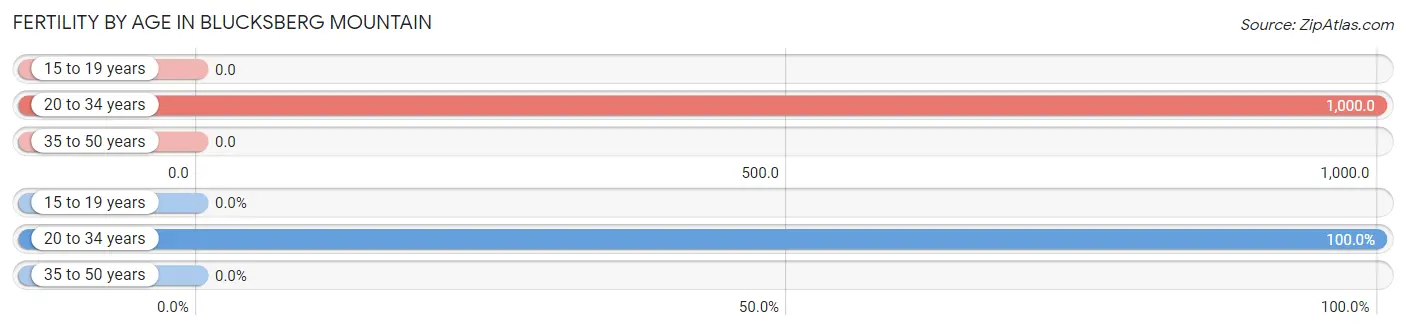
Fertility by Age in Blucksberg Mountain
Average fertility rate in Blucksberg Mountain is 408.0 births per 1,000 women. Women in the age bracket of 20 to 34 years have the highest fertility rate with 1,000.0 births per 1,000 women. Women in the age bracket of 20 to 34 years acount for 100.0% of all women with births.
| Age Bracket | Women with Births | Births / 1,000 Women |
| 15 to 19 years | 0 (0.0%) | 0.0 |
| 20 to 34 years | 29 (100.0%) | 1,000.0 |
| 35 to 50 years | 0 (0.0%) | 0.0 |
| Total | 29 (100.0%) | 408.0 |
Fertility by Age by Marriage Status in Blucksberg Mountain
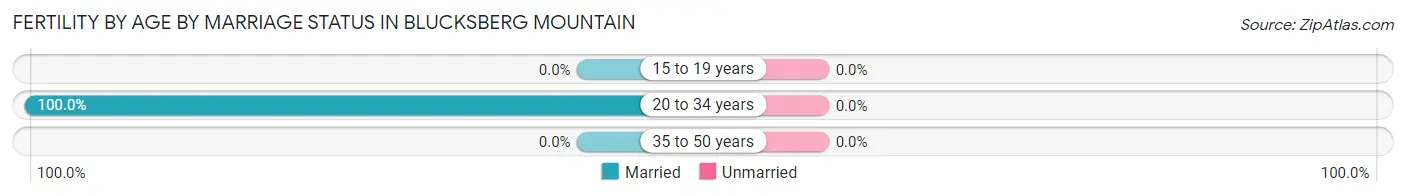
| Age Bracket | Married | Unmarried |
| 15 to 19 years | 0 (0.0%) | 0 (0.0%) |
| 20 to 34 years | 29 (100.0%) | 0 (0.0%) |
| 35 to 50 years | 0 (0.0%) | 0 (0.0%) |
| Total | 29 (100.0%) | 0 (0.0%) |
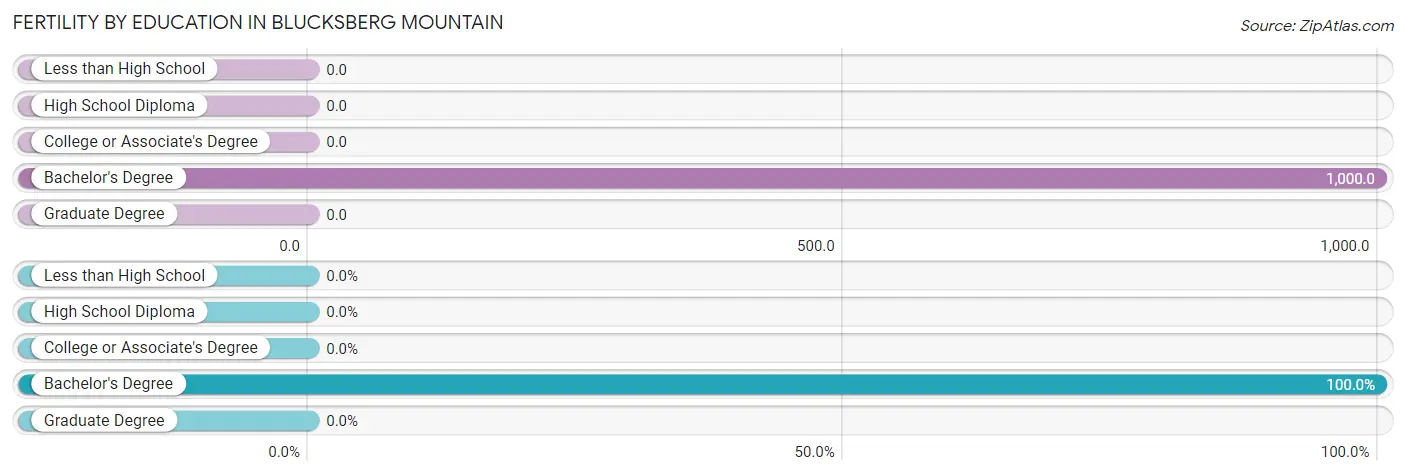
Fertility by Education in Blucksberg Mountain
| Educational Attainment | Women with Births | Births / 1,000 Women |
| Less than High School | 0 (0.0%) | 0.0 |
| High School Diploma | 0 (0.0%) | 0.0 |
| College or Associate's Degree | 0 (0.0%) | 0.0 |
| Bachelor's Degree | 29 (100.0%) | 1,000.0 |
| Graduate Degree | 0 (0.0%) | 0.0 |
| Total | 29 (100.0%) | 408.0 |
Fertility by Education by Marriage Status in Blucksberg Mountain
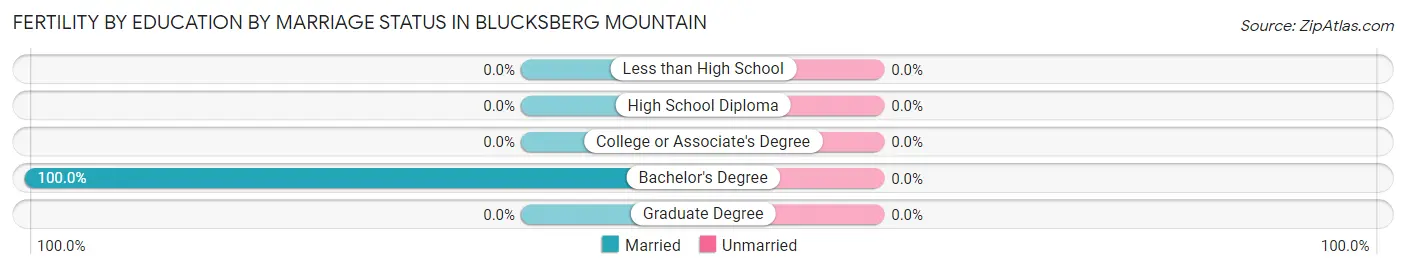
| Educational Attainment | Married | Unmarried |
| Less than High School | 0 (0.0%) | 0 (0.0%) |
| High School Diploma | 0 (0.0%) | 0 (0.0%) |
| College or Associate's Degree | 0 (0.0%) | 0 (0.0%) |
| Bachelor's Degree | 29 (100.0%) | 0 (0.0%) |
| Graduate Degree | 0 (0.0%) | 0 (0.0%) |
| Total | 29 (100.0%) | 0 (0.0%) |
Employment Characteristics in Blucksberg Mountain
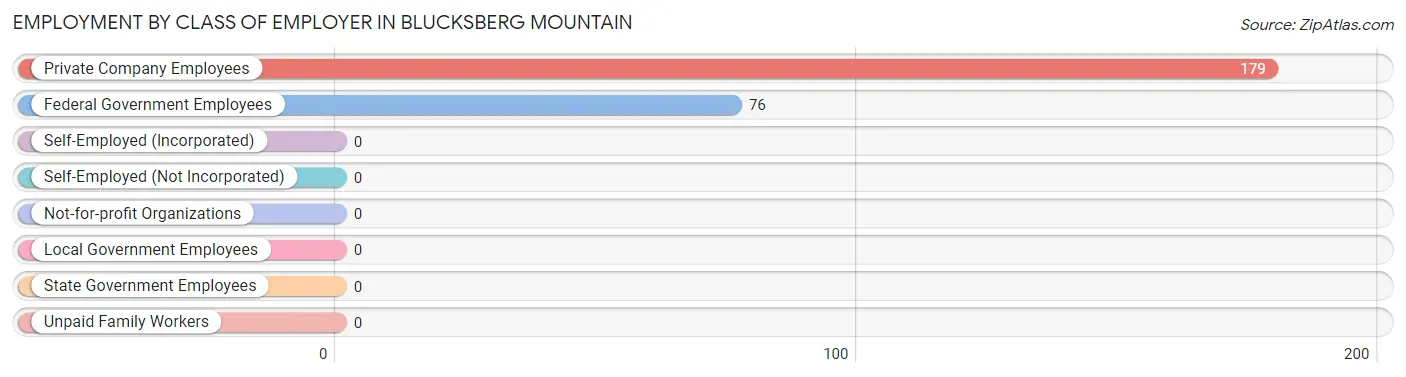
Employment by Class of Employer in Blucksberg Mountain
Among the 255 employed individuals in Blucksberg Mountain, private company employees (179 | 70.2%), and federal government employees (76 | 29.8%) make up the most common classes of employment.
| Employer Class | # Employees | % Employees |
| Private Company Employees | 179 | 70.2% |
| Self-Employed (Incorporated) | 0 | 0.0% |
| Self-Employed (Not Incorporated) | 0 | 0.0% |
| Not-for-profit Organizations | 0 | 0.0% |
| Local Government Employees | 0 | 0.0% |
| State Government Employees | 0 | 0.0% |
| Federal Government Employees | 76 | 29.8% |
| Unpaid Family Workers | 0 | 0.0% |
| Total | 255 | 100.0% |
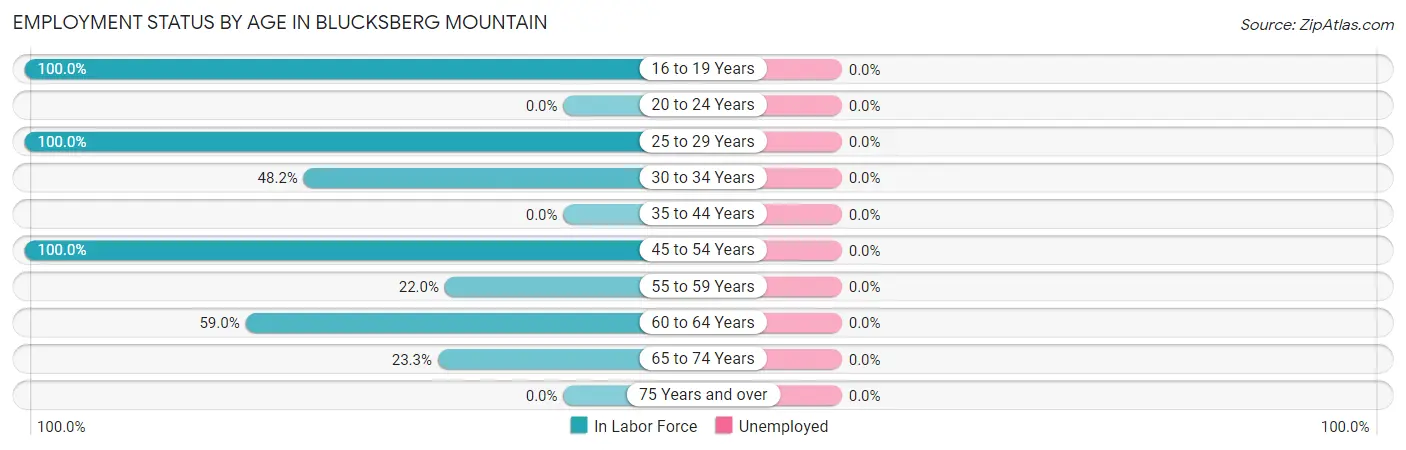
Employment Status by Age in Blucksberg Mountain
| Age Bracket | In Labor Force | Unemployed |
| 16 to 19 Years | 19 (100.0%) | 0 (0.0%) |
| 20 to 24 Years | 0 (0.0%) | 0 (0.0%) |
| 25 to 29 Years | 67 (100.0%) | 0 (0.0%) |
| 30 to 34 Years | 27 (48.2%) | 0 (0.0%) |
| 35 to 44 Years | 0 (0.0%) | 0 (0.0%) |
| 45 to 54 Years | 131 (100.0%) | 0 (0.0%) |
| 55 to 59 Years | 18 (22.0%) | 0 (0.0%) |
| 60 to 64 Years | 62 (59.0%) | 0 (0.0%) |
| 65 to 74 Years | 20 (23.3%) | 0 (0.0%) |
| 75 Years and over | 0 (0.0%) | 0 (0.0%) |
| Total | 344 (59.2%) | 0 (0.0%) |
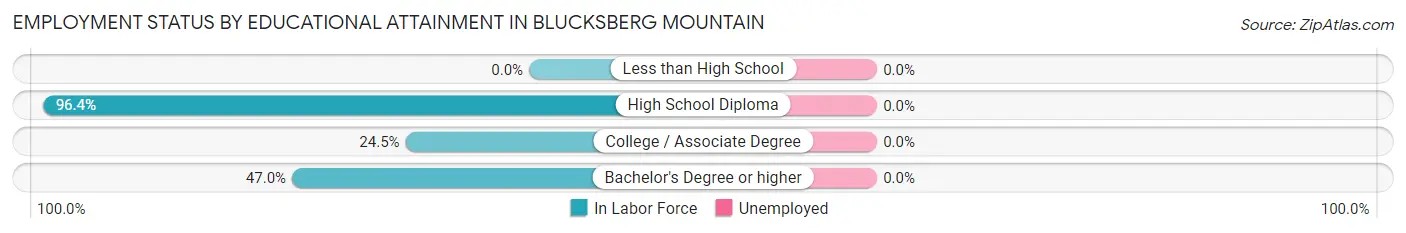
Employment Status by Educational Attainment in Blucksberg Mountain
| Educational Attainment | In Labor Force | Unemployed |
| Less than High School | 0 (0.0%) | 0 (0.0%) |
| High School Diploma | 239 (96.4%) | 0 (0.0%) |
| College / Associate Degree | 27 (24.5%) | 0 (0.0%) |
| Bachelor's Degree or higher | 39 (47.0%) | 0 (0.0%) |
| Total | 305 (69.2%) | 0 (0.0%) |
Employment Occupations by Sex in Blucksberg Mountain
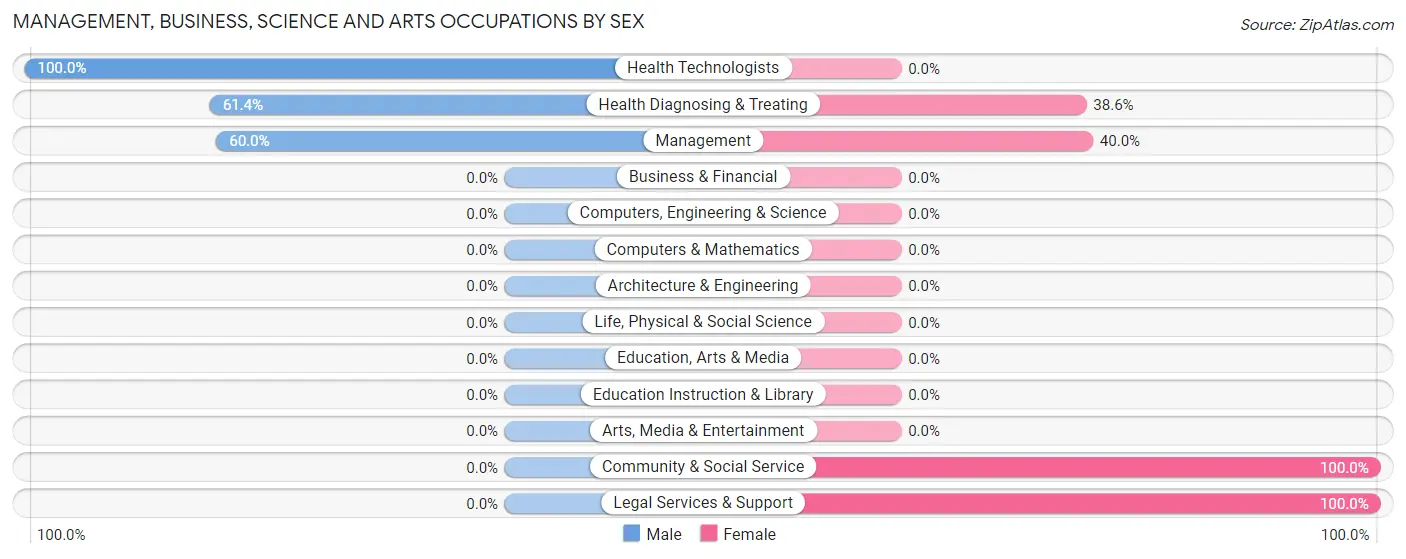
Management, Business, Science and Arts Occupations
The most common Management, Business, Science and Arts occupations in Blucksberg Mountain are Management (55 | 16.0%), Health Diagnosing & Treating (44 | 12.8%), Health Technologists (27 | 7.9%), Community & Social Service (23 | 6.7%), and Legal Services & Support (23 | 6.7%).
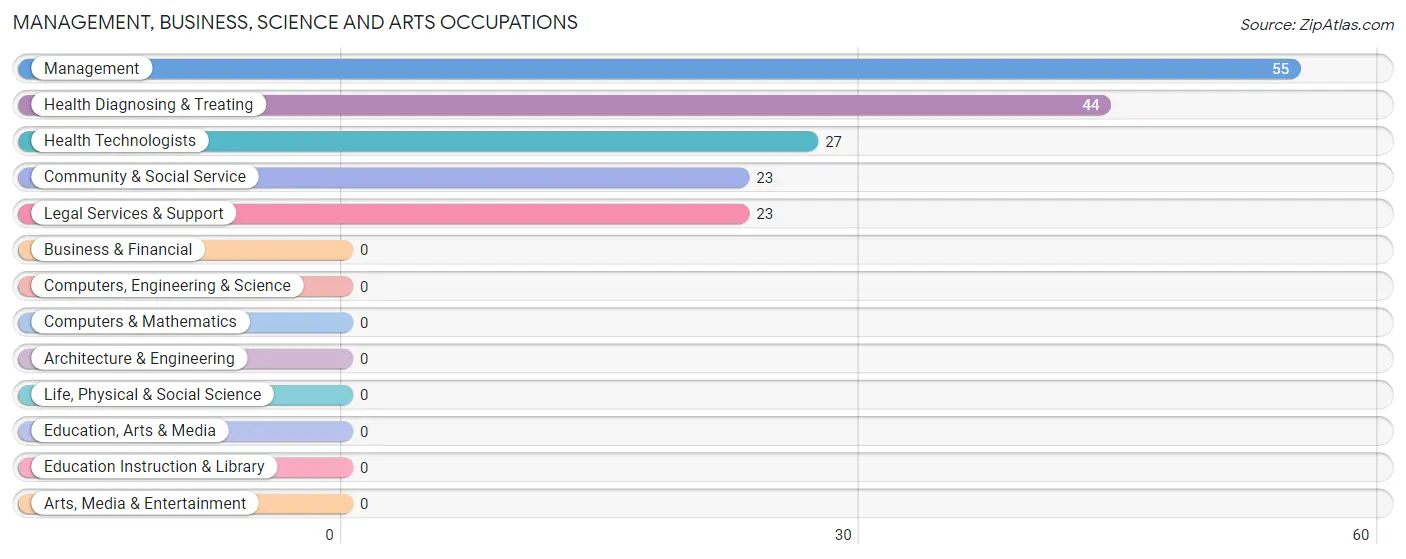
Management, Business, Science and Arts Occupations by Sex
Within the Management, Business, Science and Arts occupations in Blucksberg Mountain, the most male-oriented occupations are Health Technologists (100.0%), Health Diagnosing & Treating (61.4%), and Management (60.0%), while the most female-oriented occupations are Community & Social Service (100.0%), Legal Services & Support (100.0%), and Management (40.0%).
| Occupation | Male | Female |
| Management | 33 (60.0%) | 22 (40.0%) |
| Business & Financial | 0 (0.0%) | 0 (0.0%) |
| Computers, Engineering & Science | 0 (0.0%) | 0 (0.0%) |
| Computers & Mathematics | 0 (0.0%) | 0 (0.0%) |
| Architecture & Engineering | 0 (0.0%) | 0 (0.0%) |
| Life, Physical & Social Science | 0 (0.0%) | 0 (0.0%) |
| Community & Social Service | 0 (0.0%) | 23 (100.0%) |
| Education, Arts & Media | 0 (0.0%) | 0 (0.0%) |
| Legal Services & Support | 0 (0.0%) | 23 (100.0%) |
| Education Instruction & Library | 0 (0.0%) | 0 (0.0%) |
| Arts, Media & Entertainment | 0 (0.0%) | 0 (0.0%) |
| Health Diagnosing & Treating | 27 (61.4%) | 17 (38.6%) |
| Health Technologists | 27 (100.0%) | 0 (0.0%) |
| Total (Category) | 60 (49.2%) | 62 (50.8%) |
| Total (Overall) | 194 (56.4%) | 150 (43.6%) |
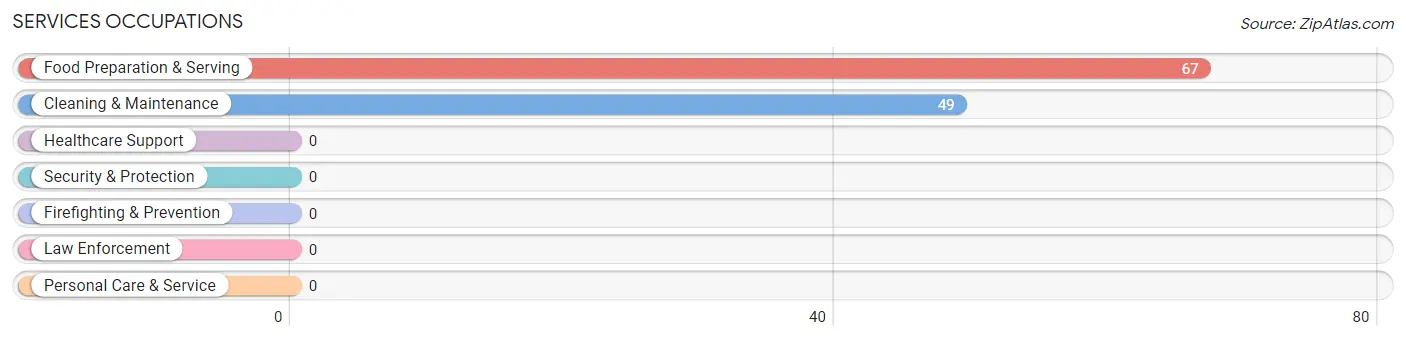
Services Occupations
The most common Services occupations in Blucksberg Mountain are Food Preparation & Serving (67 | 19.5%), and Cleaning & Maintenance (49 | 14.2%).
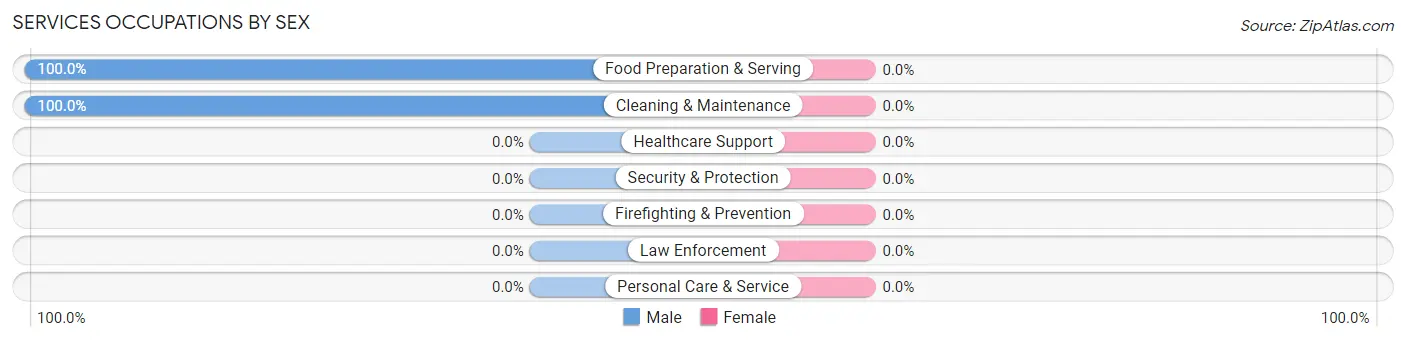
Services Occupations by Sex
| Occupation | Male | Female |
| Healthcare Support | 0 (0.0%) | 0 (0.0%) |
| Security & Protection | 0 (0.0%) | 0 (0.0%) |
| Firefighting & Prevention | 0 (0.0%) | 0 (0.0%) |
| Law Enforcement | 0 (0.0%) | 0 (0.0%) |
| Food Preparation & Serving | 67 (100.0%) | 0 (0.0%) |
| Cleaning & Maintenance | 49 (100.0%) | 0 (0.0%) |
| Personal Care & Service | 0 (0.0%) | 0 (0.0%) |
| Total (Category) | 116 (100.0%) | 0 (0.0%) |
| Total (Overall) | 194 (56.4%) | 150 (43.6%) |
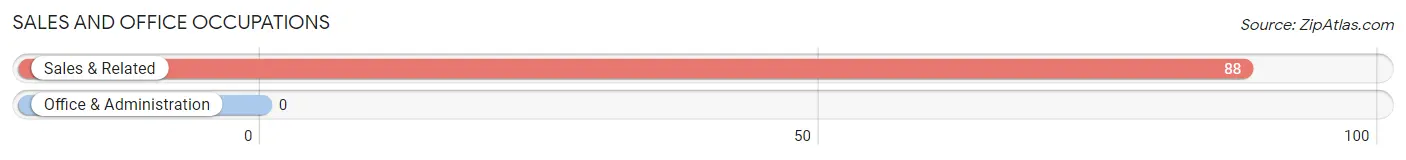
Sales and Office Occupations
The most common Sales and Office occupations in Blucksberg Mountain are , and Sales & Related (88 | 25.6%).
Sales and Office Occupations by Sex

| Occupation | Male | Female |
| Sales & Related | 0 (0.0%) | 88 (100.0%) |
| Office & Administration | 0 (0.0%) | 0 (0.0%) |
| Total (Category) | 0 (0.0%) | 88 (100.0%) |
| Total (Overall) | 194 (56.4%) | 150 (43.6%) |
Natural Resources, Construction and Maintenance Occupations
Natural Resources, Construction and Maintenance Occupations by Sex
| Occupation | Male | Female |
| Farming, Fishing & Forestry | 0 (0.0%) | 0 (0.0%) |
| Construction & Extraction | 0 (0.0%) | 0 (0.0%) |
| Installation, Maintenance & Repair | 0 (0.0%) | 0 (0.0%) |
| Total (Category) | 0 (0.0%) | 0 (0.0%) |
| Total (Overall) | 194 (56.4%) | 150 (43.6%) |
Production, Transportation and Moving Occupations
The most common Production, Transportation and Moving occupations in Blucksberg Mountain are , and Production (18 | 5.2%).
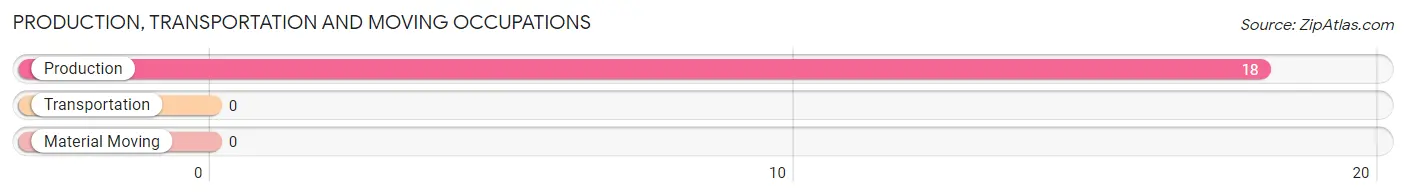
Production, Transportation and Moving Occupations by Sex
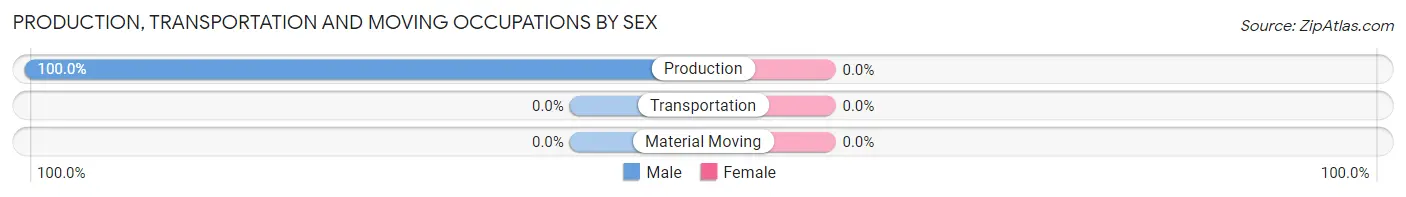
| Occupation | Male | Female |
| Production | 18 (100.0%) | 0 (0.0%) |
| Transportation | 0 (0.0%) | 0 (0.0%) |
| Material Moving | 0 (0.0%) | 0 (0.0%) |
| Total (Category) | 18 (100.0%) | 0 (0.0%) |
| Total (Overall) | 194 (56.4%) | 150 (43.6%) |
Employment Industries by Sex in Blucksberg Mountain
Employment Industries in Blucksberg Mountain
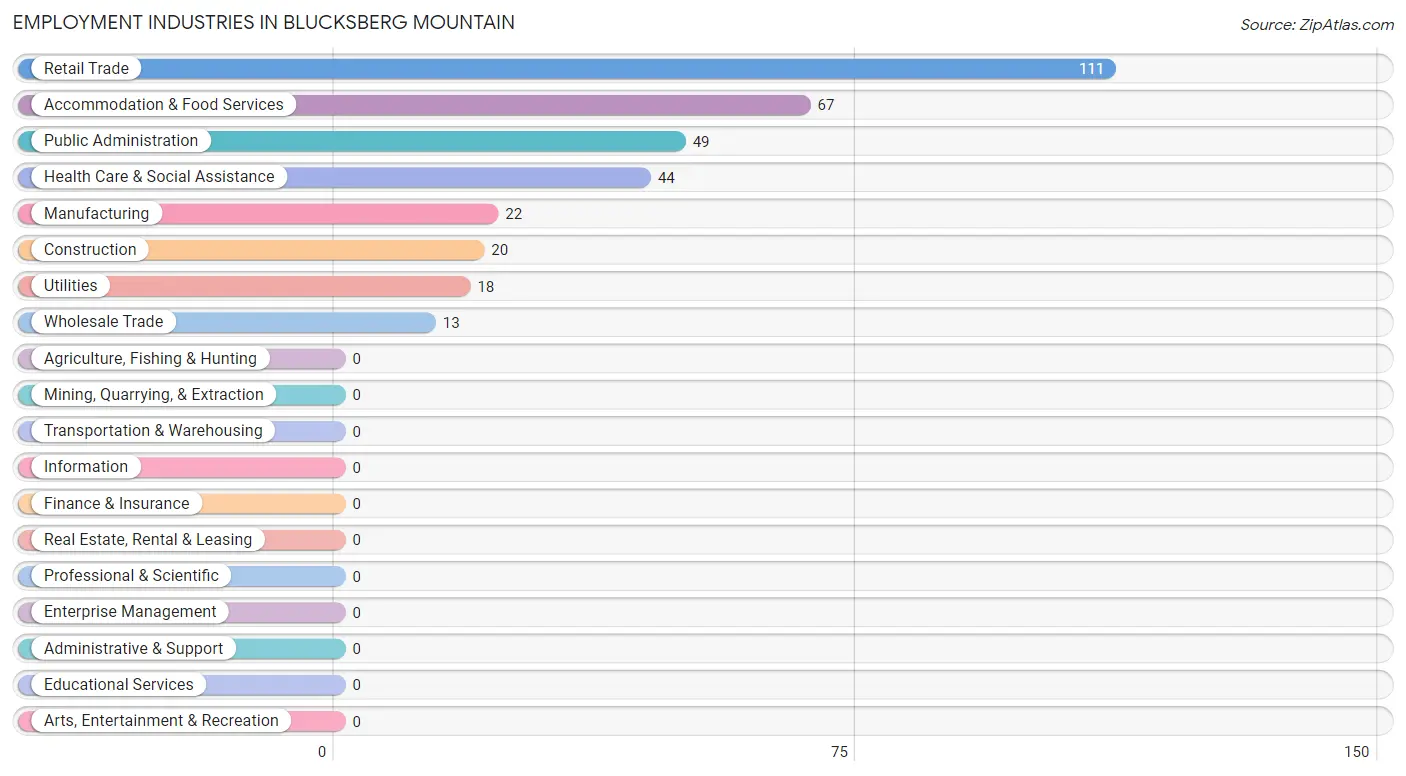
The major employment industries in Blucksberg Mountain include Retail Trade (111 | 32.3%), Accommodation & Food Services (67 | 19.5%), Public Administration (49 | 14.2%), Health Care & Social Assistance (44 | 12.8%), and Manufacturing (22 | 6.4%).
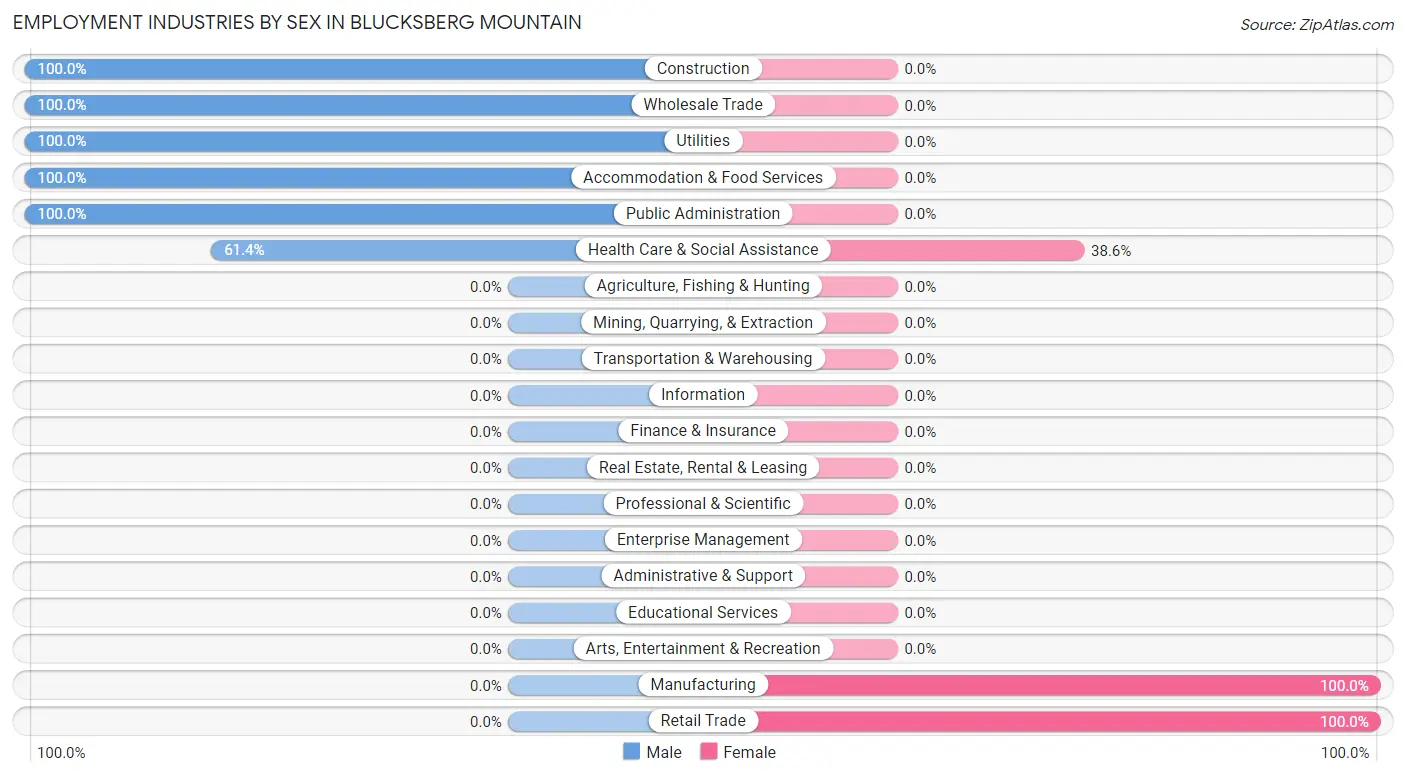
Employment Industries by Sex in Blucksberg Mountain
The Blucksberg Mountain industries that see more men than women are Construction (100.0%), Wholesale Trade (100.0%), and Utilities (100.0%), whereas the industries that tend to have a higher number of women are Manufacturing (100.0%), Retail Trade (100.0%), and Health Care & Social Assistance (38.6%).
| Industry | Male | Female |
| Agriculture, Fishing & Hunting | 0 (0.0%) | 0 (0.0%) |
| Mining, Quarrying, & Extraction | 0 (0.0%) | 0 (0.0%) |
| Construction | 20 (100.0%) | 0 (0.0%) |
| Manufacturing | 0 (0.0%) | 22 (100.0%) |
| Wholesale Trade | 13 (100.0%) | 0 (0.0%) |
| Retail Trade | 0 (0.0%) | 111 (100.0%) |
| Transportation & Warehousing | 0 (0.0%) | 0 (0.0%) |
| Utilities | 18 (100.0%) | 0 (0.0%) |
| Information | 0 (0.0%) | 0 (0.0%) |
| Finance & Insurance | 0 (0.0%) | 0 (0.0%) |
| Real Estate, Rental & Leasing | 0 (0.0%) | 0 (0.0%) |
| Professional & Scientific | 0 (0.0%) | 0 (0.0%) |
| Enterprise Management | 0 (0.0%) | 0 (0.0%) |
| Administrative & Support | 0 (0.0%) | 0 (0.0%) |
| Educational Services | 0 (0.0%) | 0 (0.0%) |
| Health Care & Social Assistance | 27 (61.4%) | 17 (38.6%) |
| Arts, Entertainment & Recreation | 0 (0.0%) | 0 (0.0%) |
| Accommodation & Food Services | 67 (100.0%) | 0 (0.0%) |
| Public Administration | 49 (100.0%) | 0 (0.0%) |
| Total | 194 (56.4%) | 150 (43.6%) |
Education in Blucksberg Mountain
School Enrollment in Blucksberg Mountain
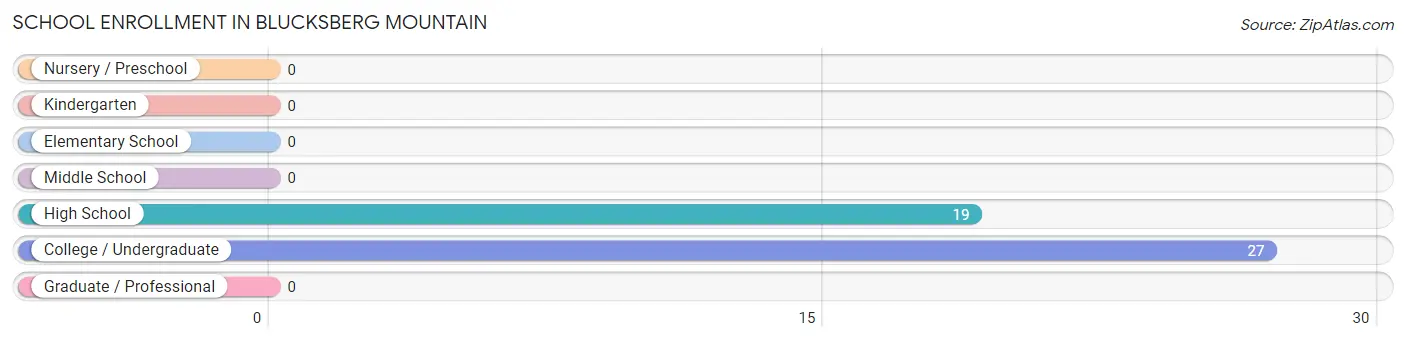
The most common levels of schooling among the 46 students in Blucksberg Mountain are college / undergraduate (27 | 58.7%), and high school (19 | 41.3%).
| School Level | # Students | % Students |
| Nursery / Preschool | 0 | 0.0% |
| Kindergarten | 0 | 0.0% |
| Elementary School | 0 | 0.0% |
| Middle School | 0 | 0.0% |
| High School | 19 | 41.3% |
| College / Undergraduate | 27 | 58.7% |
| Graduate / Professional | 0 | 0.0% |
| Total | 46 | 100.0% |
School Enrollment by Age by Funding Source in Blucksberg Mountain
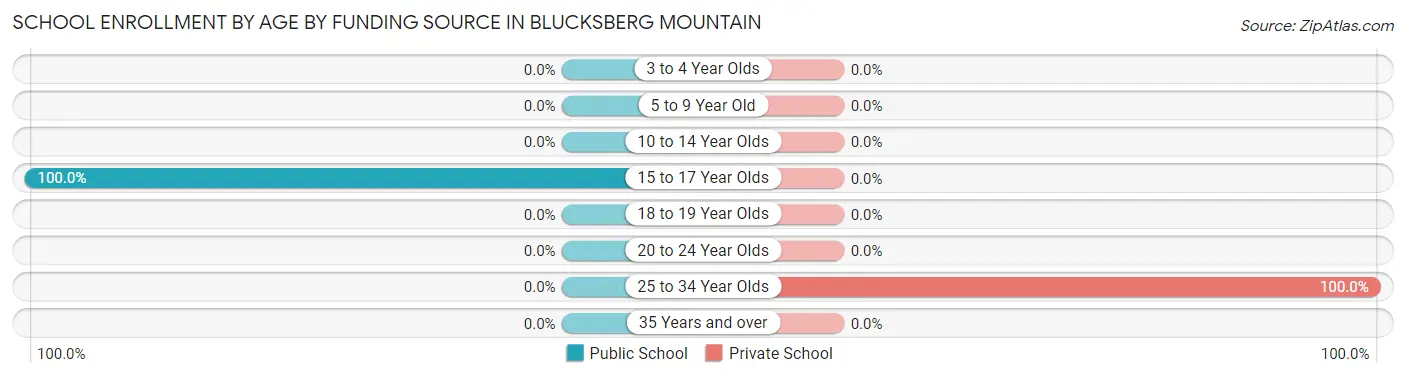
Out of a total of 46 students who are enrolled in schools in Blucksberg Mountain, 27 (58.7%) attend a private institution, while the remaining 19 (41.3%) are enrolled in public schools. The age group of 25 to 34 year olds has the highest likelihood of being enrolled in private schools, with 27 (100.0% in the age bracket) enrolled. Conversely, the age group of 15 to 17 year olds has the lowest likelihood of being enrolled in a private school, with 19 (100.0% in the age bracket) attending a public institution.
| Age Bracket | Public School | Private School |
| 3 to 4 Year Olds | 0 (0.0%) | 0 (0.0%) |
| 5 to 9 Year Old | 0 (0.0%) | 0 (0.0%) |
| 10 to 14 Year Olds | 0 (0.0%) | 0 (0.0%) |
| 15 to 17 Year Olds | 19 (100.0%) | 0 (0.0%) |
| 18 to 19 Year Olds | 0 (0.0%) | 0 (0.0%) |
| 20 to 24 Year Olds | 0 (0.0%) | 0 (0.0%) |
| 25 to 34 Year Olds | 0 (0.0%) | 27 (100.0%) |
| 35 Years and over | 0 (0.0%) | 0 (0.0%) |
| Total | 19 (41.3%) | 27 (58.7%) |
Educational Attainment by Field of Study in Blucksberg Mountain
Education (85 | 45.0%), computers & mathematics (37 | 19.6%), science & technology (29 | 15.3%), visual & performing arts (23 | 12.2%), and bio, nature & agricultural (15 | 7.9%) are the most common fields of study among 189 individuals in Blucksberg Mountain who have obtained a bachelor's degree or higher.
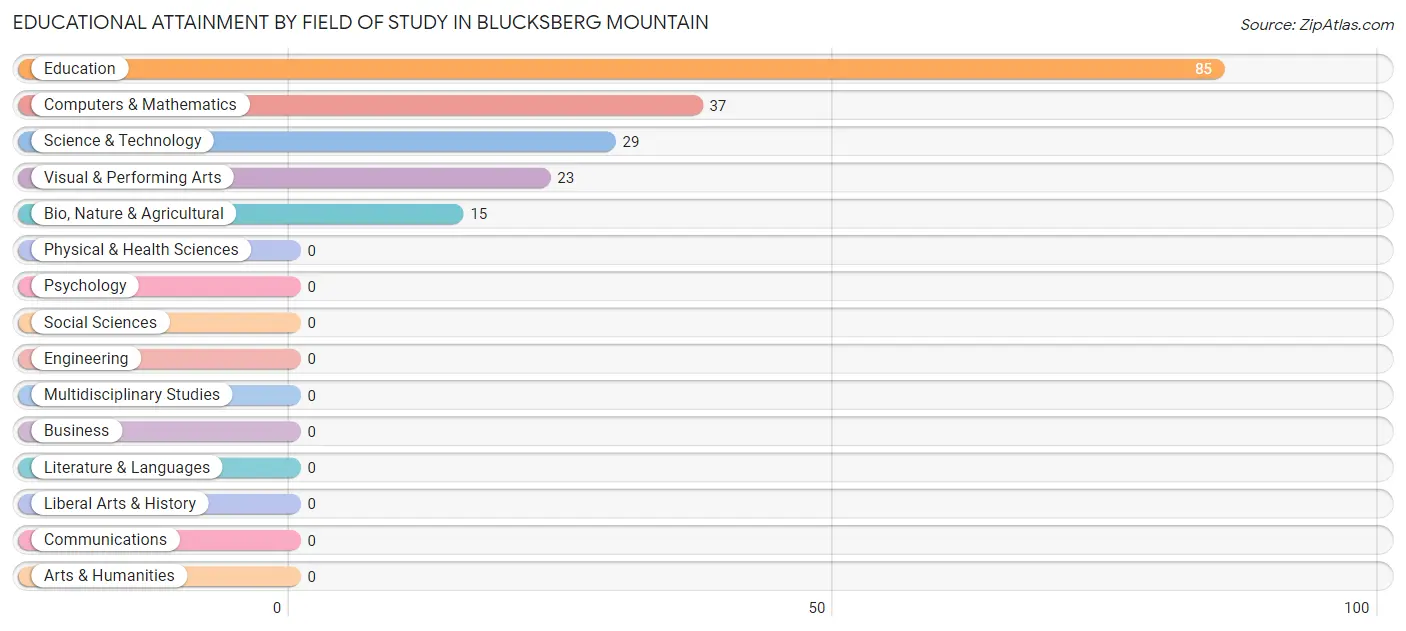
| Field of Study | # Graduates | % Graduates |
| Computers & Mathematics | 37 | 19.6% |
| Bio, Nature & Agricultural | 15 | 7.9% |
| Physical & Health Sciences | 0 | 0.0% |
| Psychology | 0 | 0.0% |
| Social Sciences | 0 | 0.0% |
| Engineering | 0 | 0.0% |
| Multidisciplinary Studies | 0 | 0.0% |
| Science & Technology | 29 | 15.3% |
| Business | 0 | 0.0% |
| Education | 85 | 45.0% |
| Literature & Languages | 0 | 0.0% |
| Liberal Arts & History | 0 | 0.0% |
| Visual & Performing Arts | 23 | 12.2% |
| Communications | 0 | 0.0% |
| Arts & Humanities | 0 | 0.0% |
| Total | 189 | 100.0% |
Transportation & Commute in Blucksberg Mountain
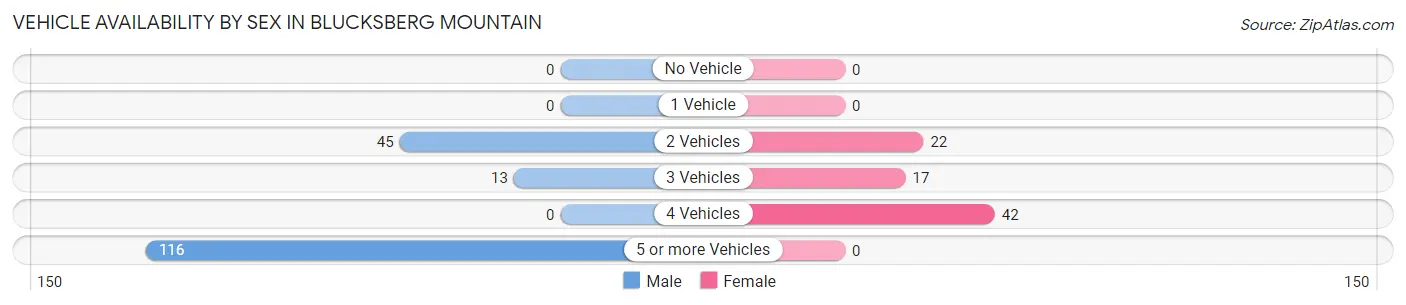
Vehicle Availability by Sex in Blucksberg Mountain
The most prevalent vehicle ownership categories in Blucksberg Mountain are males with 5 or more vehicles (116, accounting for 66.7%) and females with 5 or more vehicles (0, making up 143.2%).
| Vehicles Available | Male | Female |
| No Vehicle | 0 (0.0%) | 0 (0.0%) |
| 1 Vehicle | 0 (0.0%) | 0 (0.0%) |
| 2 Vehicles | 45 (25.9%) | 22 (27.2%) |
| 3 Vehicles | 13 (7.5%) | 17 (21.0%) |
| 4 Vehicles | 0 (0.0%) | 42 (51.8%) |
| 5 or more Vehicles | 116 (66.7%) | 0 (0.0%) |
| Total | 174 (100.0%) | 81 (100.0%) |
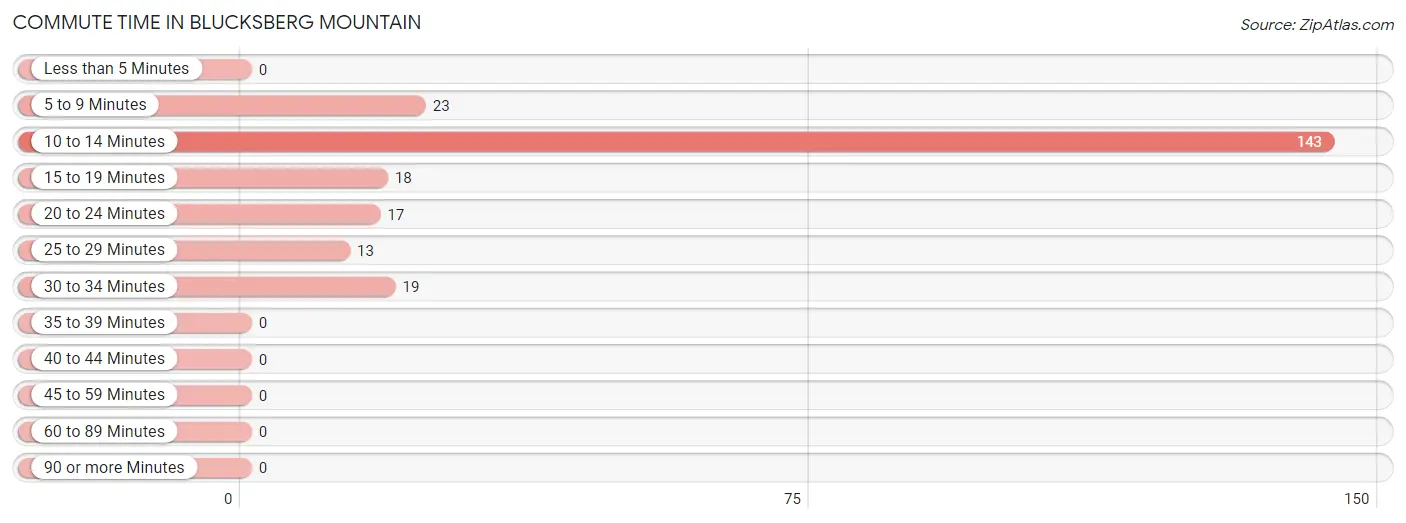
Commute Time in Blucksberg Mountain
The most frequently occuring commute durations in Blucksberg Mountain are 10 to 14 minutes (143 commuters, 61.4%), 5 to 9 minutes (23 commuters, 9.9%), and 30 to 34 minutes (19 commuters, 8.2%).
| Commute Time | # Commuters | % Commuters |
| Less than 5 Minutes | 0 | 0.0% |
| 5 to 9 Minutes | 23 | 9.9% |
| 10 to 14 Minutes | 143 | 61.4% |
| 15 to 19 Minutes | 18 | 7.7% |
| 20 to 24 Minutes | 17 | 7.3% |
| 25 to 29 Minutes | 13 | 5.6% |
| 30 to 34 Minutes | 19 | 8.2% |
| 35 to 39 Minutes | 0 | 0.0% |
| 40 to 44 Minutes | 0 | 0.0% |
| 45 to 59 Minutes | 0 | 0.0% |
| 60 to 89 Minutes | 0 | 0.0% |
| 90 or more Minutes | 0 | 0.0% |
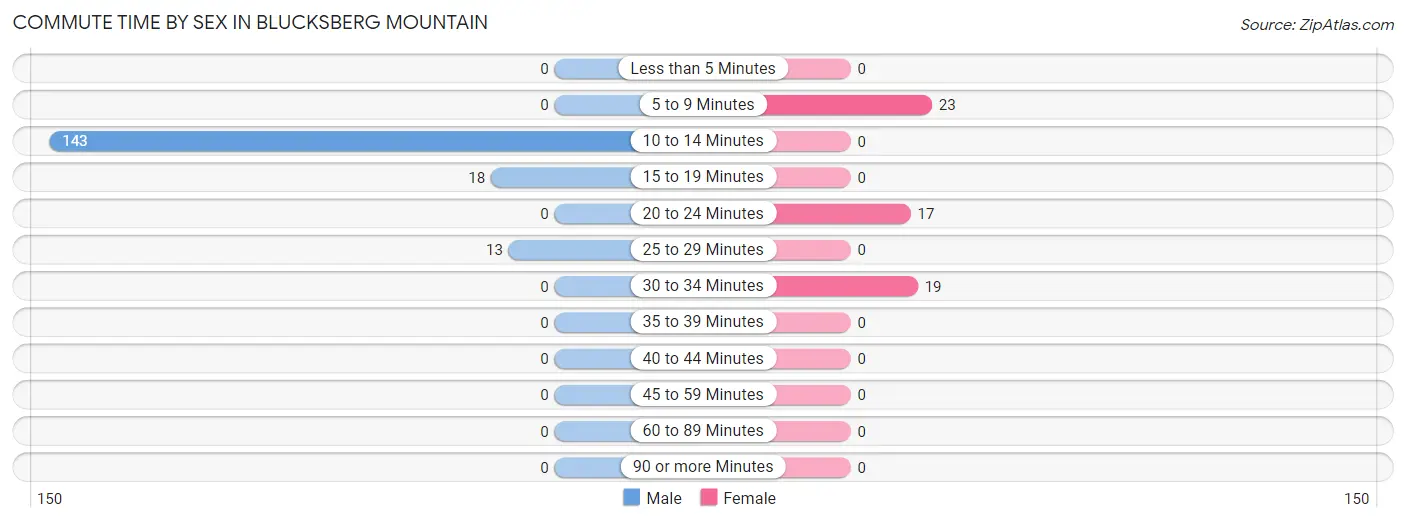
Commute Time by Sex in Blucksberg Mountain
The most common commute times in Blucksberg Mountain are 10 to 14 minutes (143 commuters, 82.2%) for males and 5 to 9 minutes (23 commuters, 39.0%) for females.
| Commute Time | Male | Female |
| Less than 5 Minutes | 0 (0.0%) | 0 (0.0%) |
| 5 to 9 Minutes | 0 (0.0%) | 23 (39.0%) |
| 10 to 14 Minutes | 143 (82.2%) | 0 (0.0%) |
| 15 to 19 Minutes | 18 (10.3%) | 0 (0.0%) |
| 20 to 24 Minutes | 0 (0.0%) | 17 (28.8%) |
| 25 to 29 Minutes | 13 (7.5%) | 0 (0.0%) |
| 30 to 34 Minutes | 0 (0.0%) | 19 (32.2%) |
| 35 to 39 Minutes | 0 (0.0%) | 0 (0.0%) |
| 40 to 44 Minutes | 0 (0.0%) | 0 (0.0%) |
| 45 to 59 Minutes | 0 (0.0%) | 0 (0.0%) |
| 60 to 89 Minutes | 0 (0.0%) | 0 (0.0%) |
| 90 or more Minutes | 0 (0.0%) | 0 (0.0%) |
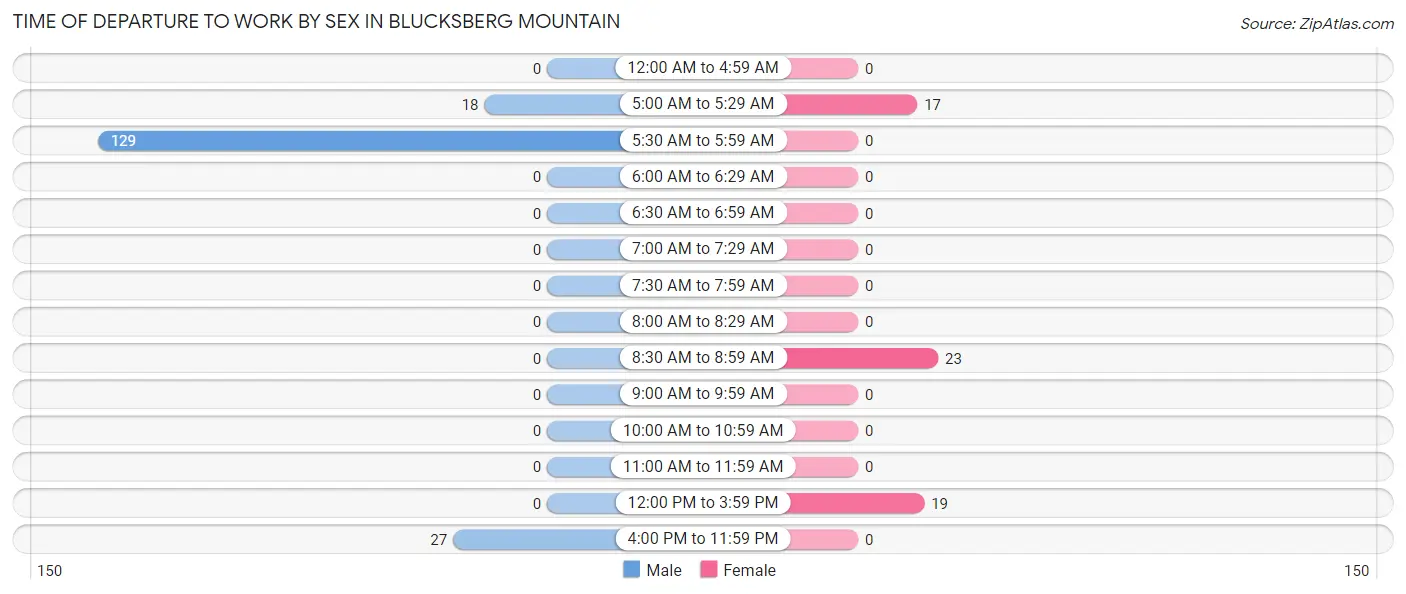
Time of Departure to Work by Sex in Blucksberg Mountain
The most frequent times of departure to work in Blucksberg Mountain are 5:30 AM to 5:59 AM (129, 74.1%) for males and 8:30 AM to 8:59 AM (23, 39.0%) for females.
| Time of Departure | Male | Female |
| 12:00 AM to 4:59 AM | 0 (0.0%) | 0 (0.0%) |
| 5:00 AM to 5:29 AM | 18 (10.3%) | 17 (28.8%) |
| 5:30 AM to 5:59 AM | 129 (74.1%) | 0 (0.0%) |
| 6:00 AM to 6:29 AM | 0 (0.0%) | 0 (0.0%) |
| 6:30 AM to 6:59 AM | 0 (0.0%) | 0 (0.0%) |
| 7:00 AM to 7:29 AM | 0 (0.0%) | 0 (0.0%) |
| 7:30 AM to 7:59 AM | 0 (0.0%) | 0 (0.0%) |
| 8:00 AM to 8:29 AM | 0 (0.0%) | 0 (0.0%) |
| 8:30 AM to 8:59 AM | 0 (0.0%) | 23 (39.0%) |
| 9:00 AM to 9:59 AM | 0 (0.0%) | 0 (0.0%) |
| 10:00 AM to 10:59 AM | 0 (0.0%) | 0 (0.0%) |
| 11:00 AM to 11:59 AM | 0 (0.0%) | 0 (0.0%) |
| 12:00 PM to 3:59 PM | 0 (0.0%) | 19 (32.2%) |
| 4:00 PM to 11:59 PM | 27 (15.5%) | 0 (0.0%) |
| Total | 174 (100.0%) | 59 (100.0%) |
Housing Occupancy in Blucksberg Mountain
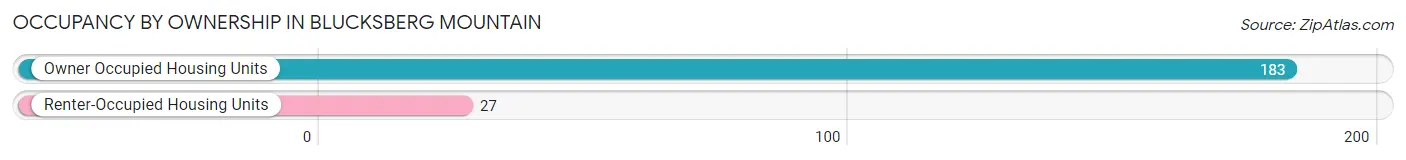
Occupancy by Ownership in Blucksberg Mountain
Of the total 210 dwellings in Blucksberg Mountain, owner-occupied units account for 183 (87.1%), while renter-occupied units make up 27 (12.9%).
| Occupancy | # Housing Units | % Housing Units |
| Owner Occupied Housing Units | 183 | 87.1% |
| Renter-Occupied Housing Units | 27 | 12.9% |
| Total Occupied Housing Units | 210 | 100.0% |
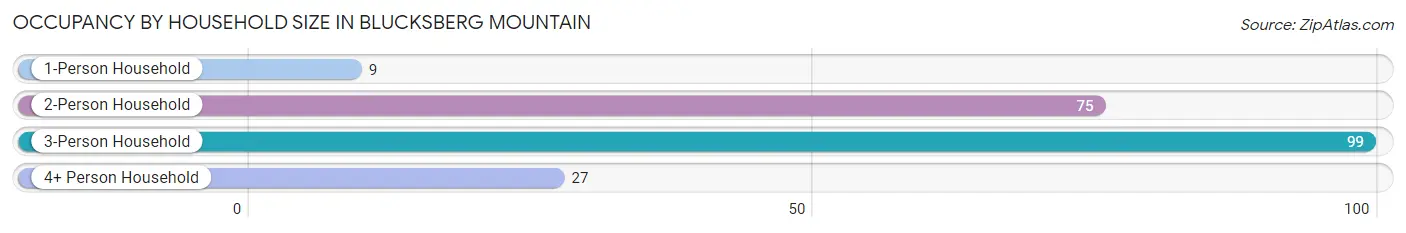
Occupancy by Household Size in Blucksberg Mountain
| Household Size | # Housing Units | % Housing Units |
| 1-Person Household | 9 | 4.3% |
| 2-Person Household | 75 | 35.7% |
| 3-Person Household | 99 | 47.1% |
| 4+ Person Household | 27 | 12.9% |
| Total Housing Units | 210 | 100.0% |
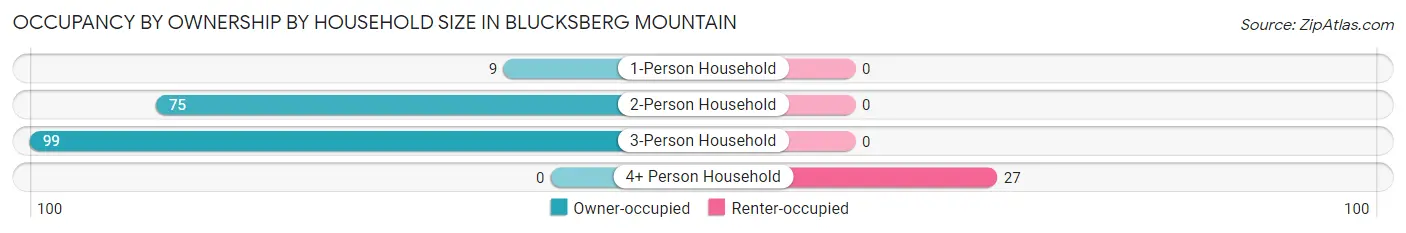
Occupancy by Ownership by Household Size in Blucksberg Mountain
| Household Size | Owner-occupied | Renter-occupied |
| 1-Person Household | 9 (100.0%) | 0 (0.0%) |
| 2-Person Household | 75 (100.0%) | 0 (0.0%) |
| 3-Person Household | 99 (100.0%) | 0 (0.0%) |
| 4+ Person Household | 0 (0.0%) | 27 (100.0%) |
| Total Housing Units | 183 (87.1%) | 27 (12.9%) |
Occupancy by Educational Attainment in Blucksberg Mountain
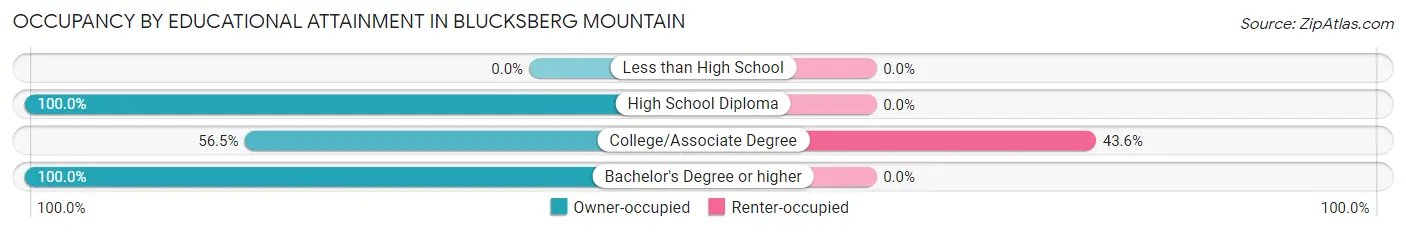
| Household Size | Owner-occupied | Renter-occupied |
| Less than High School | 0 (0.0%) | 0 (0.0%) |
| High School Diploma | 71 (100.0%) | 0 (0.0%) |
| College/Associate Degree | 35 (56.5%) | 27 (43.5%) |
| Bachelor's Degree or higher | 77 (100.0%) | 0 (0.0%) |
Occupancy by Age of Householder in Blucksberg Mountain
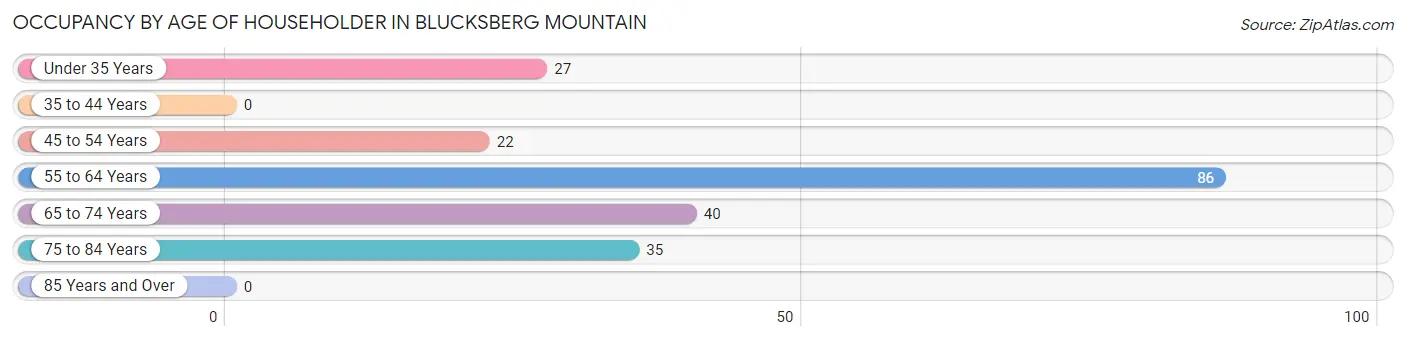
| Age Bracket | # Households | % Households |
| Under 35 Years | 27 | 12.9% |
| 35 to 44 Years | 0 | 0.0% |
| 45 to 54 Years | 22 | 10.5% |
| 55 to 64 Years | 86 | 40.9% |
| 65 to 74 Years | 40 | 19.1% |
| 75 to 84 Years | 35 | 16.7% |
| 85 Years and Over | 0 | 0.0% |
| Total | 210 | 100.0% |
Housing Finances in Blucksberg Mountain
Median Income by Occupancy in Blucksberg Mountain
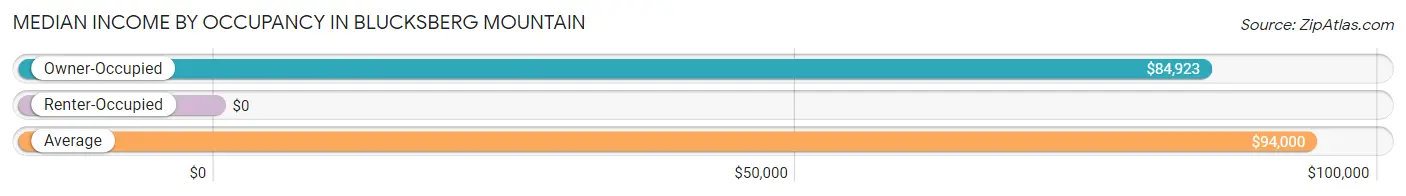
| Occupancy Type | # Households | Median Income |
| Owner-Occupied | 183 (87.1%) | $84,923 |
| Renter-Occupied | 27 (12.9%) | $0 |
| Average | 210 (100.0%) | $94,000 |
Occupancy by Householder Income Bracket in Blucksberg Mountain
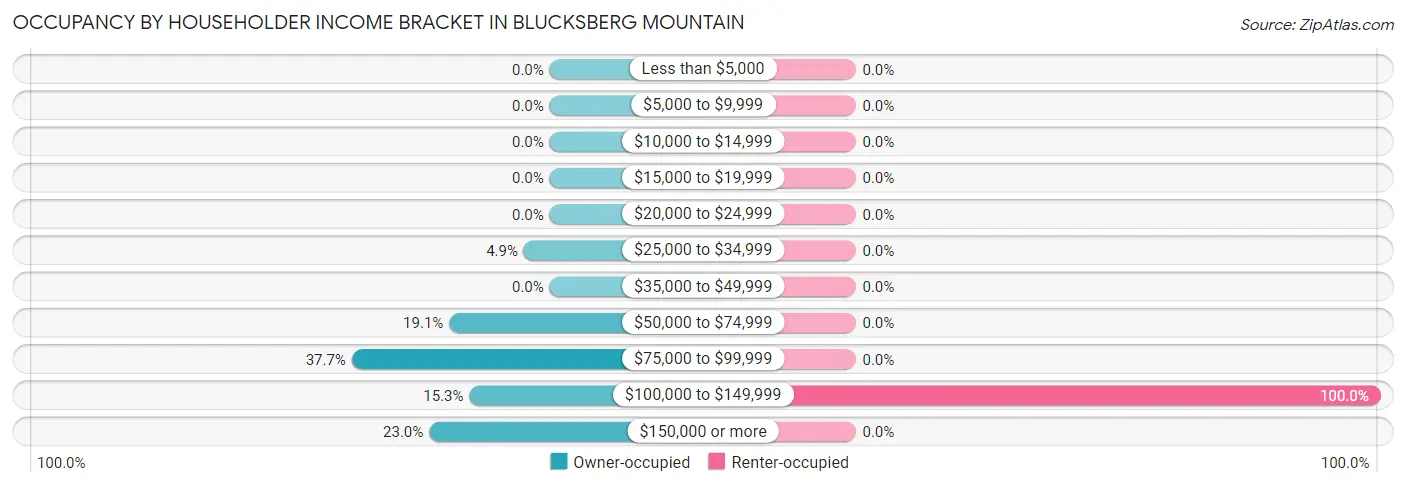
| Income Bracket | Owner-occupied | Renter-occupied |
| Less than $5,000 | 0 (0.0%) | 0 (0.0%) |
| $5,000 to $9,999 | 0 (0.0%) | 0 (0.0%) |
| $10,000 to $14,999 | 0 (0.0%) | 0 (0.0%) |
| $15,000 to $19,999 | 0 (0.0%) | 0 (0.0%) |
| $20,000 to $24,999 | 0 (0.0%) | 0 (0.0%) |
| $25,000 to $34,999 | 9 (4.9%) | 0 (0.0%) |
| $35,000 to $49,999 | 0 (0.0%) | 0 (0.0%) |
| $50,000 to $74,999 | 35 (19.1%) | 0 (0.0%) |
| $75,000 to $99,999 | 69 (37.7%) | 0 (0.0%) |
| $100,000 to $149,999 | 28 (15.3%) | 27 (100.0%) |
| $150,000 or more | 42 (23.0%) | 0 (0.0%) |
| Total | 183 (100.0%) | 27 (100.0%) |
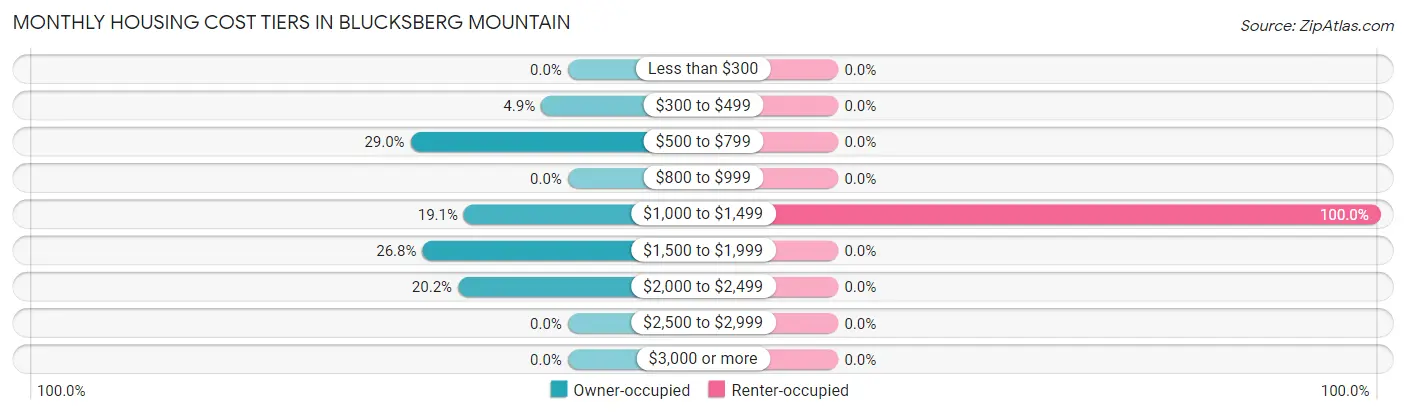
Monthly Housing Cost Tiers in Blucksberg Mountain
| Monthly Cost | Owner-occupied | Renter-occupied |
| Less than $300 | 0 (0.0%) | 0 (0.0%) |
| $300 to $499 | 9 (4.9%) | 0 (0.0%) |
| $500 to $799 | 53 (29.0%) | 0 (0.0%) |
| $800 to $999 | 0 (0.0%) | 0 (0.0%) |
| $1,000 to $1,499 | 35 (19.1%) | 27 (100.0%) |
| $1,500 to $1,999 | 49 (26.8%) | 0 (0.0%) |
| $2,000 to $2,499 | 37 (20.2%) | 0 (0.0%) |
| $2,500 to $2,999 | 0 (0.0%) | 0 (0.0%) |
| $3,000 or more | 0 (0.0%) | 0 (0.0%) |
| Total | 183 (100.0%) | 27 (100.0%) |
Physical Housing Characteristics in Blucksberg Mountain
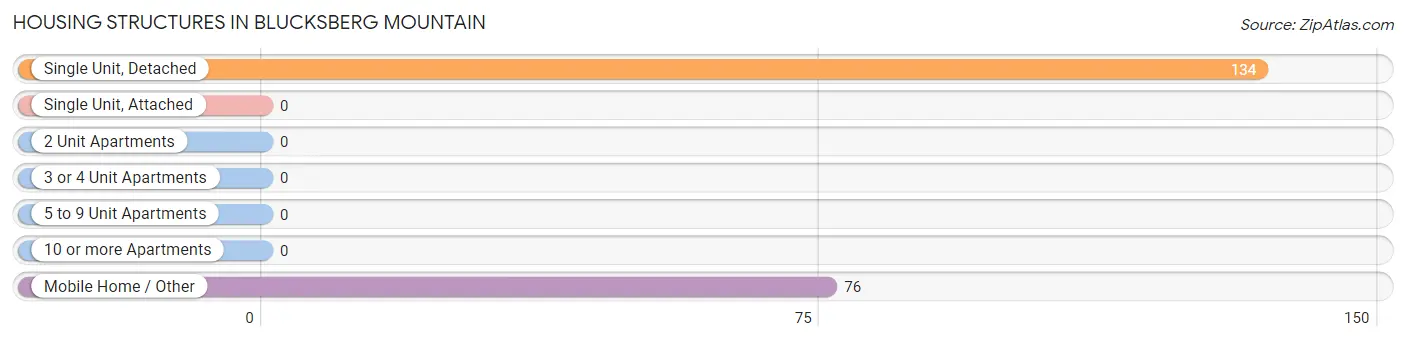
Housing Structures in Blucksberg Mountain
| Structure Type | # Housing Units | % Housing Units |
| Single Unit, Detached | 134 | 63.8% |
| Single Unit, Attached | 0 | 0.0% |
| 2 Unit Apartments | 0 | 0.0% |
| 3 or 4 Unit Apartments | 0 | 0.0% |
| 5 to 9 Unit Apartments | 0 | 0.0% |
| 10 or more Apartments | 0 | 0.0% |
| Mobile Home / Other | 76 | 36.2% |
| Total | 210 | 100.0% |
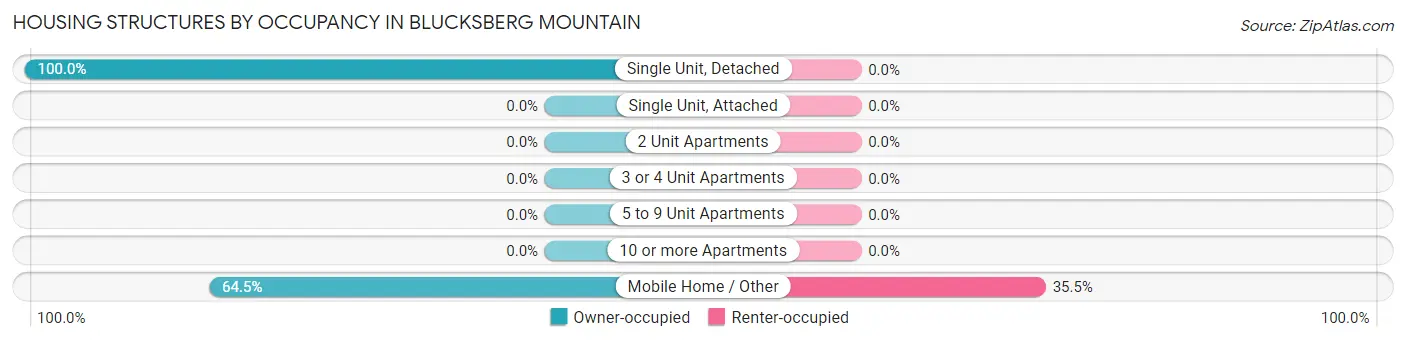
Housing Structures by Occupancy in Blucksberg Mountain
| Structure Type | Owner-occupied | Renter-occupied |
| Single Unit, Detached | 134 (100.0%) | 0 (0.0%) |
| Single Unit, Attached | 0 (0.0%) | 0 (0.0%) |
| 2 Unit Apartments | 0 (0.0%) | 0 (0.0%) |
| 3 or 4 Unit Apartments | 0 (0.0%) | 0 (0.0%) |
| 5 to 9 Unit Apartments | 0 (0.0%) | 0 (0.0%) |
| 10 or more Apartments | 0 (0.0%) | 0 (0.0%) |
| Mobile Home / Other | 49 (64.5%) | 27 (35.5%) |
| Total | 183 (87.1%) | 27 (12.9%) |
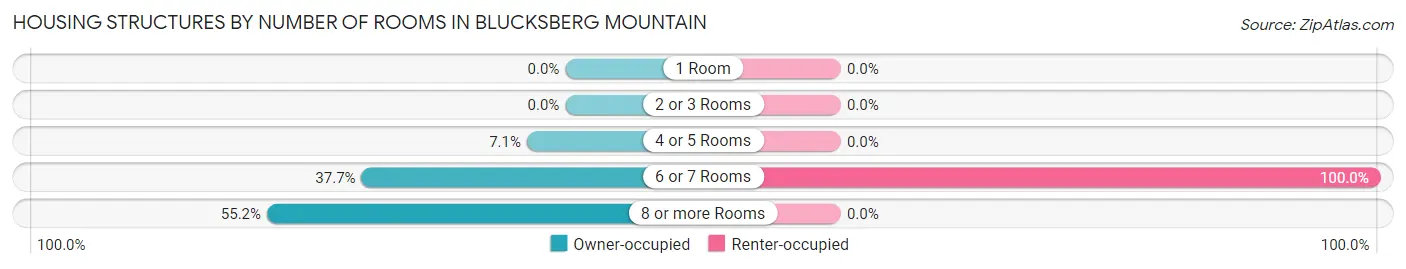
Housing Structures by Number of Rooms in Blucksberg Mountain
| Number of Rooms | Owner-occupied | Renter-occupied |
| 1 Room | 0 (0.0%) | 0 (0.0%) |
| 2 or 3 Rooms | 0 (0.0%) | 0 (0.0%) |
| 4 or 5 Rooms | 13 (7.1%) | 0 (0.0%) |
| 6 or 7 Rooms | 69 (37.7%) | 27 (100.0%) |
| 8 or more Rooms | 101 (55.2%) | 0 (0.0%) |
| Total | 183 (100.0%) | 27 (100.0%) |
Housing Structure by Heating Type in Blucksberg Mountain
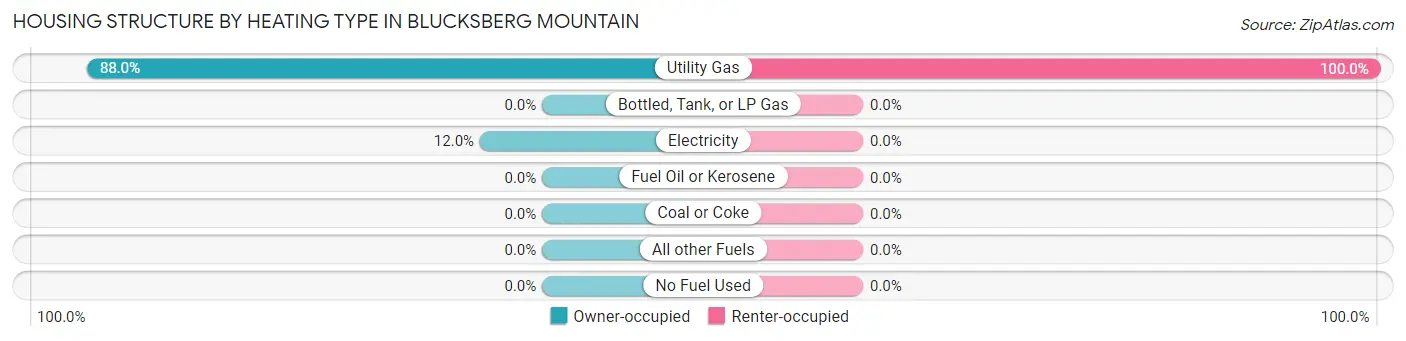
| Heating Type | Owner-occupied | Renter-occupied |
| Utility Gas | 161 (88.0%) | 27 (100.0%) |
| Bottled, Tank, or LP Gas | 0 (0.0%) | 0 (0.0%) |
| Electricity | 22 (12.0%) | 0 (0.0%) |
| Fuel Oil or Kerosene | 0 (0.0%) | 0 (0.0%) |
| Coal or Coke | 0 (0.0%) | 0 (0.0%) |
| All other Fuels | 0 (0.0%) | 0 (0.0%) |
| No Fuel Used | 0 (0.0%) | 0 (0.0%) |
| Total | 183 (100.0%) | 27 (100.0%) |
Household Vehicle Usage in Blucksberg Mountain
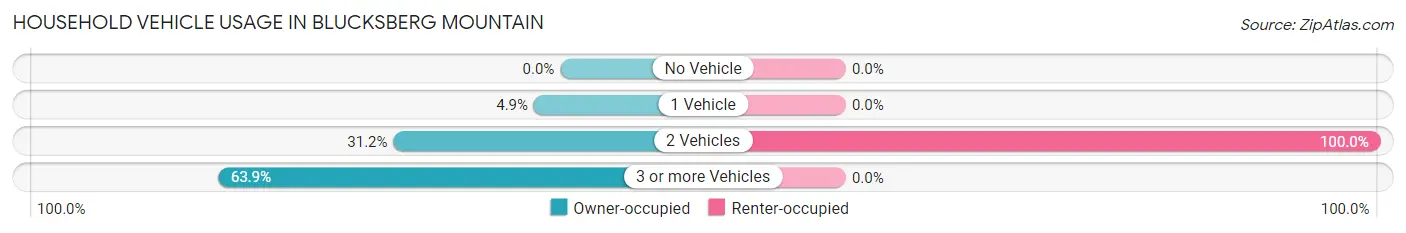
| Vehicles per Household | Owner-occupied | Renter-occupied |
| No Vehicle | 0 (0.0%) | 0 (0.0%) |
| 1 Vehicle | 9 (4.9%) | 0 (0.0%) |
| 2 Vehicles | 57 (31.1%) | 27 (100.0%) |
| 3 or more Vehicles | 117 (63.9%) | 0 (0.0%) |
| Total | 183 (100.0%) | 27 (100.0%) |
Real Estate & Mortgages in Blucksberg Mountain
Real Estate and Mortgage Overview in Blucksberg Mountain
| Characteristic | Without Mortgage | With Mortgage |
| Housing Units | 62 | 121 |
| Median Property Value | $345,000 | $0 |
| Median Household Income | $102,885 | $22 |
| Monthly Housing Costs | $645 | $0 |
| Real Estate Taxes | $3,450 | $0 |
Property Value by Mortgage Status in Blucksberg Mountain
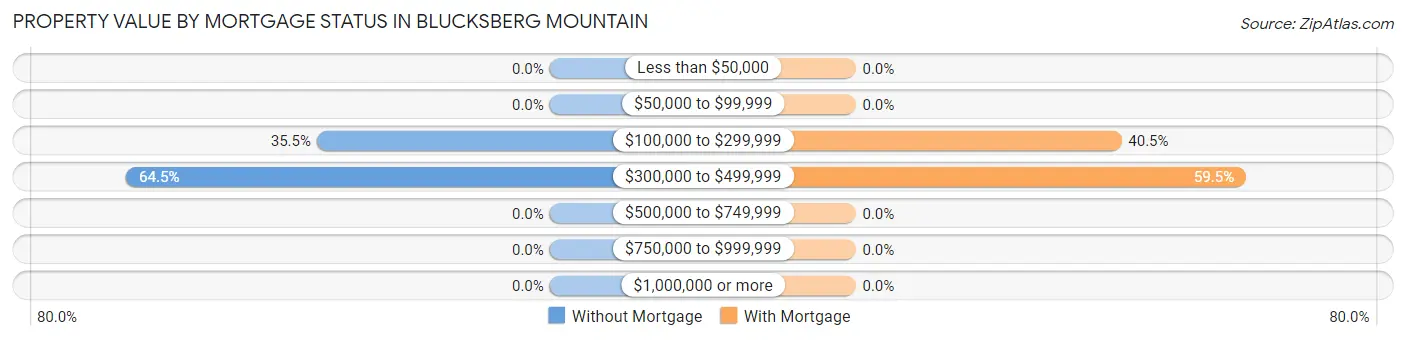
| Property Value | Without Mortgage | With Mortgage |
| Less than $50,000 | 0 (0.0%) | 0 (0.0%) |
| $50,000 to $99,999 | 0 (0.0%) | 0 (0.0%) |
| $100,000 to $299,999 | 22 (35.5%) | 49 (40.5%) |
| $300,000 to $499,999 | 40 (64.5%) | 72 (59.5%) |
| $500,000 to $749,999 | 0 (0.0%) | 0 (0.0%) |
| $750,000 to $999,999 | 0 (0.0%) | 0 (0.0%) |
| $1,000,000 or more | 0 (0.0%) | 0 (0.0%) |
| Total | 62 (100.0%) | 121 (100.0%) |
Household Income by Mortgage Status in Blucksberg Mountain
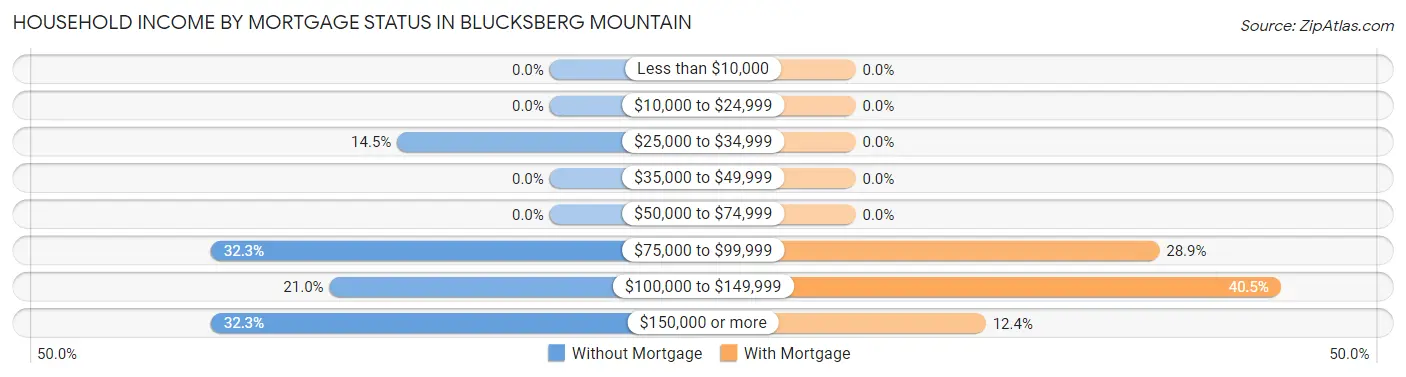
| Household Income | Without Mortgage | With Mortgage |
| Less than $10,000 | 0 (0.0%) | 0 (0.0%) |
| $10,000 to $24,999 | 0 (0.0%) | 0 (0.0%) |
| $25,000 to $34,999 | 9 (14.5%) | 0 (0.0%) |
| $35,000 to $49,999 | 0 (0.0%) | 0 (0.0%) |
| $50,000 to $74,999 | 0 (0.0%) | 0 (0.0%) |
| $75,000 to $99,999 | 20 (32.3%) | 35 (28.9%) |
| $100,000 to $149,999 | 13 (21.0%) | 49 (40.5%) |
| $150,000 or more | 20 (32.3%) | 15 (12.4%) |
| Total | 62 (100.0%) | 121 (100.0%) |
Property Value to Household Income Ratio in Blucksberg Mountain
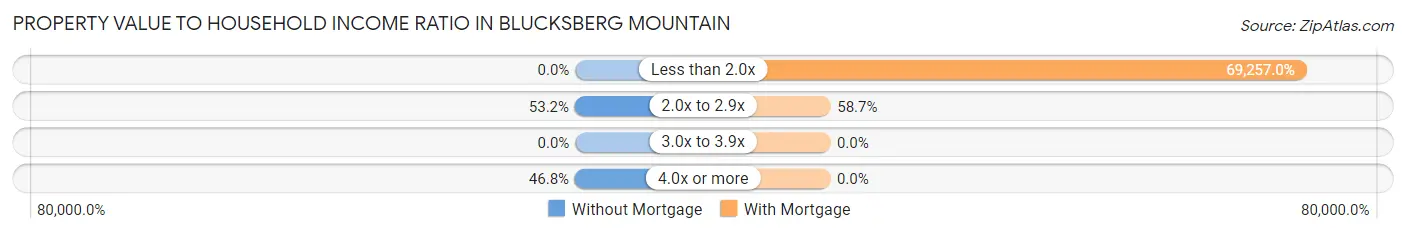
| Value-to-Income Ratio | Without Mortgage | With Mortgage |
| Less than 2.0x | 0 (0.0%) | 83,801 (69,257.0%) |
| 2.0x to 2.9x | 33 (53.2%) | 71 (58.7%) |
| 3.0x to 3.9x | 0 (0.0%) | 0 (0.0%) |
| 4.0x or more | 29 (46.8%) | 0 (0.0%) |
| Total | 62 (100.0%) | 121 (100.0%) |
Real Estate Taxes by Mortgage Status in Blucksberg Mountain
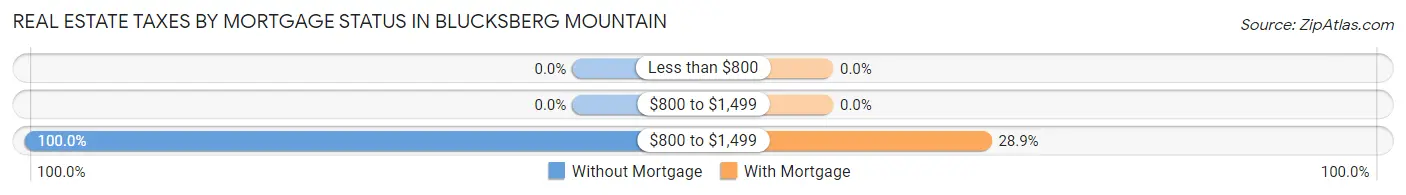
| Property Taxes | Without Mortgage | With Mortgage |
| Less than $800 | 0 (0.0%) | 0 (0.0%) |
| $800 to $1,499 | 0 (0.0%) | 0 (0.0%) |
| $800 to $1,499 | 62 (100.0%) | 35 (28.9%) |
| Total | 62 (100.0%) | 121 (100.0%) |
Health & Disability in Blucksberg Mountain
Health Insurance Coverage by Age in Blucksberg Mountain
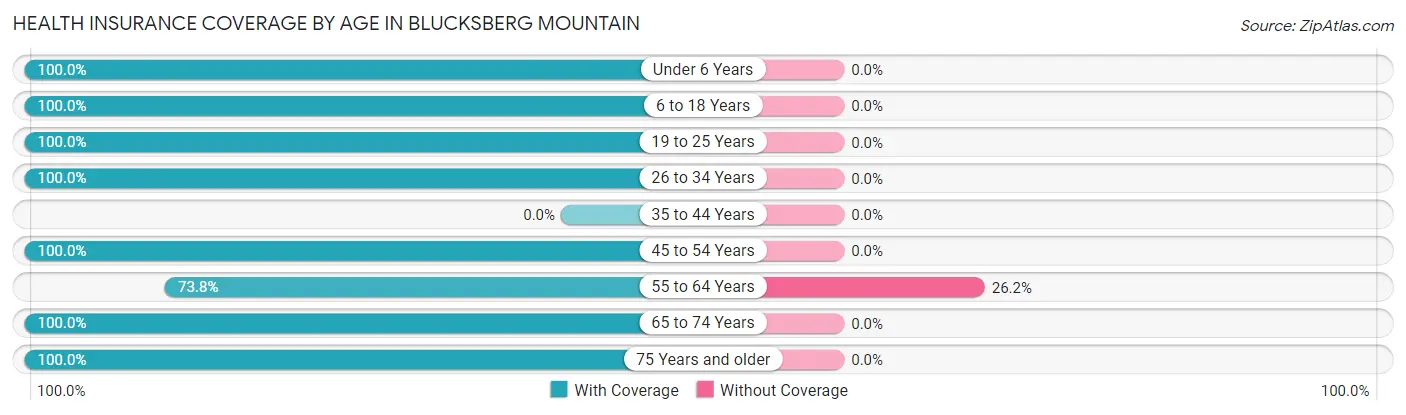
| Age Bracket | With Coverage | Without Coverage |
| Under 6 Years | 38 (100.0%) | 0 (0.0%) |
| 6 to 18 Years | 19 (100.0%) | 0 (0.0%) |
| 19 to 25 Years | 67 (100.0%) | 0 (0.0%) |
| 26 to 34 Years | 56 (100.0%) | 0 (0.0%) |
| 35 to 44 Years | 0 (0.0%) | 0 (0.0%) |
| 45 to 54 Years | 131 (100.0%) | 0 (0.0%) |
| 55 to 64 Years | 138 (73.8%) | 49 (26.2%) |
| 65 to 74 Years | 86 (100.0%) | 0 (0.0%) |
| 75 Years and older | 35 (100.0%) | 0 (0.0%) |
| Total | 570 (92.1%) | 49 (7.9%) |
Health Insurance Coverage by Citizenship Status in Blucksberg Mountain
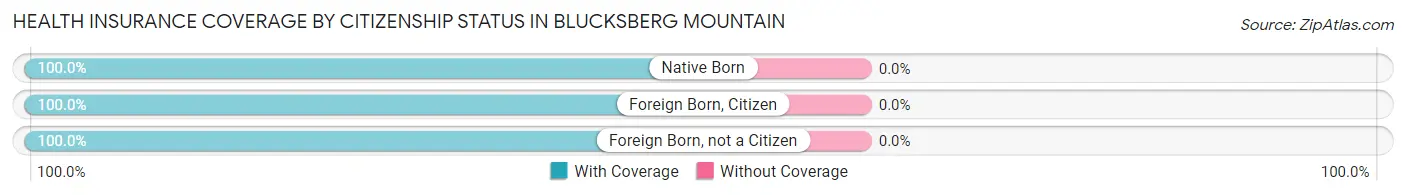
| Citizenship Status | With Coverage | Without Coverage |
| Native Born | 38 (100.0%) | 0 (0.0%) |
| Foreign Born, Citizen | 19 (100.0%) | 0 (0.0%) |
| Foreign Born, not a Citizen | 67 (100.0%) | 0 (0.0%) |
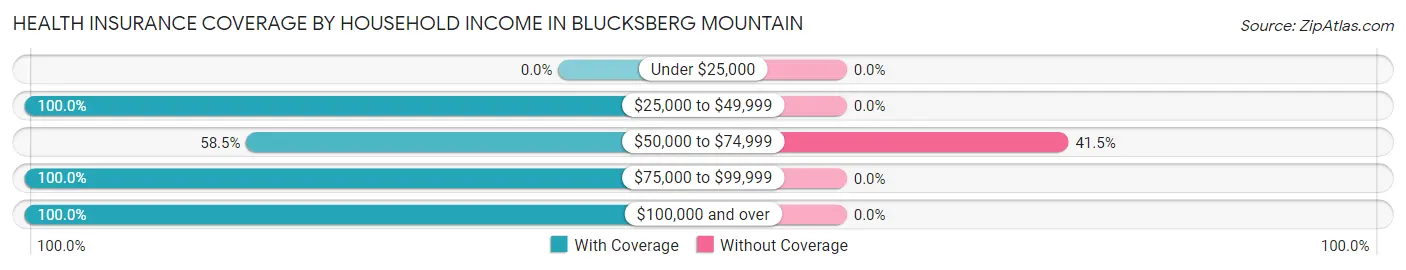
Health Insurance Coverage by Household Income in Blucksberg Mountain
| Household Income | With Coverage | Without Coverage |
| Under $25,000 | 0 (0.0%) | 0 (0.0%) |
| $25,000 to $49,999 | 9 (100.0%) | 0 (0.0%) |
| $50,000 to $74,999 | 69 (58.5%) | 49 (41.5%) |
| $75,000 to $99,999 | 228 (100.0%) | 0 (0.0%) |
| $100,000 and over | 264 (100.0%) | 0 (0.0%) |
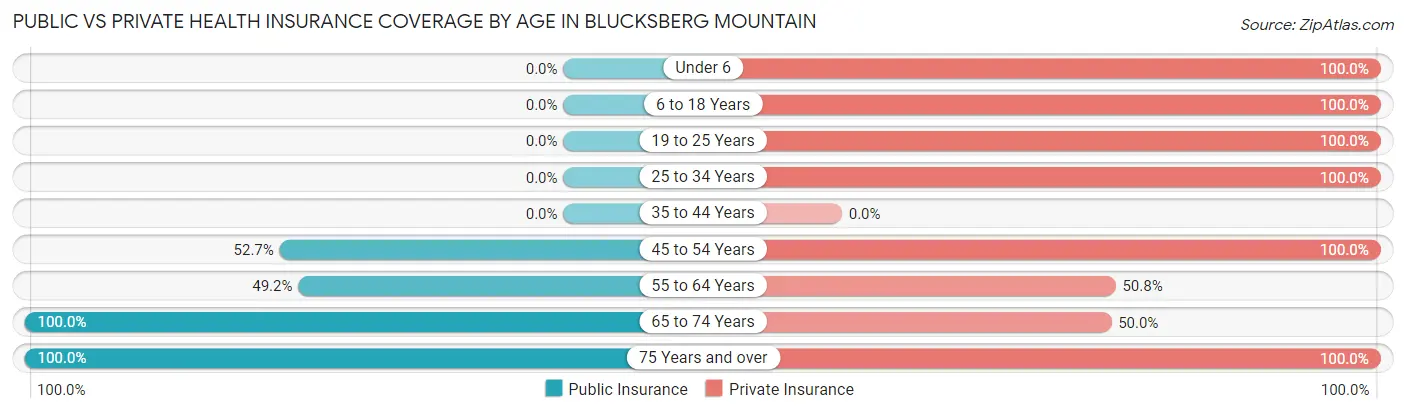
Public vs Private Health Insurance Coverage by Age in Blucksberg Mountain
| Age Bracket | Public Insurance | Private Insurance |
| Under 6 | 0 (0.0%) | 38 (100.0%) |
| 6 to 18 Years | 0 (0.0%) | 19 (100.0%) |
| 19 to 25 Years | 0 (0.0%) | 67 (100.0%) |
| 25 to 34 Years | 0 (0.0%) | 56 (100.0%) |
| 35 to 44 Years | 0 (0.0%) | 0 (0.0%) |
| 45 to 54 Years | 69 (52.7%) | 131 (100.0%) |
| 55 to 64 Years | 92 (49.2%) | 95 (50.8%) |
| 65 to 74 Years | 86 (100.0%) | 43 (50.0%) |
| 75 Years and over | 35 (100.0%) | 35 (100.0%) |
| Total | 282 (45.6%) | 484 (78.2%) |
Disability Status by Sex by Age in Blucksberg Mountain
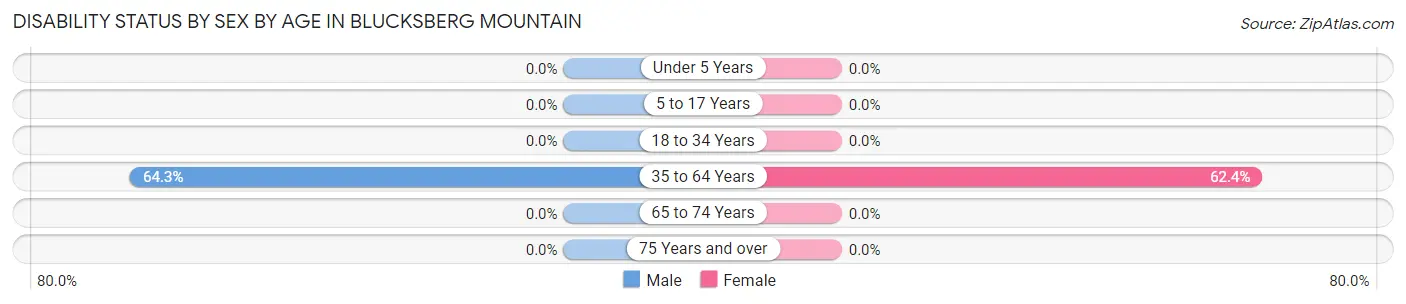
| Age Bracket | Male | Female |
| Under 5 Years | 0 (0.0%) | 0 (0.0%) |
| 5 to 17 Years | 0 (0.0%) | 0 (0.0%) |
| 18 to 34 Years | 0 (0.0%) | 0 (0.0%) |
| 35 to 64 Years | 83 (64.3%) | 118 (62.4%) |
| 65 to 74 Years | 0 (0.0%) | 0 (0.0%) |
| 75 Years and over | 0 (0.0%) | 0 (0.0%) |
Disability Class by Sex by Age in Blucksberg Mountain
Disability Class: Hearing Difficulty
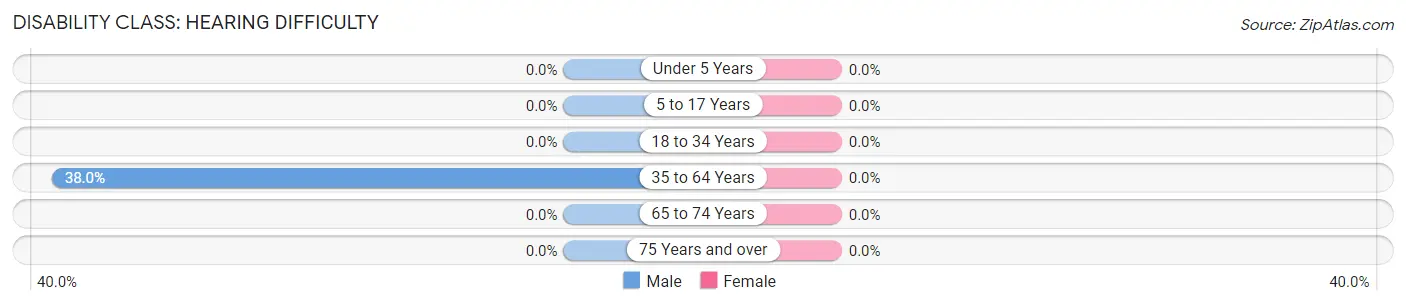
| Age Bracket | Male | Female |
| Under 5 Years | 0 (0.0%) | 0 (0.0%) |
| 5 to 17 Years | 0 (0.0%) | 0 (0.0%) |
| 18 to 34 Years | 0 (0.0%) | 0 (0.0%) |
| 35 to 64 Years | 49 (38.0%) | 0 (0.0%) |
| 65 to 74 Years | 0 (0.0%) | 0 (0.0%) |
| 75 Years and over | 0 (0.0%) | 0 (0.0%) |
Disability Class: Vision Difficulty
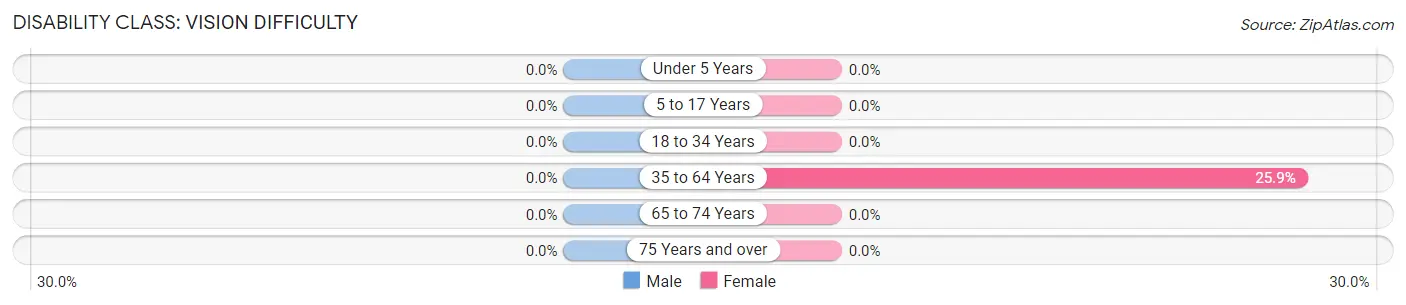
| Age Bracket | Male | Female |
| Under 5 Years | 0 (0.0%) | 0 (0.0%) |
| 5 to 17 Years | 0 (0.0%) | 0 (0.0%) |
| 18 to 34 Years | 0 (0.0%) | 0 (0.0%) |
| 35 to 64 Years | 0 (0.0%) | 49 (25.9%) |
| 65 to 74 Years | 0 (0.0%) | 0 (0.0%) |
| 75 Years and over | 0 (0.0%) | 0 (0.0%) |
Disability Class: Cognitive Difficulty
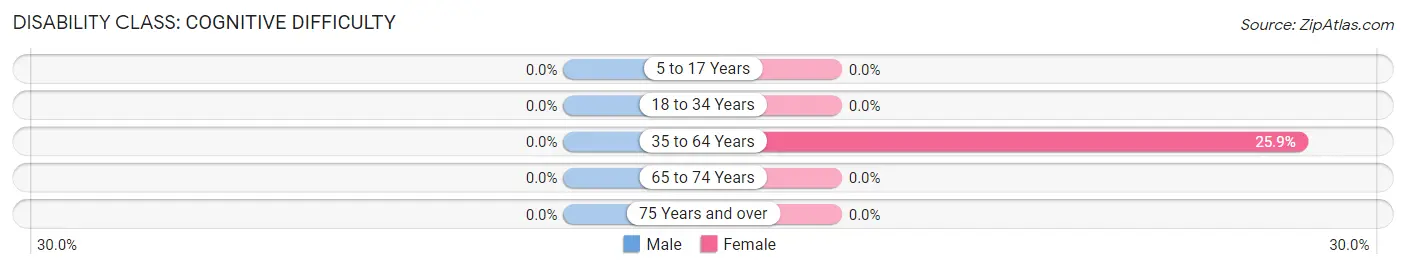
| Age Bracket | Male | Female |
| 5 to 17 Years | 0 (0.0%) | 0 (0.0%) |
| 18 to 34 Years | 0 (0.0%) | 0 (0.0%) |
| 35 to 64 Years | 0 (0.0%) | 49 (25.9%) |
| 65 to 74 Years | 0 (0.0%) | 0 (0.0%) |
| 75 Years and over | 0 (0.0%) | 0 (0.0%) |
Disability Class: Ambulatory Difficulty
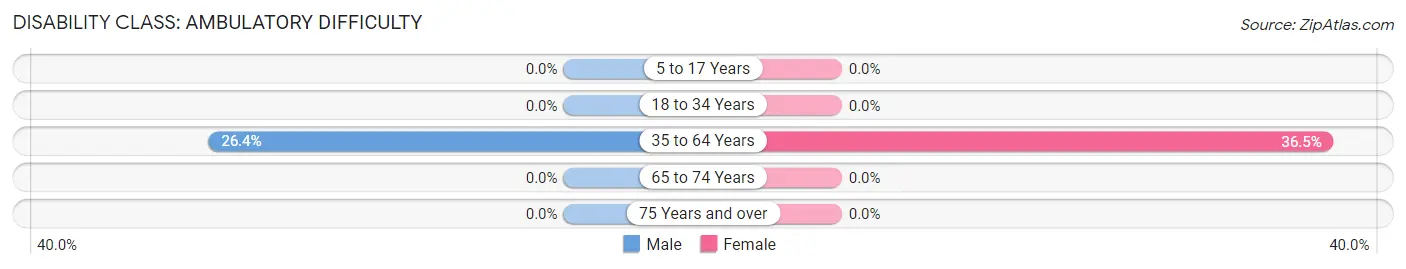
| Age Bracket | Male | Female |
| 5 to 17 Years | 0 (0.0%) | 0 (0.0%) |
| 18 to 34 Years | 0 (0.0%) | 0 (0.0%) |
| 35 to 64 Years | 34 (26.4%) | 69 (36.5%) |
| 65 to 74 Years | 0 (0.0%) | 0 (0.0%) |
| 75 Years and over | 0 (0.0%) | 0 (0.0%) |
Disability Class: Self-Care Difficulty
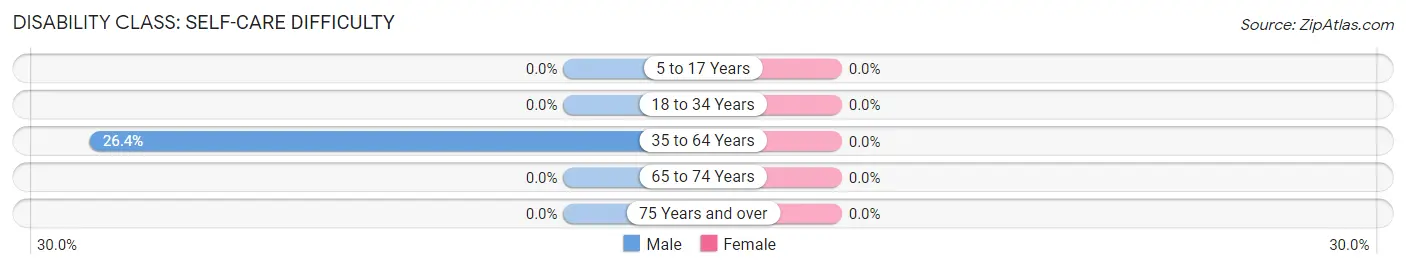
| Age Bracket | Male | Female |
| 5 to 17 Years | 0 (0.0%) | 0 (0.0%) |
| 18 to 34 Years | 0 (0.0%) | 0 (0.0%) |
| 35 to 64 Years | 34 (26.4%) | 0 (0.0%) |
| 65 to 74 Years | 0 (0.0%) | 0 (0.0%) |
| 75 Years and over | 0 (0.0%) | 0 (0.0%) |
Technology Access in Blucksberg Mountain
Computing Device Access in Blucksberg Mountain
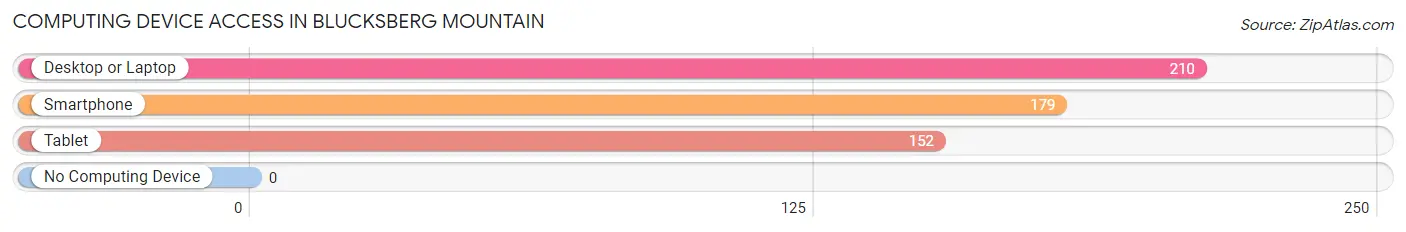
| Device Type | # Households | % Households |
| Desktop or Laptop | 210 | 100.0% |
| Smartphone | 179 | 85.2% |
| Tablet | 152 | 72.4% |
| No Computing Device | 0 | 0.0% |
| Total | 210 | 100.0% |
Internet Access in Blucksberg Mountain
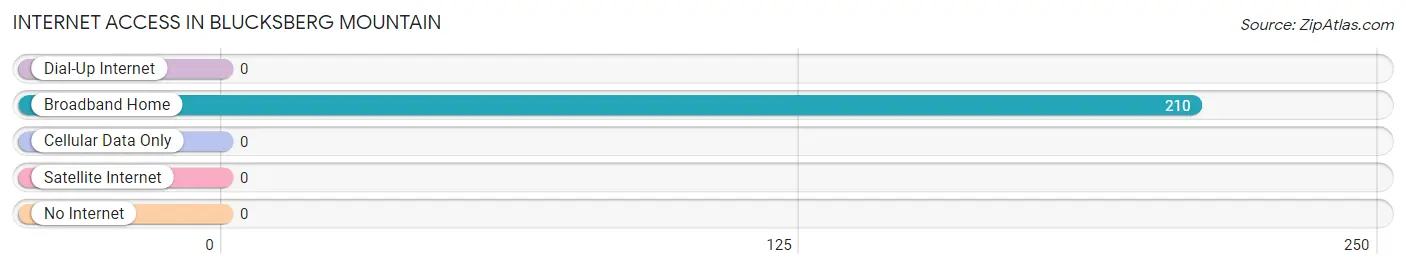
| Internet Type | # Households | % Households |
| Dial-Up Internet | 0 | 0.0% |
| Broadband Home | 210 | 100.0% |
| Cellular Data Only | 0 | 0.0% |
| Satellite Internet | 0 | 0.0% |
| No Internet | 0 | 0.0% |
| Total | 210 | 100.0% |
Blucksberg Mountain Summary
Blucksberg Mountain, located in the Black Hills of South Dakota, is a prominent peak in the region. It is the highest peak in the Black Hills, standing at 7,242 feet above sea level. The mountain is located in the Black Hills National Forest and is a popular destination for hikers, campers, and other outdoor enthusiasts.
History
The Black Hills have been home to many Native American tribes for centuries, including the Lakota, Cheyenne, and Arapaho. The mountain was named after a Lakota chief, Blucksberg, who was said to have lived in the area. The mountain was also known as “The Mountain of the Sacred Heart” by the Lakota.
The first recorded ascent of Blucksberg Mountain was in 1874 by a group of miners led by General George Custer. The miners were searching for gold in the area, but were unsuccessful. The mountain was later named after the chief Blucksberg.
Geography
Blucksberg Mountain is located in the Black Hills of South Dakota. The mountain is part of the Black Hills National Forest and is surrounded by other peaks, including Harney Peak, Bear Mountain, and Iron Mountain. The mountain is located in the Black Hills Uplift, which is a large area of uplifted sedimentary rocks.
The mountain is composed of granite and quartzite, and is covered in pine and spruce forests. The mountain is home to a variety of wildlife, including deer, elk, bighorn sheep, and mountain lions.
Economy
The economy of the Black Hills region is largely based on tourism. The area is home to several national parks, including Badlands National Park, Wind Cave National Park, and Jewel Cave National Monument. The area is also home to several ski resorts, including Terry Peak Ski Area and Deer Mountain Ski Area.
The area is also home to several mining operations, including gold, silver, and uranium. The area is also home to several logging operations, as well as cattle and sheep ranches.
Demographics
The population of the Black Hills region is largely rural, with a population of approximately 75,000 people. The population is largely white, with a small percentage of Native Americans. The median household income in the region is approximately $45,000.
The area is home to several colleges and universities, including South Dakota State University, Black Hills State University, and the University of South Dakota. The area is also home to several museums, including the South Dakota State Historical Society and the Black Hills Museum of Natural History.
Conclusion
Blucksberg Mountain is a prominent peak in the Black Hills of South Dakota. The mountain is home to a variety of wildlife and is a popular destination for hikers, campers, and other outdoor enthusiasts. The economy of the region is largely based on tourism, mining, logging, and ranching. The population of the region is largely rural, with a median household income of approximately $45,000. The area is home to several colleges and universities, as well as several museums.
Common Questions
What is Per Capita Income in Blucksberg Mountain?
Per Capita income in Blucksberg Mountain is $41,018.
What is the Median Family Income in Blucksberg Mountain?
Median Family Income in Blucksberg Mountain is $94,563.
What is the Median Household income in Blucksberg Mountain?
Median Household Income in Blucksberg Mountain is $94,000.
What is Inequality or Gini Index in Blucksberg Mountain?
Inequality or Gini Index in Blucksberg Mountain is 0.32.
What is the Total Population of Blucksberg Mountain?
Total Population of Blucksberg Mountain is 619.
What is the Total Male Population of Blucksberg Mountain?
Total Male Population of Blucksberg Mountain is 301.
What is the Total Female Population of Blucksberg Mountain?
Total Female Population of Blucksberg Mountain is 318.
What is the Ratio of Males per 100 Females in Blucksberg Mountain?
There are 94.65 Males per 100 Females in Blucksberg Mountain.
What is the Ratio of Females per 100 Males in Blucksberg Mountain?
There are 105.65 Females per 100 Males in Blucksberg Mountain.
What is the Median Population Age in Blucksberg Mountain?
Median Population Age in Blucksberg Mountain is 55.0 Years.
What is the Average Family Size in Blucksberg Mountain
Average Family Size in Blucksberg Mountain is 2.9 People.
What is the Average Household Size in Blucksberg Mountain
Average Household Size in Blucksberg Mountain is 3.0 People.
How Large is the Labor Force in Blucksberg Mountain?
There are 344 People in the Labor Forcein in Blucksberg Mountain.
What is the Percentage of People in the Labor Force in Blucksberg Mountain?
59.2% of People are in the Labor Force in Blucksberg Mountain.