Iron Mountain Lake, MO Map & Demographics
Iron Mountain Lake Map
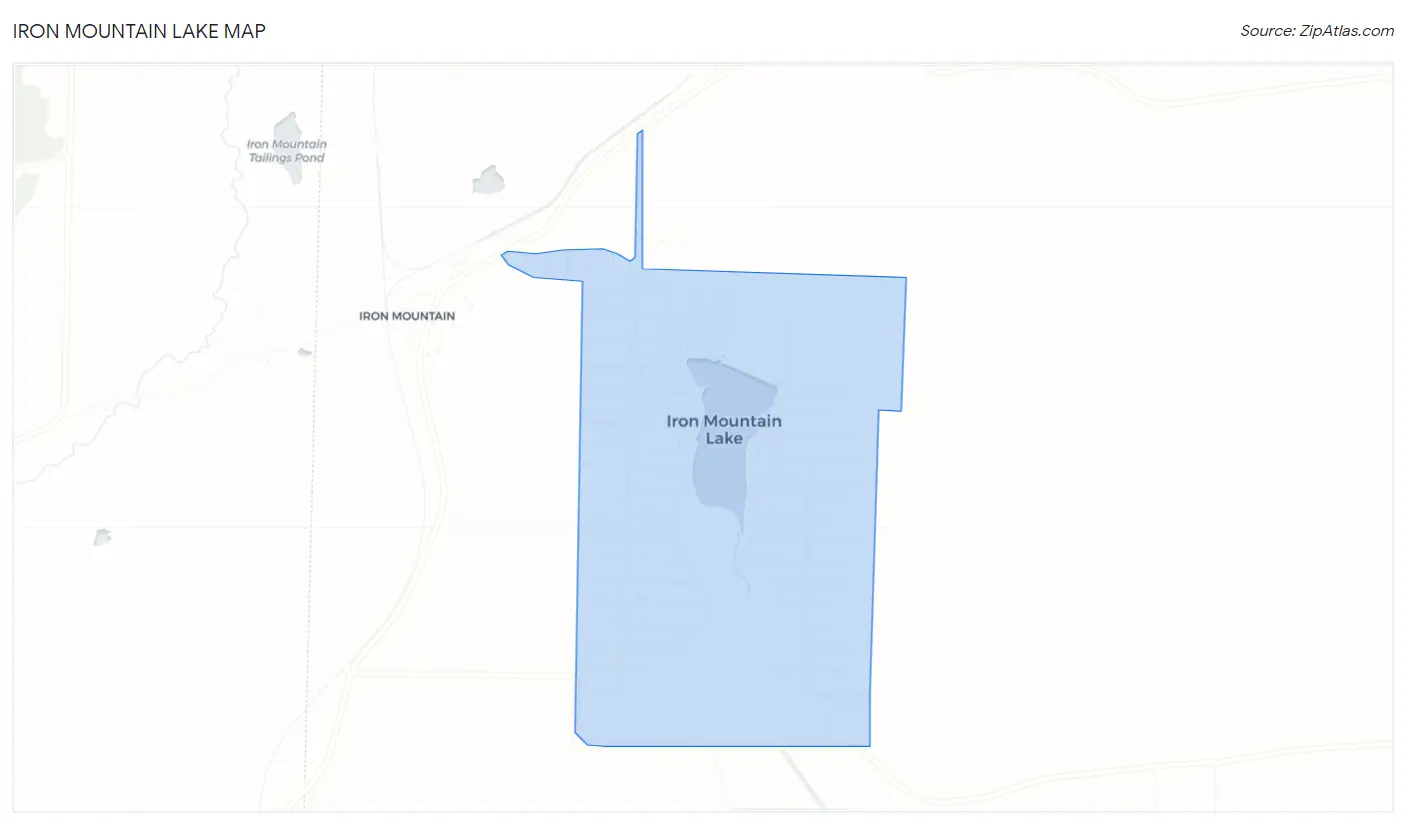
Iron Mountain Lake Overview
$14,297
PER CAPITA INCOME
$26,319
AVG FAMILY INCOME
$28,173
AVG HOUSEHOLD INCOME
19.5%
WAGE / INCOME GAP [ % ]
80.5¢/ $1
WAGE / INCOME GAP [ $ ]
0.35
INEQUALITY / GINI INDEX
806
TOTAL POPULATION
384
MALE POPULATION
422
FEMALE POPULATION
91.00
MALES / 100 FEMALES
109.90
FEMALES / 100 MALES
49.2
MEDIAN AGE
2.9
AVG FAMILY SIZE
2.7
AVG HOUSEHOLD SIZE
231
LABOR FORCE [ PEOPLE ]
34.3%
PERCENT IN LABOR FORCE
4.3%
UNEMPLOYMENT RATE
Income in Iron Mountain Lake
Income Overview in Iron Mountain Lake
Per Capita Income in Iron Mountain Lake is $14,297, while median incomes of families and households are $26,319 and $28,173 respectively.
| Characteristic | Number | Measure |
| Per Capita Income | 806 | $14,297 |
| Median Family Income | 211 | $26,319 |
| Mean Family Income | 211 | $37,535 |
| Median Household Income | 295 | $28,173 |
| Mean Household Income | 295 | $34,979 |
| Income Deficit | 211 | $0 |
| Wage / Income Gap (%) | 806 | 19.52% |
| Wage / Income Gap ($) | 806 | 80.48¢ per $1 |
| Gini / Inequality Index | 806 | 0.35 |
Earnings by Sex in Iron Mountain Lake
Average Earnings in Iron Mountain Lake are $24,646, $28,580 for men and $23,000 for women, a difference of 19.5%.
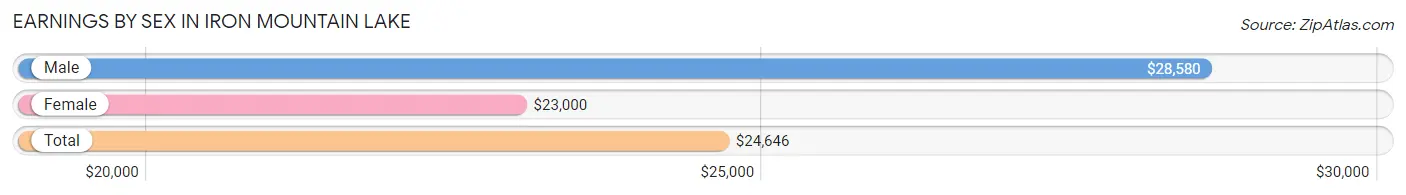
| Sex | Number | Average Earnings |
| Male | 111 (46.1%) | $28,580 |
| Female | 130 (53.9%) | $23,000 |
| Total | 241 (100.0%) | $24,646 |
Earnings by Sex by Income Bracket in Iron Mountain Lake
The most common earnings brackets in Iron Mountain Lake are $25,000 to $29,999 for men (41 | 36.9%) and $22,500 to $24,999 for women (45 | 34.6%).
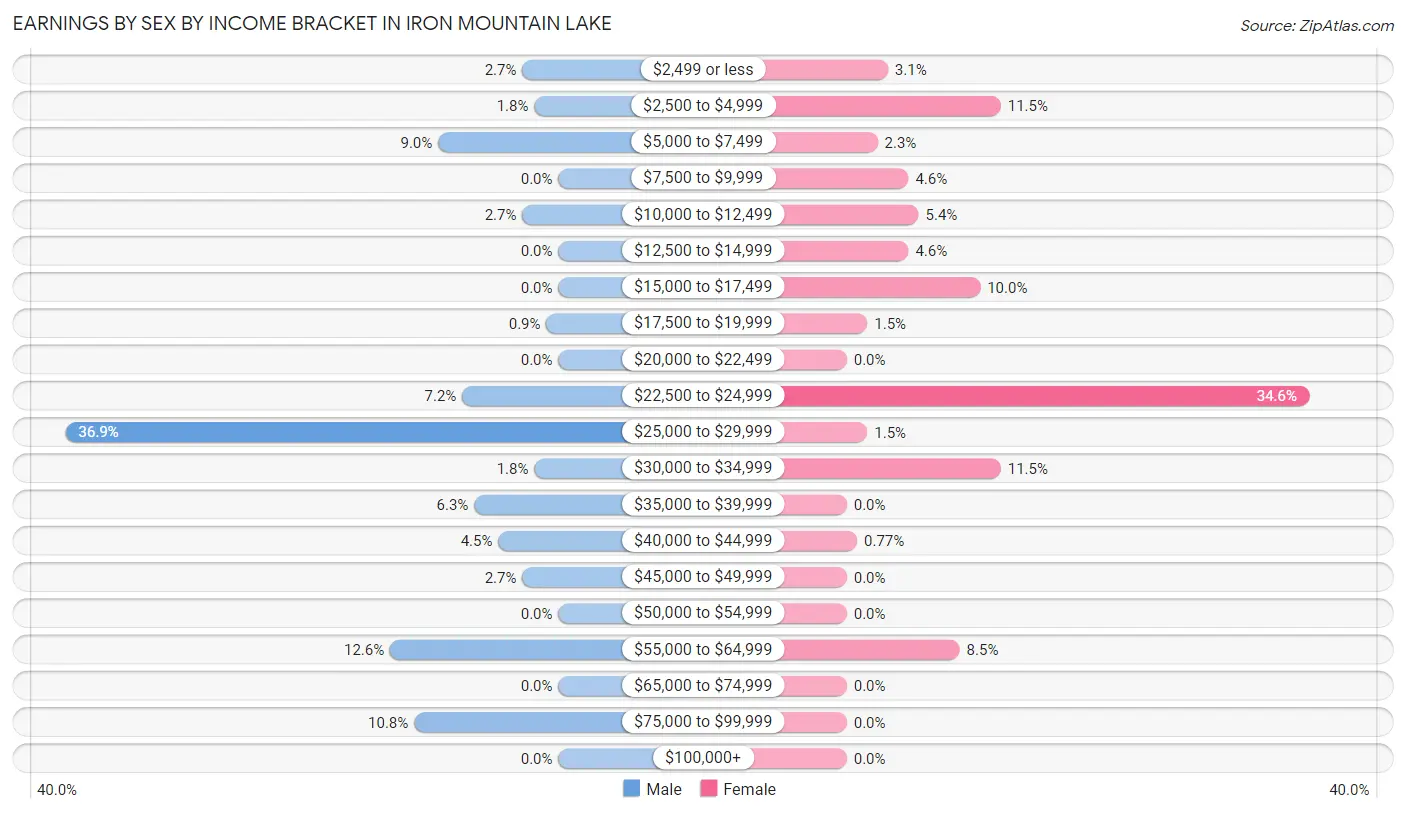
| Income | Male | Female |
| $2,499 or less | 3 (2.7%) | 4 (3.1%) |
| $2,500 to $4,999 | 2 (1.8%) | 15 (11.5%) |
| $5,000 to $7,499 | 10 (9.0%) | 3 (2.3%) |
| $7,500 to $9,999 | 0 (0.0%) | 6 (4.6%) |
| $10,000 to $12,499 | 3 (2.7%) | 7 (5.4%) |
| $12,500 to $14,999 | 0 (0.0%) | 6 (4.6%) |
| $15,000 to $17,499 | 0 (0.0%) | 13 (10.0%) |
| $17,500 to $19,999 | 1 (0.9%) | 2 (1.5%) |
| $20,000 to $22,499 | 0 (0.0%) | 0 (0.0%) |
| $22,500 to $24,999 | 8 (7.2%) | 45 (34.6%) |
| $25,000 to $29,999 | 41 (36.9%) | 2 (1.5%) |
| $30,000 to $34,999 | 2 (1.8%) | 15 (11.5%) |
| $35,000 to $39,999 | 7 (6.3%) | 0 (0.0%) |
| $40,000 to $44,999 | 5 (4.5%) | 1 (0.8%) |
| $45,000 to $49,999 | 3 (2.7%) | 0 (0.0%) |
| $50,000 to $54,999 | 0 (0.0%) | 0 (0.0%) |
| $55,000 to $64,999 | 14 (12.6%) | 11 (8.5%) |
| $65,000 to $74,999 | 0 (0.0%) | 0 (0.0%) |
| $75,000 to $99,999 | 12 (10.8%) | 0 (0.0%) |
| $100,000+ | 0 (0.0%) | 0 (0.0%) |
| Total | 111 (100.0%) | 130 (100.0%) |
Earnings by Sex by Educational Attainment in Iron Mountain Lake
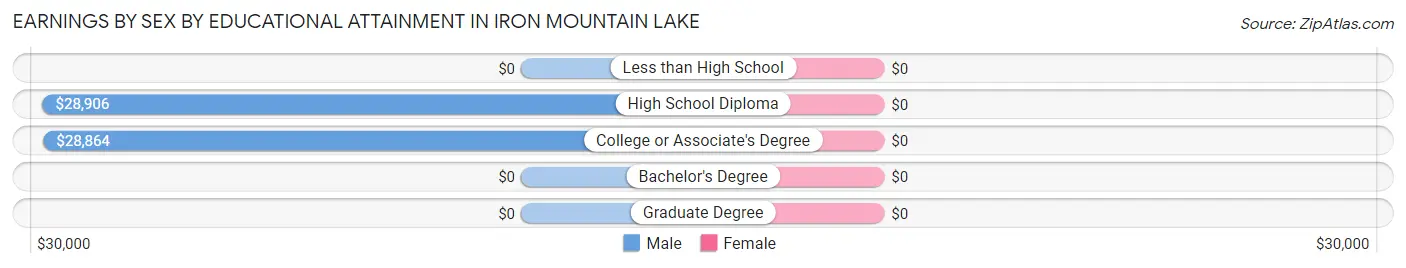
| Educational Attainment | Male Income | Female Income |
| Less than High School | - | - |
| High School Diploma | $28,906 | $0 |
| College or Associate's Degree | $28,864 | $0 |
| Bachelor's Degree | - | - |
| Graduate Degree | - | - |
| Total | $29,091 | $23,611 |
Family Income in Iron Mountain Lake
Family Income Brackets in Iron Mountain Lake
According to the Iron Mountain Lake family income data, there are 81 families falling into the $15,000 to $24,999 income range, which is the most common income bracket and makes up 38.4% of all families.
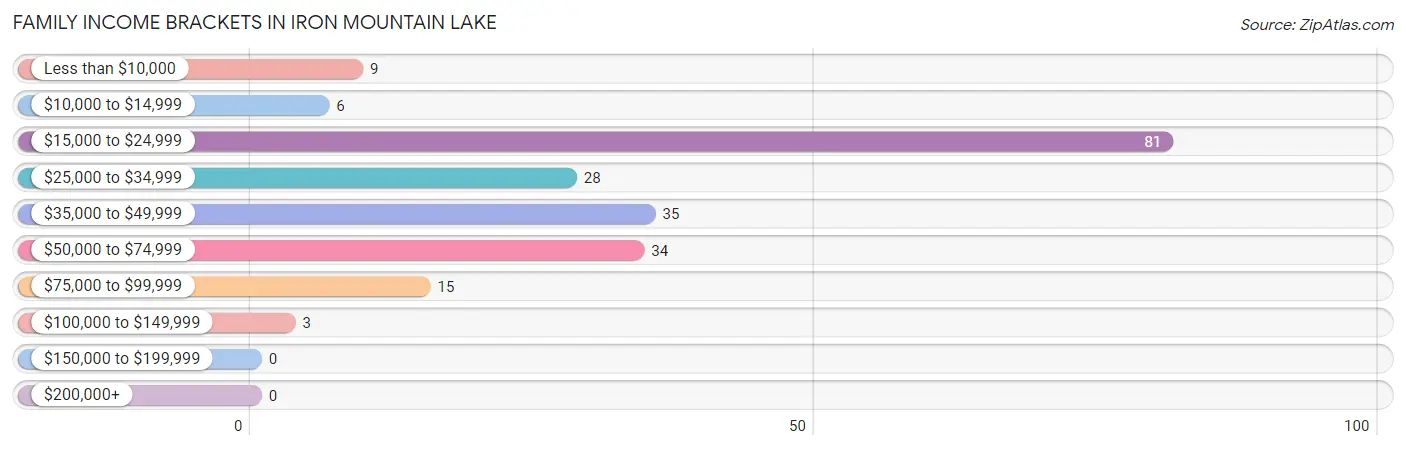
| Income Bracket | # Families | % Families |
| Less than $10,000 | 9 | 4.3% |
| $10,000 to $14,999 | 6 | 2.8% |
| $15,000 to $24,999 | 81 | 38.4% |
| $25,000 to $34,999 | 28 | 13.3% |
| $35,000 to $49,999 | 35 | 16.6% |
| $50,000 to $74,999 | 34 | 16.1% |
| $75,000 to $99,999 | 15 | 7.1% |
| $100,000 to $149,999 | 3 | 1.4% |
| $150,000 to $199,999 | 0 | 0.0% |
| $200,000+ | 0 | 0.0% |
Family Income by Famaliy Size in Iron Mountain Lake
3-person families (49 | 23.2%) account for the highest median family income in Iron Mountain Lake with $53,125 per family, while 3-person families (49 | 23.2%) have the highest median income of $17,708 per family member.
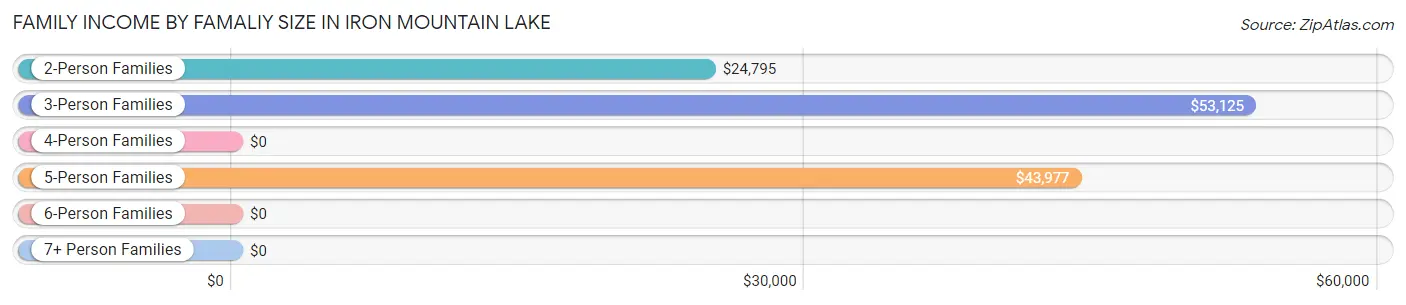
| Income Bracket | # Families | Median Income |
| 2-Person Families | 141 (66.8%) | $24,795 |
| 3-Person Families | 49 (23.2%) | $53,125 |
| 4-Person Families | 3 (1.4%) | $0 |
| 5-Person Families | 13 (6.2%) | $43,977 |
| 6-Person Families | 5 (2.4%) | $0 |
| 7+ Person Families | 0 (0.0%) | $0 |
| Total | 211 (100.0%) | $26,319 |
Family Income by Number of Earners in Iron Mountain Lake
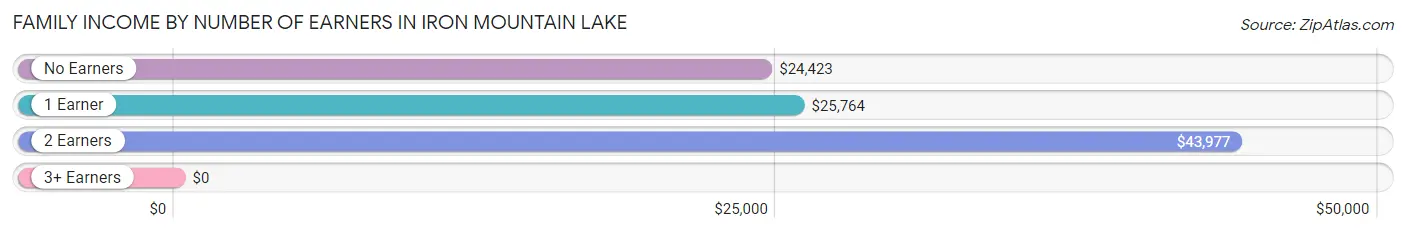
| Number of Earners | # Families | Median Income |
| No Earners | 58 (27.5%) | $24,423 |
| 1 Earner | 123 (58.3%) | $25,764 |
| 2 Earners | 29 (13.7%) | $43,977 |
| 3+ Earners | 1 (0.5%) | $0 |
| Total | 211 (100.0%) | $26,319 |
Household Income in Iron Mountain Lake
Household Income Brackets in Iron Mountain Lake
With 93 households falling in the category, the $15,000 to $24,999 income range is the most frequent in Iron Mountain Lake, accounting for 31.5% of all households.
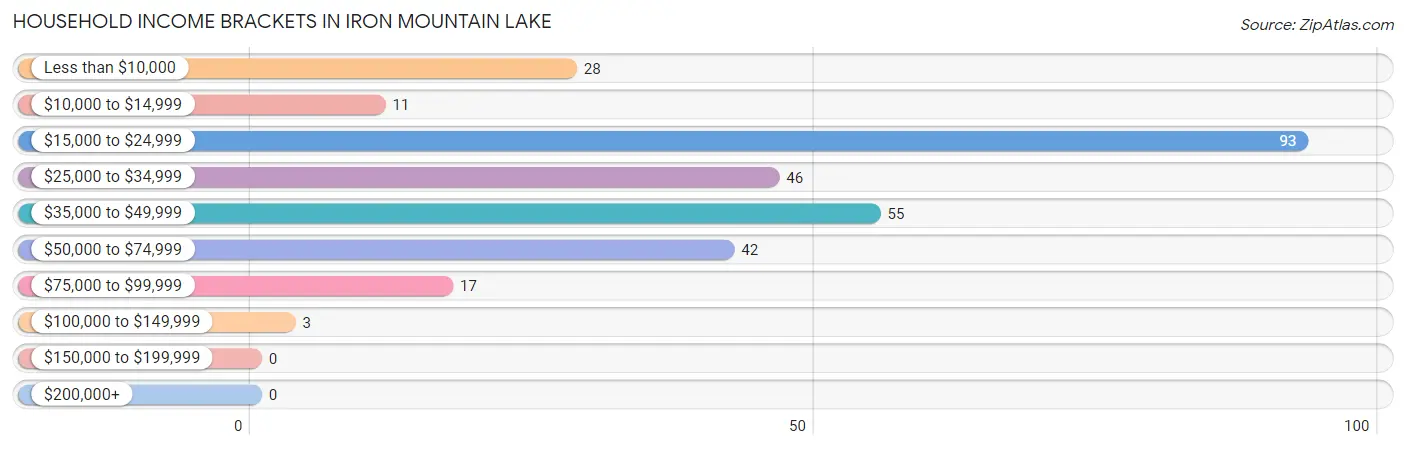
| Income Bracket | # Households | % Households |
| Less than $10,000 | 28 | 9.5% |
| $10,000 to $14,999 | 11 | 3.7% |
| $15,000 to $24,999 | 93 | 31.5% |
| $25,000 to $34,999 | 46 | 15.6% |
| $35,000 to $49,999 | 55 | 18.6% |
| $50,000 to $74,999 | 42 | 14.2% |
| $75,000 to $99,999 | 17 | 5.8% |
| $100,000 to $149,999 | 3 | 1.0% |
| $150,000 to $199,999 | 0 | 0.0% |
| $200,000+ | 0 | 0.0% |
Household Income by Householder Age in Iron Mountain Lake
The median household income in Iron Mountain Lake is $28,173, with the highest median household income of $36,719 found in the 25 to 44 years age bracket for the primary householder. A total of 70 households (23.7%) fall into this category. Meanwhile, the 15 to 24 years age bracket for the primary householder has the lowest median household income of $0, with 6 households (2.0%) in this group.
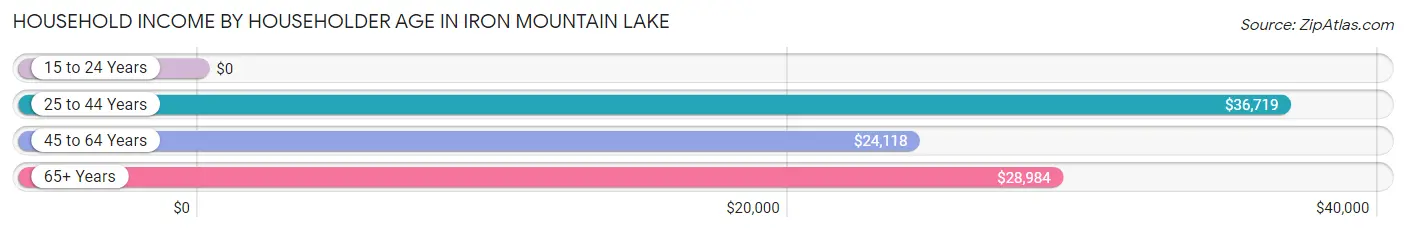
| Income Bracket | # Households | Median Income |
| 15 to 24 Years | 6 (2.0%) | $0 |
| 25 to 44 Years | 70 (23.7%) | $36,719 |
| 45 to 64 Years | 140 (47.5%) | $24,118 |
| 65+ Years | 79 (26.8%) | $28,984 |
| Total | 295 (100.0%) | $28,173 |
Poverty in Iron Mountain Lake
Income Below Poverty by Sex and Age in Iron Mountain Lake
With 23.5% poverty level for males and 31.0% for females among the residents of Iron Mountain Lake, 15 year old males and 15 year old females are the most vulnerable to poverty, with 3 males (100.0%) and 4 females (100.0%) in their respective age groups living below the poverty level.
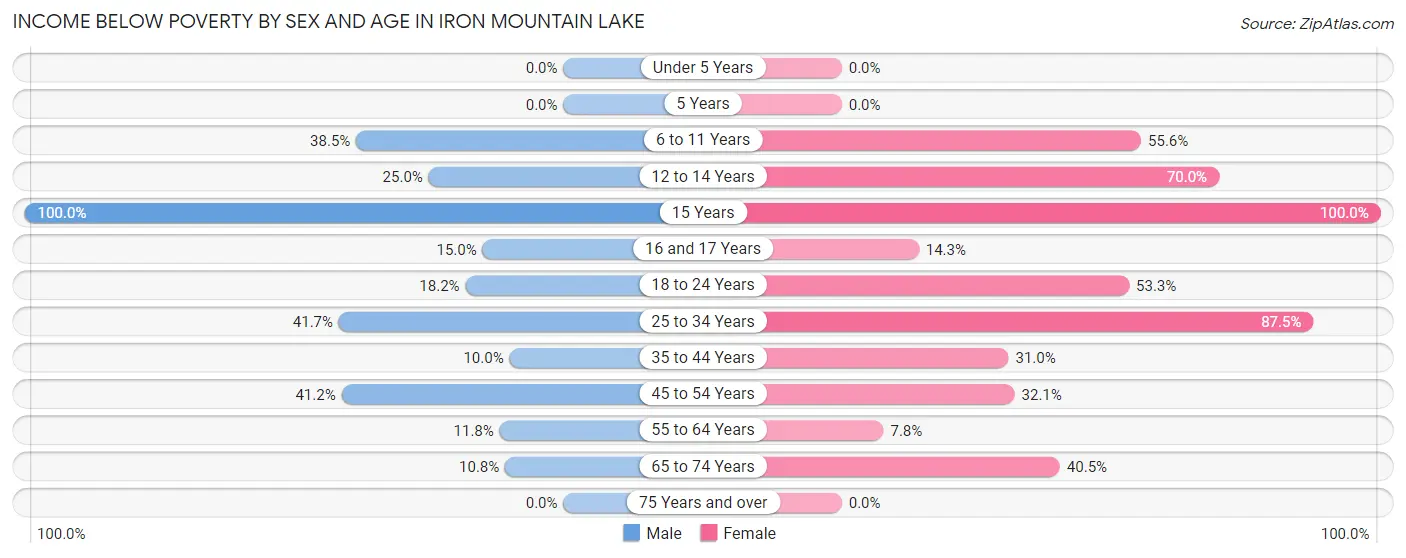
| Age Bracket | Male | Female |
| Under 5 Years | 0 (0.0%) | 0 (0.0%) |
| 5 Years | 0 (0.0%) | 0 (0.0%) |
| 6 to 11 Years | 10 (38.5%) | 10 (55.6%) |
| 12 to 14 Years | 6 (25.0%) | 7 (70.0%) |
| 15 Years | 3 (100.0%) | 4 (100.0%) |
| 16 and 17 Years | 3 (15.0%) | 3 (14.3%) |
| 18 to 24 Years | 2 (18.2%) | 8 (53.3%) |
| 25 to 34 Years | 15 (41.7%) | 42 (87.5%) |
| 35 to 44 Years | 3 (10.0%) | 13 (30.9%) |
| 45 to 54 Years | 28 (41.2%) | 17 (32.1%) |
| 55 to 64 Years | 11 (11.8%) | 10 (7.7%) |
| 65 to 74 Years | 4 (10.8%) | 17 (40.5%) |
| 75 Years and over | 0 (0.0%) | 0 (0.0%) |
| Total | 85 (23.5%) | 131 (31.0%) |
Income Above Poverty by Sex and Age in Iron Mountain Lake
According to the poverty statistics in Iron Mountain Lake, males aged under 5 years and females aged under 5 years are the age groups that are most secure financially, with 100.0% of males and 100.0% of females in these age groups living above the poverty line.
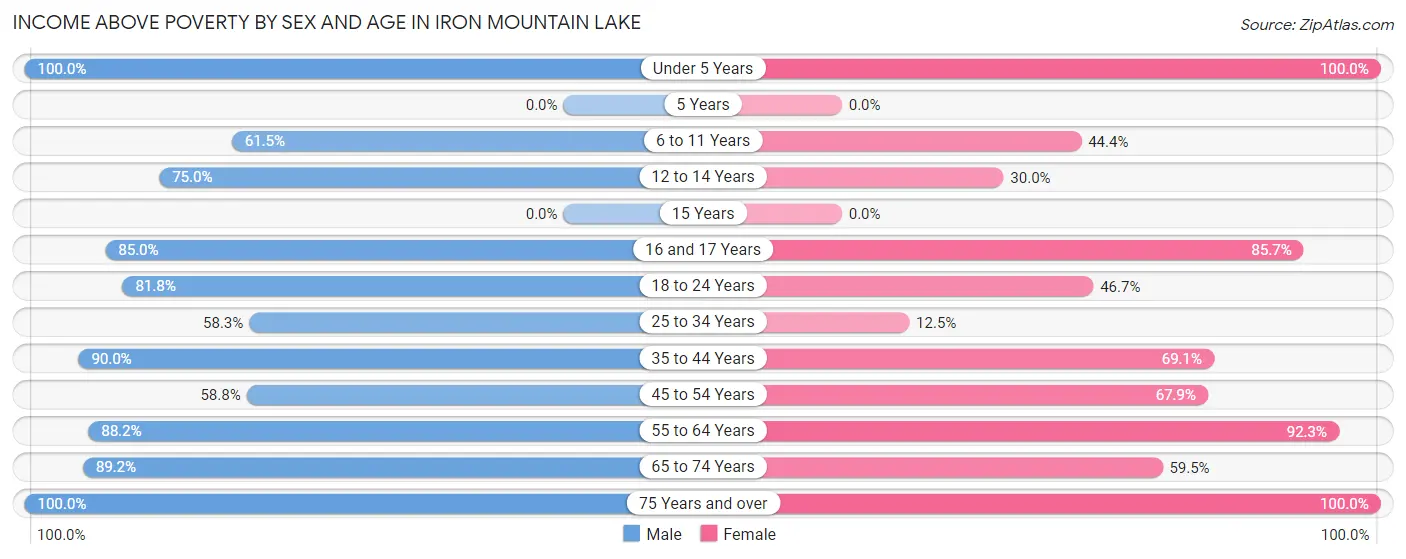
| Age Bracket | Male | Female |
| Under 5 Years | 3 (100.0%) | 21 (100.0%) |
| 5 Years | 0 (0.0%) | 0 (0.0%) |
| 6 to 11 Years | 16 (61.5%) | 8 (44.4%) |
| 12 to 14 Years | 18 (75.0%) | 3 (30.0%) |
| 15 Years | 0 (0.0%) | 0 (0.0%) |
| 16 and 17 Years | 17 (85.0%) | 18 (85.7%) |
| 18 to 24 Years | 9 (81.8%) | 7 (46.7%) |
| 25 to 34 Years | 21 (58.3%) | 6 (12.5%) |
| 35 to 44 Years | 27 (90.0%) | 29 (69.1%) |
| 45 to 54 Years | 40 (58.8%) | 36 (67.9%) |
| 55 to 64 Years | 82 (88.2%) | 119 (92.2%) |
| 65 to 74 Years | 33 (89.2%) | 25 (59.5%) |
| 75 Years and over | 10 (100.0%) | 19 (100.0%) |
| Total | 276 (76.4%) | 291 (69.0%) |
Income Below Poverty Among Married-Couple Families in Iron Mountain Lake
The poverty statistics for married-couple families in Iron Mountain Lake show that 15.0% or 21 of the total 140 families live below the poverty line. Families with 1 or 2 children have the highest poverty rate of 45.5%, comprising of 10 families. On the other hand, families with no children have the lowest poverty rate of 7.8%, which includes 8 families.
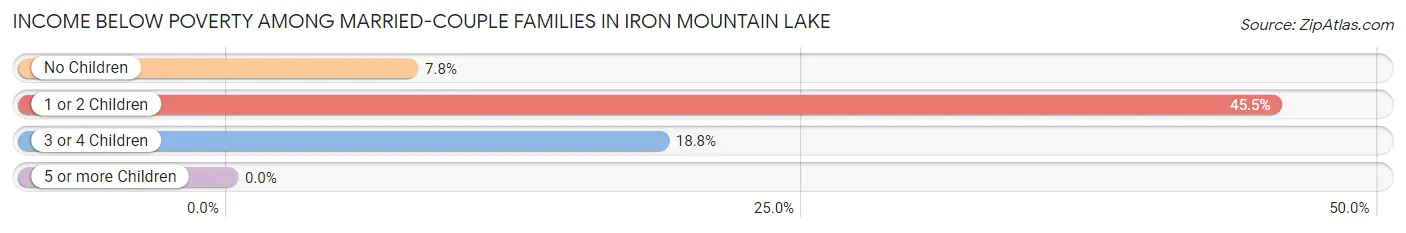
| Children | Above Poverty | Below Poverty |
| No Children | 94 (92.2%) | 8 (7.8%) |
| 1 or 2 Children | 12 (54.5%) | 10 (45.5%) |
| 3 or 4 Children | 13 (81.2%) | 3 (18.8%) |
| 5 or more Children | 0 (0.0%) | 0 (0.0%) |
| Total | 119 (85.0%) | 21 (15.0%) |
Income Below Poverty Among Single-Parent Households in Iron Mountain Lake
According to the poverty data in Iron Mountain Lake, 11.1% or 5 single-father households and 46.2% or 12 single-mother households are living below the poverty line. Among single-father households, those with 3 or 4 children have the highest poverty rate, with 2 households (100.0%) experiencing poverty. Likewise, among single-mother households, those with no children have the highest poverty rate, with 12 households (46.2%) falling below the poverty line.
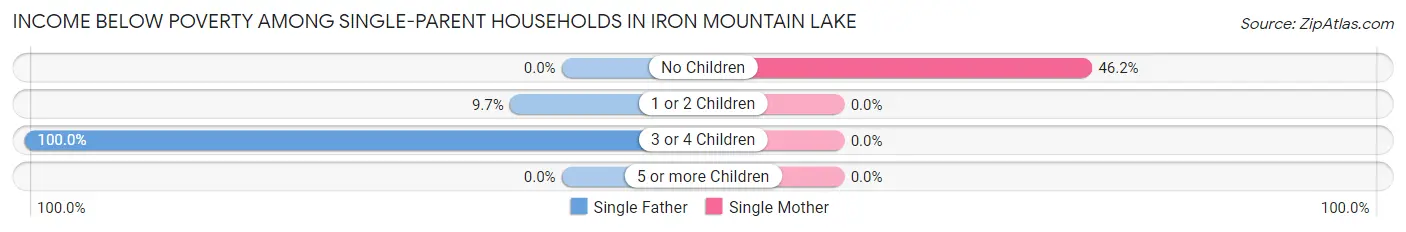
| Children | Single Father | Single Mother |
| No Children | 0 (0.0%) | 12 (46.2%) |
| 1 or 2 Children | 3 (9.7%) | 0 (0.0%) |
| 3 or 4 Children | 2 (100.0%) | 0 (0.0%) |
| 5 or more Children | 0 (0.0%) | 0 (0.0%) |
| Total | 5 (11.1%) | 12 (46.2%) |
Income Below Poverty Among Married-Couple vs Single-Parent Households in Iron Mountain Lake
The poverty data for Iron Mountain Lake shows that 21 of the married-couple family households (15.0%) and 17 of the single-parent households (23.9%) are living below the poverty level. Within the married-couple family households, those with 1 or 2 children have the highest poverty rate, with 10 households (45.5%) falling below the poverty line. Among the single-parent households, those with 3 or 4 children have the highest poverty rate, with 2 household (100.0%) living below poverty.
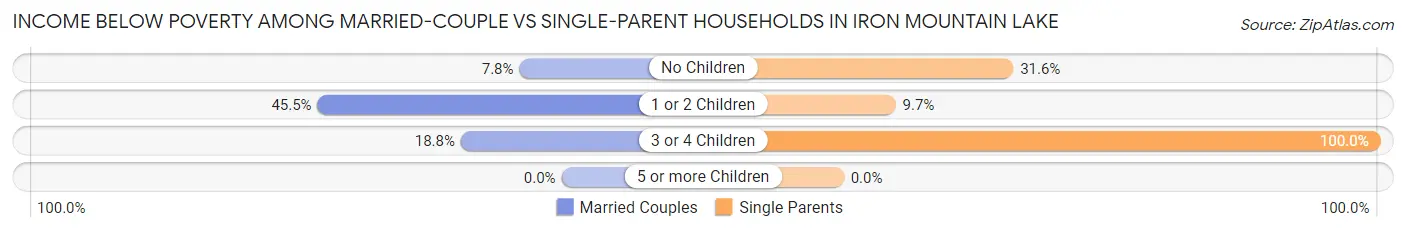
| Children | Married-Couple Families | Single-Parent Households |
| No Children | 8 (7.8%) | 12 (31.6%) |
| 1 or 2 Children | 10 (45.5%) | 3 (9.7%) |
| 3 or 4 Children | 3 (18.8%) | 2 (100.0%) |
| 5 or more Children | 0 (0.0%) | 0 (0.0%) |
| Total | 21 (15.0%) | 17 (23.9%) |
Race in Iron Mountain Lake
The most populous races in Iron Mountain Lake are White / Caucasian (778 | 96.5%), Two or more Races (23 | 2.9%), and Hispanic or Latino (21 | 2.6%).
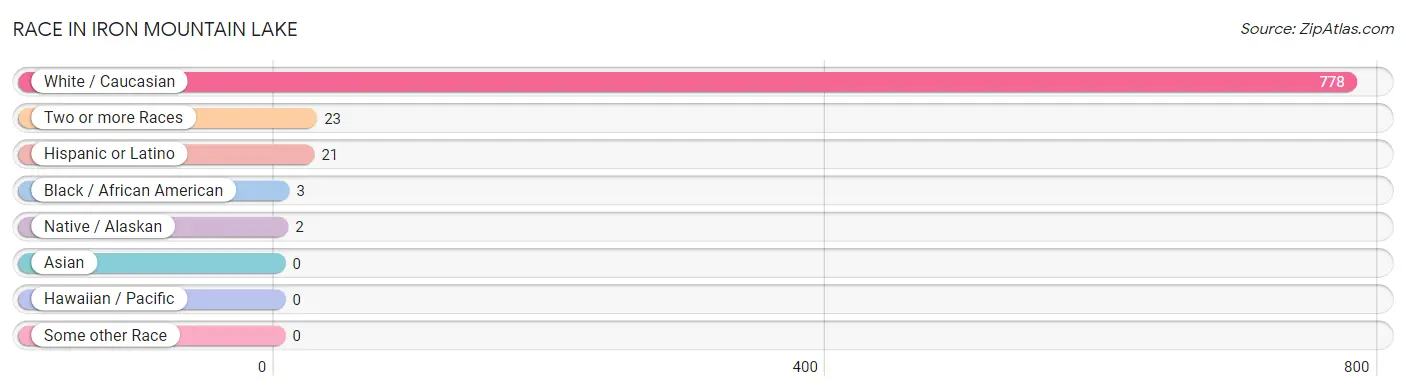
| Race | # Population | % Population |
| Asian | 0 | 0.0% |
| Black / African American | 3 | 0.4% |
| Hawaiian / Pacific | 0 | 0.0% |
| Hispanic or Latino | 21 | 2.6% |
| Native / Alaskan | 2 | 0.3% |
| White / Caucasian | 778 | 96.5% |
| Two or more Races | 23 | 2.9% |
| Some other Race | 0 | 0.0% |
| Total | 806 | 100.0% |
Ancestry in Iron Mountain Lake
The most populous ancestries reported in Iron Mountain Lake are American (252 | 31.3%), Irish (140 | 17.4%), German (96 | 11.9%), English (72 | 8.9%), and European (38 | 4.7%), together accounting for 74.2% of all Iron Mountain Lake residents.
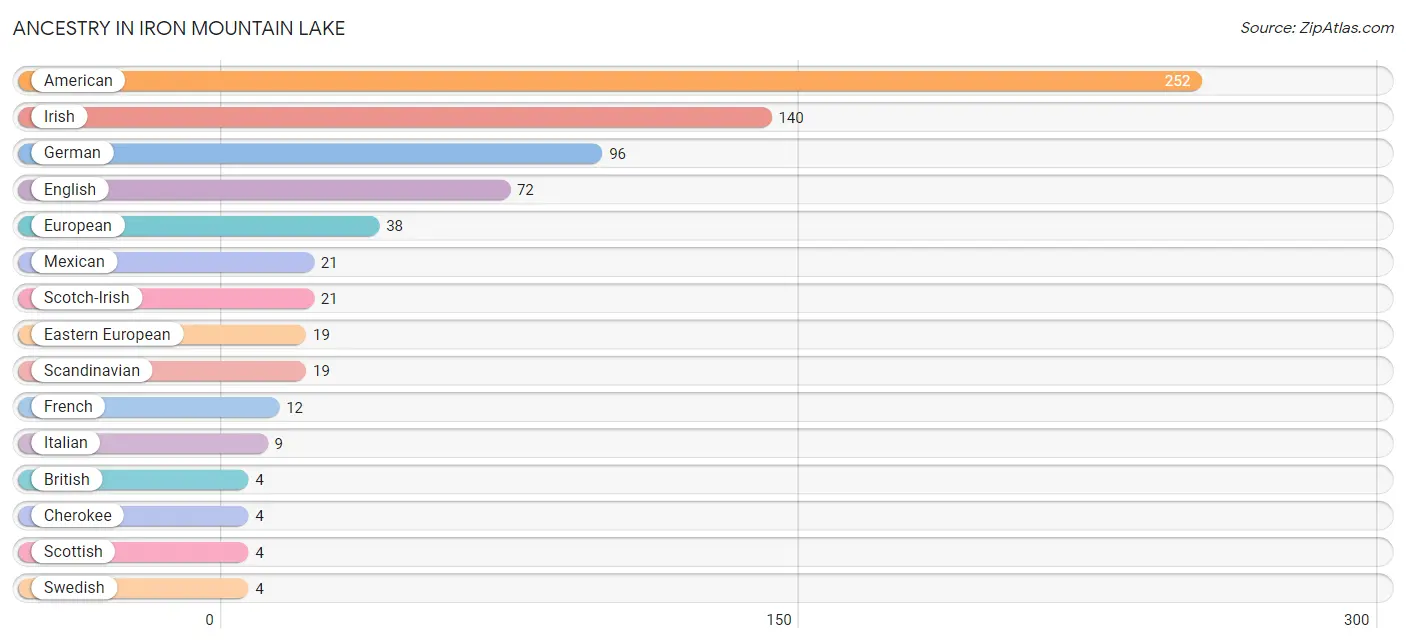
| Ancestry | # Population | % Population |
| American | 252 | 31.3% |
| British | 4 | 0.5% |
| Cherokee | 4 | 0.5% |
| Chippewa | 2 | 0.3% |
| Dutch | 3 | 0.4% |
| Eastern European | 19 | 2.4% |
| English | 72 | 8.9% |
| European | 38 | 4.7% |
| French | 12 | 1.5% |
| French American Indian | 2 | 0.3% |
| German | 96 | 11.9% |
| Irish | 140 | 17.4% |
| Italian | 9 | 1.1% |
| Mexican | 21 | 2.6% |
| Northern European | 1 | 0.1% |
| Scandinavian | 19 | 2.4% |
| Scotch-Irish | 21 | 2.6% |
| Scottish | 4 | 0.5% |
| Swedish | 4 | 0.5% |
| Welsh | 4 | 0.5% | View All 20 Rows |
Immigrants in Iron Mountain Lake
The most numerous immigrant groups reported in Iron Mountain Lake came from England (2 | 0.3%), Europe (2 | 0.3%), and Northern Europe (2 | 0.3%), together accounting for 0.7% of all Iron Mountain Lake residents.
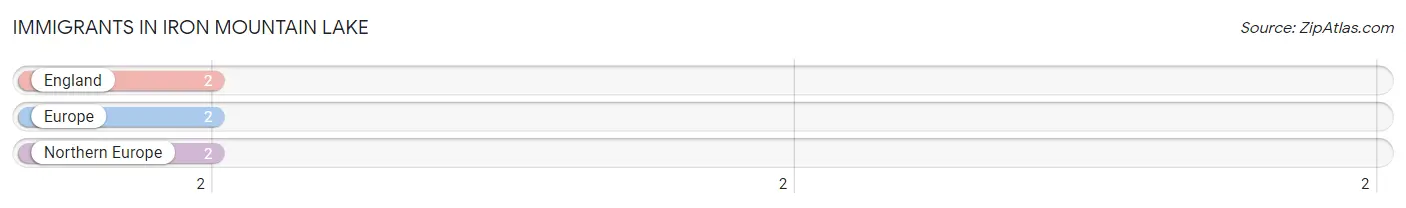
| Immigration Origin | # Population | % Population |
| England | 2 | 0.3% |
| Europe | 2 | 0.3% |
| Northern Europe | 2 | 0.3% | View All 3 Rows |
Sex and Age in Iron Mountain Lake
Sex and Age in Iron Mountain Lake
The most populous age groups in Iron Mountain Lake are 60 to 64 Years (86 | 22.4%) for men and 55 to 59 Years (69 | 16.4%) for women.
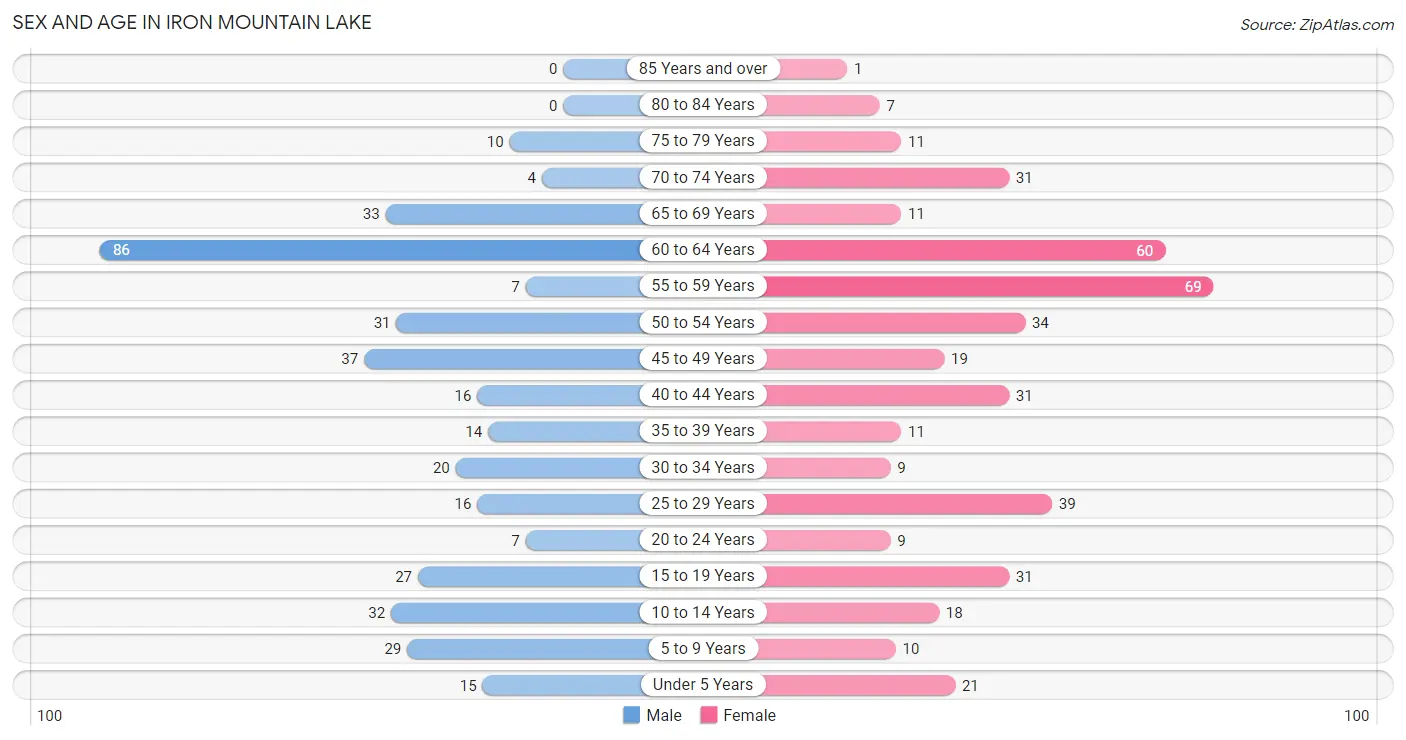
| Age Bracket | Male | Female |
| Under 5 Years | 15 (3.9%) | 21 (5.0%) |
| 5 to 9 Years | 29 (7.5%) | 10 (2.4%) |
| 10 to 14 Years | 32 (8.3%) | 18 (4.3%) |
| 15 to 19 Years | 27 (7.0%) | 31 (7.3%) |
| 20 to 24 Years | 7 (1.8%) | 9 (2.1%) |
| 25 to 29 Years | 16 (4.2%) | 39 (9.2%) |
| 30 to 34 Years | 20 (5.2%) | 9 (2.1%) |
| 35 to 39 Years | 14 (3.6%) | 11 (2.6%) |
| 40 to 44 Years | 16 (4.2%) | 31 (7.3%) |
| 45 to 49 Years | 37 (9.6%) | 19 (4.5%) |
| 50 to 54 Years | 31 (8.1%) | 34 (8.1%) |
| 55 to 59 Years | 7 (1.8%) | 69 (16.4%) |
| 60 to 64 Years | 86 (22.4%) | 60 (14.2%) |
| 65 to 69 Years | 33 (8.6%) | 11 (2.6%) |
| 70 to 74 Years | 4 (1.0%) | 31 (7.3%) |
| 75 to 79 Years | 10 (2.6%) | 11 (2.6%) |
| 80 to 84 Years | 0 (0.0%) | 7 (1.7%) |
| 85 Years and over | 0 (0.0%) | 1 (0.2%) |
| Total | 384 (100.0%) | 422 (100.0%) |
Families and Households in Iron Mountain Lake
Median Family Size in Iron Mountain Lake
The median family size in Iron Mountain Lake is 2.93 persons per family, with single male/father families (45 | 21.3%) accounting for the largest median family size of 3.64 persons per family. On the other hand, single female/mother families (26 | 12.3%) represent the smallest median family size with 2.19 persons per family.
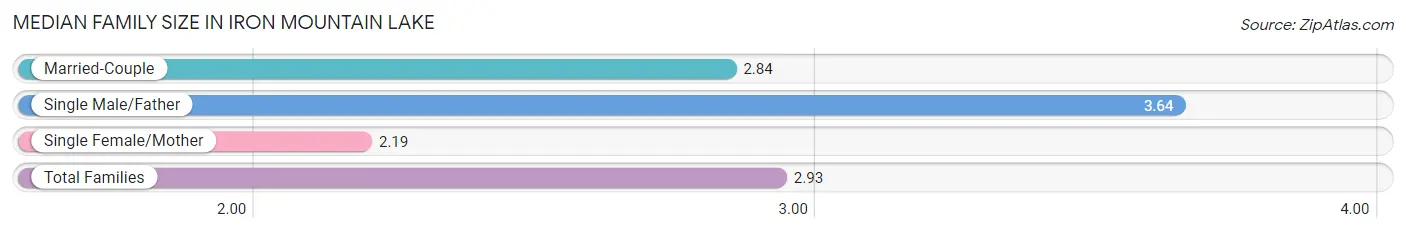
| Family Type | # Families | Family Size |
| Married-Couple | 140 (66.3%) | 2.84 |
| Single Male/Father | 45 (21.3%) | 3.64 |
| Single Female/Mother | 26 (12.3%) | 2.19 |
| Total Families | 211 (100.0%) | 2.93 |
Median Household Size in Iron Mountain Lake
The median household size in Iron Mountain Lake is 2.73 persons per household, with single male/father households (45 | 15.2%) accounting for the largest median household size of 4.38 persons per household. non-family households (84 | 28.5%) represent the smallest median household size with 1.15 persons per household.
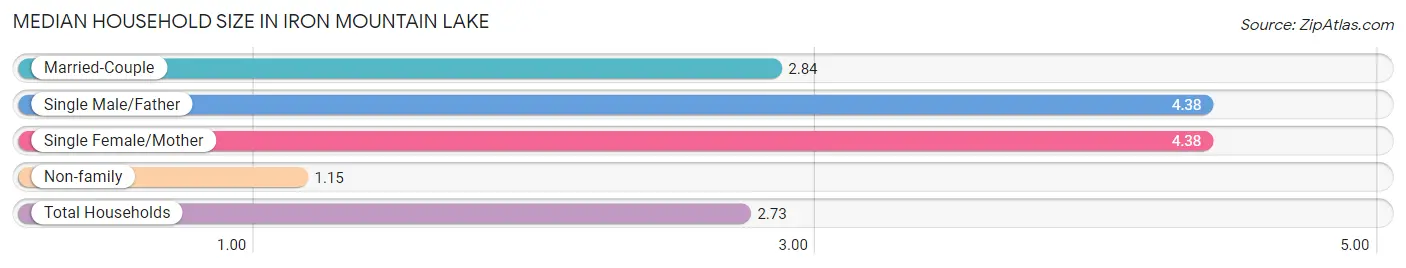
| Household Type | # Households | Household Size |
| Married-Couple | 140 (47.5%) | 2.84 |
| Single Male/Father | 45 (15.2%) | 4.38 |
| Single Female/Mother | 26 (8.8%) | 4.38 |
| Non-family | 84 (28.5%) | 1.15 |
| Total Households | 295 (100.0%) | 2.73 |
Household Size by Marriage Status in Iron Mountain Lake
Out of a total of 295 households in Iron Mountain Lake, 211 (71.5%) are family households, while 84 (28.5%) are nonfamily households. The most numerous type of family households are 2-person households, comprising 116, and the most common type of nonfamily households are 1-person households, comprising 72.
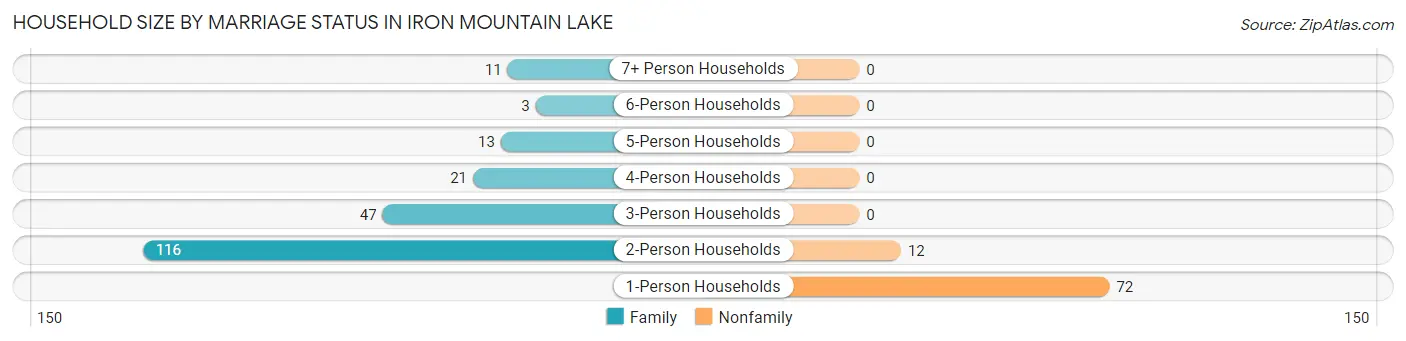
| Household Size | Family Households | Nonfamily Households |
| 1-Person Households | - | 72 (24.4%) |
| 2-Person Households | 116 (39.3%) | 12 (4.1%) |
| 3-Person Households | 47 (15.9%) | 0 (0.0%) |
| 4-Person Households | 21 (7.1%) | 0 (0.0%) |
| 5-Person Households | 13 (4.4%) | 0 (0.0%) |
| 6-Person Households | 3 (1.0%) | 0 (0.0%) |
| 7+ Person Households | 11 (3.7%) | 0 (0.0%) |
| Total | 211 (71.5%) | 84 (28.5%) |
Female Fertility in Iron Mountain Lake
Fertility by Age in Iron Mountain Lake
Average fertility rate in Iron Mountain Lake is 20.0 births per 1,000 women. Women in the age bracket of 20 to 34 years have the highest fertility rate with 53.0 births per 1,000 women. Women in the age bracket of 20 to 34 years acount for 100.0% of all women with births.
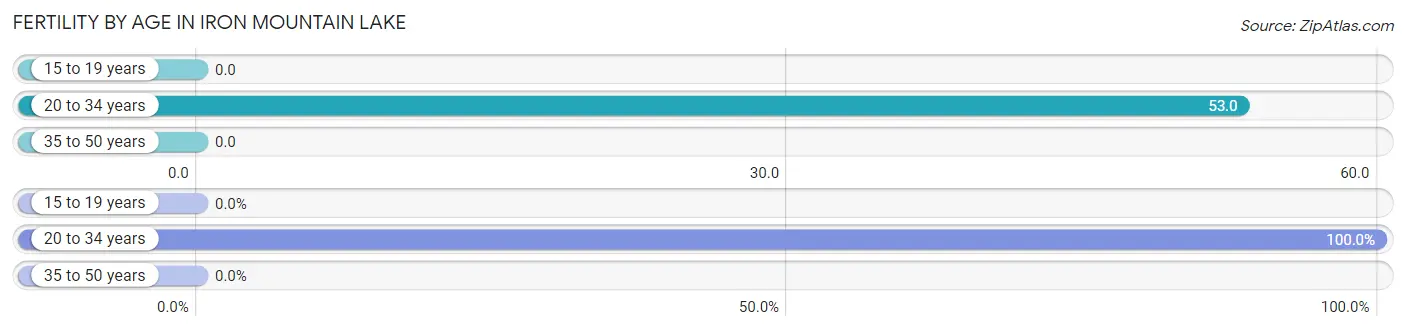
| Age Bracket | Women with Births | Births / 1,000 Women |
| 15 to 19 years | 0 (0.0%) | 0.0 |
| 20 to 34 years | 3 (100.0%) | 53.0 |
| 35 to 50 years | 0 (0.0%) | 0.0 |
| Total | 3 (100.0%) | 20.0 |
Fertility by Age by Marriage Status in Iron Mountain Lake
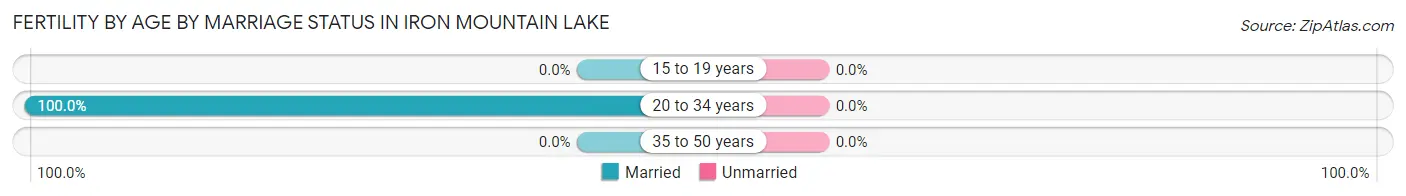
| Age Bracket | Married | Unmarried |
| 15 to 19 years | 0 (0.0%) | 0 (0.0%) |
| 20 to 34 years | 3 (100.0%) | 0 (0.0%) |
| 35 to 50 years | 0 (0.0%) | 0 (0.0%) |
| Total | 3 (100.0%) | 0 (0.0%) |
Fertility by Education in Iron Mountain Lake
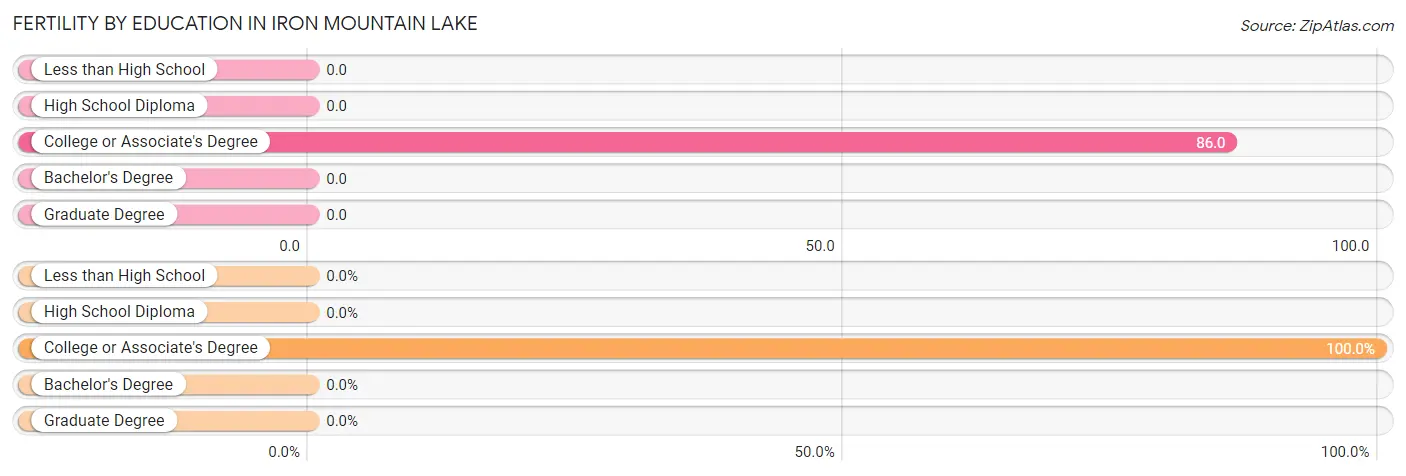
| Educational Attainment | Women with Births | Births / 1,000 Women |
| Less than High School | 0 (0.0%) | 0.0 |
| High School Diploma | 0 (0.0%) | 0.0 |
| College or Associate's Degree | 3 (100.0%) | 86.0 |
| Bachelor's Degree | 0 (0.0%) | 0.0 |
| Graduate Degree | 0 (0.0%) | 0.0 |
| Total | 3 (100.0%) | 20.0 |
Fertility by Education by Marriage Status in Iron Mountain Lake
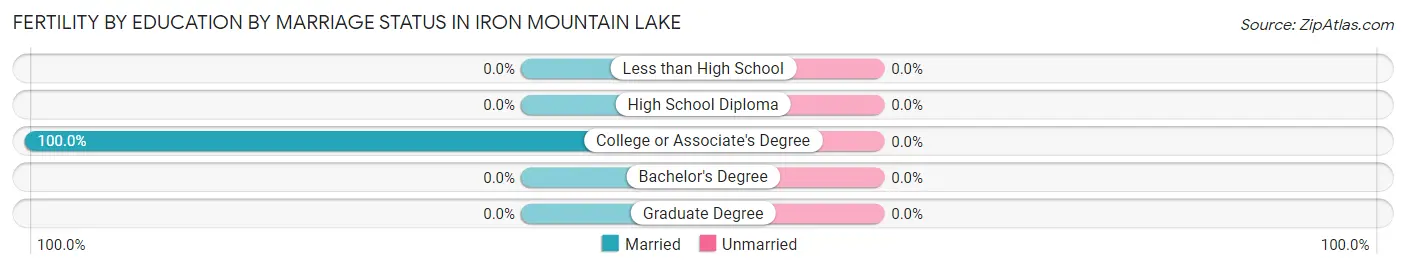
| Educational Attainment | Married | Unmarried |
| Less than High School | 0 (0.0%) | 0 (0.0%) |
| High School Diploma | 0 (0.0%) | 0 (0.0%) |
| College or Associate's Degree | 3 (100.0%) | 0 (0.0%) |
| Bachelor's Degree | 0 (0.0%) | 0 (0.0%) |
| Graduate Degree | 0 (0.0%) | 0 (0.0%) |
| Total | 3 (100.0%) | 0 (0.0%) |
Employment Characteristics in Iron Mountain Lake
Employment by Class of Employer in Iron Mountain Lake
Among the 221 employed individuals in Iron Mountain Lake, private company employees (174 | 78.7%), state government employees (28 | 12.7%), and not-for-profit organizations (10 | 4.5%) make up the most common classes of employment.
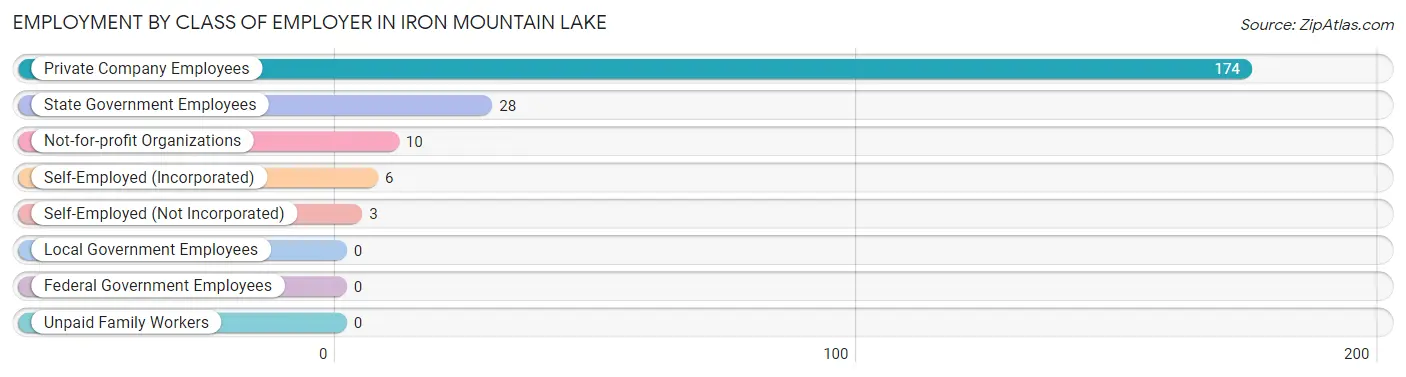
| Employer Class | # Employees | % Employees |
| Private Company Employees | 174 | 78.7% |
| Self-Employed (Incorporated) | 6 | 2.7% |
| Self-Employed (Not Incorporated) | 3 | 1.4% |
| Not-for-profit Organizations | 10 | 4.5% |
| Local Government Employees | 0 | 0.0% |
| State Government Employees | 28 | 12.7% |
| Federal Government Employees | 0 | 0.0% |
| Unpaid Family Workers | 0 | 0.0% |
| Total | 221 | 100.0% |
Employment Status by Age in Iron Mountain Lake
According to the labor force statistics for Iron Mountain Lake, out of the total population over 16 years of age (674), 34.3% or 231 individuals are in the labor force, with 4.3% or 10 of them unemployed. The age group with the highest labor force participation rate is 20 to 24 years, with 81.3% or 13 individuals in the labor force. Within the labor force, the 30 to 34 years age range has the highest percentage of unemployed individuals, with 54.5% or 6 of them being unemployed.
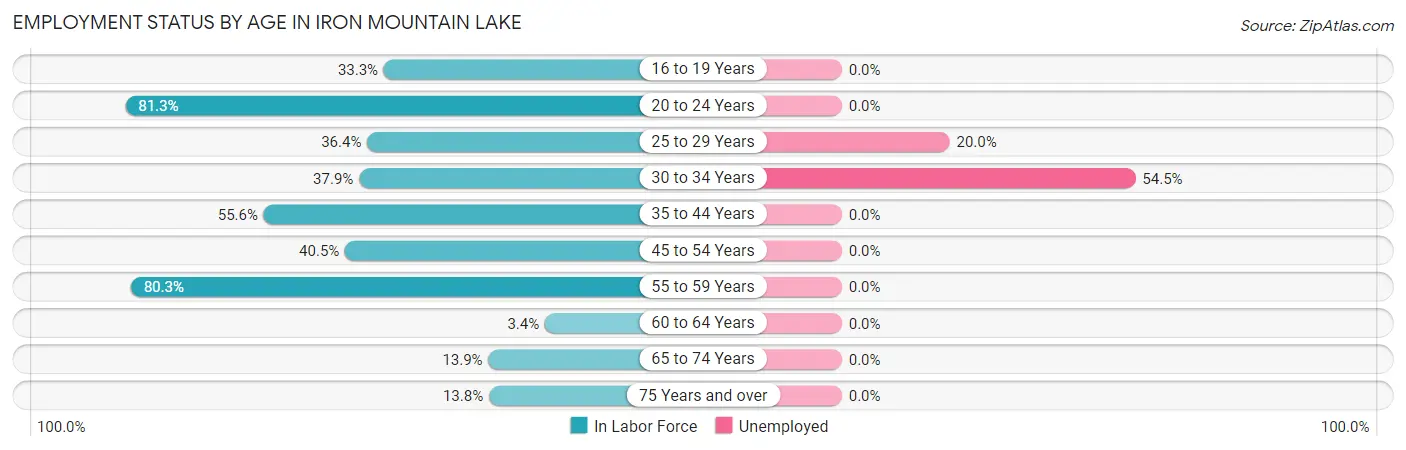
| Age Bracket | In Labor Force | Unemployed |
| 16 to 19 Years | 17 (33.3%) | 0 (0.0%) |
| 20 to 24 Years | 13 (81.3%) | 0 (0.0%) |
| 25 to 29 Years | 20 (36.4%) | 4 (20.0%) |
| 30 to 34 Years | 11 (37.9%) | 6 (54.5%) |
| 35 to 44 Years | 40 (55.6%) | 0 (0.0%) |
| 45 to 54 Years | 49 (40.5%) | 0 (0.0%) |
| 55 to 59 Years | 61 (80.3%) | 0 (0.0%) |
| 60 to 64 Years | 5 (3.4%) | 0 (0.0%) |
| 65 to 74 Years | 11 (13.9%) | 0 (0.0%) |
| 75 Years and over | 4 (13.8%) | 0 (0.0%) |
| Total | 231 (34.3%) | 10 (4.3%) |
Employment Status by Educational Attainment in Iron Mountain Lake
According to labor force statistics for Iron Mountain Lake, 37.3% of individuals (186) out of the total population between 25 and 64 years of age (499) are in the labor force, with 5.4% or 10 of them being unemployed. The group with the highest labor force participation rate are those with the educational attainment of college / associate degree, with 48.8% or 40 individuals in the labor force. Within the labor force, individuals with less than high school education have the highest percentage of unemployment, with 12.1% or 7 of them being unemployed.
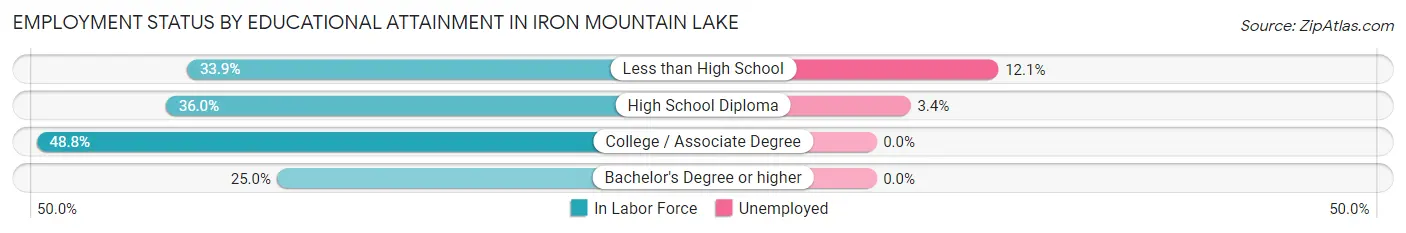
| Educational Attainment | In Labor Force | Unemployed |
| Less than High School | 58 (33.9%) | 21 (12.1%) |
| High School Diploma | 87 (36.0%) | 8 (3.4%) |
| College / Associate Degree | 40 (48.8%) | 0 (0.0%) |
| Bachelor's Degree or higher | 1 (25.0%) | 0 (0.0%) |
| Total | 186 (37.3%) | 27 (5.4%) |
Employment Occupations by Sex in Iron Mountain Lake
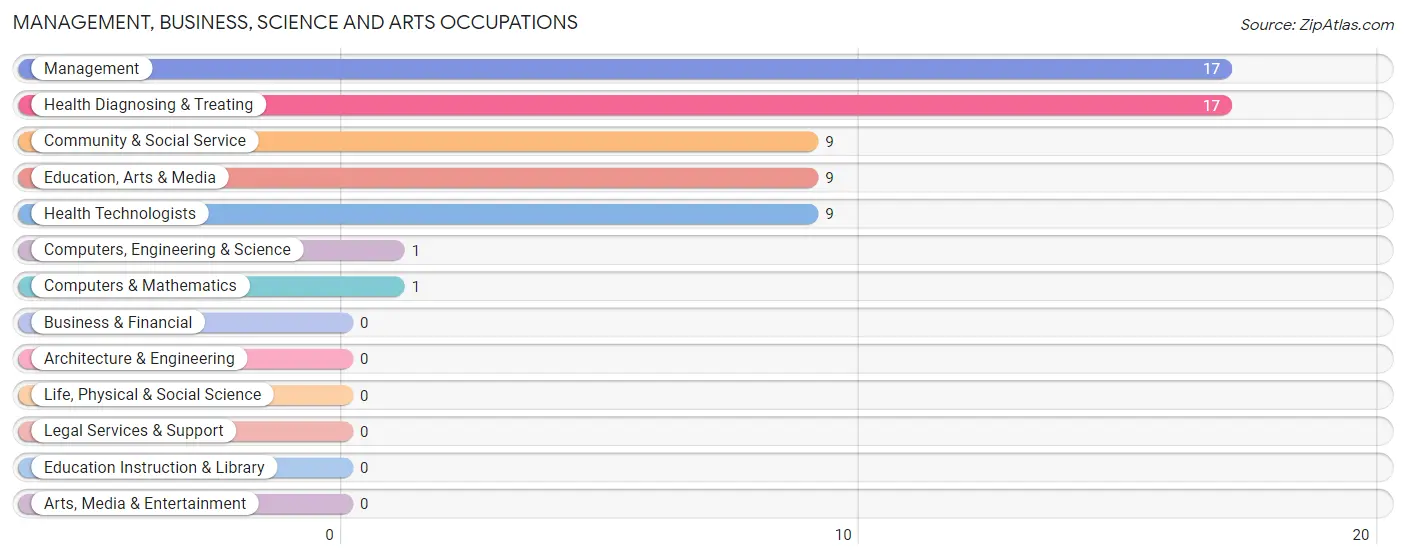
Management, Business, Science and Arts Occupations
The most common Management, Business, Science and Arts occupations in Iron Mountain Lake are Management (17 | 7.7%), Health Diagnosing & Treating (17 | 7.7%), Community & Social Service (9 | 4.1%), Education, Arts & Media (9 | 4.1%), and Health Technologists (9 | 4.1%).
Management, Business, Science and Arts Occupations by Sex
Within the Management, Business, Science and Arts occupations in Iron Mountain Lake, the most male-oriented occupations are Computers, Engineering & Science (100.0%), Computers & Mathematics (100.0%), and Community & Social Service (100.0%), while the most female-oriented occupations are Health Diagnosing & Treating (100.0%), Health Technologists (100.0%), and Management (41.2%).
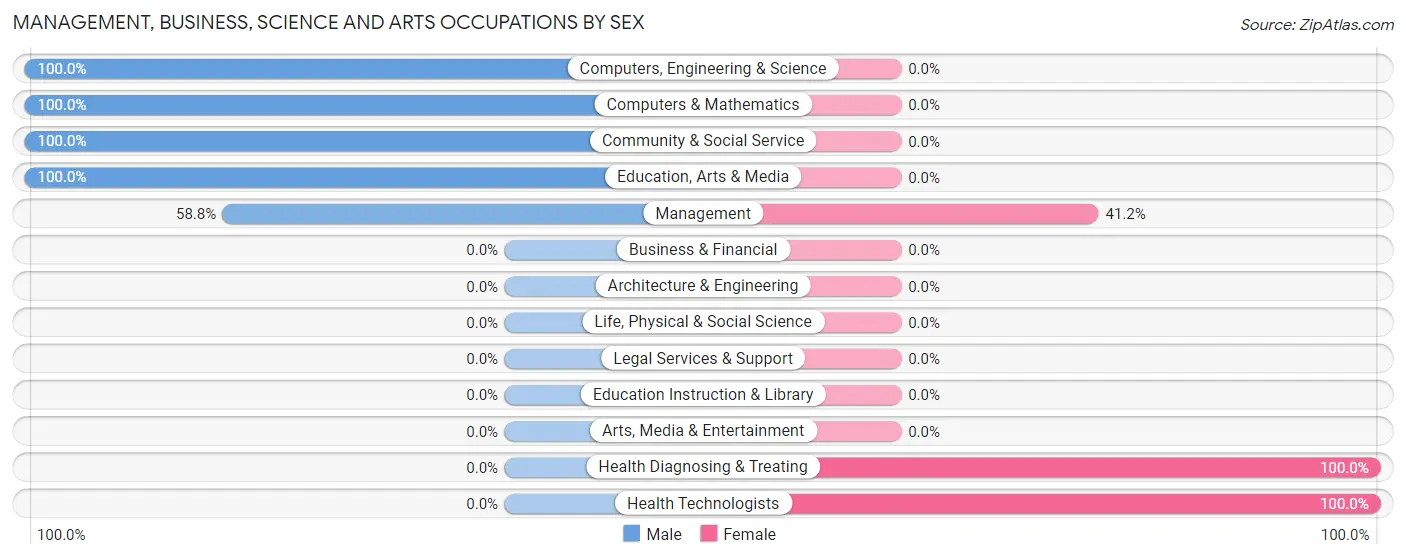
| Occupation | Male | Female |
| Management | 10 (58.8%) | 7 (41.2%) |
| Business & Financial | 0 (0.0%) | 0 (0.0%) |
| Computers, Engineering & Science | 1 (100.0%) | 0 (0.0%) |
| Computers & Mathematics | 1 (100.0%) | 0 (0.0%) |
| Architecture & Engineering | 0 (0.0%) | 0 (0.0%) |
| Life, Physical & Social Science | 0 (0.0%) | 0 (0.0%) |
| Community & Social Service | 9 (100.0%) | 0 (0.0%) |
| Education, Arts & Media | 9 (100.0%) | 0 (0.0%) |
| Legal Services & Support | 0 (0.0%) | 0 (0.0%) |
| Education Instruction & Library | 0 (0.0%) | 0 (0.0%) |
| Arts, Media & Entertainment | 0 (0.0%) | 0 (0.0%) |
| Health Diagnosing & Treating | 0 (0.0%) | 17 (100.0%) |
| Health Technologists | 0 (0.0%) | 9 (100.0%) |
| Total (Category) | 20 (45.5%) | 24 (54.5%) |
| Total (Overall) | 99 (44.8%) | 122 (55.2%) |
Services Occupations
The most common Services occupations in Iron Mountain Lake are Food Preparation & Serving (24 | 10.9%), Healthcare Support (16 | 7.2%), Cleaning & Maintenance (11 | 5.0%), Security & Protection (6 | 2.7%), and Law Enforcement (6 | 2.7%).
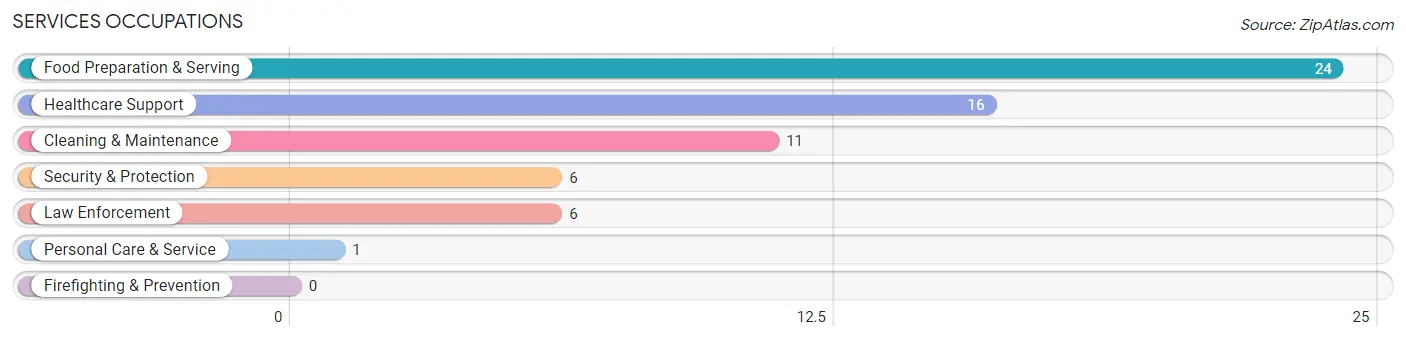
Services Occupations by Sex
Within the Services occupations in Iron Mountain Lake, the most male-oriented occupations are Security & Protection (100.0%), Law Enforcement (100.0%), and Food Preparation & Serving (25.0%), while the most female-oriented occupations are Healthcare Support (100.0%), Personal Care & Service (100.0%), and Cleaning & Maintenance (81.8%).
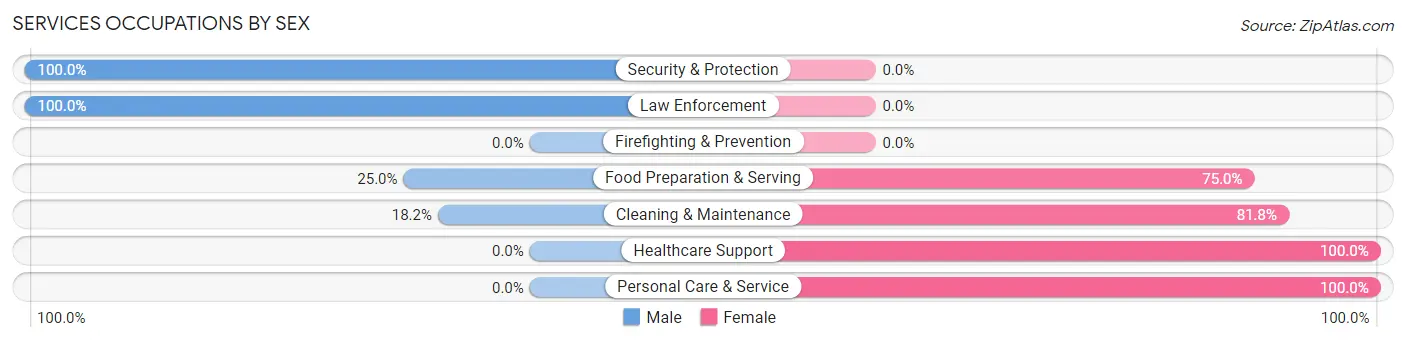
| Occupation | Male | Female |
| Healthcare Support | 0 (0.0%) | 16 (100.0%) |
| Security & Protection | 6 (100.0%) | 0 (0.0%) |
| Firefighting & Prevention | 0 (0.0%) | 0 (0.0%) |
| Law Enforcement | 6 (100.0%) | 0 (0.0%) |
| Food Preparation & Serving | 6 (25.0%) | 18 (75.0%) |
| Cleaning & Maintenance | 2 (18.2%) | 9 (81.8%) |
| Personal Care & Service | 0 (0.0%) | 1 (100.0%) |
| Total (Category) | 14 (24.1%) | 44 (75.9%) |
| Total (Overall) | 99 (44.8%) | 122 (55.2%) |
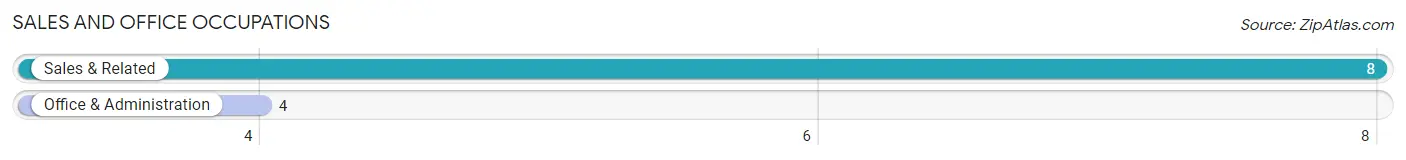
Sales and Office Occupations
The most common Sales and Office occupations in Iron Mountain Lake are Sales & Related (8 | 3.6%), and Office & Administration (4 | 1.8%).
Sales and Office Occupations by Sex
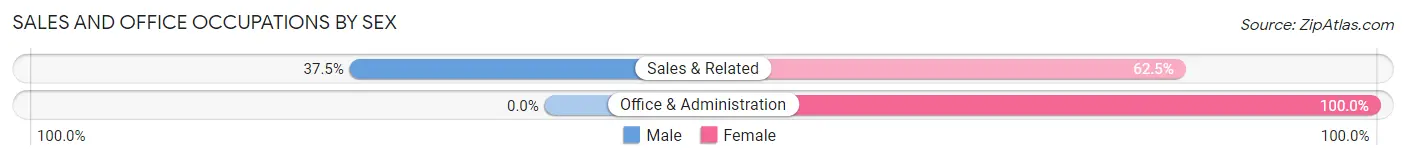
| Occupation | Male | Female |
| Sales & Related | 3 (37.5%) | 5 (62.5%) |
| Office & Administration | 0 (0.0%) | 4 (100.0%) |
| Total (Category) | 3 (25.0%) | 9 (75.0%) |
| Total (Overall) | 99 (44.8%) | 122 (55.2%) |
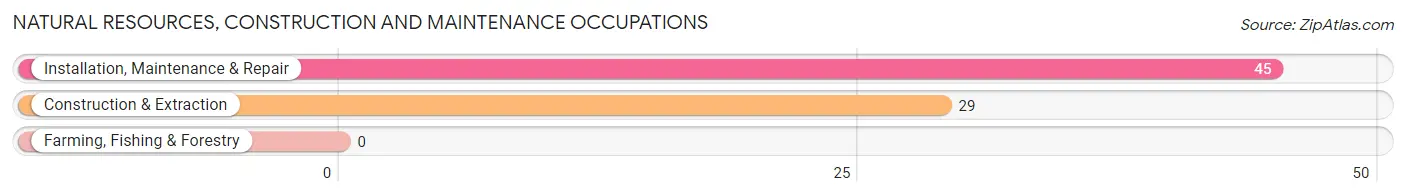
Natural Resources, Construction and Maintenance Occupations
The most common Natural Resources, Construction and Maintenance occupations in Iron Mountain Lake are Installation, Maintenance & Repair (45 | 20.4%), and Construction & Extraction (29 | 13.1%).
Natural Resources, Construction and Maintenance Occupations by Sex
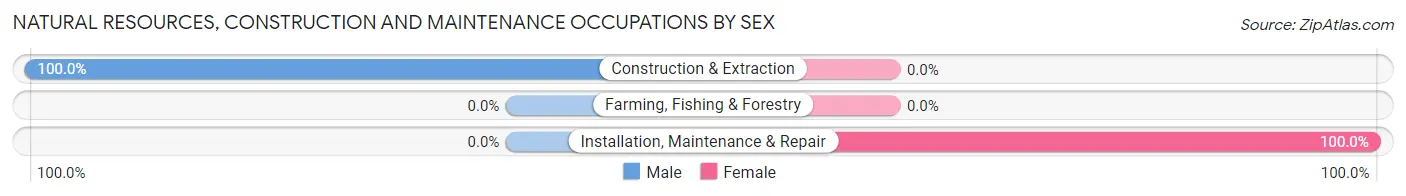
| Occupation | Male | Female |
| Farming, Fishing & Forestry | 0 (0.0%) | 0 (0.0%) |
| Construction & Extraction | 29 (100.0%) | 0 (0.0%) |
| Installation, Maintenance & Repair | 0 (0.0%) | 45 (100.0%) |
| Total (Category) | 29 (39.2%) | 45 (60.8%) |
| Total (Overall) | 99 (44.8%) | 122 (55.2%) |
Production, Transportation and Moving Occupations
The most common Production, Transportation and Moving occupations in Iron Mountain Lake are Material Moving (16 | 7.2%), Production (14 | 6.3%), and Transportation (3 | 1.4%).
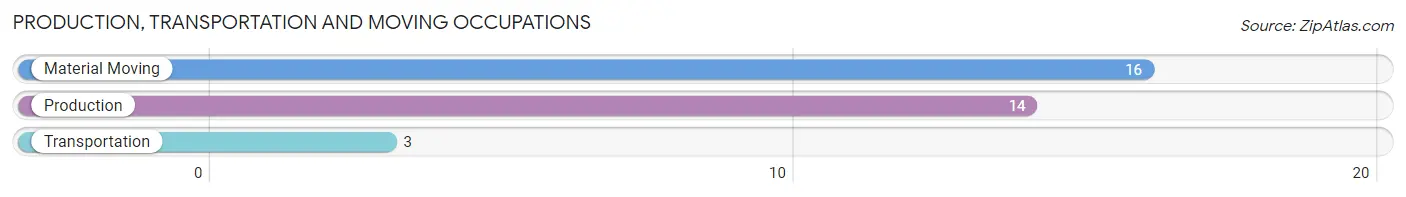
Production, Transportation and Moving Occupations by Sex
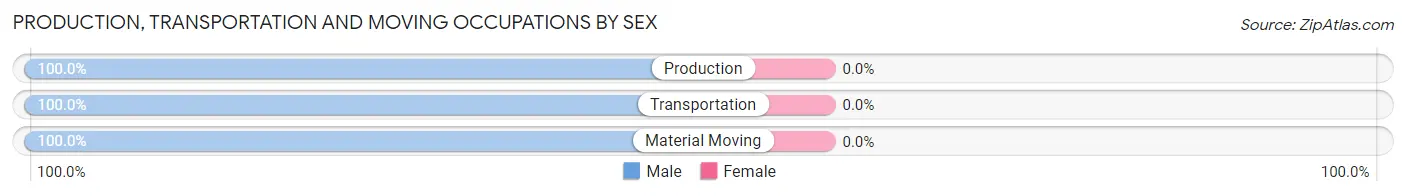
| Occupation | Male | Female |
| Production | 14 (100.0%) | 0 (0.0%) |
| Transportation | 3 (100.0%) | 0 (0.0%) |
| Material Moving | 16 (100.0%) | 0 (0.0%) |
| Total (Category) | 33 (100.0%) | 0 (0.0%) |
| Total (Overall) | 99 (44.8%) | 122 (55.2%) |
Employment Industries by Sex in Iron Mountain Lake
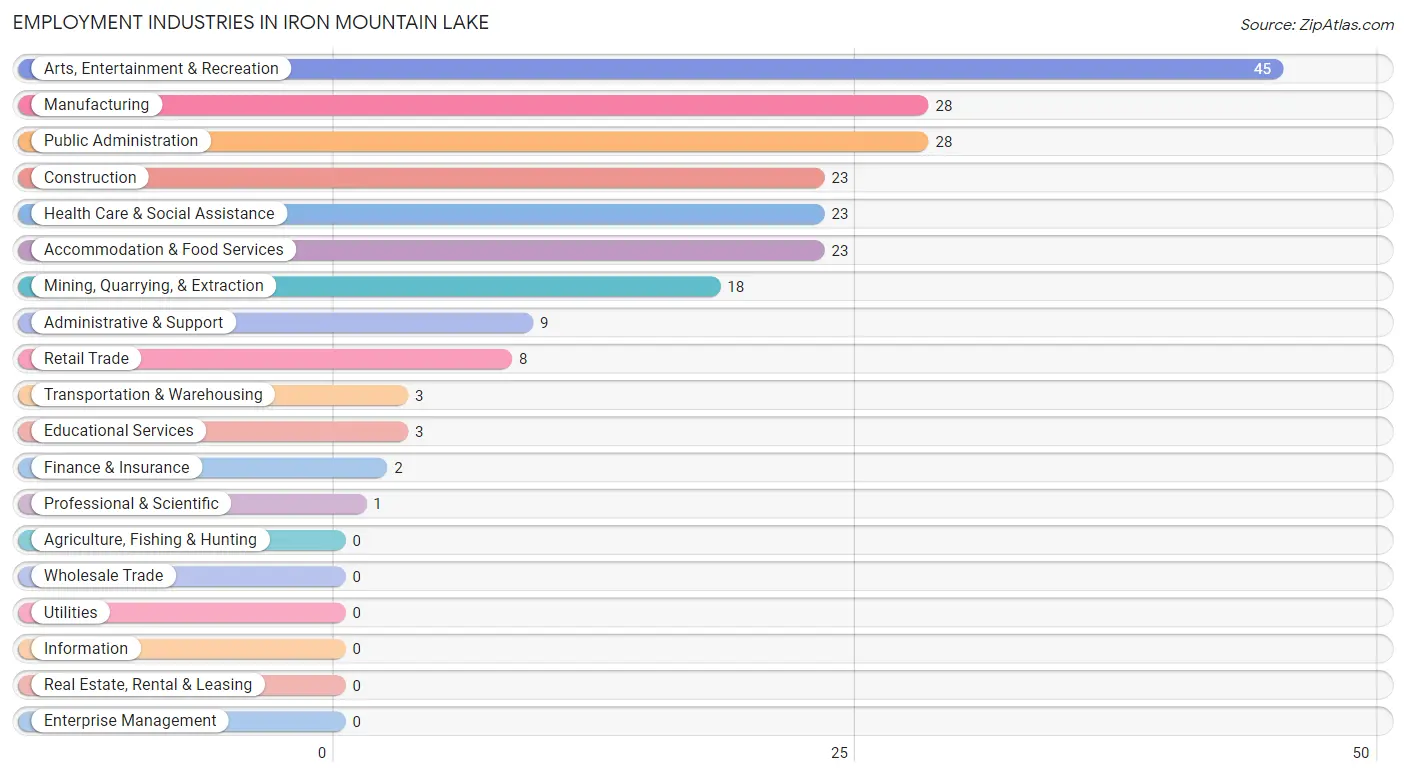
Employment Industries in Iron Mountain Lake
The major employment industries in Iron Mountain Lake include Arts, Entertainment & Recreation (45 | 20.4%), Manufacturing (28 | 12.7%), Public Administration (28 | 12.7%), Construction (23 | 10.4%), and Health Care & Social Assistance (23 | 10.4%).
Employment Industries by Sex in Iron Mountain Lake
The Iron Mountain Lake industries that see more men than women are Mining, Quarrying, & Extraction (100.0%), Construction (100.0%), and Manufacturing (100.0%), whereas the industries that tend to have a higher number of women are Finance & Insurance (100.0%), Administrative & Support (100.0%), and Educational Services (100.0%).
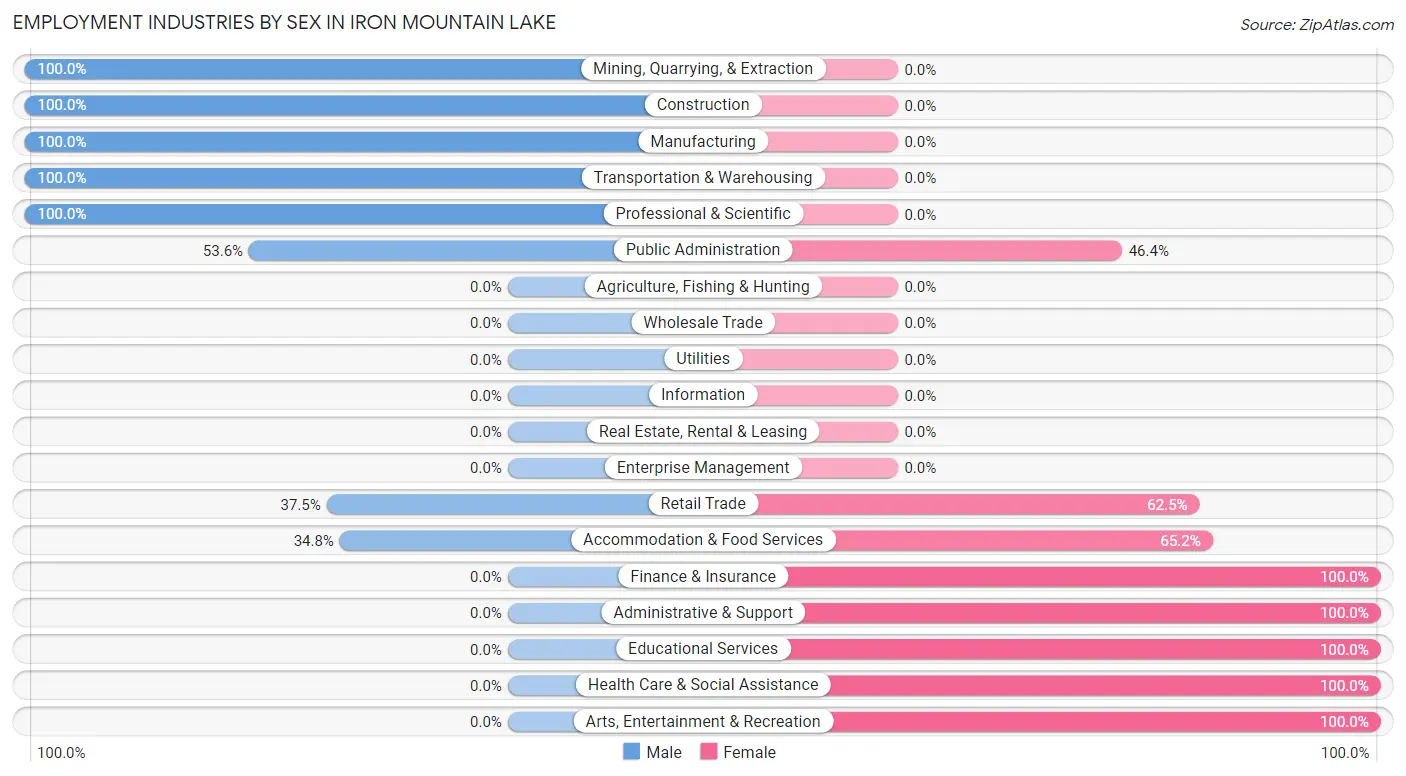
| Industry | Male | Female |
| Agriculture, Fishing & Hunting | 0 (0.0%) | 0 (0.0%) |
| Mining, Quarrying, & Extraction | 18 (100.0%) | 0 (0.0%) |
| Construction | 23 (100.0%) | 0 (0.0%) |
| Manufacturing | 28 (100.0%) | 0 (0.0%) |
| Wholesale Trade | 0 (0.0%) | 0 (0.0%) |
| Retail Trade | 3 (37.5%) | 5 (62.5%) |
| Transportation & Warehousing | 3 (100.0%) | 0 (0.0%) |
| Utilities | 0 (0.0%) | 0 (0.0%) |
| Information | 0 (0.0%) | 0 (0.0%) |
| Finance & Insurance | 0 (0.0%) | 2 (100.0%) |
| Real Estate, Rental & Leasing | 0 (0.0%) | 0 (0.0%) |
| Professional & Scientific | 1 (100.0%) | 0 (0.0%) |
| Enterprise Management | 0 (0.0%) | 0 (0.0%) |
| Administrative & Support | 0 (0.0%) | 9 (100.0%) |
| Educational Services | 0 (0.0%) | 3 (100.0%) |
| Health Care & Social Assistance | 0 (0.0%) | 23 (100.0%) |
| Arts, Entertainment & Recreation | 0 (0.0%) | 45 (100.0%) |
| Accommodation & Food Services | 8 (34.8%) | 15 (65.2%) |
| Public Administration | 15 (53.6%) | 13 (46.4%) |
| Total | 99 (44.8%) | 122 (55.2%) |
Education in Iron Mountain Lake
School Enrollment in Iron Mountain Lake
The most common levels of schooling among the 146 students in Iron Mountain Lake are high school (50 | 34.3%), middle school (46 | 31.5%), and elementary school (43 | 29.4%).
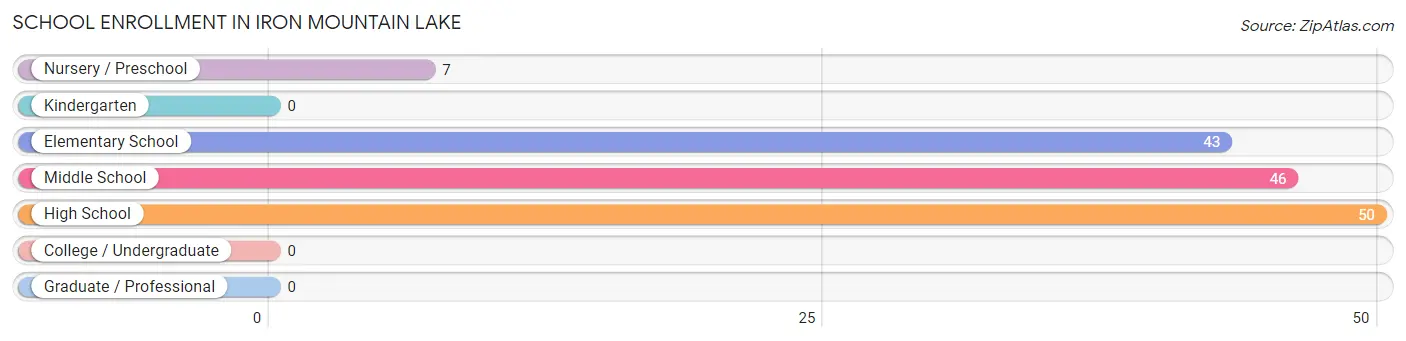
| School Level | # Students | % Students |
| Nursery / Preschool | 7 | 4.8% |
| Kindergarten | 0 | 0.0% |
| Elementary School | 43 | 29.4% |
| Middle School | 46 | 31.5% |
| High School | 50 | 34.3% |
| College / Undergraduate | 0 | 0.0% |
| Graduate / Professional | 0 | 0.0% |
| Total | 146 | 100.0% |
School Enrollment by Age by Funding Source in Iron Mountain Lake
Out of a total of 146 students who are enrolled in schools in Iron Mountain Lake, 12 (8.2%) attend a private institution, while the remaining 134 (91.8%) are enrolled in public schools. The age group of 5 to 9 year old has the highest likelihood of being enrolled in private schools, with 12 (30.8% in the age bracket) enrolled. Conversely, the age group of 3 to 4 year olds has the lowest likelihood of being enrolled in a private school, with 7 (100.0% in the age bracket) attending a public institution.
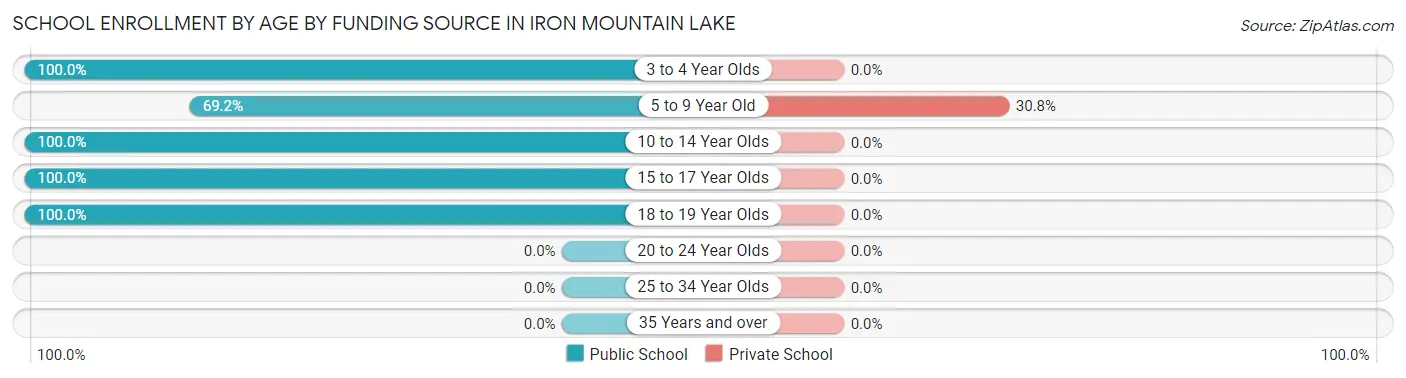
| Age Bracket | Public School | Private School |
| 3 to 4 Year Olds | 7 (100.0%) | 0 (0.0%) |
| 5 to 9 Year Old | 27 (69.2%) | 12 (30.8%) |
| 10 to 14 Year Olds | 50 (100.0%) | 0 (0.0%) |
| 15 to 17 Year Olds | 44 (100.0%) | 0 (0.0%) |
| 18 to 19 Year Olds | 6 (100.0%) | 0 (0.0%) |
| 20 to 24 Year Olds | 0 (0.0%) | 0 (0.0%) |
| 25 to 34 Year Olds | 0 (0.0%) | 0 (0.0%) |
| 35 Years and over | 0 (0.0%) | 0 (0.0%) |
| Total | 134 (91.8%) | 12 (8.2%) |
Educational Attainment by Field of Study in Iron Mountain Lake
Science & technology (13 | 68.4%), psychology (5 | 26.3%), and literature & languages (1 | 5.3%) are the most common fields of study among 19 individuals in Iron Mountain Lake who have obtained a bachelor's degree or higher.
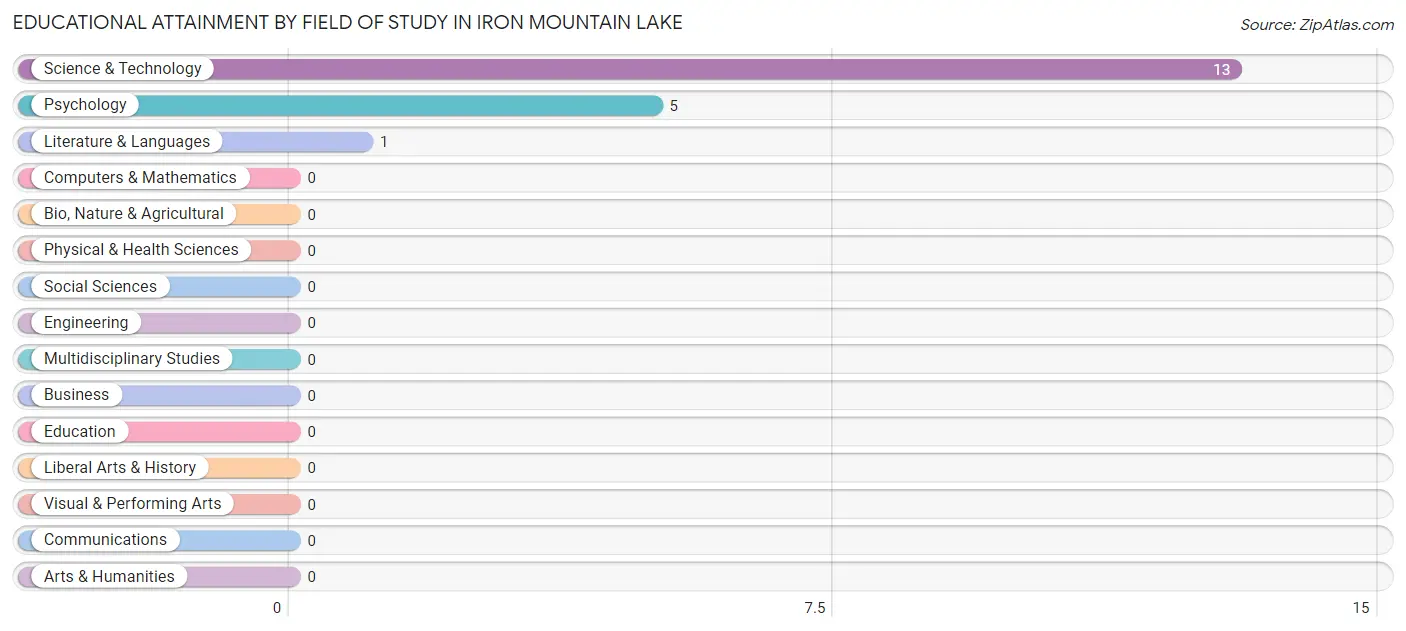
| Field of Study | # Graduates | % Graduates |
| Computers & Mathematics | 0 | 0.0% |
| Bio, Nature & Agricultural | 0 | 0.0% |
| Physical & Health Sciences | 0 | 0.0% |
| Psychology | 5 | 26.3% |
| Social Sciences | 0 | 0.0% |
| Engineering | 0 | 0.0% |
| Multidisciplinary Studies | 0 | 0.0% |
| Science & Technology | 13 | 68.4% |
| Business | 0 | 0.0% |
| Education | 0 | 0.0% |
| Literature & Languages | 1 | 5.3% |
| Liberal Arts & History | 0 | 0.0% |
| Visual & Performing Arts | 0 | 0.0% |
| Communications | 0 | 0.0% |
| Arts & Humanities | 0 | 0.0% |
| Total | 19 | 100.0% |
Transportation & Commute in Iron Mountain Lake
Vehicle Availability by Sex in Iron Mountain Lake
The most prevalent vehicle ownership categories in Iron Mountain Lake are males with 1 vehicle (42, accounting for 42.4%) and females with 1 vehicle (35, making up 34.4%).
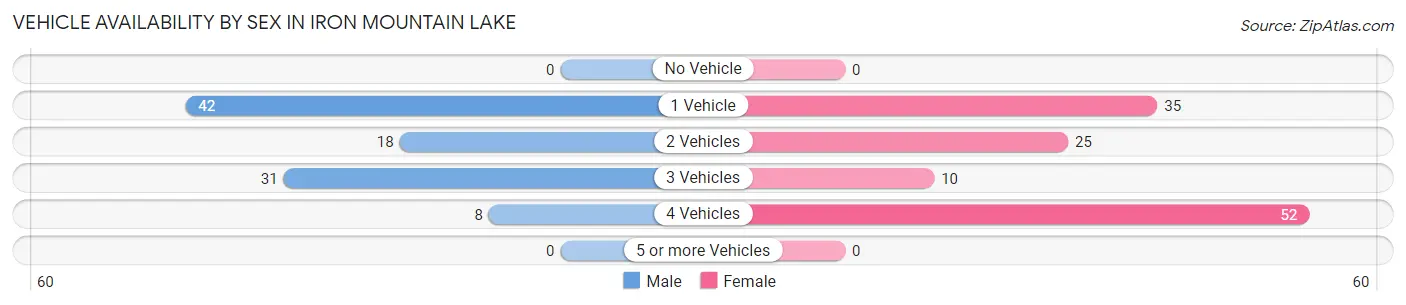
| Vehicles Available | Male | Female |
| No Vehicle | 0 (0.0%) | 0 (0.0%) |
| 1 Vehicle | 42 (42.4%) | 35 (28.7%) |
| 2 Vehicles | 18 (18.2%) | 25 (20.5%) |
| 3 Vehicles | 31 (31.3%) | 10 (8.2%) |
| 4 Vehicles | 8 (8.1%) | 52 (42.6%) |
| 5 or more Vehicles | 0 (0.0%) | 0 (0.0%) |
| Total | 99 (100.0%) | 122 (100.0%) |
Commute Time in Iron Mountain Lake
The most frequently occuring commute durations in Iron Mountain Lake are 20 to 24 minutes (52 commuters, 24.0%), 30 to 34 minutes (31 commuters, 14.3%), and 45 to 59 minutes (31 commuters, 14.3%).
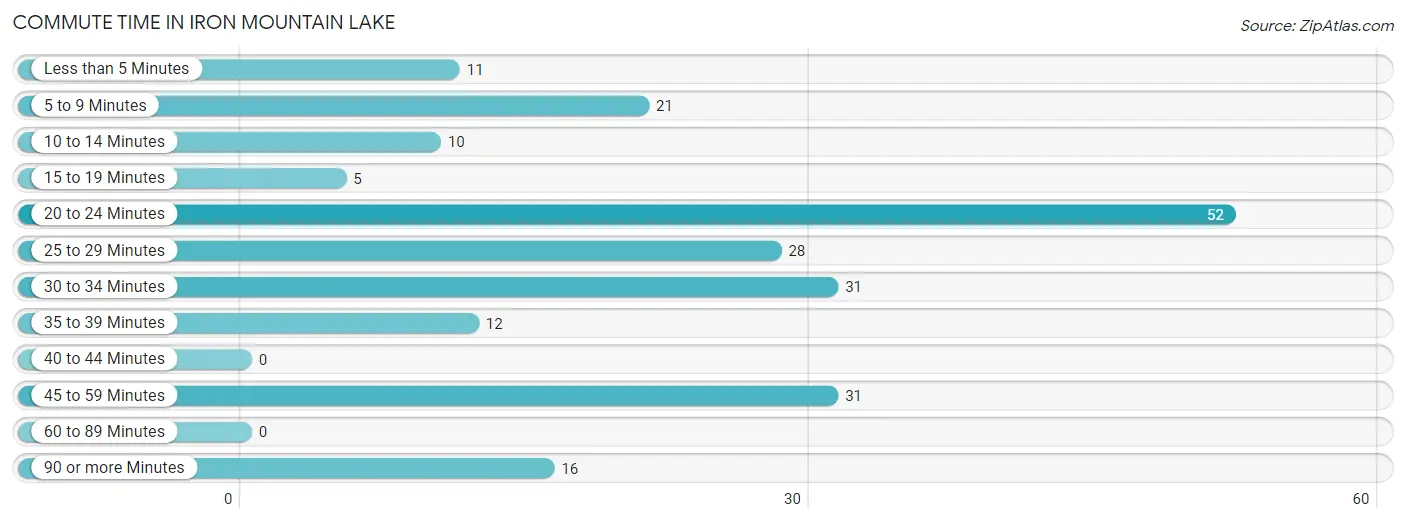
| Commute Time | # Commuters | % Commuters |
| Less than 5 Minutes | 11 | 5.1% |
| 5 to 9 Minutes | 21 | 9.7% |
| 10 to 14 Minutes | 10 | 4.6% |
| 15 to 19 Minutes | 5 | 2.3% |
| 20 to 24 Minutes | 52 | 24.0% |
| 25 to 29 Minutes | 28 | 12.9% |
| 30 to 34 Minutes | 31 | 14.3% |
| 35 to 39 Minutes | 12 | 5.5% |
| 40 to 44 Minutes | 0 | 0.0% |
| 45 to 59 Minutes | 31 | 14.3% |
| 60 to 89 Minutes | 0 | 0.0% |
| 90 or more Minutes | 16 | 7.4% |
Commute Time by Sex in Iron Mountain Lake
The most common commute times in Iron Mountain Lake are 45 to 59 minutes (29 commuters, 30.5%) for males and 20 to 24 minutes (50 commuters, 41.0%) for females.
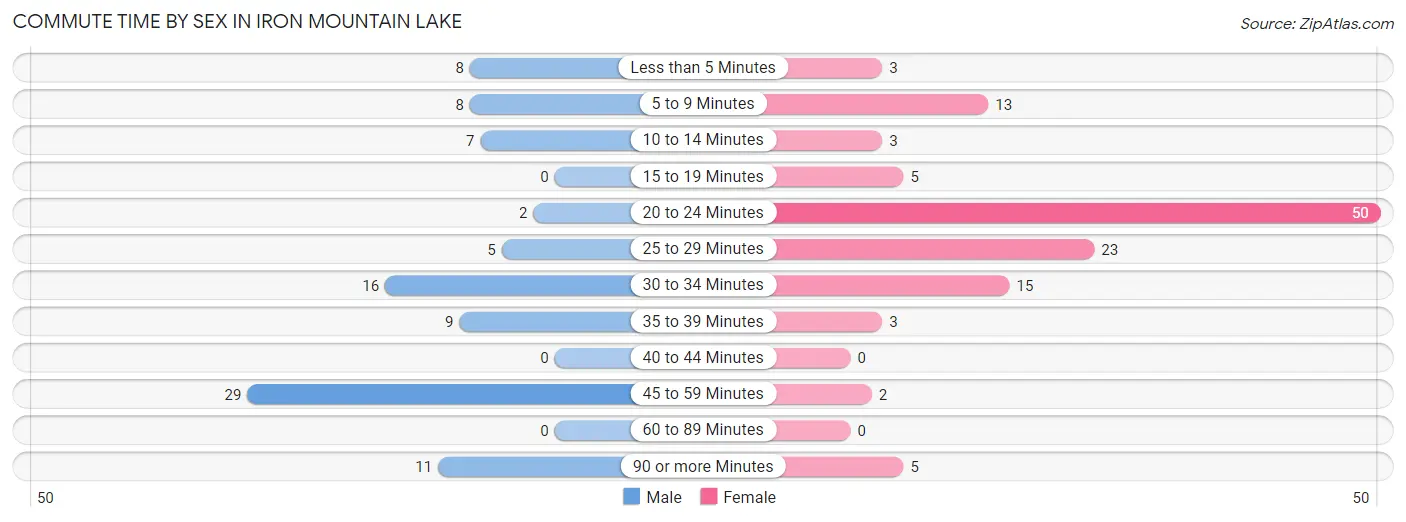
| Commute Time | Male | Female |
| Less than 5 Minutes | 8 (8.4%) | 3 (2.5%) |
| 5 to 9 Minutes | 8 (8.4%) | 13 (10.7%) |
| 10 to 14 Minutes | 7 (7.4%) | 3 (2.5%) |
| 15 to 19 Minutes | 0 (0.0%) | 5 (4.1%) |
| 20 to 24 Minutes | 2 (2.1%) | 50 (41.0%) |
| 25 to 29 Minutes | 5 (5.3%) | 23 (18.9%) |
| 30 to 34 Minutes | 16 (16.8%) | 15 (12.3%) |
| 35 to 39 Minutes | 9 (9.5%) | 3 (2.5%) |
| 40 to 44 Minutes | 0 (0.0%) | 0 (0.0%) |
| 45 to 59 Minutes | 29 (30.5%) | 2 (1.6%) |
| 60 to 89 Minutes | 0 (0.0%) | 0 (0.0%) |
| 90 or more Minutes | 11 (11.6%) | 5 (4.1%) |
Time of Departure to Work by Sex in Iron Mountain Lake
The most frequent times of departure to work in Iron Mountain Lake are 5:30 AM to 5:59 AM (21, 22.1%) for males and 7:30 AM to 7:59 AM (55, 45.1%) for females.
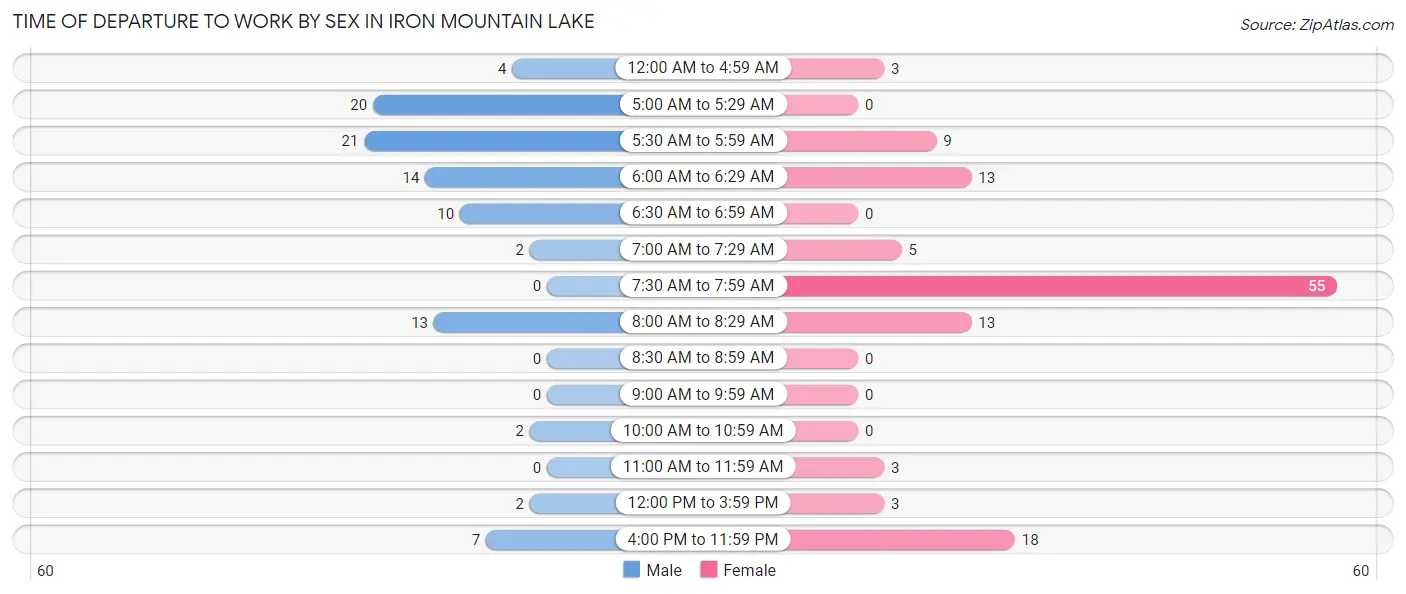
| Time of Departure | Male | Female |
| 12:00 AM to 4:59 AM | 4 (4.2%) | 3 (2.5%) |
| 5:00 AM to 5:29 AM | 20 (21.0%) | 0 (0.0%) |
| 5:30 AM to 5:59 AM | 21 (22.1%) | 9 (7.4%) |
| 6:00 AM to 6:29 AM | 14 (14.7%) | 13 (10.7%) |
| 6:30 AM to 6:59 AM | 10 (10.5%) | 0 (0.0%) |
| 7:00 AM to 7:29 AM | 2 (2.1%) | 5 (4.1%) |
| 7:30 AM to 7:59 AM | 0 (0.0%) | 55 (45.1%) |
| 8:00 AM to 8:29 AM | 13 (13.7%) | 13 (10.7%) |
| 8:30 AM to 8:59 AM | 0 (0.0%) | 0 (0.0%) |
| 9:00 AM to 9:59 AM | 0 (0.0%) | 0 (0.0%) |
| 10:00 AM to 10:59 AM | 2 (2.1%) | 0 (0.0%) |
| 11:00 AM to 11:59 AM | 0 (0.0%) | 3 (2.5%) |
| 12:00 PM to 3:59 PM | 2 (2.1%) | 3 (2.5%) |
| 4:00 PM to 11:59 PM | 7 (7.4%) | 18 (14.7%) |
| Total | 95 (100.0%) | 122 (100.0%) |
Housing Occupancy in Iron Mountain Lake
Occupancy by Ownership in Iron Mountain Lake
Of the total 295 dwellings in Iron Mountain Lake, owner-occupied units account for 244 (82.7%), while renter-occupied units make up 51 (17.3%).
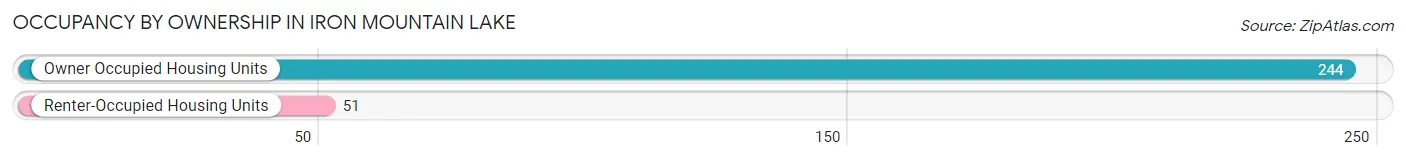
| Occupancy | # Housing Units | % Housing Units |
| Owner Occupied Housing Units | 244 | 82.7% |
| Renter-Occupied Housing Units | 51 | 17.3% |
| Total Occupied Housing Units | 295 | 100.0% |
Occupancy by Household Size in Iron Mountain Lake
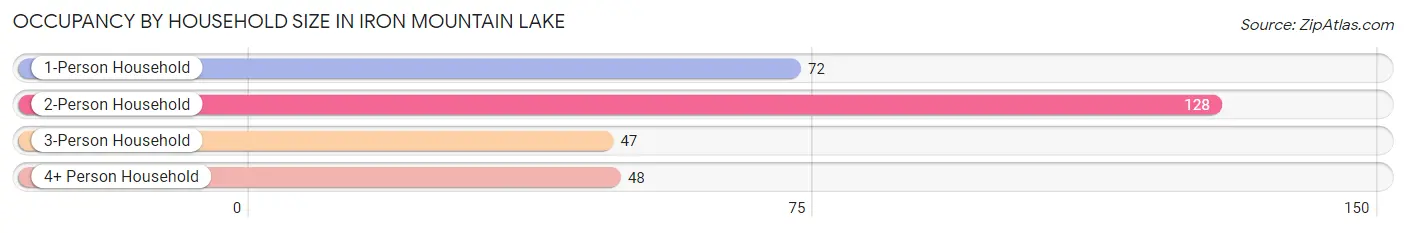
| Household Size | # Housing Units | % Housing Units |
| 1-Person Household | 72 | 24.4% |
| 2-Person Household | 128 | 43.4% |
| 3-Person Household | 47 | 15.9% |
| 4+ Person Household | 48 | 16.3% |
| Total Housing Units | 295 | 100.0% |
Occupancy by Ownership by Household Size in Iron Mountain Lake
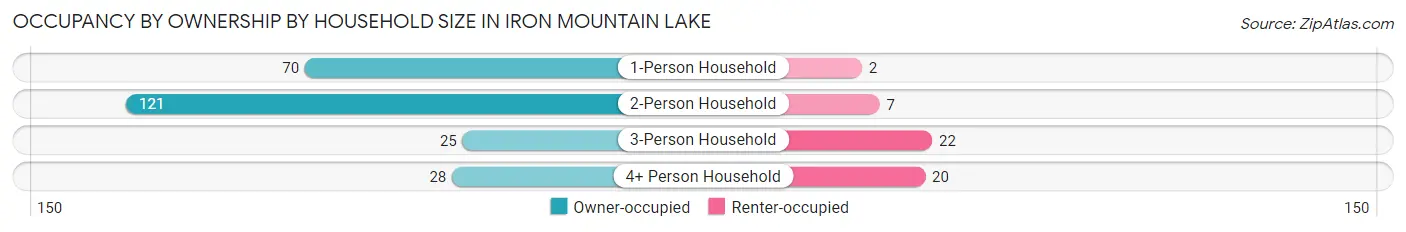
| Household Size | Owner-occupied | Renter-occupied |
| 1-Person Household | 70 (97.2%) | 2 (2.8%) |
| 2-Person Household | 121 (94.5%) | 7 (5.5%) |
| 3-Person Household | 25 (53.2%) | 22 (46.8%) |
| 4+ Person Household | 28 (58.3%) | 20 (41.7%) |
| Total Housing Units | 244 (82.7%) | 51 (17.3%) |
Occupancy by Educational Attainment in Iron Mountain Lake
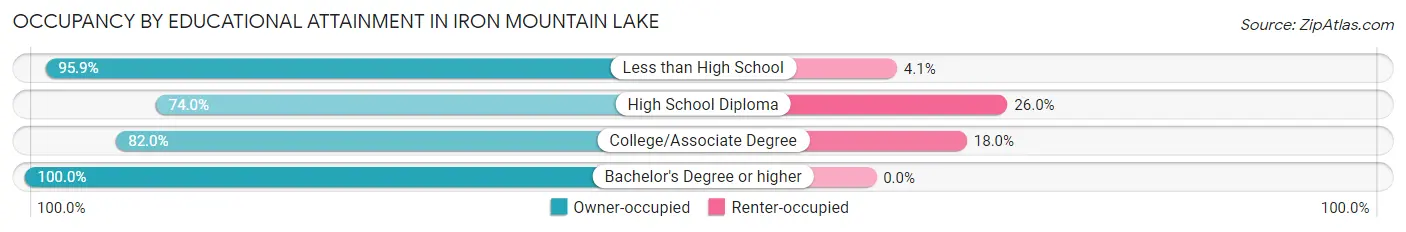
| Household Size | Owner-occupied | Renter-occupied |
| Less than High School | 70 (95.9%) | 3 (4.1%) |
| High School Diploma | 91 (74.0%) | 32 (26.0%) |
| College/Associate Degree | 73 (82.0%) | 16 (18.0%) |
| Bachelor's Degree or higher | 10 (100.0%) | 0 (0.0%) |
Occupancy by Age of Householder in Iron Mountain Lake
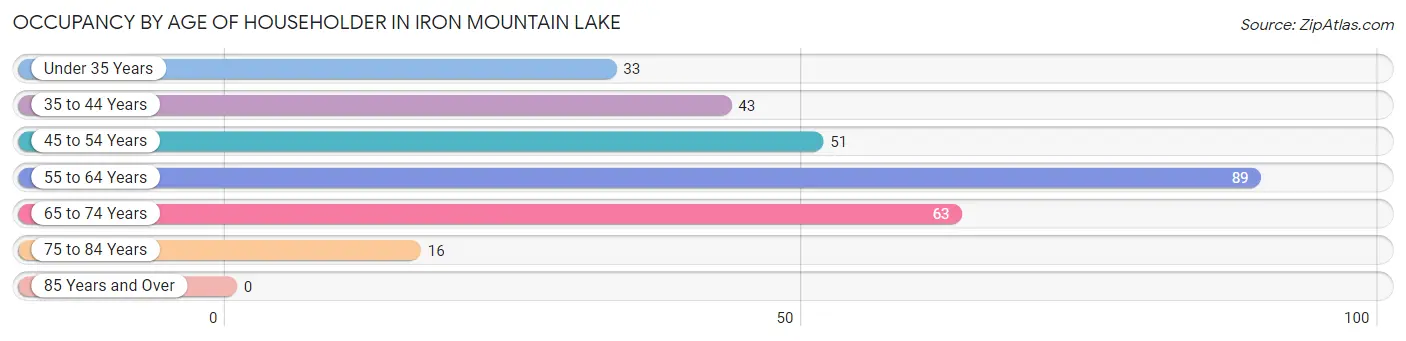
| Age Bracket | # Households | % Households |
| Under 35 Years | 33 | 11.2% |
| 35 to 44 Years | 43 | 14.6% |
| 45 to 54 Years | 51 | 17.3% |
| 55 to 64 Years | 89 | 30.2% |
| 65 to 74 Years | 63 | 21.4% |
| 75 to 84 Years | 16 | 5.4% |
| 85 Years and Over | 0 | 0.0% |
| Total | 295 | 100.0% |
Housing Finances in Iron Mountain Lake
Median Income by Occupancy in Iron Mountain Lake
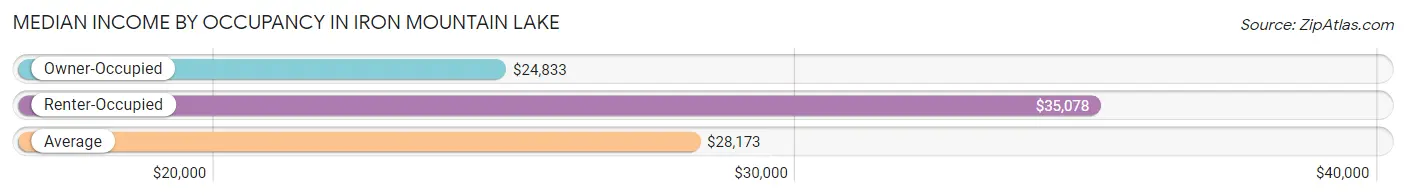
| Occupancy Type | # Households | Median Income |
| Owner-Occupied | 244 (82.7%) | $24,833 |
| Renter-Occupied | 51 (17.3%) | $35,078 |
| Average | 295 (100.0%) | $28,173 |
Occupancy by Householder Income Bracket in Iron Mountain Lake
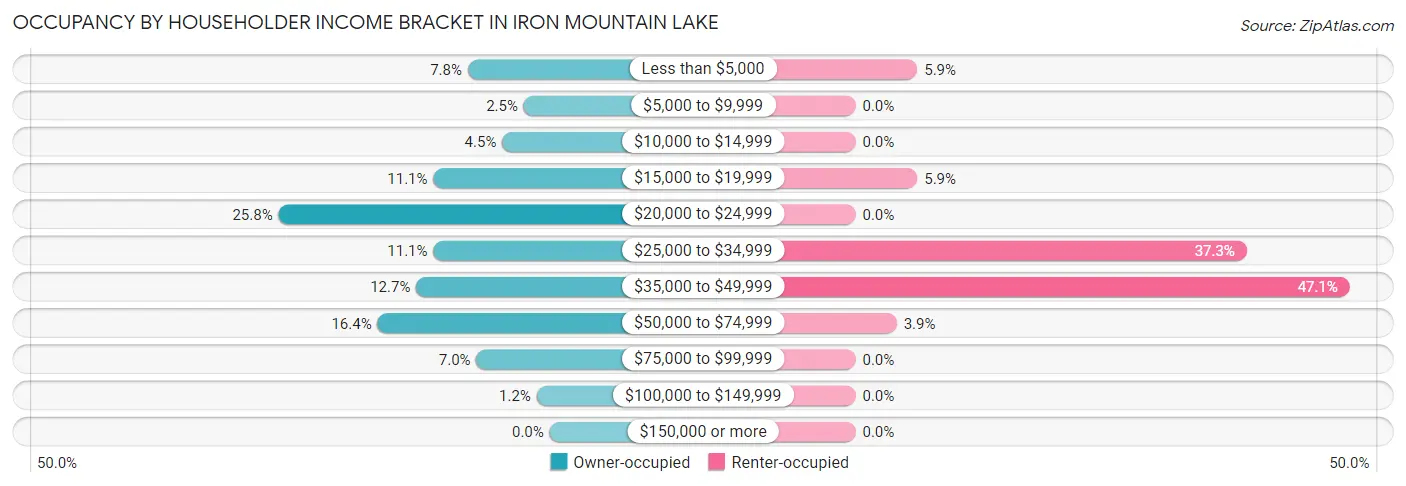
| Income Bracket | Owner-occupied | Renter-occupied |
| Less than $5,000 | 19 (7.8%) | 3 (5.9%) |
| $5,000 to $9,999 | 6 (2.5%) | 0 (0.0%) |
| $10,000 to $14,999 | 11 (4.5%) | 0 (0.0%) |
| $15,000 to $19,999 | 27 (11.1%) | 3 (5.9%) |
| $20,000 to $24,999 | 63 (25.8%) | 0 (0.0%) |
| $25,000 to $34,999 | 27 (11.1%) | 19 (37.2%) |
| $35,000 to $49,999 | 31 (12.7%) | 24 (47.1%) |
| $50,000 to $74,999 | 40 (16.4%) | 2 (3.9%) |
| $75,000 to $99,999 | 17 (7.0%) | 0 (0.0%) |
| $100,000 to $149,999 | 3 (1.2%) | 0 (0.0%) |
| $150,000 or more | 0 (0.0%) | 0 (0.0%) |
| Total | 244 (100.0%) | 51 (100.0%) |
Monthly Housing Cost Tiers in Iron Mountain Lake
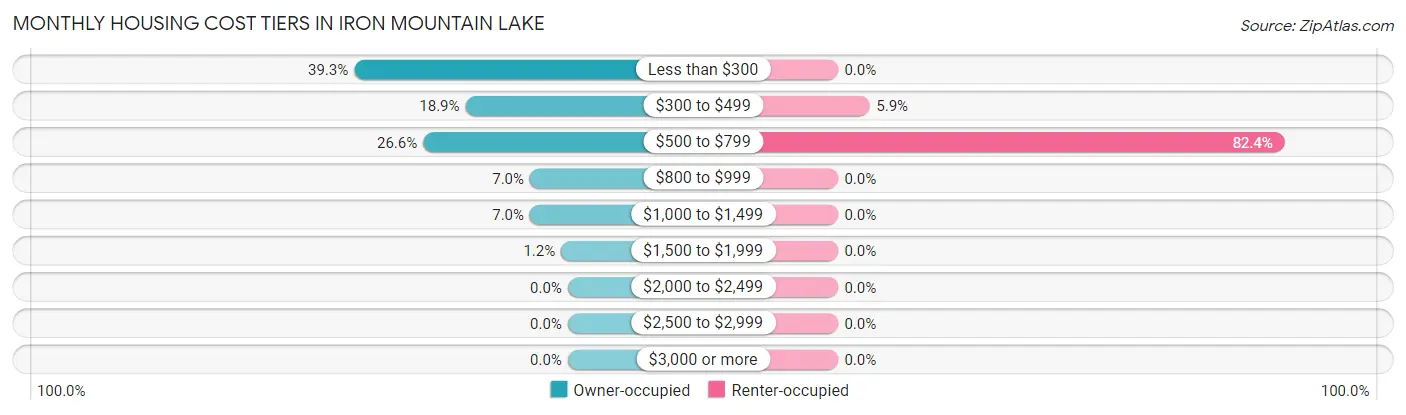
| Monthly Cost | Owner-occupied | Renter-occupied |
| Less than $300 | 96 (39.3%) | 0 (0.0%) |
| $300 to $499 | 46 (18.9%) | 3 (5.9%) |
| $500 to $799 | 65 (26.6%) | 42 (82.4%) |
| $800 to $999 | 17 (7.0%) | 0 (0.0%) |
| $1,000 to $1,499 | 17 (7.0%) | 0 (0.0%) |
| $1,500 to $1,999 | 3 (1.2%) | 0 (0.0%) |
| $2,000 to $2,499 | 0 (0.0%) | 0 (0.0%) |
| $2,500 to $2,999 | 0 (0.0%) | 0 (0.0%) |
| $3,000 or more | 0 (0.0%) | 0 (0.0%) |
| Total | 244 (100.0%) | 51 (100.0%) |
Physical Housing Characteristics in Iron Mountain Lake
Housing Structures in Iron Mountain Lake
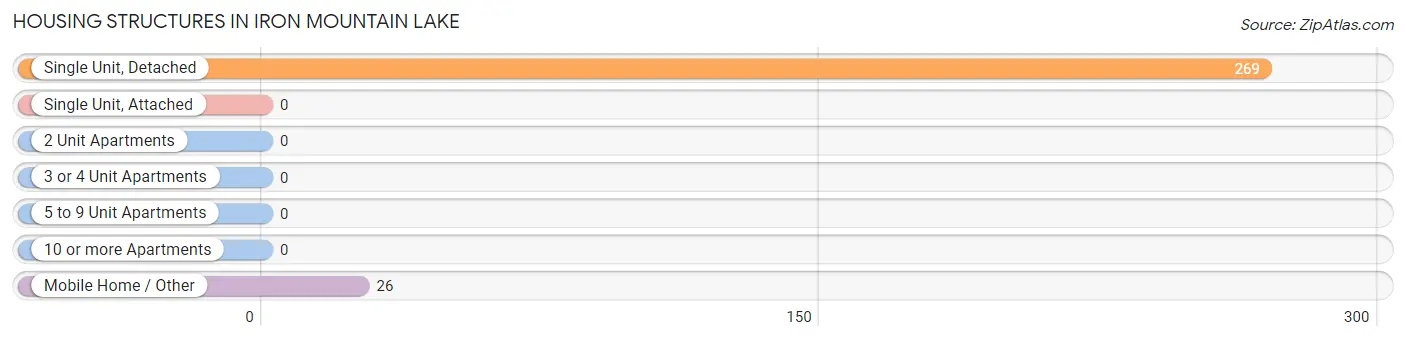
| Structure Type | # Housing Units | % Housing Units |
| Single Unit, Detached | 269 | 91.2% |
| Single Unit, Attached | 0 | 0.0% |
| 2 Unit Apartments | 0 | 0.0% |
| 3 or 4 Unit Apartments | 0 | 0.0% |
| 5 to 9 Unit Apartments | 0 | 0.0% |
| 10 or more Apartments | 0 | 0.0% |
| Mobile Home / Other | 26 | 8.8% |
| Total | 295 | 100.0% |
Housing Structures by Occupancy in Iron Mountain Lake
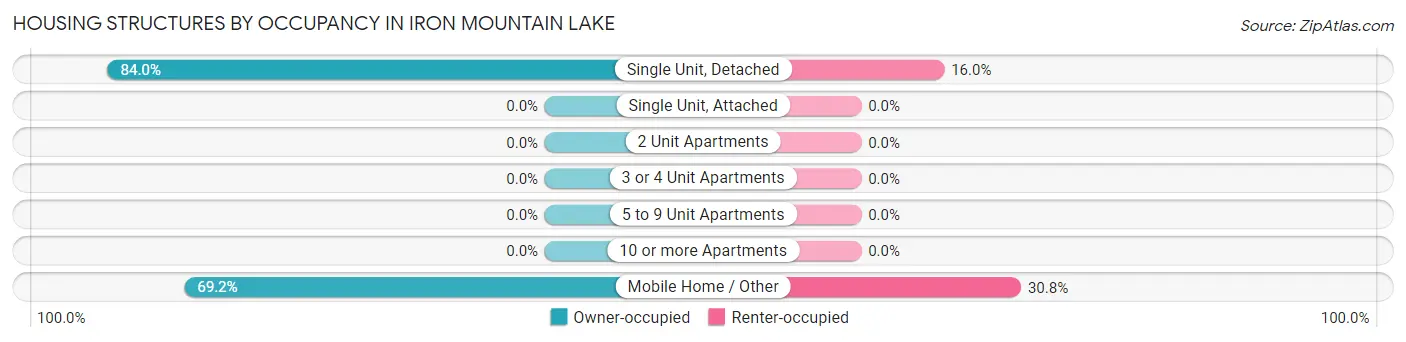
| Structure Type | Owner-occupied | Renter-occupied |
| Single Unit, Detached | 226 (84.0%) | 43 (16.0%) |
| Single Unit, Attached | 0 (0.0%) | 0 (0.0%) |
| 2 Unit Apartments | 0 (0.0%) | 0 (0.0%) |
| 3 or 4 Unit Apartments | 0 (0.0%) | 0 (0.0%) |
| 5 to 9 Unit Apartments | 0 (0.0%) | 0 (0.0%) |
| 10 or more Apartments | 0 (0.0%) | 0 (0.0%) |
| Mobile Home / Other | 18 (69.2%) | 8 (30.8%) |
| Total | 244 (82.7%) | 51 (17.3%) |
Housing Structures by Number of Rooms in Iron Mountain Lake
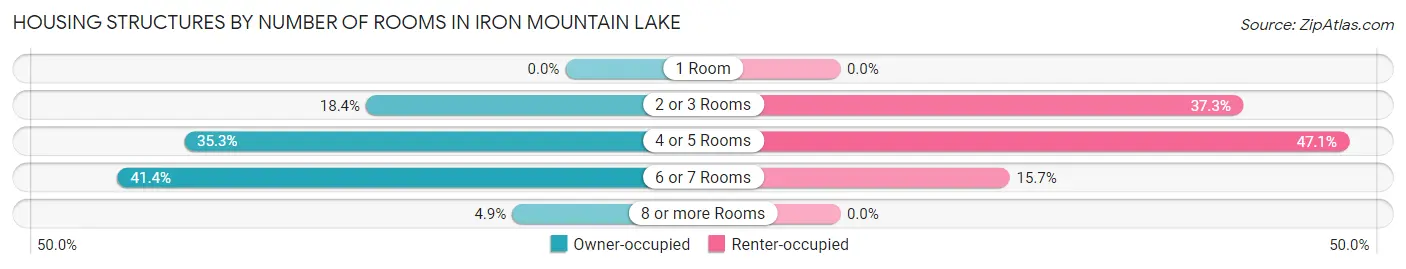
| Number of Rooms | Owner-occupied | Renter-occupied |
| 1 Room | 0 (0.0%) | 0 (0.0%) |
| 2 or 3 Rooms | 45 (18.4%) | 19 (37.2%) |
| 4 or 5 Rooms | 86 (35.2%) | 24 (47.1%) |
| 6 or 7 Rooms | 101 (41.4%) | 8 (15.7%) |
| 8 or more Rooms | 12 (4.9%) | 0 (0.0%) |
| Total | 244 (100.0%) | 51 (100.0%) |
Housing Structure by Heating Type in Iron Mountain Lake
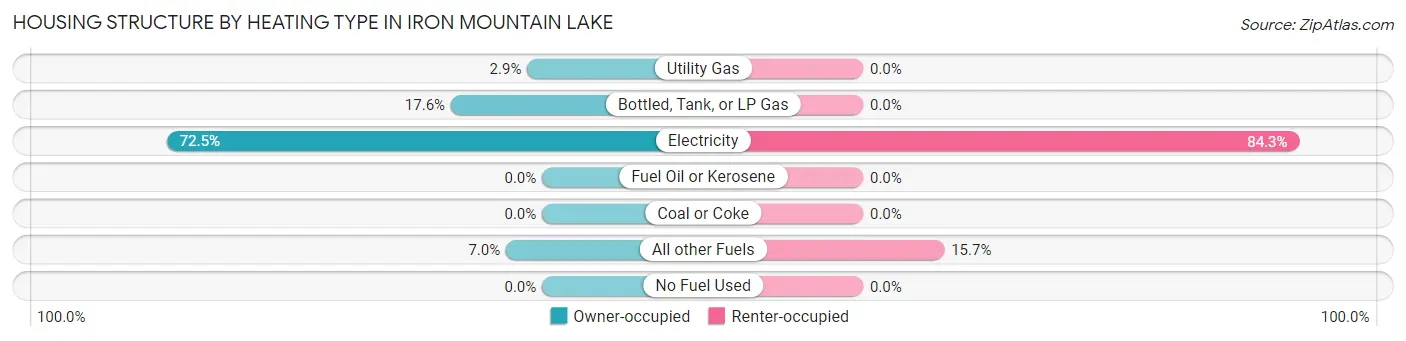
| Heating Type | Owner-occupied | Renter-occupied |
| Utility Gas | 7 (2.9%) | 0 (0.0%) |
| Bottled, Tank, or LP Gas | 43 (17.6%) | 0 (0.0%) |
| Electricity | 177 (72.5%) | 43 (84.3%) |
| Fuel Oil or Kerosene | 0 (0.0%) | 0 (0.0%) |
| Coal or Coke | 0 (0.0%) | 0 (0.0%) |
| All other Fuels | 17 (7.0%) | 8 (15.7%) |
| No Fuel Used | 0 (0.0%) | 0 (0.0%) |
| Total | 244 (100.0%) | 51 (100.0%) |
Household Vehicle Usage in Iron Mountain Lake
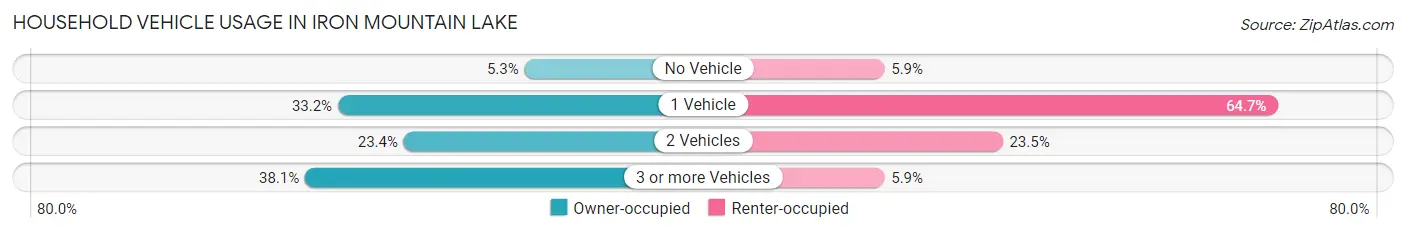
| Vehicles per Household | Owner-occupied | Renter-occupied |
| No Vehicle | 13 (5.3%) | 3 (5.9%) |
| 1 Vehicle | 81 (33.2%) | 33 (64.7%) |
| 2 Vehicles | 57 (23.4%) | 12 (23.5%) |
| 3 or more Vehicles | 93 (38.1%) | 3 (5.9%) |
| Total | 244 (100.0%) | 51 (100.0%) |
Real Estate & Mortgages in Iron Mountain Lake
Real Estate and Mortgage Overview in Iron Mountain Lake
| Characteristic | Without Mortgage | With Mortgage |
| Housing Units | 153 | 91 |
| Median Property Value | $25,600 | $68,600 |
| Median Household Income | $23,794 | $0 |
| Monthly Housing Costs | $227 | $0 |
| Real Estate Taxes | $512 | $0 |
Property Value by Mortgage Status in Iron Mountain Lake
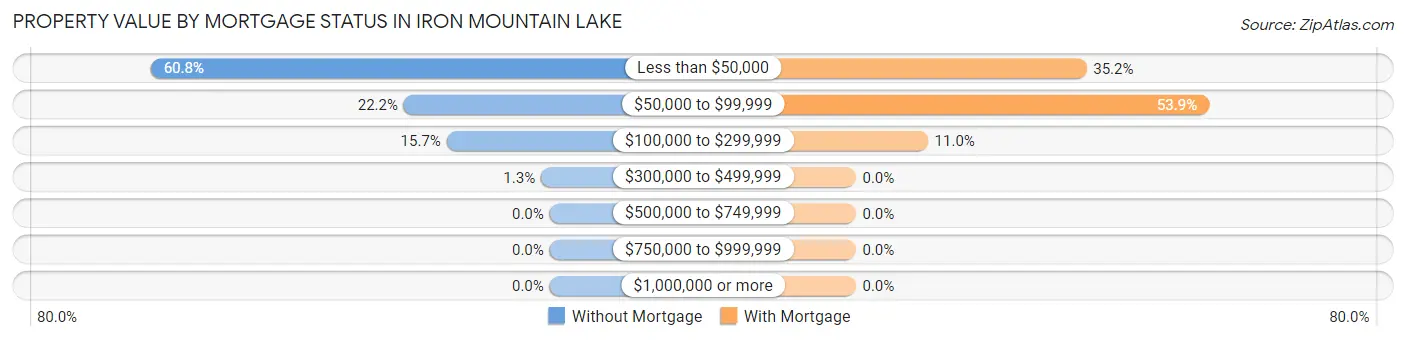
| Property Value | Without Mortgage | With Mortgage |
| Less than $50,000 | 93 (60.8%) | 32 (35.2%) |
| $50,000 to $99,999 | 34 (22.2%) | 49 (53.8%) |
| $100,000 to $299,999 | 24 (15.7%) | 10 (11.0%) |
| $300,000 to $499,999 | 2 (1.3%) | 0 (0.0%) |
| $500,000 to $749,999 | 0 (0.0%) | 0 (0.0%) |
| $750,000 to $999,999 | 0 (0.0%) | 0 (0.0%) |
| $1,000,000 or more | 0 (0.0%) | 0 (0.0%) |
| Total | 153 (100.0%) | 91 (100.0%) |
Household Income by Mortgage Status in Iron Mountain Lake
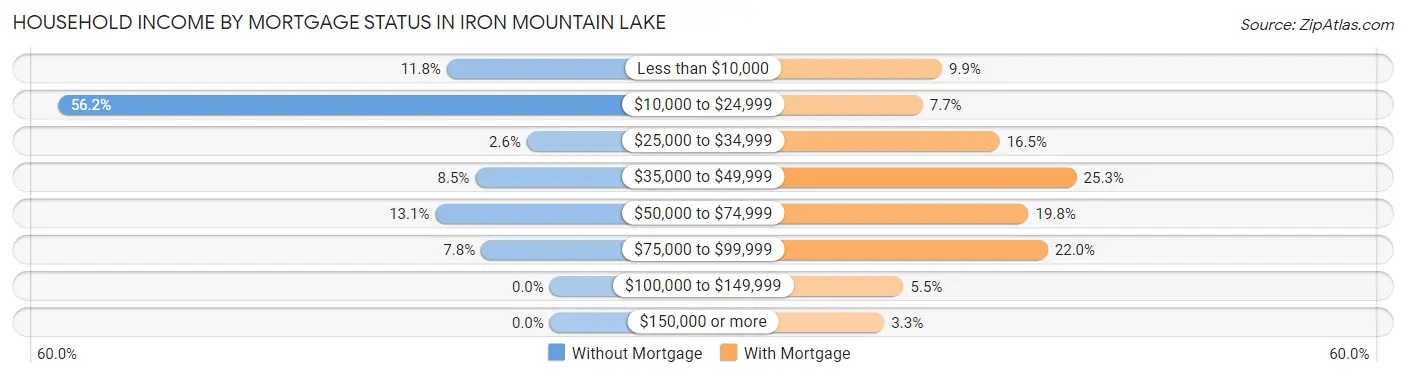
| Household Income | Without Mortgage | With Mortgage |
| Less than $10,000 | 18 (11.8%) | 9 (9.9%) |
| $10,000 to $24,999 | 86 (56.2%) | 7 (7.7%) |
| $25,000 to $34,999 | 4 (2.6%) | 15 (16.5%) |
| $35,000 to $49,999 | 13 (8.5%) | 23 (25.3%) |
| $50,000 to $74,999 | 20 (13.1%) | 18 (19.8%) |
| $75,000 to $99,999 | 12 (7.8%) | 20 (22.0%) |
| $100,000 to $149,999 | 0 (0.0%) | 5 (5.5%) |
| $150,000 or more | 0 (0.0%) | 3 (3.3%) |
| Total | 153 (100.0%) | 91 (100.0%) |
Property Value to Household Income Ratio in Iron Mountain Lake
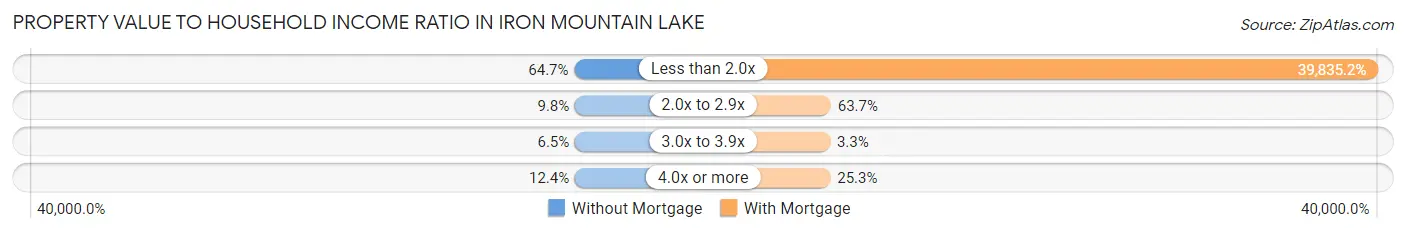
| Value-to-Income Ratio | Without Mortgage | With Mortgage |
| Less than 2.0x | 99 (64.7%) | 36,250 (39,835.2%) |
| 2.0x to 2.9x | 15 (9.8%) | 58 (63.7%) |
| 3.0x to 3.9x | 10 (6.5%) | 3 (3.3%) |
| 4.0x or more | 19 (12.4%) | 23 (25.3%) |
| Total | 153 (100.0%) | 91 (100.0%) |
Real Estate Taxes by Mortgage Status in Iron Mountain Lake
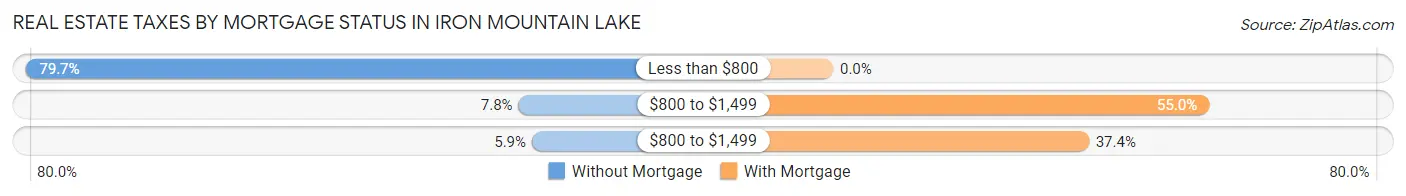
| Property Taxes | Without Mortgage | With Mortgage |
| Less than $800 | 122 (79.7%) | 0 (0.0%) |
| $800 to $1,499 | 12 (7.8%) | 50 (54.9%) |
| $800 to $1,499 | 9 (5.9%) | 34 (37.4%) |
| Total | 153 (100.0%) | 91 (100.0%) |
Health & Disability in Iron Mountain Lake
Health Insurance Coverage by Age in Iron Mountain Lake
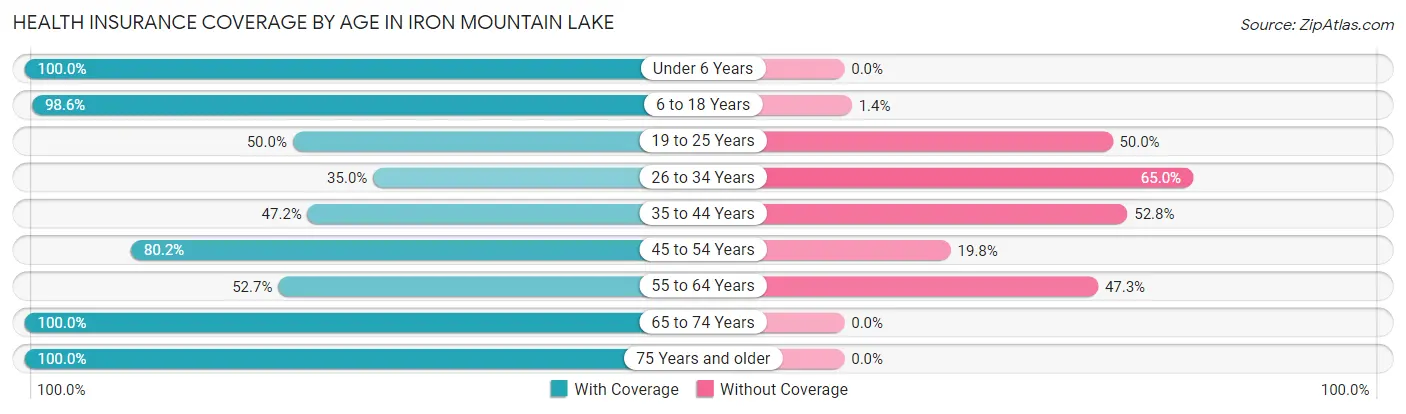
| Age Bracket | With Coverage | Without Coverage |
| Under 6 Years | 36 (100.0%) | 0 (0.0%) |
| 6 to 18 Years | 143 (98.6%) | 2 (1.4%) |
| 19 to 25 Years | 11 (50.0%) | 11 (50.0%) |
| 26 to 34 Years | 28 (35.0%) | 52 (65.0%) |
| 35 to 44 Years | 34 (47.2%) | 38 (52.8%) |
| 45 to 54 Years | 97 (80.2%) | 24 (19.8%) |
| 55 to 64 Years | 117 (52.7%) | 105 (47.3%) |
| 65 to 74 Years | 79 (100.0%) | 0 (0.0%) |
| 75 Years and older | 29 (100.0%) | 0 (0.0%) |
| Total | 574 (71.2%) | 232 (28.8%) |
Health Insurance Coverage by Citizenship Status in Iron Mountain Lake
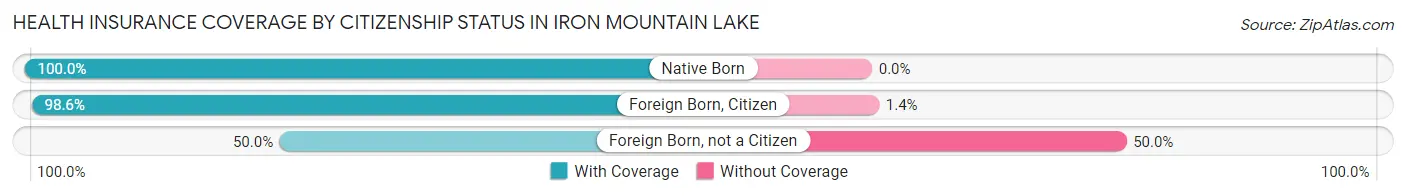
| Citizenship Status | With Coverage | Without Coverage |
| Native Born | 36 (100.0%) | 0 (0.0%) |
| Foreign Born, Citizen | 143 (98.6%) | 2 (1.4%) |
| Foreign Born, not a Citizen | 11 (50.0%) | 11 (50.0%) |
Health Insurance Coverage by Household Income in Iron Mountain Lake
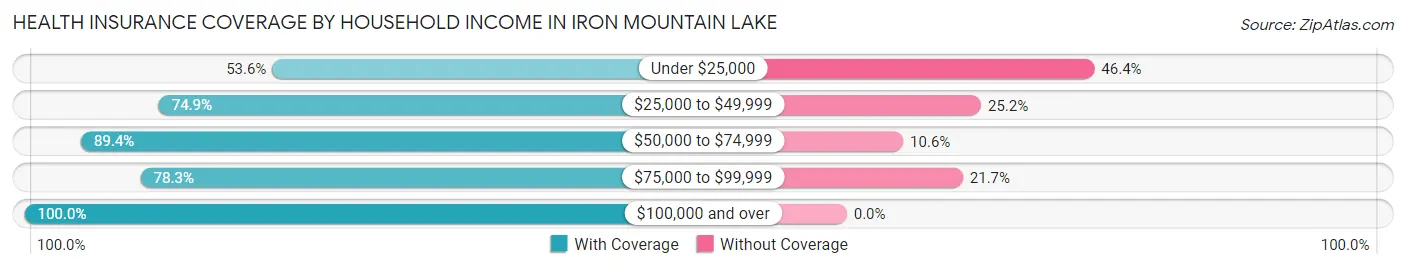
| Household Income | With Coverage | Without Coverage |
| Under $25,000 | 141 (53.6%) | 122 (46.4%) |
| $25,000 to $49,999 | 253 (74.9%) | 85 (25.2%) |
| $50,000 to $74,999 | 127 (89.4%) | 15 (10.6%) |
| $75,000 to $99,999 | 36 (78.3%) | 10 (21.7%) |
| $100,000 and over | 17 (100.0%) | 0 (0.0%) |
Public vs Private Health Insurance Coverage by Age in Iron Mountain Lake
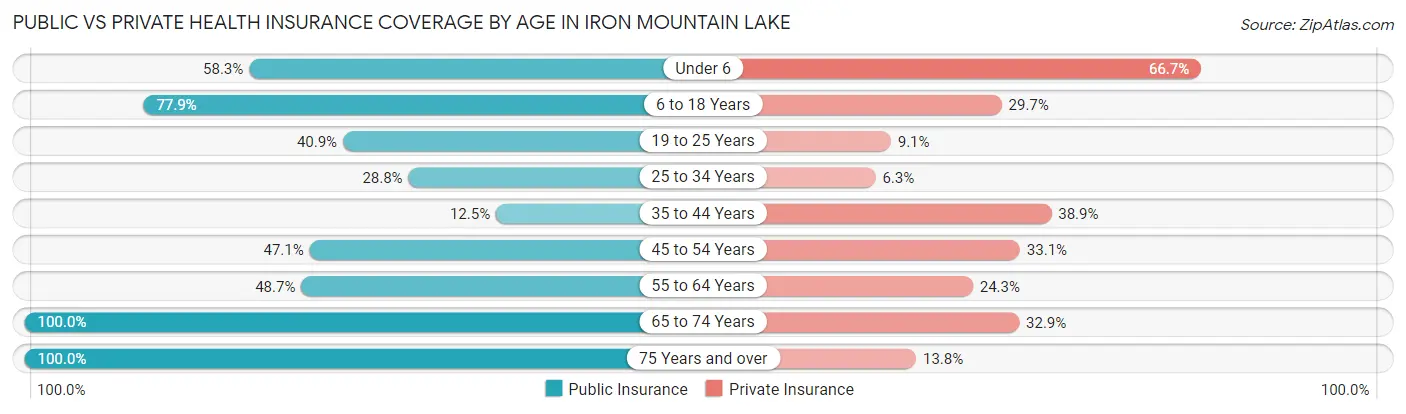
| Age Bracket | Public Insurance | Private Insurance |
| Under 6 | 21 (58.3%) | 24 (66.7%) |
| 6 to 18 Years | 113 (77.9%) | 43 (29.7%) |
| 19 to 25 Years | 9 (40.9%) | 2 (9.1%) |
| 25 to 34 Years | 23 (28.7%) | 5 (6.2%) |
| 35 to 44 Years | 9 (12.5%) | 28 (38.9%) |
| 45 to 54 Years | 57 (47.1%) | 40 (33.1%) |
| 55 to 64 Years | 108 (48.6%) | 54 (24.3%) |
| 65 to 74 Years | 79 (100.0%) | 26 (32.9%) |
| 75 Years and over | 29 (100.0%) | 4 (13.8%) |
| Total | 448 (55.6%) | 226 (28.0%) |
Disability Status by Sex by Age in Iron Mountain Lake
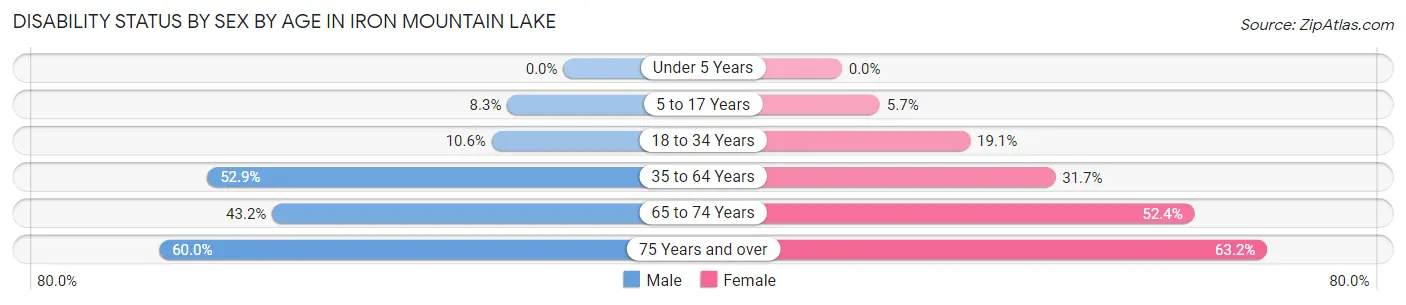
| Age Bracket | Male | Female |
| Under 5 Years | 0 (0.0%) | 0 (0.0%) |
| 5 to 17 Years | 7 (8.3%) | 3 (5.7%) |
| 18 to 34 Years | 5 (10.6%) | 12 (19.1%) |
| 35 to 64 Years | 101 (52.9%) | 71 (31.7%) |
| 65 to 74 Years | 16 (43.2%) | 22 (52.4%) |
| 75 Years and over | 6 (60.0%) | 12 (63.2%) |
Disability Class by Sex by Age in Iron Mountain Lake
Disability Class: Hearing Difficulty
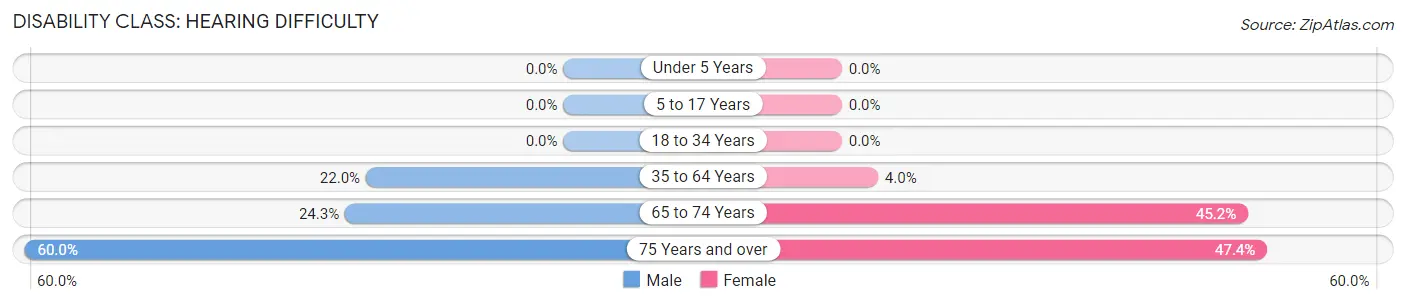
| Age Bracket | Male | Female |
| Under 5 Years | 0 (0.0%) | 0 (0.0%) |
| 5 to 17 Years | 0 (0.0%) | 0 (0.0%) |
| 18 to 34 Years | 0 (0.0%) | 0 (0.0%) |
| 35 to 64 Years | 42 (22.0%) | 9 (4.0%) |
| 65 to 74 Years | 9 (24.3%) | 19 (45.2%) |
| 75 Years and over | 6 (60.0%) | 9 (47.4%) |
Disability Class: Vision Difficulty
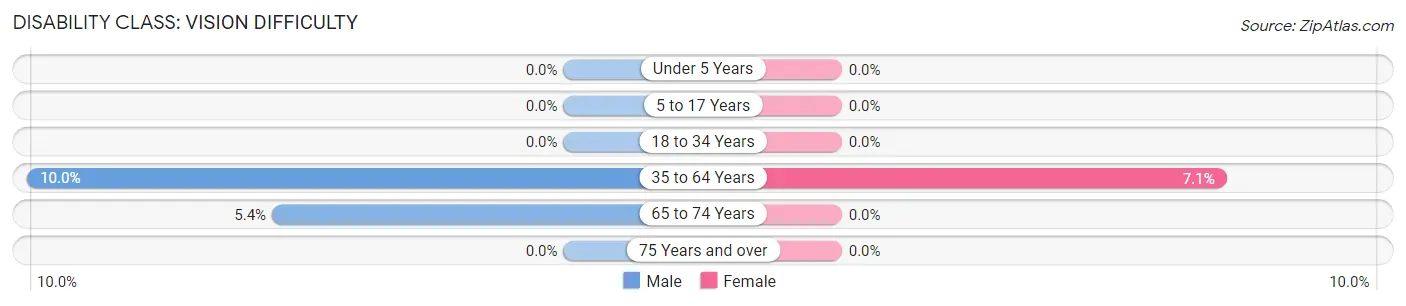
| Age Bracket | Male | Female |
| Under 5 Years | 0 (0.0%) | 0 (0.0%) |
| 5 to 17 Years | 0 (0.0%) | 0 (0.0%) |
| 18 to 34 Years | 0 (0.0%) | 0 (0.0%) |
| 35 to 64 Years | 19 (10.0%) | 16 (7.1%) |
| 65 to 74 Years | 2 (5.4%) | 0 (0.0%) |
| 75 Years and over | 0 (0.0%) | 0 (0.0%) |
Disability Class: Cognitive Difficulty
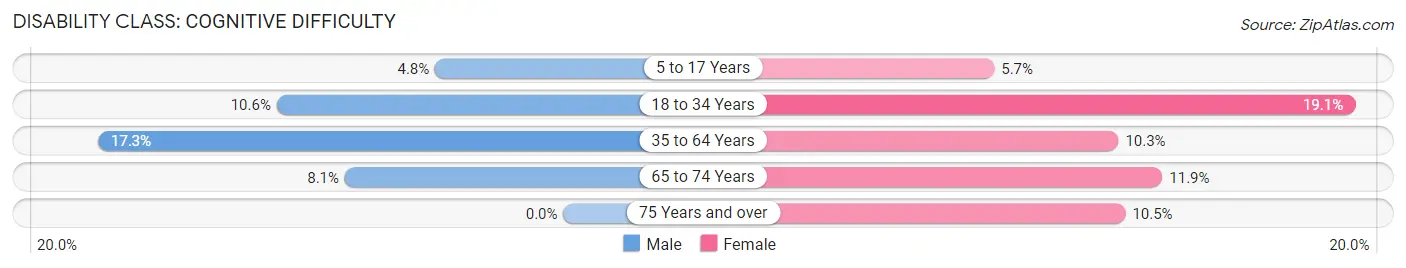
| Age Bracket | Male | Female |
| 5 to 17 Years | 4 (4.8%) | 3 (5.7%) |
| 18 to 34 Years | 5 (10.6%) | 12 (19.1%) |
| 35 to 64 Years | 33 (17.3%) | 23 (10.3%) |
| 65 to 74 Years | 3 (8.1%) | 5 (11.9%) |
| 75 Years and over | 0 (0.0%) | 2 (10.5%) |
Disability Class: Ambulatory Difficulty
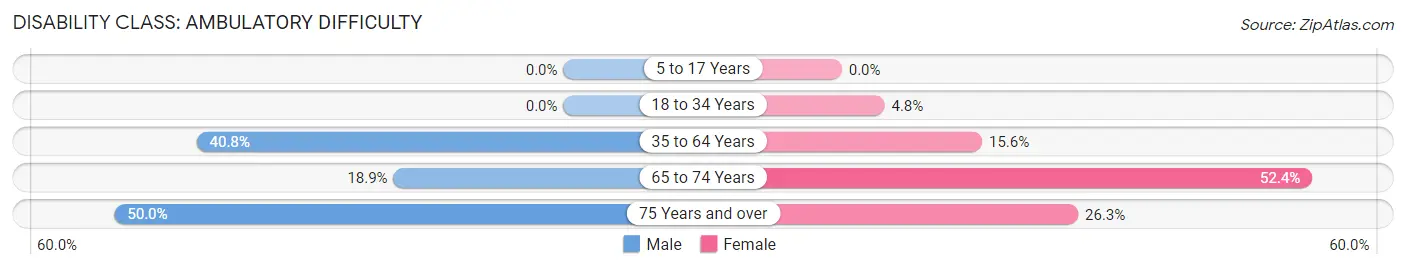
| Age Bracket | Male | Female |
| 5 to 17 Years | 0 (0.0%) | 0 (0.0%) |
| 18 to 34 Years | 0 (0.0%) | 3 (4.8%) |
| 35 to 64 Years | 78 (40.8%) | 35 (15.6%) |
| 65 to 74 Years | 7 (18.9%) | 22 (52.4%) |
| 75 Years and over | 5 (50.0%) | 5 (26.3%) |
Disability Class: Self-Care Difficulty
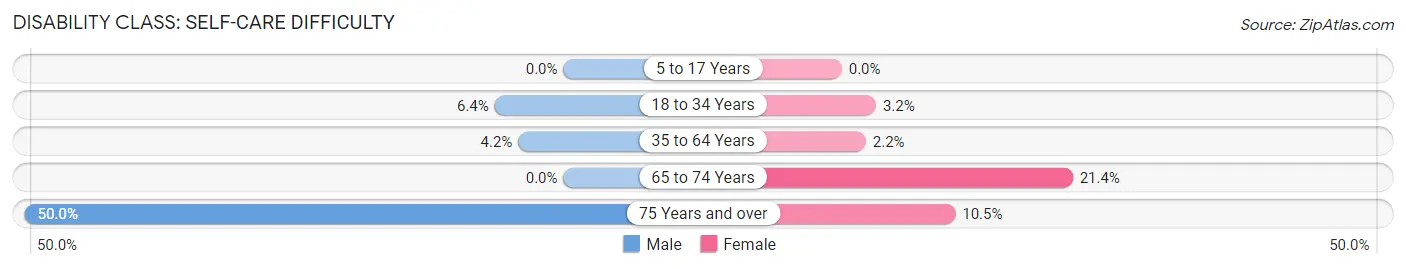
| Age Bracket | Male | Female |
| 5 to 17 Years | 0 (0.0%) | 0 (0.0%) |
| 18 to 34 Years | 3 (6.4%) | 2 (3.2%) |
| 35 to 64 Years | 8 (4.2%) | 5 (2.2%) |
| 65 to 74 Years | 0 (0.0%) | 9 (21.4%) |
| 75 Years and over | 5 (50.0%) | 2 (10.5%) |
Technology Access in Iron Mountain Lake
Computing Device Access in Iron Mountain Lake
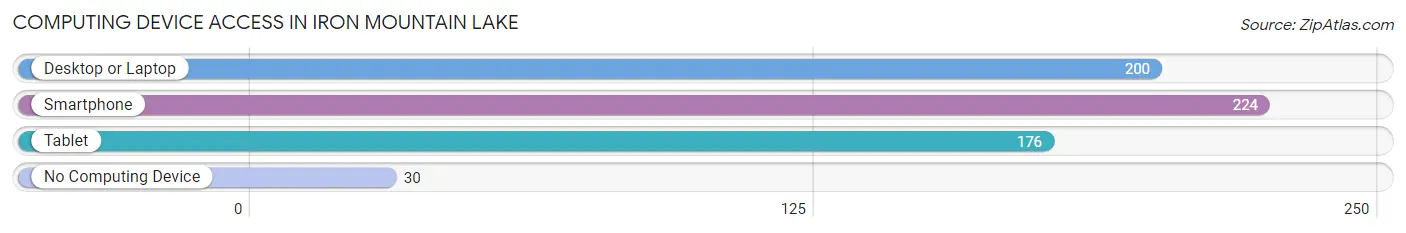
| Device Type | # Households | % Households |
| Desktop or Laptop | 200 | 67.8% |
| Smartphone | 224 | 75.9% |
| Tablet | 176 | 59.7% |
| No Computing Device | 30 | 10.2% |
| Total | 295 | 100.0% |
Internet Access in Iron Mountain Lake
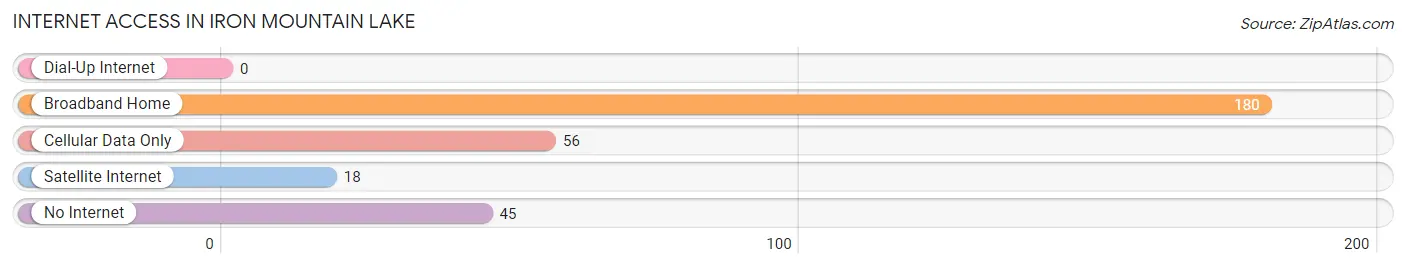
| Internet Type | # Households | % Households |
| Dial-Up Internet | 0 | 0.0% |
| Broadband Home | 180 | 61.0% |
| Cellular Data Only | 56 | 19.0% |
| Satellite Internet | 18 | 6.1% |
| No Internet | 45 | 15.2% |
| Total | 295 | 100.0% |
Iron Mountain Lake Summary
Iron Mountain Lake is a small community located in St. Francois County, Missouri. It is situated in the foothills of the Ozark Mountains, approximately 30 miles south of St. Louis. The lake itself is a man-made reservoir created in the early 1960s by the U.S. Army Corps of Engineers. The lake is a popular destination for fishing, boating, and other recreational activities.
History
Iron Mountain Lake was originally part of a large tract of land owned by the French in the late 1700s. The land was later acquired by the United States government in 1803 as part of the Louisiana Purchase. In the early 1900s, the area was used for logging and mining operations. In the 1950s, the U.S. Army Corps of Engineers began construction of a dam and reservoir on the site. The lake was completed in 1962 and the community of Iron Mountain Lake was established shortly thereafter.
Geography
Iron Mountain Lake is located in the foothills of the Ozark Mountains in St. Francois County, Missouri. The lake itself is a man-made reservoir created by the U.S. Army Corps of Engineers. It covers an area of approximately 1,000 acres and has a maximum depth of 40 feet. The lake is fed by several small creeks and streams, including the Big River, which flows through the area. The lake is surrounded by rolling hills and wooded areas, providing a scenic backdrop for the community.
Economy
Iron Mountain Lake is a small, rural community with a population of just over 1,000 people. The economy of the area is largely based on tourism and recreation. The lake is a popular destination for fishing, boating, and other recreational activities. There are several marinas and boat ramps located around the lake, as well as several campgrounds and RV parks. The area also has several restaurants, convenience stores, and other businesses catering to visitors.
Demographics
As of the 2010 census, the population of Iron Mountain Lake was 1,072. The racial makeup of the community was 97.3% White, 0.7% African American, 0.3% Native American, 0.2% Asian, and 1.5% from other races. The median household income was $37,917, and the median age was 44.7 years. The majority of the population (90.2%) was over the age of 18, and the median age of the population was 44.7 years. The population was spread out, with 25.2% under the age of 18, 8.2% from 18 to 24, 28.2% from 25 to 44, 24.2% from 45 to 64, and 14.2% who were 65 years of age or older.
Conclusion
Iron Mountain Lake is a small, rural community located in the foothills of the Ozark Mountains in St. Francois County, Missouri. The lake itself is a man-made reservoir created by the U.S. Army Corps of Engineers in the early 1960s. The economy of the area is largely based on tourism and recreation, with the lake being a popular destination for fishing, boating, and other recreational activities. The population of Iron Mountain Lake is just over 1,000 people, with the majority of the population being over the age of 18 and the median age being 44.7 years.
Common Questions
What is Per Capita Income in Iron Mountain Lake?
Per Capita income in Iron Mountain Lake is $14,297.
What is the Median Family Income in Iron Mountain Lake?
Median Family Income in Iron Mountain Lake is $26,319.
What is the Median Household income in Iron Mountain Lake?
Median Household Income in Iron Mountain Lake is $28,173.
What is Income or Wage Gap in Iron Mountain Lake?
Income or Wage Gap in Iron Mountain Lake is 19.5%.
Women in Iron Mountain Lake earn 80.5 cents for every dollar earned by a man.
What is Inequality or Gini Index in Iron Mountain Lake?
Inequality or Gini Index in Iron Mountain Lake is 0.35.
What is the Total Population of Iron Mountain Lake?
Total Population of Iron Mountain Lake is 806.
What is the Total Male Population of Iron Mountain Lake?
Total Male Population of Iron Mountain Lake is 384.
What is the Total Female Population of Iron Mountain Lake?
Total Female Population of Iron Mountain Lake is 422.
What is the Ratio of Males per 100 Females in Iron Mountain Lake?
There are 91.00 Males per 100 Females in Iron Mountain Lake.
What is the Ratio of Females per 100 Males in Iron Mountain Lake?
There are 109.90 Females per 100 Males in Iron Mountain Lake.
What is the Median Population Age in Iron Mountain Lake?
Median Population Age in Iron Mountain Lake is 49.2 Years.
What is the Average Family Size in Iron Mountain Lake
Average Family Size in Iron Mountain Lake is 2.9 People.
What is the Average Household Size in Iron Mountain Lake
Average Household Size in Iron Mountain Lake is 2.7 People.
How Large is the Labor Force in Iron Mountain Lake?
There are 231 People in the Labor Forcein in Iron Mountain Lake.
What is the Percentage of People in the Labor Force in Iron Mountain Lake?
34.3% of People are in the Labor Force in Iron Mountain Lake.
What is the Unemployment Rate in Iron Mountain Lake?
Unemployment Rate in Iron Mountain Lake is 4.3%.