Aleut vs Soviet Union Wage/Income Gap
COMPARE
Aleut
Soviet Union
Wage/Income Gap
Wage/Income Gap Comparison
Aleuts
Soviet Union
23.7%
WAGE/INCOME GAP
99.2/ 100
METRIC RATING
99th/ 347
METRIC RANK
24.2%
WAGE/INCOME GAP
97.6/ 100
METRIC RATING
111th/ 347
METRIC RANK
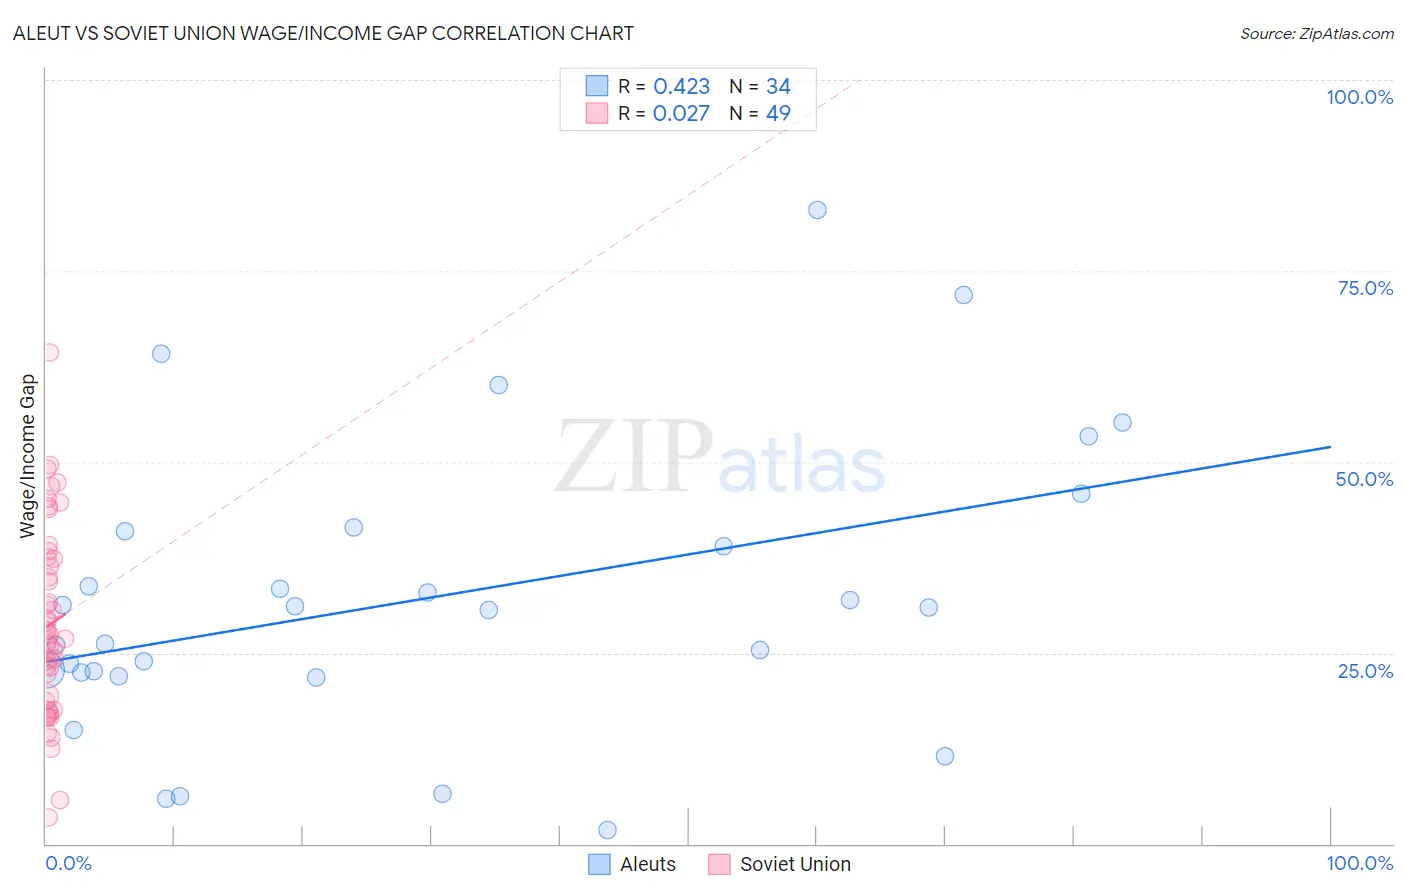
Aleut vs Soviet Union Wage/Income Gap Correlation Chart
The statistical analysis conducted on geographies consisting of 61,745,679 people shows a moderate positive correlation between the proportion of Aleuts and wage/income gap percentage in the United States with a correlation coefficient (R) of 0.423 and weighted average of 23.7%. Similarly, the statistical analysis conducted on geographies consisting of 43,506,320 people shows no correlation between the proportion of Soviet Union and wage/income gap percentage in the United States with a correlation coefficient (R) of 0.027 and weighted average of 24.2%, a difference of 2.0%.
Wage/Income Gap Correlation Summary
| Measurement | Aleut | Soviet Union |
| Minimum | 1.9% | 3.5% |
| Maximum | 83.0% | 64.4% |
| Range | 81.1% | 60.9% |
| Mean | 32.2% | 28.7% |
| Median | 30.8% | 26.8% |
| Interquartile 25% (IQ1) | 22.4% | 18.1% |
| Interquartile 75% (IQ3) | 41.0% | 37.4% |
| Interquartile Range (IQR) | 18.6% | 19.3% |
| Standard Deviation (Sample) | 18.9% | 12.5% |
| Standard Deviation (Population) | 18.6% | 12.4% |
Demographics Similar to Aleuts and Soviet Union by Wage/Income Gap
In terms of wage/income gap, the demographic groups most similar to Aleuts are Yakama (23.7%, a difference of 0.020%), Immigrants from Latin America (23.7%, a difference of 0.070%), Japanese (23.8%, a difference of 0.17%), Immigrants from Laos (23.8%, a difference of 0.32%), and Immigrants from Sudan (23.6%, a difference of 0.47%). Similarly, the demographic groups most similar to Soviet Union are Immigrants from Colombia (24.3%, a difference of 0.40%), Immigrants from Morocco (24.1%, a difference of 0.44%), Sioux (24.3%, a difference of 0.45%), Panamanian (24.4%, a difference of 0.65%), and Ugandan (24.1%, a difference of 0.66%).
| Demographics | Rating | Rank | Wage/Income Gap |
| Cape Verdeans | 99.4 /100 | #95 | Exceptional 23.6% |
| Kiowa | 99.4 /100 | #96 | Exceptional 23.6% |
| Immigrants | Sudan | 99.4 /100 | #97 | Exceptional 23.6% |
| Immigrants | Latin America | 99.2 /100 | #98 | Exceptional 23.7% |
| Aleuts | 99.2 /100 | #99 | Exceptional 23.7% |
| Yakama | 99.2 /100 | #100 | Exceptional 23.7% |
| Japanese | 99.1 /100 | #101 | Exceptional 23.8% |
| Immigrants | Laos | 99.0 /100 | #102 | Exceptional 23.8% |
| Tsimshian | 98.9 /100 | #103 | Exceptional 23.9% |
| Tlingit-Haida | 98.7 /100 | #104 | Exceptional 24.0% |
| Moroccans | 98.6 /100 | #105 | Exceptional 24.0% |
| Sudanese | 98.6 /100 | #106 | Exceptional 24.0% |
| Yaqui | 98.4 /100 | #107 | Exceptional 24.0% |
| Immigrants | Albania | 98.4 /100 | #108 | Exceptional 24.0% |
| Ugandans | 98.3 /100 | #109 | Exceptional 24.1% |
| Immigrants | Morocco | 98.1 /100 | #110 | Exceptional 24.1% |
| Soviet Union | 97.6 /100 | #111 | Exceptional 24.2% |
| Immigrants | Colombia | 97.0 /100 | #112 | Exceptional 24.3% |
| Sioux | 96.9 /100 | #113 | Exceptional 24.3% |
| Panamanians | 96.5 /100 | #114 | Exceptional 24.4% |
| Immigrants | Kenya | 96.4 /100 | #115 | Exceptional 24.4% |