Aleut vs Osage Wage/Income Gap
COMPARE
Aleut
Osage
Wage/Income Gap
Wage/Income Gap Comparison
Aleuts
Osage
23.7%
WAGE/INCOME GAP
99.2/ 100
METRIC RATING
99th/ 347
METRIC RANK
27.1%
WAGE/INCOME GAP
4.4/ 100
METRIC RATING
238th/ 347
METRIC RANK
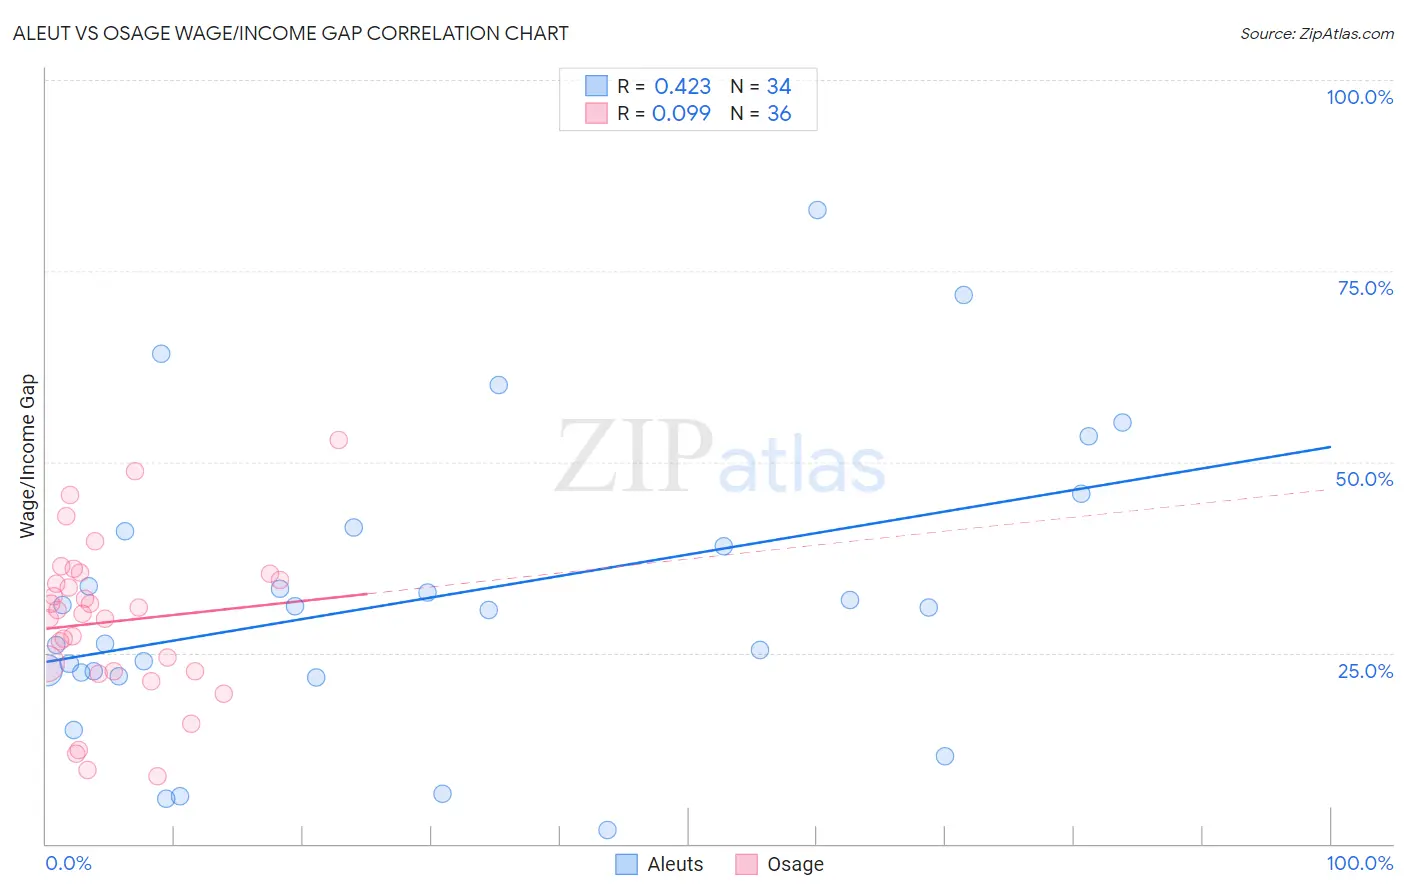
Aleut vs Osage Wage/Income Gap Correlation Chart
The statistical analysis conducted on geographies consisting of 61,745,679 people shows a moderate positive correlation between the proportion of Aleuts and wage/income gap percentage in the United States with a correlation coefficient (R) of 0.423 and weighted average of 23.7%. Similarly, the statistical analysis conducted on geographies consisting of 91,772,804 people shows a slight positive correlation between the proportion of Osage and wage/income gap percentage in the United States with a correlation coefficient (R) of 0.099 and weighted average of 27.1%, a difference of 14.0%.
Wage/Income Gap Correlation Summary
| Measurement | Aleut | Osage |
| Minimum | 1.9% | 8.8% |
| Maximum | 83.0% | 52.9% |
| Range | 81.1% | 44.1% |
| Mean | 32.2% | 29.1% |
| Median | 30.8% | 30.4% |
| Interquartile 25% (IQ1) | 22.4% | 22.6% |
| Interquartile 75% (IQ3) | 41.0% | 34.9% |
| Interquartile Range (IQR) | 18.6% | 12.2% |
| Standard Deviation (Sample) | 18.9% | 10.3% |
| Standard Deviation (Population) | 18.6% | 10.2% |
Similar Demographics by Wage/Income Gap
Demographics Similar to Aleuts by Wage/Income Gap
In terms of wage/income gap, the demographic groups most similar to Aleuts are Yakama (23.7%, a difference of 0.020%), Immigrants from Latin America (23.7%, a difference of 0.070%), Japanese (23.8%, a difference of 0.17%), Immigrants from Laos (23.8%, a difference of 0.32%), and Immigrants from Sudan (23.6%, a difference of 0.47%).
| Demographics | Rating | Rank | Wage/Income Gap |
| Immigrants | Honduras | 99.5 /100 | #92 | Exceptional 23.5% |
| Immigrants | Cabo Verde | 99.5 /100 | #93 | Exceptional 23.6% |
| Hondurans | 99.5 /100 | #94 | Exceptional 23.6% |
| Cape Verdeans | 99.4 /100 | #95 | Exceptional 23.6% |
| Kiowa | 99.4 /100 | #96 | Exceptional 23.6% |
| Immigrants | Sudan | 99.4 /100 | #97 | Exceptional 23.6% |
| Immigrants | Latin America | 99.2 /100 | #98 | Exceptional 23.7% |
| Aleuts | 99.2 /100 | #99 | Exceptional 23.7% |
| Yakama | 99.2 /100 | #100 | Exceptional 23.7% |
| Japanese | 99.1 /100 | #101 | Exceptional 23.8% |
| Immigrants | Laos | 99.0 /100 | #102 | Exceptional 23.8% |
| Tsimshian | 98.9 /100 | #103 | Exceptional 23.9% |
| Tlingit-Haida | 98.7 /100 | #104 | Exceptional 24.0% |
| Moroccans | 98.6 /100 | #105 | Exceptional 24.0% |
| Sudanese | 98.6 /100 | #106 | Exceptional 24.0% |
Demographics Similar to Osage by Wage/Income Gap
In terms of wage/income gap, the demographic groups most similar to Osage are Immigrants from Eastern Asia (27.1%, a difference of 0.0%), Estonian (27.1%, a difference of 0.020%), Immigrants from Romania (27.0%, a difference of 0.15%), Immigrants from Hungary (27.0%, a difference of 0.16%), and Immigrants from Pakistan (27.0%, a difference of 0.18%).
| Demographics | Rating | Rank | Wage/Income Gap |
| Bhutanese | 5.3 /100 | #231 | Tragic 27.0% |
| Argentineans | 5.2 /100 | #232 | Tragic 27.0% |
| Immigrants | Brazil | 5.0 /100 | #233 | Tragic 27.0% |
| Immigrants | Pakistan | 4.9 /100 | #234 | Tragic 27.0% |
| Immigrants | Hungary | 4.8 /100 | #235 | Tragic 27.0% |
| Immigrants | Romania | 4.8 /100 | #236 | Tragic 27.0% |
| Immigrants | Eastern Asia | 4.4 /100 | #237 | Tragic 27.1% |
| Osage | 4.4 /100 | #238 | Tragic 27.1% |
| Estonians | 4.3 /100 | #239 | Tragic 27.1% |
| Immigrants | Europe | 3.8 /100 | #240 | Tragic 27.1% |
| Creek | 3.8 /100 | #241 | Tragic 27.1% |
| Immigrants | Sri Lanka | 3.7 /100 | #242 | Tragic 27.1% |
| Spanish | 3.6 /100 | #243 | Tragic 27.1% |
| Chickasaw | 3.5 /100 | #244 | Tragic 27.2% |
| Immigrants | Azores | 3.5 /100 | #245 | Tragic 27.2% |