Aleut vs Ecuadorian Wage/Income Gap
COMPARE
Aleut
Ecuadorian
Wage/Income Gap
Wage/Income Gap Comparison
Aleuts
Ecuadorians
23.7%
WAGE/INCOME GAP
99.2/ 100
METRIC RATING
99th/ 347
METRIC RANK
22.9%
WAGE/INCOME GAP
99.9/ 100
METRIC RATING
76th/ 347
METRIC RANK
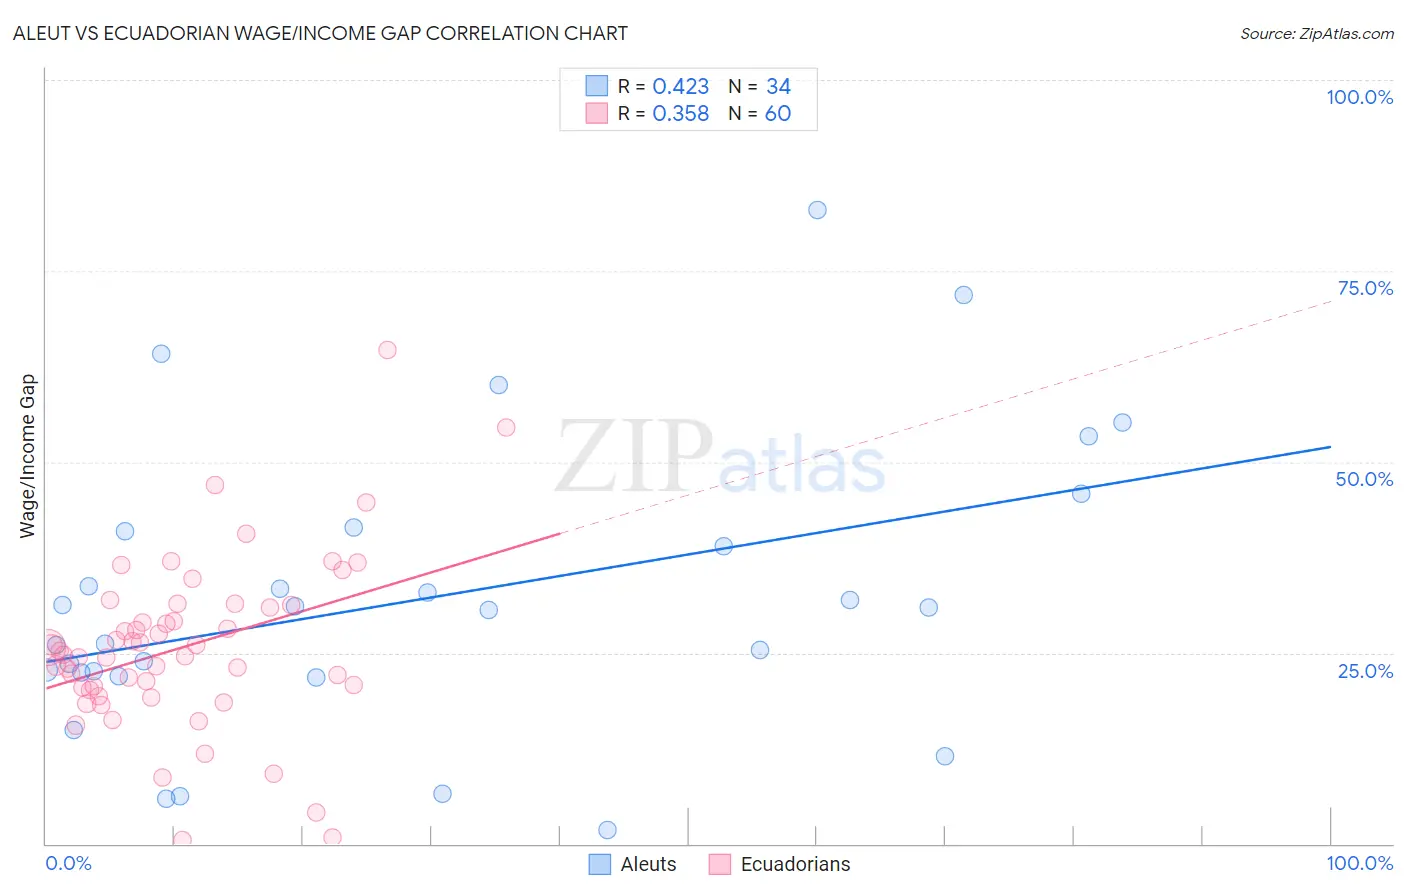
Aleut vs Ecuadorian Wage/Income Gap Correlation Chart
The statistical analysis conducted on geographies consisting of 61,745,679 people shows a moderate positive correlation between the proportion of Aleuts and wage/income gap percentage in the United States with a correlation coefficient (R) of 0.423 and weighted average of 23.7%. Similarly, the statistical analysis conducted on geographies consisting of 317,709,562 people shows a mild positive correlation between the proportion of Ecuadorians and wage/income gap percentage in the United States with a correlation coefficient (R) of 0.358 and weighted average of 22.9%, a difference of 3.6%.
Wage/Income Gap Correlation Summary
| Measurement | Aleut | Ecuadorian |
| Minimum | 1.9% | 0.44% |
| Maximum | 83.0% | 64.7% |
| Range | 81.1% | 64.2% |
| Mean | 32.2% | 25.7% |
| Median | 30.8% | 25.0% |
| Interquartile 25% (IQ1) | 22.4% | 20.3% |
| Interquartile 75% (IQ3) | 41.0% | 31.1% |
| Interquartile Range (IQR) | 18.6% | 10.8% |
| Standard Deviation (Sample) | 18.9% | 11.3% |
| Standard Deviation (Population) | 18.6% | 11.2% |
Similar Demographics by Wage/Income Gap
Demographics Similar to Aleuts by Wage/Income Gap
In terms of wage/income gap, the demographic groups most similar to Aleuts are Yakama (23.7%, a difference of 0.020%), Immigrants from Latin America (23.7%, a difference of 0.070%), Japanese (23.8%, a difference of 0.17%), Immigrants from Laos (23.8%, a difference of 0.32%), and Immigrants from Sudan (23.6%, a difference of 0.47%).
| Demographics | Rating | Rank | Wage/Income Gap |
| Immigrants | Honduras | 99.5 /100 | #92 | Exceptional 23.5% |
| Immigrants | Cabo Verde | 99.5 /100 | #93 | Exceptional 23.6% |
| Hondurans | 99.5 /100 | #94 | Exceptional 23.6% |
| Cape Verdeans | 99.4 /100 | #95 | Exceptional 23.6% |
| Kiowa | 99.4 /100 | #96 | Exceptional 23.6% |
| Immigrants | Sudan | 99.4 /100 | #97 | Exceptional 23.6% |
| Immigrants | Latin America | 99.2 /100 | #98 | Exceptional 23.7% |
| Aleuts | 99.2 /100 | #99 | Exceptional 23.7% |
| Yakama | 99.2 /100 | #100 | Exceptional 23.7% |
| Japanese | 99.1 /100 | #101 | Exceptional 23.8% |
| Immigrants | Laos | 99.0 /100 | #102 | Exceptional 23.8% |
| Tsimshian | 98.9 /100 | #103 | Exceptional 23.9% |
| Tlingit-Haida | 98.7 /100 | #104 | Exceptional 24.0% |
| Moroccans | 98.6 /100 | #105 | Exceptional 24.0% |
| Sudanese | 98.6 /100 | #106 | Exceptional 24.0% |
Demographics Similar to Ecuadorians by Wage/Income Gap
In terms of wage/income gap, the demographic groups most similar to Ecuadorians are Fijian (22.9%, a difference of 0.010%), African (22.9%, a difference of 0.13%), Nigerian (23.0%, a difference of 0.24%), Immigrants from Burma/Myanmar (22.8%, a difference of 0.30%), and Immigrants from Nicaragua (23.0%, a difference of 0.33%).
| Demographics | Rating | Rank | Wage/Income Gap |
| Indonesians | 99.9 /100 | #69 | Exceptional 22.7% |
| Immigrants | Uzbekistan | 99.9 /100 | #70 | Exceptional 22.7% |
| Immigrants | El Salvador | 99.9 /100 | #71 | Exceptional 22.8% |
| Sub-Saharan Africans | 99.9 /100 | #72 | Exceptional 22.8% |
| Immigrants | Eastern Africa | 99.9 /100 | #73 | Exceptional 22.8% |
| Immigrants | Burma/Myanmar | 99.9 /100 | #74 | Exceptional 22.8% |
| Fijians | 99.9 /100 | #75 | Exceptional 22.9% |
| Ecuadorians | 99.9 /100 | #76 | Exceptional 22.9% |
| Africans | 99.9 /100 | #77 | Exceptional 22.9% |
| Nigerians | 99.9 /100 | #78 | Exceptional 23.0% |
| Immigrants | Nicaragua | 99.9 /100 | #79 | Exceptional 23.0% |
| Salvadorans | 99.9 /100 | #80 | Exceptional 23.0% |
| Bermudans | 99.8 /100 | #81 | Exceptional 23.1% |
| Central Americans | 99.8 /100 | #82 | Exceptional 23.1% |
| Immigrants | Africa | 99.8 /100 | #83 | Exceptional 23.2% |