Zip Codes with the Highest Percentage of Population Employed in Computer & Mathematics in Delaware
RELATED REPORTS & OPTIONS
Computer & Mathematics
Delaware
Compare Zip Codes
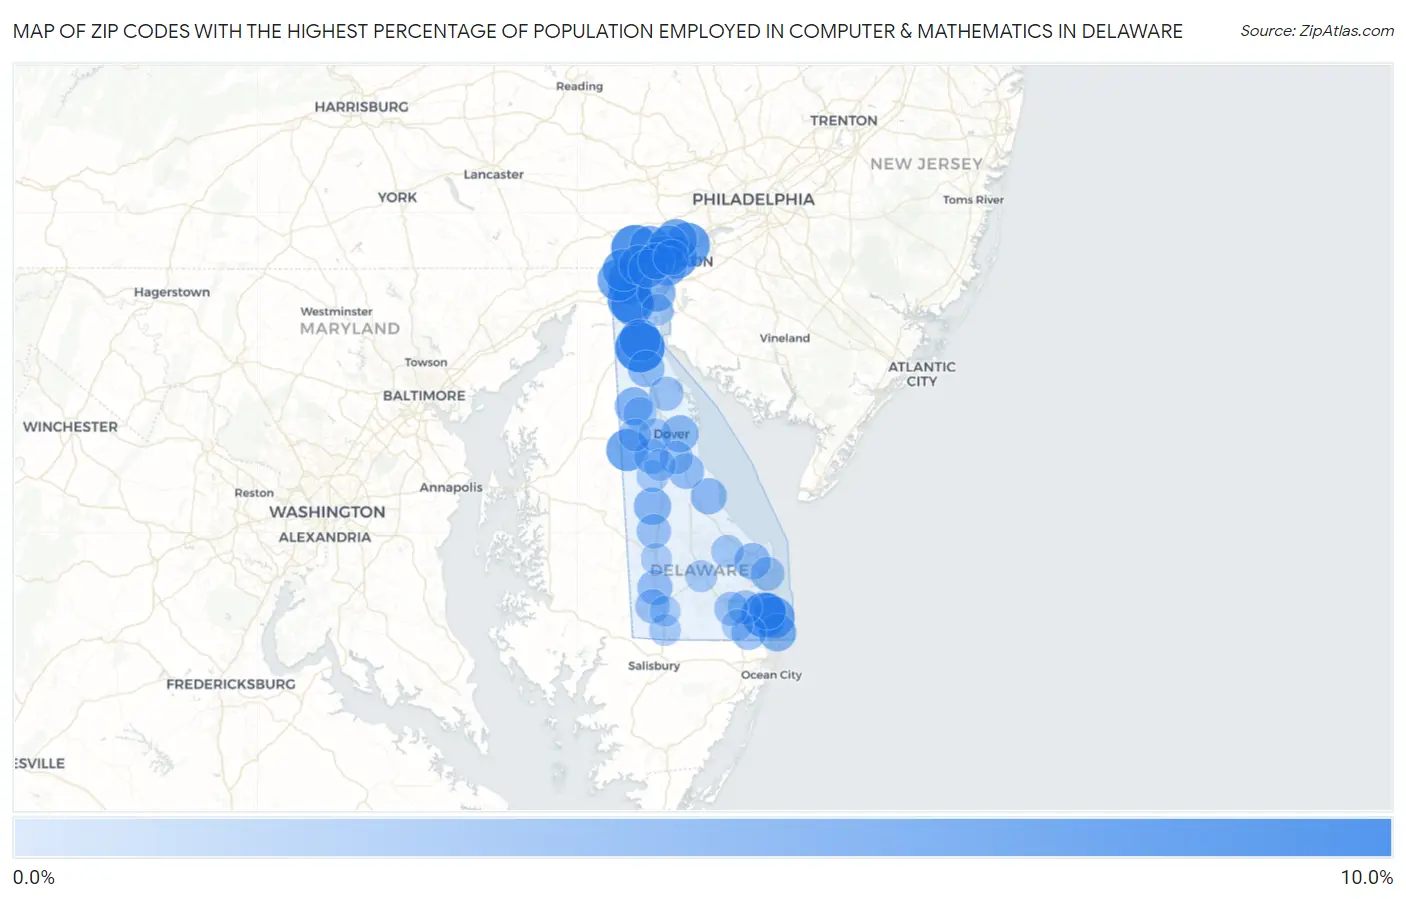
Map of Zip Codes with the Highest Percentage of Population Employed in Computer & Mathematics in Delaware
0.0%
10.0%
Zip Codes with the Highest Percentage of Population Employed in Computer & Mathematics in Delaware
| Zip Code | % Employed | vs State | vs National | |
| 1. | 19730 | 8.0% | 3.4%(+4.66)#1 | 3.5%(+4.49)#1,203 |
| 2. | 19707 | 7.2% | 3.4%(+3.83)#2 | 3.5%(+3.66)#1,522 |
| 3. | 19967 | 6.1% | 3.4%(+2.71)#3 | 3.5%(+2.54)#2,260 |
| 4. | 19702 | 6.0% | 3.4%(+2.68)#4 | 3.5%(+2.51)#2,281 |
| 5. | 19703 | 5.9% | 3.4%(+2.58)#5 | 3.5%(+2.41)#2,373 |
| 6. | 19713 | 5.8% | 3.4%(+2.48)#6 | 3.5%(+2.31)#2,477 |
| 7. | 19701 | 5.3% | 3.4%(+1.98)#7 | 3.5%(+1.81)#2,963 |
| 8. | 19809 | 5.1% | 3.4%(+1.70)#8 | 3.5%(+1.53)#3,298 |
| 9. | 19964 | 5.0% | 3.4%(+1.64)#9 | 3.5%(+1.47)#3,366 |
| 10. | 19717 | 5.0% | 3.4%(+1.62)#10 | 3.5%(+1.45)#3,382 |
| 11. | 19711 | 4.9% | 3.4%(+1.58)#11 | 3.5%(+1.41)#3,449 |
| 12. | 19930 | 4.8% | 3.4%(+1.45)#12 | 3.5%(+1.28)#3,644 |
| 13. | 19810 | 4.7% | 3.4%(+1.38)#13 | 3.5%(+1.21)#3,738 |
| 14. | 19709 | 4.7% | 3.4%(+1.30)#14 | 3.5%(+1.13)#3,864 |
| 15. | 19807 | 4.3% | 3.4%(+0.976)#15 | 3.5%(+0.806)#4,374 |
| 16. | 19806 | 4.3% | 3.4%(+0.960)#16 | 3.5%(+0.789)#4,407 |
| 17. | 19808 | 3.8% | 3.4%(+0.462)#17 | 3.5%(+0.291)#5,441 |
| 18. | 19803 | 3.7% | 3.4%(+0.329)#18 | 3.5%(+0.159)#5,769 |
| 19. | 19801 | 3.6% | 3.4%(+0.286)#19 | 3.5%(+0.116)#5,867 |
| 20. | 19720 | 3.4% | 3.4%(+0.018)#20 | 3.5%(-0.153)#6,566 |
| 21. | 19804 | 3.3% | 3.4%(-0.023)#21 | 3.5%(-0.193)#6,679 |
| 22. | 19938 | 3.1% | 3.4%(-0.263)#22 | 3.5%(-0.433)#7,432 |
| 23. | 19944 | 3.0% | 3.4%(-0.306)#23 | 3.5%(-0.476)#7,572 |
| 24. | 19952 | 2.9% | 3.4%(-0.448)#24 | 3.5%(-0.619)#8,080 |
| 25. | 19970 | 2.9% | 3.4%(-0.498)#25 | 3.5%(-0.669)#8,265 |
| 26. | 19901 | 2.8% | 3.4%(-0.527)#26 | 3.5%(-0.698)#8,360 |
| 27. | 19734 | 2.7% | 3.4%(-0.700)#27 | 3.5%(-0.871)#9,017 |
| 28. | 19805 | 2.5% | 3.4%(-0.835)#28 | 3.5%(-1.01)#9,565 |
| 29. | 19958 | 2.5% | 3.4%(-0.840)#29 | 3.5%(-1.01)#9,582 |
| 30. | 19963 | 2.4% | 3.4%(-0.945)#30 | 3.5%(-1.11)#9,991 |
| 31. | 19802 | 2.3% | 3.4%(-1.05)#31 | 3.5%(-1.22)#10,433 |
| 32. | 19946 | 2.2% | 3.4%(-1.19)#32 | 3.5%(-1.36)#11,068 |
| 33. | 19973 | 2.0% | 3.4%(-1.39)#33 | 3.5%(-1.56)#11,968 |
| 34. | 19975 | 1.9% | 3.4%(-1.46)#34 | 3.5%(-1.63)#12,348 |
| 35. | 19934 | 1.8% | 3.4%(-1.55)#35 | 3.5%(-1.72)#12,711 |
| 36. | 19950 | 1.7% | 3.4%(-1.67)#36 | 3.5%(-1.84)#13,328 |
| 37. | 19931 | 1.7% | 3.4%(-1.67)#37 | 3.5%(-1.84)#13,354 |
| 38. | 19977 | 1.6% | 3.4%(-1.73)#38 | 3.5%(-1.90)#13,696 |
| 39. | 19939 | 1.6% | 3.4%(-1.80)#39 | 3.5%(-1.97)#14,052 |
| 40. | 19966 | 1.5% | 3.4%(-1.80)#40 | 3.5%(-1.97)#14,086 |
| 41. | 19971 | 1.5% | 3.4%(-1.90)#41 | 3.5%(-2.07)#14,650 |
| 42. | 19962 | 1.4% | 3.4%(-1.98)#42 | 3.5%(-2.15)#15,076 |
| 43. | 19955 | 1.4% | 3.4%(-1.98)#43 | 3.5%(-2.15)#15,126 |
| 44. | 19904 | 1.2% | 3.4%(-2.11)#44 | 3.5%(-2.28)#15,904 |
| 45. | 19953 | 1.0% | 3.4%(-2.34)#45 | 3.5%(-2.51)#17,309 |
| 46. | 19968 | 1.0% | 3.4%(-2.35)#46 | 3.5%(-2.52)#17,355 |
| 47. | 19943 | 0.75% | 3.4%(-2.60)#47 | 3.5%(-2.77)#18,929 |
| 48. | 19947 | 0.71% | 3.4%(-2.64)#48 | 3.5%(-2.81)#19,156 |
| 49. | 19979 | 0.68% | 3.4%(-2.67)#49 | 3.5%(-2.84)#19,383 |
| 50. | 19940 | 0.60% | 3.4%(-2.76)#50 | 3.5%(-2.93)#19,902 |
| 51. | 19706 | 0.56% | 3.4%(-2.80)#51 | 3.5%(-2.97)#20,135 |
| 52. | 19945 | 0.51% | 3.4%(-2.84)#52 | 3.5%(-3.01)#20,431 |
| 53. | 19933 | 0.38% | 3.4%(-2.97)#53 | 3.5%(-3.14)#21,161 |
| 54. | 19956 | 0.29% | 3.4%(-3.06)#54 | 3.5%(-3.23)#21,645 |
1
Common Questions
What are the Top 10 Zip Codes with the Highest Percentage of Population Employed in Computer & Mathematics in Delaware?
Top 10 Zip Codes with the Highest Percentage of Population Employed in Computer & Mathematics in Delaware are:
What zip code has the Highest Percentage of Population Employed in Computer & Mathematics in Delaware?
19730 has the Highest Percentage of Population Employed in Computer & Mathematics in Delaware with 8.0%.
What is the Percentage of Population Employed in Computer & Mathematics in the State of Delaware?
Percentage of Population Employed in Computer & Mathematics in Delaware is 3.4%.
What is the Percentage of Population Employed in Computer & Mathematics in the United States?
Percentage of Population Employed in Computer & Mathematics in the United States is 3.5%.