Zip Codes with the Highest Percentage of Population Employed in Computer & Mathematics in Newark, DE
RELATED REPORTS & OPTIONS
Computer & Mathematics
Newark
Compare Zip Codes
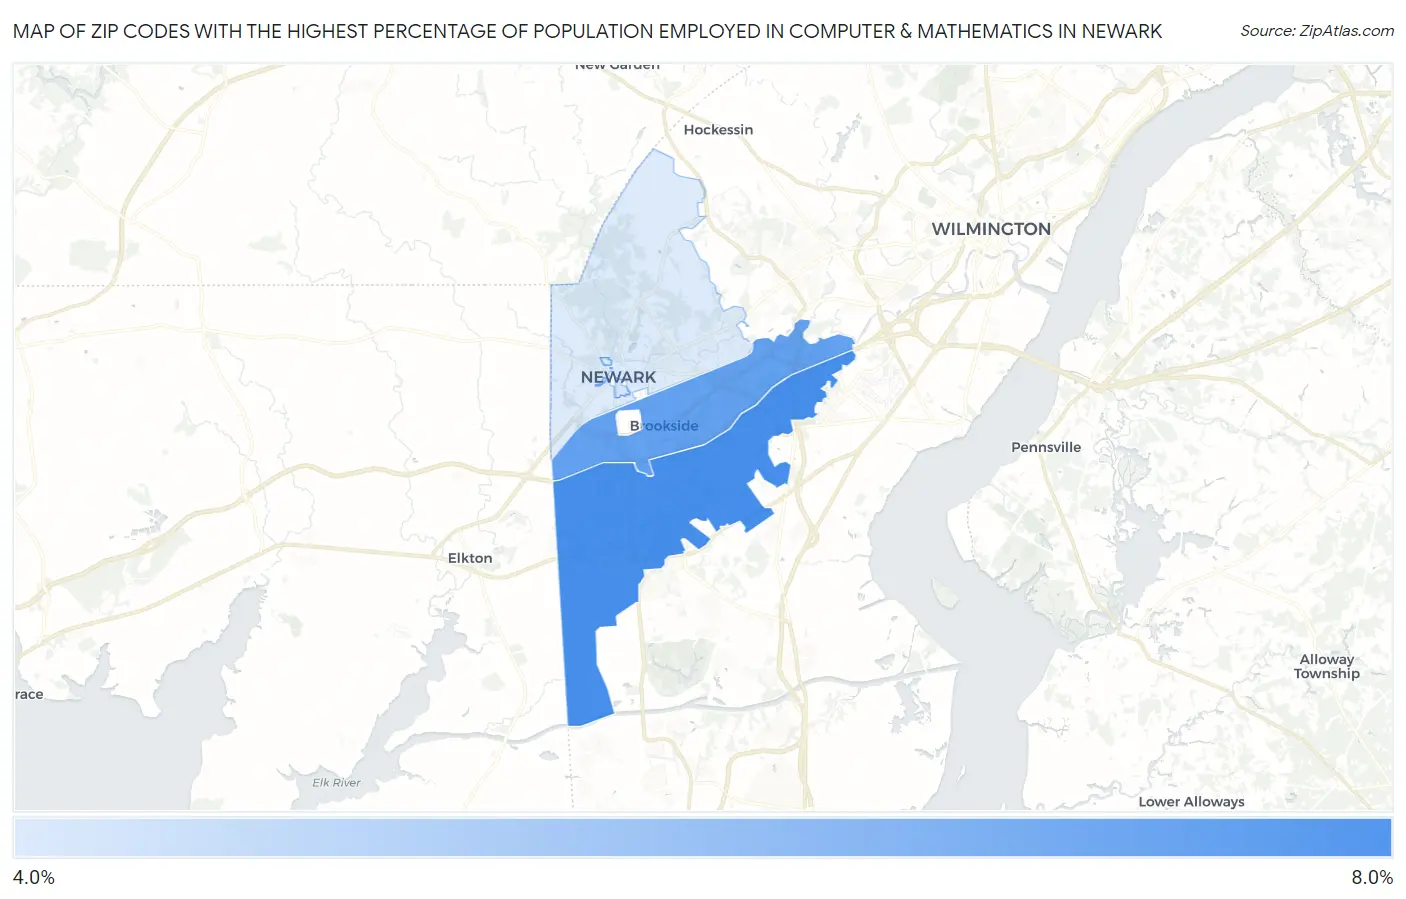
Map of Zip Codes with the Highest Percentage of Population Employed in Computer & Mathematics in Newark
4.9%
6.0%
Zip Codes with the Highest Percentage of Population Employed in Computer & Mathematics in Newark, DE
| Zip Code | % Employed | vs State | vs National | |
| 1. | 19702 | 6.0% | 3.4%(+2.68)#4 | 3.5%(+2.51)#2,281 |
| 2. | 19713 | 5.8% | 3.4%(+2.48)#6 | 3.5%(+2.31)#2,477 |
| 3. | 19717 | 5.0% | 3.4%(+1.62)#10 | 3.5%(+1.45)#3,382 |
| 4. | 19711 | 4.9% | 3.4%(+1.58)#11 | 3.5%(+1.41)#3,449 |
1
Common Questions
What are the Top 3 Zip Codes with the Highest Percentage of Population Employed in Computer & Mathematics in Newark, DE?
Top 3 Zip Codes with the Highest Percentage of Population Employed in Computer & Mathematics in Newark, DE are:
What zip code has the Highest Percentage of Population Employed in Computer & Mathematics in Newark, DE?
19702 has the Highest Percentage of Population Employed in Computer & Mathematics in Newark, DE with 6.0%.
What is the Percentage of Population Employed in Computer & Mathematics in Newark, DE?
Percentage of Population Employed in Computer & Mathematics in Newark is 3.8%.
What is the Percentage of Population Employed in Computer & Mathematics in Delaware?
Percentage of Population Employed in Computer & Mathematics in Delaware is 3.4%.
What is the Percentage of Population Employed in Computer & Mathematics in the United States?
Percentage of Population Employed in Computer & Mathematics in the United States is 3.5%.