North Washington, CO Map & Demographics
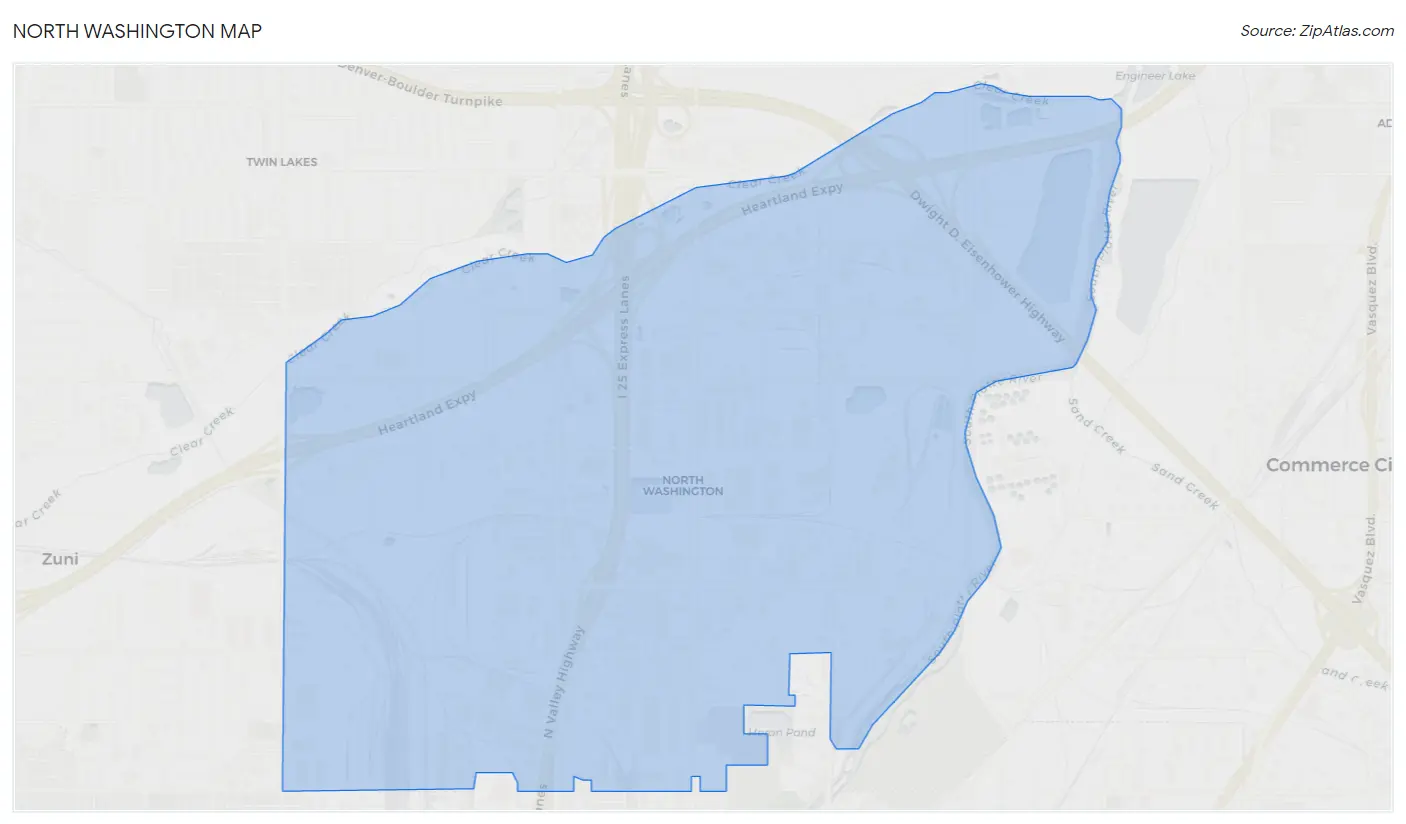
North Washington Map
North Washington Overview
$23,731
PER CAPITA INCOME
$78,750
AVG FAMILY INCOME
0.46
INEQUALITY / GINI INDEX
232
TOTAL POPULATION
150
MALE POPULATION
82
FEMALE POPULATION
182.93
MALES / 100 FEMALES
54.67
FEMALES / 100 MALES
59.6
MEDIAN AGE
2.0
AVG FAMILY SIZE
1.2
AVG HOUSEHOLD SIZE
145
LABOR FORCE [ PEOPLE ]
62.5%
PERCENT IN LABOR FORCE
6.9%
UNEMPLOYMENT RATE
Income in North Washington
Income Overview in North Washington
| Characteristic | Number | Measure |
| Per Capita Income | 232 | $23,731 |
| Median Family Income | 29 | $78,750 |
| Mean Family Income | 29 | $77,110 |
| Median Household Income | 177 | $0 |
| Mean Household Income | 177 | $31,266 |
| Income Deficit | 29 | $0 |
| Wage / Income Gap (%) | 232 | 0.00% |
| Wage / Income Gap ($) | 232 | 100.00¢ per $1 |
| Gini / Inequality Index | 232 | 0.46 |
Earnings by Sex in North Washington
| Sex | Number | Average Earnings |
| Male | 124 (78.0%) | $0 |
| Female | 35 (22.0%) | $0 |
| Total | 159 (100.0%) | $0 |
Earnings by Sex by Income Bracket in North Washington
The most common earnings brackets in North Washington are $5,000 to $7,499 for men (46 | 37.1%) and $20,000 to $22,499 for women (26 | 74.3%).
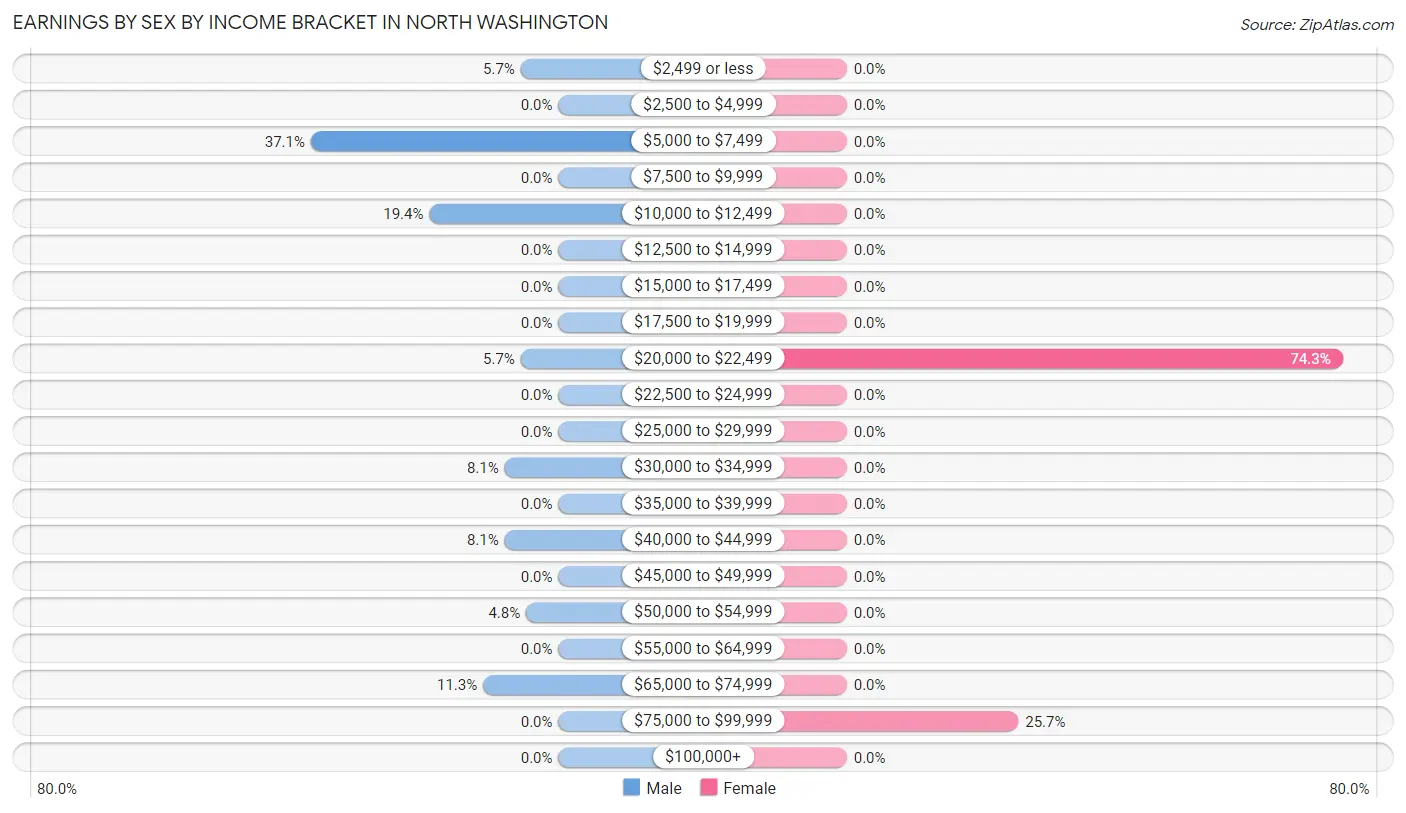
| Income | Male | Female |
| $2,499 or less | 7 (5.7%) | 0 (0.0%) |
| $2,500 to $4,999 | 0 (0.0%) | 0 (0.0%) |
| $5,000 to $7,499 | 46 (37.1%) | 0 (0.0%) |
| $7,500 to $9,999 | 0 (0.0%) | 0 (0.0%) |
| $10,000 to $12,499 | 24 (19.4%) | 0 (0.0%) |
| $12,500 to $14,999 | 0 (0.0%) | 0 (0.0%) |
| $15,000 to $17,499 | 0 (0.0%) | 0 (0.0%) |
| $17,500 to $19,999 | 0 (0.0%) | 0 (0.0%) |
| $20,000 to $22,499 | 7 (5.7%) | 26 (74.3%) |
| $22,500 to $24,999 | 0 (0.0%) | 0 (0.0%) |
| $25,000 to $29,999 | 0 (0.0%) | 0 (0.0%) |
| $30,000 to $34,999 | 10 (8.1%) | 0 (0.0%) |
| $35,000 to $39,999 | 0 (0.0%) | 0 (0.0%) |
| $40,000 to $44,999 | 10 (8.1%) | 0 (0.0%) |
| $45,000 to $49,999 | 0 (0.0%) | 0 (0.0%) |
| $50,000 to $54,999 | 6 (4.8%) | 0 (0.0%) |
| $55,000 to $64,999 | 0 (0.0%) | 0 (0.0%) |
| $65,000 to $74,999 | 14 (11.3%) | 0 (0.0%) |
| $75,000 to $99,999 | 0 (0.0%) | 9 (25.7%) |
| $100,000+ | 0 (0.0%) | 0 (0.0%) |
| Total | 124 (100.0%) | 35 (100.0%) |
Earnings by Sex by Educational Attainment in North Washington
| Educational Attainment | Male Income | Female Income |
| Less than High School | - | - |
| High School Diploma | - | - |
| College or Associate's Degree | - | - |
| Bachelor's Degree | - | - |
| Graduate Degree | - | - |
| Total | - | - |
Family Income in North Washington
Family Income Brackets in North Washington
According to the North Washington family income data, there are 19 families falling into the $75,000 to $99,999 income range, which is the most common income bracket and makes up 65.5% of all families.
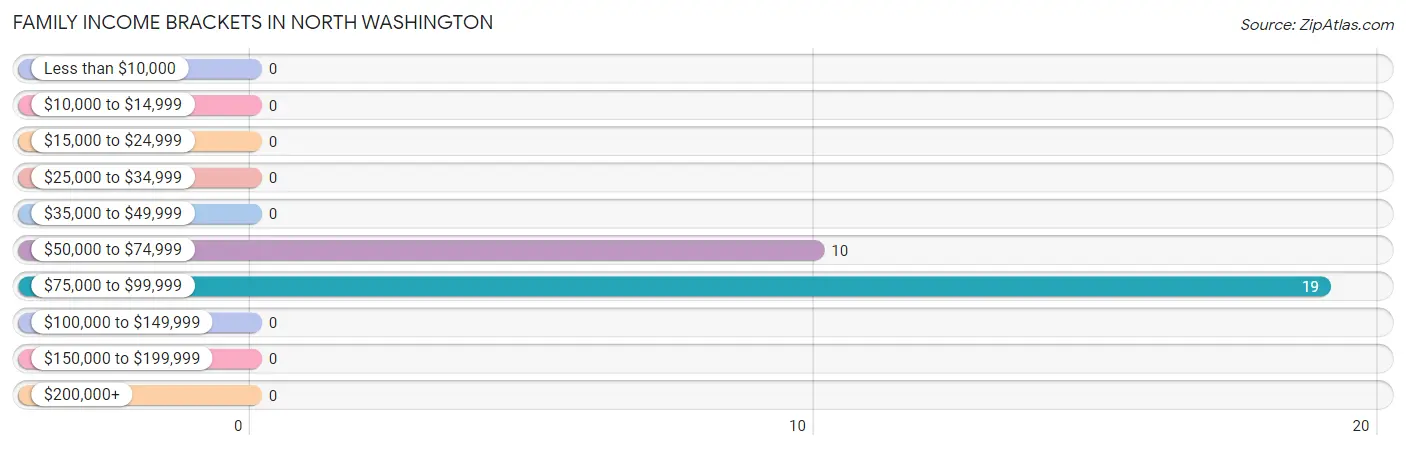
| Income Bracket | # Families | % Families |
| Less than $10,000 | 0 | 0.0% |
| $10,000 to $14,999 | 0 | 0.0% |
| $15,000 to $24,999 | 0 | 0.0% |
| $25,000 to $34,999 | 0 | 0.0% |
| $35,000 to $49,999 | 0 | 0.0% |
| $50,000 to $74,999 | 10 | 34.5% |
| $75,000 to $99,999 | 19 | 65.5% |
| $100,000 to $149,999 | 0 | 0.0% |
| $150,000 to $199,999 | 0 | 0.0% |
| $200,000+ | 0 | 0.0% |
Family Income by Famaliy Size in North Washington
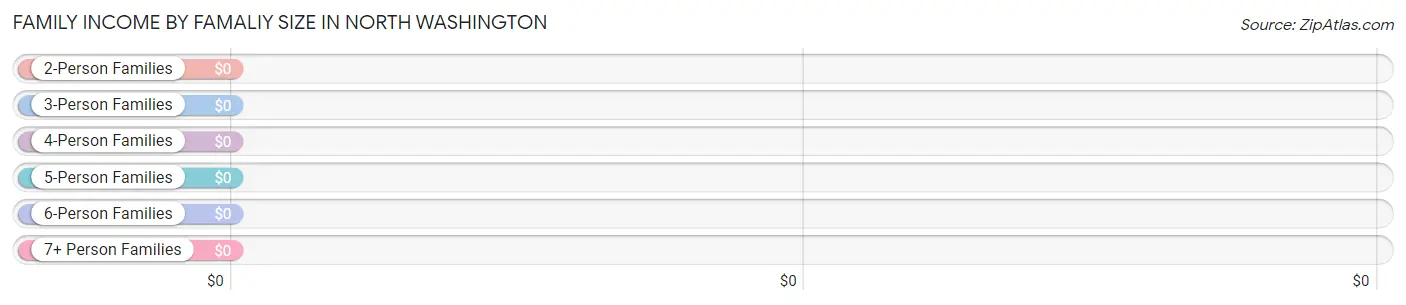
| Income Bracket | # Families | Median Income |
| 2-Person Families | 19 (65.5%) | $0 |
| 3-Person Families | 10 (34.5%) | $0 |
| 4-Person Families | 0 (0.0%) | $0 |
| 5-Person Families | 0 (0.0%) | $0 |
| 6-Person Families | 0 (0.0%) | $0 |
| 7+ Person Families | 0 (0.0%) | $0 |
| Total | 29 (100.0%) | $78,750 |
Family Income by Number of Earners in North Washington
| Number of Earners | # Families | Median Income |
| No Earners | 0 (0.0%) | $0 |
| 1 Earner | 19 (65.5%) | $0 |
| 2 Earners | 10 (34.5%) | $0 |
| 3+ Earners | 0 (0.0%) | $0 |
| Total | 29 (100.0%) | $78,750 |
Household Income in North Washington
Household Income Brackets in North Washington
With 46 households falling in the category, the less than $10,000 income range is the most frequent in North Washington, accounting for 26.0% of all households.
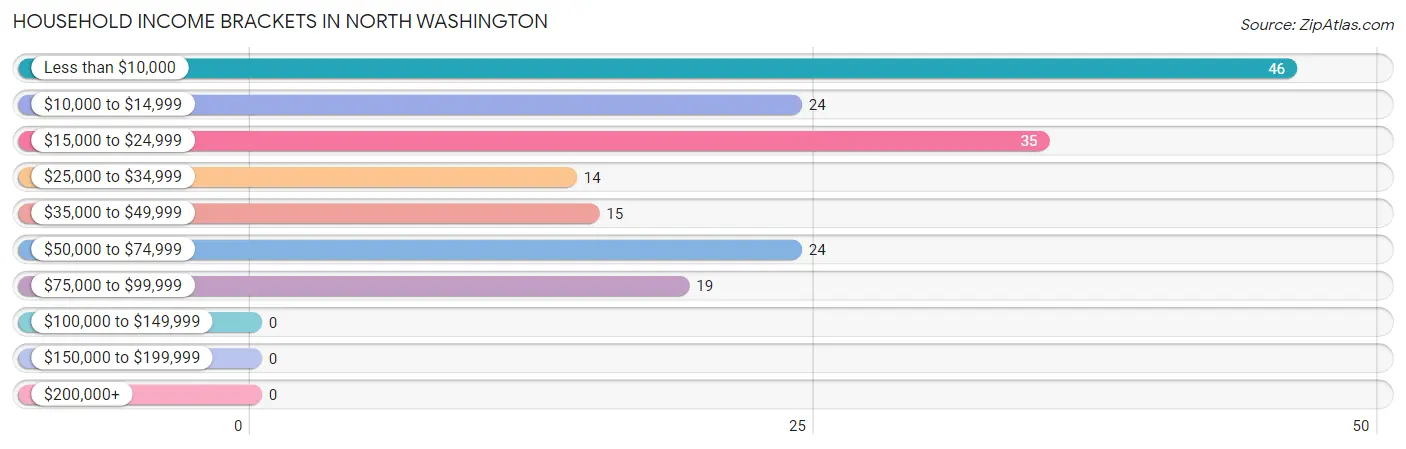
| Income Bracket | # Households | % Households |
| Less than $10,000 | 46 | 26.0% |
| $10,000 to $14,999 | 24 | 13.6% |
| $15,000 to $24,999 | 35 | 19.8% |
| $25,000 to $34,999 | 14 | 7.9% |
| $35,000 to $49,999 | 15 | 8.5% |
| $50,000 to $74,999 | 24 | 13.6% |
| $75,000 to $99,999 | 19 | 10.7% |
| $100,000 to $149,999 | 0 | 0.0% |
| $150,000 to $199,999 | 0 | 0.0% |
| $200,000+ | 0 | 0.0% |
Household Income by Householder Age in North Washington
The median household income in North Washington is $0, with the highest median household income of $28,571 found in the 65+ years age bracket for the primary householder. A total of 64 households (36.2%) fall into this category.
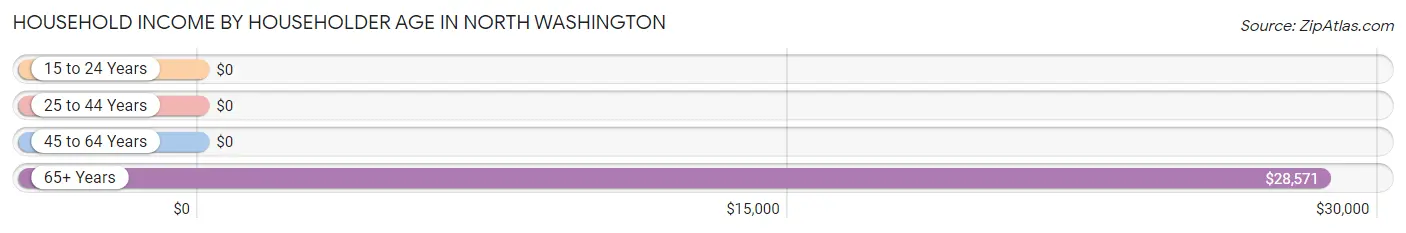
| Income Bracket | # Households | Median Income |
| 15 to 24 Years | 0 (0.0%) | $0 |
| 25 to 44 Years | 24 (13.6%) | $0 |
| 45 to 64 Years | 89 (50.3%) | $0 |
| 65+ Years | 64 (36.2%) | $28,571 |
| Total | 177 (100.0%) | $0 |
Poverty in North Washington
Income Below Poverty by Sex and Age in North Washington
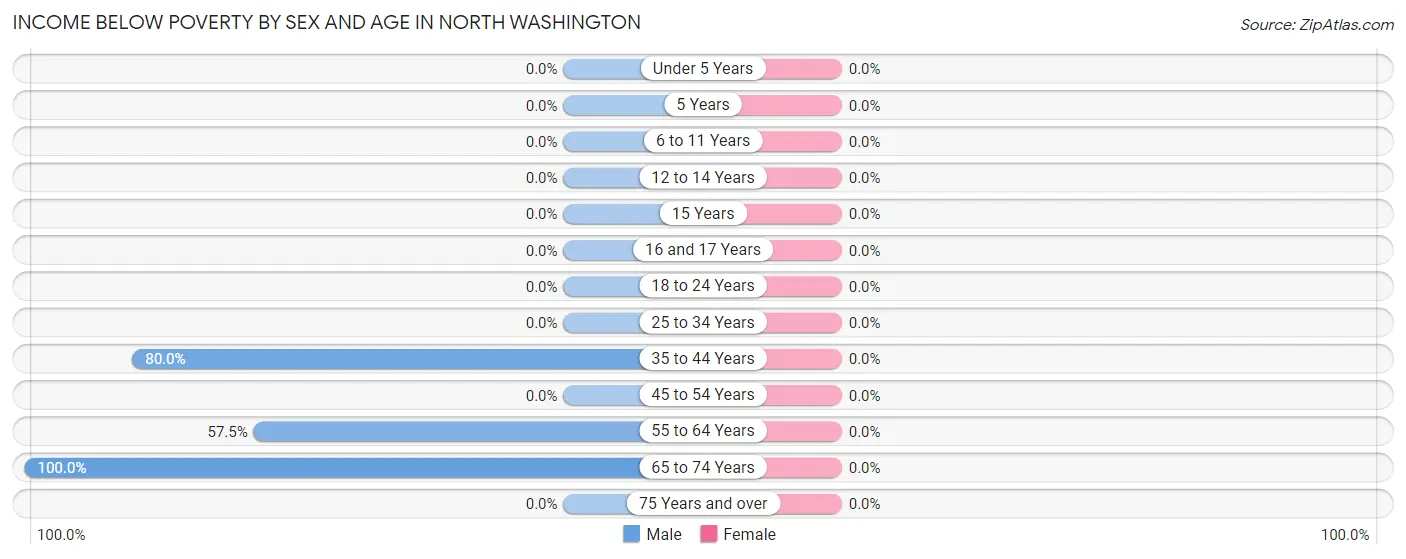
| Age Bracket | Male | Female |
| Under 5 Years | 0 (0.0%) | 0 (0.0%) |
| 5 Years | 0 (0.0%) | 0 (0.0%) |
| 6 to 11 Years | 0 (0.0%) | 0 (0.0%) |
| 12 to 14 Years | 0 (0.0%) | 0 (0.0%) |
| 15 Years | 0 (0.0%) | 0 (0.0%) |
| 16 and 17 Years | 0 (0.0%) | 0 (0.0%) |
| 18 to 24 Years | 0 (0.0%) | 0 (0.0%) |
| 25 to 34 Years | 0 (0.0%) | 0 (0.0%) |
| 35 to 44 Years | 24 (80.0%) | 0 (0.0%) |
| 45 to 54 Years | 0 (0.0%) | 0 (0.0%) |
| 55 to 64 Years | 46 (57.5%) | 0 (0.0%) |
| 65 to 74 Years | 5 (100.0%) | 0 (0.0%) |
| 75 Years and over | 0 (0.0%) | 0 (0.0%) |
| Total | 75 (58.1%) | 0 (0.0%) |
Income Above Poverty by Sex and Age in North Washington
According to the poverty statistics in North Washington, males aged 75 years and over and females aged 16 and 17 years are the age groups that are most secure financially, with 100.0% of males and 100.0% of females in these age groups living above the poverty line.
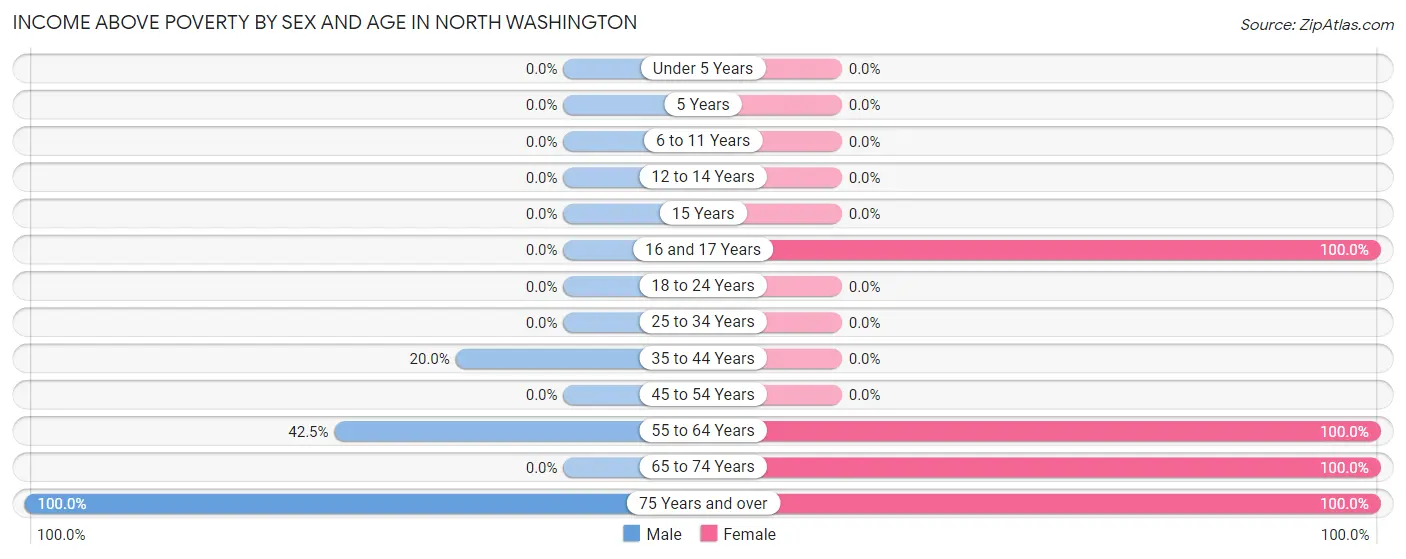
| Age Bracket | Male | Female |
| Under 5 Years | 0 (0.0%) | 0 (0.0%) |
| 5 Years | 0 (0.0%) | 0 (0.0%) |
| 6 to 11 Years | 0 (0.0%) | 0 (0.0%) |
| 12 to 14 Years | 0 (0.0%) | 0 (0.0%) |
| 15 Years | 0 (0.0%) | 0 (0.0%) |
| 16 and 17 Years | 0 (0.0%) | 10 (100.0%) |
| 18 to 24 Years | 0 (0.0%) | 0 (0.0%) |
| 25 to 34 Years | 0 (0.0%) | 0 (0.0%) |
| 35 to 44 Years | 6 (20.0%) | 0 (0.0%) |
| 45 to 54 Years | 0 (0.0%) | 0 (0.0%) |
| 55 to 64 Years | 34 (42.5%) | 17 (100.0%) |
| 65 to 74 Years | 0 (0.0%) | 35 (100.0%) |
| 75 Years and over | 14 (100.0%) | 20 (100.0%) |
| Total | 54 (41.9%) | 82 (100.0%) |
Income Below Poverty Among Married-Couple Families in North Washington
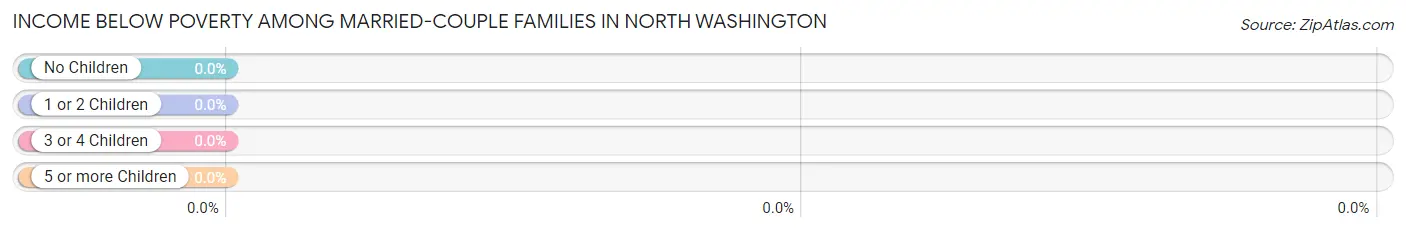
| Children | Above Poverty | Below Poverty |
| No Children | 10 (100.0%) | 0 (0.0%) |
| 1 or 2 Children | 0 (0.0%) | 0 (0.0%) |
| 3 or 4 Children | 0 (0.0%) | 0 (0.0%) |
| 5 or more Children | 0 (0.0%) | 0 (0.0%) |
| Total | 10 (100.0%) | 0 (0.0%) |
Income Below Poverty Among Single-Parent Households in North Washington
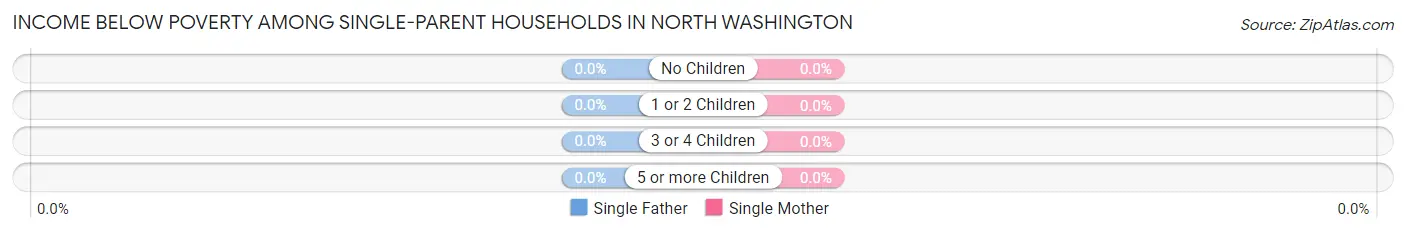
| Children | Single Father | Single Mother |
| No Children | 0 (0.0%) | 0 (0.0%) |
| 1 or 2 Children | 0 (0.0%) | 0 (0.0%) |
| 3 or 4 Children | 0 (0.0%) | 0 (0.0%) |
| 5 or more Children | 0 (0.0%) | 0 (0.0%) |
| Total | 0 (0.0%) | 0 (0.0%) |
Income Below Poverty Among Married-Couple vs Single-Parent Households in North Washington
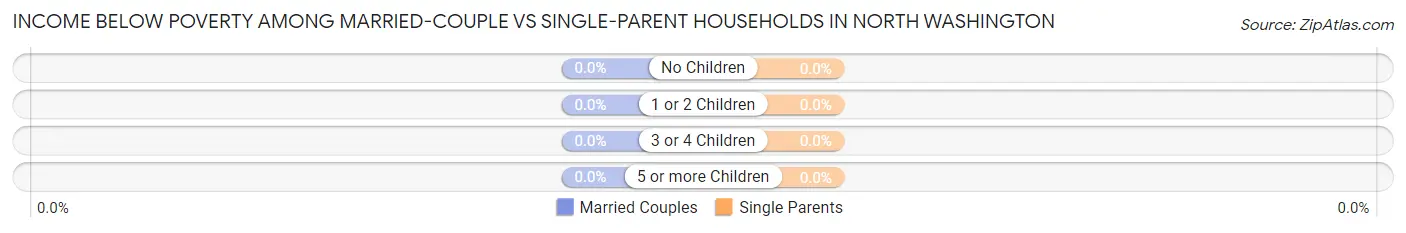
| Children | Married-Couple Families | Single-Parent Households |
| No Children | 0 (0.0%) | 0 (0.0%) |
| 1 or 2 Children | 0 (0.0%) | 0 (0.0%) |
| 3 or 4 Children | 0 (0.0%) | 0 (0.0%) |
| 5 or more Children | 0 (0.0%) | 0 (0.0%) |
| Total | 0 (0.0%) | 0 (0.0%) |
Race in North Washington
The most populous races in North Washington are White / Caucasian (158 | 68.1%), Hispanic or Latino (108 | 46.6%), and Two or more Races (40 | 17.2%).
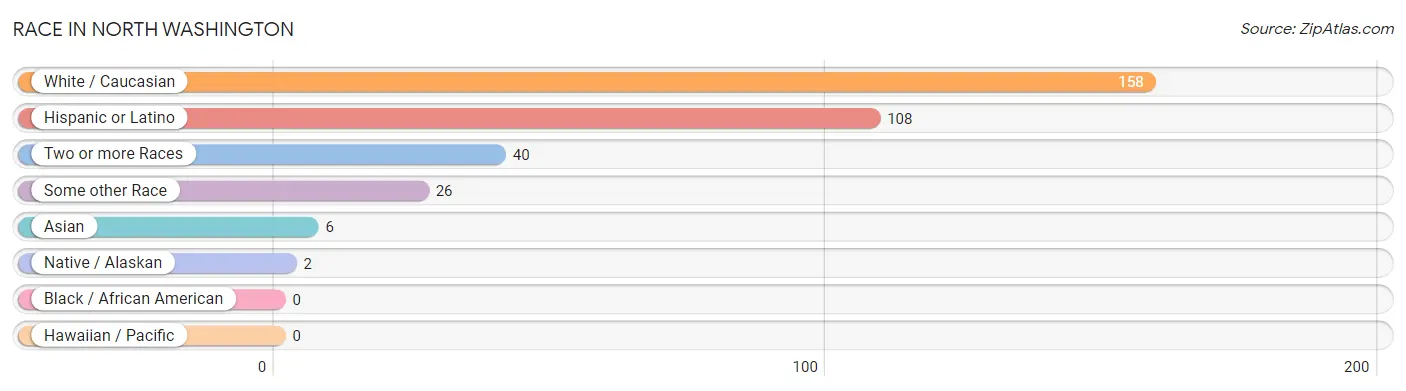
| Race | # Population | % Population |
| Asian | 6 | 2.6% |
| Black / African American | 0 | 0.0% |
| Hawaiian / Pacific | 0 | 0.0% |
| Hispanic or Latino | 108 | 46.6% |
| Native / Alaskan | 2 | 0.9% |
| White / Caucasian | 158 | 68.1% |
| Two or more Races | 40 | 17.2% |
| Some other Race | 26 | 11.2% |
| Total | 232 | 100.0% |
Ancestry in North Washington
The most populous ancestries reported in North Washington are Irish (74 | 31.9%), Mexican (74 | 31.9%), English (46 | 19.8%), Italian (21 | 9.0%), and Spanish American (14 | 6.0%), together accounting for 98.7% of all North Washington residents.
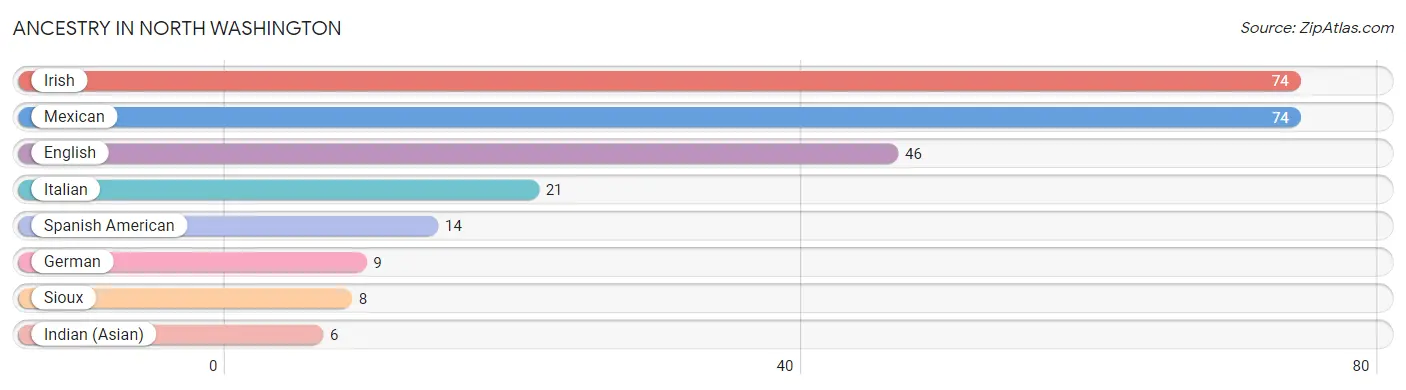
| Ancestry | # Population | % Population |
| English | 46 | 19.8% |
| German | 9 | 3.9% |
| Indian (Asian) | 6 | 2.6% |
| Irish | 74 | 31.9% |
| Italian | 21 | 9.0% |
| Mexican | 74 | 31.9% |
| Sioux | 8 | 3.5% |
| Spanish American | 14 | 6.0% | View All 8 Rows |
Immigrants in North Washington
The most numerous immigrant groups reported in North Washington came from Central America (26 | 11.2%), Latin America (26 | 11.2%), Mexico (26 | 11.2%), Asia (6 | 2.6%), and China (6 | 2.6%), together accounting for 38.8% of all North Washington residents.
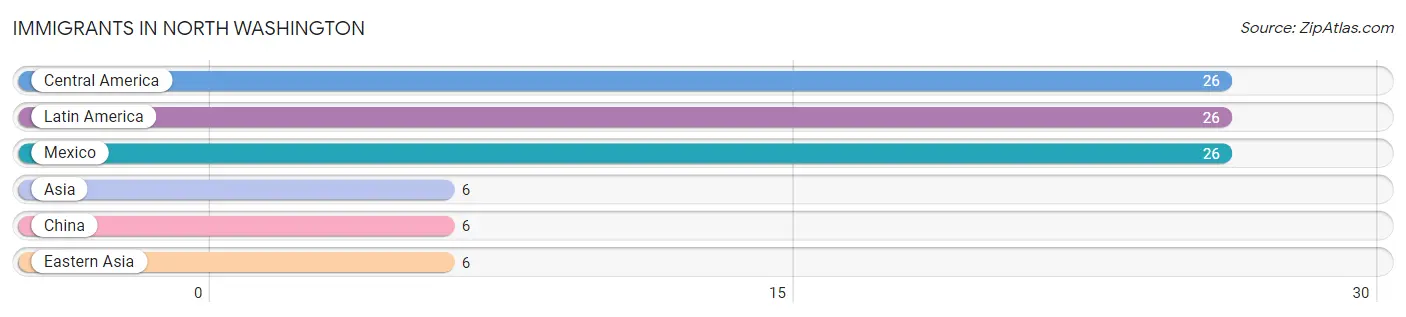
| Immigration Origin | # Population | % Population |
| Asia | 6 | 2.6% |
| Central America | 26 | 11.2% |
| China | 6 | 2.6% |
| Eastern Asia | 6 | 2.6% |
| Latin America | 26 | 11.2% |
| Mexico | 26 | 11.2% | View All 6 Rows |
Sex and Age in North Washington
Sex and Age in North Washington
The most populous age groups in North Washington are 55 to 59 Years (70 | 46.7%) for men and 65 to 69 Years (35 | 42.7%) for women.
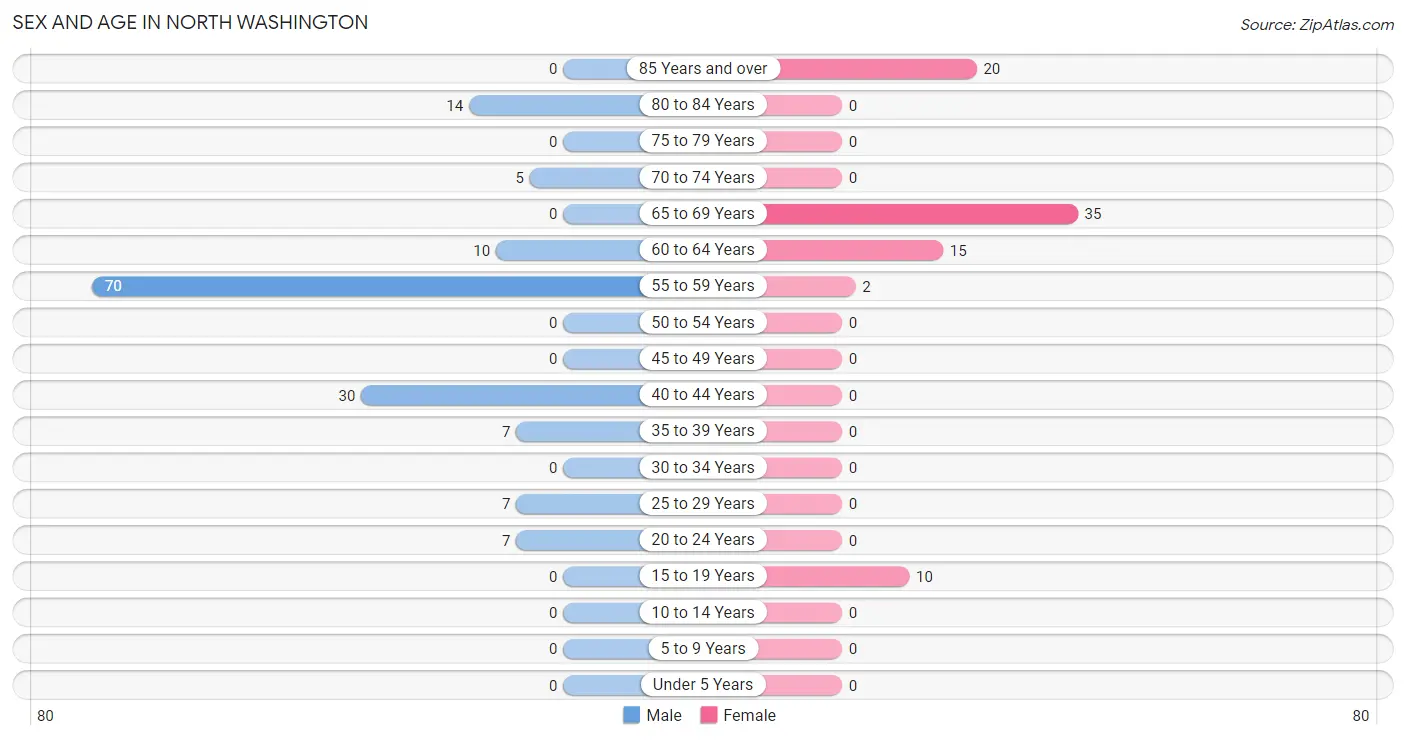
| Age Bracket | Male | Female |
| Under 5 Years | 0 (0.0%) | 0 (0.0%) |
| 5 to 9 Years | 0 (0.0%) | 0 (0.0%) |
| 10 to 14 Years | 0 (0.0%) | 0 (0.0%) |
| 15 to 19 Years | 0 (0.0%) | 10 (12.2%) |
| 20 to 24 Years | 7 (4.7%) | 0 (0.0%) |
| 25 to 29 Years | 7 (4.7%) | 0 (0.0%) |
| 30 to 34 Years | 0 (0.0%) | 0 (0.0%) |
| 35 to 39 Years | 7 (4.7%) | 0 (0.0%) |
| 40 to 44 Years | 30 (20.0%) | 0 (0.0%) |
| 45 to 49 Years | 0 (0.0%) | 0 (0.0%) |
| 50 to 54 Years | 0 (0.0%) | 0 (0.0%) |
| 55 to 59 Years | 70 (46.7%) | 2 (2.4%) |
| 60 to 64 Years | 10 (6.7%) | 15 (18.3%) |
| 65 to 69 Years | 0 (0.0%) | 35 (42.7%) |
| 70 to 74 Years | 5 (3.3%) | 0 (0.0%) |
| 75 to 79 Years | 0 (0.0%) | 0 (0.0%) |
| 80 to 84 Years | 14 (9.3%) | 0 (0.0%) |
| 85 Years and over | 0 (0.0%) | 20 (24.4%) |
| Total | 150 (100.0%) | 82 (100.0%) |
Families and Households in North Washington
Median Family Size in North Washington
The median family size in North Washington is 1.97 persons per family, with single female/mother families (9 | 31.0%) accounting for the largest median family size of 2.11 persons per family. On the other hand, married-couple families (10 | 34.5%) represent the smallest median family size with 1.80 persons per family.
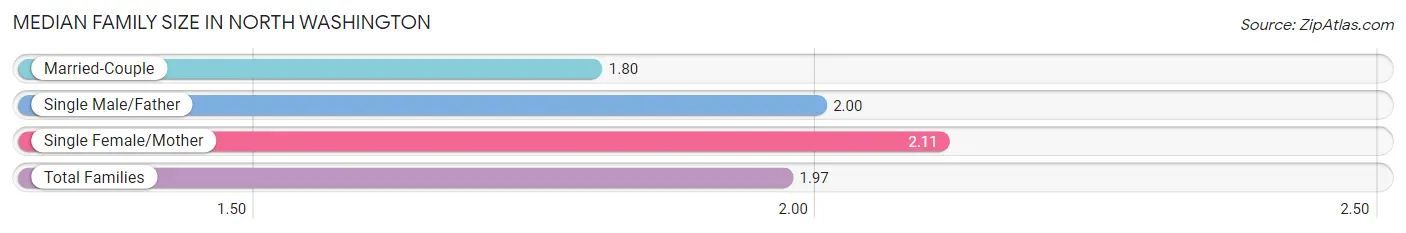
| Family Type | # Families | Family Size |
| Married-Couple | 10 (34.5%) | 1.80 |
| Single Male/Father | 10 (34.5%) | 2.00 |
| Single Female/Mother | 9 (31.0%) | 2.11 |
| Total Families | 29 (100.0%) | 1.97 |
Median Household Size in North Washington
The median household size in North Washington is 1.19 persons per household, with single female/mother households (9 | 5.1%) accounting for the largest median household size of 2.11 persons per household. non-family households (148 | 83.6%) represent the smallest median household size with 1.04 persons per household.
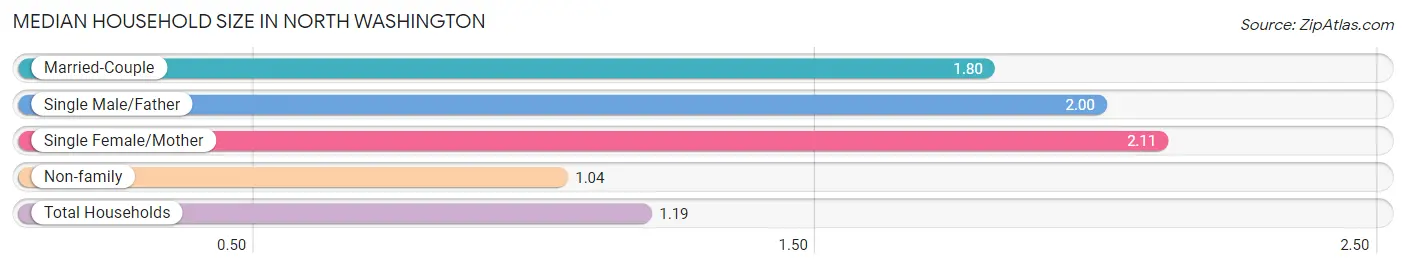
| Household Type | # Households | Household Size |
| Married-Couple | 10 (5.7%) | 1.80 |
| Single Male/Father | 10 (5.7%) | 2.00 |
| Single Female/Mother | 9 (5.1%) | 2.11 |
| Non-family | 148 (83.6%) | 1.04 |
| Total Households | 177 (100.0%) | 1.19 |
Household Size by Marriage Status in North Washington
Out of a total of 177 households in North Washington, 29 (16.4%) are family households, while 148 (83.6%) are nonfamily households. The most numerous type of family households are 2-person households, comprising 19, and the most common type of nonfamily households are 1-person households, comprising 143.
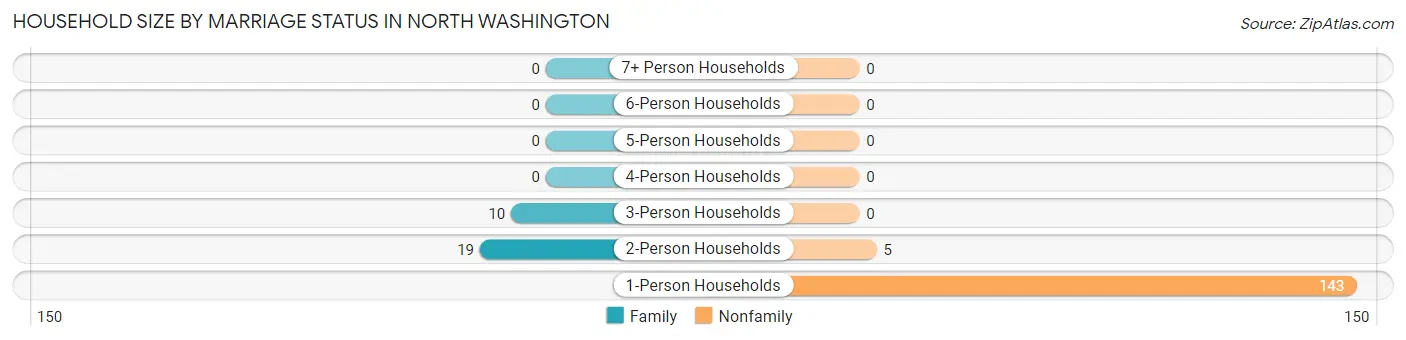
| Household Size | Family Households | Nonfamily Households |
| 1-Person Households | - | 143 (80.8%) |
| 2-Person Households | 19 (10.7%) | 5 (2.8%) |
| 3-Person Households | 10 (5.7%) | 0 (0.0%) |
| 4-Person Households | 0 (0.0%) | 0 (0.0%) |
| 5-Person Households | 0 (0.0%) | 0 (0.0%) |
| 6-Person Households | 0 (0.0%) | 0 (0.0%) |
| 7+ Person Households | 0 (0.0%) | 0 (0.0%) |
| Total | 29 (16.4%) | 148 (83.6%) |
Female Fertility in North Washington
Fertility by Age in North Washington
| Age Bracket | Women with Births | Births / 1,000 Women |
| 15 to 19 years | 0 (0.0%) | 0.0 |
| 20 to 34 years | 0 (0.0%) | 0.0 |
| 35 to 50 years | 0 (0.0%) | 0.0 |
| Total | 0 (0.0%) | 0.0 |
Fertility by Age by Marriage Status in North Washington
| Age Bracket | Married | Unmarried |
| 15 to 19 years | 0 (0.0%) | 0 (0.0%) |
| 20 to 34 years | 0 (0.0%) | 0 (0.0%) |
| 35 to 50 years | 0 (0.0%) | 0 (0.0%) |
| Total | 0 (0.0%) | 0 (0.0%) |
Fertility by Education in North Washington
| Educational Attainment | Women with Births | Births / 1,000 Women |
| Less than High School | 0 (0.0%) | 0.0 |
| High School Diploma | 0 (0.0%) | 0.0 |
| College or Associate's Degree | 0 (0.0%) | 0.0 |
| Bachelor's Degree | 0 (0.0%) | 0.0 |
| Graduate Degree | 0 (0.0%) | 0.0 |
| Total | 0 (0.0%) | 0.0 |
Fertility by Education by Marriage Status in North Washington
| Educational Attainment | Married | Unmarried |
| Less than High School | 0 (0.0%) | 0 (0.0%) |
| High School Diploma | 0 (0.0%) | 0 (0.0%) |
| College or Associate's Degree | 0 (0.0%) | 0 (0.0%) |
| Bachelor's Degree | 0 (0.0%) | 0 (0.0%) |
| Graduate Degree | 0 (0.0%) | 0 (0.0%) |
| Total | 0 (0.0%) | 0 (0.0%) |
Employment Characteristics in North Washington
Employment by Class of Employer in North Washington
Among the 135 employed individuals in North Washington, private company employees (129 | 95.6%), and not-for-profit organizations (6 | 4.4%) make up the most common classes of employment.
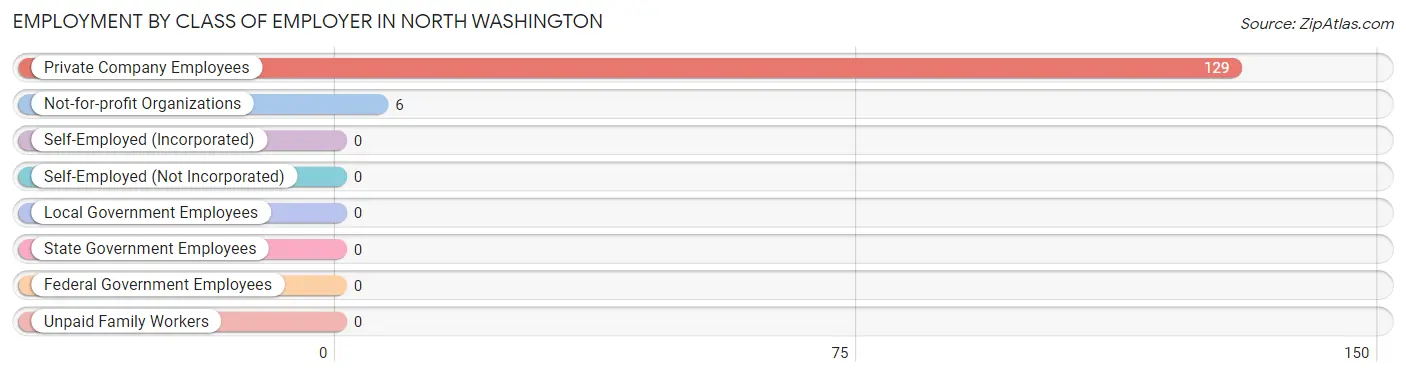
| Employer Class | # Employees | % Employees |
| Private Company Employees | 129 | 95.6% |
| Self-Employed (Incorporated) | 0 | 0.0% |
| Self-Employed (Not Incorporated) | 0 | 0.0% |
| Not-for-profit Organizations | 6 | 4.4% |
| Local Government Employees | 0 | 0.0% |
| State Government Employees | 0 | 0.0% |
| Federal Government Employees | 0 | 0.0% |
| Unpaid Family Workers | 0 | 0.0% |
| Total | 135 | 100.0% |
Employment Status by Age in North Washington
According to the labor force statistics for North Washington, out of the total population over 16 years of age (232), 62.5% or 145 individuals are in the labor force, with 6.9% or 10 of them unemployed. The age group with the highest labor force participation rate is 16 to 19 years, with 100.0% or 10 individuals in the labor force. Within the labor force, the 16 to 19 years age range has the highest percentage of unemployed individuals, with 100.0% or 10 of them being unemployed.
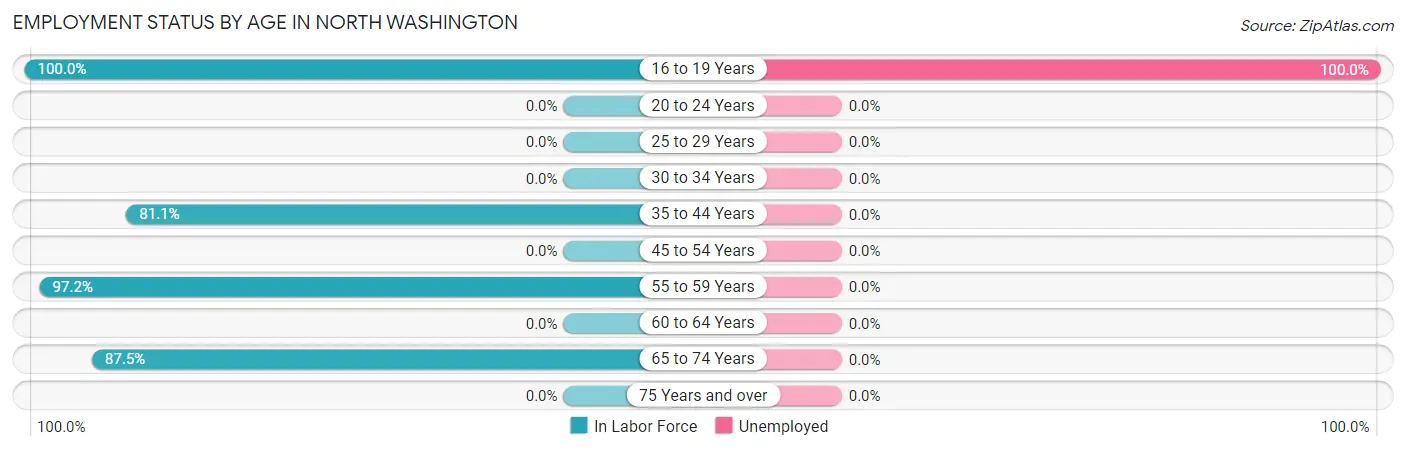
| Age Bracket | In Labor Force | Unemployed |
| 16 to 19 Years | 10 (100.0%) | 10 (100.0%) |
| 20 to 24 Years | 0 (0.0%) | 0 (0.0%) |
| 25 to 29 Years | 0 (0.0%) | 0 (0.0%) |
| 30 to 34 Years | 0 (0.0%) | 0 (0.0%) |
| 35 to 44 Years | 30 (81.1%) | 0 (0.0%) |
| 45 to 54 Years | 0 (0.0%) | 0 (0.0%) |
| 55 to 59 Years | 70 (97.2%) | 0 (0.0%) |
| 60 to 64 Years | 0 (0.0%) | 0 (0.0%) |
| 65 to 74 Years | 35 (87.5%) | 0 (0.0%) |
| 75 Years and over | 0 (0.0%) | 0 (0.0%) |
| Total | 145 (62.5%) | 10 (6.9%) |
Employment Status by Educational Attainment in North Washington
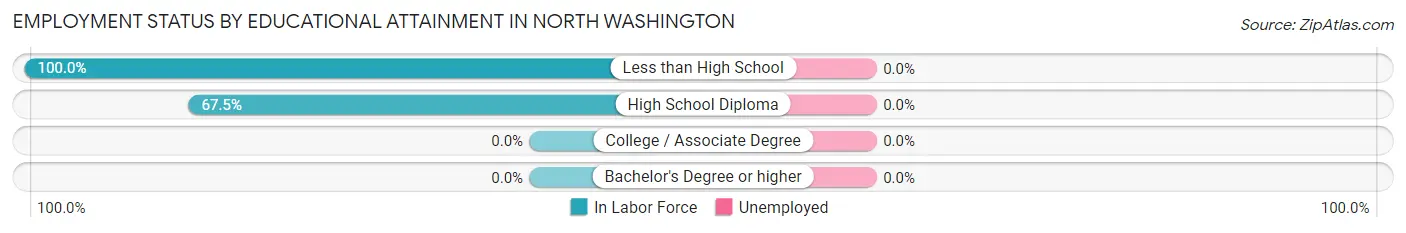
| Educational Attainment | In Labor Force | Unemployed |
| Less than High School | 46 (100.0%) | 0 (0.0%) |
| High School Diploma | 54 (67.5%) | 0 (0.0%) |
| College / Associate Degree | 0 (0.0%) | 0 (0.0%) |
| Bachelor's Degree or higher | 0 (0.0%) | 0 (0.0%) |
| Total | 100 (70.9%) | 0 (0.0%) |
Employment Occupations by Sex in North Washington
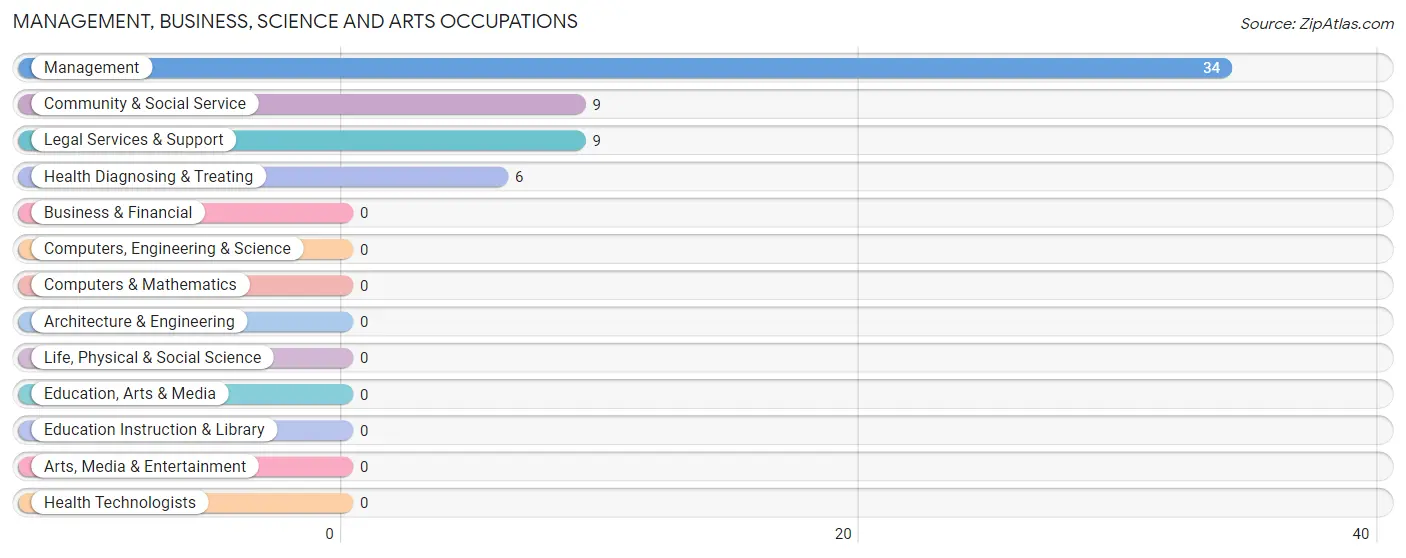
Management, Business, Science and Arts Occupations
The most common Management, Business, Science and Arts occupations in North Washington are Management (34 | 25.2%), Community & Social Service (9 | 6.7%), Legal Services & Support (9 | 6.7%), and Health Diagnosing & Treating (6 | 4.4%).
Management, Business, Science and Arts Occupations by Sex
Within the Management, Business, Science and Arts occupations in North Washington, the most male-oriented occupations are Management (100.0%), and Health Diagnosing & Treating (100.0%), while the most female-oriented occupations are Community & Social Service (100.0%), and Legal Services & Support (100.0%).
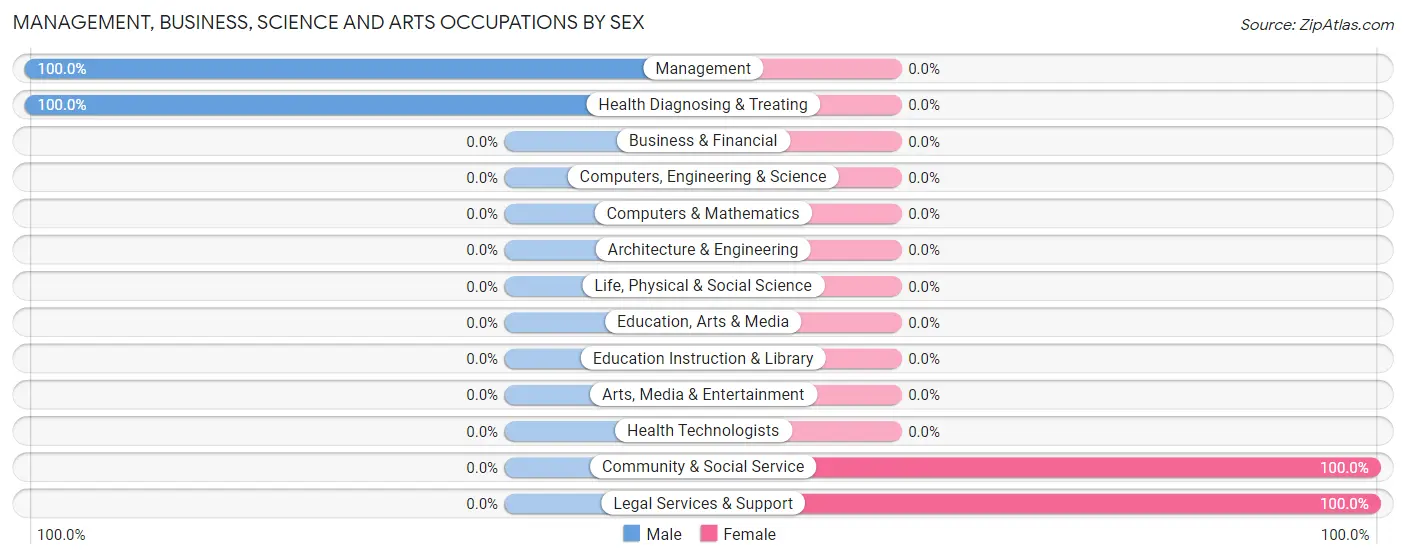
| Occupation | Male | Female |
| Management | 34 (100.0%) | 0 (0.0%) |
| Business & Financial | 0 (0.0%) | 0 (0.0%) |
| Computers, Engineering & Science | 0 (0.0%) | 0 (0.0%) |
| Computers & Mathematics | 0 (0.0%) | 0 (0.0%) |
| Architecture & Engineering | 0 (0.0%) | 0 (0.0%) |
| Life, Physical & Social Science | 0 (0.0%) | 0 (0.0%) |
| Community & Social Service | 0 (0.0%) | 9 (100.0%) |
| Education, Arts & Media | 0 (0.0%) | 0 (0.0%) |
| Legal Services & Support | 0 (0.0%) | 9 (100.0%) |
| Education Instruction & Library | 0 (0.0%) | 0 (0.0%) |
| Arts, Media & Entertainment | 0 (0.0%) | 0 (0.0%) |
| Health Diagnosing & Treating | 6 (100.0%) | 0 (0.0%) |
| Health Technologists | 0 (0.0%) | 0 (0.0%) |
| Total (Category) | 40 (81.6%) | 9 (18.4%) |
| Total (Overall) | 100 (74.1%) | 35 (25.9%) |
Services Occupations
Services Occupations by Sex
| Occupation | Male | Female |
| Healthcare Support | 0 (0.0%) | 0 (0.0%) |
| Security & Protection | 0 (0.0%) | 0 (0.0%) |
| Firefighting & Prevention | 0 (0.0%) | 0 (0.0%) |
| Law Enforcement | 0 (0.0%) | 0 (0.0%) |
| Food Preparation & Serving | 0 (0.0%) | 0 (0.0%) |
| Cleaning & Maintenance | 0 (0.0%) | 0 (0.0%) |
| Personal Care & Service | 0 (0.0%) | 0 (0.0%) |
| Total (Category) | 0 (0.0%) | 0 (0.0%) |
| Total (Overall) | 100 (74.1%) | 35 (25.9%) |
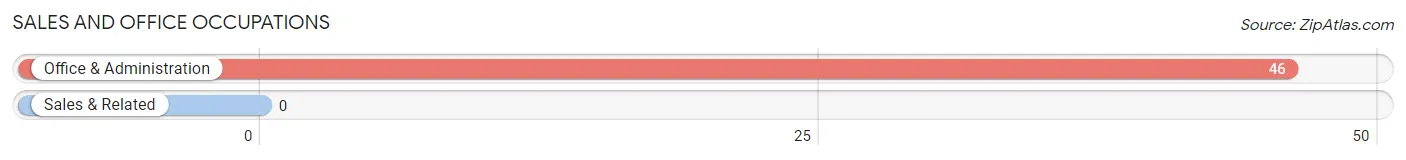
Sales and Office Occupations
The most common Sales and Office occupations in North Washington are , and Office & Administration (46 | 34.1%).
Sales and Office Occupations by Sex
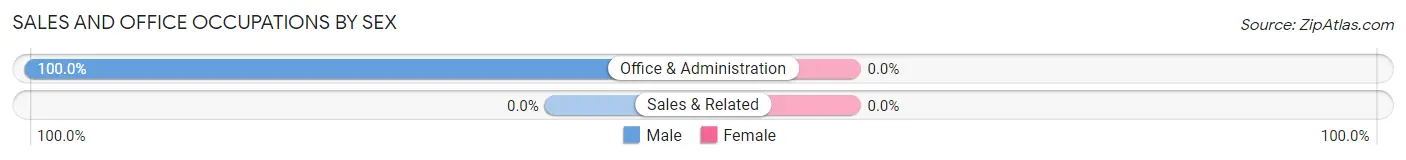
| Occupation | Male | Female |
| Sales & Related | 0 (0.0%) | 0 (0.0%) |
| Office & Administration | 46 (100.0%) | 0 (0.0%) |
| Total (Category) | 46 (100.0%) | 0 (0.0%) |
| Total (Overall) | 100 (74.1%) | 35 (25.9%) |
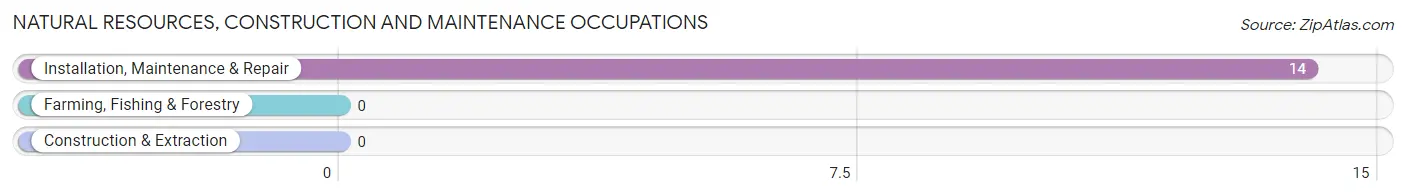
Natural Resources, Construction and Maintenance Occupations
The most common Natural Resources, Construction and Maintenance occupations in North Washington are , and Installation, Maintenance & Repair (14 | 10.4%).
Natural Resources, Construction and Maintenance Occupations by Sex
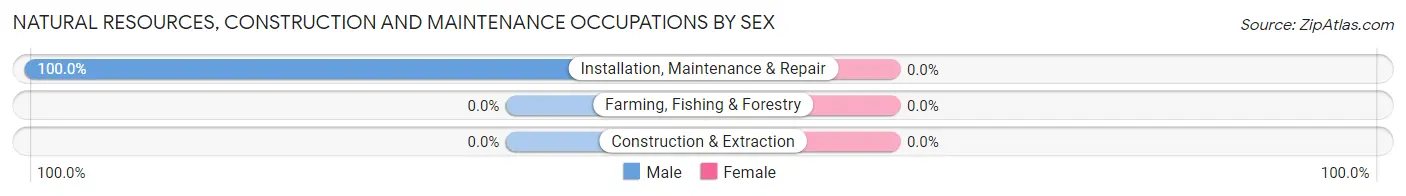
| Occupation | Male | Female |
| Farming, Fishing & Forestry | 0 (0.0%) | 0 (0.0%) |
| Construction & Extraction | 0 (0.0%) | 0 (0.0%) |
| Installation, Maintenance & Repair | 14 (100.0%) | 0 (0.0%) |
| Total (Category) | 14 (100.0%) | 0 (0.0%) |
| Total (Overall) | 100 (74.1%) | 35 (25.9%) |
Production, Transportation and Moving Occupations
The most common Production, Transportation and Moving occupations in North Washington are , and Material Moving (26 | 19.3%).
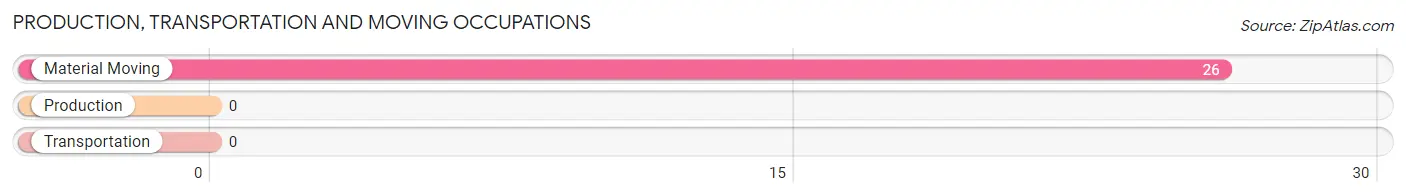
Production, Transportation and Moving Occupations by Sex
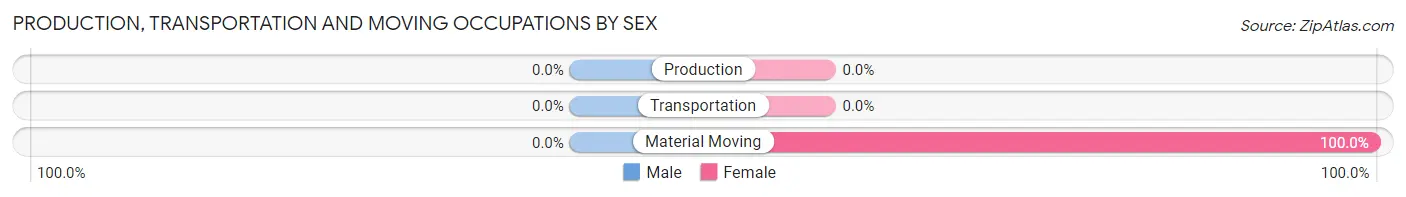
| Occupation | Male | Female |
| Production | 0 (0.0%) | 0 (0.0%) |
| Transportation | 0 (0.0%) | 0 (0.0%) |
| Material Moving | 0 (0.0%) | 26 (100.0%) |
| Total (Category) | 0 (0.0%) | 26 (100.0%) |
| Total (Overall) | 100 (74.1%) | 35 (25.9%) |
Employment Industries by Sex in North Washington
Employment Industries in North Washington
The major employment industries in North Washington include Transportation & Warehousing (46 | 34.1%), Retail Trade (26 | 19.3%), Manufacturing (24 | 17.8%), Construction (14 | 10.4%), and Information (10 | 7.4%).
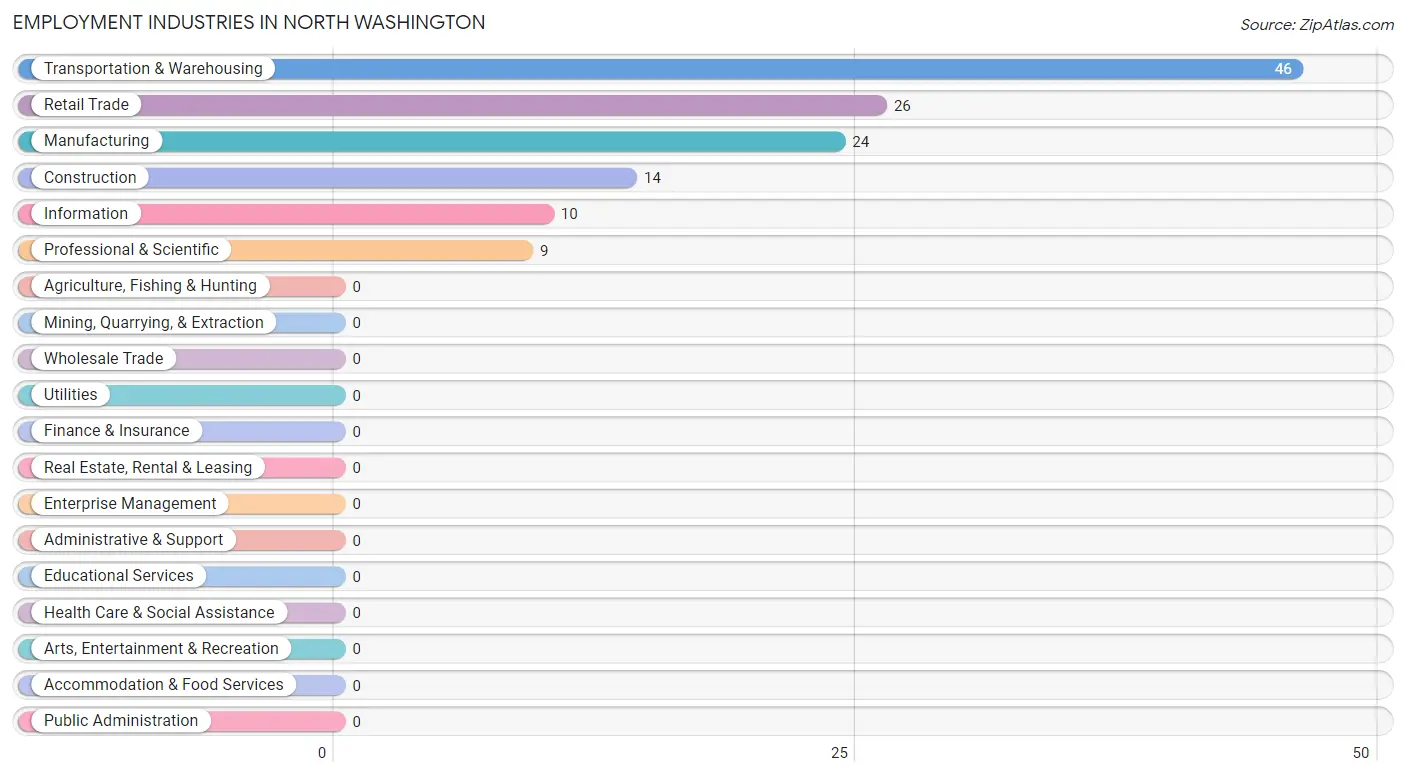
Employment Industries by Sex in North Washington
The North Washington industries that see more men than women are Construction (100.0%), Manufacturing (100.0%), and Transportation & Warehousing (100.0%), whereas the industries that tend to have a higher number of women are Retail Trade (100.0%), and Professional & Scientific (100.0%).
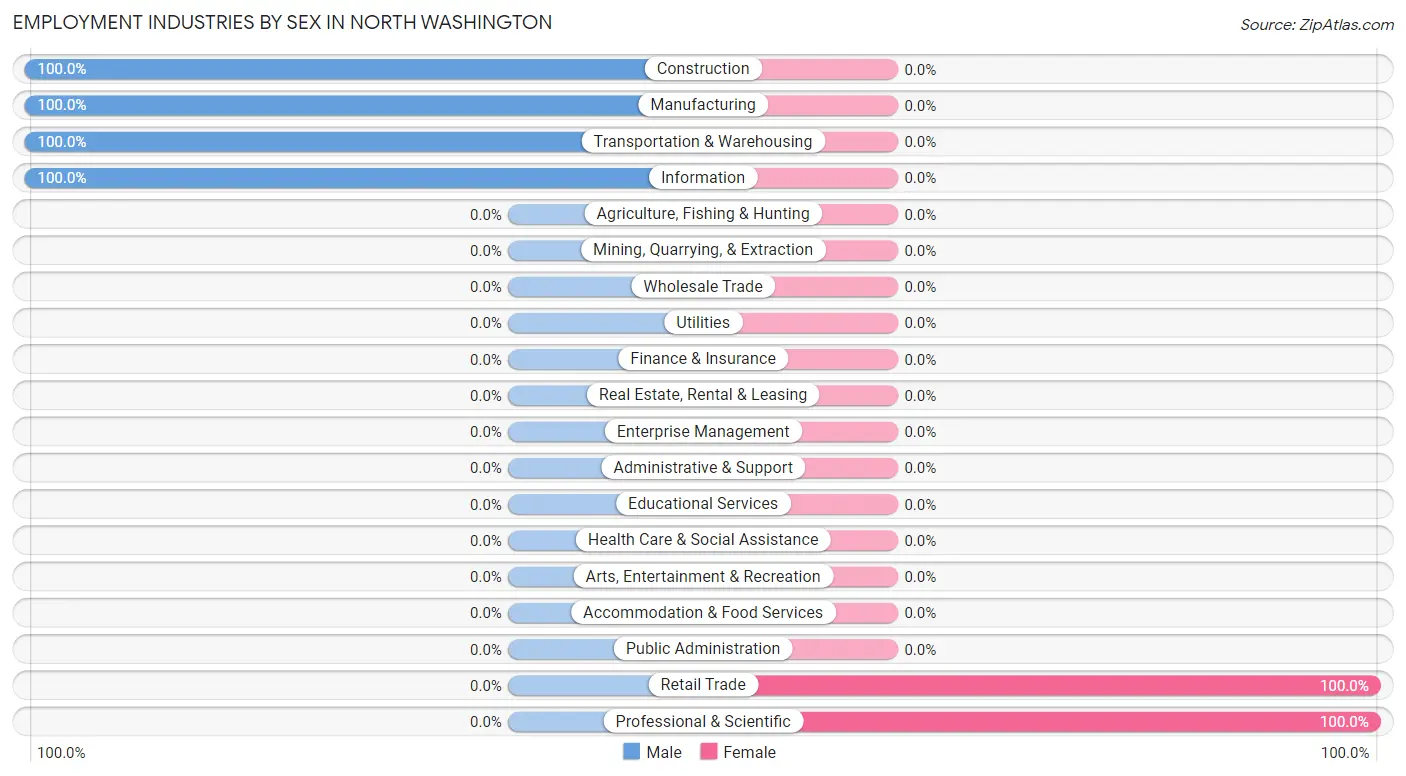
| Industry | Male | Female |
| Agriculture, Fishing & Hunting | 0 (0.0%) | 0 (0.0%) |
| Mining, Quarrying, & Extraction | 0 (0.0%) | 0 (0.0%) |
| Construction | 14 (100.0%) | 0 (0.0%) |
| Manufacturing | 24 (100.0%) | 0 (0.0%) |
| Wholesale Trade | 0 (0.0%) | 0 (0.0%) |
| Retail Trade | 0 (0.0%) | 26 (100.0%) |
| Transportation & Warehousing | 46 (100.0%) | 0 (0.0%) |
| Utilities | 0 (0.0%) | 0 (0.0%) |
| Information | 10 (100.0%) | 0 (0.0%) |
| Finance & Insurance | 0 (0.0%) | 0 (0.0%) |
| Real Estate, Rental & Leasing | 0 (0.0%) | 0 (0.0%) |
| Professional & Scientific | 0 (0.0%) | 9 (100.0%) |
| Enterprise Management | 0 (0.0%) | 0 (0.0%) |
| Administrative & Support | 0 (0.0%) | 0 (0.0%) |
| Educational Services | 0 (0.0%) | 0 (0.0%) |
| Health Care & Social Assistance | 0 (0.0%) | 0 (0.0%) |
| Arts, Entertainment & Recreation | 0 (0.0%) | 0 (0.0%) |
| Accommodation & Food Services | 0 (0.0%) | 0 (0.0%) |
| Public Administration | 0 (0.0%) | 0 (0.0%) |
| Total | 100 (74.1%) | 35 (25.9%) |
Education in North Washington
School Enrollment in North Washington
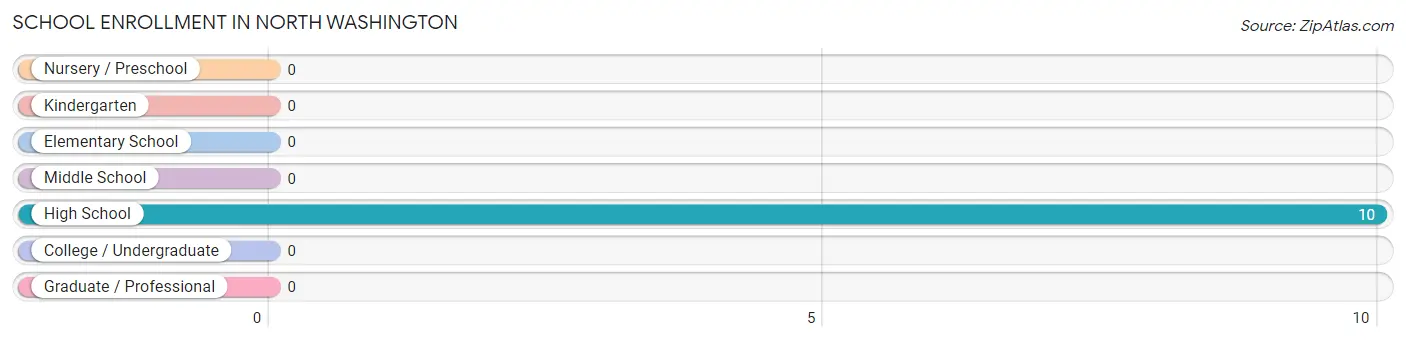
| School Level | # Students | % Students |
| Nursery / Preschool | 0 | 0.0% |
| Kindergarten | 0 | 0.0% |
| Elementary School | 0 | 0.0% |
| Middle School | 0 | 0.0% |
| High School | 10 | 100.0% |
| College / Undergraduate | 0 | 0.0% |
| Graduate / Professional | 0 | 0.0% |
| Total | 10 | 100.0% |
School Enrollment by Age by Funding Source in North Washington
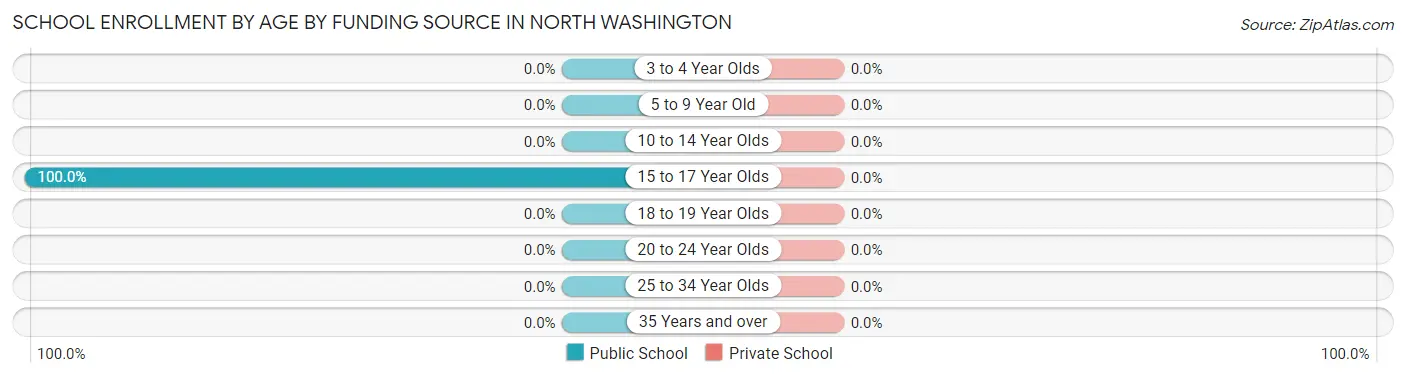
| Age Bracket | Public School | Private School |
| 3 to 4 Year Olds | 0 (0.0%) | 0 (0.0%) |
| 5 to 9 Year Old | 0 (0.0%) | 0 (0.0%) |
| 10 to 14 Year Olds | 0 (0.0%) | 0 (0.0%) |
| 15 to 17 Year Olds | 10 (100.0%) | 0 (0.0%) |
| 18 to 19 Year Olds | 0 (0.0%) | 0 (0.0%) |
| 20 to 24 Year Olds | 0 (0.0%) | 0 (0.0%) |
| 25 to 34 Year Olds | 0 (0.0%) | 0 (0.0%) |
| 35 Years and over | 0 (0.0%) | 0 (0.0%) |
| Total | 10 (100.0%) | 0 (0.0%) |
Educational Attainment by Field of Study in North Washington
Literature & languages (6 | 54.5%), and bio, nature & agricultural (5 | 45.5%) are the most common fields of study among 11 individuals in North Washington who have obtained a bachelor's degree or higher.
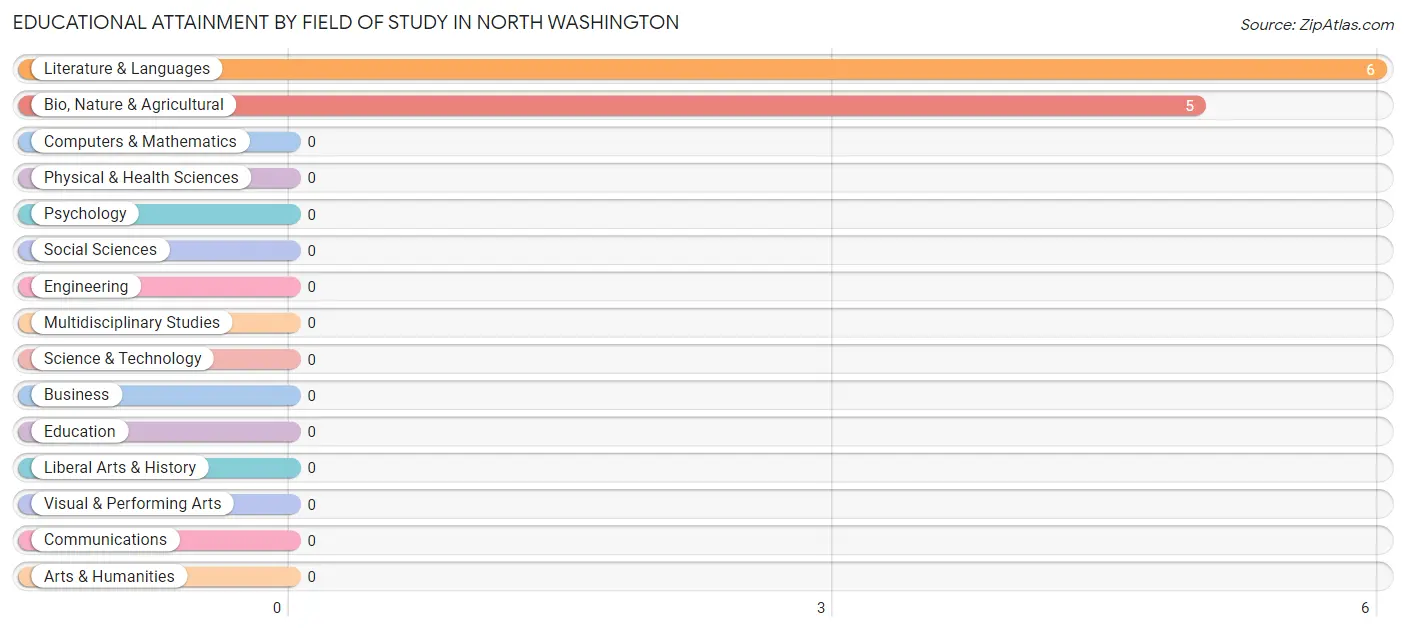
| Field of Study | # Graduates | % Graduates |
| Computers & Mathematics | 0 | 0.0% |
| Bio, Nature & Agricultural | 5 | 45.5% |
| Physical & Health Sciences | 0 | 0.0% |
| Psychology | 0 | 0.0% |
| Social Sciences | 0 | 0.0% |
| Engineering | 0 | 0.0% |
| Multidisciplinary Studies | 0 | 0.0% |
| Science & Technology | 0 | 0.0% |
| Business | 0 | 0.0% |
| Education | 0 | 0.0% |
| Literature & Languages | 6 | 54.5% |
| Liberal Arts & History | 0 | 0.0% |
| Visual & Performing Arts | 0 | 0.0% |
| Communications | 0 | 0.0% |
| Arts & Humanities | 0 | 0.0% |
| Total | 11 | 100.0% |
Transportation & Commute in North Washington
Vehicle Availability by Sex in North Washington
The most prevalent vehicle ownership categories in North Washington are males with 1 vehicle (84, accounting for 84.0%) and females with 1 vehicle (35, making up 240.0%).
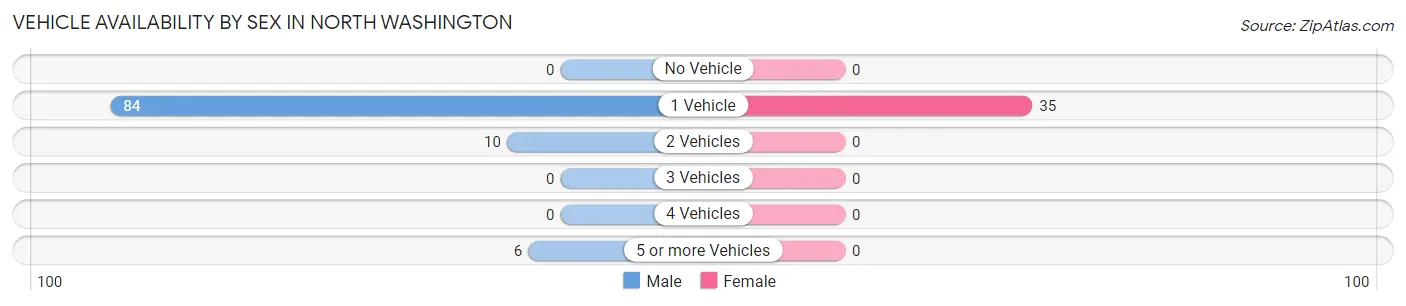
| Vehicles Available | Male | Female |
| No Vehicle | 0 (0.0%) | 0 (0.0%) |
| 1 Vehicle | 84 (84.0%) | 35 (100.0%) |
| 2 Vehicles | 10 (10.0%) | 0 (0.0%) |
| 3 Vehicles | 0 (0.0%) | 0 (0.0%) |
| 4 Vehicles | 0 (0.0%) | 0 (0.0%) |
| 5 or more Vehicles | 6 (6.0%) | 0 (0.0%) |
| Total | 100 (100.0%) | 35 (100.0%) |
Commute Time in North Washington
The most frequently occuring commute durations in North Washington are 15 to 19 minutes (48 commuters, 35.6%), 10 to 14 minutes (46 commuters, 34.1%), and 20 to 24 minutes (26 commuters, 19.3%).
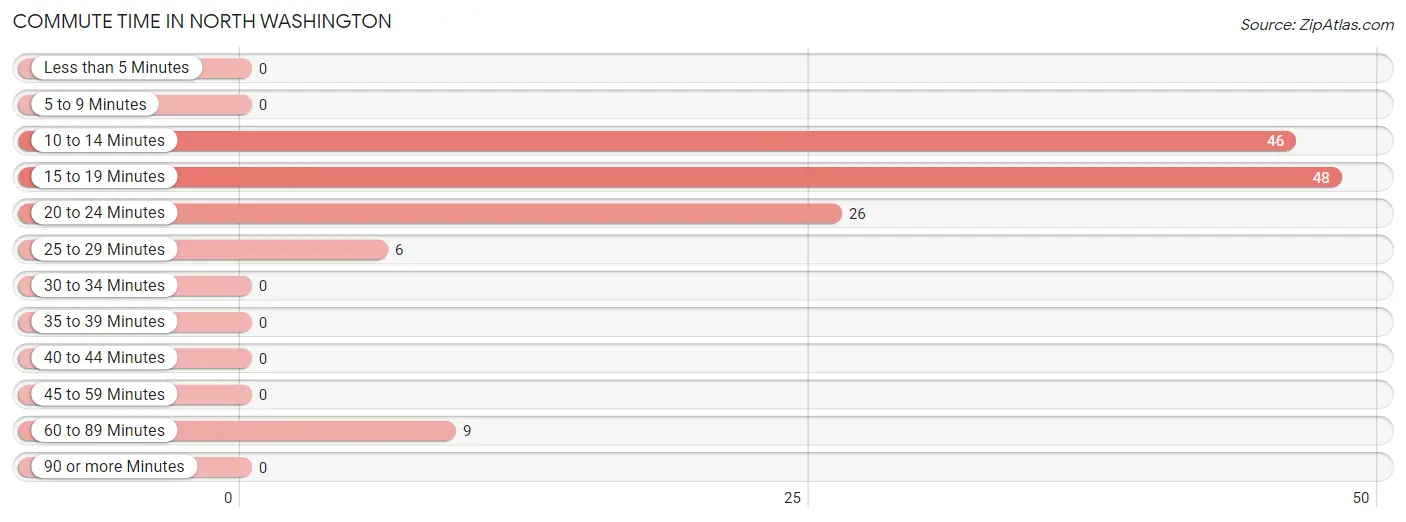
| Commute Time | # Commuters | % Commuters |
| Less than 5 Minutes | 0 | 0.0% |
| 5 to 9 Minutes | 0 | 0.0% |
| 10 to 14 Minutes | 46 | 34.1% |
| 15 to 19 Minutes | 48 | 35.6% |
| 20 to 24 Minutes | 26 | 19.3% |
| 25 to 29 Minutes | 6 | 4.4% |
| 30 to 34 Minutes | 0 | 0.0% |
| 35 to 39 Minutes | 0 | 0.0% |
| 40 to 44 Minutes | 0 | 0.0% |
| 45 to 59 Minutes | 0 | 0.0% |
| 60 to 89 Minutes | 9 | 6.7% |
| 90 or more Minutes | 0 | 0.0% |
Commute Time by Sex in North Washington
The most common commute times in North Washington are 15 to 19 minutes (48 commuters, 48.0%) for males and 20 to 24 minutes (26 commuters, 74.3%) for females.
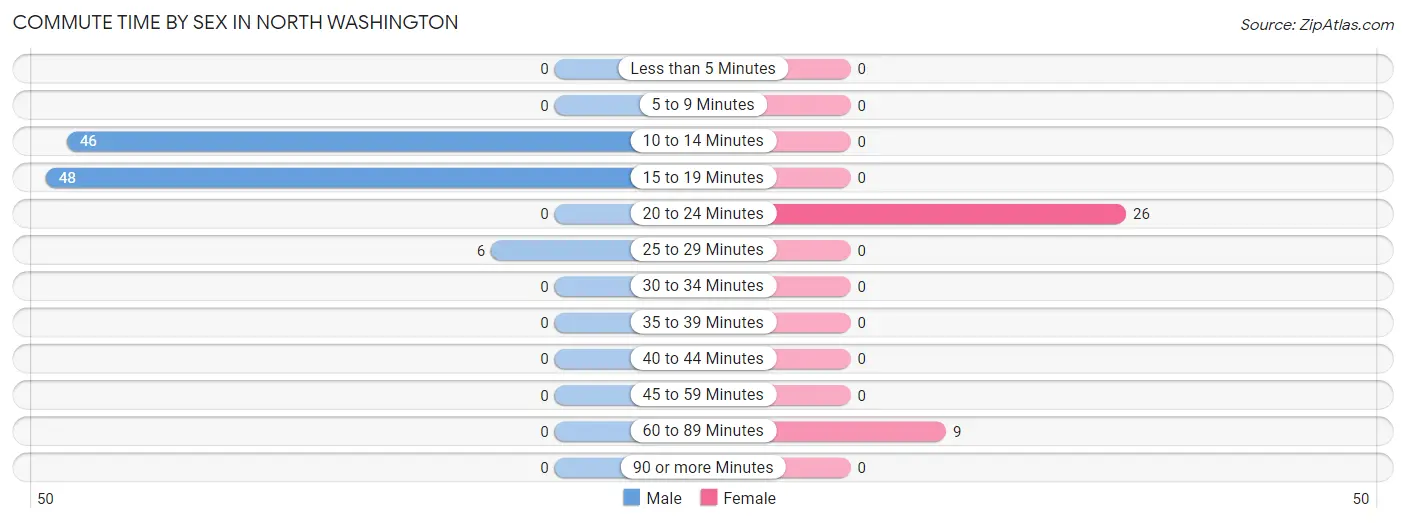
| Commute Time | Male | Female |
| Less than 5 Minutes | 0 (0.0%) | 0 (0.0%) |
| 5 to 9 Minutes | 0 (0.0%) | 0 (0.0%) |
| 10 to 14 Minutes | 46 (46.0%) | 0 (0.0%) |
| 15 to 19 Minutes | 48 (48.0%) | 0 (0.0%) |
| 20 to 24 Minutes | 0 (0.0%) | 26 (74.3%) |
| 25 to 29 Minutes | 6 (6.0%) | 0 (0.0%) |
| 30 to 34 Minutes | 0 (0.0%) | 0 (0.0%) |
| 35 to 39 Minutes | 0 (0.0%) | 0 (0.0%) |
| 40 to 44 Minutes | 0 (0.0%) | 0 (0.0%) |
| 45 to 59 Minutes | 0 (0.0%) | 0 (0.0%) |
| 60 to 89 Minutes | 0 (0.0%) | 9 (25.7%) |
| 90 or more Minutes | 0 (0.0%) | 0 (0.0%) |
Time of Departure to Work by Sex in North Washington
The most frequent times of departure to work in North Washington are 12:00 AM to 4:59 AM (56, 56.0%) for males and 12:00 PM to 3:59 PM (26, 74.3%) for females.
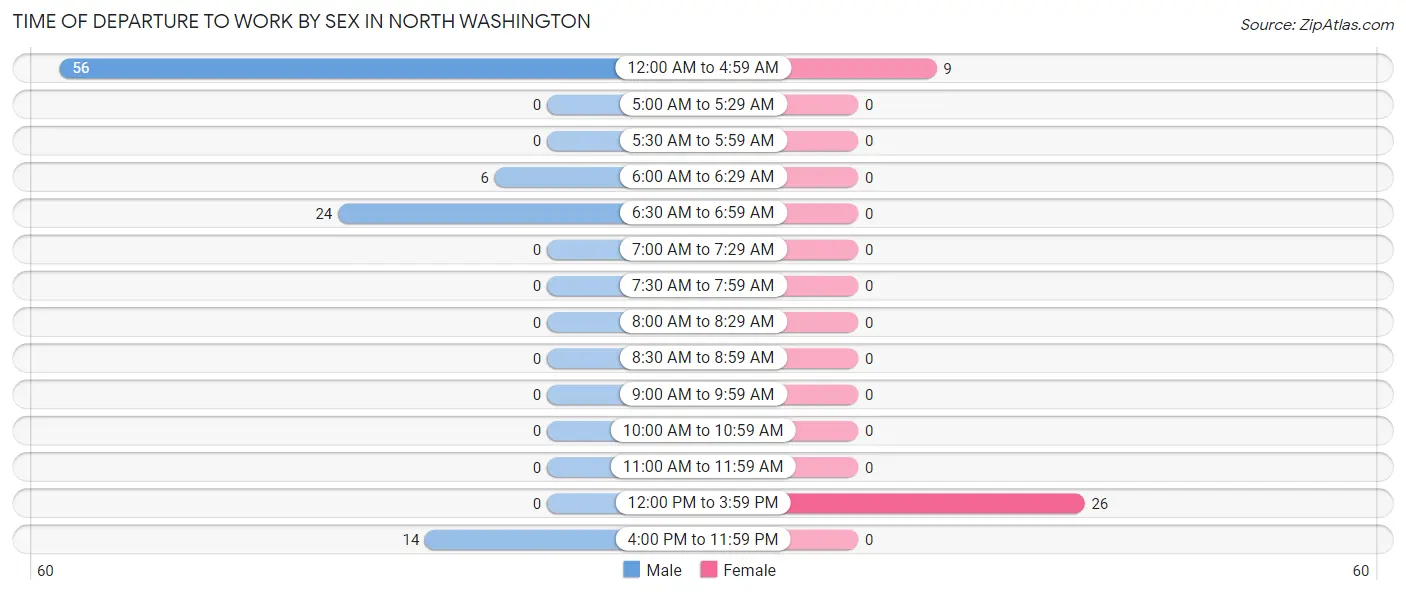
| Time of Departure | Male | Female |
| 12:00 AM to 4:59 AM | 56 (56.0%) | 9 (25.7%) |
| 5:00 AM to 5:29 AM | 0 (0.0%) | 0 (0.0%) |
| 5:30 AM to 5:59 AM | 0 (0.0%) | 0 (0.0%) |
| 6:00 AM to 6:29 AM | 6 (6.0%) | 0 (0.0%) |
| 6:30 AM to 6:59 AM | 24 (24.0%) | 0 (0.0%) |
| 7:00 AM to 7:29 AM | 0 (0.0%) | 0 (0.0%) |
| 7:30 AM to 7:59 AM | 0 (0.0%) | 0 (0.0%) |
| 8:00 AM to 8:29 AM | 0 (0.0%) | 0 (0.0%) |
| 8:30 AM to 8:59 AM | 0 (0.0%) | 0 (0.0%) |
| 9:00 AM to 9:59 AM | 0 (0.0%) | 0 (0.0%) |
| 10:00 AM to 10:59 AM | 0 (0.0%) | 0 (0.0%) |
| 11:00 AM to 11:59 AM | 0 (0.0%) | 0 (0.0%) |
| 12:00 PM to 3:59 PM | 0 (0.0%) | 26 (74.3%) |
| 4:00 PM to 11:59 PM | 14 (14.0%) | 0 (0.0%) |
| Total | 100 (100.0%) | 35 (100.0%) |
Housing Occupancy in North Washington
Occupancy by Ownership in North Washington
Of the total 177 dwellings in North Washington, owner-occupied units account for 108 (61.0%), while renter-occupied units make up 69 (39.0%).
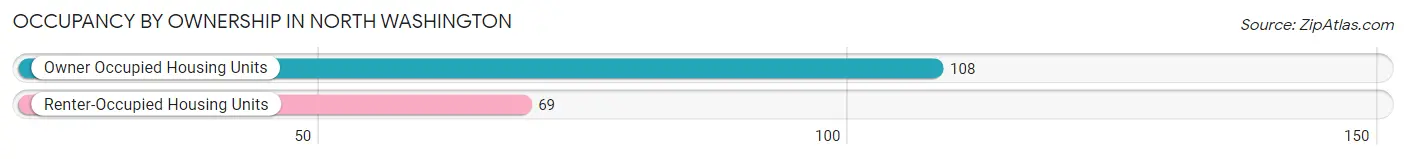
| Occupancy | # Housing Units | % Housing Units |
| Owner Occupied Housing Units | 108 | 61.0% |
| Renter-Occupied Housing Units | 69 | 39.0% |
| Total Occupied Housing Units | 177 | 100.0% |
Occupancy by Household Size in North Washington
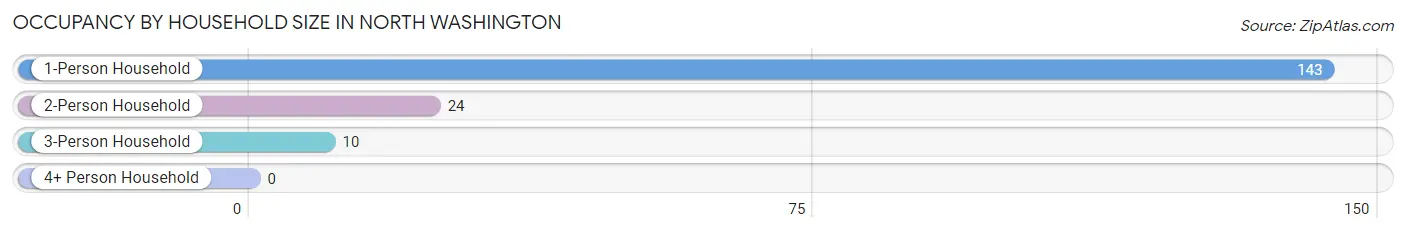
| Household Size | # Housing Units | % Housing Units |
| 1-Person Household | 143 | 80.8% |
| 2-Person Household | 24 | 13.6% |
| 3-Person Household | 10 | 5.7% |
| 4+ Person Household | 0 | 0.0% |
| Total Housing Units | 177 | 100.0% |
Occupancy by Ownership by Household Size in North Washington
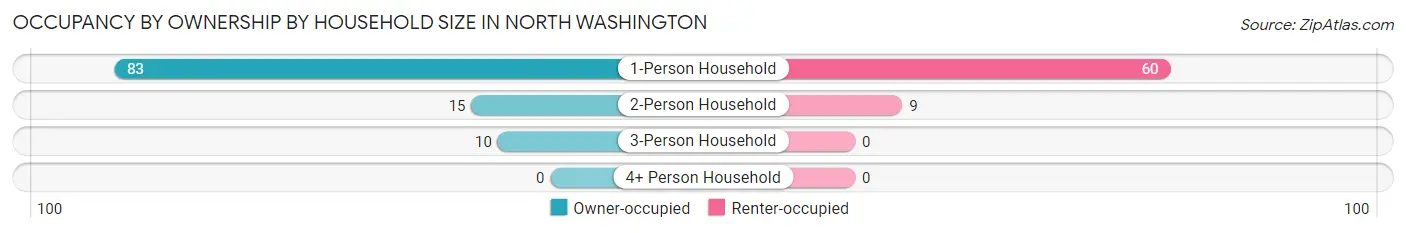
| Household Size | Owner-occupied | Renter-occupied |
| 1-Person Household | 83 (58.0%) | 60 (42.0%) |
| 2-Person Household | 15 (62.5%) | 9 (37.5%) |
| 3-Person Household | 10 (100.0%) | 0 (0.0%) |
| 4+ Person Household | 0 (0.0%) | 0 (0.0%) |
| Total Housing Units | 108 (61.0%) | 69 (39.0%) |
Occupancy by Educational Attainment in North Washington
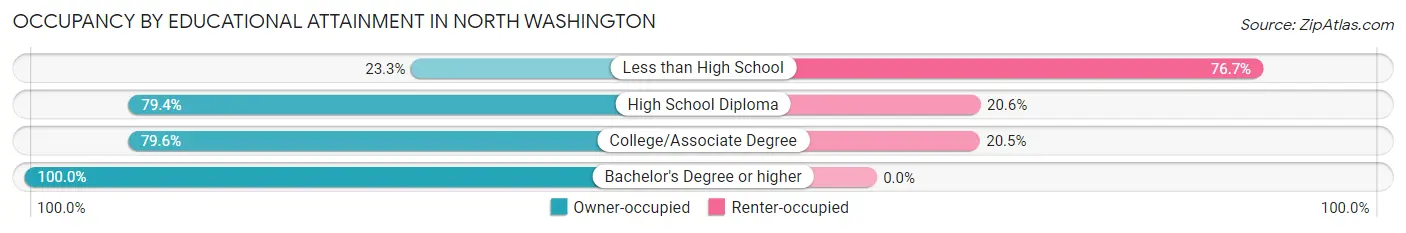
| Household Size | Owner-occupied | Renter-occupied |
| Less than High School | 14 (23.3%) | 46 (76.7%) |
| High School Diploma | 54 (79.4%) | 14 (20.6%) |
| College/Associate Degree | 35 (79.5%) | 9 (20.4%) |
| Bachelor's Degree or higher | 5 (100.0%) | 0 (0.0%) |
Occupancy by Age of Householder in North Washington
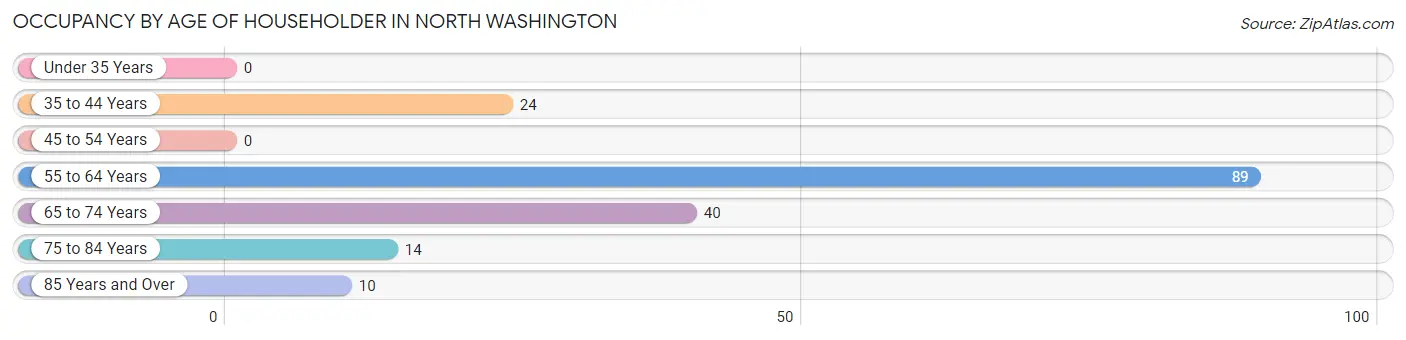
| Age Bracket | # Households | % Households |
| Under 35 Years | 0 | 0.0% |
| 35 to 44 Years | 24 | 13.6% |
| 45 to 54 Years | 0 | 0.0% |
| 55 to 64 Years | 89 | 50.3% |
| 65 to 74 Years | 40 | 22.6% |
| 75 to 84 Years | 14 | 7.9% |
| 85 Years and Over | 10 | 5.7% |
| Total | 177 | 100.0% |
Housing Finances in North Washington
Median Income by Occupancy in North Washington
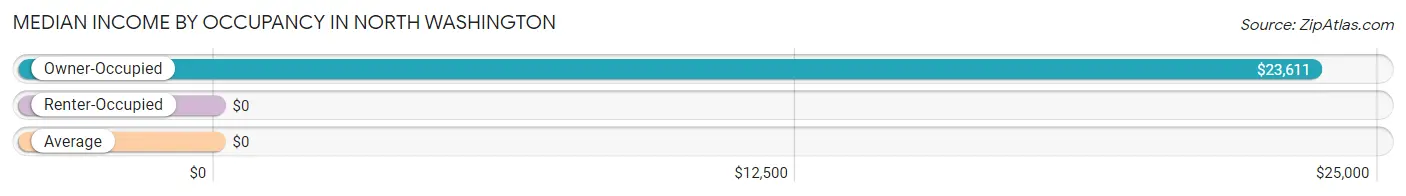
| Occupancy Type | # Households | Median Income |
| Owner-Occupied | 108 (61.0%) | $23,611 |
| Renter-Occupied | 69 (39.0%) | $0 |
| Average | 177 (100.0%) | $0 |
Occupancy by Householder Income Bracket in North Washington
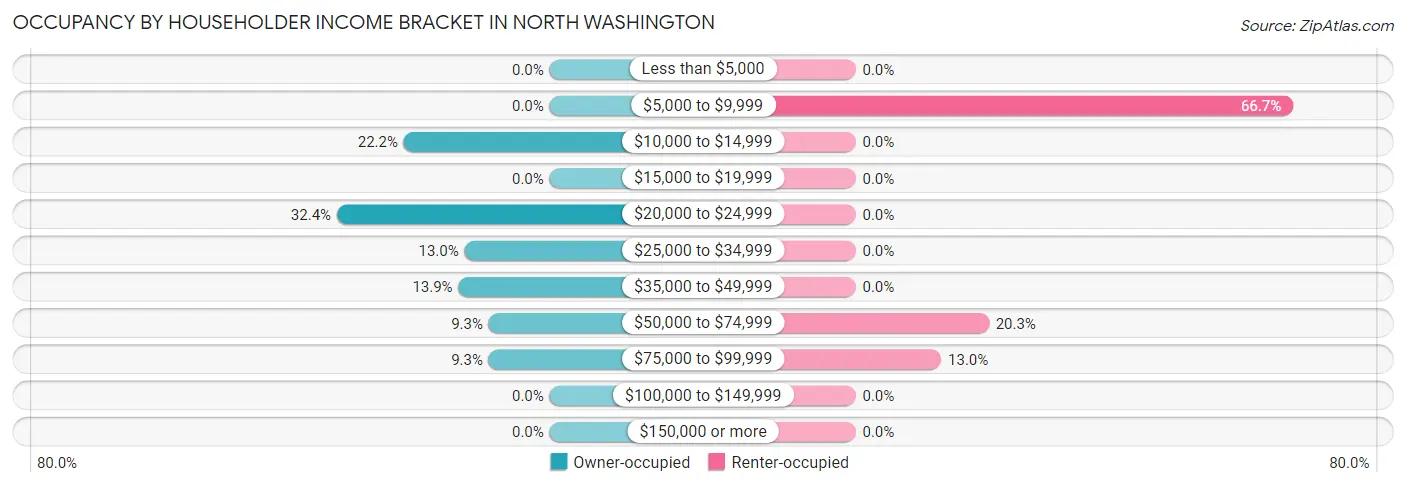
| Income Bracket | Owner-occupied | Renter-occupied |
| Less than $5,000 | 0 (0.0%) | 0 (0.0%) |
| $5,000 to $9,999 | 0 (0.0%) | 46 (66.7%) |
| $10,000 to $14,999 | 24 (22.2%) | 0 (0.0%) |
| $15,000 to $19,999 | 0 (0.0%) | 0 (0.0%) |
| $20,000 to $24,999 | 35 (32.4%) | 0 (0.0%) |
| $25,000 to $34,999 | 14 (13.0%) | 0 (0.0%) |
| $35,000 to $49,999 | 15 (13.9%) | 0 (0.0%) |
| $50,000 to $74,999 | 10 (9.3%) | 14 (20.3%) |
| $75,000 to $99,999 | 10 (9.3%) | 9 (13.0%) |
| $100,000 to $149,999 | 0 (0.0%) | 0 (0.0%) |
| $150,000 or more | 0 (0.0%) | 0 (0.0%) |
| Total | 108 (100.0%) | 69 (100.0%) |
Monthly Housing Cost Tiers in North Washington
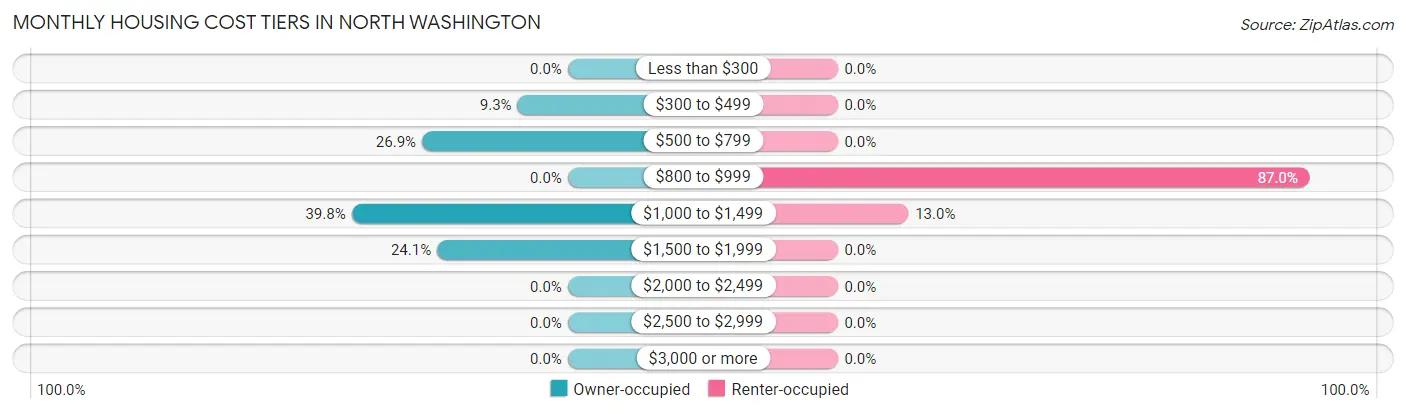
| Monthly Cost | Owner-occupied | Renter-occupied |
| Less than $300 | 0 (0.0%) | 0 (0.0%) |
| $300 to $499 | 10 (9.3%) | 0 (0.0%) |
| $500 to $799 | 29 (26.9%) | 0 (0.0%) |
| $800 to $999 | 0 (0.0%) | 60 (87.0%) |
| $1,000 to $1,499 | 43 (39.8%) | 9 (13.0%) |
| $1,500 to $1,999 | 26 (24.1%) | 0 (0.0%) |
| $2,000 to $2,499 | 0 (0.0%) | 0 (0.0%) |
| $2,500 to $2,999 | 0 (0.0%) | 0 (0.0%) |
| $3,000 or more | 0 (0.0%) | 0 (0.0%) |
| Total | 108 (100.0%) | 69 (100.0%) |
Physical Housing Characteristics in North Washington
Housing Structures in North Washington
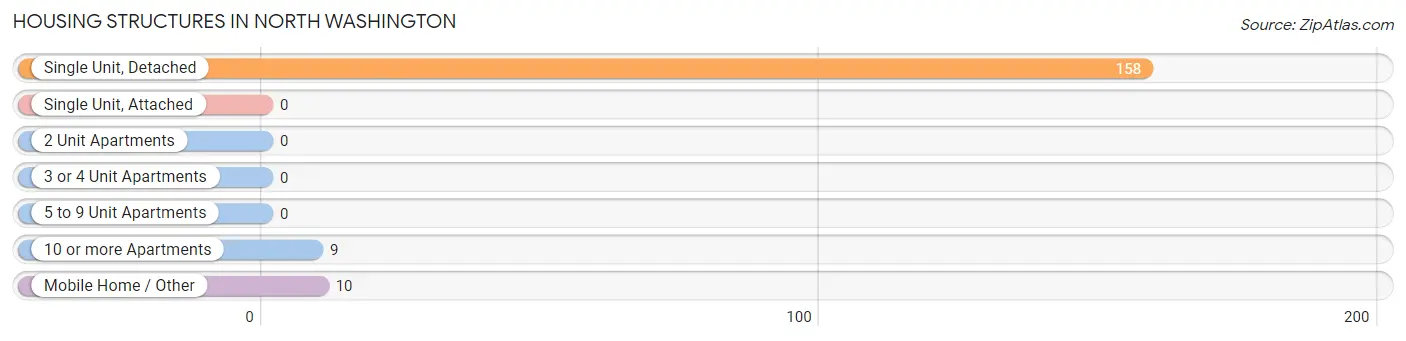
| Structure Type | # Housing Units | % Housing Units |
| Single Unit, Detached | 158 | 89.3% |
| Single Unit, Attached | 0 | 0.0% |
| 2 Unit Apartments | 0 | 0.0% |
| 3 or 4 Unit Apartments | 0 | 0.0% |
| 5 to 9 Unit Apartments | 0 | 0.0% |
| 10 or more Apartments | 9 | 5.1% |
| Mobile Home / Other | 10 | 5.7% |
| Total | 177 | 100.0% |
Housing Structures by Occupancy in North Washington
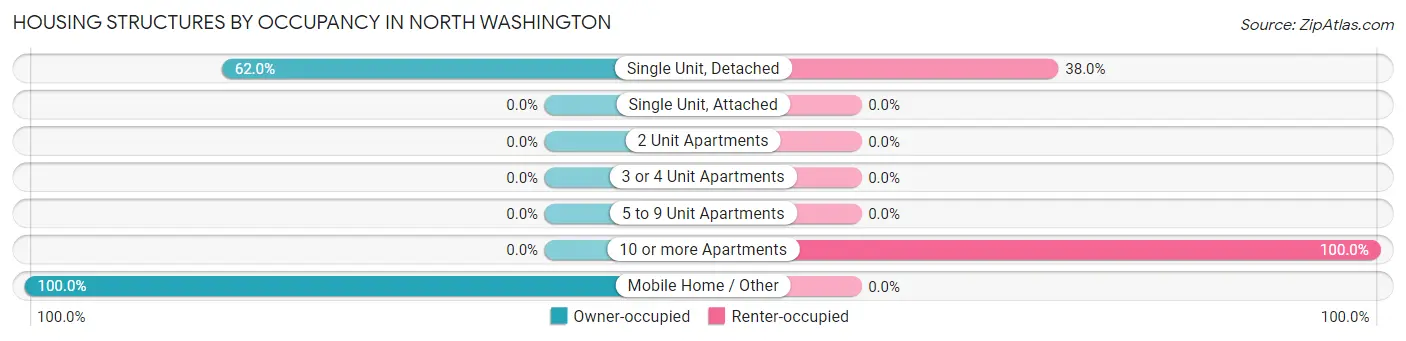
| Structure Type | Owner-occupied | Renter-occupied |
| Single Unit, Detached | 98 (62.0%) | 60 (38.0%) |
| Single Unit, Attached | 0 (0.0%) | 0 (0.0%) |
| 2 Unit Apartments | 0 (0.0%) | 0 (0.0%) |
| 3 or 4 Unit Apartments | 0 (0.0%) | 0 (0.0%) |
| 5 to 9 Unit Apartments | 0 (0.0%) | 0 (0.0%) |
| 10 or more Apartments | 0 (0.0%) | 9 (100.0%) |
| Mobile Home / Other | 10 (100.0%) | 0 (0.0%) |
| Total | 108 (61.0%) | 69 (39.0%) |
Housing Structures by Number of Rooms in North Washington
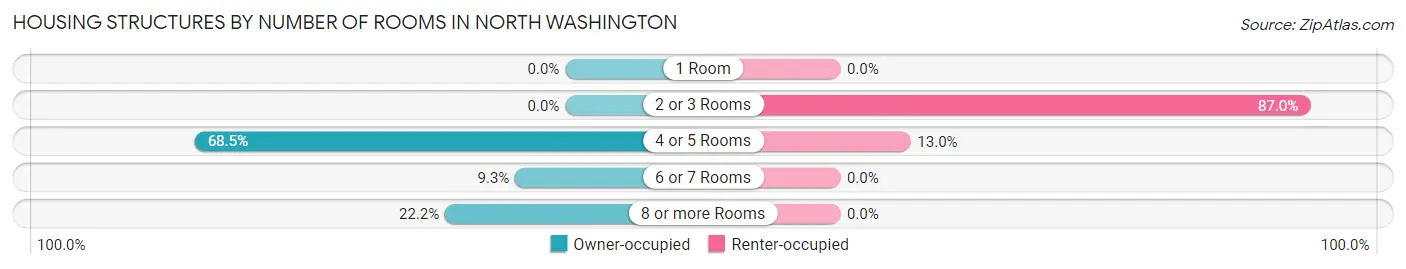
| Number of Rooms | Owner-occupied | Renter-occupied |
| 1 Room | 0 (0.0%) | 0 (0.0%) |
| 2 or 3 Rooms | 0 (0.0%) | 60 (87.0%) |
| 4 or 5 Rooms | 74 (68.5%) | 9 (13.0%) |
| 6 or 7 Rooms | 10 (9.3%) | 0 (0.0%) |
| 8 or more Rooms | 24 (22.2%) | 0 (0.0%) |
| Total | 108 (100.0%) | 69 (100.0%) |
Housing Structure by Heating Type in North Washington
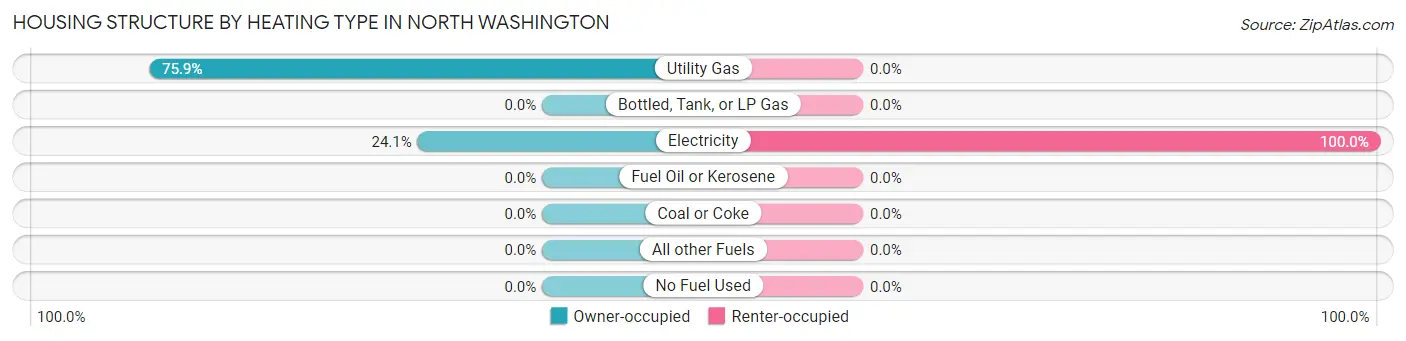
| Heating Type | Owner-occupied | Renter-occupied |
| Utility Gas | 82 (75.9%) | 0 (0.0%) |
| Bottled, Tank, or LP Gas | 0 (0.0%) | 0 (0.0%) |
| Electricity | 26 (24.1%) | 69 (100.0%) |
| Fuel Oil or Kerosene | 0 (0.0%) | 0 (0.0%) |
| Coal or Coke | 0 (0.0%) | 0 (0.0%) |
| All other Fuels | 0 (0.0%) | 0 (0.0%) |
| No Fuel Used | 0 (0.0%) | 0 (0.0%) |
| Total | 108 (100.0%) | 69 (100.0%) |
Household Vehicle Usage in North Washington
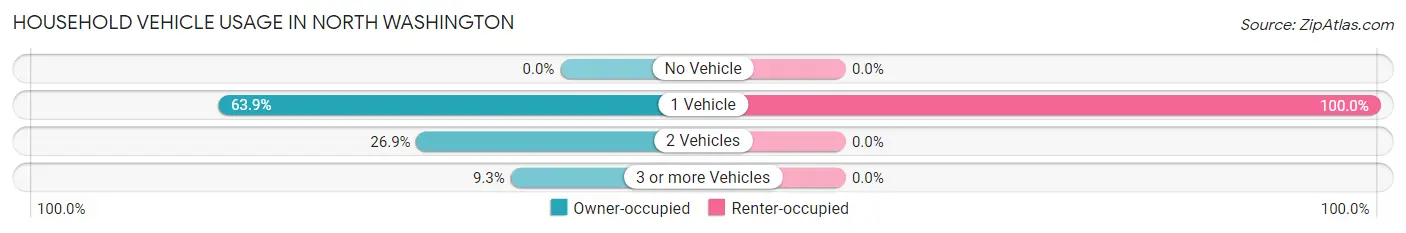
| Vehicles per Household | Owner-occupied | Renter-occupied |
| No Vehicle | 0 (0.0%) | 0 (0.0%) |
| 1 Vehicle | 69 (63.9%) | 69 (100.0%) |
| 2 Vehicles | 29 (26.9%) | 0 (0.0%) |
| 3 or more Vehicles | 10 (9.3%) | 0 (0.0%) |
| Total | 108 (100.0%) | 69 (100.0%) |
Real Estate & Mortgages in North Washington
Real Estate and Mortgage Overview in North Washington
| Characteristic | Without Mortgage | With Mortgage |
| Housing Units | 39 | 69 |
| Median Property Value | $397,500 | $305,600 |
| Median Household Income | $60,125 | $0 |
| Monthly Housing Costs | $540 | $0 |
| Real Estate Taxes | $2,396 | $0 |
Property Value by Mortgage Status in North Washington
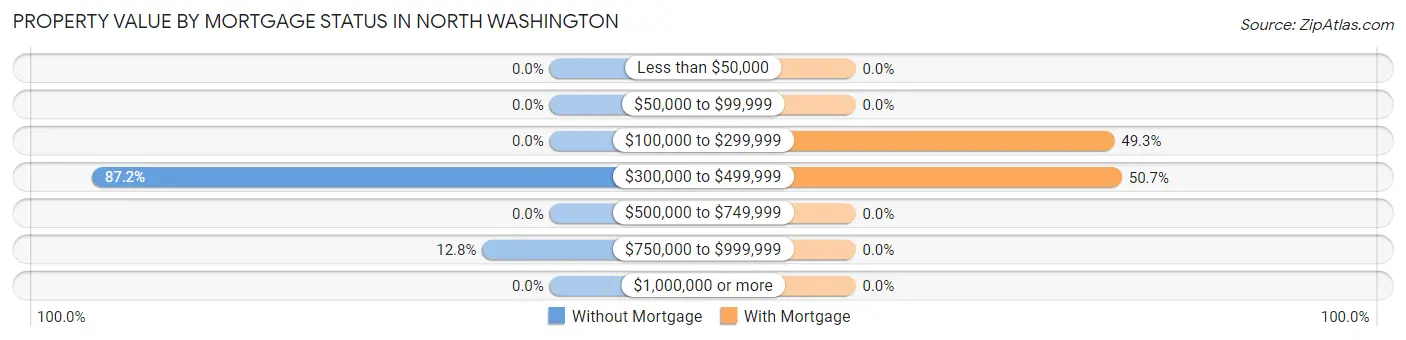
| Property Value | Without Mortgage | With Mortgage |
| Less than $50,000 | 0 (0.0%) | 0 (0.0%) |
| $50,000 to $99,999 | 0 (0.0%) | 0 (0.0%) |
| $100,000 to $299,999 | 0 (0.0%) | 34 (49.3%) |
| $300,000 to $499,999 | 34 (87.2%) | 35 (50.7%) |
| $500,000 to $749,999 | 0 (0.0%) | 0 (0.0%) |
| $750,000 to $999,999 | 5 (12.8%) | 0 (0.0%) |
| $1,000,000 or more | 0 (0.0%) | 0 (0.0%) |
| Total | 39 (100.0%) | 69 (100.0%) |
Household Income by Mortgage Status in North Washington
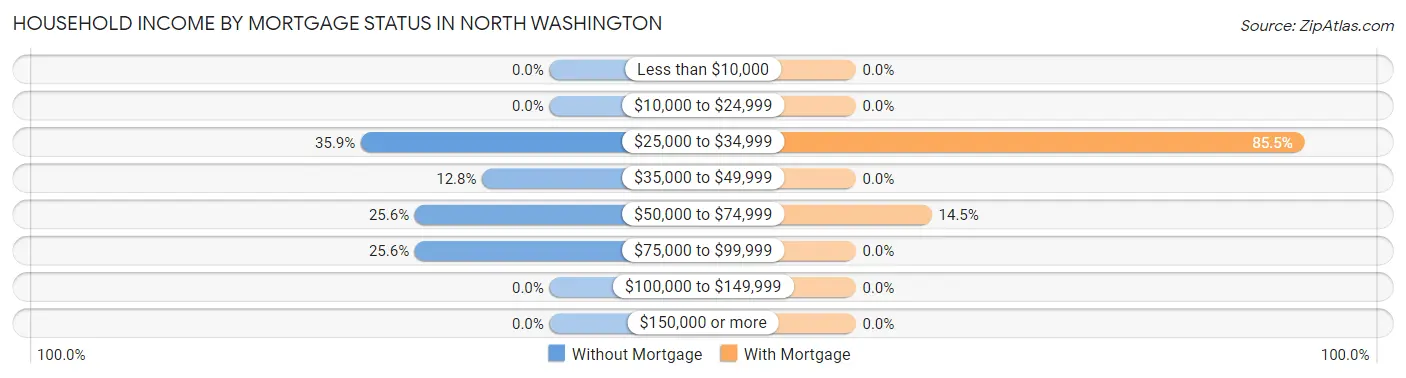
| Household Income | Without Mortgage | With Mortgage |
| Less than $10,000 | 0 (0.0%) | 0 (0.0%) |
| $10,000 to $24,999 | 0 (0.0%) | 0 (0.0%) |
| $25,000 to $34,999 | 14 (35.9%) | 59 (85.5%) |
| $35,000 to $49,999 | 5 (12.8%) | 0 (0.0%) |
| $50,000 to $74,999 | 10 (25.6%) | 10 (14.5%) |
| $75,000 to $99,999 | 10 (25.6%) | 0 (0.0%) |
| $100,000 to $149,999 | 0 (0.0%) | 0 (0.0%) |
| $150,000 or more | 0 (0.0%) | 0 (0.0%) |
| Total | 39 (100.0%) | 69 (100.0%) |
Property Value to Household Income Ratio in North Washington
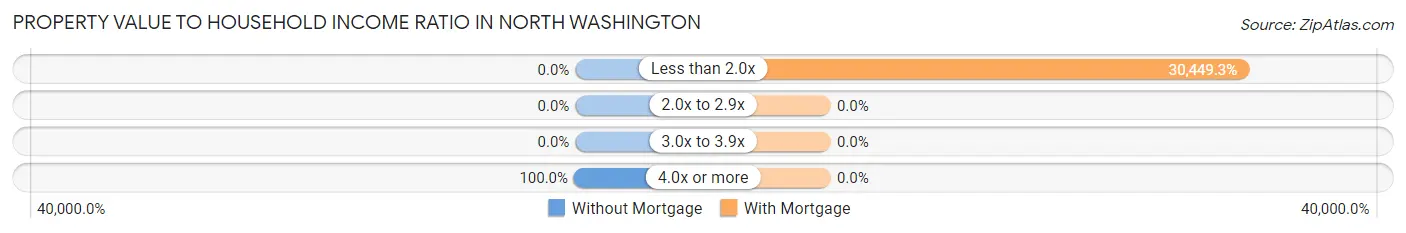
| Value-to-Income Ratio | Without Mortgage | With Mortgage |
| Less than 2.0x | 0 (0.0%) | 21,010 (30,449.3%) |
| 2.0x to 2.9x | 0 (0.0%) | 0 (0.0%) |
| 3.0x to 3.9x | 0 (0.0%) | 0 (0.0%) |
| 4.0x or more | 39 (100.0%) | 0 (0.0%) |
| Total | 39 (100.0%) | 69 (100.0%) |
Real Estate Taxes by Mortgage Status in North Washington
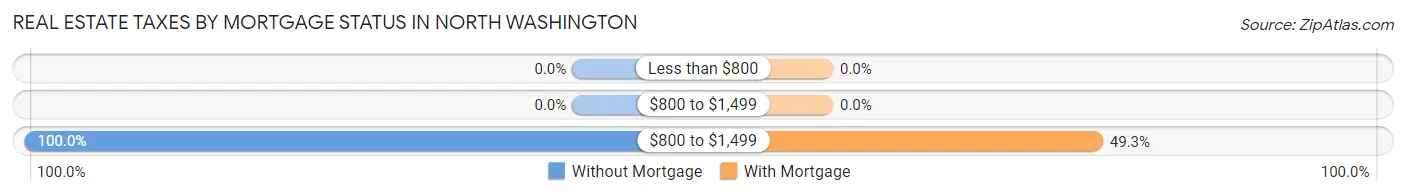
| Property Taxes | Without Mortgage | With Mortgage |
| Less than $800 | 0 (0.0%) | 0 (0.0%) |
| $800 to $1,499 | 0 (0.0%) | 0 (0.0%) |
| $800 to $1,499 | 39 (100.0%) | 34 (49.3%) |
| Total | 39 (100.0%) | 69 (100.0%) |
Health & Disability in North Washington
Health Insurance Coverage by Age in North Washington
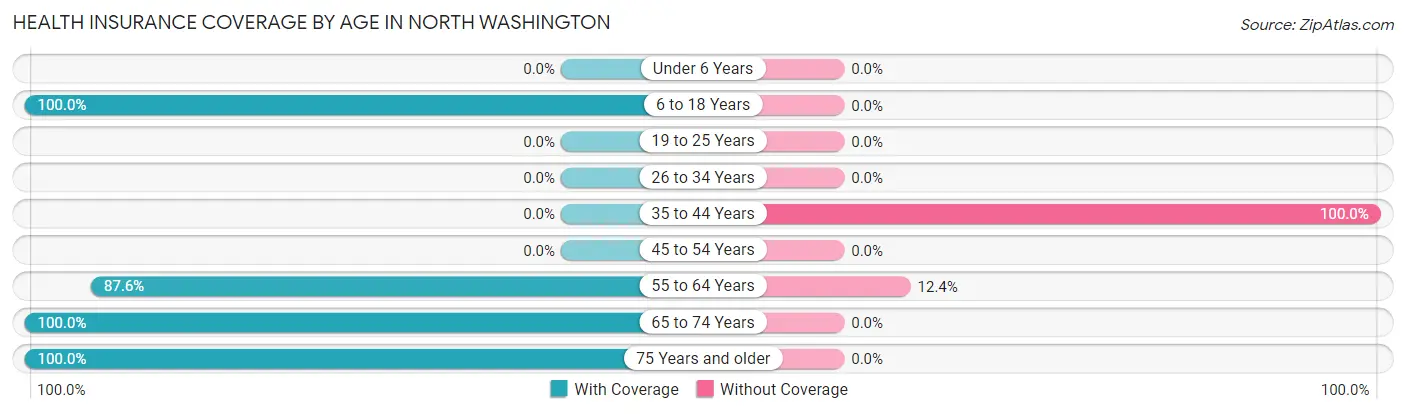
| Age Bracket | With Coverage | Without Coverage |
| Under 6 Years | 0 (0.0%) | 0 (0.0%) |
| 6 to 18 Years | 10 (100.0%) | 0 (0.0%) |
| 19 to 25 Years | 0 (0.0%) | 0 (0.0%) |
| 26 to 34 Years | 0 (0.0%) | 0 (0.0%) |
| 35 to 44 Years | 0 (0.0%) | 30 (100.0%) |
| 45 to 54 Years | 0 (0.0%) | 0 (0.0%) |
| 55 to 64 Years | 85 (87.6%) | 12 (12.4%) |
| 65 to 74 Years | 40 (100.0%) | 0 (0.0%) |
| 75 Years and older | 34 (100.0%) | 0 (0.0%) |
| Total | 169 (80.1%) | 42 (19.9%) |
Health Insurance Coverage by Citizenship Status in North Washington
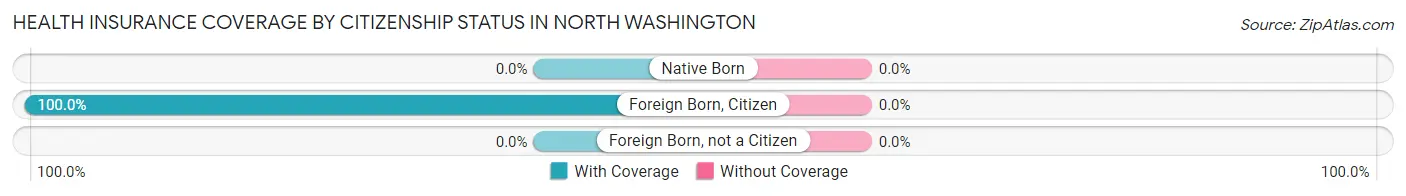
| Citizenship Status | With Coverage | Without Coverage |
| Native Born | 0 (0.0%) | 0 (0.0%) |
| Foreign Born, Citizen | 10 (100.0%) | 0 (0.0%) |
| Foreign Born, not a Citizen | 0 (0.0%) | 0 (0.0%) |
Health Insurance Coverage by Household Income in North Washington
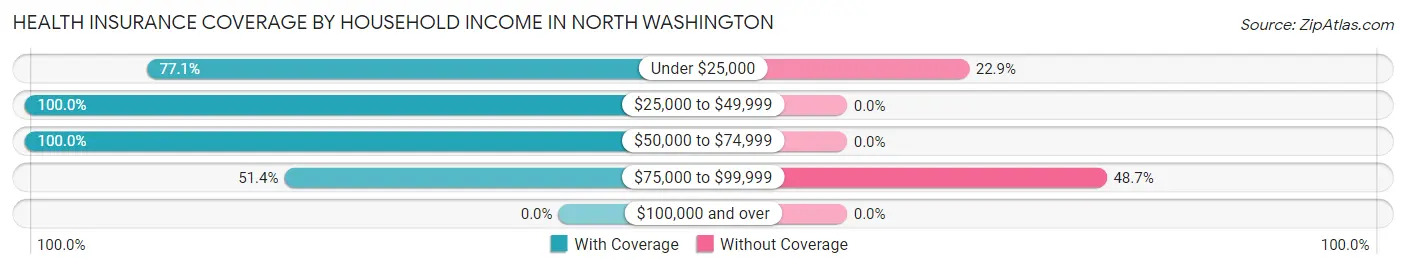
| Household Income | With Coverage | Without Coverage |
| Under $25,000 | 81 (77.1%) | 24 (22.9%) |
| $25,000 to $49,999 | 35 (100.0%) | 0 (0.0%) |
| $50,000 to $74,999 | 34 (100.0%) | 0 (0.0%) |
| $75,000 to $99,999 | 19 (51.3%) | 18 (48.6%) |
| $100,000 and over | 0 (0.0%) | 0 (0.0%) |
Public vs Private Health Insurance Coverage by Age in North Washington
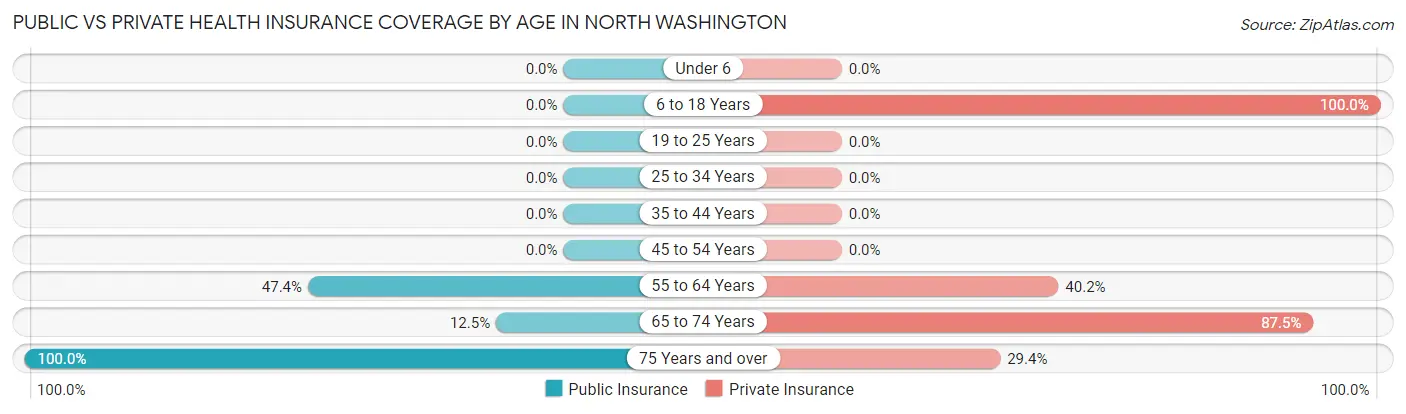
| Age Bracket | Public Insurance | Private Insurance |
| Under 6 | 0 (0.0%) | 0 (0.0%) |
| 6 to 18 Years | 0 (0.0%) | 10 (100.0%) |
| 19 to 25 Years | 0 (0.0%) | 0 (0.0%) |
| 25 to 34 Years | 0 (0.0%) | 0 (0.0%) |
| 35 to 44 Years | 0 (0.0%) | 0 (0.0%) |
| 45 to 54 Years | 0 (0.0%) | 0 (0.0%) |
| 55 to 64 Years | 46 (47.4%) | 39 (40.2%) |
| 65 to 74 Years | 5 (12.5%) | 35 (87.5%) |
| 75 Years and over | 34 (100.0%) | 10 (29.4%) |
| Total | 85 (40.3%) | 94 (44.6%) |
Disability Status by Sex by Age in North Washington
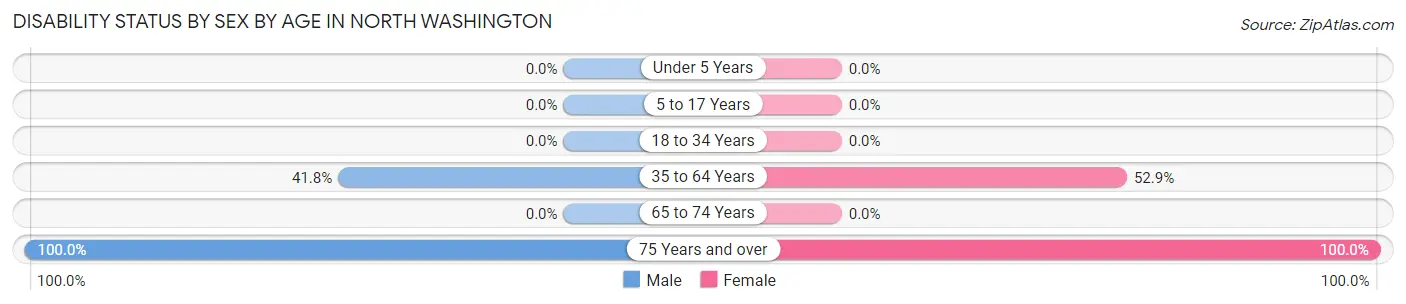
| Age Bracket | Male | Female |
| Under 5 Years | 0 (0.0%) | 0 (0.0%) |
| 5 to 17 Years | 0 (0.0%) | 0 (0.0%) |
| 18 to 34 Years | 0 (0.0%) | 0 (0.0%) |
| 35 to 64 Years | 46 (41.8%) | 9 (52.9%) |
| 65 to 74 Years | 0 (0.0%) | 0 (0.0%) |
| 75 Years and over | 14 (100.0%) | 20 (100.0%) |
Disability Class by Sex by Age in North Washington
Disability Class: Hearing Difficulty
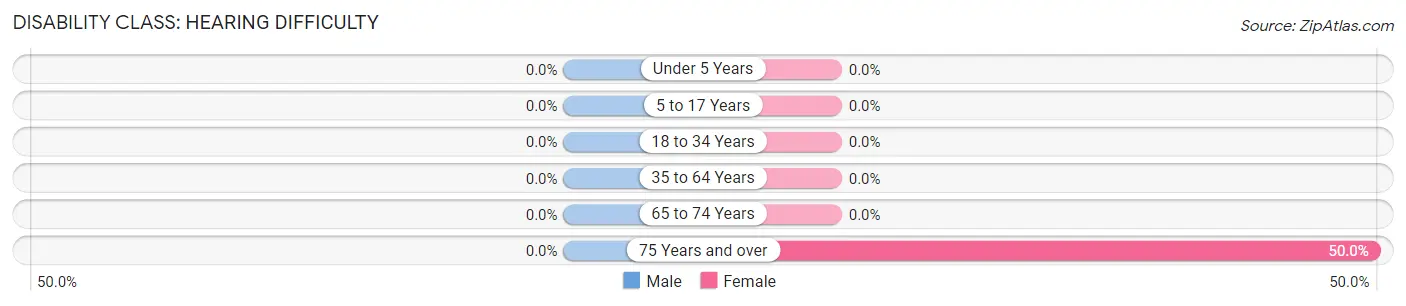
| Age Bracket | Male | Female |
| Under 5 Years | 0 (0.0%) | 0 (0.0%) |
| 5 to 17 Years | 0 (0.0%) | 0 (0.0%) |
| 18 to 34 Years | 0 (0.0%) | 0 (0.0%) |
| 35 to 64 Years | 0 (0.0%) | 0 (0.0%) |
| 65 to 74 Years | 0 (0.0%) | 0 (0.0%) |
| 75 Years and over | 0 (0.0%) | 10 (50.0%) |
Disability Class: Vision Difficulty
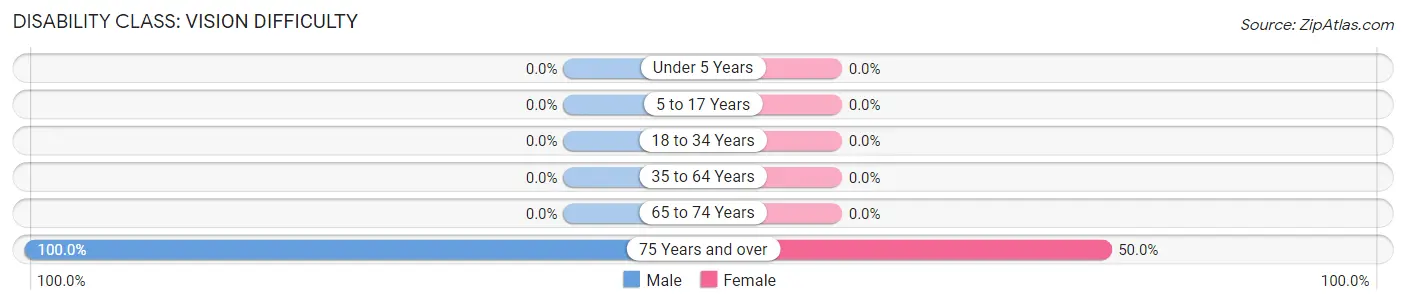
| Age Bracket | Male | Female |
| Under 5 Years | 0 (0.0%) | 0 (0.0%) |
| 5 to 17 Years | 0 (0.0%) | 0 (0.0%) |
| 18 to 34 Years | 0 (0.0%) | 0 (0.0%) |
| 35 to 64 Years | 0 (0.0%) | 0 (0.0%) |
| 65 to 74 Years | 0 (0.0%) | 0 (0.0%) |
| 75 Years and over | 14 (100.0%) | 10 (50.0%) |
Disability Class: Cognitive Difficulty
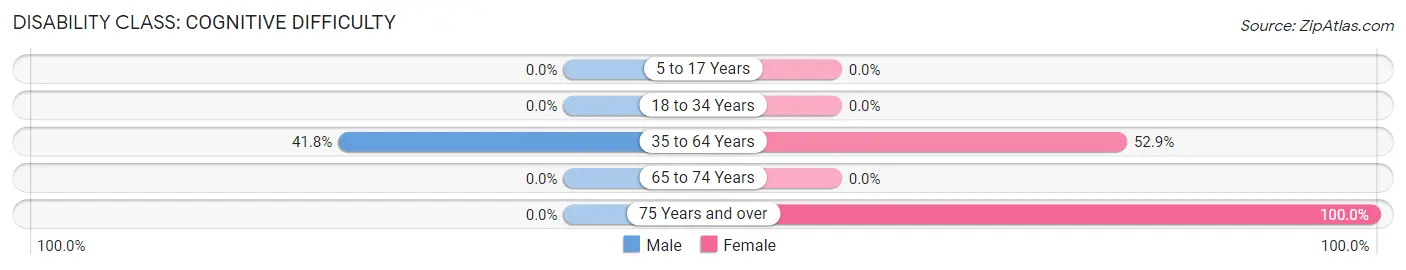
| Age Bracket | Male | Female |
| 5 to 17 Years | 0 (0.0%) | 0 (0.0%) |
| 18 to 34 Years | 0 (0.0%) | 0 (0.0%) |
| 35 to 64 Years | 46 (41.8%) | 9 (52.9%) |
| 65 to 74 Years | 0 (0.0%) | 0 (0.0%) |
| 75 Years and over | 0 (0.0%) | 20 (100.0%) |
Disability Class: Ambulatory Difficulty
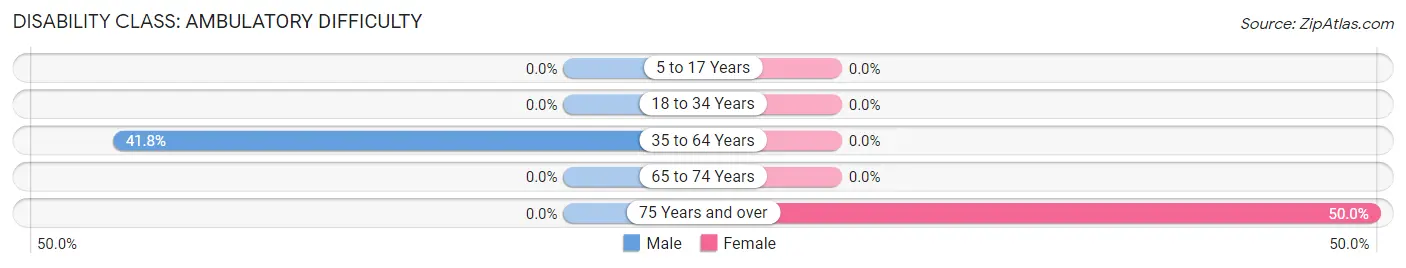
| Age Bracket | Male | Female |
| 5 to 17 Years | 0 (0.0%) | 0 (0.0%) |
| 18 to 34 Years | 0 (0.0%) | 0 (0.0%) |
| 35 to 64 Years | 46 (41.8%) | 0 (0.0%) |
| 65 to 74 Years | 0 (0.0%) | 0 (0.0%) |
| 75 Years and over | 0 (0.0%) | 10 (50.0%) |
Disability Class: Self-Care Difficulty
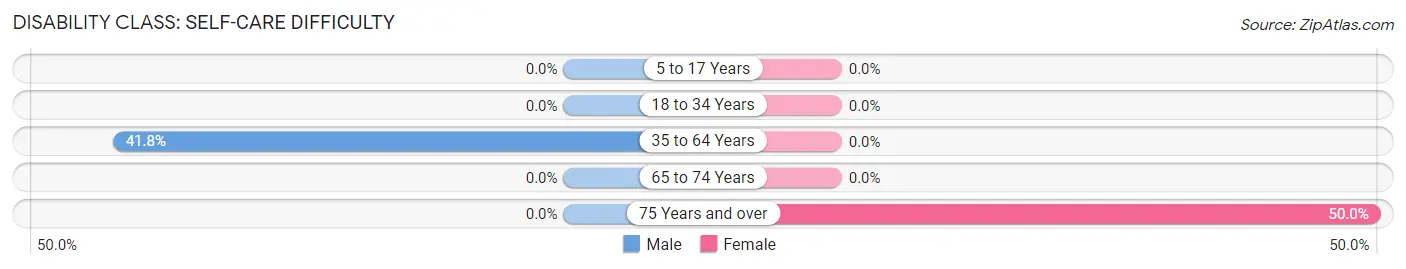
| Age Bracket | Male | Female |
| 5 to 17 Years | 0 (0.0%) | 0 (0.0%) |
| 18 to 34 Years | 0 (0.0%) | 0 (0.0%) |
| 35 to 64 Years | 46 (41.8%) | 0 (0.0%) |
| 65 to 74 Years | 0 (0.0%) | 0 (0.0%) |
| 75 Years and over | 0 (0.0%) | 10 (50.0%) |
Technology Access in North Washington
Computing Device Access in North Washington
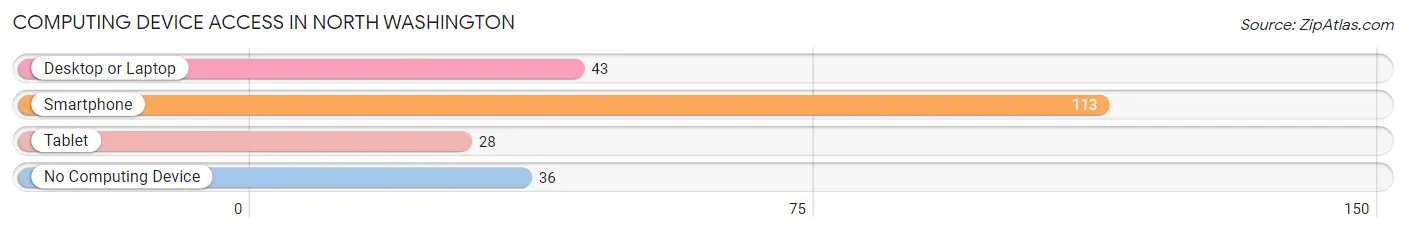
| Device Type | # Households | % Households |
| Desktop or Laptop | 43 | 24.3% |
| Smartphone | 113 | 63.8% |
| Tablet | 28 | 15.8% |
| No Computing Device | 36 | 20.3% |
| Total | 177 | 100.0% |
Internet Access in North Washington
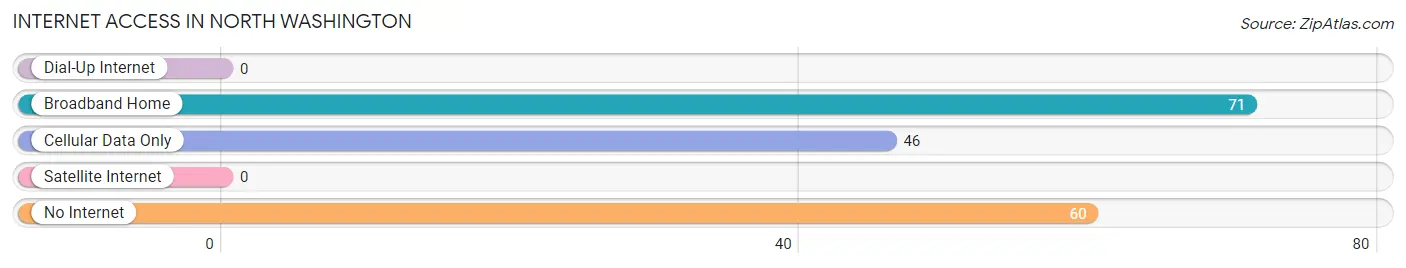
| Internet Type | # Households | % Households |
| Dial-Up Internet | 0 | 0.0% |
| Broadband Home | 71 | 40.1% |
| Cellular Data Only | 46 | 26.0% |
| Satellite Internet | 0 | 0.0% |
| No Internet | 60 | 33.9% |
| Total | 177 | 100.0% |
North Washington Summary
North Washington is a small town located in the state of Colorado, United States. It is situated in the northern part of the state, near the border with Wyoming. The town has a population of approximately 1,000 people and is part of the Denver-Aurora-Lakewood Metropolitan Statistical Area.
History
North Washington was founded in 1876 by a group of settlers from the East Coast. The town was originally called “Washingtonville”, but the name was changed to North Washington in 1883. The town was named after George Washington, the first President of the United States.
The town was initially a farming community, but it soon became a mining town as well. The town was home to several coal mines, which provided employment for many of the town’s residents. The town also had a number of businesses, including a hotel, a general store, and a post office.
In the early 1900s, the town experienced a period of growth and prosperity. The population increased from around 500 in 1900 to over 1,000 in 1910. The town also had a number of new businesses, including a bank, a newspaper, and a movie theater.
Geography
North Washington is located in the northern part of Colorado, near the border with Wyoming. The town is situated in the foothills of the Rocky Mountains, at an elevation of 6,000 feet. The town is surrounded by mountains and forests, and is located near several lakes and rivers.
The town is located in a semi-arid climate, with hot summers and cold winters. The average temperature in the summer is around 80 degrees Fahrenheit, and the average temperature in the winter is around 20 degrees Fahrenheit.
Economy
The economy of North Washington is largely based on tourism and agriculture. The town is home to several tourist attractions, including a ski resort, a golf course, and a number of hiking trails. The town also has a number of farms, which produce a variety of crops, including wheat, corn, and hay.
The town also has a number of businesses, including restaurants, bars, and shops. The town is also home to a number of manufacturing companies, which produce a variety of products, including furniture, clothing, and electronics.
Demographics
As of the 2010 census, the population of North Washington was 1,000 people. The town has a population that is predominantly white, with a small percentage of African Americans, Hispanics, and Native Americans. The median household income in the town is $45,000, and the median age is 40 years old.
Conclusion
North Washington is a small town located in the northern part of Colorado, near the border with Wyoming. The town has a population of approximately 1,000 people and is part of the Denver-Aurora-Lakewood Metropolitan Statistical Area. The town was founded in 1876 and was initially a farming community, but it soon became a mining town as well. The town’s economy is largely based on tourism and agriculture, and it is home to several tourist attractions, including a ski resort, a golf course, and a number of hiking trails. The town has a population that is predominantly white, with a small percentage of African Americans, Hispanics, and Native Americans.
Common Questions
What is Per Capita Income in North Washington?
Per Capita income in North Washington is $23,731.
What is the Median Family Income in North Washington?
Median Family Income in North Washington is $78,750.
What is Inequality or Gini Index in North Washington?
Inequality or Gini Index in North Washington is 0.46.
What is the Total Population of North Washington?
Total Population of North Washington is 232.
What is the Total Male Population of North Washington?
Total Male Population of North Washington is 150.
What is the Total Female Population of North Washington?
Total Female Population of North Washington is 82.
What is the Ratio of Males per 100 Females in North Washington?
There are 182.93 Males per 100 Females in North Washington.
What is the Ratio of Females per 100 Males in North Washington?
There are 54.67 Females per 100 Males in North Washington.
What is the Median Population Age in North Washington?
Median Population Age in North Washington is 59.6 Years.
What is the Average Family Size in North Washington
Average Family Size in North Washington is 2.0 People.
What is the Average Household Size in North Washington
Average Household Size in North Washington is 1.2 People.
How Large is the Labor Force in North Washington?
There are 145 People in the Labor Forcein in North Washington.
What is the Percentage of People in the Labor Force in North Washington?
62.5% of People are in the Labor Force in North Washington.
What is the Unemployment Rate in North Washington?
Unemployment Rate in North Washington is 6.9%.