Olathe, CO Map & Demographics
Olathe Map
Olathe Overview
$24,274
PER CAPITA INCOME
$75,102
AVG FAMILY INCOME
$60,966
AVG HOUSEHOLD INCOME
33.8%
WAGE / INCOME GAP [ % ]
66.2¢/ $1
WAGE / INCOME GAP [ $ ]
$10,338
FAMILY INCOME DEFICIT
0.39
INEQUALITY / GINI INDEX
1,901
TOTAL POPULATION
1,014
MALE POPULATION
887
FEMALE POPULATION
114.32
MALES / 100 FEMALES
87.48
FEMALES / 100 MALES
37.7
MEDIAN AGE
4.4
AVG FAMILY SIZE
3.4
AVG HOUSEHOLD SIZE
804
LABOR FORCE [ PEOPLE ]
52.1%
PERCENT IN LABOR FORCE
4.6%
UNEMPLOYMENT RATE
Olathe Zip Codes
Olathe Area Codes
Income in Olathe
Income Overview in Olathe
Per Capita Income in Olathe is $24,274, while median incomes of families and households are $75,102 and $60,966 respectively.
| Characteristic | Number | Measure |
| Per Capita Income | 1,901 | $24,274 |
| Median Family Income | 340 | $75,102 |
| Mean Family Income | 340 | $74,576 |
| Median Household Income | 509 | $60,966 |
| Mean Household Income | 509 | $63,247 |
| Income Deficit | 340 | $10,338 |
| Wage / Income Gap (%) | 1,901 | 33.84% |
| Wage / Income Gap ($) | 1,901 | 66.16¢ per $1 |
| Gini / Inequality Index | 1,901 | 0.39 |
Earnings by Sex in Olathe
Average Earnings in Olathe are $29,982, $34,638 for men and $22,917 for women, a difference of 33.8%.
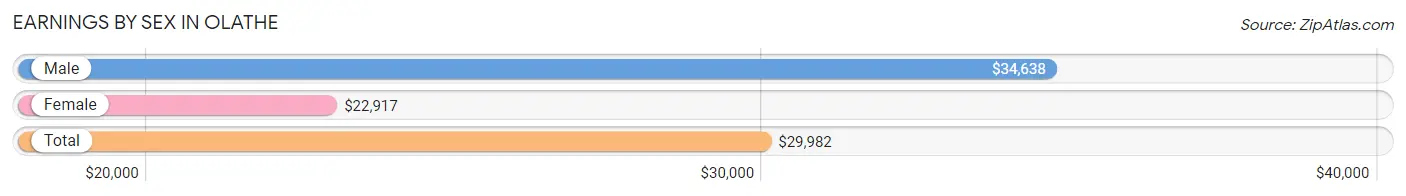
| Sex | Number | Average Earnings |
| Male | 700 (70.0%) | $34,638 |
| Female | 300 (30.0%) | $22,917 |
| Total | 1,000 (100.0%) | $29,982 |
Earnings by Sex by Income Bracket in Olathe
The most common earnings brackets in Olathe are $25,000 to $29,999 for men (133 | 19.0%) and $25,000 to $29,999 for women (53 | 17.7%).
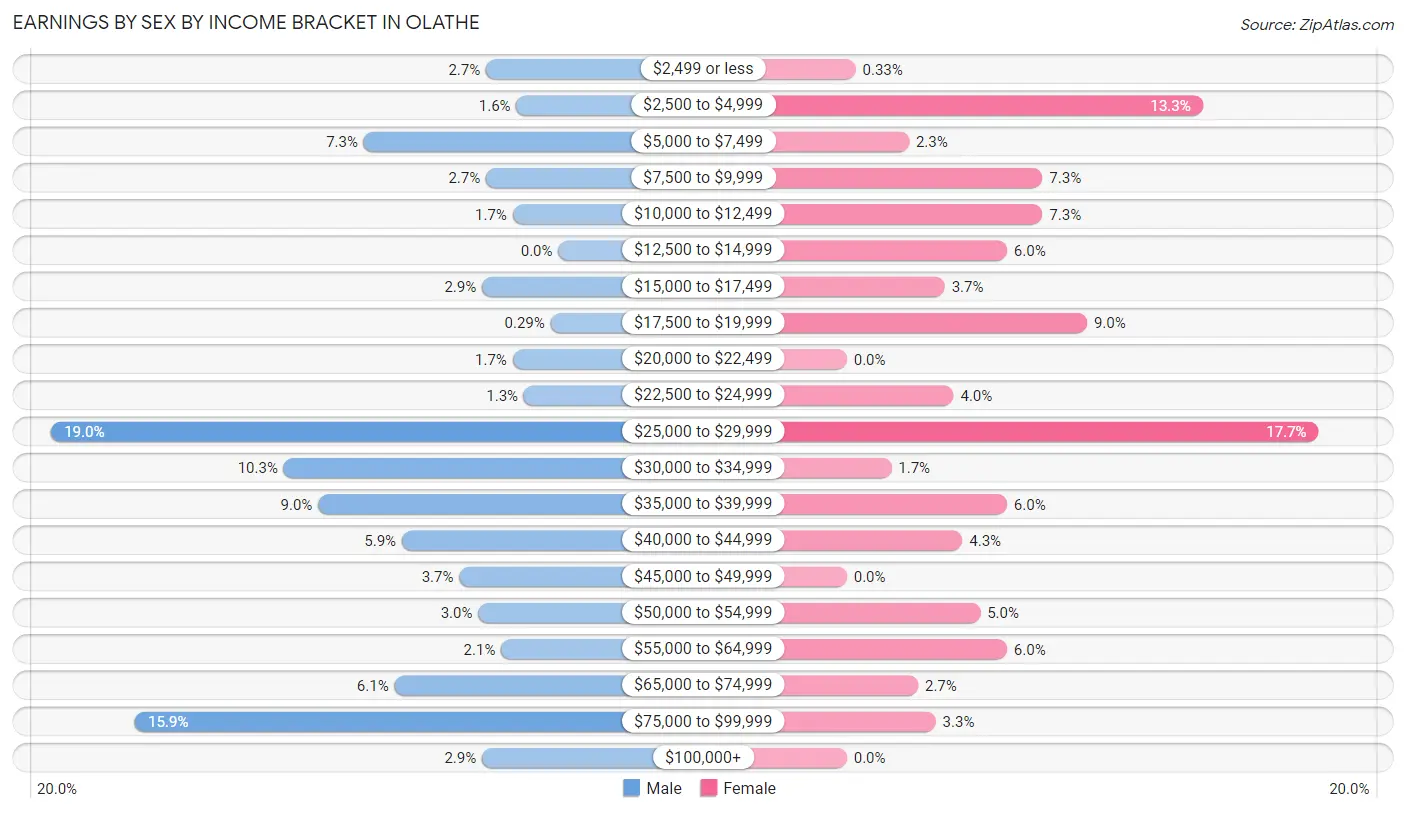
| Income | Male | Female |
| $2,499 or less | 19 (2.7%) | 1 (0.3%) |
| $2,500 to $4,999 | 11 (1.6%) | 40 (13.3%) |
| $5,000 to $7,499 | 51 (7.3%) | 7 (2.3%) |
| $7,500 to $9,999 | 19 (2.7%) | 22 (7.3%) |
| $10,000 to $12,499 | 12 (1.7%) | 22 (7.3%) |
| $12,500 to $14,999 | 0 (0.0%) | 18 (6.0%) |
| $15,000 to $17,499 | 20 (2.9%) | 11 (3.7%) |
| $17,500 to $19,999 | 2 (0.3%) | 27 (9.0%) |
| $20,000 to $22,499 | 12 (1.7%) | 0 (0.0%) |
| $22,500 to $24,999 | 9 (1.3%) | 12 (4.0%) |
| $25,000 to $29,999 | 133 (19.0%) | 53 (17.7%) |
| $30,000 to $34,999 | 72 (10.3%) | 5 (1.7%) |
| $35,000 to $39,999 | 63 (9.0%) | 18 (6.0%) |
| $40,000 to $44,999 | 41 (5.9%) | 13 (4.3%) |
| $45,000 to $49,999 | 26 (3.7%) | 0 (0.0%) |
| $50,000 to $54,999 | 21 (3.0%) | 15 (5.0%) |
| $55,000 to $64,999 | 15 (2.1%) | 18 (6.0%) |
| $65,000 to $74,999 | 43 (6.1%) | 8 (2.7%) |
| $75,000 to $99,999 | 111 (15.9%) | 10 (3.3%) |
| $100,000+ | 20 (2.9%) | 0 (0.0%) |
| Total | 700 (100.0%) | 300 (100.0%) |
Earnings by Sex by Educational Attainment in Olathe
Average earnings in Olathe are $35,198 for men and $26,739 for women, a difference of 24.0%. Men with an educational attainment of less than high school enjoy the highest average annual earnings of $75,346, while those with high school diploma education earn the least with $29,904. Women with an educational attainment of bachelor's degree earn the most with the average annual earnings of $60,893, while those with college or associate's degree education have the smallest earnings of $23,333.
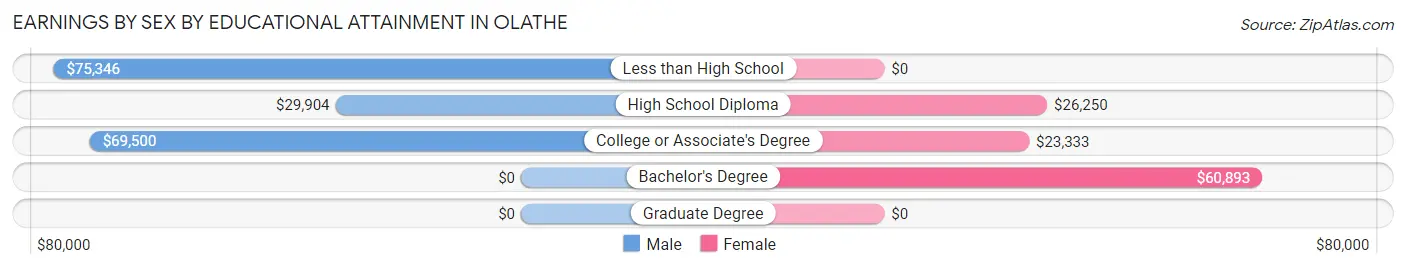
| Educational Attainment | Male Income | Female Income |
| Less than High School | $75,346 | $0 |
| High School Diploma | $29,904 | $26,250 |
| College or Associate's Degree | $69,500 | $23,333 |
| Bachelor's Degree | - | - |
| Graduate Degree | - | - |
| Total | $35,198 | $26,739 |
Family Income in Olathe
Family Income Brackets in Olathe
According to the Olathe family income data, there are 123 families falling into the $75,000 to $99,999 income range, which is the most common income bracket and makes up 36.2% of all families.
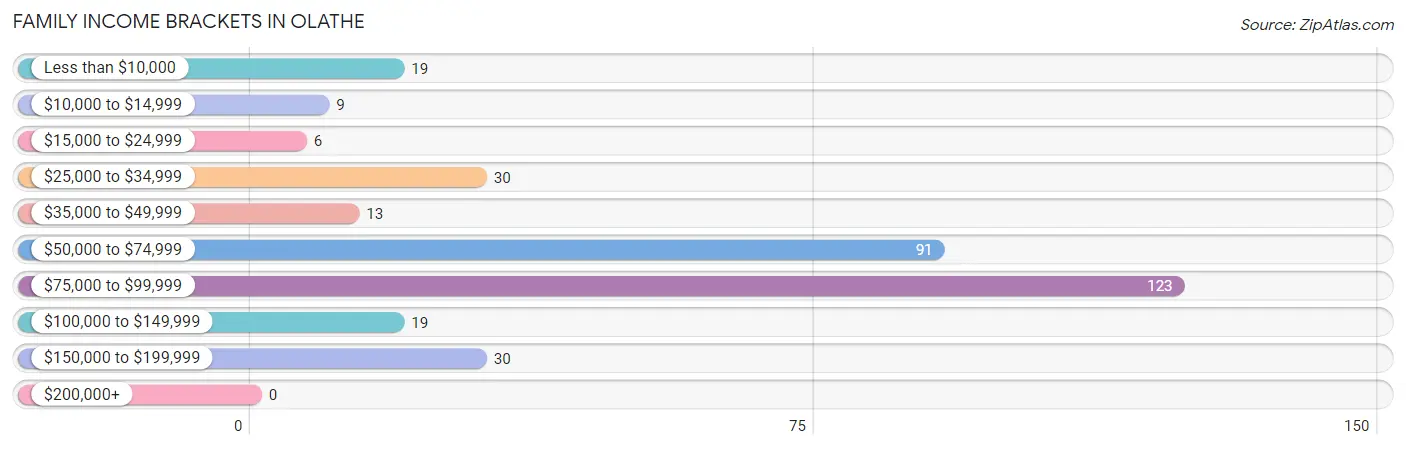
| Income Bracket | # Families | % Families |
| Less than $10,000 | 19 | 5.6% |
| $10,000 to $14,999 | 9 | 2.6% |
| $15,000 to $24,999 | 6 | 1.8% |
| $25,000 to $34,999 | 30 | 8.8% |
| $35,000 to $49,999 | 13 | 3.8% |
| $50,000 to $74,999 | 91 | 26.8% |
| $75,000 to $99,999 | 123 | 36.2% |
| $100,000 to $149,999 | 19 | 5.6% |
| $150,000 to $199,999 | 30 | 8.8% |
| $200,000+ | 0 | 0.0% |
Family Income by Famaliy Size in Olathe
3-person families (87 | 25.6%) account for the highest median family income in Olathe with $76,806 per family, while 2-person families (101 | 29.7%) have the highest median income of $31,010 per family member.
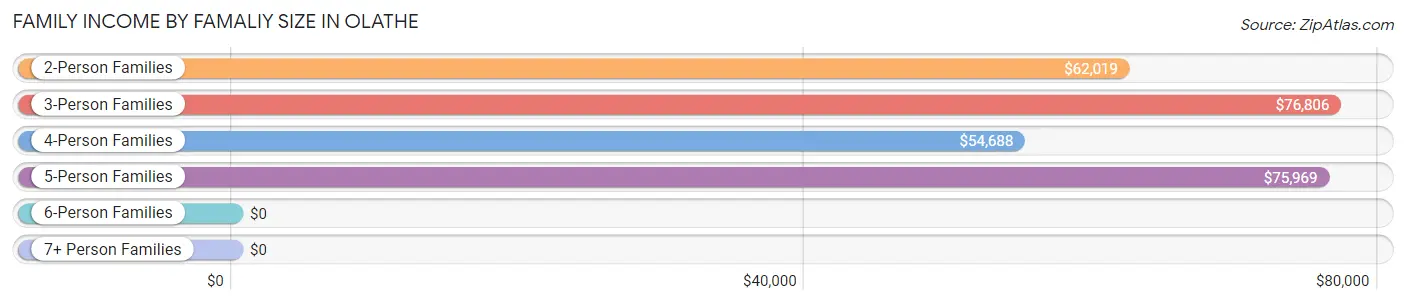
| Income Bracket | # Families | Median Income |
| 2-Person Families | 101 (29.7%) | $62,019 |
| 3-Person Families | 87 (25.6%) | $76,806 |
| 4-Person Families | 60 (17.6%) | $54,688 |
| 5-Person Families | 83 (24.4%) | $75,969 |
| 6-Person Families | 1 (0.3%) | $0 |
| 7+ Person Families | 8 (2.4%) | $0 |
| Total | 340 (100.0%) | $75,102 |
Family Income by Number of Earners in Olathe
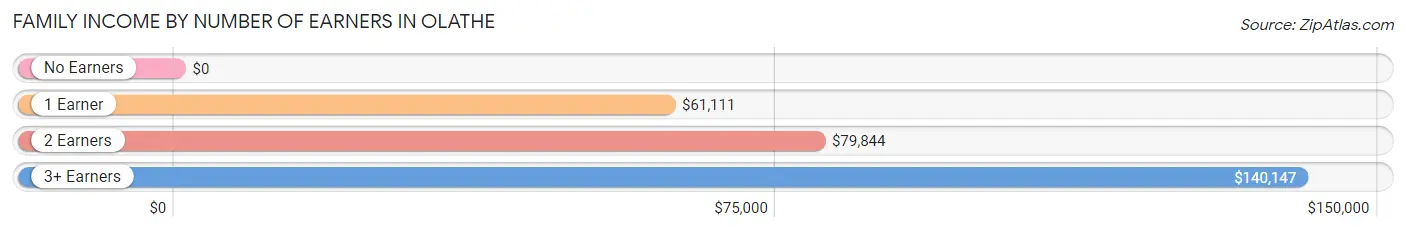
| Number of Earners | # Families | Median Income |
| No Earners | 22 (6.5%) | $0 |
| 1 Earner | 142 (41.8%) | $61,111 |
| 2 Earners | 144 (42.3%) | $79,844 |
| 3+ Earners | 32 (9.4%) | $140,147 |
| Total | 340 (100.0%) | $75,102 |
Household Income in Olathe
Household Income Brackets in Olathe
With 133 households falling in the category, the $75,000 to $99,999 income range is the most frequent in Olathe, accounting for 26.1% of all households.
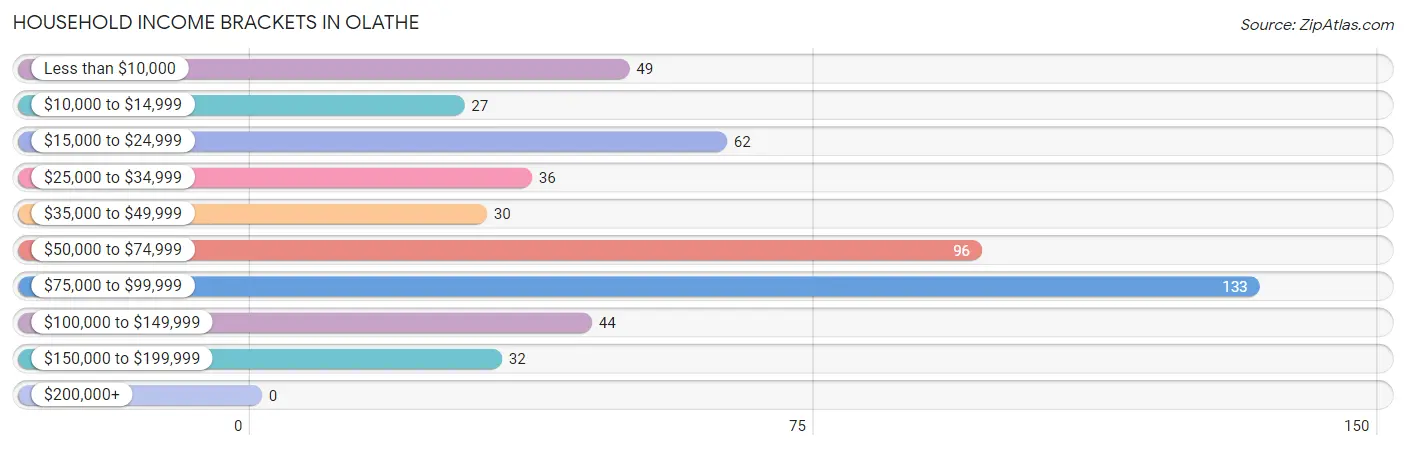
| Income Bracket | # Households | % Households |
| Less than $10,000 | 49 | 9.6% |
| $10,000 to $14,999 | 27 | 5.3% |
| $15,000 to $24,999 | 62 | 12.2% |
| $25,000 to $34,999 | 36 | 7.1% |
| $35,000 to $49,999 | 30 | 5.9% |
| $50,000 to $74,999 | 96 | 18.9% |
| $75,000 to $99,999 | 133 | 26.1% |
| $100,000 to $149,999 | 44 | 8.6% |
| $150,000 to $199,999 | 32 | 6.3% |
| $200,000+ | 0 | 0.0% |
Household Income by Householder Age in Olathe
The median household income in Olathe is $60,966, with the highest median household income of $76,031 found in the 25 to 44 years age bracket for the primary householder. A total of 179 households (35.2%) fall into this category. Meanwhile, the 15 to 24 years age bracket for the primary householder has the lowest median household income of $43,409, with 34 households (6.7%) in this group.
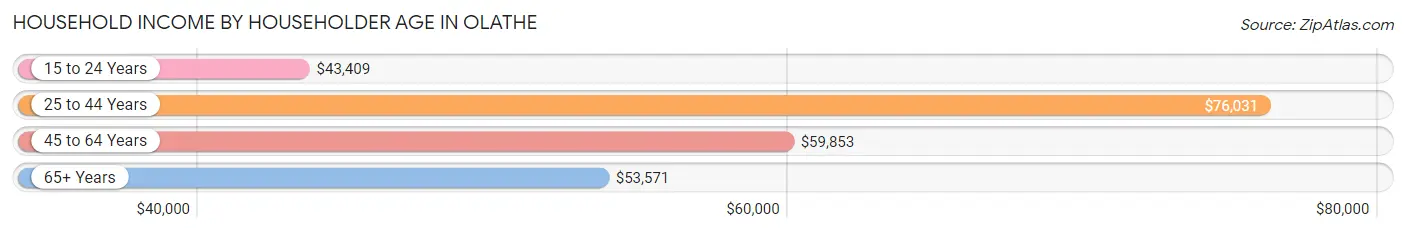
| Income Bracket | # Households | Median Income |
| 15 to 24 Years | 34 (6.7%) | $43,409 |
| 25 to 44 Years | 179 (35.2%) | $76,031 |
| 45 to 64 Years | 168 (33.0%) | $59,853 |
| 65+ Years | 128 (25.2%) | $53,571 |
| Total | 509 (100.0%) | $60,966 |
Poverty in Olathe
Income Below Poverty by Sex and Age in Olathe
With 22.6% poverty level for males and 26.6% for females among the residents of Olathe, 15 year old males and 16 and 17 year old females are the most vulnerable to poverty, with 14 males (70.0%) and 23 females (67.6%) in their respective age groups living below the poverty level.
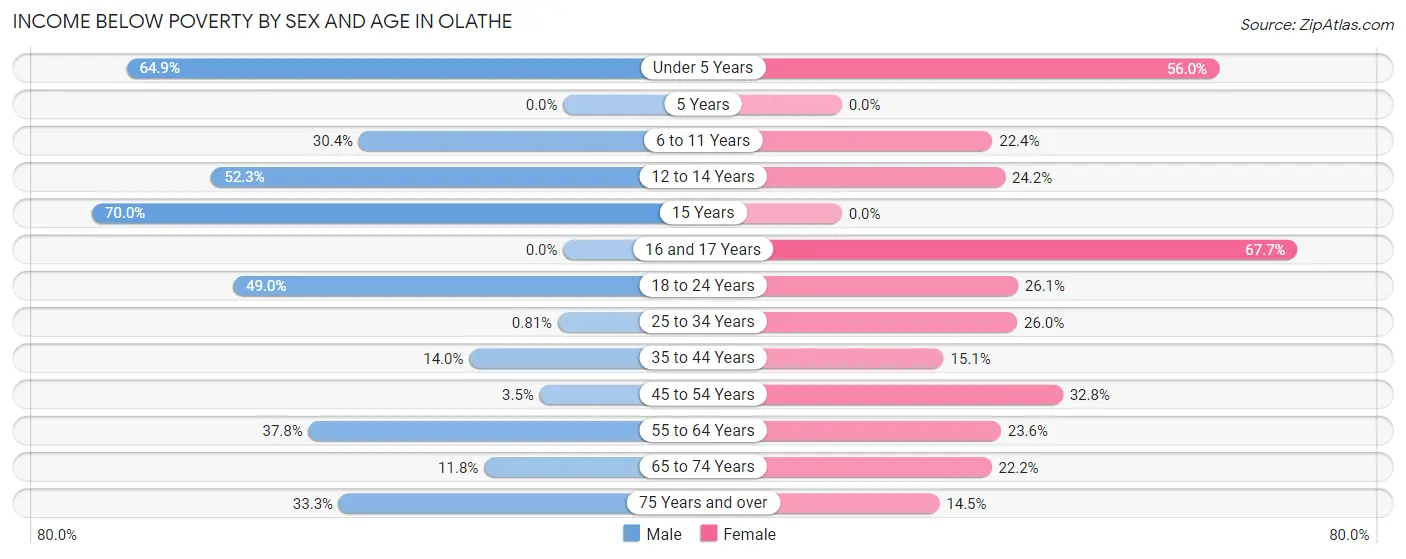
| Age Bracket | Male | Female |
| Under 5 Years | 24 (64.9%) | 14 (56.0%) |
| 5 Years | 0 (0.0%) | 0 (0.0%) |
| 6 to 11 Years | 34 (30.4%) | 19 (22.4%) |
| 12 to 14 Years | 23 (52.3%) | 8 (24.2%) |
| 15 Years | 14 (70.0%) | 0 (0.0%) |
| 16 and 17 Years | 0 (0.0%) | 23 (67.6%) |
| 18 to 24 Years | 51 (49.0%) | 40 (26.1%) |
| 25 to 34 Years | 1 (0.8%) | 19 (26.0%) |
| 35 to 44 Years | 32 (14.0%) | 13 (15.1%) |
| 45 to 54 Years | 6 (3.5%) | 41 (32.8%) |
| 55 to 64 Years | 28 (37.8%) | 17 (23.6%) |
| 65 to 74 Years | 6 (11.8%) | 14 (22.2%) |
| 75 Years and over | 8 (33.3%) | 10 (14.5%) |
| Total | 227 (22.6%) | 218 (26.6%) |
Income Above Poverty by Sex and Age in Olathe
According to the poverty statistics in Olathe, males aged 16 and 17 years and females aged 15 years are the age groups that are most secure financially, with 100.0% of males and 100.0% of females in these age groups living above the poverty line.
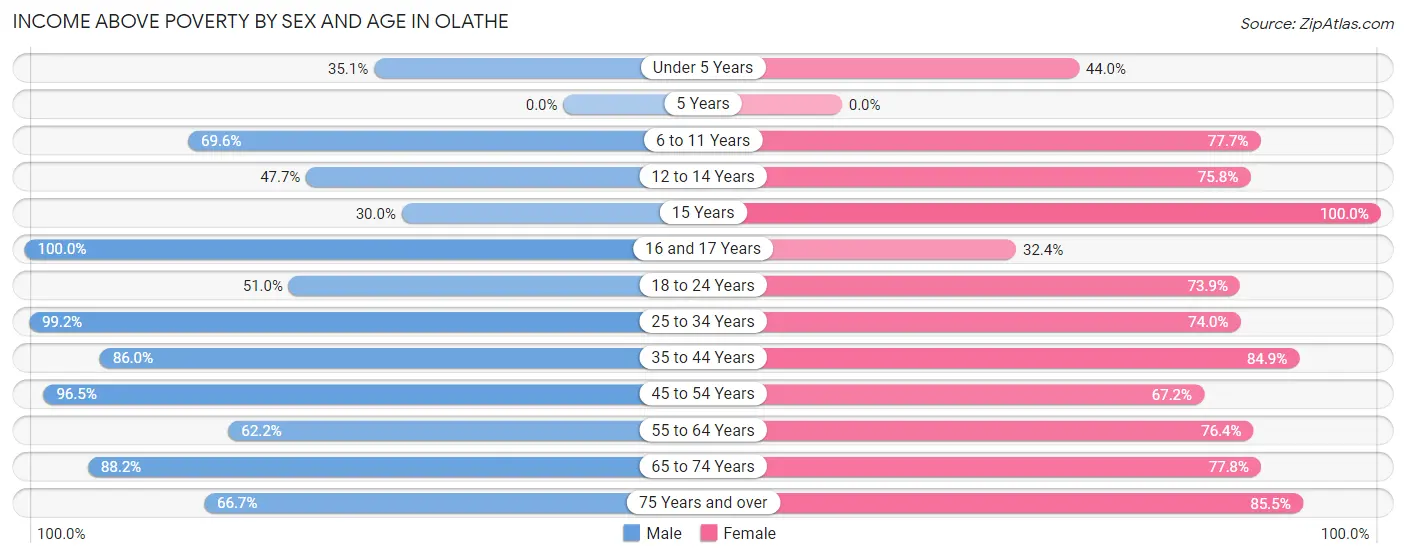
| Age Bracket | Male | Female |
| Under 5 Years | 13 (35.1%) | 11 (44.0%) |
| 5 Years | 0 (0.0%) | 0 (0.0%) |
| 6 to 11 Years | 78 (69.6%) | 66 (77.6%) |
| 12 to 14 Years | 21 (47.7%) | 25 (75.8%) |
| 15 Years | 6 (30.0%) | 2 (100.0%) |
| 16 and 17 Years | 16 (100.0%) | 11 (32.4%) |
| 18 to 24 Years | 53 (51.0%) | 113 (73.9%) |
| 25 to 34 Years | 122 (99.2%) | 54 (74.0%) |
| 35 to 44 Years | 197 (86.0%) | 73 (84.9%) |
| 45 to 54 Years | 165 (96.5%) | 84 (67.2%) |
| 55 to 64 Years | 46 (62.2%) | 55 (76.4%) |
| 65 to 74 Years | 45 (88.2%) | 49 (77.8%) |
| 75 Years and over | 16 (66.7%) | 59 (85.5%) |
| Total | 778 (77.4%) | 602 (73.4%) |
Income Below Poverty Among Married-Couple Families in Olathe
The poverty statistics for married-couple families in Olathe show that 9.2% or 23 of the total 251 families live below the poverty line. Families with 3 or 4 children have the highest poverty rate of 39.1%, comprising of 9 families. On the other hand, families with no children have the lowest poverty rate of 6.0%, which includes 5 families.
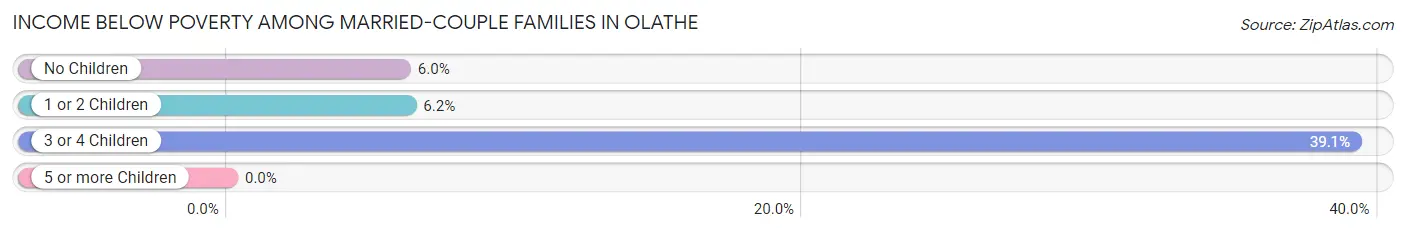
| Children | Above Poverty | Below Poverty |
| No Children | 78 (94.0%) | 5 (6.0%) |
| 1 or 2 Children | 136 (93.8%) | 9 (6.2%) |
| 3 or 4 Children | 14 (60.9%) | 9 (39.1%) |
| 5 or more Children | 0 (0.0%) | 0 (0.0%) |
| Total | 228 (90.8%) | 23 (9.2%) |
Income Below Poverty Among Single-Parent Households in Olathe
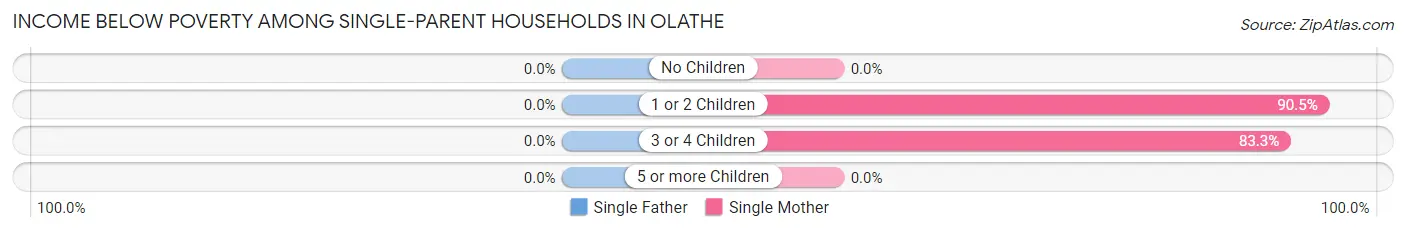
| Children | Single Father | Single Mother |
| No Children | 0 (0.0%) | 0 (0.0%) |
| 1 or 2 Children | 0 (0.0%) | 19 (90.5%) |
| 3 or 4 Children | 0 (0.0%) | 10 (83.3%) |
| 5 or more Children | 0 (0.0%) | 0 (0.0%) |
| Total | 0 (0.0%) | 29 (46.0%) |
Income Below Poverty Among Married-Couple vs Single-Parent Households in Olathe
The poverty data for Olathe shows that 23 of the married-couple family households (9.2%) and 29 of the single-parent households (32.6%) are living below the poverty level. Within the married-couple family households, those with 3 or 4 children have the highest poverty rate, with 9 households (39.1%) falling below the poverty line. Among the single-parent households, those with 3 or 4 children have the highest poverty rate, with 10 household (83.3%) living below poverty.
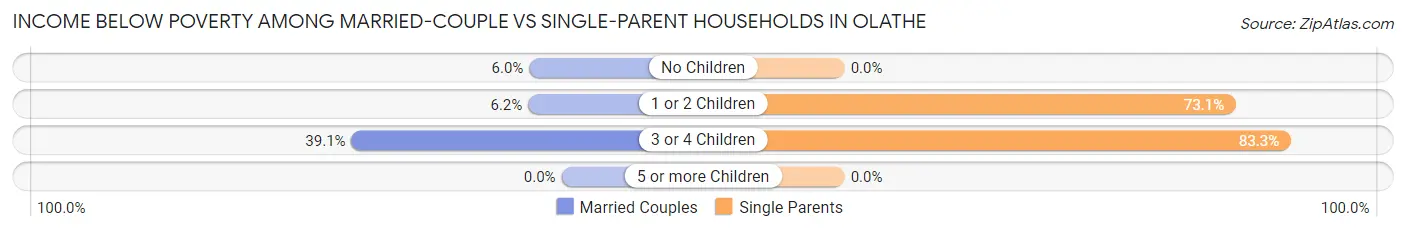
| Children | Married-Couple Families | Single-Parent Households |
| No Children | 5 (6.0%) | 0 (0.0%) |
| 1 or 2 Children | 9 (6.2%) | 19 (73.1%) |
| 3 or 4 Children | 9 (39.1%) | 10 (83.3%) |
| 5 or more Children | 0 (0.0%) | 0 (0.0%) |
| Total | 23 (9.2%) | 29 (32.6%) |
Race in Olathe
The most populous races in Olathe are Hispanic or Latino (1,120 | 58.9%), White / Caucasian (1,039 | 54.7%), and Two or more Races (843 | 44.4%).
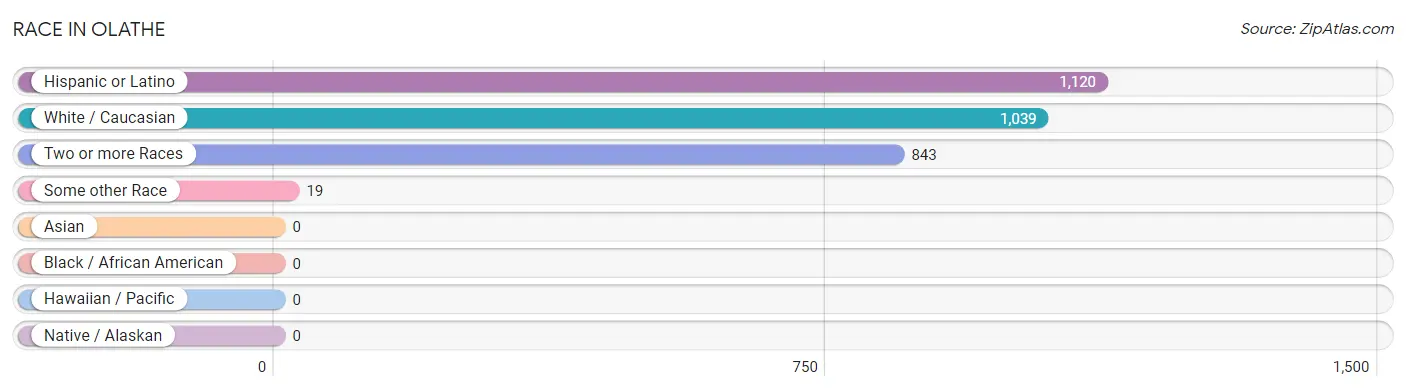
| Race | # Population | % Population |
| Asian | 0 | 0.0% |
| Black / African American | 0 | 0.0% |
| Hawaiian / Pacific | 0 | 0.0% |
| Hispanic or Latino | 1,120 | 58.9% |
| Native / Alaskan | 0 | 0.0% |
| White / Caucasian | 1,039 | 54.7% |
| Two or more Races | 843 | 44.4% |
| Some other Race | 19 | 1.0% |
| Total | 1,901 | 100.0% |
Ancestry in Olathe
The most populous ancestries reported in Olathe are Mexican (1,089 | 57.3%), German (122 | 6.4%), English (97 | 5.1%), French (76 | 4.0%), and Irish (42 | 2.2%), together accounting for 75.0% of all Olathe residents.
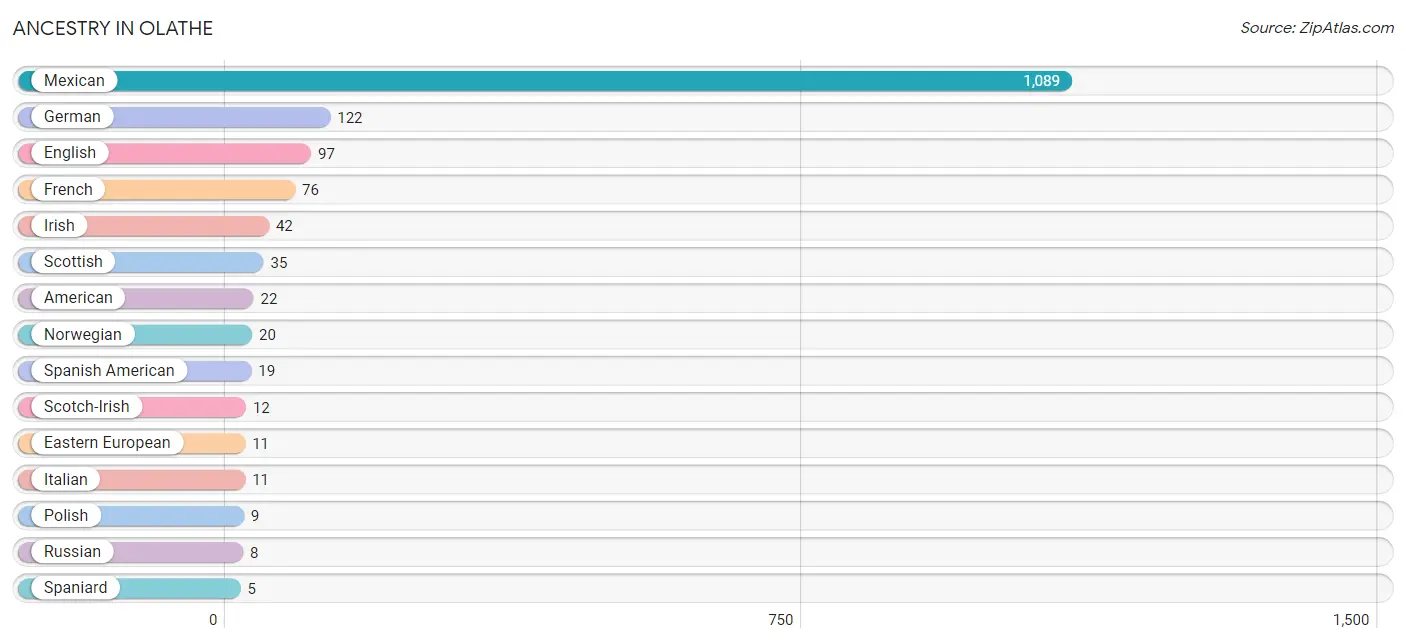
| Ancestry | # Population | % Population |
| American | 22 | 1.2% |
| Australian | 3 | 0.2% |
| British | 3 | 0.2% |
| Czech | 3 | 0.2% |
| Dutch | 3 | 0.2% |
| Eastern European | 11 | 0.6% |
| English | 97 | 5.1% |
| European | 4 | 0.2% |
| French | 76 | 4.0% |
| German | 122 | 6.4% |
| Greek | 2 | 0.1% |
| Irish | 42 | 2.2% |
| Italian | 11 | 0.6% |
| Mexican | 1,089 | 57.3% |
| Norwegian | 20 | 1.1% |
| Polish | 9 | 0.5% |
| Puerto Rican | 2 | 0.1% |
| Russian | 8 | 0.4% |
| Scotch-Irish | 12 | 0.6% |
| Scottish | 35 | 1.8% |
| Spaniard | 5 | 0.3% |
| Spanish | 5 | 0.3% |
| Spanish American | 19 | 1.0% | View All 23 Rows |
Immigrants in Olathe
The most numerous immigrant groups reported in Olathe came from Central America (428 | 22.5%), Latin America (428 | 22.5%), Mexico (428 | 22.5%), Australia (3 | 0.2%), and Europe (3 | 0.2%), together accounting for 67.9% of all Olathe residents.
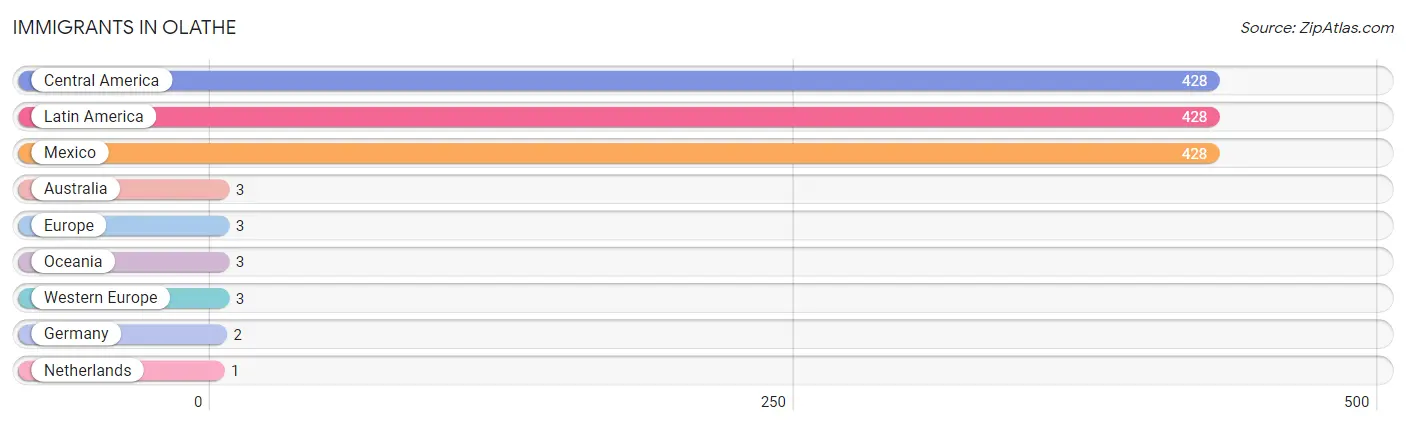
| Immigration Origin | # Population | % Population |
| Australia | 3 | 0.2% |
| Central America | 428 | 22.5% |
| Europe | 3 | 0.2% |
| Germany | 2 | 0.1% |
| Latin America | 428 | 22.5% |
| Mexico | 428 | 22.5% |
| Netherlands | 1 | 0.1% |
| Oceania | 3 | 0.2% |
| Western Europe | 3 | 0.2% | View All 9 Rows |
Sex and Age in Olathe
Sex and Age in Olathe
The most populous age groups in Olathe are 35 to 39 Years (203 | 20.0%) for men and 15 to 19 Years (137 | 15.4%) for women.
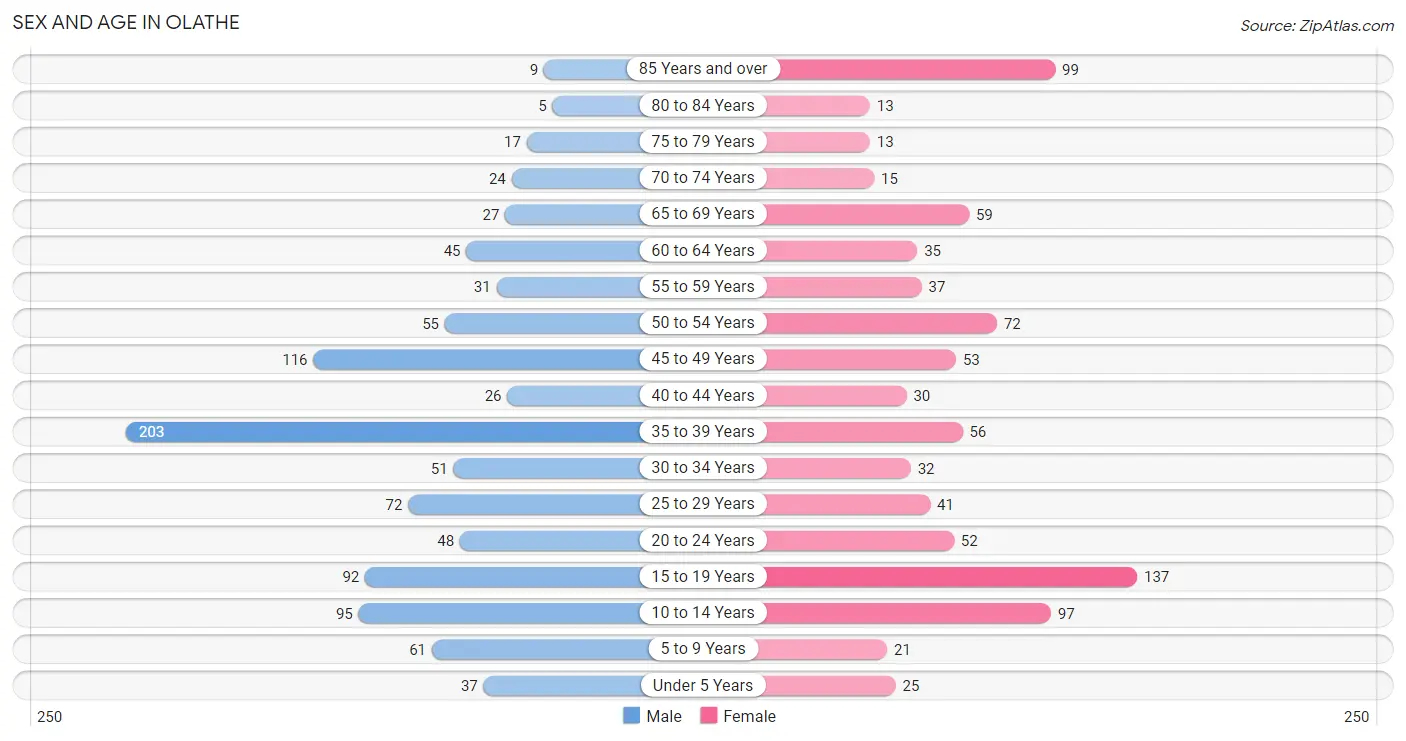
| Age Bracket | Male | Female |
| Under 5 Years | 37 (3.6%) | 25 (2.8%) |
| 5 to 9 Years | 61 (6.0%) | 21 (2.4%) |
| 10 to 14 Years | 95 (9.4%) | 97 (10.9%) |
| 15 to 19 Years | 92 (9.1%) | 137 (15.4%) |
| 20 to 24 Years | 48 (4.7%) | 52 (5.9%) |
| 25 to 29 Years | 72 (7.1%) | 41 (4.6%) |
| 30 to 34 Years | 51 (5.0%) | 32 (3.6%) |
| 35 to 39 Years | 203 (20.0%) | 56 (6.3%) |
| 40 to 44 Years | 26 (2.6%) | 30 (3.4%) |
| 45 to 49 Years | 116 (11.4%) | 53 (6.0%) |
| 50 to 54 Years | 55 (5.4%) | 72 (8.1%) |
| 55 to 59 Years | 31 (3.1%) | 37 (4.2%) |
| 60 to 64 Years | 45 (4.4%) | 35 (4.0%) |
| 65 to 69 Years | 27 (2.7%) | 59 (6.7%) |
| 70 to 74 Years | 24 (2.4%) | 15 (1.7%) |
| 75 to 79 Years | 17 (1.7%) | 13 (1.5%) |
| 80 to 84 Years | 5 (0.5%) | 13 (1.5%) |
| 85 Years and over | 9 (0.9%) | 99 (11.2%) |
| Total | 1,014 (100.0%) | 887 (100.0%) |
Families and Households in Olathe
Median Family Size in Olathe
The median family size in Olathe is 4.44 persons per family, with single female/mother families (63 | 18.5%) accounting for the largest median family size of 4.65 persons per family. On the other hand, single male/father families (26 | 7.6%) represent the smallest median family size with 2.23 persons per family.
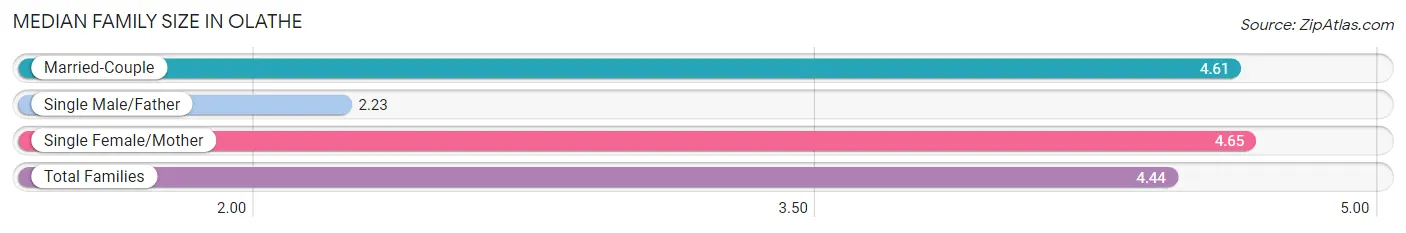
| Family Type | # Families | Family Size |
| Married-Couple | 251 (73.8%) | 4.61 |
| Single Male/Father | 26 (7.6%) | 2.23 |
| Single Female/Mother | 63 (18.5%) | 4.65 |
| Total Families | 340 (100.0%) | 4.44 |
Median Household Size in Olathe
The median household size in Olathe is 3.35 persons per household, with single female/mother households (63 | 12.4%) accounting for the largest median household size of 4.7 persons per household. non-family households (169 | 33.2%) represent the smallest median household size with 1.09 persons per household.
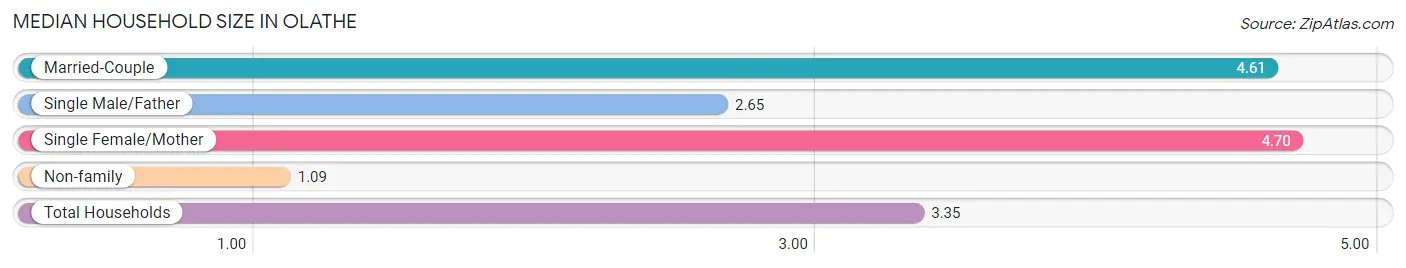
| Household Type | # Households | Household Size |
| Married-Couple | 251 (49.3%) | 4.61 |
| Single Male/Father | 26 (5.1%) | 2.65 |
| Single Female/Mother | 63 (12.4%) | 4.70 |
| Non-family | 169 (33.2%) | 1.09 |
| Total Households | 509 (100.0%) | 3.35 |
Household Size by Marriage Status in Olathe
Out of a total of 509 households in Olathe, 340 (66.8%) are family households, while 169 (33.2%) are nonfamily households. The most numerous type of family households are 2-person households, comprising 93, and the most common type of nonfamily households are 1-person households, comprising 160.
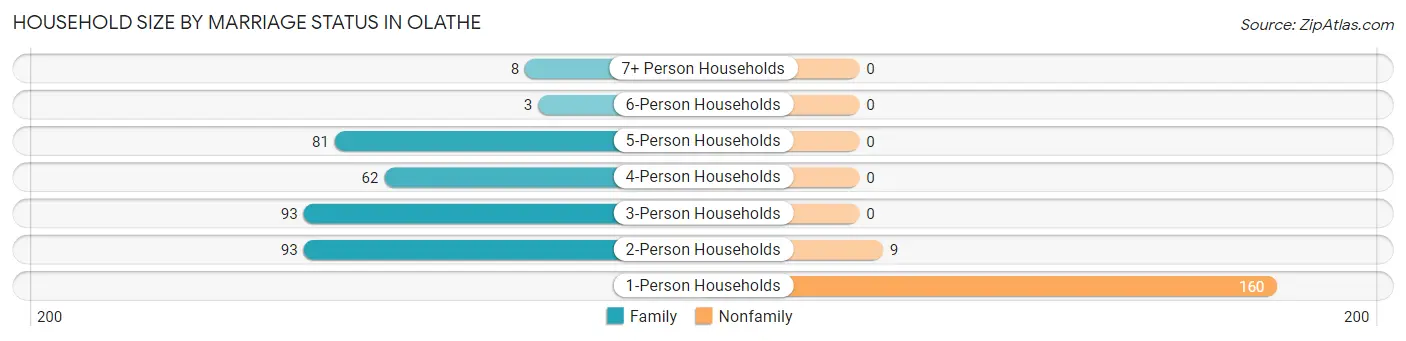
| Household Size | Family Households | Nonfamily Households |
| 1-Person Households | - | 160 (31.4%) |
| 2-Person Households | 93 (18.3%) | 9 (1.8%) |
| 3-Person Households | 93 (18.3%) | 0 (0.0%) |
| 4-Person Households | 62 (12.2%) | 0 (0.0%) |
| 5-Person Households | 81 (15.9%) | 0 (0.0%) |
| 6-Person Households | 3 (0.6%) | 0 (0.0%) |
| 7+ Person Households | 8 (1.6%) | 0 (0.0%) |
| Total | 340 (66.8%) | 169 (33.2%) |
Female Fertility in Olathe
Fertility by Age in Olathe
Average fertility rate in Olathe is 12.0 births per 1,000 women. Women in the age bracket of 20 to 34 years have the highest fertility rate with 32.0 births per 1,000 women. Women in the age bracket of 20 to 34 years acount for 80.0% of all women with births.
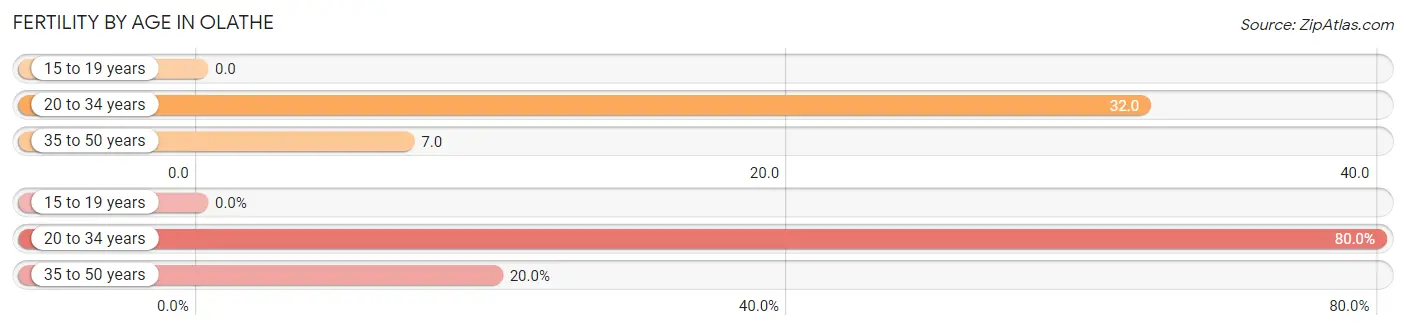
| Age Bracket | Women with Births | Births / 1,000 Women |
| 15 to 19 years | 0 (0.0%) | 0.0 |
| 20 to 34 years | 4 (80.0%) | 32.0 |
| 35 to 50 years | 1 (20.0%) | 7.0 |
| Total | 5 (100.0%) | 12.0 |
Fertility by Age by Marriage Status in Olathe
80.0% of women with births (5) in Olathe are married. The highest percentage of unmarried women with births falls into 35 to 50 years age bracket with 100.0% of them unmarried at the time of birth, while the lowest percentage of unmarried women with births belong to 20 to 34 years age bracket with 0.0% of them unmarried.
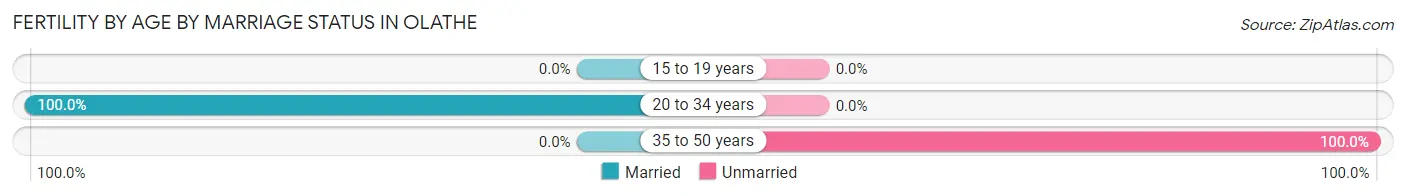
| Age Bracket | Married | Unmarried |
| 15 to 19 years | 0 (0.0%) | 0 (0.0%) |
| 20 to 34 years | 4 (100.0%) | 0 (0.0%) |
| 35 to 50 years | 0 (0.0%) | 1 (100.0%) |
| Total | 4 (80.0%) | 1 (20.0%) |
Fertility by Education in Olathe
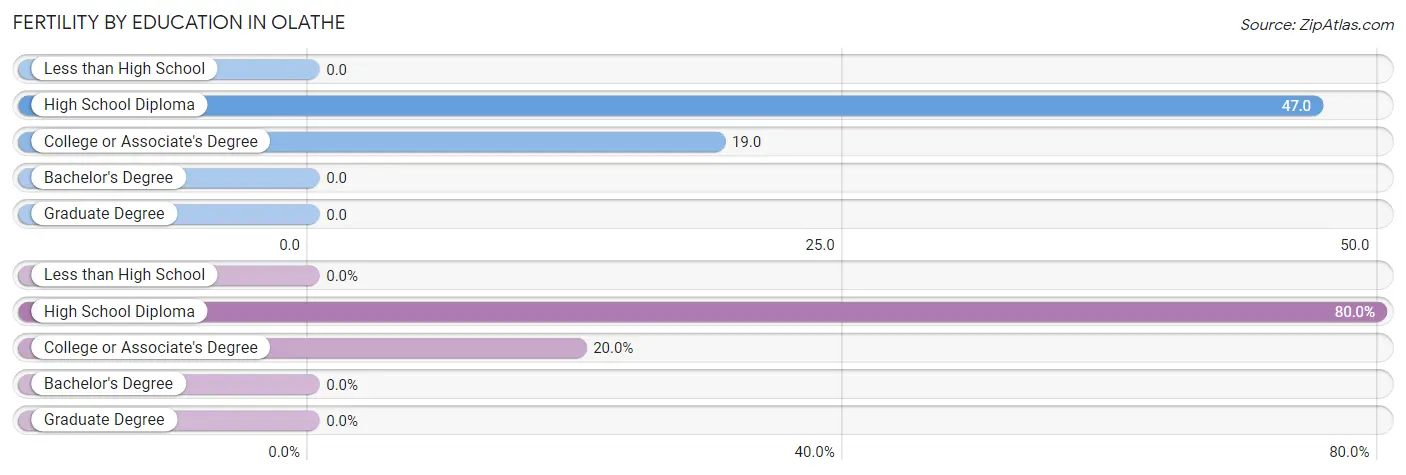
| Educational Attainment | Women with Births | Births / 1,000 Women |
| Less than High School | 0 (0.0%) | 0.0 |
| High School Diploma | 4 (80.0%) | 47.0 |
| College or Associate's Degree | 1 (20.0%) | 19.0 |
| Bachelor's Degree | 0 (0.0%) | 0.0 |
| Graduate Degree | 0 (0.0%) | 0.0 |
| Total | 5 (100.0%) | 12.0 |
Fertility by Education by Marriage Status in Olathe
20.0% of women with births in Olathe are unmarried. Women with the educational attainment of high school diploma are most likely to be married with 100.0% of them married at childbirth, while women with the educational attainment of college or associate's degree are least likely to be married with 100.0% of them unmarried at childbirth.
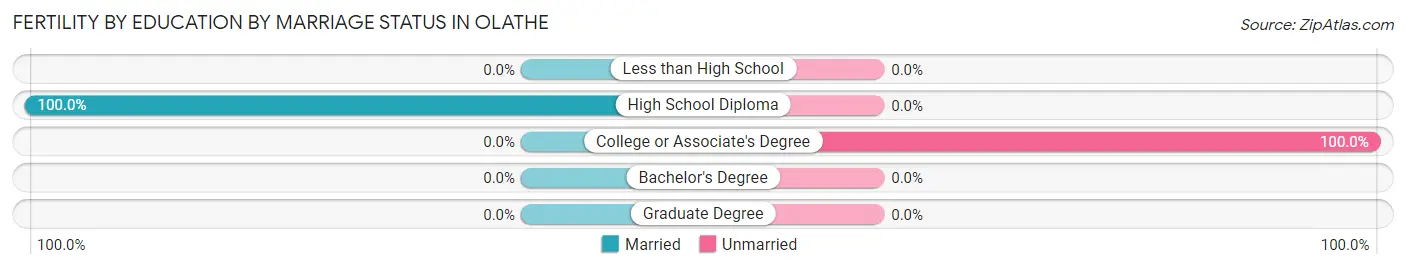
| Educational Attainment | Married | Unmarried |
| Less than High School | 0 (0.0%) | 0 (0.0%) |
| High School Diploma | 4 (100.0%) | 0 (0.0%) |
| College or Associate's Degree | 0 (0.0%) | 1 (100.0%) |
| Bachelor's Degree | 0 (0.0%) | 0 (0.0%) |
| Graduate Degree | 0 (0.0%) | 0 (0.0%) |
| Total | 4 (80.0%) | 1 (20.0%) |
Employment Characteristics in Olathe
Employment by Class of Employer in Olathe
Among the 767 employed individuals in Olathe, private company employees (516 | 67.3%), self-employed (not incorporated) (163 | 21.2%), and local government employees (38 | 5.0%) make up the most common classes of employment.
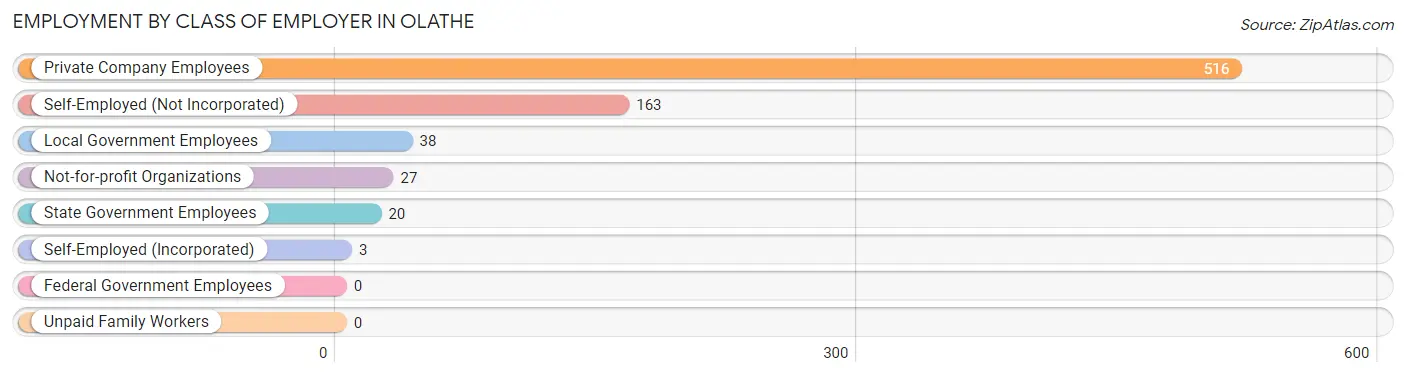
| Employer Class | # Employees | % Employees |
| Private Company Employees | 516 | 67.3% |
| Self-Employed (Incorporated) | 3 | 0.4% |
| Self-Employed (Not Incorporated) | 163 | 21.2% |
| Not-for-profit Organizations | 27 | 3.5% |
| Local Government Employees | 38 | 5.0% |
| State Government Employees | 20 | 2.6% |
| Federal Government Employees | 0 | 0.0% |
| Unpaid Family Workers | 0 | 0.0% |
| Total | 767 | 100.0% |
Employment Status by Age in Olathe
According to the labor force statistics for Olathe, out of the total population over 16 years of age (1,543), 52.1% or 804 individuals are in the labor force, with 4.6% or 37 of them unemployed. The age group with the highest labor force participation rate is 25 to 29 years, with 100.0% or 113 individuals in the labor force. Within the labor force, the 60 to 64 years age range has the highest percentage of unemployed individuals, with 42.2% or 19 of them being unemployed.
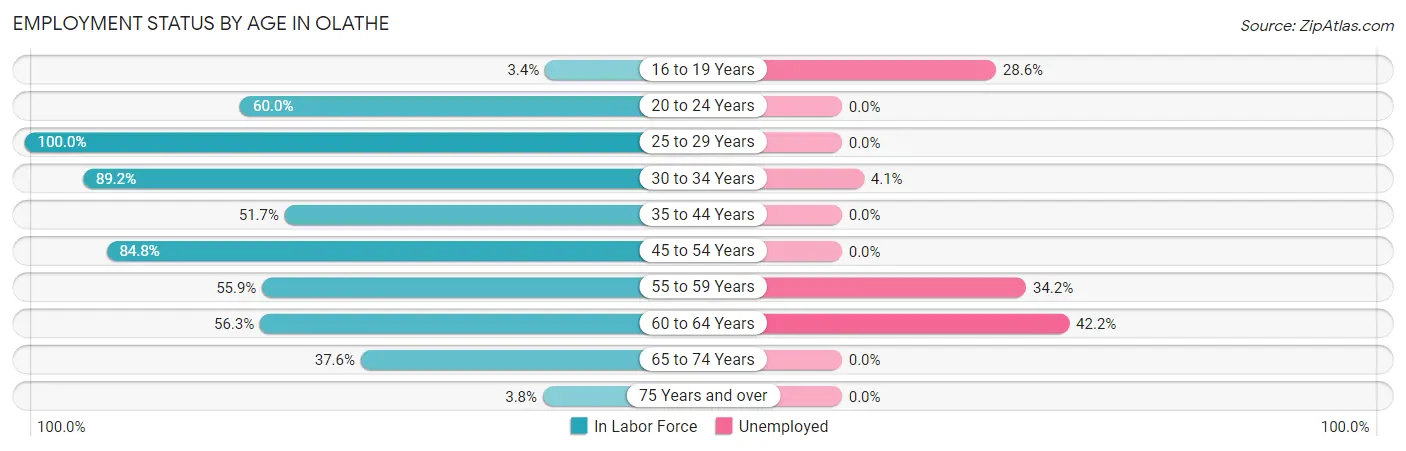
| Age Bracket | In Labor Force | Unemployed |
| 16 to 19 Years | 7 (3.4%) | 2 (28.6%) |
| 20 to 24 Years | 60 (60.0%) | 0 (0.0%) |
| 25 to 29 Years | 113 (100.0%) | 0 (0.0%) |
| 30 to 34 Years | 74 (89.2%) | 3 (4.1%) |
| 35 to 44 Years | 163 (51.7%) | 0 (0.0%) |
| 45 to 54 Years | 251 (84.8%) | 0 (0.0%) |
| 55 to 59 Years | 38 (55.9%) | 13 (34.2%) |
| 60 to 64 Years | 45 (56.3%) | 19 (42.2%) |
| 65 to 74 Years | 47 (37.6%) | 0 (0.0%) |
| 75 Years and over | 6 (3.8%) | 0 (0.0%) |
| Total | 804 (52.1%) | 37 (4.6%) |
Employment Status by Educational Attainment in Olathe
According to labor force statistics for Olathe, 71.6% of individuals (684) out of the total population between 25 and 64 years of age (955) are in the labor force, with 5.1% or 35 of them being unemployed. The group with the highest labor force participation rate are those with the educational attainment of high school diploma, with 94.9% or 373 individuals in the labor force. Within the labor force, individuals with less than high school education have the highest percentage of unemployment, with 21.4% or 25 of them being unemployed.
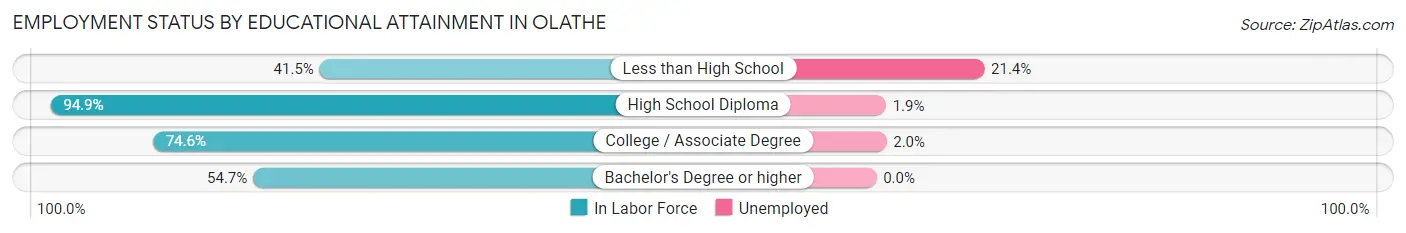
| Educational Attainment | In Labor Force | Unemployed |
| Less than High School | 117 (41.5%) | 60 (21.4%) |
| High School Diploma | 373 (94.9%) | 7 (1.9%) |
| College / Associate Degree | 153 (74.6%) | 4 (2.0%) |
| Bachelor's Degree or higher | 41 (54.7%) | 0 (0.0%) |
| Total | 684 (71.6%) | 49 (5.1%) |
Employment Occupations by Sex in Olathe
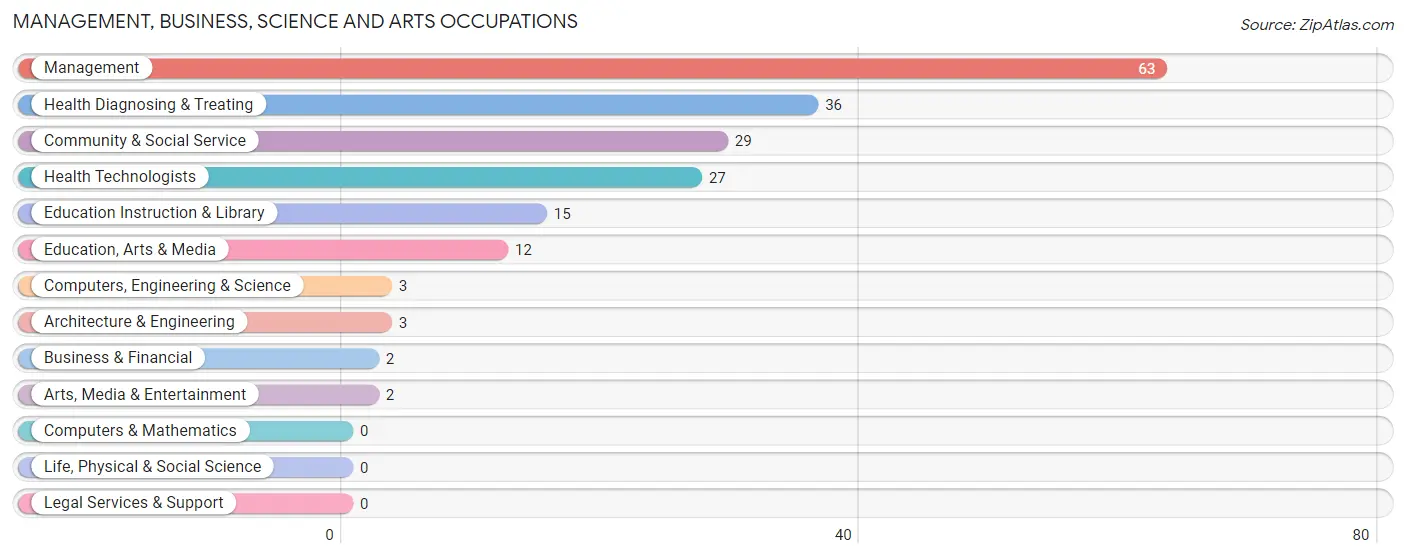
Management, Business, Science and Arts Occupations
The most common Management, Business, Science and Arts occupations in Olathe are Management (63 | 8.2%), Health Diagnosing & Treating (36 | 4.7%), Community & Social Service (29 | 3.8%), Health Technologists (27 | 3.5%), and Education Instruction & Library (15 | 2.0%).
Management, Business, Science and Arts Occupations by Sex
Within the Management, Business, Science and Arts occupations in Olathe, the most male-oriented occupations are Computers, Engineering & Science (100.0%), Architecture & Engineering (100.0%), and Management (66.7%), while the most female-oriented occupations are Business & Financial (100.0%), Education Instruction & Library (100.0%), and Arts, Media & Entertainment (100.0%).
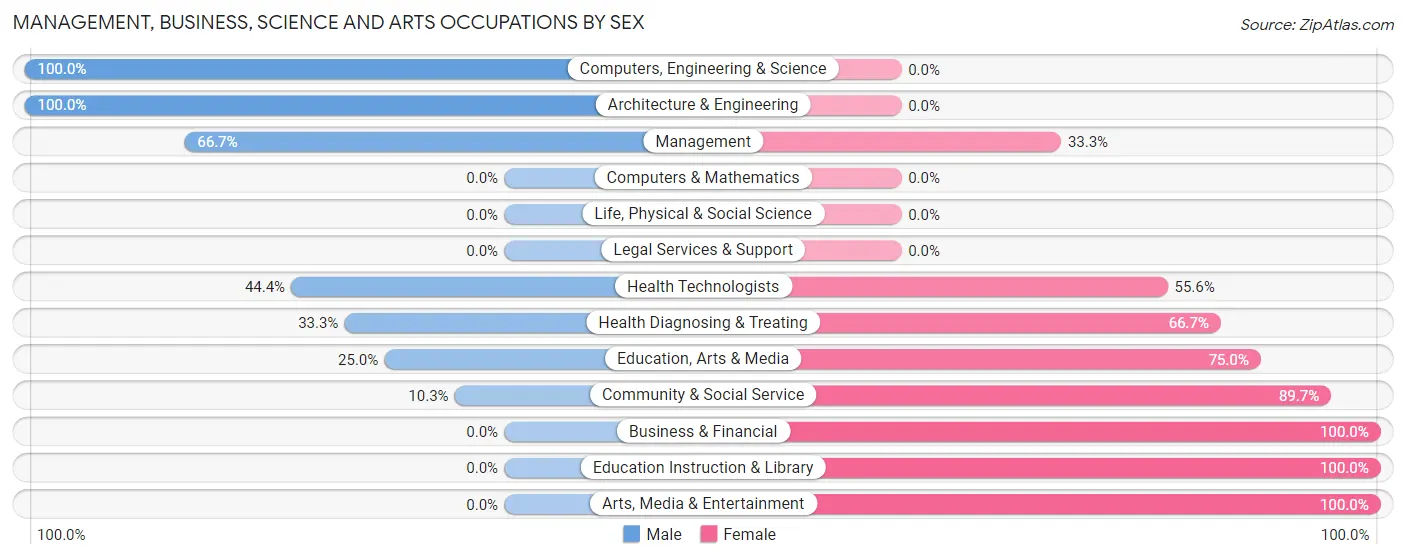
| Occupation | Male | Female |
| Management | 42 (66.7%) | 21 (33.3%) |
| Business & Financial | 0 (0.0%) | 2 (100.0%) |
| Computers, Engineering & Science | 3 (100.0%) | 0 (0.0%) |
| Computers & Mathematics | 0 (0.0%) | 0 (0.0%) |
| Architecture & Engineering | 3 (100.0%) | 0 (0.0%) |
| Life, Physical & Social Science | 0 (0.0%) | 0 (0.0%) |
| Community & Social Service | 3 (10.3%) | 26 (89.7%) |
| Education, Arts & Media | 3 (25.0%) | 9 (75.0%) |
| Legal Services & Support | 0 (0.0%) | 0 (0.0%) |
| Education Instruction & Library | 0 (0.0%) | 15 (100.0%) |
| Arts, Media & Entertainment | 0 (0.0%) | 2 (100.0%) |
| Health Diagnosing & Treating | 12 (33.3%) | 24 (66.7%) |
| Health Technologists | 12 (44.4%) | 15 (55.6%) |
| Total (Category) | 60 (45.1%) | 73 (54.9%) |
| Total (Overall) | 520 (67.8%) | 247 (32.2%) |
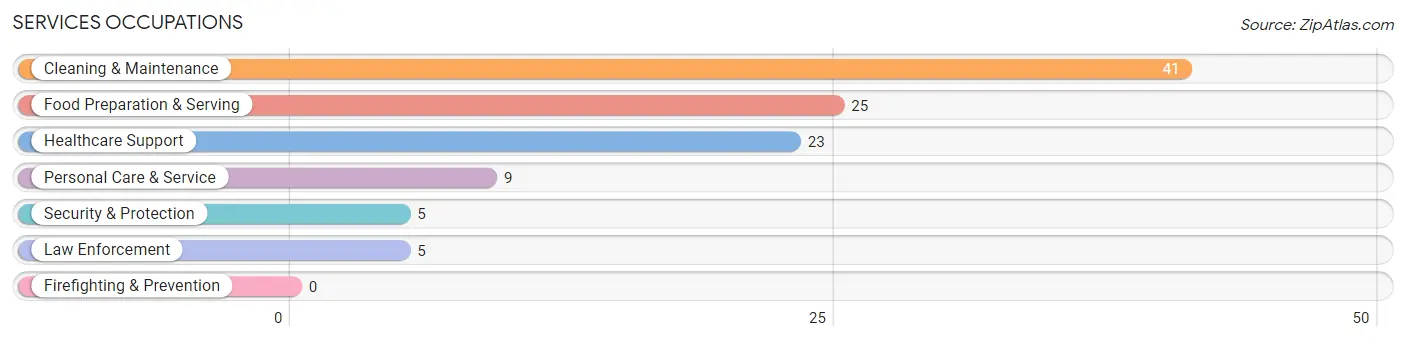
Services Occupations
The most common Services occupations in Olathe are Cleaning & Maintenance (41 | 5.3%), Food Preparation & Serving (25 | 3.3%), Healthcare Support (23 | 3.0%), Personal Care & Service (9 | 1.2%), and Security & Protection (5 | 0.6%).
Services Occupations by Sex
Within the Services occupations in Olathe, the most male-oriented occupations are Security & Protection (100.0%), Law Enforcement (100.0%), and Cleaning & Maintenance (63.4%), while the most female-oriented occupations are Healthcare Support (100.0%), Food Preparation & Serving (100.0%), and Personal Care & Service (100.0%).
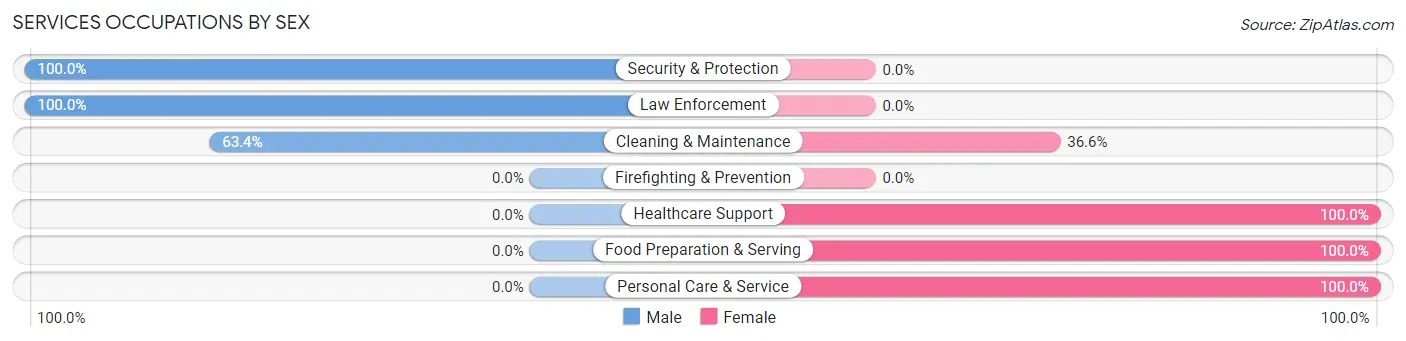
| Occupation | Male | Female |
| Healthcare Support | 0 (0.0%) | 23 (100.0%) |
| Security & Protection | 5 (100.0%) | 0 (0.0%) |
| Firefighting & Prevention | 0 (0.0%) | 0 (0.0%) |
| Law Enforcement | 5 (100.0%) | 0 (0.0%) |
| Food Preparation & Serving | 0 (0.0%) | 25 (100.0%) |
| Cleaning & Maintenance | 26 (63.4%) | 15 (36.6%) |
| Personal Care & Service | 0 (0.0%) | 9 (100.0%) |
| Total (Category) | 31 (30.1%) | 72 (69.9%) |
| Total (Overall) | 520 (67.8%) | 247 (32.2%) |
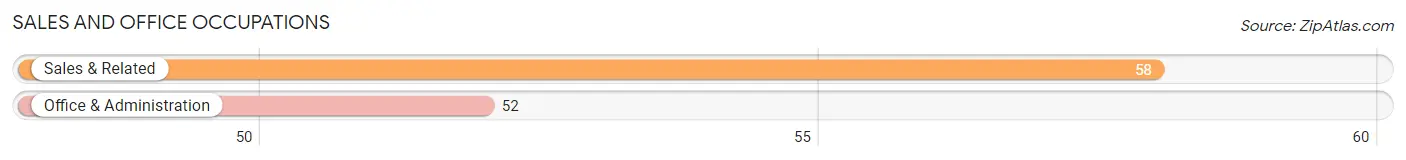
Sales and Office Occupations
The most common Sales and Office occupations in Olathe are Sales & Related (58 | 7.6%), and Office & Administration (52 | 6.8%).
Sales and Office Occupations by Sex
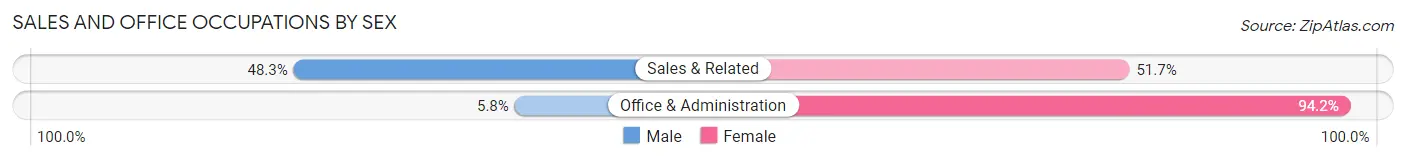
| Occupation | Male | Female |
| Sales & Related | 28 (48.3%) | 30 (51.7%) |
| Office & Administration | 3 (5.8%) | 49 (94.2%) |
| Total (Category) | 31 (28.2%) | 79 (71.8%) |
| Total (Overall) | 520 (67.8%) | 247 (32.2%) |
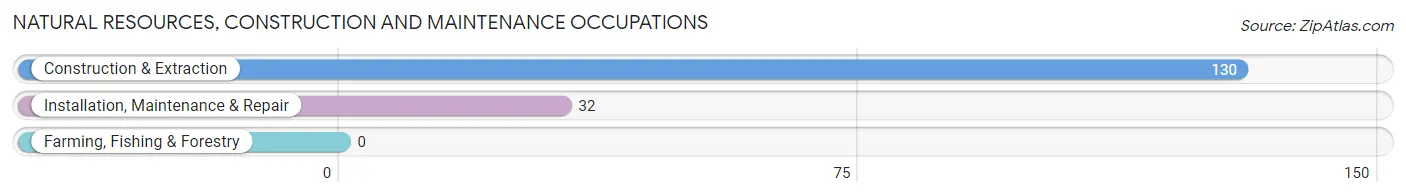
Natural Resources, Construction and Maintenance Occupations
The most common Natural Resources, Construction and Maintenance occupations in Olathe are Construction & Extraction (130 | 17.0%), and Installation, Maintenance & Repair (32 | 4.2%).
Natural Resources, Construction and Maintenance Occupations by Sex
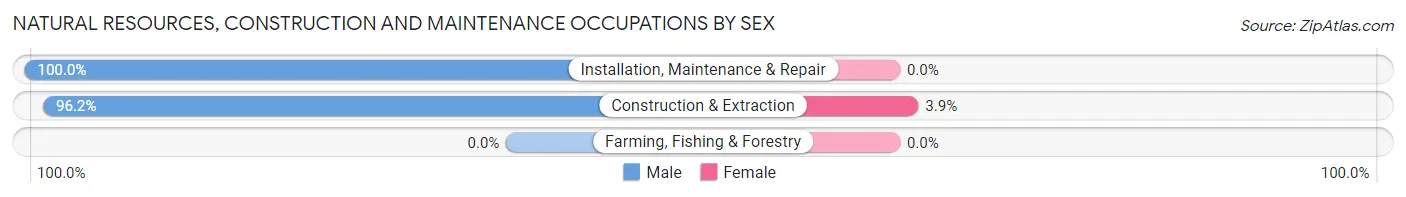
| Occupation | Male | Female |
| Farming, Fishing & Forestry | 0 (0.0%) | 0 (0.0%) |
| Construction & Extraction | 125 (96.2%) | 5 (3.8%) |
| Installation, Maintenance & Repair | 32 (100.0%) | 0 (0.0%) |
| Total (Category) | 157 (96.9%) | 5 (3.1%) |
| Total (Overall) | 520 (67.8%) | 247 (32.2%) |
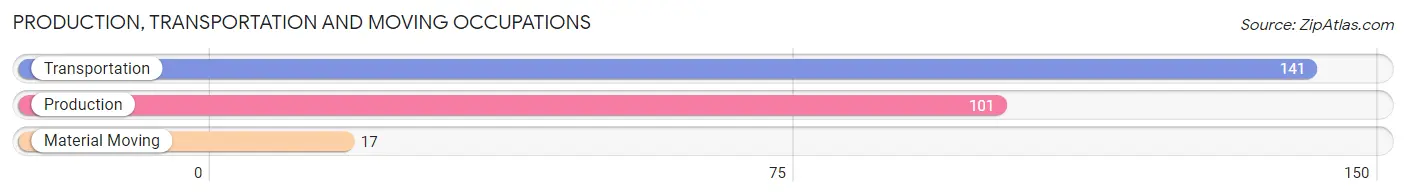
Production, Transportation and Moving Occupations
The most common Production, Transportation and Moving occupations in Olathe are Transportation (141 | 18.4%), Production (101 | 13.2%), and Material Moving (17 | 2.2%).
Production, Transportation and Moving Occupations by Sex
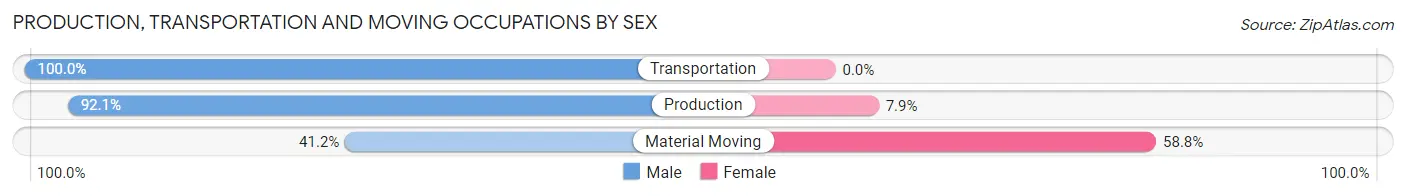
| Occupation | Male | Female |
| Production | 93 (92.1%) | 8 (7.9%) |
| Transportation | 141 (100.0%) | 0 (0.0%) |
| Material Moving | 7 (41.2%) | 10 (58.8%) |
| Total (Category) | 241 (93.0%) | 18 (7.0%) |
| Total (Overall) | 520 (67.8%) | 247 (32.2%) |
Employment Industries by Sex in Olathe
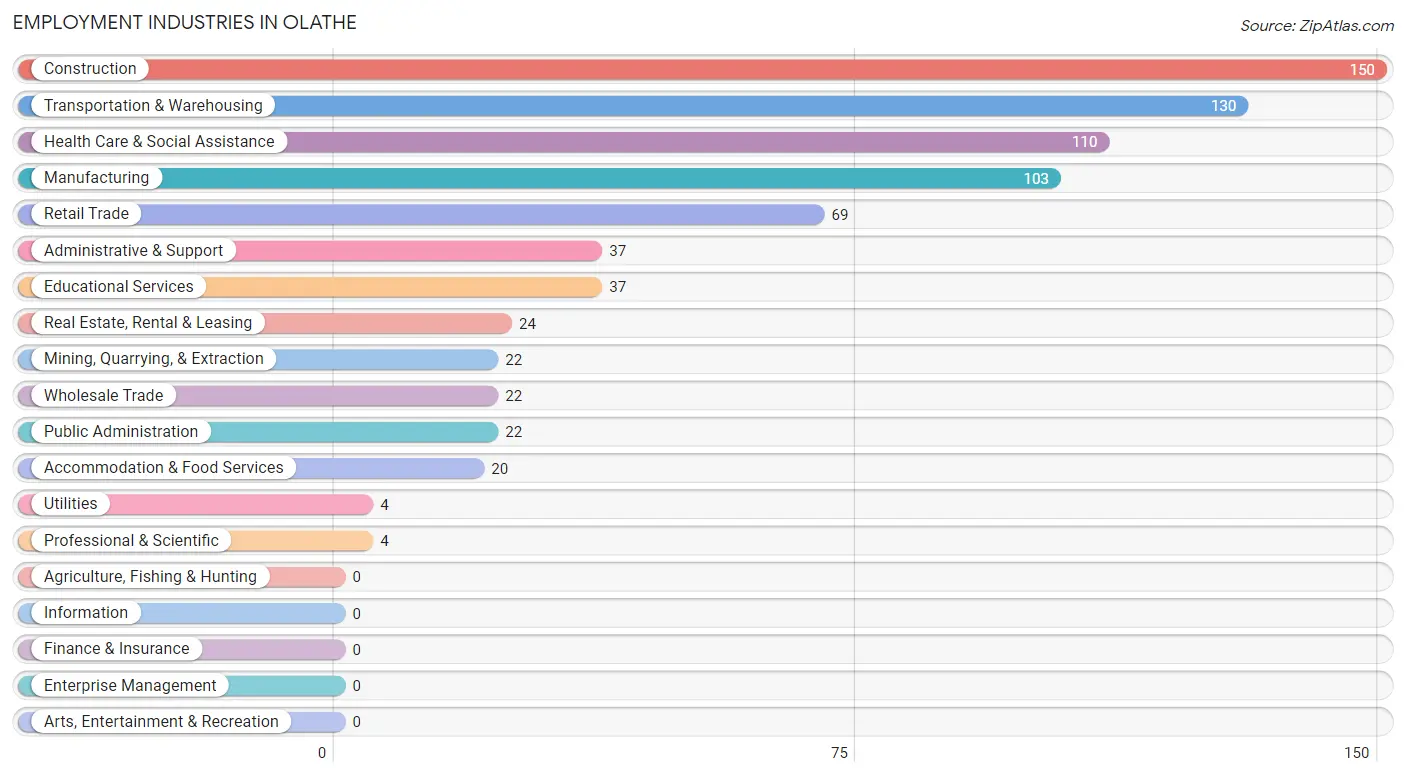
Employment Industries in Olathe
The major employment industries in Olathe include Construction (150 | 19.6%), Transportation & Warehousing (130 | 17.0%), Health Care & Social Assistance (110 | 14.3%), Manufacturing (103 | 13.4%), and Retail Trade (69 | 9.0%).
Employment Industries by Sex in Olathe
The Olathe industries that see more men than women are Mining, Quarrying, & Extraction (100.0%), Wholesale Trade (100.0%), and Transportation & Warehousing (100.0%), whereas the industries that tend to have a higher number of women are Real Estate, Rental & Leasing (100.0%), Professional & Scientific (100.0%), and Health Care & Social Assistance (86.4%).
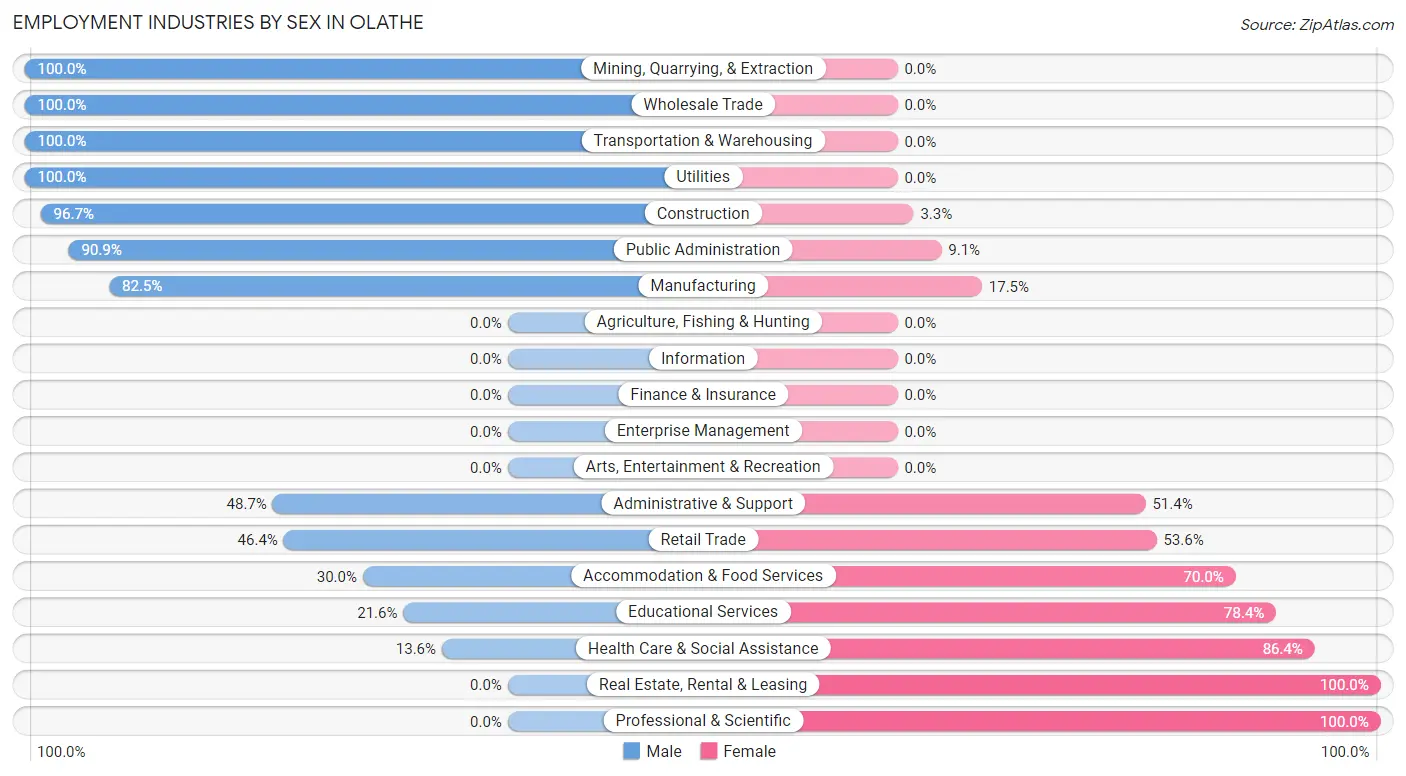
| Industry | Male | Female |
| Agriculture, Fishing & Hunting | 0 (0.0%) | 0 (0.0%) |
| Mining, Quarrying, & Extraction | 22 (100.0%) | 0 (0.0%) |
| Construction | 145 (96.7%) | 5 (3.3%) |
| Manufacturing | 85 (82.5%) | 18 (17.5%) |
| Wholesale Trade | 22 (100.0%) | 0 (0.0%) |
| Retail Trade | 32 (46.4%) | 37 (53.6%) |
| Transportation & Warehousing | 130 (100.0%) | 0 (0.0%) |
| Utilities | 4 (100.0%) | 0 (0.0%) |
| Information | 0 (0.0%) | 0 (0.0%) |
| Finance & Insurance | 0 (0.0%) | 0 (0.0%) |
| Real Estate, Rental & Leasing | 0 (0.0%) | 24 (100.0%) |
| Professional & Scientific | 0 (0.0%) | 4 (100.0%) |
| Enterprise Management | 0 (0.0%) | 0 (0.0%) |
| Administrative & Support | 18 (48.6%) | 19 (51.3%) |
| Educational Services | 8 (21.6%) | 29 (78.4%) |
| Health Care & Social Assistance | 15 (13.6%) | 95 (86.4%) |
| Arts, Entertainment & Recreation | 0 (0.0%) | 0 (0.0%) |
| Accommodation & Food Services | 6 (30.0%) | 14 (70.0%) |
| Public Administration | 20 (90.9%) | 2 (9.1%) |
| Total | 520 (67.8%) | 247 (32.2%) |
Education in Olathe
School Enrollment in Olathe
The most common levels of schooling among the 531 students in Olathe are high school (224 | 42.2%), elementary school (153 | 28.8%), and middle school (114 | 21.5%).
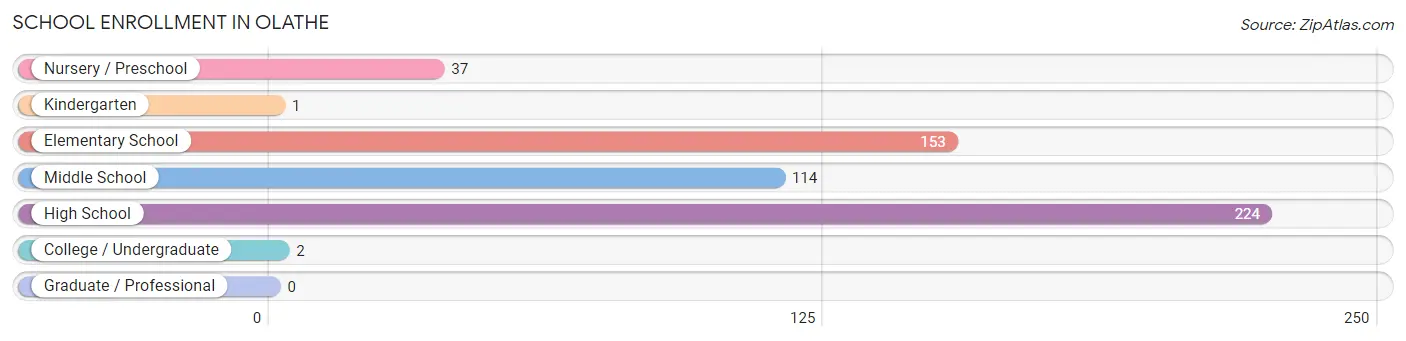
| School Level | # Students | % Students |
| Nursery / Preschool | 37 | 7.0% |
| Kindergarten | 1 | 0.2% |
| Elementary School | 153 | 28.8% |
| Middle School | 114 | 21.5% |
| High School | 224 | 42.2% |
| College / Undergraduate | 2 | 0.4% |
| Graduate / Professional | 0 | 0.0% |
| Total | 531 | 100.0% |
School Enrollment by Age by Funding Source in Olathe
Out of a total of 531 students who are enrolled in schools in Olathe, 55 (10.4%) attend a private institution, while the remaining 476 (89.6%) are enrolled in public schools. The age group of 35 years and over has the highest likelihood of being enrolled in private schools, with 2 (100.0% in the age bracket) enrolled. Conversely, the age group of 3 to 4 year olds has the lowest likelihood of being enrolled in a private school, with 37 (100.0% in the age bracket) attending a public institution.
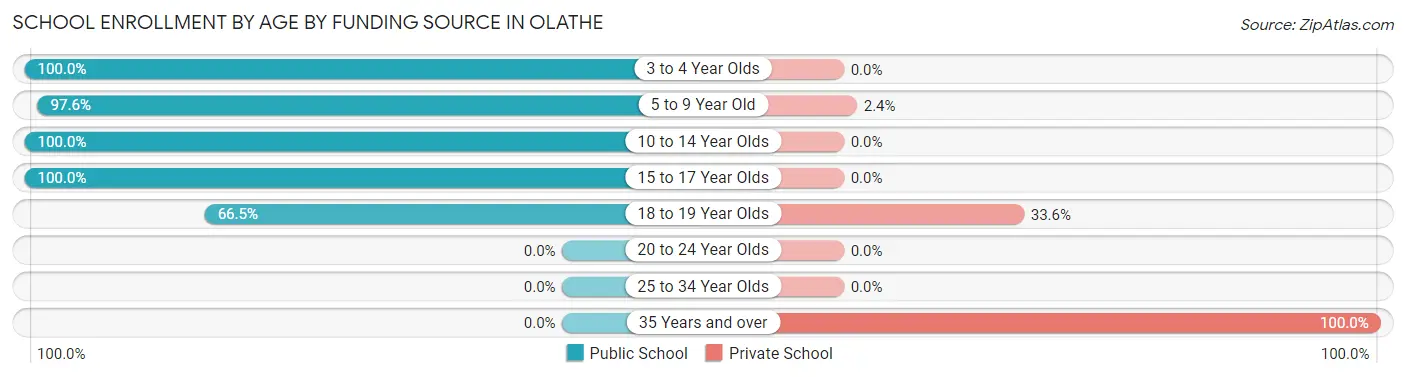
| Age Bracket | Public School | Private School |
| 3 to 4 Year Olds | 37 (100.0%) | 0 (0.0%) |
| 5 to 9 Year Old | 80 (97.6%) | 2 (2.4%) |
| 10 to 14 Year Olds | 186 (100.0%) | 0 (0.0%) |
| 15 to 17 Year Olds | 72 (100.0%) | 0 (0.0%) |
| 18 to 19 Year Olds | 101 (66.4%) | 51 (33.6%) |
| 20 to 24 Year Olds | 0 (0.0%) | 0 (0.0%) |
| 25 to 34 Year Olds | 0 (0.0%) | 0 (0.0%) |
| 35 Years and over | 0 (0.0%) | 2 (100.0%) |
| Total | 476 (89.6%) | 55 (10.4%) |
Educational Attainment by Field of Study in Olathe
Business (35 | 35.7%), education (22 | 22.5%), science & technology (12 | 12.2%), liberal arts & history (12 | 12.2%), and engineering (7 | 7.1%) are the most common fields of study among 98 individuals in Olathe who have obtained a bachelor's degree or higher.
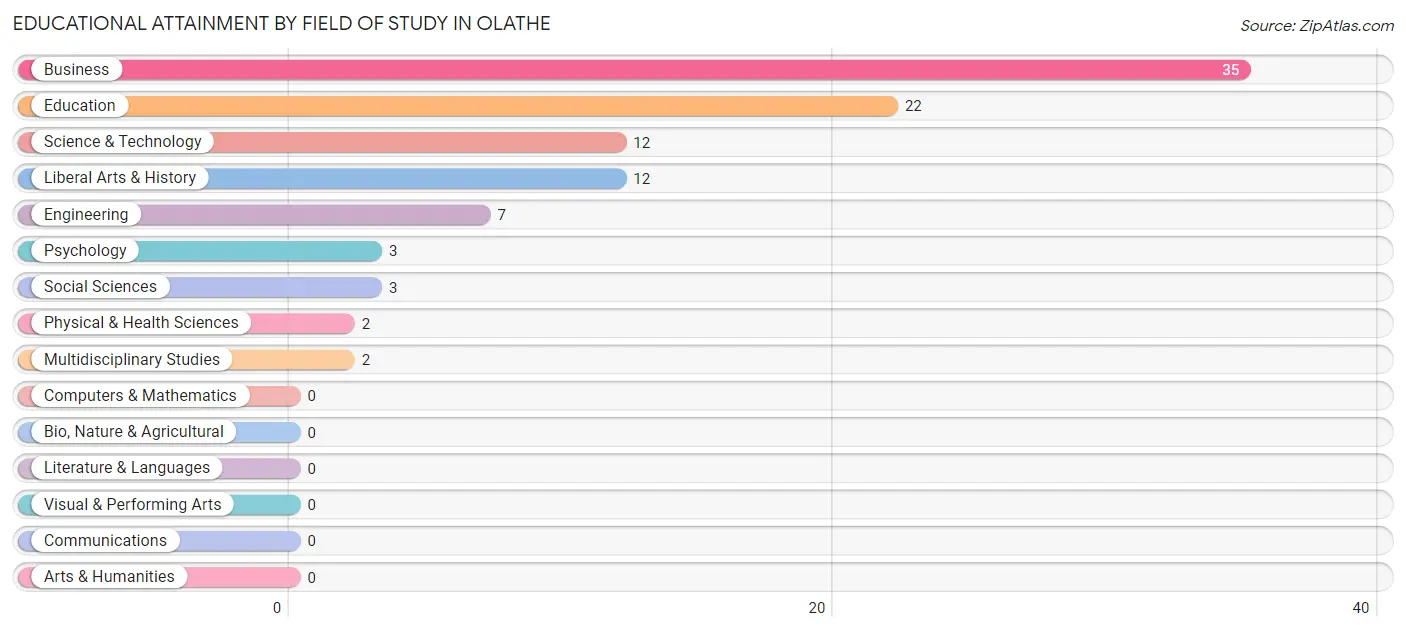
| Field of Study | # Graduates | % Graduates |
| Computers & Mathematics | 0 | 0.0% |
| Bio, Nature & Agricultural | 0 | 0.0% |
| Physical & Health Sciences | 2 | 2.0% |
| Psychology | 3 | 3.1% |
| Social Sciences | 3 | 3.1% |
| Engineering | 7 | 7.1% |
| Multidisciplinary Studies | 2 | 2.0% |
| Science & Technology | 12 | 12.2% |
| Business | 35 | 35.7% |
| Education | 22 | 22.5% |
| Literature & Languages | 0 | 0.0% |
| Liberal Arts & History | 12 | 12.2% |
| Visual & Performing Arts | 0 | 0.0% |
| Communications | 0 | 0.0% |
| Arts & Humanities | 0 | 0.0% |
| Total | 98 | 100.0% |
Transportation & Commute in Olathe
Vehicle Availability by Sex in Olathe
The most prevalent vehicle ownership categories in Olathe are males with 2 vehicles (251, accounting for 48.7%) and females with 2 vehicles (95, making up 105.5%).
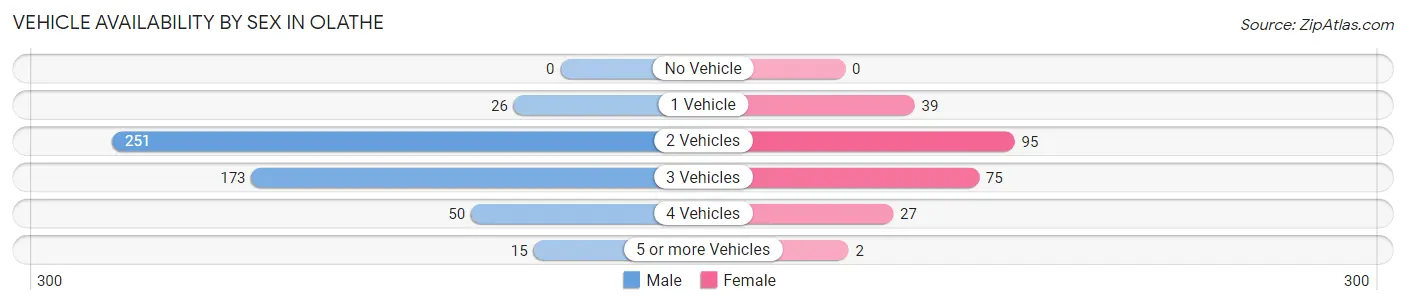
| Vehicles Available | Male | Female |
| No Vehicle | 0 (0.0%) | 0 (0.0%) |
| 1 Vehicle | 26 (5.1%) | 39 (16.4%) |
| 2 Vehicles | 251 (48.7%) | 95 (39.9%) |
| 3 Vehicles | 173 (33.6%) | 75 (31.5%) |
| 4 Vehicles | 50 (9.7%) | 27 (11.3%) |
| 5 or more Vehicles | 15 (2.9%) | 2 (0.8%) |
| Total | 515 (100.0%) | 238 (100.0%) |
Commute Time in Olathe
The most frequently occuring commute durations in Olathe are 15 to 19 minutes (196 commuters, 30.4%), 20 to 24 minutes (147 commuters, 22.8%), and 5 to 9 minutes (64 commuters, 9.9%).
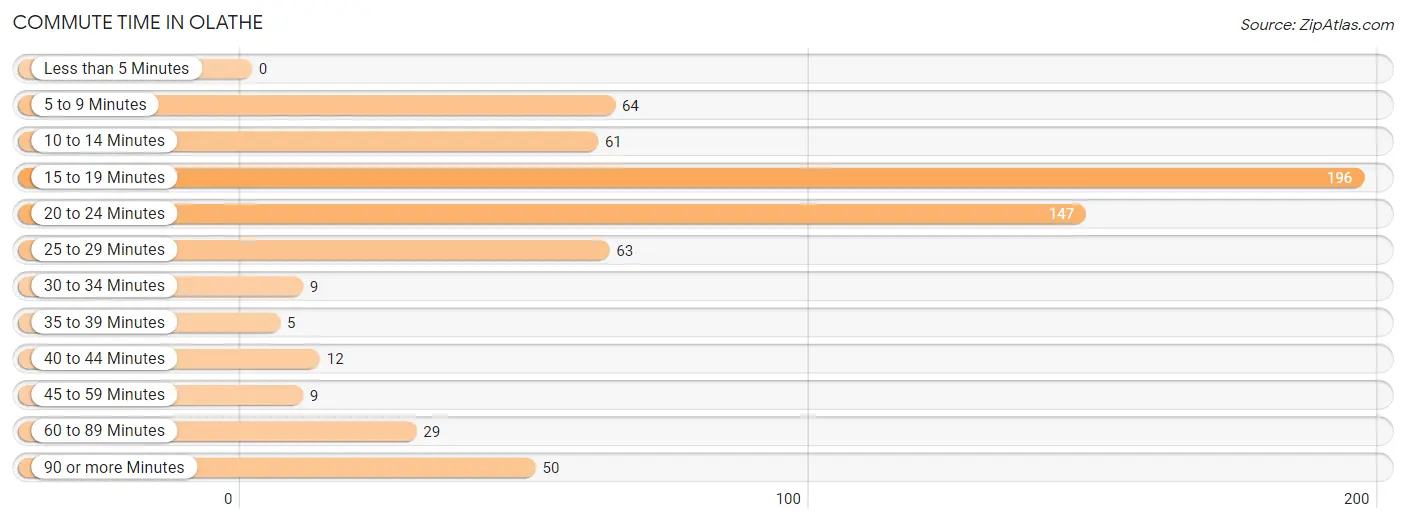
| Commute Time | # Commuters | % Commuters |
| Less than 5 Minutes | 0 | 0.0% |
| 5 to 9 Minutes | 64 | 9.9% |
| 10 to 14 Minutes | 61 | 9.5% |
| 15 to 19 Minutes | 196 | 30.4% |
| 20 to 24 Minutes | 147 | 22.8% |
| 25 to 29 Minutes | 63 | 9.8% |
| 30 to 34 Minutes | 9 | 1.4% |
| 35 to 39 Minutes | 5 | 0.8% |
| 40 to 44 Minutes | 12 | 1.9% |
| 45 to 59 Minutes | 9 | 1.4% |
| 60 to 89 Minutes | 29 | 4.5% |
| 90 or more Minutes | 50 | 7.7% |
Commute Time by Sex in Olathe
The most common commute times in Olathe are 15 to 19 minutes (160 commuters, 37.5%) for males and 20 to 24 minutes (104 commuters, 47.7%) for females.
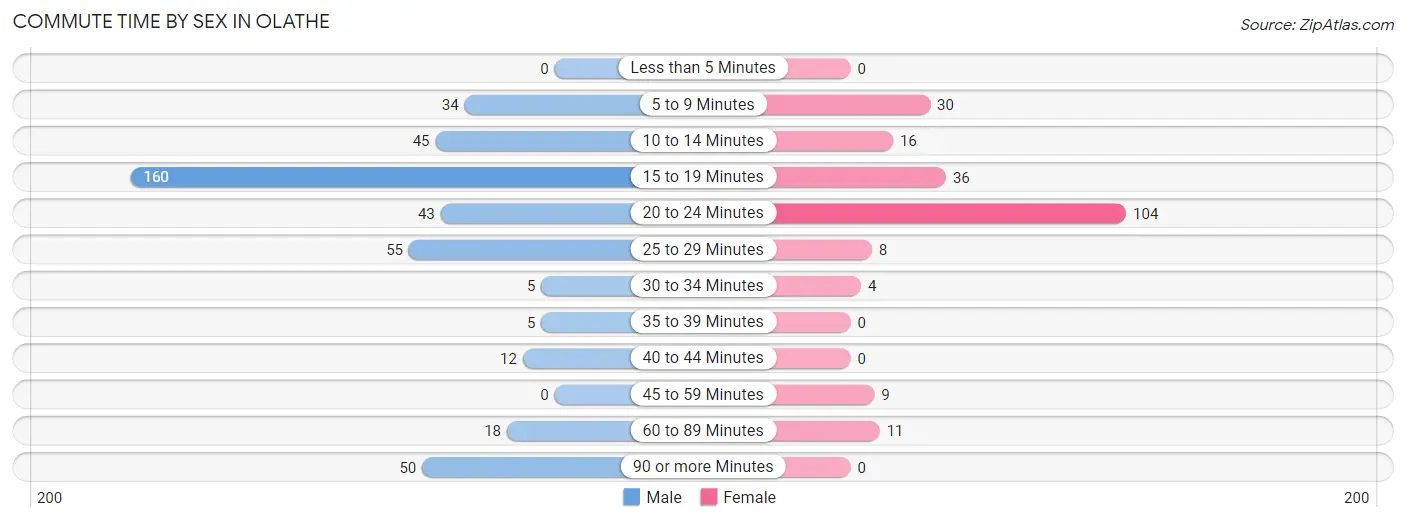
| Commute Time | Male | Female |
| Less than 5 Minutes | 0 (0.0%) | 0 (0.0%) |
| 5 to 9 Minutes | 34 (8.0%) | 30 (13.8%) |
| 10 to 14 Minutes | 45 (10.5%) | 16 (7.3%) |
| 15 to 19 Minutes | 160 (37.5%) | 36 (16.5%) |
| 20 to 24 Minutes | 43 (10.1%) | 104 (47.7%) |
| 25 to 29 Minutes | 55 (12.9%) | 8 (3.7%) |
| 30 to 34 Minutes | 5 (1.2%) | 4 (1.8%) |
| 35 to 39 Minutes | 5 (1.2%) | 0 (0.0%) |
| 40 to 44 Minutes | 12 (2.8%) | 0 (0.0%) |
| 45 to 59 Minutes | 0 (0.0%) | 9 (4.1%) |
| 60 to 89 Minutes | 18 (4.2%) | 11 (5.1%) |
| 90 or more Minutes | 50 (11.7%) | 0 (0.0%) |
Time of Departure to Work by Sex in Olathe
The most frequent times of departure to work in Olathe are 6:00 AM to 6:29 AM (88, 20.6%) for males and 7:00 AM to 7:29 AM (42, 19.3%) for females.
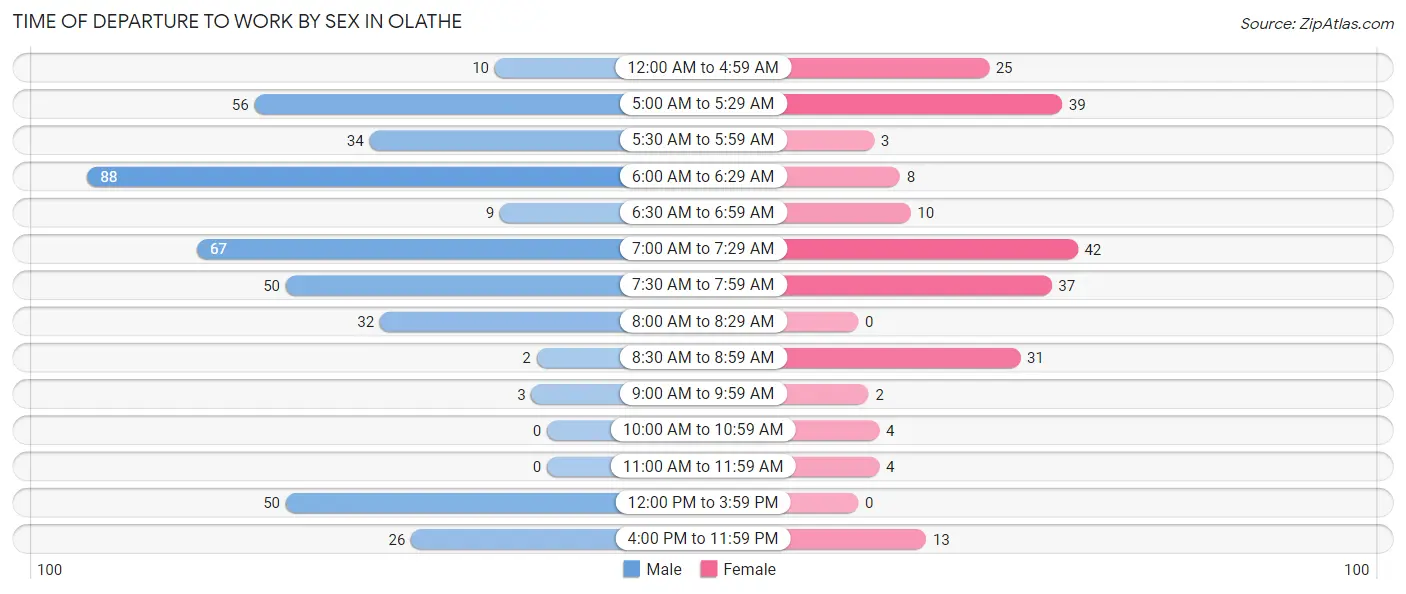
| Time of Departure | Male | Female |
| 12:00 AM to 4:59 AM | 10 (2.3%) | 25 (11.5%) |
| 5:00 AM to 5:29 AM | 56 (13.1%) | 39 (17.9%) |
| 5:30 AM to 5:59 AM | 34 (8.0%) | 3 (1.4%) |
| 6:00 AM to 6:29 AM | 88 (20.6%) | 8 (3.7%) |
| 6:30 AM to 6:59 AM | 9 (2.1%) | 10 (4.6%) |
| 7:00 AM to 7:29 AM | 67 (15.7%) | 42 (19.3%) |
| 7:30 AM to 7:59 AM | 50 (11.7%) | 37 (17.0%) |
| 8:00 AM to 8:29 AM | 32 (7.5%) | 0 (0.0%) |
| 8:30 AM to 8:59 AM | 2 (0.5%) | 31 (14.2%) |
| 9:00 AM to 9:59 AM | 3 (0.7%) | 2 (0.9%) |
| 10:00 AM to 10:59 AM | 0 (0.0%) | 4 (1.8%) |
| 11:00 AM to 11:59 AM | 0 (0.0%) | 4 (1.8%) |
| 12:00 PM to 3:59 PM | 50 (11.7%) | 0 (0.0%) |
| 4:00 PM to 11:59 PM | 26 (6.1%) | 13 (6.0%) |
| Total | 427 (100.0%) | 218 (100.0%) |
Housing Occupancy in Olathe
Occupancy by Ownership in Olathe
Of the total 509 dwellings in Olathe, owner-occupied units account for 330 (64.8%), while renter-occupied units make up 179 (35.2%).
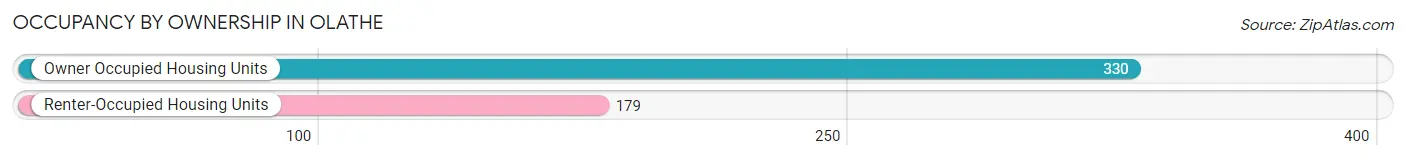
| Occupancy | # Housing Units | % Housing Units |
| Owner Occupied Housing Units | 330 | 64.8% |
| Renter-Occupied Housing Units | 179 | 35.2% |
| Total Occupied Housing Units | 509 | 100.0% |
Occupancy by Household Size in Olathe
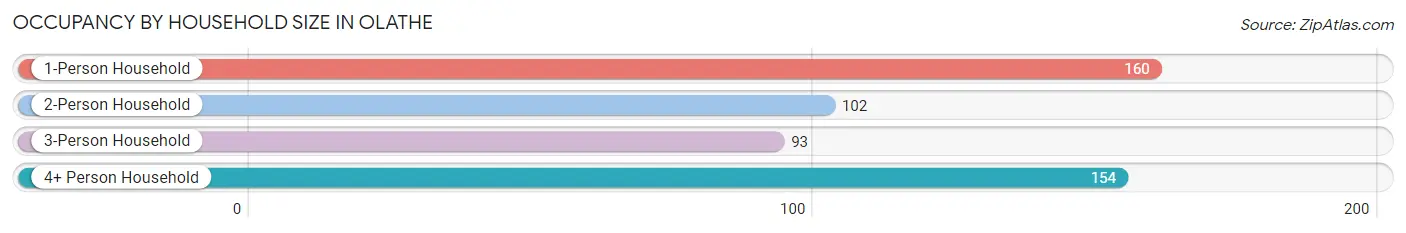
| Household Size | # Housing Units | % Housing Units |
| 1-Person Household | 160 | 31.4% |
| 2-Person Household | 102 | 20.0% |
| 3-Person Household | 93 | 18.3% |
| 4+ Person Household | 154 | 30.3% |
| Total Housing Units | 509 | 100.0% |
Occupancy by Ownership by Household Size in Olathe
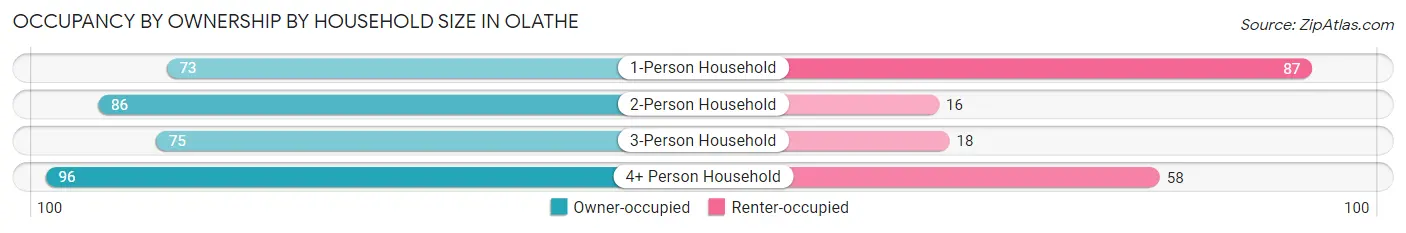
| Household Size | Owner-occupied | Renter-occupied |
| 1-Person Household | 73 (45.6%) | 87 (54.4%) |
| 2-Person Household | 86 (84.3%) | 16 (15.7%) |
| 3-Person Household | 75 (80.6%) | 18 (19.4%) |
| 4+ Person Household | 96 (62.3%) | 58 (37.7%) |
| Total Housing Units | 330 (64.8%) | 179 (35.2%) |
Occupancy by Educational Attainment in Olathe
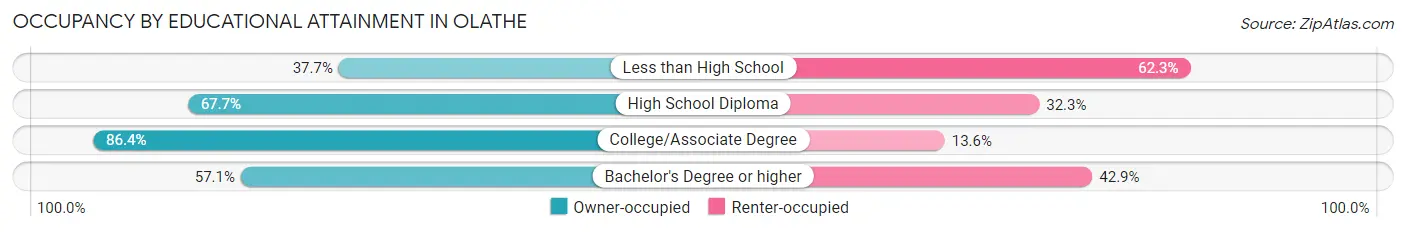
| Household Size | Owner-occupied | Renter-occupied |
| Less than High School | 43 (37.7%) | 71 (62.3%) |
| High School Diploma | 159 (67.7%) | 76 (32.3%) |
| College/Associate Degree | 108 (86.4%) | 17 (13.6%) |
| Bachelor's Degree or higher | 20 (57.1%) | 15 (42.9%) |
Occupancy by Age of Householder in Olathe
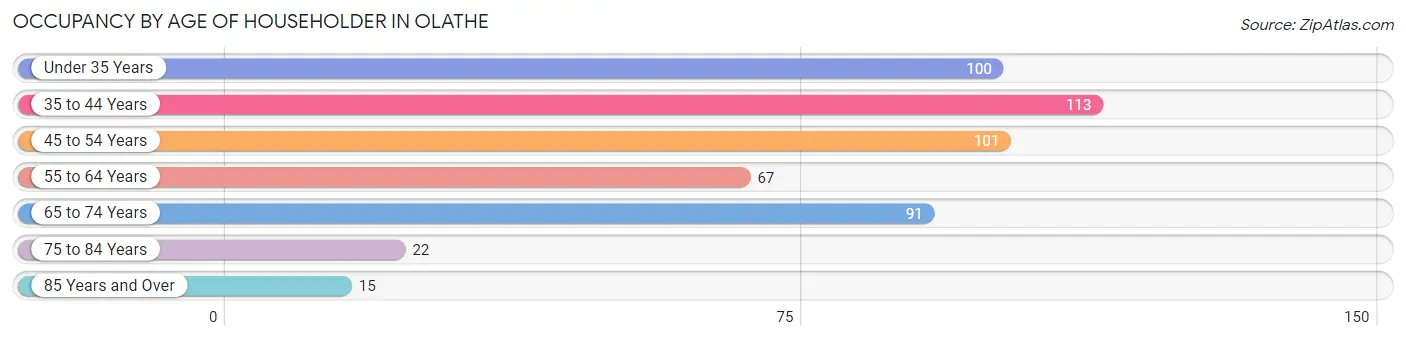
| Age Bracket | # Households | % Households |
| Under 35 Years | 100 | 19.7% |
| 35 to 44 Years | 113 | 22.2% |
| 45 to 54 Years | 101 | 19.8% |
| 55 to 64 Years | 67 | 13.2% |
| 65 to 74 Years | 91 | 17.9% |
| 75 to 84 Years | 22 | 4.3% |
| 85 Years and Over | 15 | 2.9% |
| Total | 509 | 100.0% |
Housing Finances in Olathe
Median Income by Occupancy in Olathe
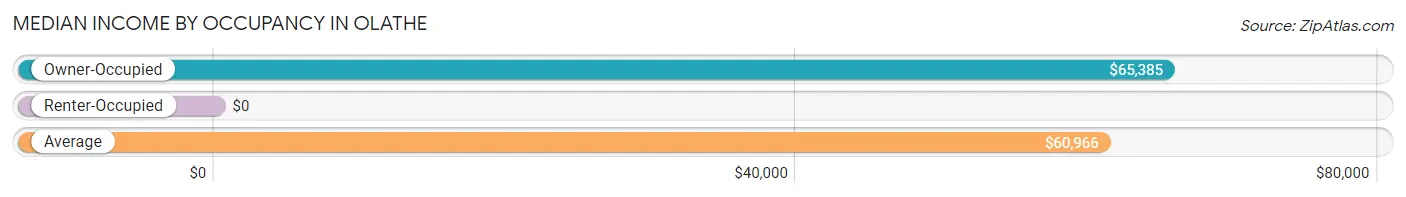
| Occupancy Type | # Households | Median Income |
| Owner-Occupied | 330 (64.8%) | $65,385 |
| Renter-Occupied | 179 (35.2%) | $0 |
| Average | 509 (100.0%) | $60,966 |
Occupancy by Householder Income Bracket in Olathe
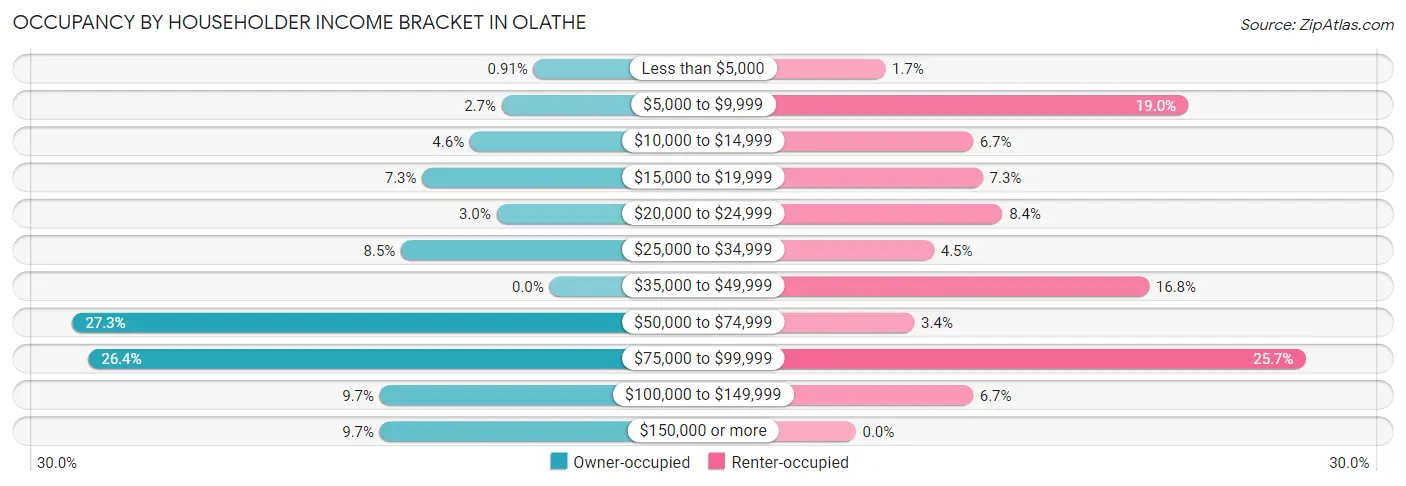
| Income Bracket | Owner-occupied | Renter-occupied |
| Less than $5,000 | 3 (0.9%) | 3 (1.7%) |
| $5,000 to $9,999 | 9 (2.7%) | 34 (19.0%) |
| $10,000 to $14,999 | 15 (4.5%) | 12 (6.7%) |
| $15,000 to $19,999 | 24 (7.3%) | 13 (7.3%) |
| $20,000 to $24,999 | 10 (3.0%) | 15 (8.4%) |
| $25,000 to $34,999 | 28 (8.5%) | 8 (4.5%) |
| $35,000 to $49,999 | 0 (0.0%) | 30 (16.8%) |
| $50,000 to $74,999 | 90 (27.3%) | 6 (3.4%) |
| $75,000 to $99,999 | 87 (26.4%) | 46 (25.7%) |
| $100,000 to $149,999 | 32 (9.7%) | 12 (6.7%) |
| $150,000 or more | 32 (9.7%) | 0 (0.0%) |
| Total | 330 (100.0%) | 179 (100.0%) |
Monthly Housing Cost Tiers in Olathe
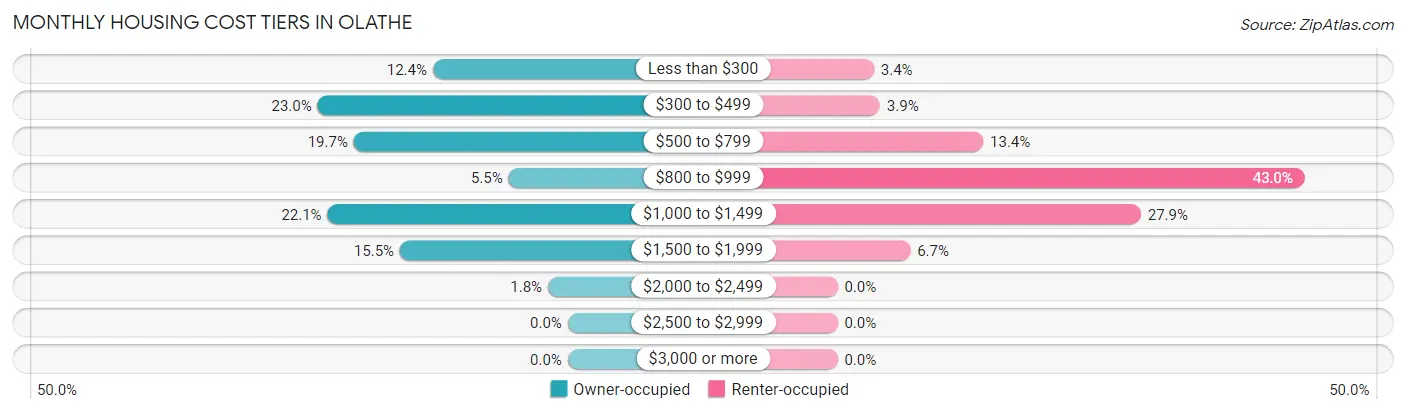
| Monthly Cost | Owner-occupied | Renter-occupied |
| Less than $300 | 41 (12.4%) | 6 (3.4%) |
| $300 to $499 | 76 (23.0%) | 7 (3.9%) |
| $500 to $799 | 65 (19.7%) | 24 (13.4%) |
| $800 to $999 | 18 (5.4%) | 77 (43.0%) |
| $1,000 to $1,499 | 73 (22.1%) | 50 (27.9%) |
| $1,500 to $1,999 | 51 (15.4%) | 12 (6.7%) |
| $2,000 to $2,499 | 6 (1.8%) | 0 (0.0%) |
| $2,500 to $2,999 | 0 (0.0%) | 0 (0.0%) |
| $3,000 or more | 0 (0.0%) | 0 (0.0%) |
| Total | 330 (100.0%) | 179 (100.0%) |
Physical Housing Characteristics in Olathe
Housing Structures in Olathe
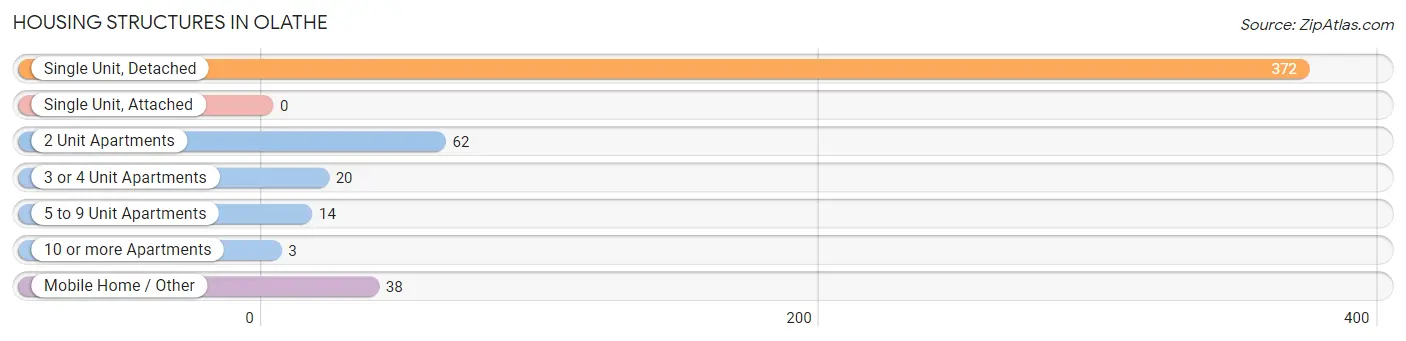
| Structure Type | # Housing Units | % Housing Units |
| Single Unit, Detached | 372 | 73.1% |
| Single Unit, Attached | 0 | 0.0% |
| 2 Unit Apartments | 62 | 12.2% |
| 3 or 4 Unit Apartments | 20 | 3.9% |
| 5 to 9 Unit Apartments | 14 | 2.8% |
| 10 or more Apartments | 3 | 0.6% |
| Mobile Home / Other | 38 | 7.5% |
| Total | 509 | 100.0% |
Housing Structures by Occupancy in Olathe
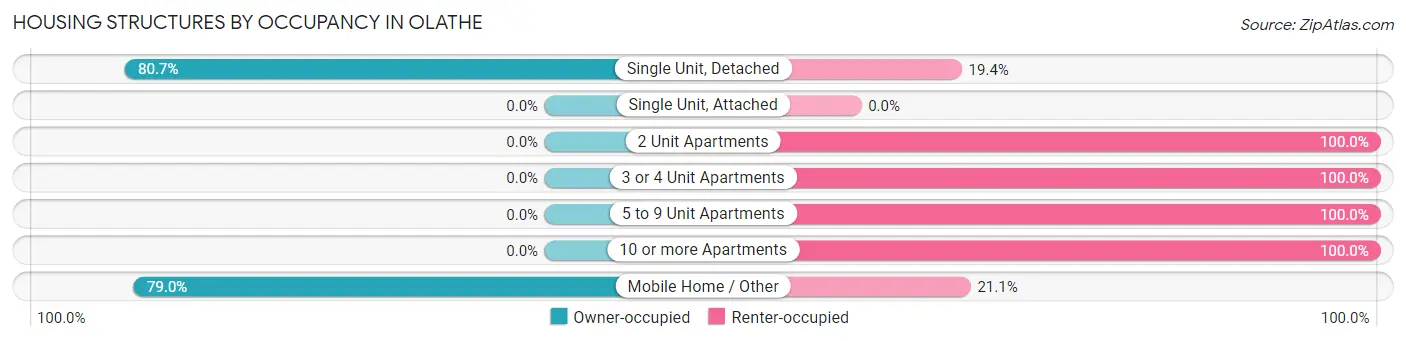
| Structure Type | Owner-occupied | Renter-occupied |
| Single Unit, Detached | 300 (80.6%) | 72 (19.4%) |
| Single Unit, Attached | 0 (0.0%) | 0 (0.0%) |
| 2 Unit Apartments | 0 (0.0%) | 62 (100.0%) |
| 3 or 4 Unit Apartments | 0 (0.0%) | 20 (100.0%) |
| 5 to 9 Unit Apartments | 0 (0.0%) | 14 (100.0%) |
| 10 or more Apartments | 0 (0.0%) | 3 (100.0%) |
| Mobile Home / Other | 30 (78.9%) | 8 (21.0%) |
| Total | 330 (64.8%) | 179 (35.2%) |
Housing Structures by Number of Rooms in Olathe
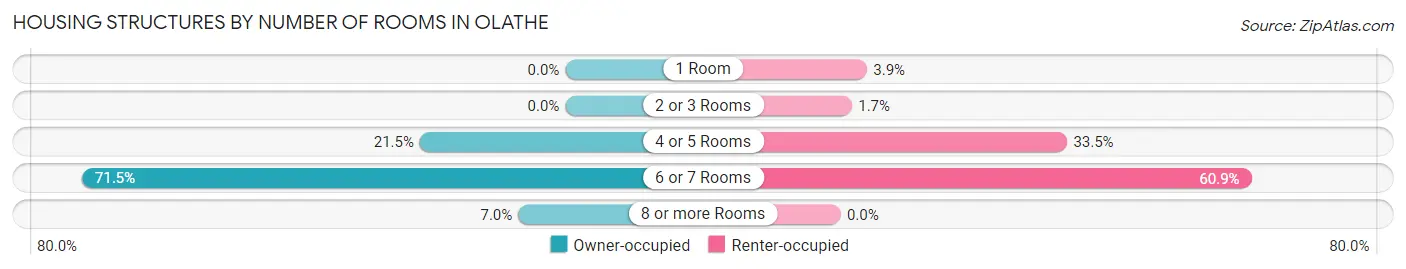
| Number of Rooms | Owner-occupied | Renter-occupied |
| 1 Room | 0 (0.0%) | 7 (3.9%) |
| 2 or 3 Rooms | 0 (0.0%) | 3 (1.7%) |
| 4 or 5 Rooms | 71 (21.5%) | 60 (33.5%) |
| 6 or 7 Rooms | 236 (71.5%) | 109 (60.9%) |
| 8 or more Rooms | 23 (7.0%) | 0 (0.0%) |
| Total | 330 (100.0%) | 179 (100.0%) |
Housing Structure by Heating Type in Olathe
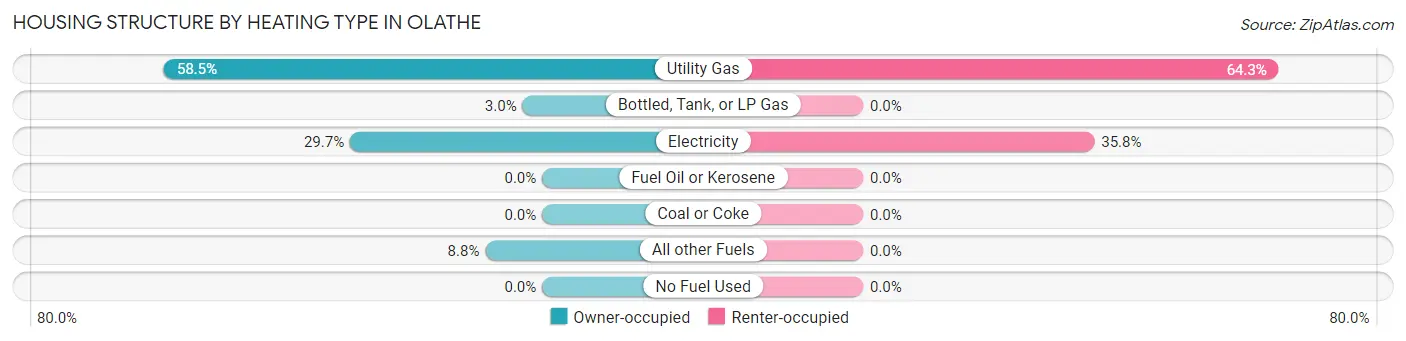
| Heating Type | Owner-occupied | Renter-occupied |
| Utility Gas | 193 (58.5%) | 115 (64.2%) |
| Bottled, Tank, or LP Gas | 10 (3.0%) | 0 (0.0%) |
| Electricity | 98 (29.7%) | 64 (35.7%) |
| Fuel Oil or Kerosene | 0 (0.0%) | 0 (0.0%) |
| Coal or Coke | 0 (0.0%) | 0 (0.0%) |
| All other Fuels | 29 (8.8%) | 0 (0.0%) |
| No Fuel Used | 0 (0.0%) | 0 (0.0%) |
| Total | 330 (100.0%) | 179 (100.0%) |
Household Vehicle Usage in Olathe
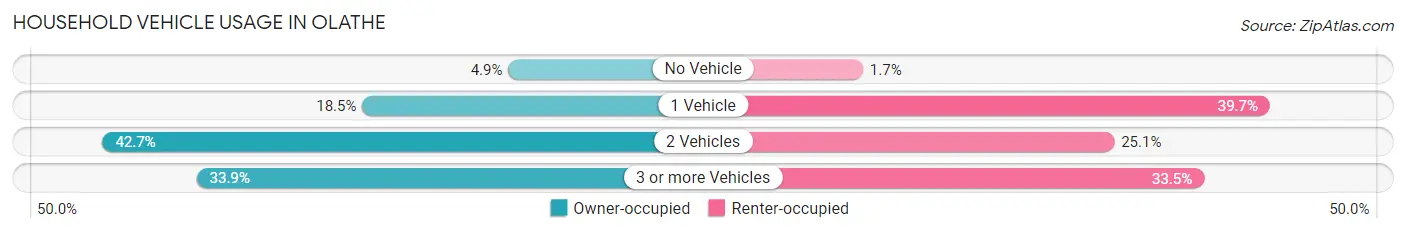
| Vehicles per Household | Owner-occupied | Renter-occupied |
| No Vehicle | 16 (4.9%) | 3 (1.7%) |
| 1 Vehicle | 61 (18.5%) | 71 (39.7%) |
| 2 Vehicles | 141 (42.7%) | 45 (25.1%) |
| 3 or more Vehicles | 112 (33.9%) | 60 (33.5%) |
| Total | 330 (100.0%) | 179 (100.0%) |
Real Estate & Mortgages in Olathe
Real Estate and Mortgage Overview in Olathe
| Characteristic | Without Mortgage | With Mortgage |
| Housing Units | 141 | 189 |
| Median Property Value | $219,900 | $222,000 |
| Median Household Income | $58,523 | $17 |
| Monthly Housing Costs | $407 | $0 |
| Real Estate Taxes | $503 | $6 |
Property Value by Mortgage Status in Olathe
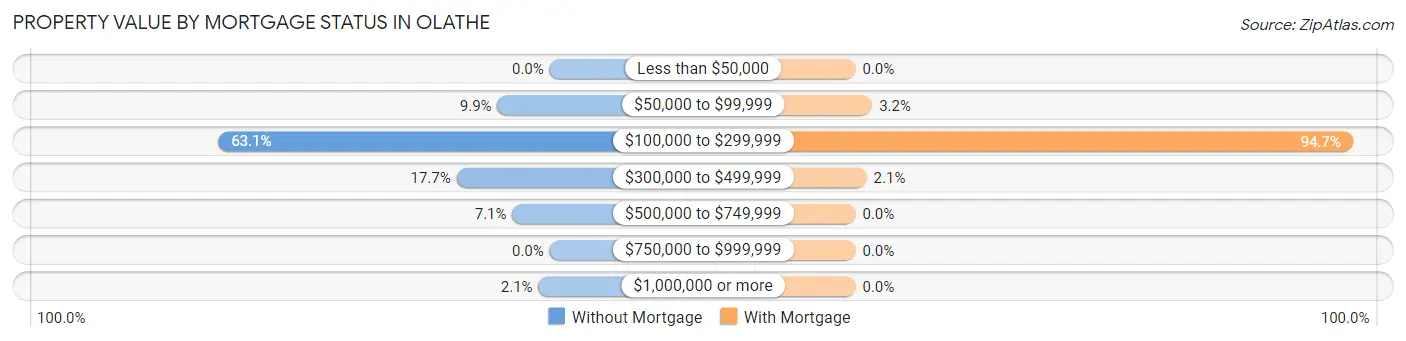
| Property Value | Without Mortgage | With Mortgage |
| Less than $50,000 | 0 (0.0%) | 0 (0.0%) |
| $50,000 to $99,999 | 14 (9.9%) | 6 (3.2%) |
| $100,000 to $299,999 | 89 (63.1%) | 179 (94.7%) |
| $300,000 to $499,999 | 25 (17.7%) | 4 (2.1%) |
| $500,000 to $749,999 | 10 (7.1%) | 0 (0.0%) |
| $750,000 to $999,999 | 0 (0.0%) | 0 (0.0%) |
| $1,000,000 or more | 3 (2.1%) | 0 (0.0%) |
| Total | 141 (100.0%) | 189 (100.0%) |
Household Income by Mortgage Status in Olathe
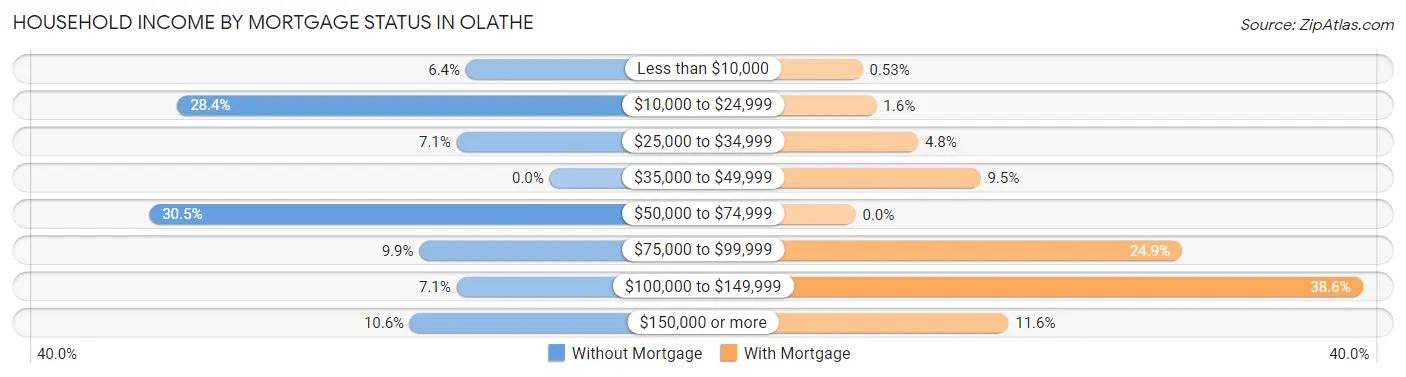
| Household Income | Without Mortgage | With Mortgage |
| Less than $10,000 | 9 (6.4%) | 1 (0.5%) |
| $10,000 to $24,999 | 40 (28.4%) | 3 (1.6%) |
| $25,000 to $34,999 | 10 (7.1%) | 9 (4.8%) |
| $35,000 to $49,999 | 0 (0.0%) | 18 (9.5%) |
| $50,000 to $74,999 | 43 (30.5%) | 0 (0.0%) |
| $75,000 to $99,999 | 14 (9.9%) | 47 (24.9%) |
| $100,000 to $149,999 | 10 (7.1%) | 73 (38.6%) |
| $150,000 or more | 15 (10.6%) | 22 (11.6%) |
| Total | 141 (100.0%) | 189 (100.0%) |
Property Value to Household Income Ratio in Olathe
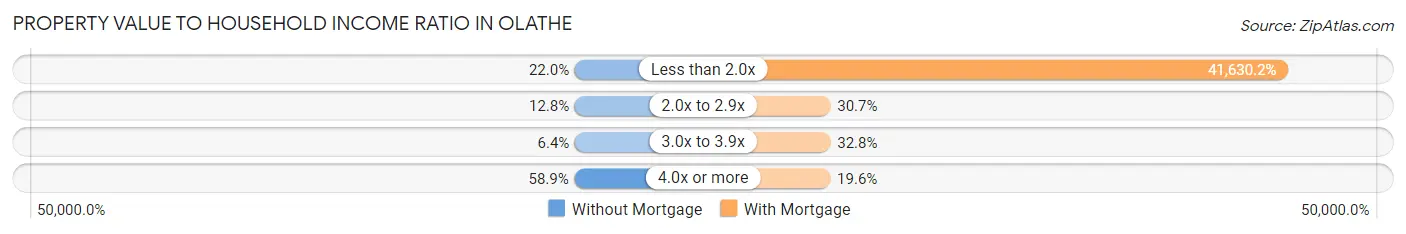
| Value-to-Income Ratio | Without Mortgage | With Mortgage |
| Less than 2.0x | 31 (22.0%) | 78,681 (41,630.2%) |
| 2.0x to 2.9x | 18 (12.8%) | 58 (30.7%) |
| 3.0x to 3.9x | 9 (6.4%) | 62 (32.8%) |
| 4.0x or more | 83 (58.9%) | 37 (19.6%) |
| Total | 141 (100.0%) | 189 (100.0%) |
Real Estate Taxes by Mortgage Status in Olathe
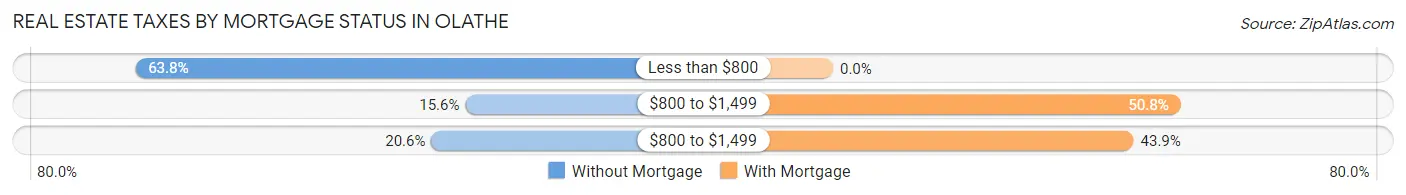
| Property Taxes | Without Mortgage | With Mortgage |
| Less than $800 | 90 (63.8%) | 0 (0.0%) |
| $800 to $1,499 | 22 (15.6%) | 96 (50.8%) |
| $800 to $1,499 | 29 (20.6%) | 83 (43.9%) |
| Total | 141 (100.0%) | 189 (100.0%) |
Health & Disability in Olathe
Health Insurance Coverage by Age in Olathe
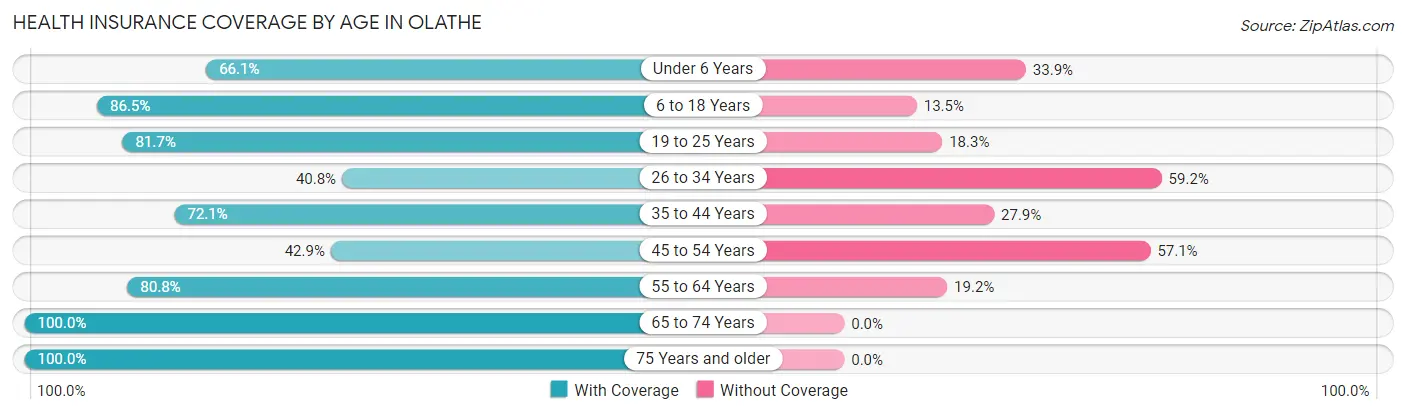
| Age Bracket | With Coverage | Without Coverage |
| Under 6 Years | 41 (66.1%) | 21 (33.9%) |
| 6 to 18 Years | 422 (86.5%) | 66 (13.5%) |
| 19 to 25 Years | 94 (81.7%) | 21 (18.3%) |
| 26 to 34 Years | 80 (40.8%) | 116 (59.2%) |
| 35 to 44 Years | 227 (72.1%) | 88 (27.9%) |
| 45 to 54 Years | 127 (42.9%) | 169 (57.1%) |
| 55 to 64 Years | 118 (80.8%) | 28 (19.2%) |
| 65 to 74 Years | 114 (100.0%) | 0 (0.0%) |
| 75 Years and older | 93 (100.0%) | 0 (0.0%) |
| Total | 1,316 (72.1%) | 509 (27.9%) |
Health Insurance Coverage by Citizenship Status in Olathe
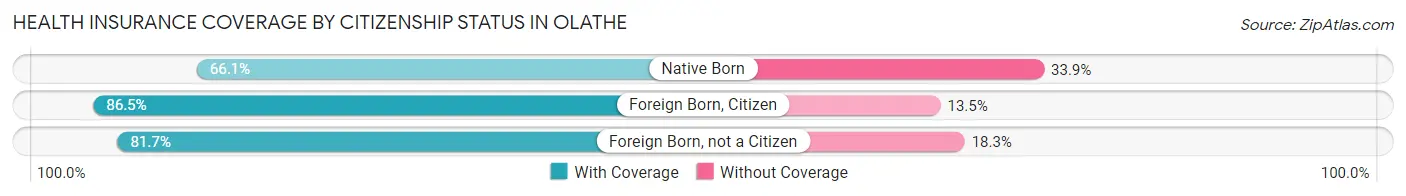
| Citizenship Status | With Coverage | Without Coverage |
| Native Born | 41 (66.1%) | 21 (33.9%) |
| Foreign Born, Citizen | 422 (86.5%) | 66 (13.5%) |
| Foreign Born, not a Citizen | 94 (81.7%) | 21 (18.3%) |
Health Insurance Coverage by Household Income in Olathe
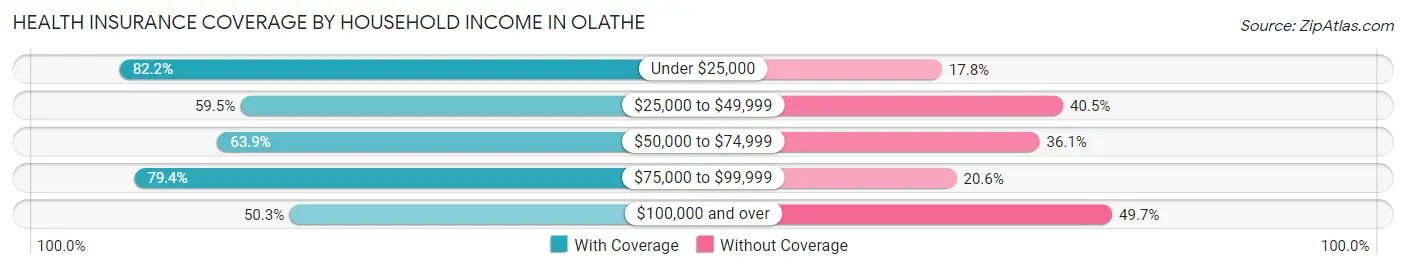
| Household Income | With Coverage | Without Coverage |
| Under $25,000 | 189 (82.2%) | 41 (17.8%) |
| $25,000 to $49,999 | 154 (59.5%) | 105 (40.5%) |
| $50,000 to $74,999 | 251 (63.9%) | 142 (36.1%) |
| $75,000 to $99,999 | 514 (79.4%) | 133 (20.6%) |
| $100,000 and over | 89 (50.3%) | 88 (49.7%) |
Public vs Private Health Insurance Coverage by Age in Olathe
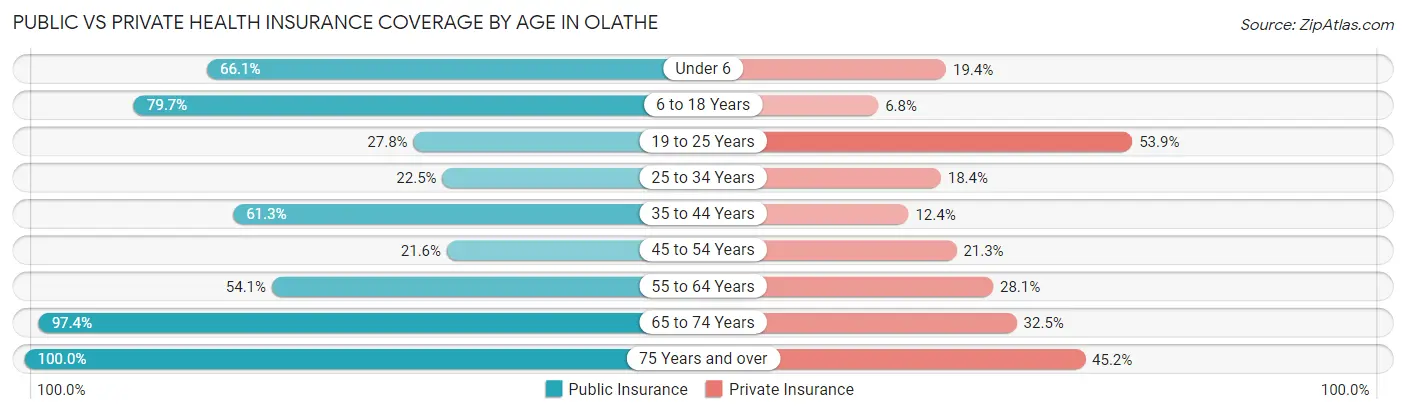
| Age Bracket | Public Insurance | Private Insurance |
| Under 6 | 41 (66.1%) | 12 (19.4%) |
| 6 to 18 Years | 389 (79.7%) | 33 (6.8%) |
| 19 to 25 Years | 32 (27.8%) | 62 (53.9%) |
| 25 to 34 Years | 44 (22.5%) | 36 (18.4%) |
| 35 to 44 Years | 193 (61.3%) | 39 (12.4%) |
| 45 to 54 Years | 64 (21.6%) | 63 (21.3%) |
| 55 to 64 Years | 79 (54.1%) | 41 (28.1%) |
| 65 to 74 Years | 111 (97.4%) | 37 (32.5%) |
| 75 Years and over | 93 (100.0%) | 42 (45.2%) |
| Total | 1,046 (57.3%) | 365 (20.0%) |
Disability Status by Sex by Age in Olathe
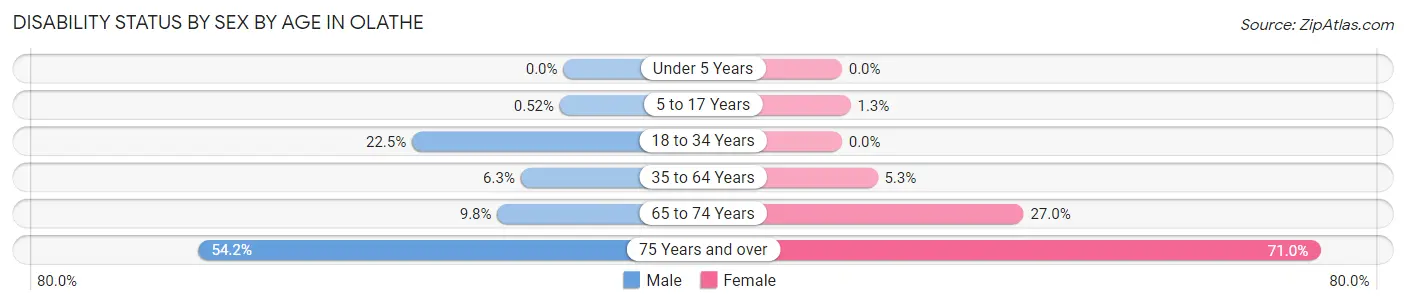
| Age Bracket | Male | Female |
| Under 5 Years | 0 (0.0%) | 0 (0.0%) |
| 5 to 17 Years | 1 (0.5%) | 2 (1.3%) |
| 18 to 34 Years | 51 (22.5%) | 0 (0.0%) |
| 35 to 64 Years | 30 (6.3%) | 15 (5.3%) |
| 65 to 74 Years | 5 (9.8%) | 17 (27.0%) |
| 75 Years and over | 13 (54.2%) | 49 (71.0%) |
Disability Class by Sex by Age in Olathe
Disability Class: Hearing Difficulty
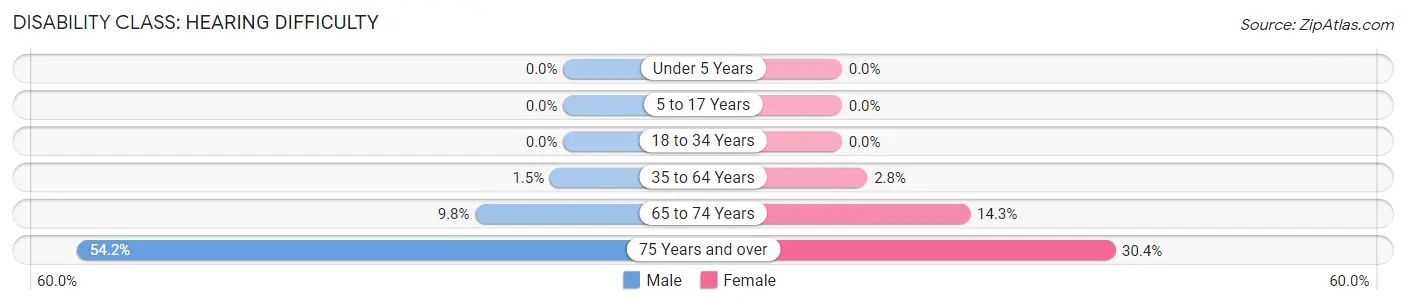
| Age Bracket | Male | Female |
| Under 5 Years | 0 (0.0%) | 0 (0.0%) |
| 5 to 17 Years | 0 (0.0%) | 0 (0.0%) |
| 18 to 34 Years | 0 (0.0%) | 0 (0.0%) |
| 35 to 64 Years | 7 (1.5%) | 8 (2.8%) |
| 65 to 74 Years | 5 (9.8%) | 9 (14.3%) |
| 75 Years and over | 13 (54.2%) | 21 (30.4%) |
Disability Class: Vision Difficulty
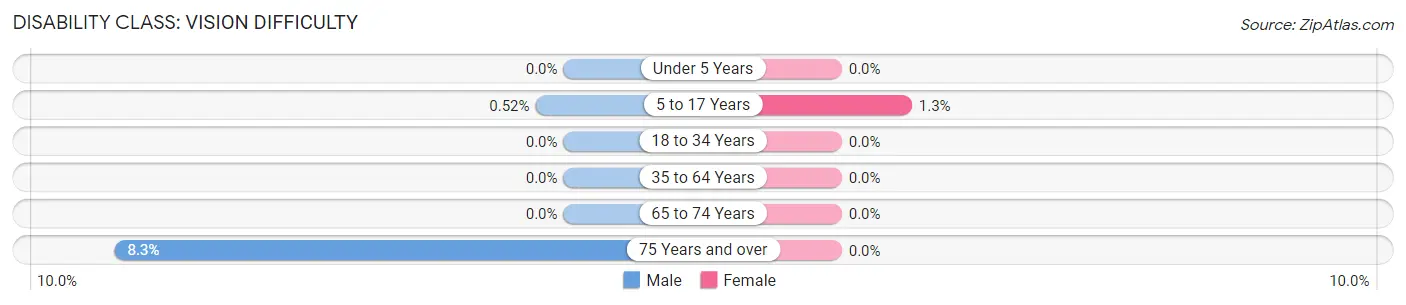
| Age Bracket | Male | Female |
| Under 5 Years | 0 (0.0%) | 0 (0.0%) |
| 5 to 17 Years | 1 (0.5%) | 2 (1.3%) |
| 18 to 34 Years | 0 (0.0%) | 0 (0.0%) |
| 35 to 64 Years | 0 (0.0%) | 0 (0.0%) |
| 65 to 74 Years | 0 (0.0%) | 0 (0.0%) |
| 75 Years and over | 2 (8.3%) | 0 (0.0%) |
Disability Class: Cognitive Difficulty
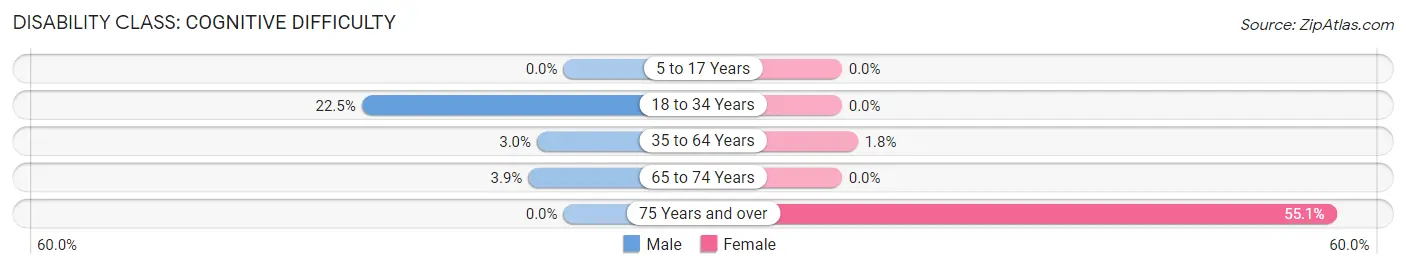
| Age Bracket | Male | Female |
| 5 to 17 Years | 0 (0.0%) | 0 (0.0%) |
| 18 to 34 Years | 51 (22.5%) | 0 (0.0%) |
| 35 to 64 Years | 14 (2.9%) | 5 (1.8%) |
| 65 to 74 Years | 2 (3.9%) | 0 (0.0%) |
| 75 Years and over | 0 (0.0%) | 38 (55.1%) |
Disability Class: Ambulatory Difficulty
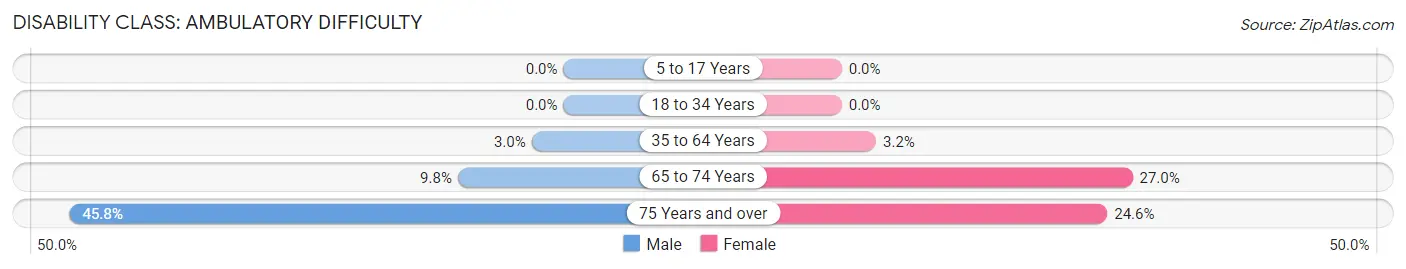
| Age Bracket | Male | Female |
| 5 to 17 Years | 0 (0.0%) | 0 (0.0%) |
| 18 to 34 Years | 0 (0.0%) | 0 (0.0%) |
| 35 to 64 Years | 14 (2.9%) | 9 (3.2%) |
| 65 to 74 Years | 5 (9.8%) | 17 (27.0%) |
| 75 Years and over | 11 (45.8%) | 17 (24.6%) |
Disability Class: Self-Care Difficulty
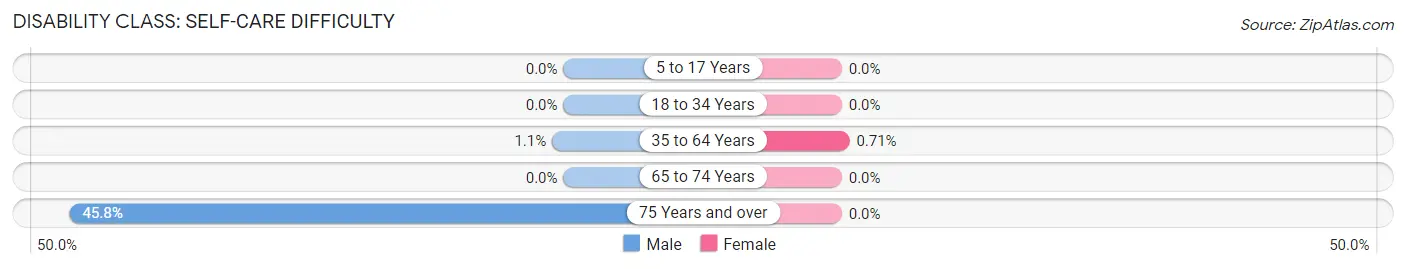
| Age Bracket | Male | Female |
| 5 to 17 Years | 0 (0.0%) | 0 (0.0%) |
| 18 to 34 Years | 0 (0.0%) | 0 (0.0%) |
| 35 to 64 Years | 5 (1.1%) | 2 (0.7%) |
| 65 to 74 Years | 0 (0.0%) | 0 (0.0%) |
| 75 Years and over | 11 (45.8%) | 0 (0.0%) |
Technology Access in Olathe
Computing Device Access in Olathe
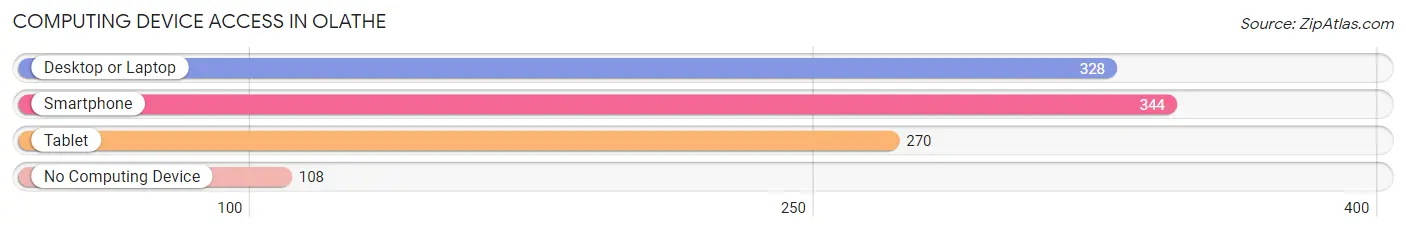
| Device Type | # Households | % Households |
| Desktop or Laptop | 328 | 64.4% |
| Smartphone | 344 | 67.6% |
| Tablet | 270 | 53.0% |
| No Computing Device | 108 | 21.2% |
| Total | 509 | 100.0% |
Internet Access in Olathe
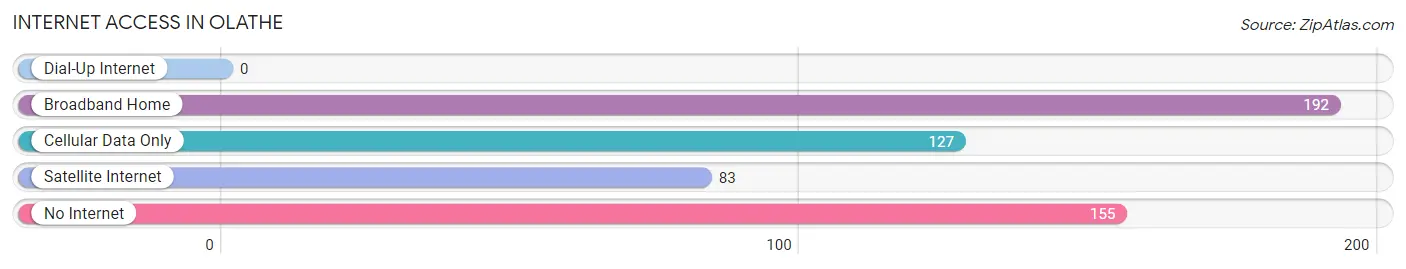
| Internet Type | # Households | % Households |
| Dial-Up Internet | 0 | 0.0% |
| Broadband Home | 192 | 37.7% |
| Cellular Data Only | 127 | 24.9% |
| Satellite Internet | 83 | 16.3% |
| No Internet | 155 | 30.4% |
| Total | 509 | 100.0% |
Olathe Summary
Olathe is a small town located in Montrose County, Colorado, United States. It is situated in the Uncompahgre Valley, at the base of the San Juan Mountains. The town was founded in 1881 and is the county seat of Montrose County. As of the 2010 census, the population of Olathe was 1,876.
Geography
Olathe is located at 38°30'25"N 107°59'17"W (38.5069, -107.9879). It is situated in the Uncompahgre Valley, at the base of the San Juan Mountains. The town is located at an elevation of 5,845 feet (1,782 m). The Uncompahgre River flows through the town.
The town is surrounded by agricultural land, with irrigated fields of alfalfa, corn, and other crops. The area is also known for its fruit orchards, which produce apples, peaches, and other fruits.
Climate
Olathe has a semi-arid climate, with hot summers and cold winters. The average annual temperature is 52.3°F (11.3°C). The average annual precipitation is 11.3 inches (286 mm).
Demographics
As of the 2010 census, the population of Olathe was 1,876. The racial makeup of the town was 91.2% White, 0.3% African American, 0.7% Native American, 0.3% Asian, 0.1% Pacific Islander, 5.2% from other races, and 2.3% from two or more races. Hispanic or Latino of any race were 11.3% of the population.
Economy
Olathe is a small agricultural town, with a focus on fruit production. The town is home to several orchards, which produce apples, peaches, and other fruits. The town is also home to several wineries, which produce wines from local grapes.
The town is also home to several businesses, including a grocery store, a hardware store, a lumber yard, and a variety of restaurants. The town is also home to several small manufacturing companies, which produce a variety of products, including furniture, clothing, and electronics.
The town is also home to several tourist attractions, including the Uncompahgre Valley Historical Museum, the Olathe Community Center, and the Olathe Public Library.
History
Olathe was founded in 1881, when the Denver and Rio Grande Railroad built a line through the Uncompahgre Valley. The town was named after the nearby Olathe Creek, which was named after a Native American chief.
The town quickly grew, and by the early 1900s, it was a thriving agricultural center. The town was home to several orchards, which produced apples, peaches, and other fruits. The town was also home to several wineries, which produced wines from local grapes.
In the 1950s, the town began to decline, as many of the orchards and wineries closed. The town's population began to decline, and by the 2000 census, the population had dropped to 1,876.
Today, Olathe is a small agricultural town, with a focus on fruit production. The town is home to several orchards, which produce apples, peaches, and other fruits. The town is also home to several wineries, which produce wines from local grapes. The town is also home to several businesses, including a grocery store, a hardware store, a lumber yard, and a variety of restaurants. The town is also home to several small manufacturing companies, which produce a variety of products, including furniture, clothing, and electronics. The town is also home to several tourist attractions, including the Uncompahgre Valley Historical Museum, the Olathe Community Center, and the Olathe Public Library.
Common Questions
What is Per Capita Income in Olathe?
Per Capita income in Olathe is $24,274.
What is the Median Family Income in Olathe?
Median Family Income in Olathe is $75,102.
What is the Median Household income in Olathe?
Median Household Income in Olathe is $60,966.
What is Income or Wage Gap in Olathe?
Income or Wage Gap in Olathe is 33.8%.
Women in Olathe earn 66.2 cents for every dollar earned by a man.
What is Family Income Deficit in Olathe?
Family Income Deficit in Olathe is $10,338.
Families that are below poverty line in Olathe earn $10,338 less on average than the poverty threshold level.
What is Inequality or Gini Index in Olathe?
Inequality or Gini Index in Olathe is 0.39.
What is the Total Population of Olathe?
Total Population of Olathe is 1,901.
What is the Total Male Population of Olathe?
Total Male Population of Olathe is 1,014.
What is the Total Female Population of Olathe?
Total Female Population of Olathe is 887.
What is the Ratio of Males per 100 Females in Olathe?
There are 114.32 Males per 100 Females in Olathe.
What is the Ratio of Females per 100 Males in Olathe?
There are 87.48 Females per 100 Males in Olathe.
What is the Median Population Age in Olathe?
Median Population Age in Olathe is 37.7 Years.
What is the Average Family Size in Olathe
Average Family Size in Olathe is 4.4 People.
What is the Average Household Size in Olathe
Average Household Size in Olathe is 3.4 People.
How Large is the Labor Force in Olathe?
There are 804 People in the Labor Forcein in Olathe.
What is the Percentage of People in the Labor Force in Olathe?
52.1% of People are in the Labor Force in Olathe.
What is the Unemployment Rate in Olathe?
Unemployment Rate in Olathe is 4.6%.