Zip Codes with the Highest Percentage of Population Employed in Computer, Engineering & Science in Alabama
RELATED REPORTS & OPTIONS
Computer, Engineering & Science
Alabama
Compare Zip Codes
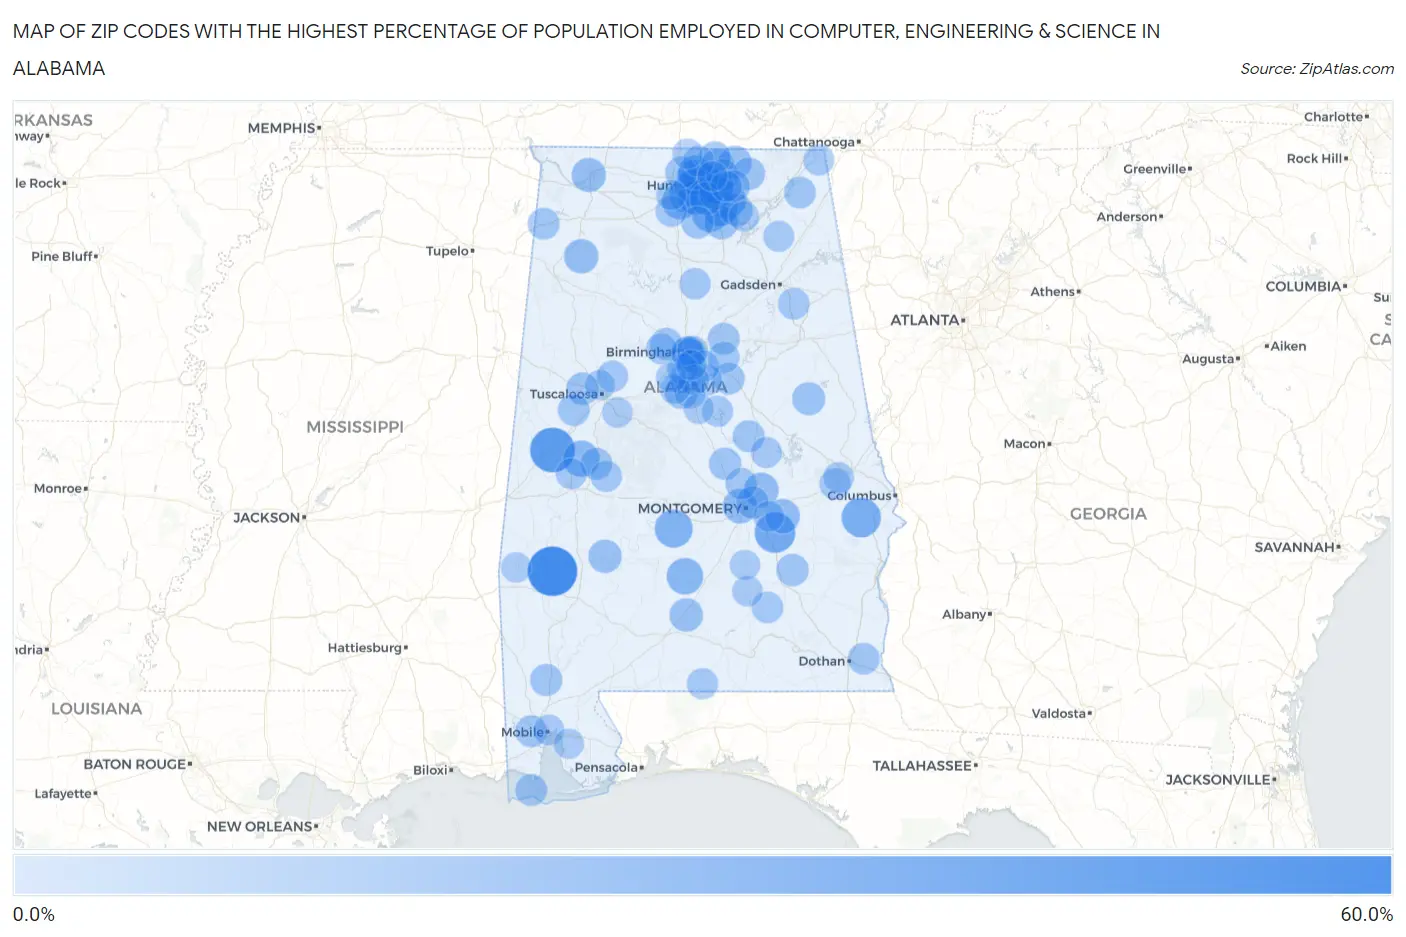
Map of Zip Codes with the Highest Percentage of Population Employed in Computer, Engineering & Science in Alabama
0.0%
60.0%
Zip Codes with the Highest Percentage of Population Employed in Computer, Engineering & Science in Alabama
| Zip Code | % Employed | vs State | vs National | |
| 1. | 36727 | 53.2% | 5.7%(+47.5)#1 | 6.8%(+46.4)#32 |
| 2. | 35443 | 41.3% | 5.7%(+35.6)#2 | 6.8%(+34.6)#74 |
| 3. | 36052 | 31.1% | 5.7%(+25.4)#3 | 6.8%(+24.4)#162 |
| 4. | 36858 | 28.1% | 5.7%(+22.4)#4 | 6.8%(+21.3)#205 |
| 5. | 35758 | 25.8% | 5.7%(+20.1)#5 | 6.8%(+19.0)#258 |
| 6. | 35806 | 24.9% | 5.7%(+19.2)#6 | 6.8%(+18.1)#281 |
| 7. | 36775 | 24.7% | 5.7%(+19.0)#7 | 6.8%(+17.9)#286 |
| 8. | 35763 | 22.6% | 5.7%(+17.0)#8 | 6.8%(+15.9)#366 |
| 9. | 36030 | 21.4% | 5.7%(+15.7)#9 | 6.8%(+14.7)#412 |
| 10. | 35756 | 21.3% | 5.7%(+15.6)#10 | 6.8%(+14.6)#421 |
| 11. | 35754 | 21.2% | 5.7%(+15.5)#11 | 6.8%(+14.5)#427 |
| 12. | 36776 | 20.9% | 5.7%(+15.2)#12 | 6.8%(+14.2)#441 |
| 13. | 35649 | 20.0% | 5.7%(+14.3)#13 | 6.8%(+13.2)#510 |
| 14. | 35803 | 19.1% | 5.7%(+13.4)#14 | 6.8%(+12.4)#581 |
| 15. | 35757 | 18.8% | 5.7%(+13.2)#15 | 6.8%(+12.1)#607 |
| 16. | 35824 | 17.9% | 5.7%(+12.2)#16 | 6.8%(+11.2)#690 |
| 17. | 35801 | 17.6% | 5.7%(+11.9)#17 | 6.8%(+10.8)#742 |
| 18. | 35802 | 17.2% | 5.7%(+11.5)#18 | 6.8%(+10.5)#787 |
| 19. | 36093 | 17.0% | 5.7%(+11.3)#19 | 6.8%(+10.3)#810 |
| 20. | 36013 | 16.9% | 5.7%(+11.2)#20 | 6.8%(+10.1)#831 |
| 21. | 35759 | 16.7% | 5.7%(+11.0)#21 | 6.8%(+9.96)#852 |
| 22. | 36112 | 16.7% | 5.7%(+11.0)#22 | 6.8%(+9.90)#860 |
| 23. | 35749 | 16.4% | 5.7%(+10.7)#23 | 6.8%(+9.62)#904 |
| 24. | 35543 | 16.1% | 5.7%(+10.4)#24 | 6.8%(+9.29)#949 |
| 25. | 35632 | 15.9% | 5.7%(+10.2)#25 | 6.8%(+9.16)#970 |
| 26. | 35233 | 15.1% | 5.7%(+9.42)#26 | 6.8%(+8.35)#1,104 |
| 27. | 35175 | 14.5% | 5.7%(+8.78)#27 | 6.8%(+7.71)#1,230 |
| 28. | 36456 | 14.3% | 5.7%(+8.57)#28 | 6.8%(+7.49)#1,279 |
| 29. | 35761 | 13.9% | 5.7%(+8.17)#29 | 6.8%(+7.09)#1,386 |
| 30. | 36769 | 13.8% | 5.7%(+8.12)#30 | 6.8%(+7.05)#1,397 |
| 31. | 35808 | 13.5% | 5.7%(+7.81)#31 | 6.8%(+6.74)#1,477 |
| 32. | 35760 | 13.4% | 5.7%(+7.72)#32 | 6.8%(+6.65)#1,503 |
| 33. | 36255 | 13.1% | 5.7%(+7.42)#33 | 6.8%(+6.35)#1,597 |
| 34. | 35114 | 12.6% | 5.7%(+6.95)#34 | 6.8%(+5.88)#1,771 |
| 35. | 36115 | 12.3% | 5.7%(+6.57)#35 | 6.8%(+5.49)#1,919 |
| 36. | 35446 | 12.1% | 5.7%(+6.45)#36 | 6.8%(+5.38)#1,968 |
| 37. | 35811 | 11.9% | 5.7%(+6.21)#37 | 6.8%(+5.14)#2,084 |
| 38. | 35205 | 11.9% | 5.7%(+6.20)#38 | 6.8%(+5.13)#2,087 |
| 39. | 35751 | 11.9% | 5.7%(+6.16)#39 | 6.8%(+5.09)#2,109 |
| 40. | 35670 | 11.7% | 5.7%(+5.99)#40 | 6.8%(+4.92)#2,186 |
| 41. | 36081 | 11.7% | 5.7%(+5.98)#41 | 6.8%(+4.91)#2,195 |
| 42. | 35203 | 11.6% | 5.7%(+5.87)#42 | 6.8%(+4.80)#2,261 |
| 43. | 36051 | 11.4% | 5.7%(+5.72)#43 | 6.8%(+4.65)#2,346 |
| 44. | 35748 | 11.1% | 5.7%(+5.42)#44 | 6.8%(+4.35)#2,502 |
| 45. | 35613 | 11.0% | 5.7%(+5.29)#45 | 6.8%(+4.21)#2,585 |
| 46. | 35244 | 11.0% | 5.7%(+5.28)#46 | 6.8%(+4.21)#2,590 |
| 47. | 36560 | 10.9% | 5.7%(+5.25)#47 | 6.8%(+4.18)#2,607 |
| 48. | 36744 | 10.6% | 5.7%(+4.95)#48 | 6.8%(+3.88)#2,768 |
| 49. | 35136 | 10.6% | 5.7%(+4.92)#49 | 6.8%(+3.85)#2,792 |
| 50. | 35750 | 10.6% | 5.7%(+4.90)#50 | 6.8%(+3.82)#2,802 |
| 51. | 35078 | 10.6% | 5.7%(+4.87)#51 | 6.8%(+3.79)#2,826 |
| 52. | 35005 | 10.5% | 5.7%(+4.84)#52 | 6.8%(+3.77)#2,848 |
| 53. | 35480 | 10.3% | 5.7%(+4.66)#53 | 6.8%(+3.58)#2,966 |
| 54. | 36528 | 10.2% | 5.7%(+4.52)#54 | 6.8%(+3.45)#3,061 |
| 55. | 36376 | 10.2% | 5.7%(+4.52)#55 | 6.8%(+3.45)#3,062 |
| 56. | 35004 | 10.2% | 5.7%(+4.49)#56 | 6.8%(+3.42)#3,086 |
| 57. | 35582 | 10.1% | 5.7%(+4.42)#57 | 6.8%(+3.35)#3,139 |
| 58. | 35765 | 10.0% | 5.7%(+4.35)#58 | 6.8%(+3.28)#3,178 |
| 59. | 36688 | 10.0% | 5.7%(+4.27)#59 | 6.8%(+3.20)#3,244 |
| 60. | 36025 | 9.9% | 5.7%(+4.24)#60 | 6.8%(+3.17)#3,271 |
| 61. | 36034 | 9.8% | 5.7%(+4.14)#61 | 6.8%(+3.07)#3,348 |
| 62. | 35176 | 9.8% | 5.7%(+4.10)#62 | 6.8%(+3.03)#3,371 |
| 63. | 36279 | 9.6% | 5.7%(+3.91)#63 | 6.8%(+2.84)#3,521 |
| 64. | 35043 | 9.6% | 5.7%(+3.86)#64 | 6.8%(+2.79)#3,555 |
| 65. | 35007 | 9.4% | 5.7%(+3.75)#65 | 6.8%(+2.67)#3,655 |
| 66. | 35070 | 9.4% | 5.7%(+3.68)#66 | 6.8%(+2.61)#3,708 |
| 67. | 35603 | 9.3% | 5.7%(+3.59)#67 | 6.8%(+2.51)#3,800 |
| 68. | 36765 | 9.2% | 5.7%(+3.55)#68 | 6.8%(+2.47)#3,831 |
| 69. | 35406 | 9.1% | 5.7%(+3.44)#69 | 6.8%(+2.37)#3,931 |
| 70. | 35242 | 9.1% | 5.7%(+3.36)#70 | 6.8%(+2.29)#4,013 |
| 71. | 35773 | 8.9% | 5.7%(+3.22)#71 | 6.8%(+2.15)#4,161 |
| 72. | 36830 | 8.8% | 5.7%(+3.08)#72 | 6.8%(+2.01)#4,287 |
| 73. | 35741 | 8.6% | 5.7%(+2.89)#73 | 6.8%(+1.82)#4,503 |
| 74. | 36026 | 8.5% | 5.7%(+2.85)#74 | 6.8%(+1.77)#4,563 |
| 75. | 36483 | 8.5% | 5.7%(+2.84)#75 | 6.8%(+1.77)#4,573 |
| 76. | 35222 | 8.4% | 5.7%(+2.71)#76 | 6.8%(+1.64)#4,710 |
| 77. | 35958 | 8.3% | 5.7%(+2.62)#77 | 6.8%(+1.55)#4,848 |
| 78. | 35118 | 8.2% | 5.7%(+2.55)#78 | 6.8%(+1.48)#4,940 |
| 79. | 35974 | 8.2% | 5.7%(+2.51)#79 | 6.8%(+1.44)#4,988 |
| 80. | 35143 | 8.1% | 5.7%(+2.43)#80 | 6.8%(+1.36)#5,094 |
| 81. | 36740 | 8.1% | 5.7%(+2.40)#81 | 6.8%(+1.33)#5,144 |
| 82. | 36602 | 8.1% | 5.7%(+2.39)#82 | 6.8%(+1.32)#5,166 |
| 83. | 35226 | 8.0% | 5.7%(+2.27)#83 | 6.8%(+1.20)#5,316 |
| 84. | 36849 | 7.7% | 5.7%(+1.96)#84 | 6.8%(+0.892)#5,742 |
| 85. | 35124 | 7.7% | 5.7%(+1.96)#85 | 6.8%(+0.888)#5,749 |
| 86. | 36064 | 7.5% | 5.7%(+1.79)#86 | 6.8%(+0.716)#6,021 |
| 87. | 36049 | 7.3% | 5.7%(+1.62)#87 | 6.8%(+0.551)#6,280 |
| 88. | 35456 | 7.1% | 5.7%(+1.42)#88 | 6.8%(+0.350)#6,606 |
| 89. | 35080 | 7.0% | 5.7%(+1.31)#89 | 6.8%(+0.236)#6,802 |
| 90. | 35473 | 7.0% | 5.7%(+1.30)#90 | 6.8%(+0.231)#6,808 |
| 91. | 35747 | 7.0% | 5.7%(+1.29)#91 | 6.8%(+0.220)#6,822 |
| 92. | 35022 | 6.9% | 5.7%(+1.20)#92 | 6.8%(+0.127)#6,987 |
| 93. | 35671 | 6.9% | 5.7%(+1.19)#93 | 6.8%(+0.123)#6,995 |
| 94. | 35739 | 6.9% | 5.7%(+1.17)#94 | 6.8%(+0.099)#7,040 |
| 95. | 35216 | 6.8% | 5.7%(+1.12)#95 | 6.8%(+0.045)#7,134 |
| 96. | 36041 | 6.7% | 5.7%(+1.05)#96 | 6.8%(-0.017)#7,250 |
| 97. | 35810 | 6.7% | 5.7%(+1.04)#97 | 6.8%(-0.034)#7,293 |
| 98. | 36526 | 6.7% | 5.7%(+1.02)#98 | 6.8%(-0.054)#7,331 |
| 99. | 35040 | 6.7% | 5.7%(+1.01)#99 | 6.8%(-0.065)#7,351 |
| 100. | 36908 | 6.7% | 5.7%(+1.00)#100 | 6.8%(-0.072)#7,364 |
Common Questions
What are the Top 10 Zip Codes with the Highest Percentage of Population Employed in Computer, Engineering & Science in Alabama?
Top 10 Zip Codes with the Highest Percentage of Population Employed in Computer, Engineering & Science in Alabama are:
What zip code has the Highest Percentage of Population Employed in Computer, Engineering & Science in Alabama?
36727 has the Highest Percentage of Population Employed in Computer, Engineering & Science in Alabama with 53.2%.
What is the Percentage of Population Employed in Computer, Engineering & Science in the State of Alabama?
Percentage of Population Employed in Computer, Engineering & Science in Alabama is 5.7%.
What is the Percentage of Population Employed in Computer, Engineering & Science in the United States?
Percentage of Population Employed in Computer, Engineering & Science in the United States is 6.8%.