Millbrook, AL Map & Demographics
Millbrook Map
Millbrook Overview
$33,605
PER CAPITA INCOME
$80,920
AVG FAMILY INCOME
$63,521
AVG HOUSEHOLD INCOME
9.0%
WAGE / INCOME GAP [ % ]
91.0¢/ $1
WAGE / INCOME GAP [ $ ]
0.41
INEQUALITY / GINI INDEX
16,631
TOTAL POPULATION
7,446
MALE POPULATION
9,185
FEMALE POPULATION
81.07
MALES / 100 FEMALES
123.35
FEMALES / 100 MALES
36.8
MEDIAN AGE
3.1
AVG FAMILY SIZE
2.5
AVG HOUSEHOLD SIZE
8,168
LABOR FORCE [ PEOPLE ]
61.3%
PERCENT IN LABOR FORCE
4.5%
UNEMPLOYMENT RATE
Millbrook Zip Codes
Millbrook Area Codes
Income in Millbrook
Income Overview in Millbrook
Per Capita Income in Millbrook is $33,605, while median incomes of families and households are $80,920 and $63,521 respectively.
| Characteristic | Number | Measure |
| Per Capita Income | 16,631 | $33,605 |
| Median Family Income | 4,446 | $80,920 |
| Mean Family Income | 4,446 | $92,871 |
| Median Household Income | 6,643 | $63,521 |
| Mean Household Income | 6,643 | $81,276 |
| Income Deficit | 4,446 | $0 |
| Wage / Income Gap (%) | 16,631 | 9.03% |
| Wage / Income Gap ($) | 16,631 | 90.97¢ per $1 |
| Gini / Inequality Index | 16,631 | 0.41 |
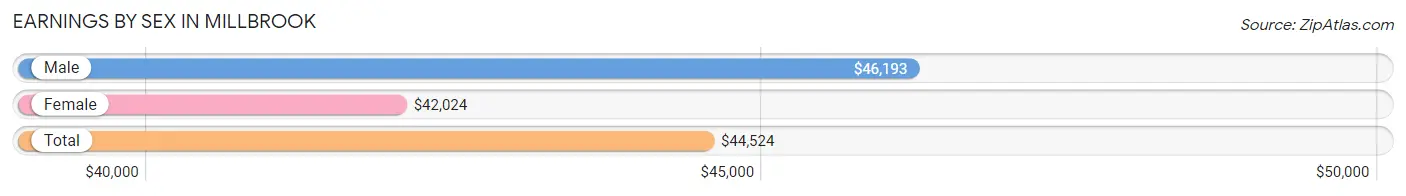
Earnings by Sex in Millbrook
Average Earnings in Millbrook are $44,524, $46,193 for men and $42,024 for women, a difference of 9.0%.
| Sex | Number | Average Earnings |
| Male | 3,700 (44.1%) | $46,193 |
| Female | 4,695 (55.9%) | $42,024 |
| Total | 8,395 (100.0%) | $44,524 |
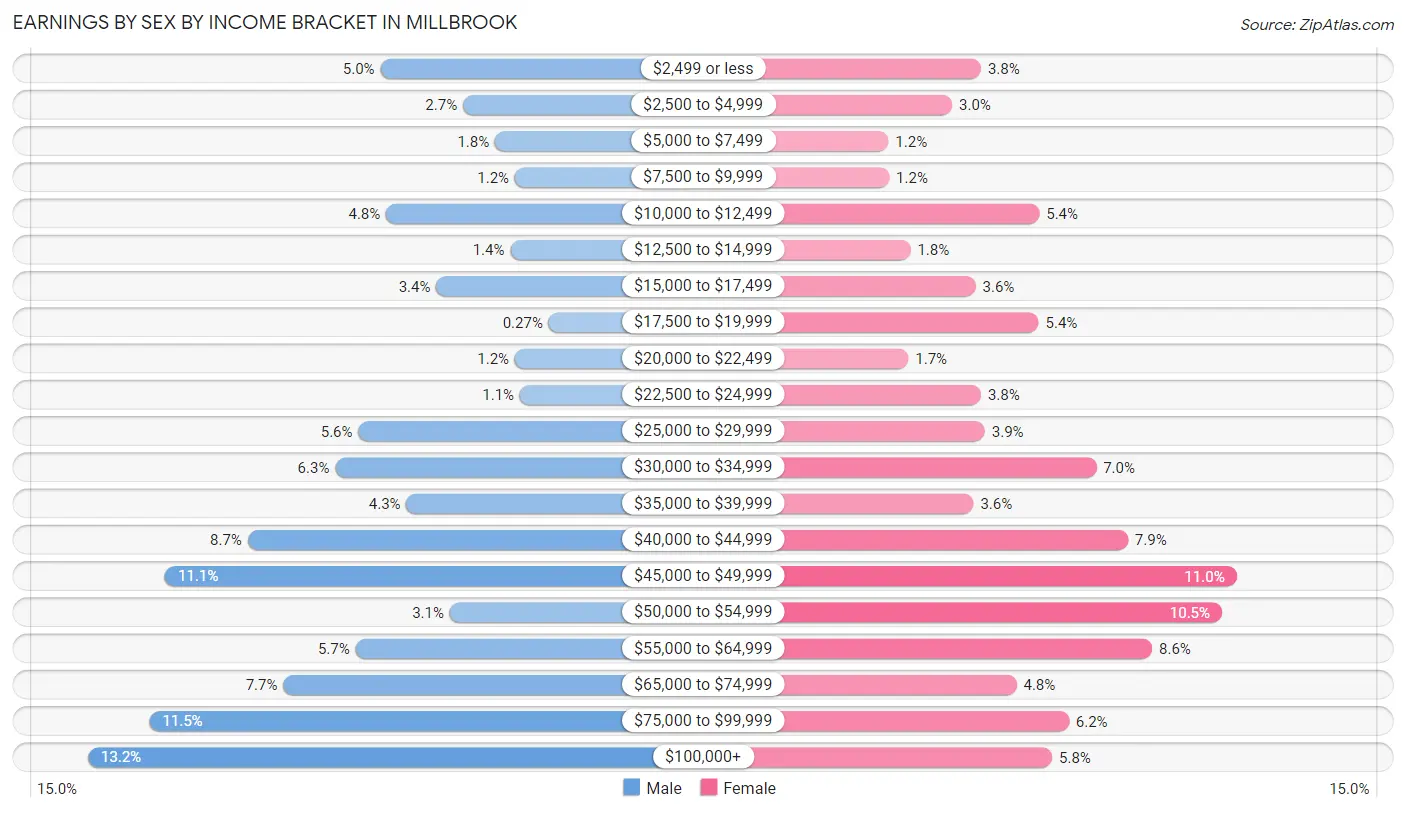
Earnings by Sex by Income Bracket in Millbrook
The most common earnings brackets in Millbrook are $100,000+ for men (489 | 13.2%) and $45,000 to $49,999 for women (514 | 11.0%).
| Income | Male | Female |
| $2,499 or less | 185 (5.0%) | 177 (3.8%) |
| $2,500 to $4,999 | 99 (2.7%) | 139 (3.0%) |
| $5,000 to $7,499 | 66 (1.8%) | 55 (1.2%) |
| $7,500 to $9,999 | 45 (1.2%) | 56 (1.2%) |
| $10,000 to $12,499 | 179 (4.8%) | 254 (5.4%) |
| $12,500 to $14,999 | 50 (1.3%) | 84 (1.8%) |
| $15,000 to $17,499 | 127 (3.4%) | 170 (3.6%) |
| $17,500 to $19,999 | 10 (0.3%) | 253 (5.4%) |
| $20,000 to $22,499 | 45 (1.2%) | 81 (1.7%) |
| $22,500 to $24,999 | 40 (1.1%) | 177 (3.8%) |
| $25,000 to $29,999 | 208 (5.6%) | 182 (3.9%) |
| $30,000 to $34,999 | 232 (6.3%) | 329 (7.0%) |
| $35,000 to $39,999 | 158 (4.3%) | 167 (3.6%) |
| $40,000 to $44,999 | 323 (8.7%) | 371 (7.9%) |
| $45,000 to $49,999 | 409 (11.1%) | 514 (11.0%) |
| $50,000 to $54,999 | 113 (3.0%) | 495 (10.5%) |
| $55,000 to $64,999 | 211 (5.7%) | 403 (8.6%) |
| $65,000 to $74,999 | 286 (7.7%) | 224 (4.8%) |
| $75,000 to $99,999 | 425 (11.5%) | 293 (6.2%) |
| $100,000+ | 489 (13.2%) | 271 (5.8%) |
| Total | 3,700 (100.0%) | 4,695 (100.0%) |
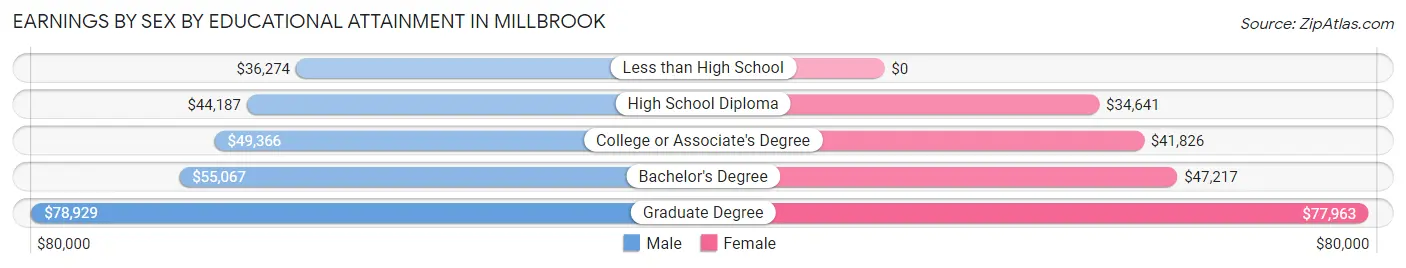
Earnings by Sex by Educational Attainment in Millbrook
Average earnings in Millbrook are $48,995 for men and $45,699 for women, a difference of 6.7%. Men with an educational attainment of graduate degree enjoy the highest average annual earnings of $78,929, while those with less than high school education earn the least with $36,274. Women with an educational attainment of graduate degree earn the most with the average annual earnings of $77,963, while those with high school diploma education have the smallest earnings of $34,641.
| Educational Attainment | Male Income | Female Income |
| Less than High School | $36,274 | $0 |
| High School Diploma | $44,187 | $34,641 |
| College or Associate's Degree | $49,366 | $41,826 |
| Bachelor's Degree | $55,067 | $47,217 |
| Graduate Degree | $78,929 | $77,963 |
| Total | $48,995 | $45,699 |
Family Income in Millbrook
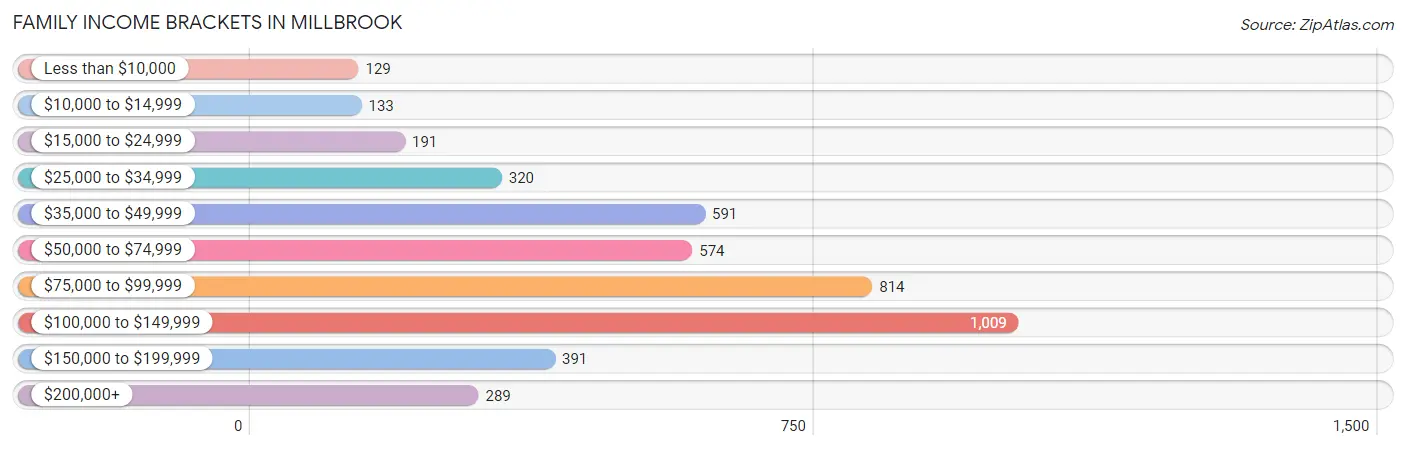
Family Income Brackets in Millbrook
According to the Millbrook family income data, there are 1,009 families falling into the $100,000 to $149,999 income range, which is the most common income bracket and makes up 22.7% of all families. Conversely, the less than $10,000 income bracket is the least frequent group with only 129 families (2.9%) belonging to this category.
| Income Bracket | # Families | % Families |
| Less than $10,000 | 129 | 2.9% |
| $10,000 to $14,999 | 133 | 3.0% |
| $15,000 to $24,999 | 191 | 4.3% |
| $25,000 to $34,999 | 320 | 7.2% |
| $35,000 to $49,999 | 591 | 13.3% |
| $50,000 to $74,999 | 574 | 12.9% |
| $75,000 to $99,999 | 814 | 18.3% |
| $100,000 to $149,999 | 1,009 | 22.7% |
| $150,000 to $199,999 | 391 | 8.8% |
| $200,000+ | 289 | 6.5% |
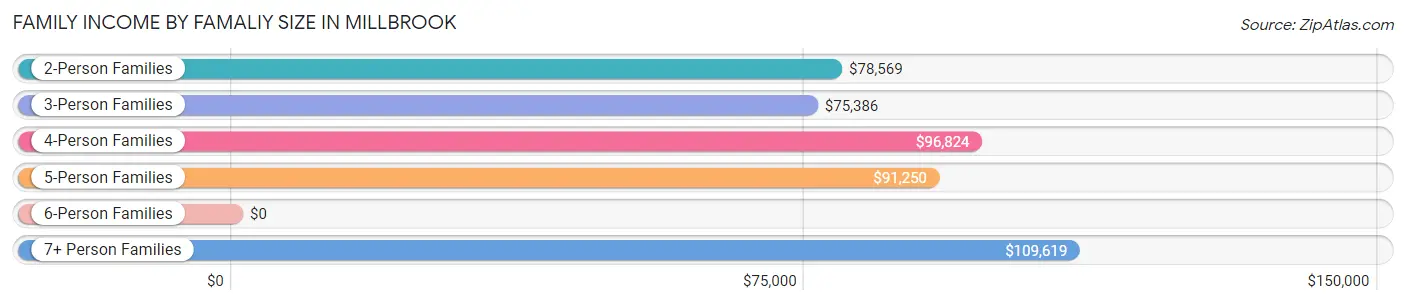
Family Income by Famaliy Size in Millbrook
7+ person families (100 | 2.2%) account for the highest median family income in Millbrook with $109,619 per family, while 2-person families (2,251 | 50.6%) have the highest median income of $39,284 per family member.
| Income Bracket | # Families | Median Income |
| 2-Person Families | 2,251 (50.6%) | $78,569 |
| 3-Person Families | 941 (21.2%) | $75,386 |
| 4-Person Families | 878 (19.8%) | $96,824 |
| 5-Person Families | 228 (5.1%) | $91,250 |
| 6-Person Families | 48 (1.1%) | $0 |
| 7+ Person Families | 100 (2.2%) | $109,619 |
| Total | 4,446 (100.0%) | $80,920 |
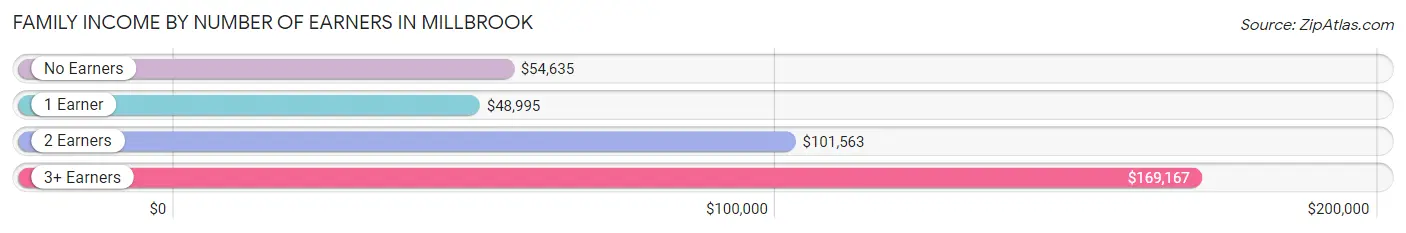
Family Income by Number of Earners in Millbrook
The median family income in Millbrook is $80,920, with families comprising 3+ earners (358) having the highest median family income of $169,167, while families with 1 earner (1,491) have the lowest median family income of $48,995, accounting for 8.1% and 33.5% of families, respectively.
| Number of Earners | # Families | Median Income |
| No Earners | 761 (17.1%) | $54,635 |
| 1 Earner | 1,491 (33.5%) | $48,995 |
| 2 Earners | 1,836 (41.3%) | $101,563 |
| 3+ Earners | 358 (8.1%) | $169,167 |
| Total | 4,446 (100.0%) | $80,920 |
Household Income in Millbrook
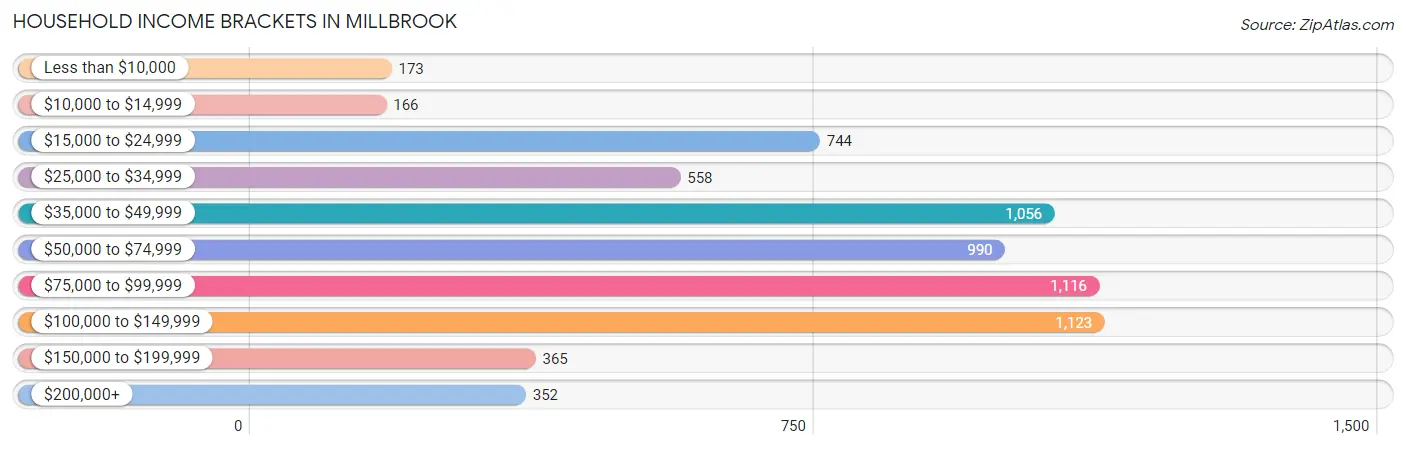
Household Income Brackets in Millbrook
With 1,123 households falling in the category, the $100,000 to $149,999 income range is the most frequent in Millbrook, accounting for 16.9% of all households. In contrast, only 166 households (2.5%) fall into the $10,000 to $14,999 income bracket, making it the least populous group.
| Income Bracket | # Households | % Households |
| Less than $10,000 | 173 | 2.6% |
| $10,000 to $14,999 | 166 | 2.5% |
| $15,000 to $24,999 | 744 | 11.2% |
| $25,000 to $34,999 | 558 | 8.4% |
| $35,000 to $49,999 | 1,056 | 15.9% |
| $50,000 to $74,999 | 990 | 14.9% |
| $75,000 to $99,999 | 1,116 | 16.8% |
| $100,000 to $149,999 | 1,123 | 16.9% |
| $150,000 to $199,999 | 365 | 5.5% |
| $200,000+ | 352 | 5.3% |
Household Income by Householder Age in Millbrook
The median household income in Millbrook is $63,521, with the highest median household income of $77,151 found in the 45 to 64 years age bracket for the primary householder. A total of 2,373 households (35.7%) fall into this category. Meanwhile, the 15 to 24 years age bracket for the primary householder has the lowest median household income of $31,667, with 200 households (3.0%) in this group.
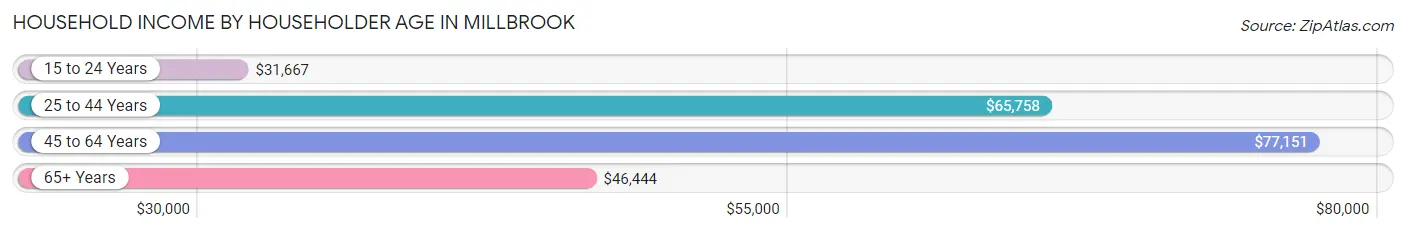
| Income Bracket | # Households | Median Income |
| 15 to 24 Years | 200 (3.0%) | $31,667 |
| 25 to 44 Years | 2,340 (35.2%) | $65,758 |
| 45 to 64 Years | 2,373 (35.7%) | $77,151 |
| 65+ Years | 1,730 (26.0%) | $46,444 |
| Total | 6,643 (100.0%) | $63,521 |
Poverty in Millbrook
Income Below Poverty by Sex and Age in Millbrook
With 9.4% poverty level for males and 9.6% for females among the residents of Millbrook, 5 year old males and 15 year old females are the most vulnerable to poverty, with 72 males (46.2%) and 60 females (52.6%) in their respective age groups living below the poverty level.
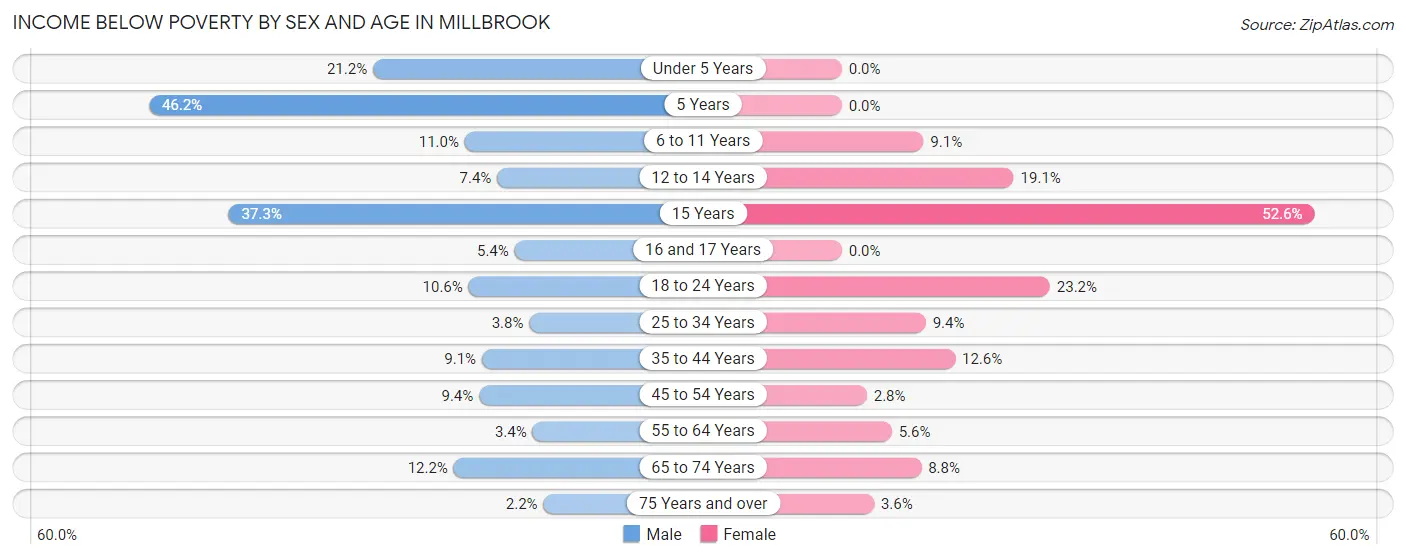
| Age Bracket | Male | Female |
| Under 5 Years | 78 (21.2%) | 0 (0.0%) |
| 5 Years | 72 (46.2%) | 0 (0.0%) |
| 6 to 11 Years | 81 (11.0%) | 50 (9.1%) |
| 12 to 14 Years | 26 (7.4%) | 62 (19.1%) |
| 15 Years | 22 (37.3%) | 60 (52.6%) |
| 16 and 17 Years | 14 (5.4%) | 0 (0.0%) |
| 18 to 24 Years | 101 (10.5%) | 215 (23.2%) |
| 25 to 34 Years | 30 (3.8%) | 134 (9.3%) |
| 35 to 44 Years | 66 (9.1%) | 170 (12.6%) |
| 45 to 54 Years | 95 (9.4%) | 30 (2.8%) |
| 55 to 64 Years | 31 (3.4%) | 67 (5.6%) |
| 65 to 74 Years | 68 (12.2%) | 61 (8.8%) |
| 75 Years and over | 12 (2.2%) | 29 (3.6%) |
| Total | 696 (9.4%) | 878 (9.6%) |
Income Above Poverty by Sex and Age in Millbrook
According to the poverty statistics in Millbrook, males aged 75 years and over and females aged under 5 years are the age groups that are most secure financially, with 97.8% of males and 100.0% of females in these age groups living above the poverty line.
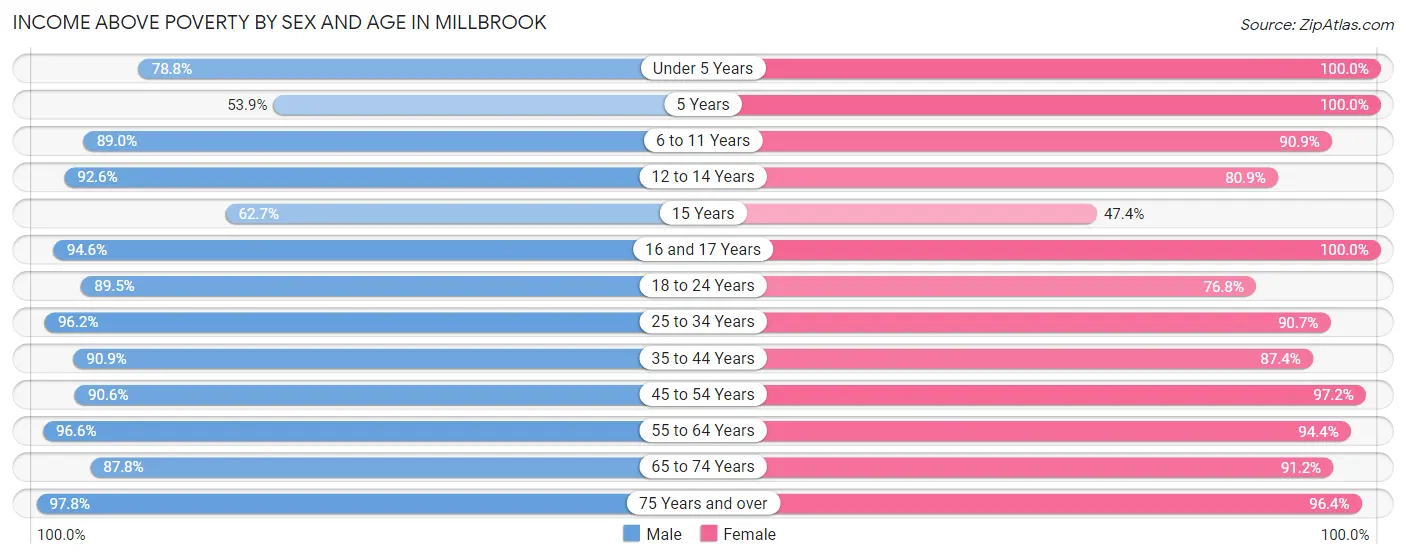
| Age Bracket | Male | Female |
| Under 5 Years | 290 (78.8%) | 547 (100.0%) |
| 5 Years | 84 (53.8%) | 55 (100.0%) |
| 6 to 11 Years | 657 (89.0%) | 500 (90.9%) |
| 12 to 14 Years | 327 (92.6%) | 262 (80.9%) |
| 15 Years | 37 (62.7%) | 54 (47.4%) |
| 16 and 17 Years | 244 (94.6%) | 67 (100.0%) |
| 18 to 24 Years | 856 (89.4%) | 713 (76.8%) |
| 25 to 34 Years | 762 (96.2%) | 1,299 (90.6%) |
| 35 to 44 Years | 662 (90.9%) | 1,178 (87.4%) |
| 45 to 54 Years | 918 (90.6%) | 1,049 (97.2%) |
| 55 to 64 Years | 874 (96.6%) | 1,137 (94.4%) |
| 65 to 74 Years | 489 (87.8%) | 629 (91.2%) |
| 75 Years and over | 528 (97.8%) | 782 (96.4%) |
| Total | 6,728 (90.6%) | 8,272 (90.4%) |
Income Below Poverty Among Married-Couple Families in Millbrook
The poverty statistics for married-couple families in Millbrook show that 1.8% or 53 of the total 2,898 families live below the poverty line. Families with 1 or 2 children have the highest poverty rate of 5.6%, comprising of 44 families. On the other hand, families with 3 or 4 children have the lowest poverty rate of 0.0%, which includes 0 families.
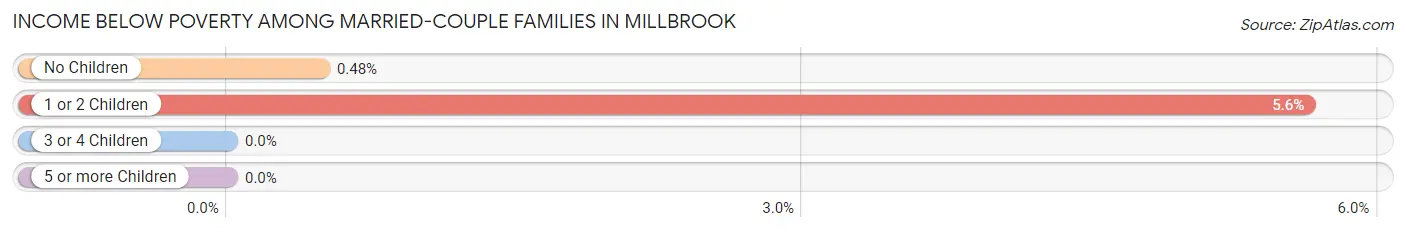
| Children | Above Poverty | Below Poverty |
| No Children | 1,866 (99.5%) | 9 (0.5%) |
| 1 or 2 Children | 737 (94.4%) | 44 (5.6%) |
| 3 or 4 Children | 183 (100.0%) | 0 (0.0%) |
| 5 or more Children | 59 (100.0%) | 0 (0.0%) |
| Total | 2,845 (98.2%) | 53 (1.8%) |
Income Below Poverty Among Single-Parent Households in Millbrook
According to the poverty data in Millbrook, 10.4% or 28 single-father households and 27.0% or 345 single-mother households are living below the poverty line. Among single-father households, those with no children have the highest poverty rate, with 17 households (21.8%) experiencing poverty. Likewise, among single-mother households, those with 3 or 4 children have the highest poverty rate, with 34 households (56.7%) falling below the poverty line.
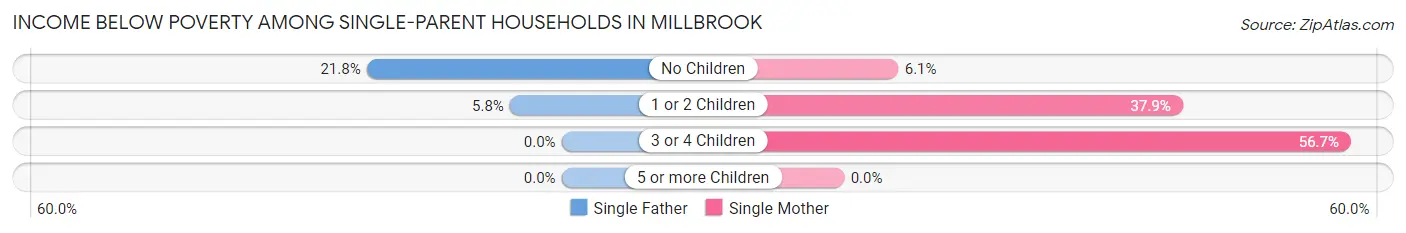
| Children | Single Father | Single Mother |
| No Children | 17 (21.8%) | 28 (6.0%) |
| 1 or 2 Children | 11 (5.8%) | 283 (37.9%) |
| 3 or 4 Children | 0 (0.0%) | 34 (56.7%) |
| 5 or more Children | 0 (0.0%) | 0 (0.0%) |
| Total | 28 (10.4%) | 345 (27.0%) |
Income Below Poverty Among Married-Couple vs Single-Parent Households in Millbrook
The poverty data for Millbrook shows that 53 of the married-couple family households (1.8%) and 373 of the single-parent households (24.1%) are living below the poverty level. Within the married-couple family households, those with 1 or 2 children have the highest poverty rate, with 44 households (5.6%) falling below the poverty line. Among the single-parent households, those with 3 or 4 children have the highest poverty rate, with 34 household (56.7%) living below poverty.
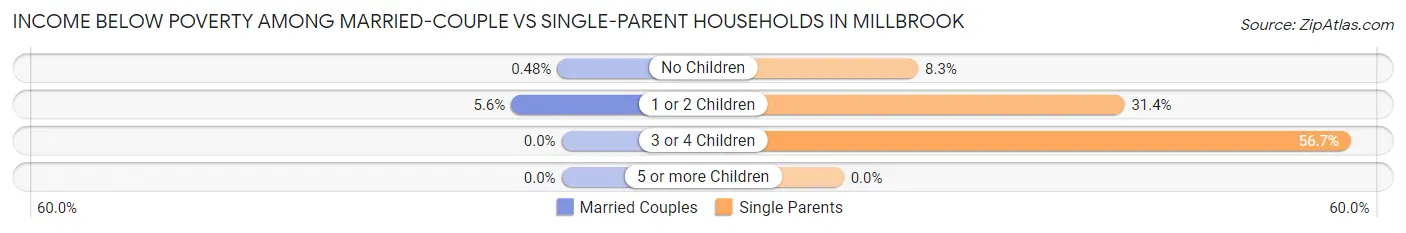
| Children | Married-Couple Families | Single-Parent Households |
| No Children | 9 (0.5%) | 45 (8.3%) |
| 1 or 2 Children | 44 (5.6%) | 294 (31.4%) |
| 3 or 4 Children | 0 (0.0%) | 34 (56.7%) |
| 5 or more Children | 0 (0.0%) | 0 (0.0%) |
| Total | 53 (1.8%) | 373 (24.1%) |
Race in Millbrook
The most populous races in Millbrook are White / Caucasian (11,154 | 67.1%), Black / African American (4,025 | 24.2%), and Two or more Races (880 | 5.3%).
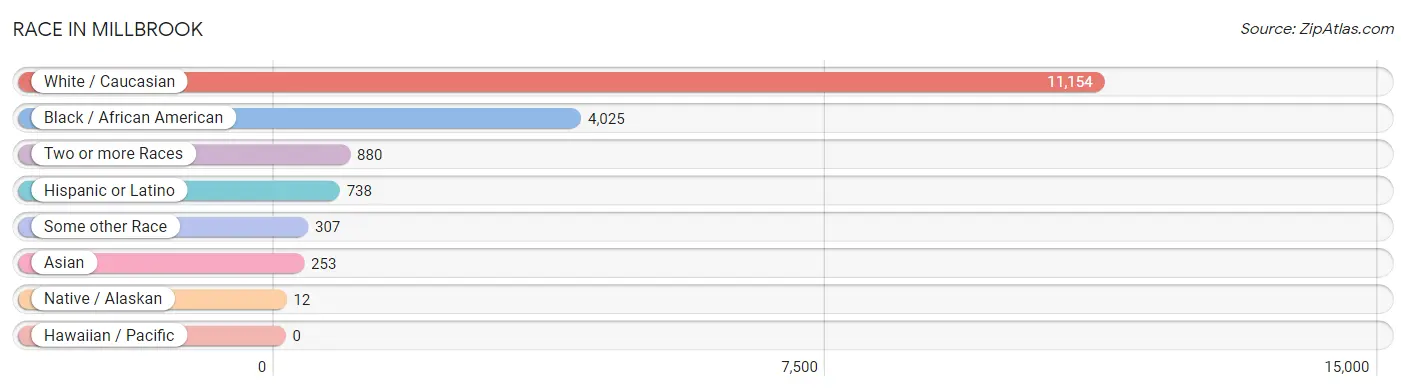
| Race | # Population | % Population |
| Asian | 253 | 1.5% |
| Black / African American | 4,025 | 24.2% |
| Hawaiian / Pacific | 0 | 0.0% |
| Hispanic or Latino | 738 | 4.4% |
| Native / Alaskan | 12 | 0.1% |
| White / Caucasian | 11,154 | 67.1% |
| Two or more Races | 880 | 5.3% |
| Some other Race | 307 | 1.8% |
| Total | 16,631 | 100.0% |
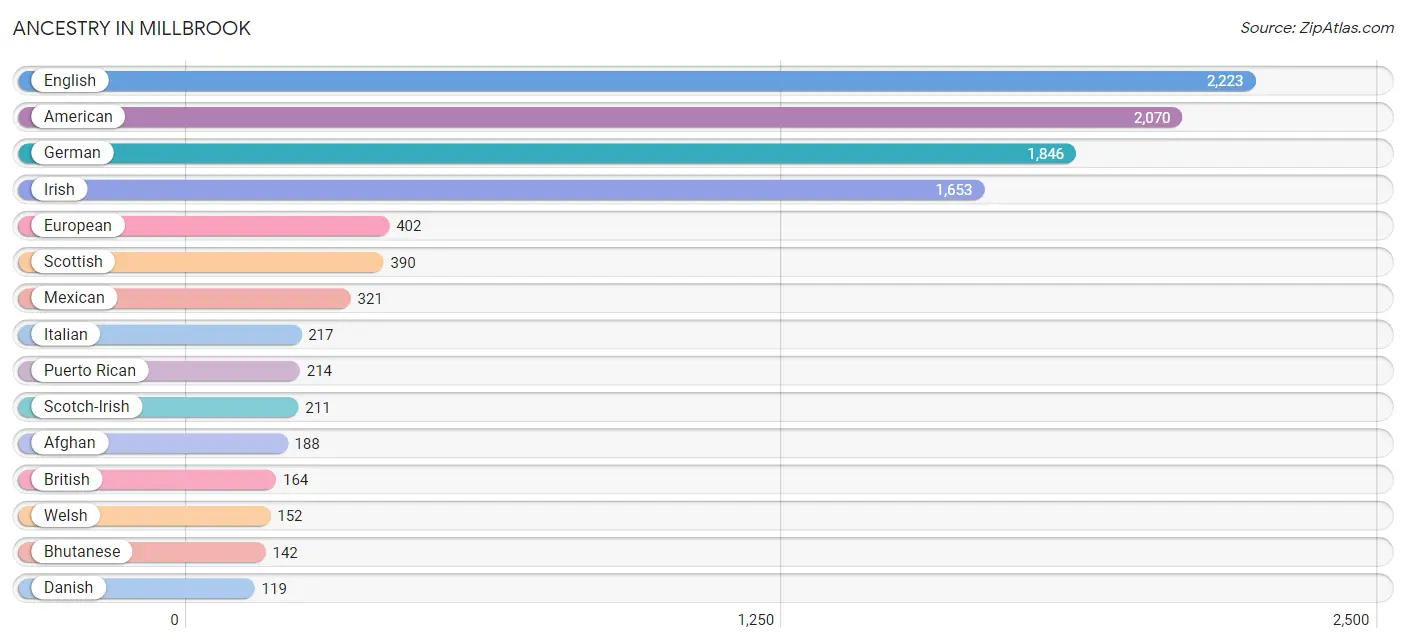
Ancestry in Millbrook
The most populous ancestries reported in Millbrook are English (2,223 | 13.4%), American (2,070 | 12.4%), German (1,846 | 11.1%), Irish (1,653 | 9.9%), and European (402 | 2.4%), together accounting for 49.3% of all Millbrook residents.
| Ancestry | # Population | % Population |
| Afghan | 188 | 1.1% |
| African | 61 | 0.4% |
| American | 2,070 | 12.4% |
| Arab | 34 | 0.2% |
| Bhutanese | 142 | 0.9% |
| British | 164 | 1.0% |
| Burmese | 21 | 0.1% |
| Central American | 28 | 0.2% |
| Cherokee | 92 | 0.5% |
| Costa Rican | 15 | 0.1% |
| Creek | 31 | 0.2% |
| Cypriot | 26 | 0.2% |
| Czech | 11 | 0.1% |
| Danish | 119 | 0.7% |
| Dutch | 45 | 0.3% |
| Eastern European | 12 | 0.1% |
| Egyptian | 22 | 0.1% |
| English | 2,223 | 13.4% |
| Estonian | 31 | 0.2% |
| European | 402 | 2.4% |
| French | 115 | 0.7% |
| French Canadian | 16 | 0.1% |
| German | 1,846 | 11.1% |
| Greek | 17 | 0.1% |
| Hungarian | 30 | 0.2% |
| Irish | 1,653 | 9.9% |
| Israeli | 31 | 0.2% |
| Italian | 217 | 1.3% |
| Korean | 47 | 0.3% |
| Lebanese | 12 | 0.1% |
| Mexican | 321 | 1.9% |
| Nigerian | 16 | 0.1% |
| Northern European | 32 | 0.2% |
| Norwegian | 66 | 0.4% |
| Panamanian | 13 | 0.1% |
| Polish | 56 | 0.3% |
| Portuguese | 44 | 0.3% |
| Puerto Rican | 214 | 1.3% |
| Scandinavian | 18 | 0.1% |
| Scotch-Irish | 211 | 1.3% |
| Scottish | 390 | 2.4% |
| Spanish | 67 | 0.4% |
| Subsaharan African | 77 | 0.5% |
| Swedish | 111 | 0.7% |
| Swiss | 19 | 0.1% |
| Welsh | 152 | 0.9% |
| West Indian | 26 | 0.2% | View All 47 Rows |
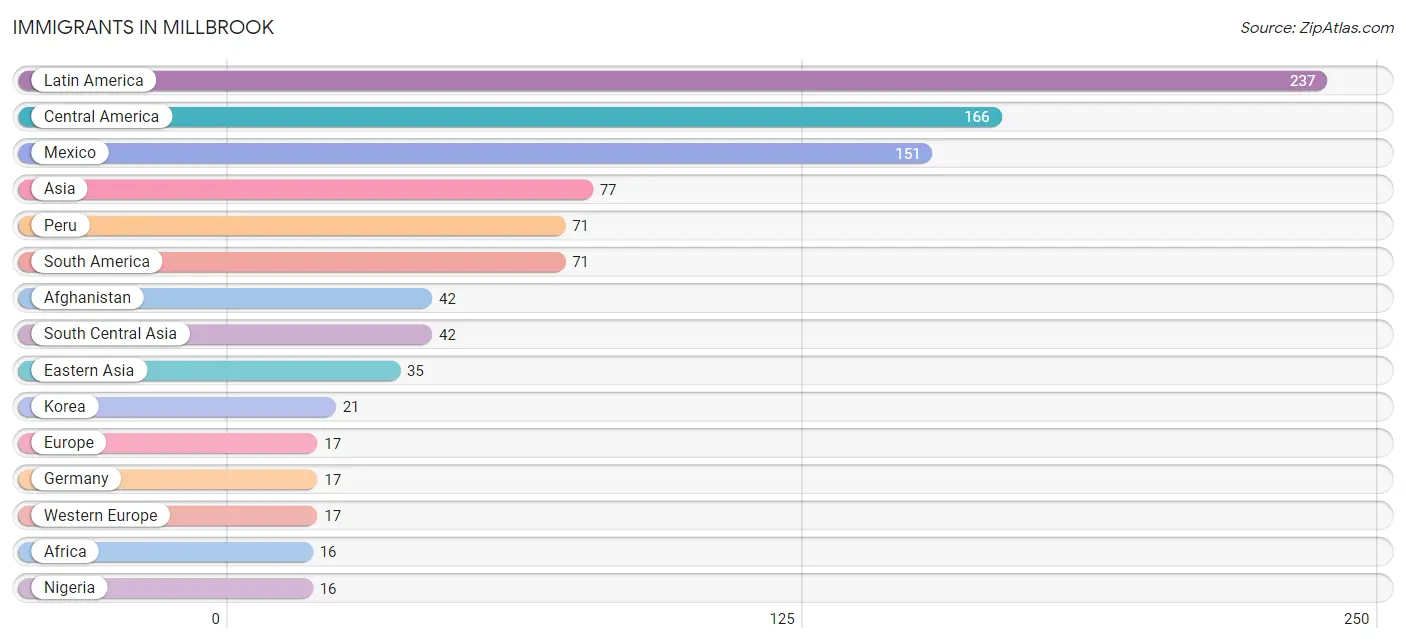
Immigrants in Millbrook
The most numerous immigrant groups reported in Millbrook came from Latin America (237 | 1.4%), Central America (166 | 1.0%), Mexico (151 | 0.9%), Asia (77 | 0.5%), and Peru (71 | 0.4%), together accounting for 4.2% of all Millbrook residents.
| Immigration Origin | # Population | % Population |
| Afghanistan | 42 | 0.3% |
| Africa | 16 | 0.1% |
| Asia | 77 | 0.5% |
| Central America | 166 | 1.0% |
| Costa Rica | 15 | 0.1% |
| Eastern Asia | 35 | 0.2% |
| Europe | 17 | 0.1% |
| Germany | 17 | 0.1% |
| Japan | 14 | 0.1% |
| Korea | 21 | 0.1% |
| Latin America | 237 | 1.4% |
| Mexico | 151 | 0.9% |
| Nigeria | 16 | 0.1% |
| Peru | 71 | 0.4% |
| South America | 71 | 0.4% |
| South Central Asia | 42 | 0.3% |
| Western Africa | 16 | 0.1% |
| Western Europe | 17 | 0.1% | View All 18 Rows |
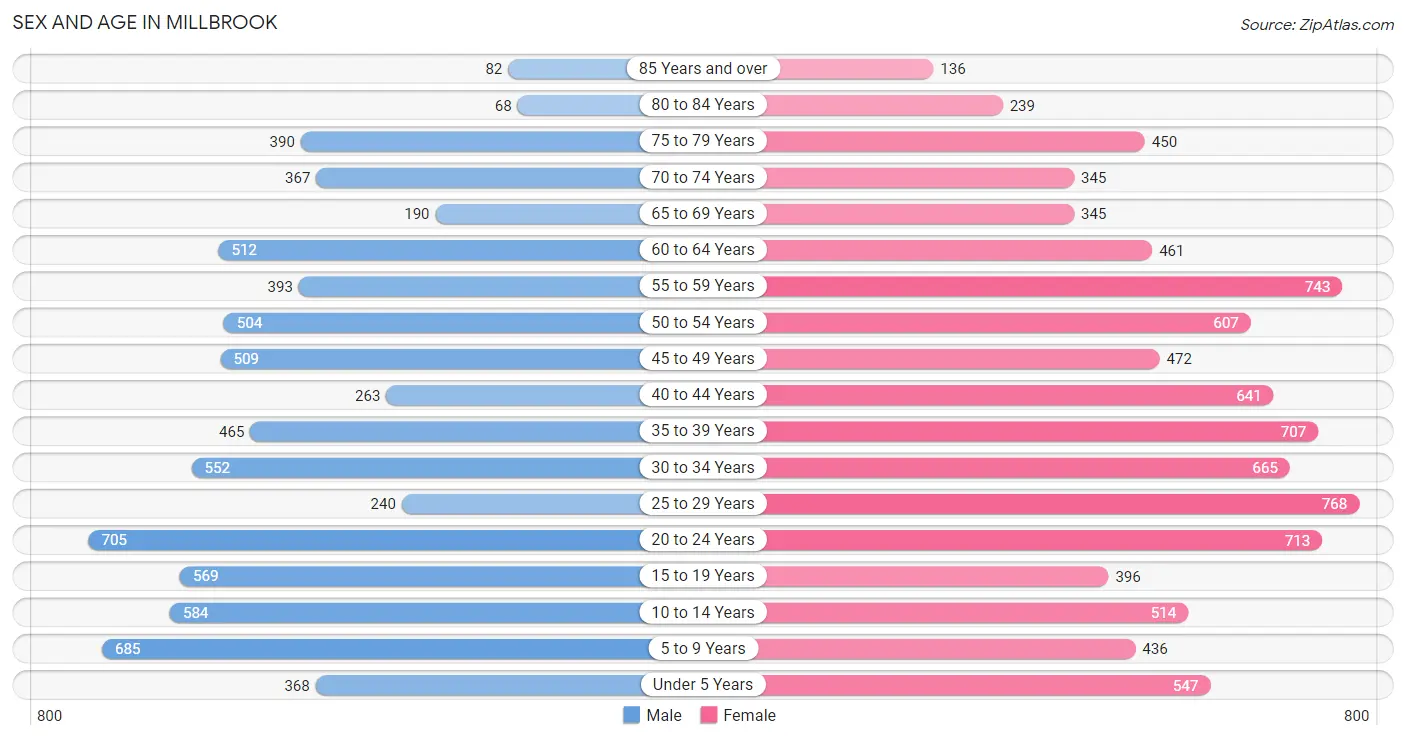
Sex and Age in Millbrook
Sex and Age in Millbrook
The most populous age groups in Millbrook are 20 to 24 Years (705 | 9.5%) for men and 25 to 29 Years (768 | 8.4%) for women.
| Age Bracket | Male | Female |
| Under 5 Years | 368 (4.9%) | 547 (6.0%) |
| 5 to 9 Years | 685 (9.2%) | 436 (4.8%) |
| 10 to 14 Years | 584 (7.8%) | 514 (5.6%) |
| 15 to 19 Years | 569 (7.6%) | 396 (4.3%) |
| 20 to 24 Years | 705 (9.5%) | 713 (7.8%) |
| 25 to 29 Years | 240 (3.2%) | 768 (8.4%) |
| 30 to 34 Years | 552 (7.4%) | 665 (7.2%) |
| 35 to 39 Years | 465 (6.2%) | 707 (7.7%) |
| 40 to 44 Years | 263 (3.5%) | 641 (7.0%) |
| 45 to 49 Years | 509 (6.8%) | 472 (5.1%) |
| 50 to 54 Years | 504 (6.8%) | 607 (6.6%) |
| 55 to 59 Years | 393 (5.3%) | 743 (8.1%) |
| 60 to 64 Years | 512 (6.9%) | 461 (5.0%) |
| 65 to 69 Years | 190 (2.5%) | 345 (3.8%) |
| 70 to 74 Years | 367 (4.9%) | 345 (3.8%) |
| 75 to 79 Years | 390 (5.2%) | 450 (4.9%) |
| 80 to 84 Years | 68 (0.9%) | 239 (2.6%) |
| 85 Years and over | 82 (1.1%) | 136 (1.5%) |
| Total | 7,446 (100.0%) | 9,185 (100.0%) |
Families and Households in Millbrook
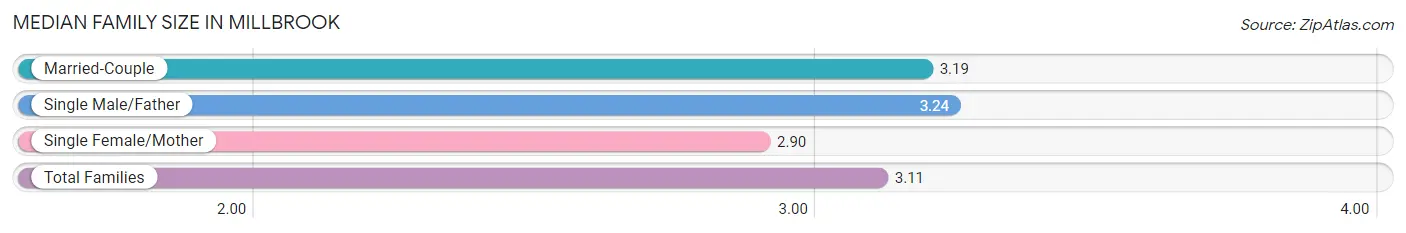
Median Family Size in Millbrook
The median family size in Millbrook is 3.11 persons per family, with single male/father families (268 | 6.0%) accounting for the largest median family size of 3.24 persons per family. On the other hand, single female/mother families (1,280 | 28.8%) represent the smallest median family size with 2.90 persons per family.
| Family Type | # Families | Family Size |
| Married-Couple | 2,898 (65.2%) | 3.19 |
| Single Male/Father | 268 (6.0%) | 3.24 |
| Single Female/Mother | 1,280 (28.8%) | 2.90 |
| Total Families | 4,446 (100.0%) | 3.11 |
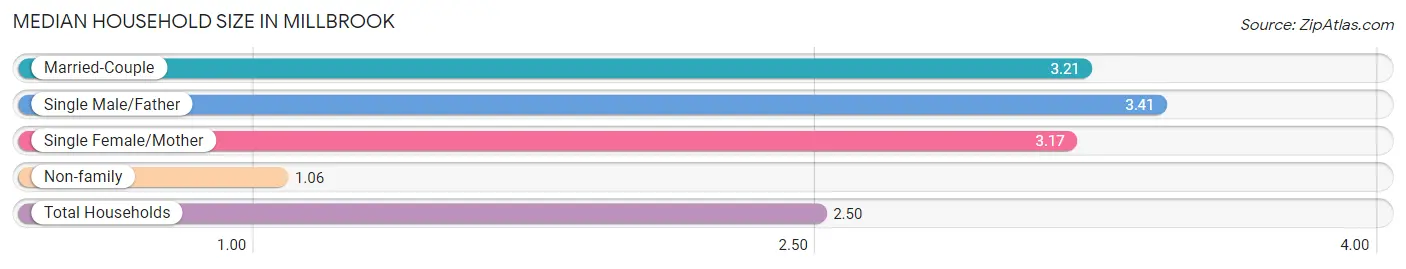
Median Household Size in Millbrook
The median household size in Millbrook is 2.50 persons per household, with single male/father households (268 | 4.0%) accounting for the largest median household size of 3.41 persons per household. non-family households (2,197 | 33.1%) represent the smallest median household size with 1.06 persons per household.
| Household Type | # Households | Household Size |
| Married-Couple | 2,898 (43.6%) | 3.21 |
| Single Male/Father | 268 (4.0%) | 3.41 |
| Single Female/Mother | 1,280 (19.3%) | 3.17 |
| Non-family | 2,197 (33.1%) | 1.06 |
| Total Households | 6,643 (100.0%) | 2.50 |
Household Size by Marriage Status in Millbrook
Out of a total of 6,643 households in Millbrook, 4,446 (66.9%) are family households, while 2,197 (33.1%) are nonfamily households. The most numerous type of family households are 2-person households, comprising 1,981, and the most common type of nonfamily households are 1-person households, comprising 2,073.
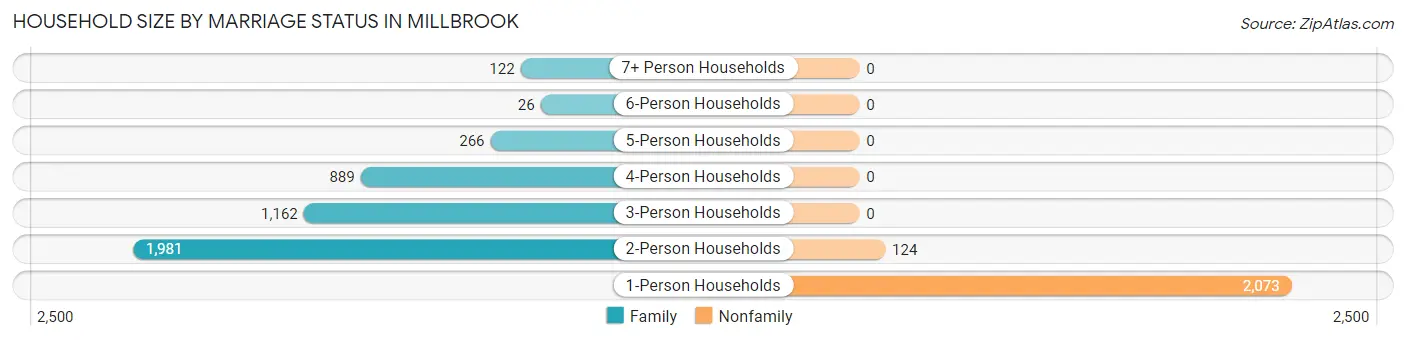
| Household Size | Family Households | Nonfamily Households |
| 1-Person Households | - | 2,073 (31.2%) |
| 2-Person Households | 1,981 (29.8%) | 124 (1.9%) |
| 3-Person Households | 1,162 (17.5%) | 0 (0.0%) |
| 4-Person Households | 889 (13.4%) | 0 (0.0%) |
| 5-Person Households | 266 (4.0%) | 0 (0.0%) |
| 6-Person Households | 26 (0.4%) | 0 (0.0%) |
| 7+ Person Households | 122 (1.8%) | 0 (0.0%) |
| Total | 4,446 (66.9%) | 2,197 (33.1%) |
Female Fertility in Millbrook
Fertility by Age in Millbrook
Average fertility rate in Millbrook is 78.0 births per 1,000 women. Women in the age bracket of 15 to 19 years have the highest fertility rate with 265.0 births per 1,000 women. Women in the age bracket of 20 to 34 years acount for 47.5% of all women with births.
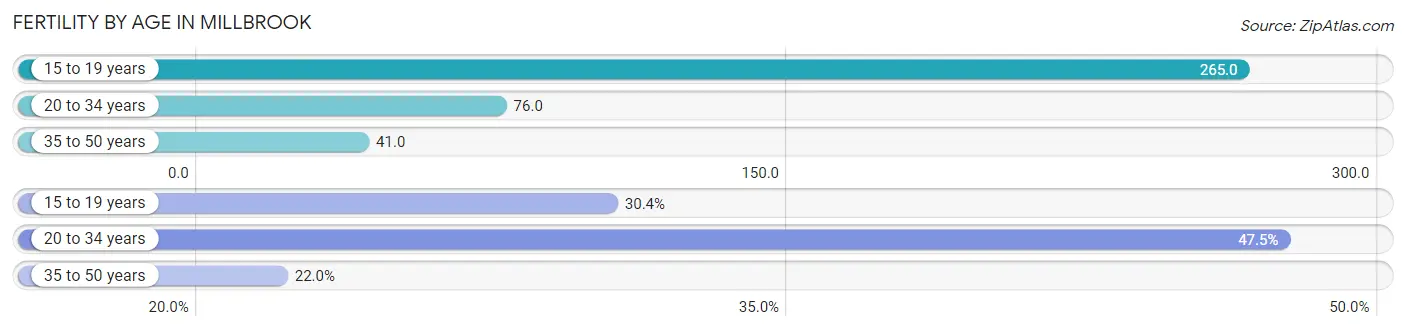
| Age Bracket | Women with Births | Births / 1,000 Women |
| 15 to 19 years | 105 (30.4%) | 265.0 |
| 20 to 34 years | 164 (47.5%) | 76.0 |
| 35 to 50 years | 76 (22.0%) | 41.0 |
| Total | 345 (100.0%) | 78.0 |
Fertility by Age by Marriage Status in Millbrook
41.2% of women with births (345) in Millbrook are married. The highest percentage of unmarried women with births falls into 15 to 19 years age bracket with 100.0% of them unmarried at the time of birth, while the lowest percentage of unmarried women with births belong to 35 to 50 years age bracket with 0.0% of them unmarried.
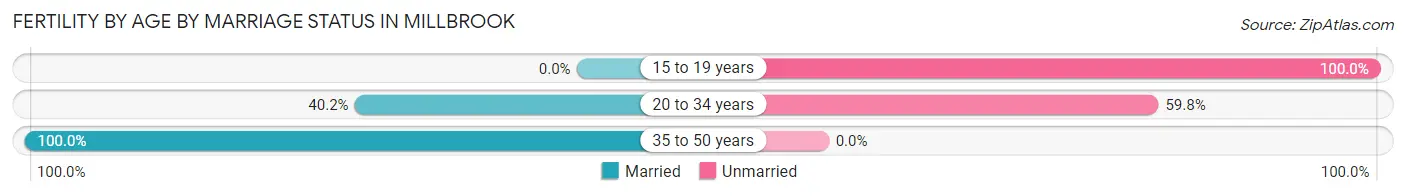
| Age Bracket | Married | Unmarried |
| 15 to 19 years | 0 (0.0%) | 105 (100.0%) |
| 20 to 34 years | 66 (40.2%) | 98 (59.8%) |
| 35 to 50 years | 76 (100.0%) | 0 (0.0%) |
| Total | 142 (41.2%) | 203 (58.8%) |
Fertility by Education in Millbrook
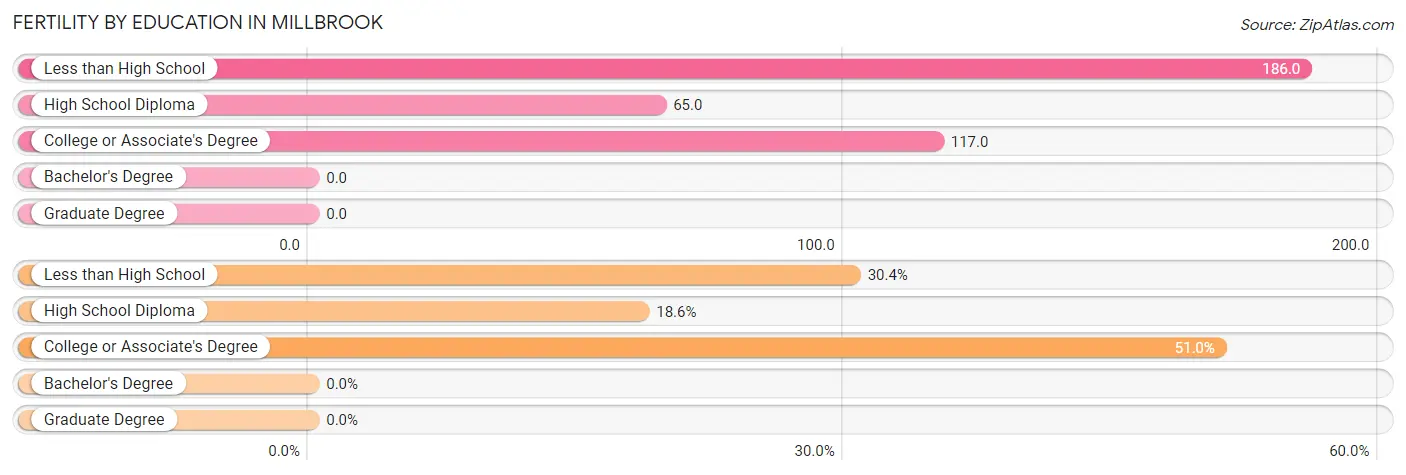
| Educational Attainment | Women with Births | Births / 1,000 Women |
| Less than High School | 105 (30.4%) | 186.0 |
| High School Diploma | 64 (18.5%) | 65.0 |
| College or Associate's Degree | 176 (51.0%) | 117.0 |
| Bachelor's Degree | 0 (0.0%) | 0.0 |
| Graduate Degree | 0 (0.0%) | 0.0 |
| Total | 345 (100.0%) | 78.0 |
Fertility by Education by Marriage Status in Millbrook
58.8% of women with births in Millbrook are unmarried. Women with the educational attainment of college or associate's degree are most likely to be married with 80.7% of them married at childbirth, while women with the educational attainment of less than high school are least likely to be married with 100.0% of them unmarried at childbirth.
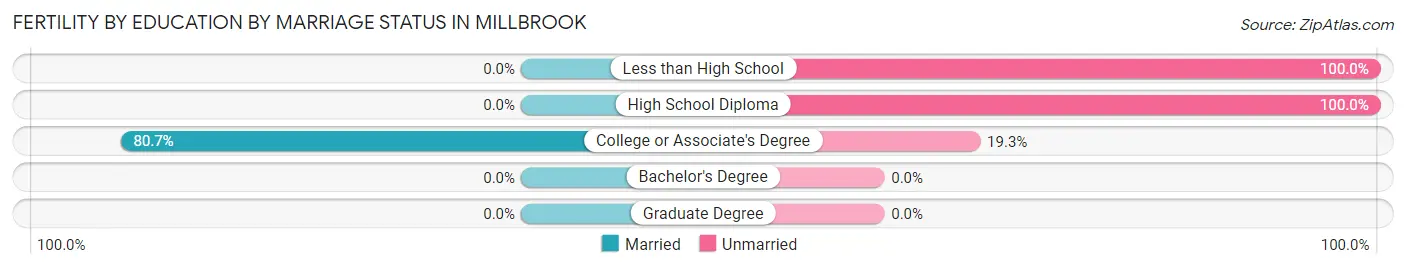
| Educational Attainment | Married | Unmarried |
| Less than High School | 0 (0.0%) | 105 (100.0%) |
| High School Diploma | 0 (0.0%) | 64 (100.0%) |
| College or Associate's Degree | 142 (80.7%) | 34 (19.3%) |
| Bachelor's Degree | 0 (0.0%) | 0 (0.0%) |
| Graduate Degree | 0 (0.0%) | 0 (0.0%) |
| Total | 142 (41.2%) | 203 (58.8%) |
Employment Characteristics in Millbrook
Employment by Class of Employer in Millbrook
Among the 7,610 employed individuals in Millbrook, private company employees (4,519 | 59.4%), state government employees (1,096 | 14.4%), and not-for-profit organizations (633 | 8.3%) make up the most common classes of employment.
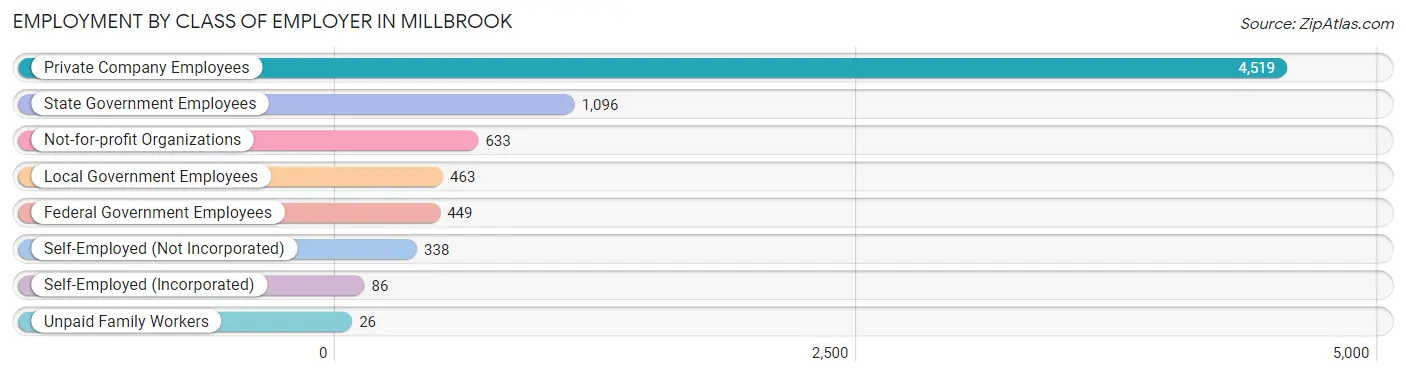
| Employer Class | # Employees | % Employees |
| Private Company Employees | 4,519 | 59.4% |
| Self-Employed (Incorporated) | 86 | 1.1% |
| Self-Employed (Not Incorporated) | 338 | 4.4% |
| Not-for-profit Organizations | 633 | 8.3% |
| Local Government Employees | 463 | 6.1% |
| State Government Employees | 1,096 | 14.4% |
| Federal Government Employees | 449 | 5.9% |
| Unpaid Family Workers | 26 | 0.3% |
| Total | 7,610 | 100.0% |
Employment Status by Age in Millbrook
According to the labor force statistics for Millbrook, out of the total population over 16 years of age (13,324), 61.3% or 8,168 individuals are in the labor force, with 4.5% or 368 of them unemployed. The age group with the highest labor force participation rate is 25 to 29 years, with 96.2% or 970 individuals in the labor force. Within the labor force, the 16 to 19 years age range has the highest percentage of unemployed individuals, with 29.0% or 18 of them being unemployed.
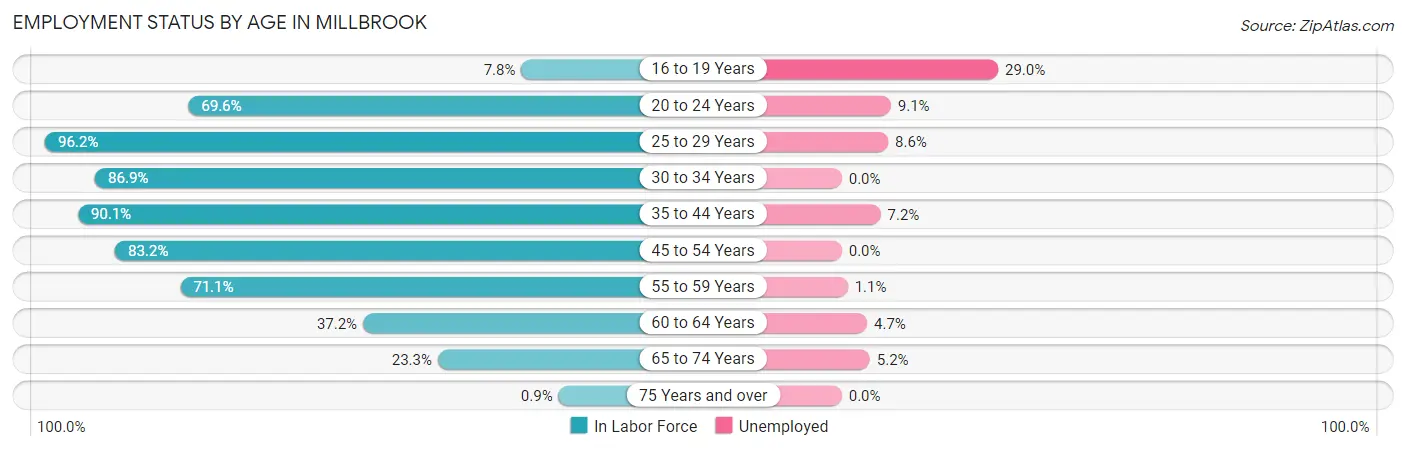
| Age Bracket | In Labor Force | Unemployed |
| 16 to 19 Years | 62 (7.8%) | 18 (29.0%) |
| 20 to 24 Years | 987 (69.6%) | 90 (9.1%) |
| 25 to 29 Years | 970 (96.2%) | 83 (8.6%) |
| 30 to 34 Years | 1,058 (86.9%) | 0 (0.0%) |
| 35 to 44 Years | 1,870 (90.1%) | 135 (7.2%) |
| 45 to 54 Years | 1,741 (83.2%) | 0 (0.0%) |
| 55 to 59 Years | 808 (71.1%) | 9 (1.1%) |
| 60 to 64 Years | 362 (37.2%) | 17 (4.7%) |
| 65 to 74 Years | 291 (23.3%) | 15 (5.2%) |
| 75 Years and over | 12 (0.9%) | 0 (0.0%) |
| Total | 8,168 (61.3%) | 368 (4.5%) |
Employment Status by Educational Attainment in Millbrook
According to labor force statistics for Millbrook, 80.1% of individuals (6,810) out of the total population between 25 and 64 years of age (8,502) are in the labor force, with 3.6% or 245 of them being unemployed. The group with the highest labor force participation rate are those with the educational attainment of bachelor's degree or higher, with 89.2% or 2,387 individuals in the labor force. Within the labor force, individuals with college / associate degree education have the highest percentage of unemployment, with 4.8% or 123 of them being unemployed.
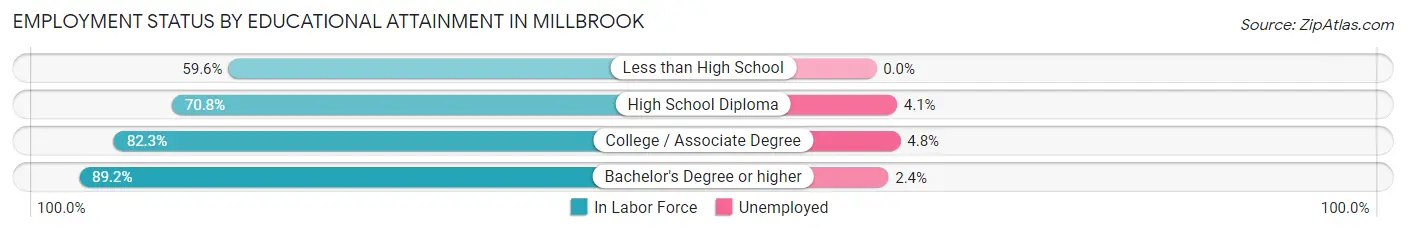
| Educational Attainment | In Labor Force | Unemployed |
| Less than High School | 330 (59.6%) | 0 (0.0%) |
| High School Diploma | 1,520 (70.8%) | 88 (4.1%) |
| College / Associate Degree | 2,572 (82.3%) | 150 (4.8%) |
| Bachelor's Degree or higher | 2,387 (89.2%) | 64 (2.4%) |
| Total | 6,810 (80.1%) | 306 (3.6%) |
Employment Occupations by Sex in Millbrook
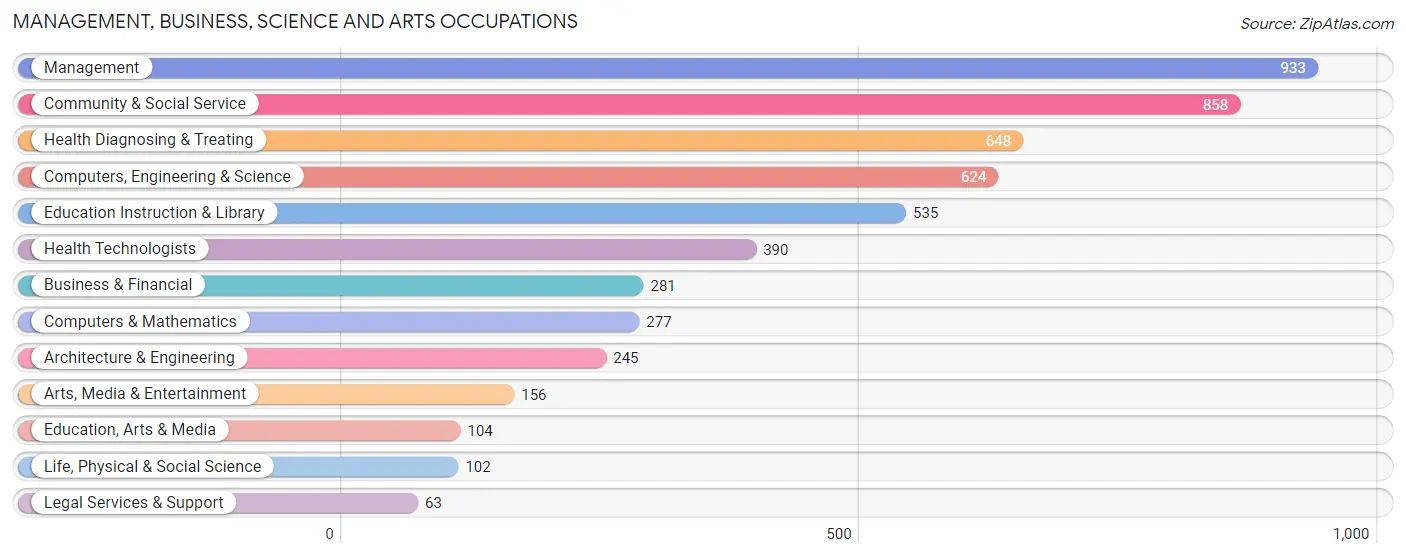
Management, Business, Science and Arts Occupations
The most common Management, Business, Science and Arts occupations in Millbrook are Management (933 | 12.2%), Community & Social Service (858 | 11.3%), Health Diagnosing & Treating (648 | 8.5%), Computers, Engineering & Science (624 | 8.2%), and Education Instruction & Library (535 | 7.0%).
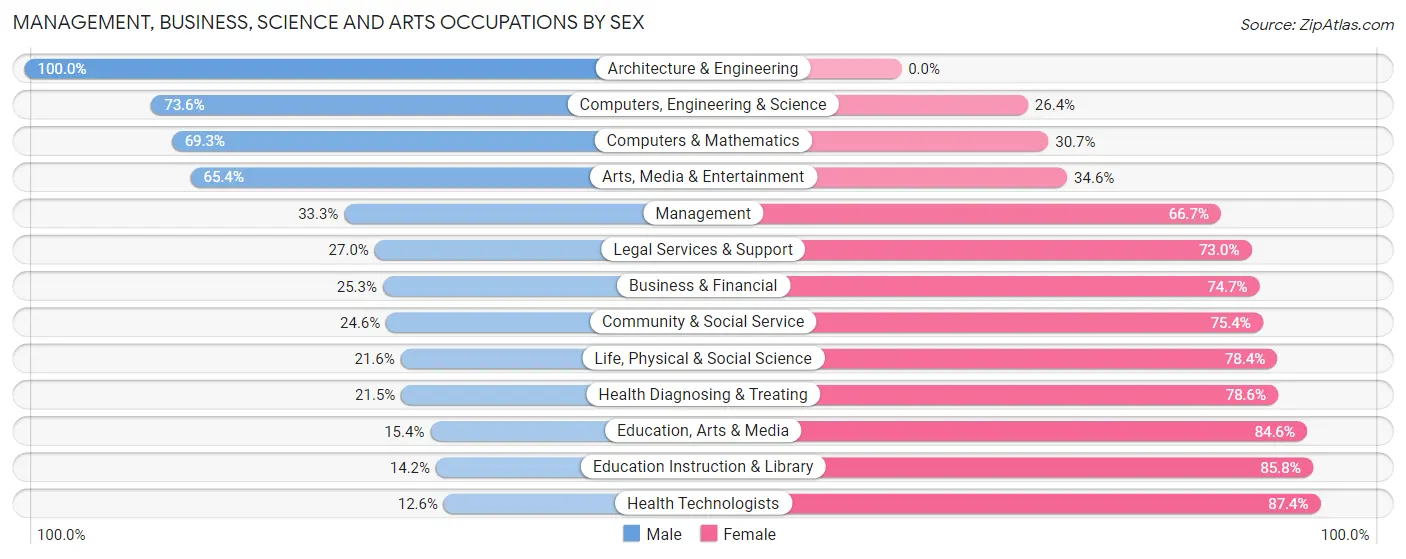
Management, Business, Science and Arts Occupations by Sex
Within the Management, Business, Science and Arts occupations in Millbrook, the most male-oriented occupations are Architecture & Engineering (100.0%), Computers, Engineering & Science (73.6%), and Computers & Mathematics (69.3%), while the most female-oriented occupations are Health Technologists (87.4%), Education Instruction & Library (85.8%), and Education, Arts & Media (84.6%).
| Occupation | Male | Female |
| Management | 311 (33.3%) | 622 (66.7%) |
| Business & Financial | 71 (25.3%) | 210 (74.7%) |
| Computers, Engineering & Science | 459 (73.6%) | 165 (26.4%) |
| Computers & Mathematics | 192 (69.3%) | 85 (30.7%) |
| Architecture & Engineering | 245 (100.0%) | 0 (0.0%) |
| Life, Physical & Social Science | 22 (21.6%) | 80 (78.4%) |
| Community & Social Service | 211 (24.6%) | 647 (75.4%) |
| Education, Arts & Media | 16 (15.4%) | 88 (84.6%) |
| Legal Services & Support | 17 (27.0%) | 46 (73.0%) |
| Education Instruction & Library | 76 (14.2%) | 459 (85.8%) |
| Arts, Media & Entertainment | 102 (65.4%) | 54 (34.6%) |
| Health Diagnosing & Treating | 139 (21.4%) | 509 (78.5%) |
| Health Technologists | 49 (12.6%) | 341 (87.4%) |
| Total (Category) | 1,191 (35.6%) | 2,153 (64.4%) |
| Total (Overall) | 3,323 (43.6%) | 4,296 (56.4%) |
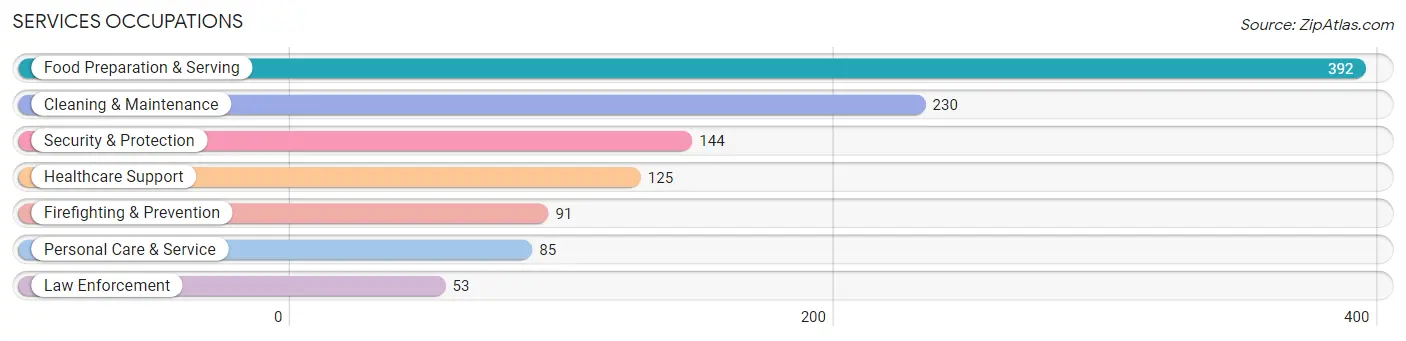
Services Occupations
The most common Services occupations in Millbrook are Food Preparation & Serving (392 | 5.1%), Cleaning & Maintenance (230 | 3.0%), Security & Protection (144 | 1.9%), Healthcare Support (125 | 1.6%), and Firefighting & Prevention (91 | 1.2%).
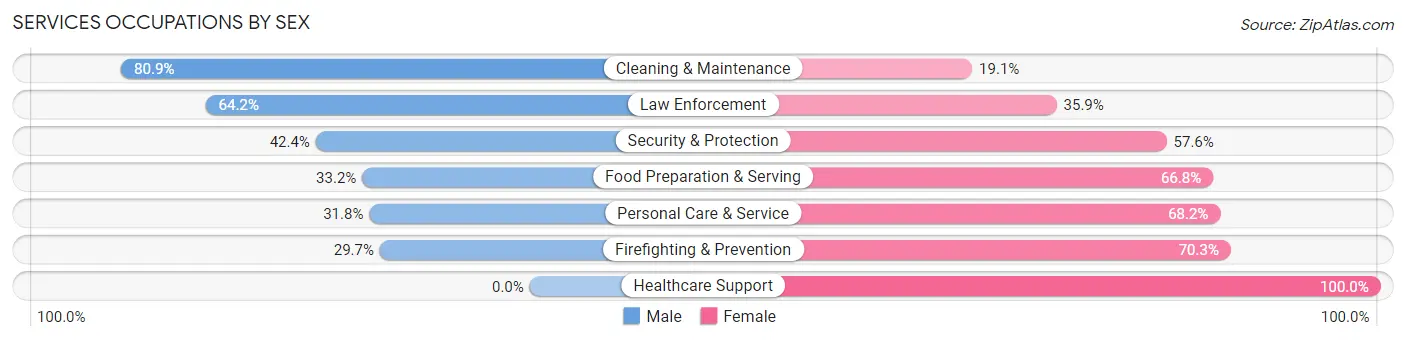
Services Occupations by Sex
Within the Services occupations in Millbrook, the most male-oriented occupations are Cleaning & Maintenance (80.9%), Law Enforcement (64.1%), and Security & Protection (42.4%), while the most female-oriented occupations are Healthcare Support (100.0%), Firefighting & Prevention (70.3%), and Personal Care & Service (68.2%).
| Occupation | Male | Female |
| Healthcare Support | 0 (0.0%) | 125 (100.0%) |
| Security & Protection | 61 (42.4%) | 83 (57.6%) |
| Firefighting & Prevention | 27 (29.7%) | 64 (70.3%) |
| Law Enforcement | 34 (64.1%) | 19 (35.8%) |
| Food Preparation & Serving | 130 (33.2%) | 262 (66.8%) |
| Cleaning & Maintenance | 186 (80.9%) | 44 (19.1%) |
| Personal Care & Service | 27 (31.8%) | 58 (68.2%) |
| Total (Category) | 404 (41.4%) | 572 (58.6%) |
| Total (Overall) | 3,323 (43.6%) | 4,296 (56.4%) |
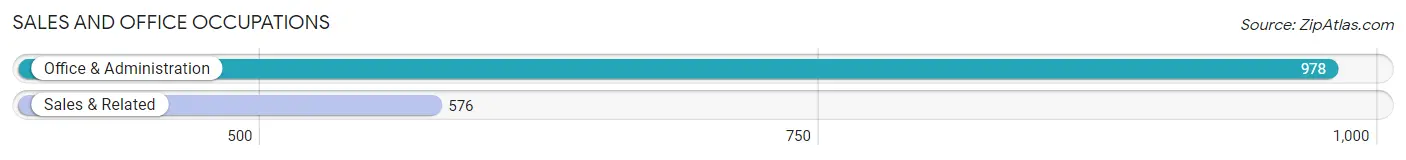
Sales and Office Occupations
The most common Sales and Office occupations in Millbrook are Office & Administration (978 | 12.8%), and Sales & Related (576 | 7.6%).
Sales and Office Occupations by Sex
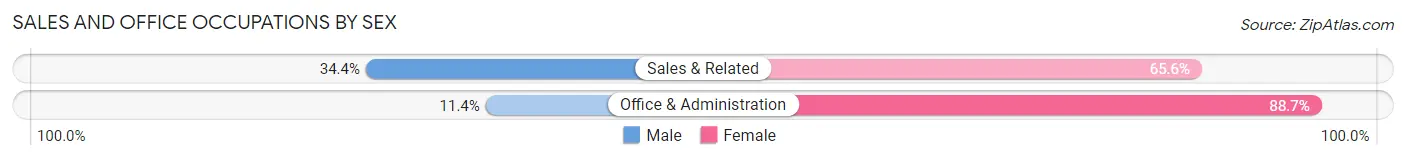
| Occupation | Male | Female |
| Sales & Related | 198 (34.4%) | 378 (65.6%) |
| Office & Administration | 111 (11.4%) | 867 (88.6%) |
| Total (Category) | 309 (19.9%) | 1,245 (80.1%) |
| Total (Overall) | 3,323 (43.6%) | 4,296 (56.4%) |
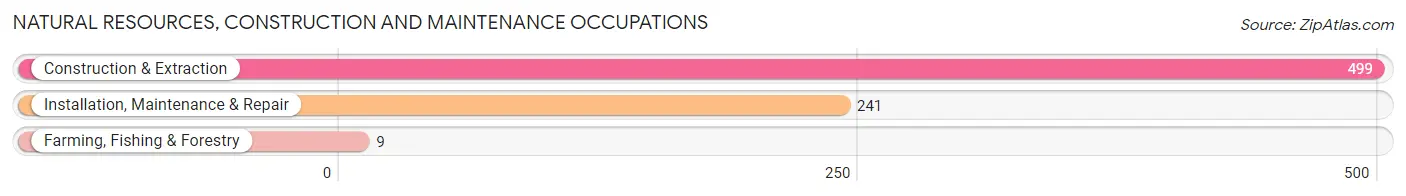
Natural Resources, Construction and Maintenance Occupations
The most common Natural Resources, Construction and Maintenance occupations in Millbrook are Construction & Extraction (499 | 6.6%), Installation, Maintenance & Repair (241 | 3.2%), and Farming, Fishing & Forestry (9 | 0.1%).
Natural Resources, Construction and Maintenance Occupations by Sex
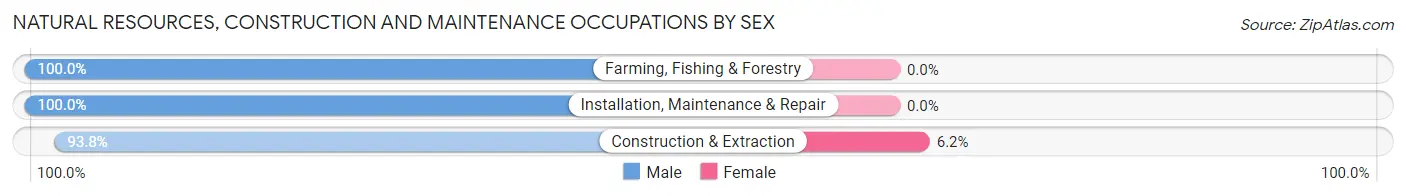
| Occupation | Male | Female |
| Farming, Fishing & Forestry | 9 (100.0%) | 0 (0.0%) |
| Construction & Extraction | 468 (93.8%) | 31 (6.2%) |
| Installation, Maintenance & Repair | 241 (100.0%) | 0 (0.0%) |
| Total (Category) | 718 (95.9%) | 31 (4.1%) |
| Total (Overall) | 3,323 (43.6%) | 4,296 (56.4%) |
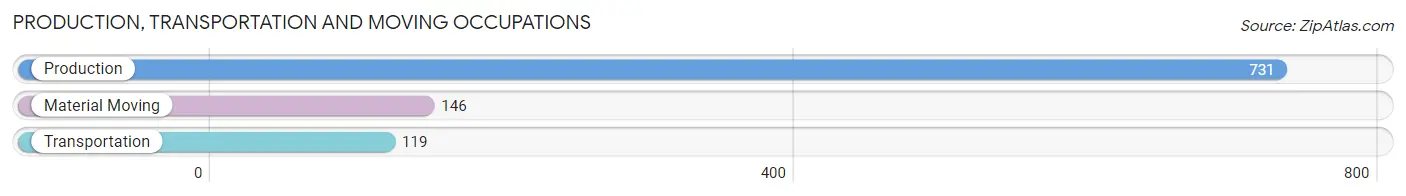
Production, Transportation and Moving Occupations
The most common Production, Transportation and Moving occupations in Millbrook are Production (731 | 9.6%), Material Moving (146 | 1.9%), and Transportation (119 | 1.6%).
Production, Transportation and Moving Occupations by Sex
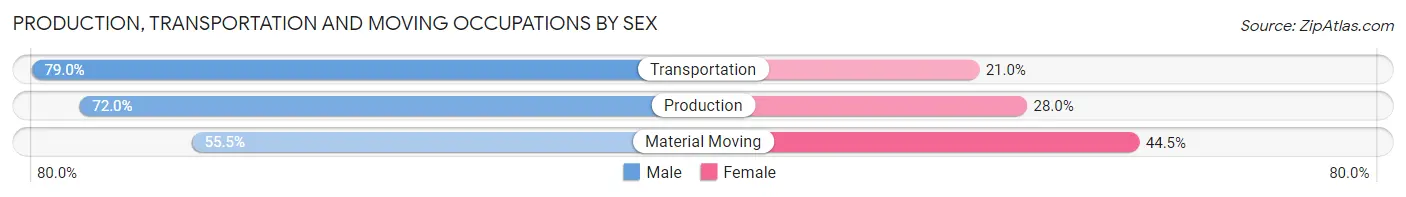
| Occupation | Male | Female |
| Production | 526 (72.0%) | 205 (28.0%) |
| Transportation | 94 (79.0%) | 25 (21.0%) |
| Material Moving | 81 (55.5%) | 65 (44.5%) |
| Total (Category) | 701 (70.4%) | 295 (29.6%) |
| Total (Overall) | 3,323 (43.6%) | 4,296 (56.4%) |
Employment Industries by Sex in Millbrook
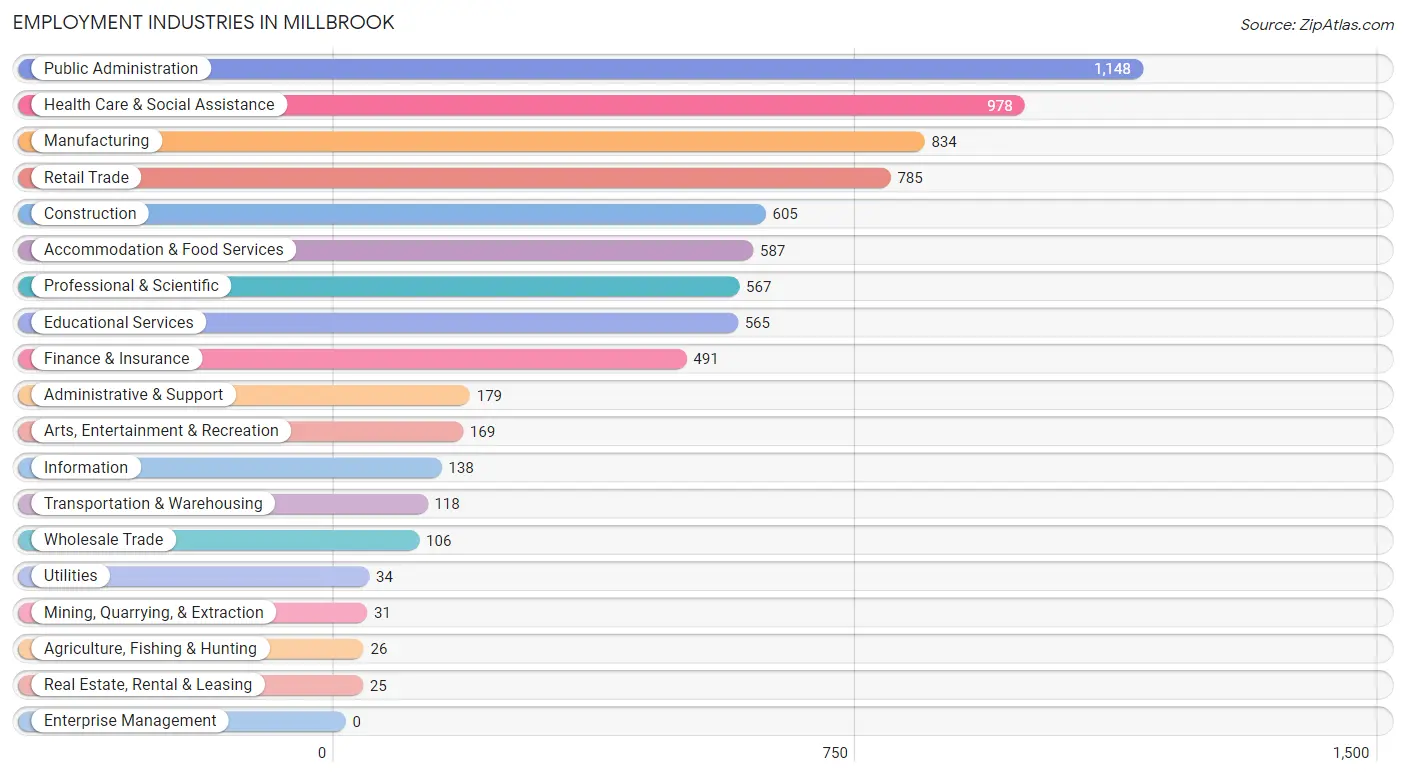
Employment Industries in Millbrook
The major employment industries in Millbrook include Public Administration (1,148 | 15.1%), Health Care & Social Assistance (978 | 12.8%), Manufacturing (834 | 11.0%), Retail Trade (785 | 10.3%), and Construction (605 | 7.9%).
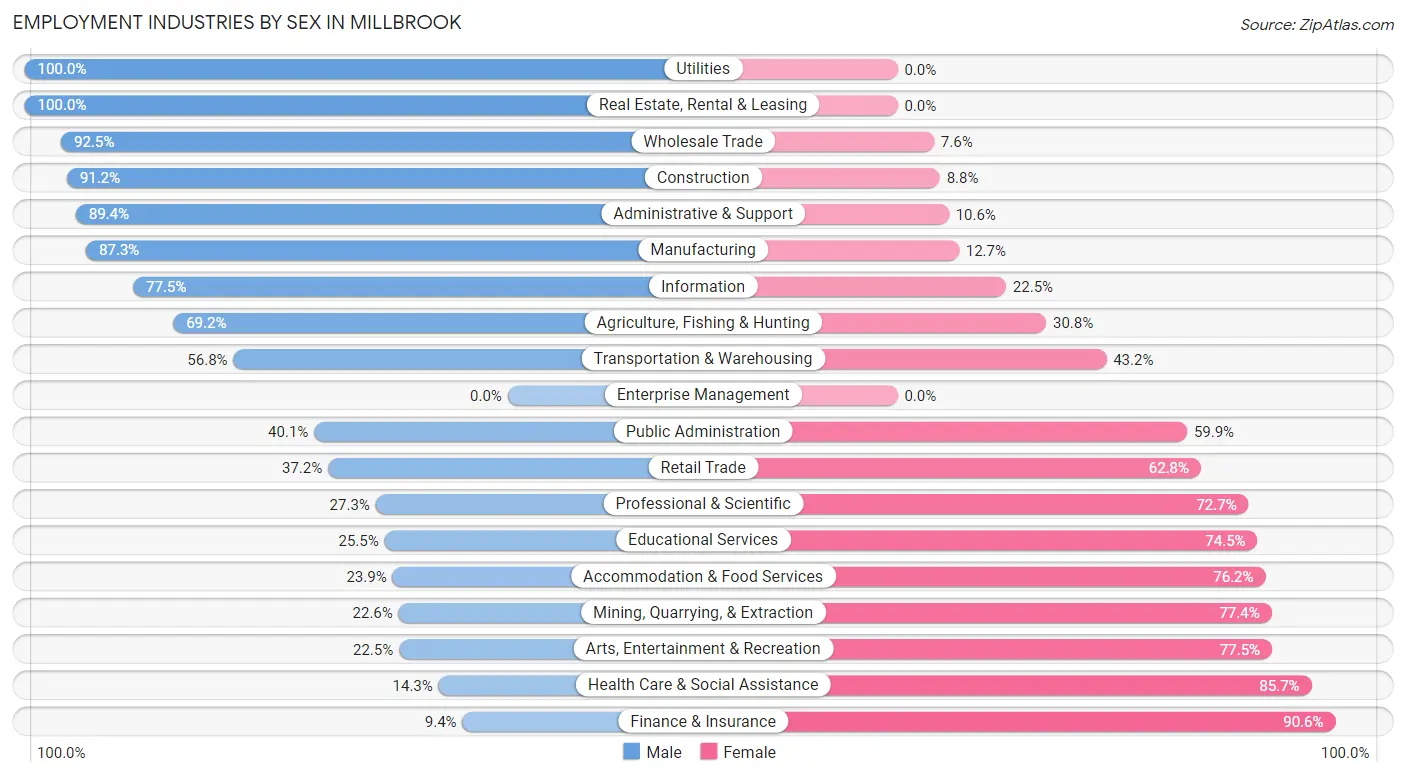
Employment Industries by Sex in Millbrook
The Millbrook industries that see more men than women are Utilities (100.0%), Real Estate, Rental & Leasing (100.0%), and Wholesale Trade (92.4%), whereas the industries that tend to have a higher number of women are Finance & Insurance (90.6%), Health Care & Social Assistance (85.7%), and Arts, Entertainment & Recreation (77.5%).
| Industry | Male | Female |
| Agriculture, Fishing & Hunting | 18 (69.2%) | 8 (30.8%) |
| Mining, Quarrying, & Extraction | 7 (22.6%) | 24 (77.4%) |
| Construction | 552 (91.2%) | 53 (8.8%) |
| Manufacturing | 728 (87.3%) | 106 (12.7%) |
| Wholesale Trade | 98 (92.4%) | 8 (7.5%) |
| Retail Trade | 292 (37.2%) | 493 (62.8%) |
| Transportation & Warehousing | 67 (56.8%) | 51 (43.2%) |
| Utilities | 34 (100.0%) | 0 (0.0%) |
| Information | 107 (77.5%) | 31 (22.5%) |
| Finance & Insurance | 46 (9.4%) | 445 (90.6%) |
| Real Estate, Rental & Leasing | 25 (100.0%) | 0 (0.0%) |
| Professional & Scientific | 155 (27.3%) | 412 (72.7%) |
| Enterprise Management | 0 (0.0%) | 0 (0.0%) |
| Administrative & Support | 160 (89.4%) | 19 (10.6%) |
| Educational Services | 144 (25.5%) | 421 (74.5%) |
| Health Care & Social Assistance | 140 (14.3%) | 838 (85.7%) |
| Arts, Entertainment & Recreation | 38 (22.5%) | 131 (77.5%) |
| Accommodation & Food Services | 140 (23.8%) | 447 (76.1%) |
| Public Administration | 460 (40.1%) | 688 (59.9%) |
| Total | 3,323 (43.6%) | 4,296 (56.4%) |
Education in Millbrook
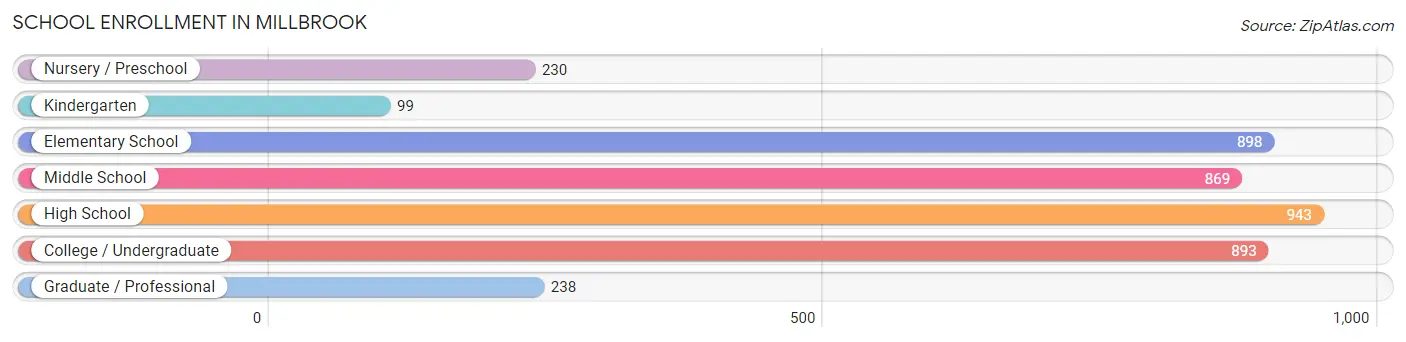
School Enrollment in Millbrook
The most common levels of schooling among the 4,170 students in Millbrook are high school (943 | 22.6%), elementary school (898 | 21.5%), and college / undergraduate (893 | 21.4%).
| School Level | # Students | % Students |
| Nursery / Preschool | 230 | 5.5% |
| Kindergarten | 99 | 2.4% |
| Elementary School | 898 | 21.5% |
| Middle School | 869 | 20.8% |
| High School | 943 | 22.6% |
| College / Undergraduate | 893 | 21.4% |
| Graduate / Professional | 238 | 5.7% |
| Total | 4,170 | 100.0% |
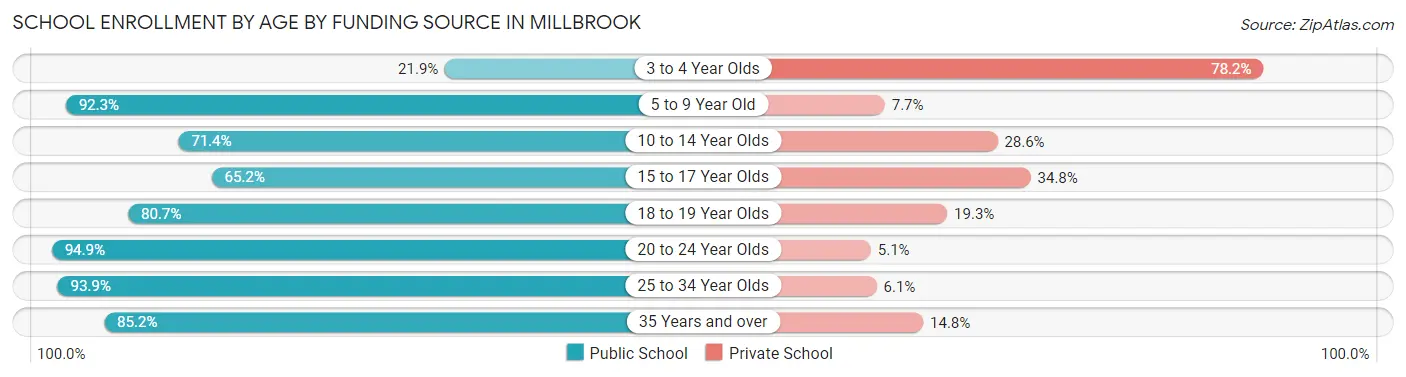
School Enrollment by Age by Funding Source in Millbrook
Out of a total of 4,170 students who are enrolled in schools in Millbrook, 813 (19.5%) attend a private institution, while the remaining 3,357 (80.5%) are enrolled in public schools. The age group of 3 to 4 year olds has the highest likelihood of being enrolled in private schools, with 118 (78.1% in the age bracket) enrolled. Conversely, the age group of 20 to 24 year olds has the lowest likelihood of being enrolled in a private school, with 563 (94.9% in the age bracket) attending a public institution.
| Age Bracket | Public School | Private School |
| 3 to 4 Year Olds | 33 (21.8%) | 118 (78.1%) |
| 5 to 9 Year Old | 940 (92.3%) | 78 (7.7%) |
| 10 to 14 Year Olds | 765 (71.4%) | 307 (28.6%) |
| 15 to 17 Year Olds | 292 (65.2%) | 156 (34.8%) |
| 18 to 19 Year Olds | 335 (80.7%) | 80 (19.3%) |
| 20 to 24 Year Olds | 563 (94.9%) | 30 (5.1%) |
| 25 to 34 Year Olds | 260 (93.9%) | 17 (6.1%) |
| 35 Years and over | 167 (85.2%) | 29 (14.8%) |
| Total | 3,357 (80.5%) | 813 (19.5%) |
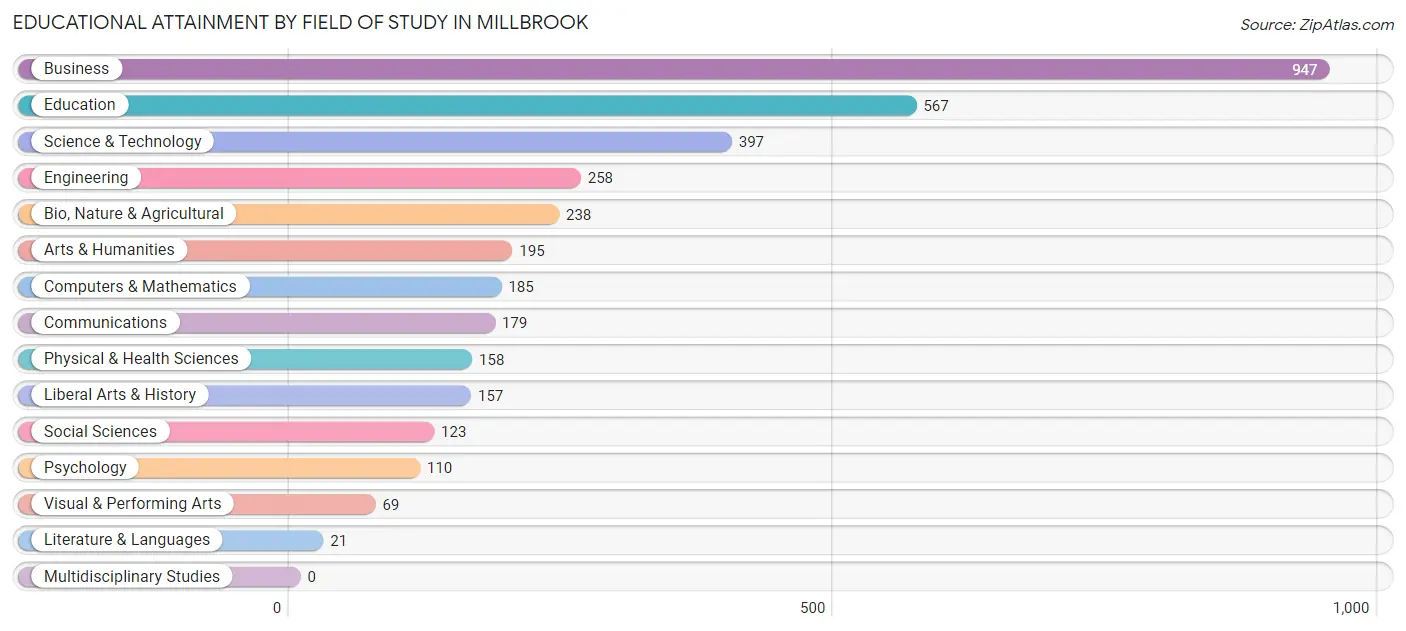
Educational Attainment by Field of Study in Millbrook
Business (947 | 26.3%), education (567 | 15.7%), science & technology (397 | 11.0%), engineering (258 | 7.2%), and bio, nature & agricultural (238 | 6.6%) are the most common fields of study among 3,604 individuals in Millbrook who have obtained a bachelor's degree or higher.
| Field of Study | # Graduates | % Graduates |
| Computers & Mathematics | 185 | 5.1% |
| Bio, Nature & Agricultural | 238 | 6.6% |
| Physical & Health Sciences | 158 | 4.4% |
| Psychology | 110 | 3.0% |
| Social Sciences | 123 | 3.4% |
| Engineering | 258 | 7.2% |
| Multidisciplinary Studies | 0 | 0.0% |
| Science & Technology | 397 | 11.0% |
| Business | 947 | 26.3% |
| Education | 567 | 15.7% |
| Literature & Languages | 21 | 0.6% |
| Liberal Arts & History | 157 | 4.4% |
| Visual & Performing Arts | 69 | 1.9% |
| Communications | 179 | 5.0% |
| Arts & Humanities | 195 | 5.4% |
| Total | 3,604 | 100.0% |
Transportation & Commute in Millbrook
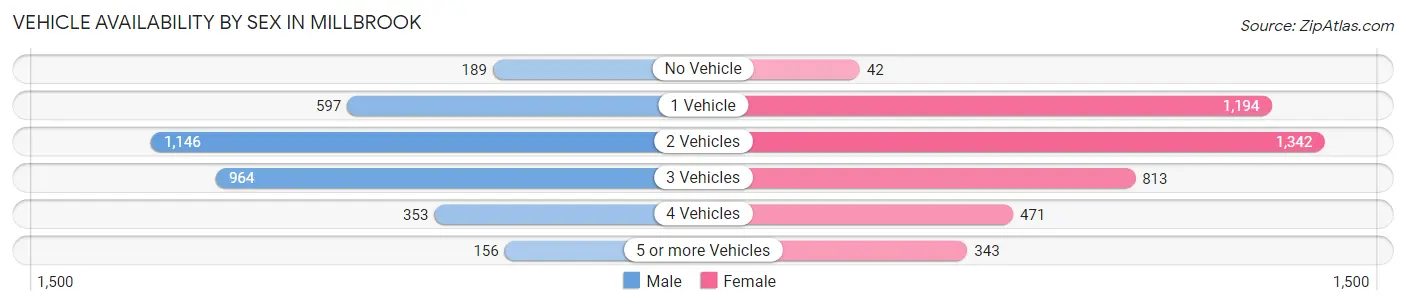
Vehicle Availability by Sex in Millbrook
The most prevalent vehicle ownership categories in Millbrook are males with 2 vehicles (1,146, accounting for 33.7%) and females with 2 vehicles (1,342, making up 27.3%).
| Vehicles Available | Male | Female |
| No Vehicle | 189 (5.6%) | 42 (1.0%) |
| 1 Vehicle | 597 (17.5%) | 1,194 (28.4%) |
| 2 Vehicles | 1,146 (33.7%) | 1,342 (31.9%) |
| 3 Vehicles | 964 (28.3%) | 813 (19.3%) |
| 4 Vehicles | 353 (10.4%) | 471 (11.2%) |
| 5 or more Vehicles | 156 (4.6%) | 343 (8.2%) |
| Total | 3,405 (100.0%) | 4,205 (100.0%) |
Commute Time in Millbrook
The most frequently occuring commute durations in Millbrook are 30 to 34 minutes (1,965 commuters, 27.4%), 20 to 24 minutes (1,387 commuters, 19.3%), and 15 to 19 minutes (1,008 commuters, 14.1%).
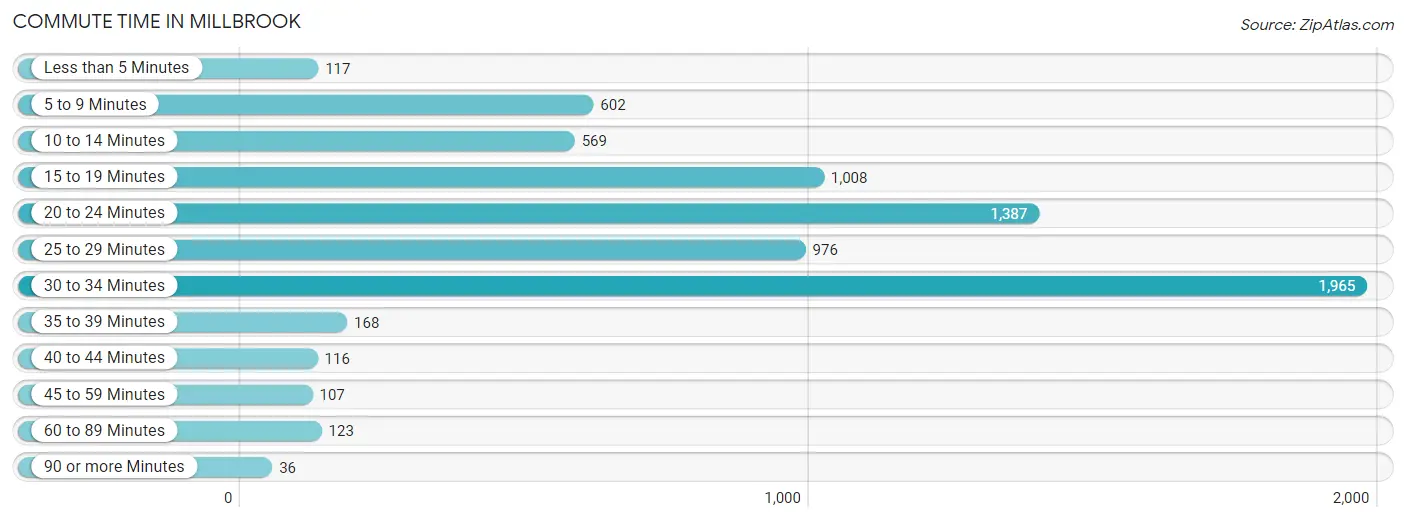
| Commute Time | # Commuters | % Commuters |
| Less than 5 Minutes | 117 | 1.6% |
| 5 to 9 Minutes | 602 | 8.4% |
| 10 to 14 Minutes | 569 | 7.9% |
| 15 to 19 Minutes | 1,008 | 14.1% |
| 20 to 24 Minutes | 1,387 | 19.3% |
| 25 to 29 Minutes | 976 | 13.6% |
| 30 to 34 Minutes | 1,965 | 27.4% |
| 35 to 39 Minutes | 168 | 2.3% |
| 40 to 44 Minutes | 116 | 1.6% |
| 45 to 59 Minutes | 107 | 1.5% |
| 60 to 89 Minutes | 123 | 1.7% |
| 90 or more Minutes | 36 | 0.5% |
Commute Time by Sex in Millbrook
The most common commute times in Millbrook are 30 to 34 minutes (862 commuters, 26.3%) for males and 30 to 34 minutes (1,103 commuters, 28.3%) for females.
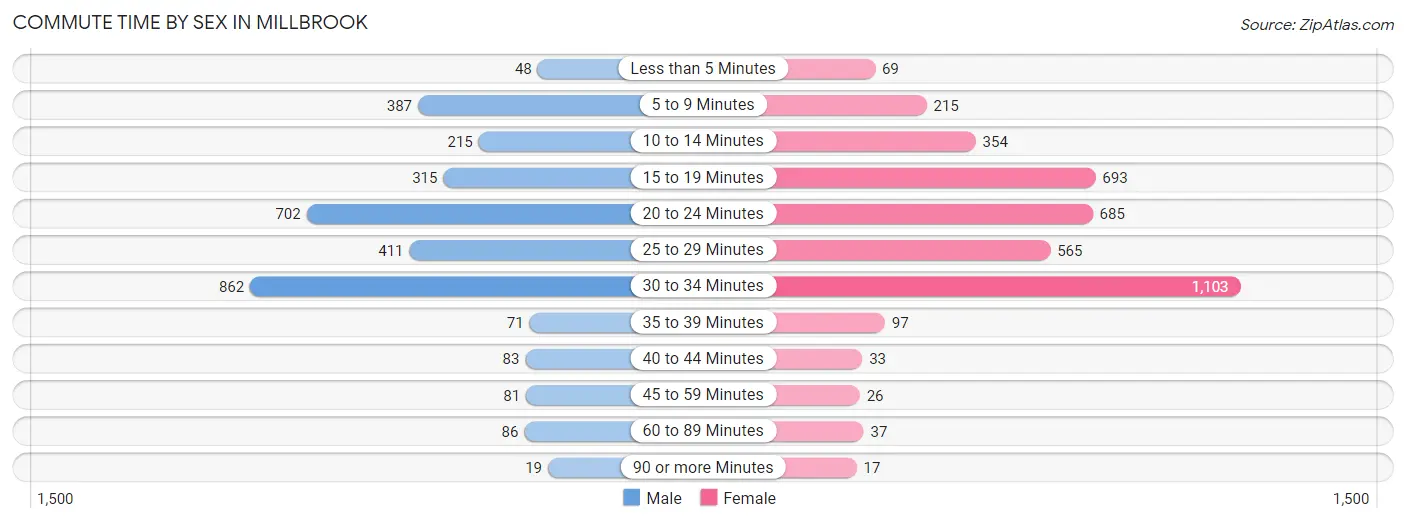
| Commute Time | Male | Female |
| Less than 5 Minutes | 48 (1.5%) | 69 (1.8%) |
| 5 to 9 Minutes | 387 (11.8%) | 215 (5.5%) |
| 10 to 14 Minutes | 215 (6.6%) | 354 (9.1%) |
| 15 to 19 Minutes | 315 (9.6%) | 693 (17.8%) |
| 20 to 24 Minutes | 702 (21.4%) | 685 (17.6%) |
| 25 to 29 Minutes | 411 (12.5%) | 565 (14.5%) |
| 30 to 34 Minutes | 862 (26.3%) | 1,103 (28.3%) |
| 35 to 39 Minutes | 71 (2.2%) | 97 (2.5%) |
| 40 to 44 Minutes | 83 (2.5%) | 33 (0.9%) |
| 45 to 59 Minutes | 81 (2.5%) | 26 (0.7%) |
| 60 to 89 Minutes | 86 (2.6%) | 37 (0.9%) |
| 90 or more Minutes | 19 (0.6%) | 17 (0.4%) |
Time of Departure to Work by Sex in Millbrook
The most frequent times of departure to work in Millbrook are 7:00 AM to 7:29 AM (884, 27.0%) for males and 7:00 AM to 7:29 AM (747, 19.2%) for females.
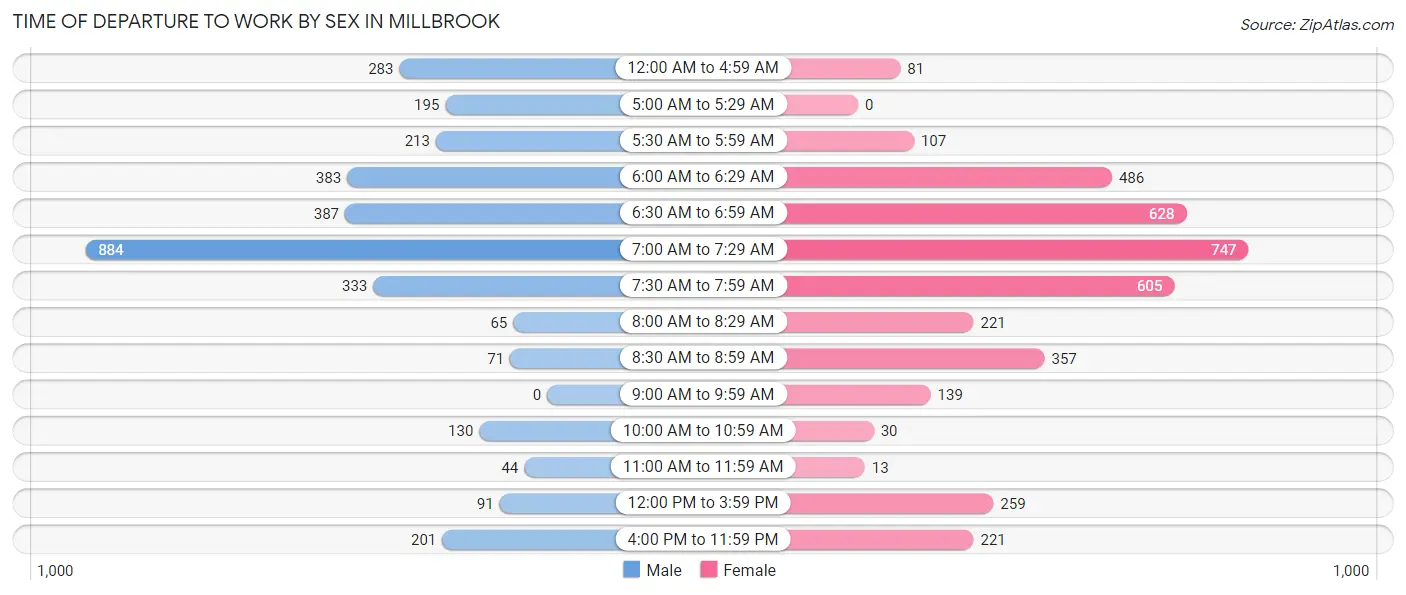
| Time of Departure | Male | Female |
| 12:00 AM to 4:59 AM | 283 (8.6%) | 81 (2.1%) |
| 5:00 AM to 5:29 AM | 195 (5.9%) | 0 (0.0%) |
| 5:30 AM to 5:59 AM | 213 (6.5%) | 107 (2.8%) |
| 6:00 AM to 6:29 AM | 383 (11.7%) | 486 (12.5%) |
| 6:30 AM to 6:59 AM | 387 (11.8%) | 628 (16.1%) |
| 7:00 AM to 7:29 AM | 884 (27.0%) | 747 (19.2%) |
| 7:30 AM to 7:59 AM | 333 (10.2%) | 605 (15.5%) |
| 8:00 AM to 8:29 AM | 65 (2.0%) | 221 (5.7%) |
| 8:30 AM to 8:59 AM | 71 (2.2%) | 357 (9.2%) |
| 9:00 AM to 9:59 AM | 0 (0.0%) | 139 (3.6%) |
| 10:00 AM to 10:59 AM | 130 (4.0%) | 30 (0.8%) |
| 11:00 AM to 11:59 AM | 44 (1.3%) | 13 (0.3%) |
| 12:00 PM to 3:59 PM | 91 (2.8%) | 259 (6.7%) |
| 4:00 PM to 11:59 PM | 201 (6.1%) | 221 (5.7%) |
| Total | 3,280 (100.0%) | 3,894 (100.0%) |
Housing Occupancy in Millbrook
Occupancy by Ownership in Millbrook
Of the total 6,643 dwellings in Millbrook, owner-occupied units account for 4,943 (74.4%), while renter-occupied units make up 1,700 (25.6%).
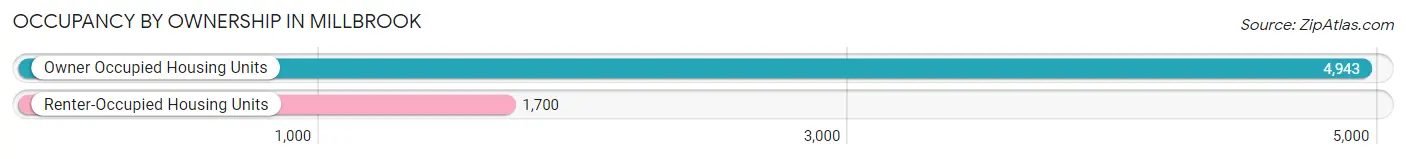
| Occupancy | # Housing Units | % Housing Units |
| Owner Occupied Housing Units | 4,943 | 74.4% |
| Renter-Occupied Housing Units | 1,700 | 25.6% |
| Total Occupied Housing Units | 6,643 | 100.0% |
Occupancy by Household Size in Millbrook
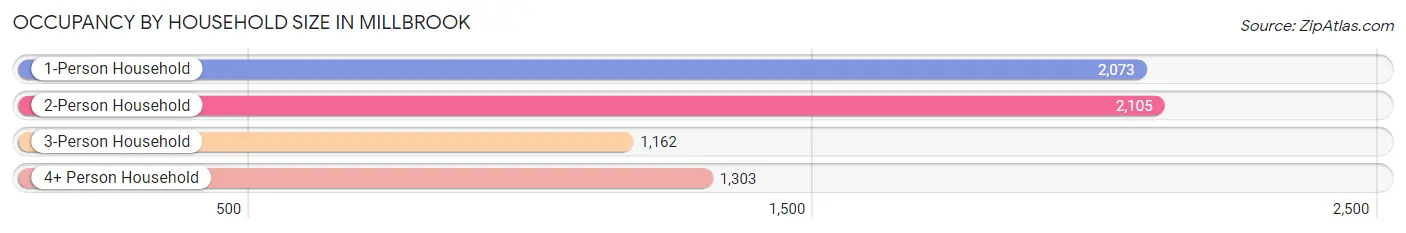
| Household Size | # Housing Units | % Housing Units |
| 1-Person Household | 2,073 | 31.2% |
| 2-Person Household | 2,105 | 31.7% |
| 3-Person Household | 1,162 | 17.5% |
| 4+ Person Household | 1,303 | 19.6% |
| Total Housing Units | 6,643 | 100.0% |
Occupancy by Ownership by Household Size in Millbrook
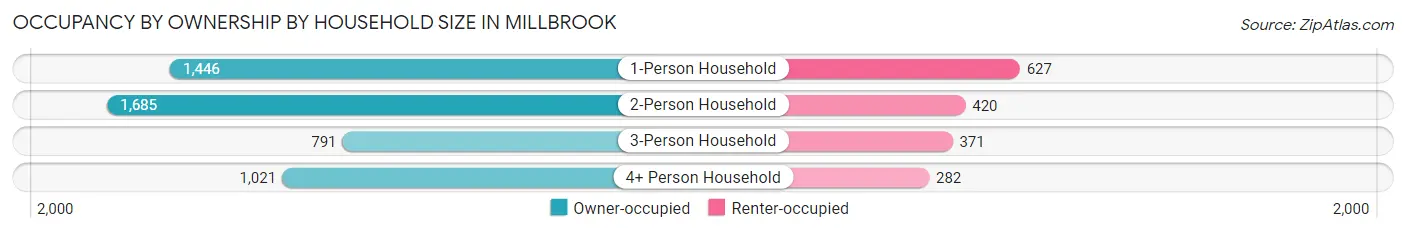
| Household Size | Owner-occupied | Renter-occupied |
| 1-Person Household | 1,446 (69.8%) | 627 (30.2%) |
| 2-Person Household | 1,685 (80.0%) | 420 (20.0%) |
| 3-Person Household | 791 (68.1%) | 371 (31.9%) |
| 4+ Person Household | 1,021 (78.4%) | 282 (21.6%) |
| Total Housing Units | 4,943 (74.4%) | 1,700 (25.6%) |
Occupancy by Educational Attainment in Millbrook
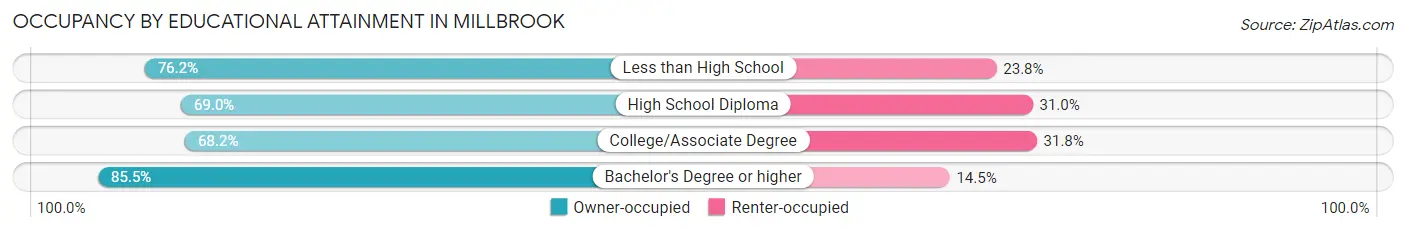
| Household Size | Owner-occupied | Renter-occupied |
| Less than High School | 454 (76.2%) | 142 (23.8%) |
| High School Diploma | 1,113 (69.0%) | 500 (31.0%) |
| College/Associate Degree | 1,631 (68.2%) | 761 (31.8%) |
| Bachelor's Degree or higher | 1,745 (85.5%) | 297 (14.5%) |
Occupancy by Age of Householder in Millbrook
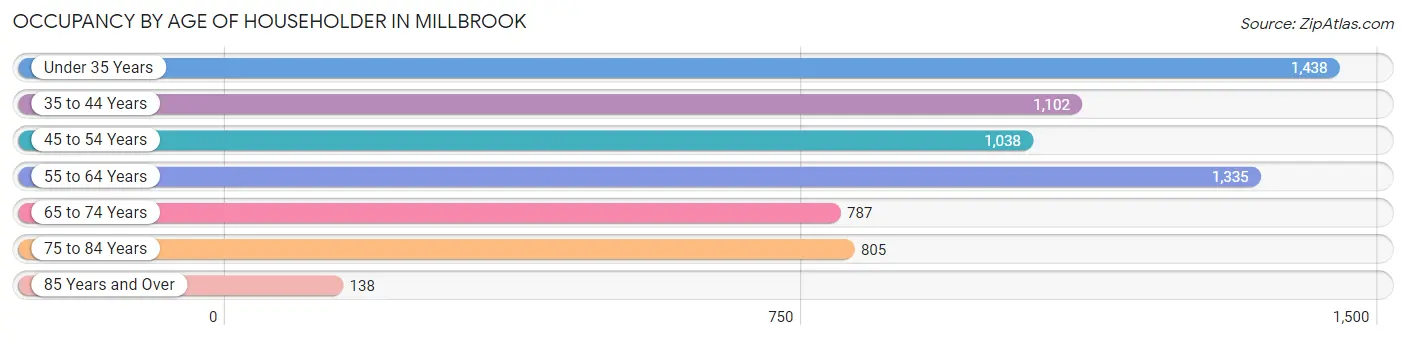
| Age Bracket | # Households | % Households |
| Under 35 Years | 1,438 | 21.6% |
| 35 to 44 Years | 1,102 | 16.6% |
| 45 to 54 Years | 1,038 | 15.6% |
| 55 to 64 Years | 1,335 | 20.1% |
| 65 to 74 Years | 787 | 11.8% |
| 75 to 84 Years | 805 | 12.1% |
| 85 Years and Over | 138 | 2.1% |
| Total | 6,643 | 100.0% |
Housing Finances in Millbrook
Median Income by Occupancy in Millbrook
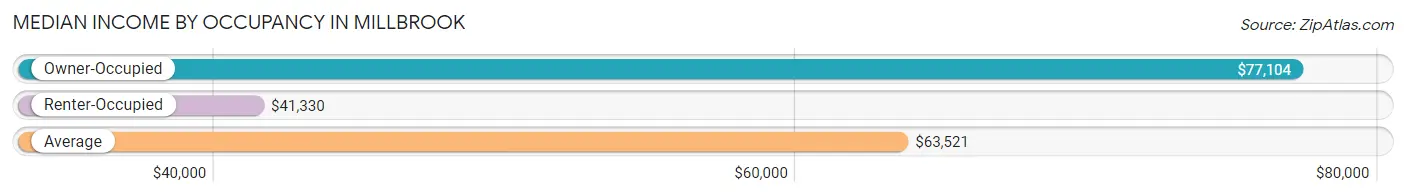
| Occupancy Type | # Households | Median Income |
| Owner-Occupied | 4,943 (74.4%) | $77,104 |
| Renter-Occupied | 1,700 (25.6%) | $41,330 |
| Average | 6,643 (100.0%) | $63,521 |
Occupancy by Householder Income Bracket in Millbrook
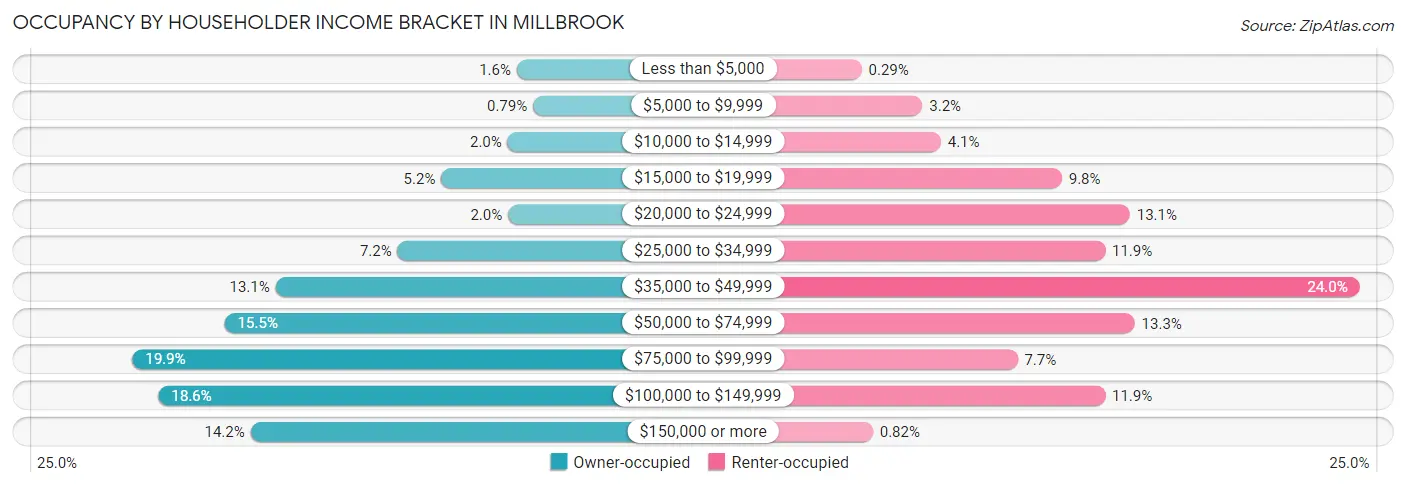
| Income Bracket | Owner-occupied | Renter-occupied |
| Less than $5,000 | 77 (1.6%) | 5 (0.3%) |
| $5,000 to $9,999 | 39 (0.8%) | 54 (3.2%) |
| $10,000 to $14,999 | 99 (2.0%) | 69 (4.1%) |
| $15,000 to $19,999 | 255 (5.2%) | 167 (9.8%) |
| $20,000 to $24,999 | 98 (2.0%) | 222 (13.1%) |
| $25,000 to $34,999 | 358 (7.2%) | 202 (11.9%) |
| $35,000 to $49,999 | 645 (13.1%) | 408 (24.0%) |
| $50,000 to $74,999 | 765 (15.5%) | 226 (13.3%) |
| $75,000 to $99,999 | 982 (19.9%) | 131 (7.7%) |
| $100,000 to $149,999 | 921 (18.6%) | 202 (11.9%) |
| $150,000 or more | 704 (14.2%) | 14 (0.8%) |
| Total | 4,943 (100.0%) | 1,700 (100.0%) |
Monthly Housing Cost Tiers in Millbrook
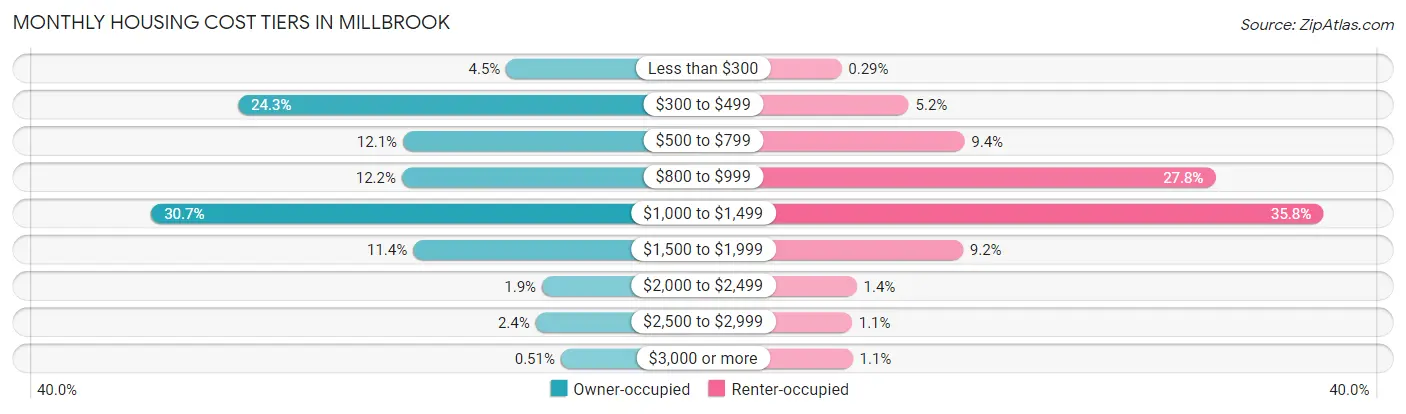
| Monthly Cost | Owner-occupied | Renter-occupied |
| Less than $300 | 224 (4.5%) | 5 (0.3%) |
| $300 to $499 | 1,200 (24.3%) | 89 (5.2%) |
| $500 to $799 | 600 (12.1%) | 159 (9.3%) |
| $800 to $999 | 604 (12.2%) | 473 (27.8%) |
| $1,000 to $1,499 | 1,516 (30.7%) | 608 (35.8%) |
| $1,500 to $1,999 | 563 (11.4%) | 157 (9.2%) |
| $2,000 to $2,499 | 94 (1.9%) | 24 (1.4%) |
| $2,500 to $2,999 | 117 (2.4%) | 18 (1.1%) |
| $3,000 or more | 25 (0.5%) | 19 (1.1%) |
| Total | 4,943 (100.0%) | 1,700 (100.0%) |
Physical Housing Characteristics in Millbrook
Housing Structures in Millbrook
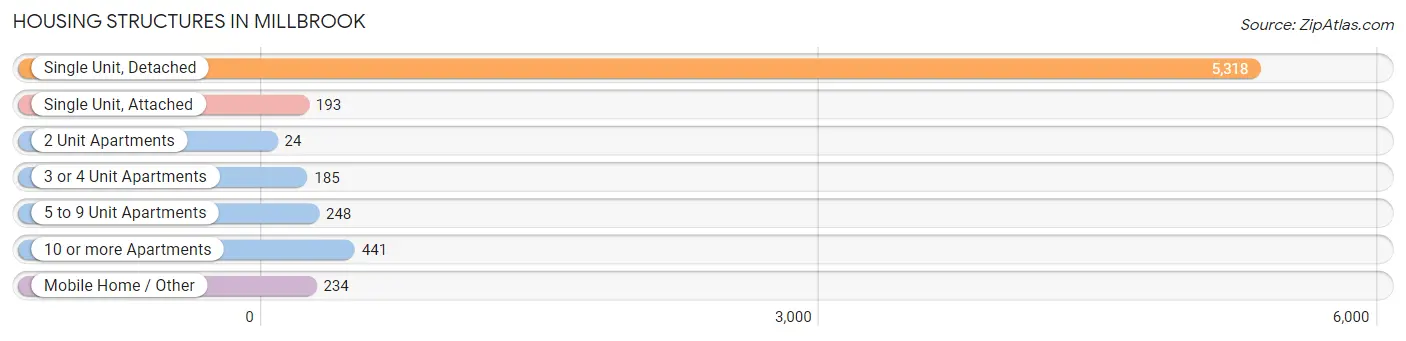
| Structure Type | # Housing Units | % Housing Units |
| Single Unit, Detached | 5,318 | 80.0% |
| Single Unit, Attached | 193 | 2.9% |
| 2 Unit Apartments | 24 | 0.4% |
| 3 or 4 Unit Apartments | 185 | 2.8% |
| 5 to 9 Unit Apartments | 248 | 3.7% |
| 10 or more Apartments | 441 | 6.6% |
| Mobile Home / Other | 234 | 3.5% |
| Total | 6,643 | 100.0% |
Housing Structures by Occupancy in Millbrook
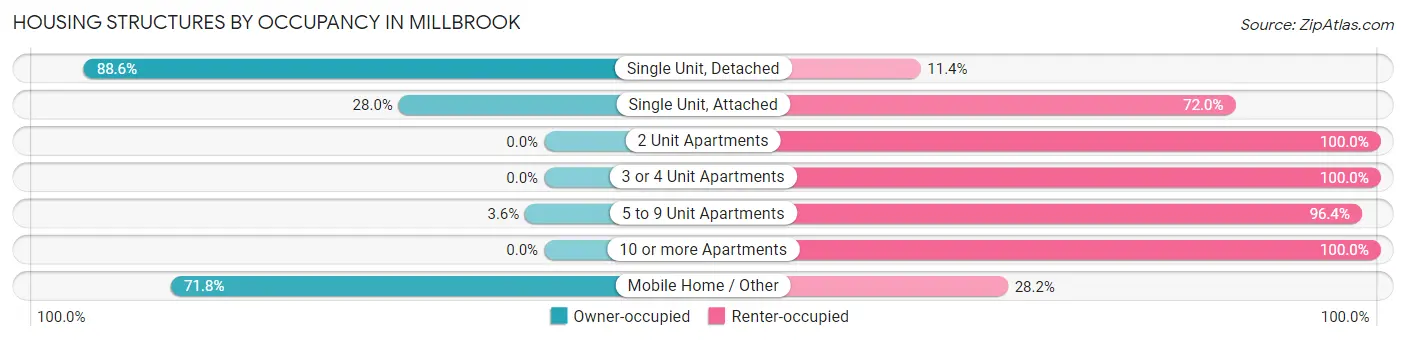
| Structure Type | Owner-occupied | Renter-occupied |
| Single Unit, Detached | 4,712 (88.6%) | 606 (11.4%) |
| Single Unit, Attached | 54 (28.0%) | 139 (72.0%) |
| 2 Unit Apartments | 0 (0.0%) | 24 (100.0%) |
| 3 or 4 Unit Apartments | 0 (0.0%) | 185 (100.0%) |
| 5 to 9 Unit Apartments | 9 (3.6%) | 239 (96.4%) |
| 10 or more Apartments | 0 (0.0%) | 441 (100.0%) |
| Mobile Home / Other | 168 (71.8%) | 66 (28.2%) |
| Total | 4,943 (74.4%) | 1,700 (25.6%) |
Housing Structures by Number of Rooms in Millbrook
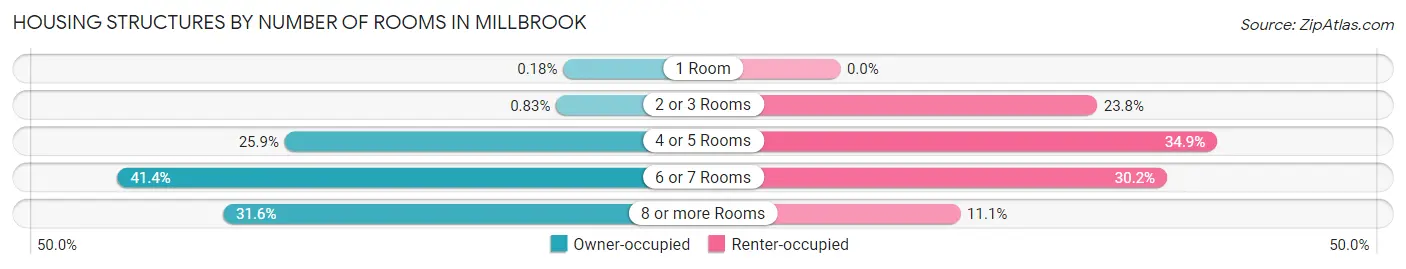
| Number of Rooms | Owner-occupied | Renter-occupied |
| 1 Room | 9 (0.2%) | 0 (0.0%) |
| 2 or 3 Rooms | 41 (0.8%) | 404 (23.8%) |
| 4 or 5 Rooms | 1,282 (25.9%) | 593 (34.9%) |
| 6 or 7 Rooms | 2,047 (41.4%) | 514 (30.2%) |
| 8 or more Rooms | 1,564 (31.6%) | 189 (11.1%) |
| Total | 4,943 (100.0%) | 1,700 (100.0%) |
Housing Structure by Heating Type in Millbrook
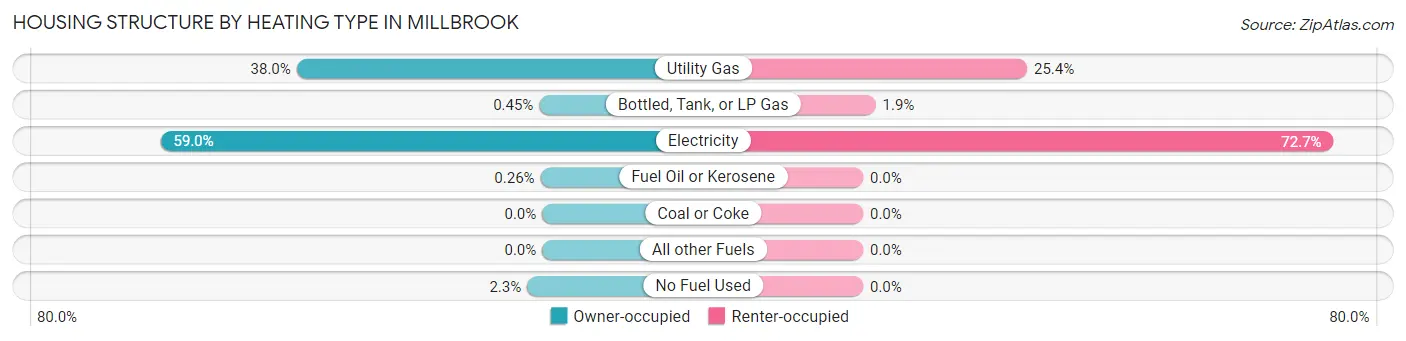
| Heating Type | Owner-occupied | Renter-occupied |
| Utility Gas | 1,876 (38.0%) | 431 (25.4%) |
| Bottled, Tank, or LP Gas | 22 (0.4%) | 33 (1.9%) |
| Electricity | 2,917 (59.0%) | 1,236 (72.7%) |
| Fuel Oil or Kerosene | 13 (0.3%) | 0 (0.0%) |
| Coal or Coke | 0 (0.0%) | 0 (0.0%) |
| All other Fuels | 0 (0.0%) | 0 (0.0%) |
| No Fuel Used | 115 (2.3%) | 0 (0.0%) |
| Total | 4,943 (100.0%) | 1,700 (100.0%) |
Household Vehicle Usage in Millbrook
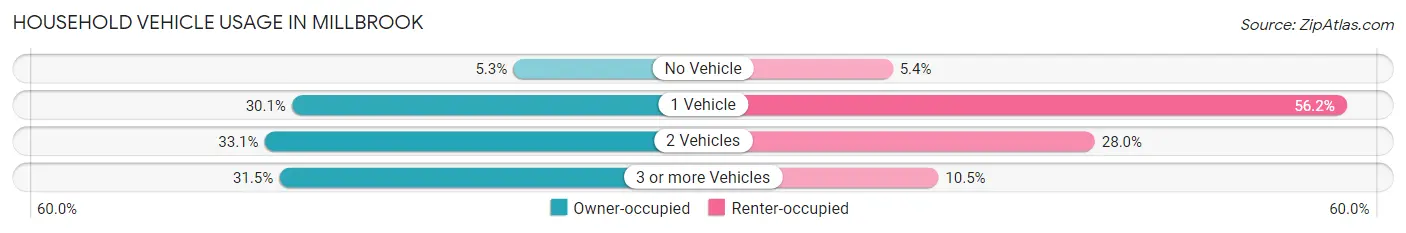
| Vehicles per Household | Owner-occupied | Renter-occupied |
| No Vehicle | 261 (5.3%) | 91 (5.3%) |
| 1 Vehicle | 1,487 (30.1%) | 955 (56.2%) |
| 2 Vehicles | 1,638 (33.1%) | 476 (28.0%) |
| 3 or more Vehicles | 1,557 (31.5%) | 178 (10.5%) |
| Total | 4,943 (100.0%) | 1,700 (100.0%) |
Real Estate & Mortgages in Millbrook
Real Estate and Mortgage Overview in Millbrook
| Characteristic | Without Mortgage | With Mortgage |
| Housing Units | 1,774 | 3,169 |
| Median Property Value | $210,100 | $175,200 |
| Median Household Income | $52,895 | $451 |
| Monthly Housing Costs | $415 | $9 |
| Real Estate Taxes | $633 | $175 |
Property Value by Mortgage Status in Millbrook
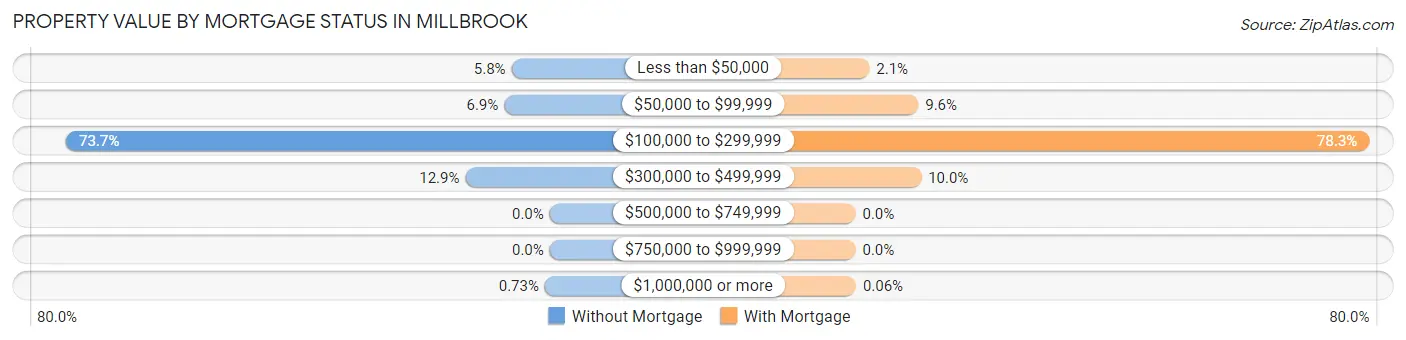
| Property Value | Without Mortgage | With Mortgage |
| Less than $50,000 | 103 (5.8%) | 67 (2.1%) |
| $50,000 to $99,999 | 123 (6.9%) | 303 (9.6%) |
| $100,000 to $299,999 | 1,307 (73.7%) | 2,480 (78.3%) |
| $300,000 to $499,999 | 228 (12.9%) | 317 (10.0%) |
| $500,000 to $749,999 | 0 (0.0%) | 0 (0.0%) |
| $750,000 to $999,999 | 0 (0.0%) | 0 (0.0%) |
| $1,000,000 or more | 13 (0.7%) | 2 (0.1%) |
| Total | 1,774 (100.0%) | 3,169 (100.0%) |
Household Income by Mortgage Status in Millbrook
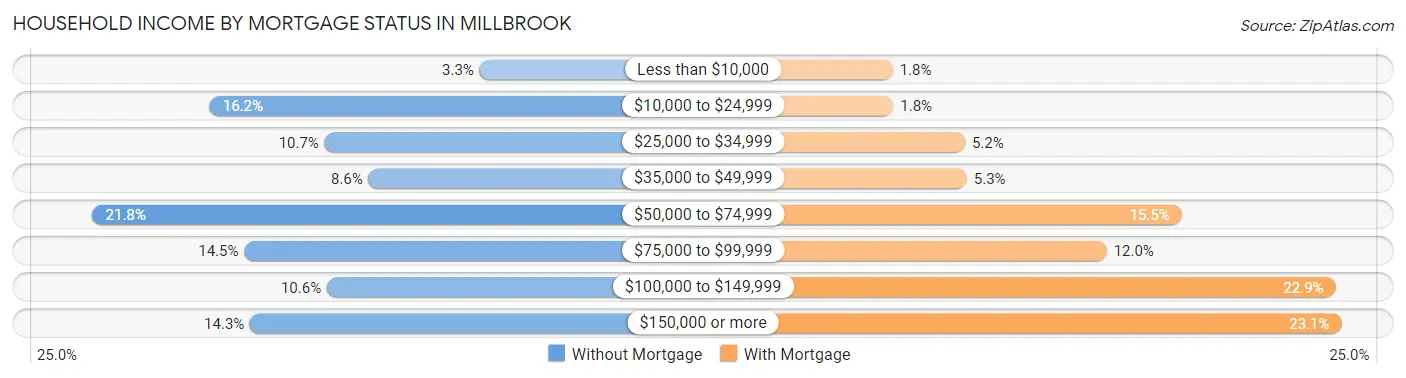
| Household Income | Without Mortgage | With Mortgage |
| Less than $10,000 | 59 (3.3%) | 56 (1.8%) |
| $10,000 to $24,999 | 287 (16.2%) | 57 (1.8%) |
| $25,000 to $34,999 | 190 (10.7%) | 165 (5.2%) |
| $35,000 to $49,999 | 153 (8.6%) | 168 (5.3%) |
| $50,000 to $74,999 | 386 (21.8%) | 492 (15.5%) |
| $75,000 to $99,999 | 258 (14.5%) | 379 (12.0%) |
| $100,000 to $149,999 | 188 (10.6%) | 724 (22.9%) |
| $150,000 or more | 253 (14.3%) | 733 (23.1%) |
| Total | 1,774 (100.0%) | 3,169 (100.0%) |
Property Value to Household Income Ratio in Millbrook
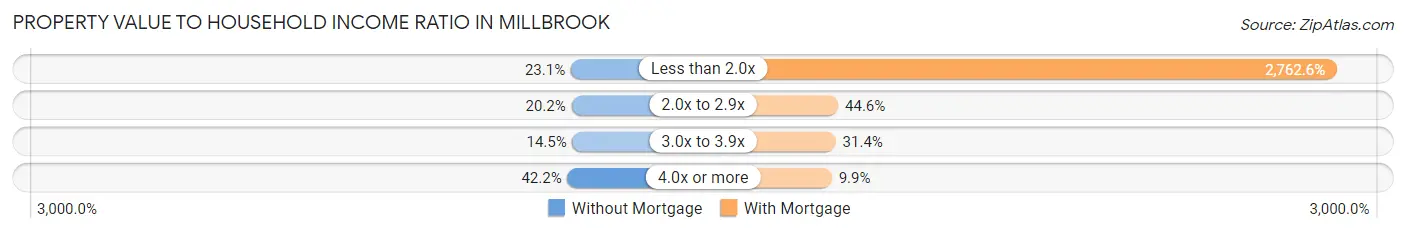
| Value-to-Income Ratio | Without Mortgage | With Mortgage |
| Less than 2.0x | 410 (23.1%) | 87,548 (2,762.6%) |
| 2.0x to 2.9x | 358 (20.2%) | 1,412 (44.6%) |
| 3.0x to 3.9x | 258 (14.5%) | 994 (31.4%) |
| 4.0x or more | 748 (42.2%) | 314 (9.9%) |
| Total | 1,774 (100.0%) | 3,169 (100.0%) |
Real Estate Taxes by Mortgage Status in Millbrook
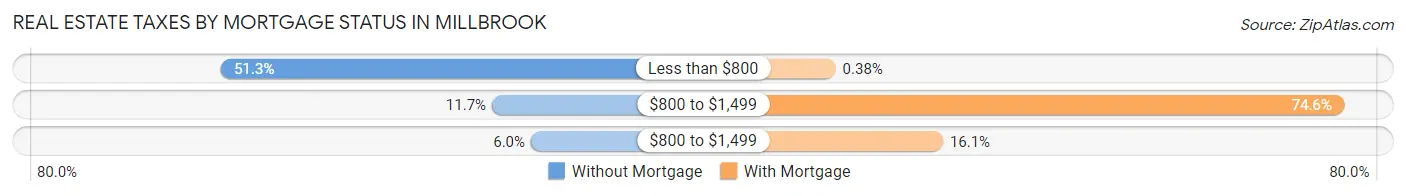
| Property Taxes | Without Mortgage | With Mortgage |
| Less than $800 | 910 (51.3%) | 12 (0.4%) |
| $800 to $1,499 | 208 (11.7%) | 2,365 (74.6%) |
| $800 to $1,499 | 107 (6.0%) | 509 (16.1%) |
| Total | 1,774 (100.0%) | 3,169 (100.0%) |
Health & Disability in Millbrook
Health Insurance Coverage by Age in Millbrook
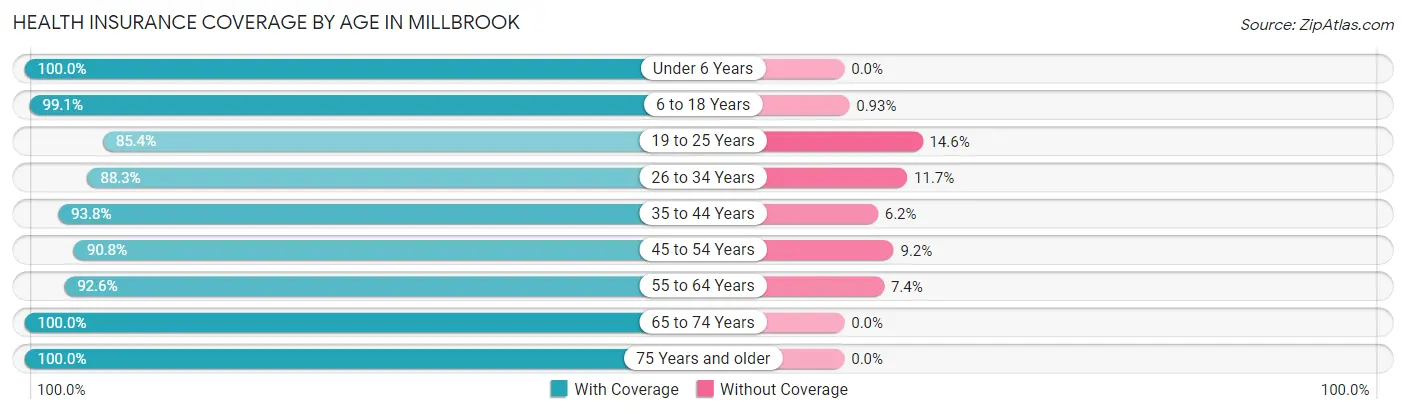
| Age Bracket | With Coverage | Without Coverage |
| Under 6 Years | 1,140 (100.0%) | 0 (0.0%) |
| 6 to 18 Years | 2,559 (99.1%) | 24 (0.9%) |
| 19 to 25 Years | 1,658 (85.4%) | 283 (14.6%) |
| 26 to 34 Years | 1,681 (88.3%) | 223 (11.7%) |
| 35 to 44 Years | 1,939 (93.8%) | 129 (6.2%) |
| 45 to 54 Years | 1,900 (90.8%) | 192 (9.2%) |
| 55 to 64 Years | 1,953 (92.6%) | 156 (7.4%) |
| 65 to 74 Years | 1,247 (100.0%) | 0 (0.0%) |
| 75 Years and older | 1,351 (100.0%) | 0 (0.0%) |
| Total | 15,428 (93.9%) | 1,007 (6.1%) |
Health Insurance Coverage by Citizenship Status in Millbrook
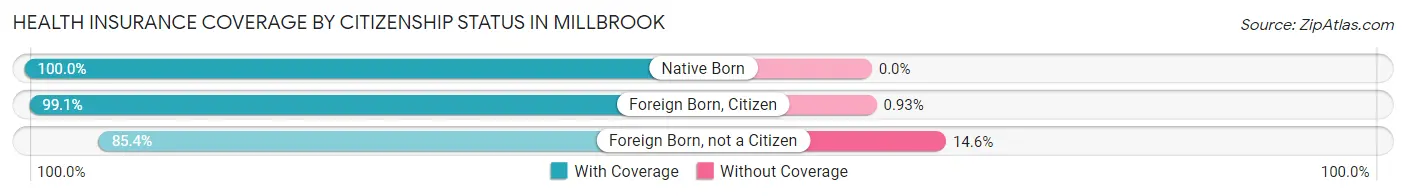
| Citizenship Status | With Coverage | Without Coverage |
| Native Born | 1,140 (100.0%) | 0 (0.0%) |
| Foreign Born, Citizen | 2,559 (99.1%) | 24 (0.9%) |
| Foreign Born, not a Citizen | 1,658 (85.4%) | 283 (14.6%) |
Health Insurance Coverage by Household Income in Millbrook
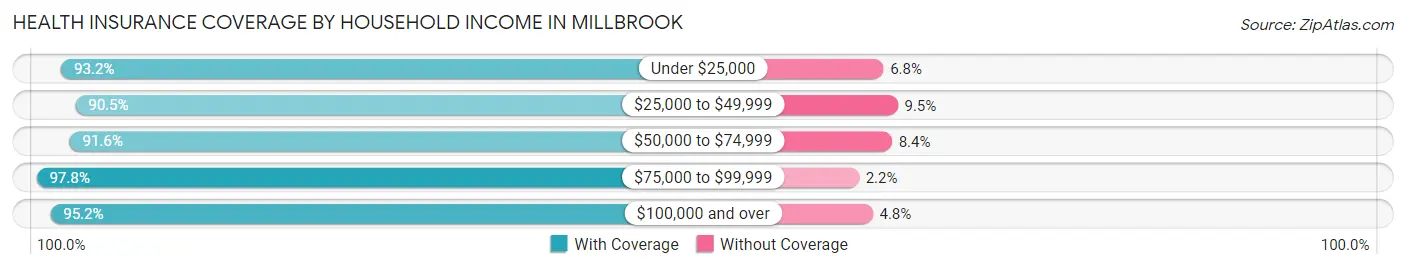
| Household Income | With Coverage | Without Coverage |
| Under $25,000 | 1,650 (93.2%) | 121 (6.8%) |
| $25,000 to $49,999 | 3,178 (90.5%) | 334 (9.5%) |
| $50,000 to $74,999 | 2,121 (91.6%) | 195 (8.4%) |
| $75,000 to $99,999 | 2,589 (97.8%) | 59 (2.2%) |
| $100,000 and over | 5,884 (95.2%) | 298 (4.8%) |
Public vs Private Health Insurance Coverage by Age in Millbrook
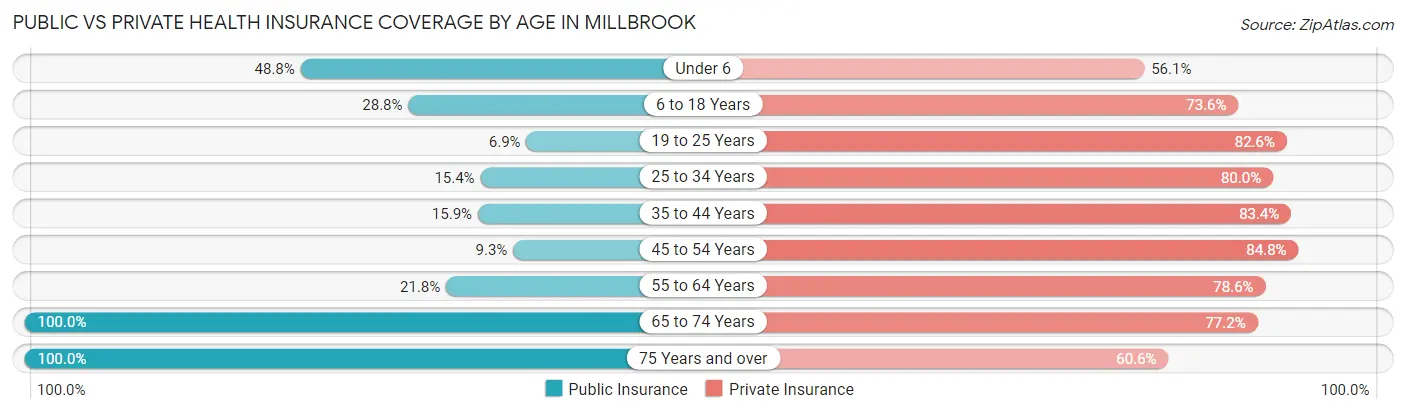
| Age Bracket | Public Insurance | Private Insurance |
| Under 6 | 556 (48.8%) | 640 (56.1%) |
| 6 to 18 Years | 743 (28.8%) | 1,901 (73.6%) |
| 19 to 25 Years | 133 (6.9%) | 1,603 (82.6%) |
| 25 to 34 Years | 293 (15.4%) | 1,524 (80.0%) |
| 35 to 44 Years | 328 (15.9%) | 1,725 (83.4%) |
| 45 to 54 Years | 195 (9.3%) | 1,773 (84.8%) |
| 55 to 64 Years | 459 (21.8%) | 1,658 (78.6%) |
| 65 to 74 Years | 1,247 (100.0%) | 962 (77.1%) |
| 75 Years and over | 1,351 (100.0%) | 819 (60.6%) |
| Total | 5,305 (32.3%) | 12,605 (76.7%) |
Disability Status by Sex by Age in Millbrook
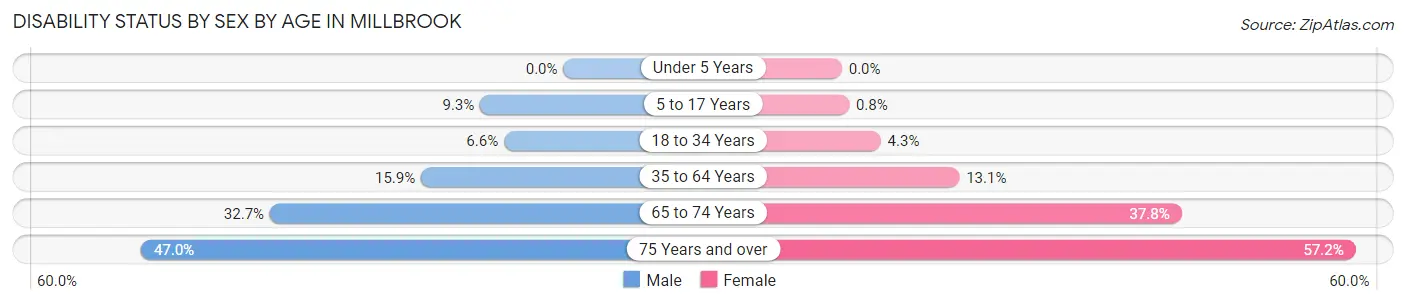
| Age Bracket | Male | Female |
| Under 5 Years | 0 (0.0%) | 0 (0.0%) |
| 5 to 17 Years | 147 (9.3%) | 9 (0.8%) |
| 18 to 34 Years | 109 (6.6%) | 99 (4.3%) |
| 35 to 64 Years | 418 (15.9%) | 475 (13.1%) |
| 65 to 74 Years | 182 (32.7%) | 261 (37.8%) |
| 75 Years and over | 254 (47.0%) | 464 (57.2%) |
Disability Class by Sex by Age in Millbrook
Disability Class: Hearing Difficulty
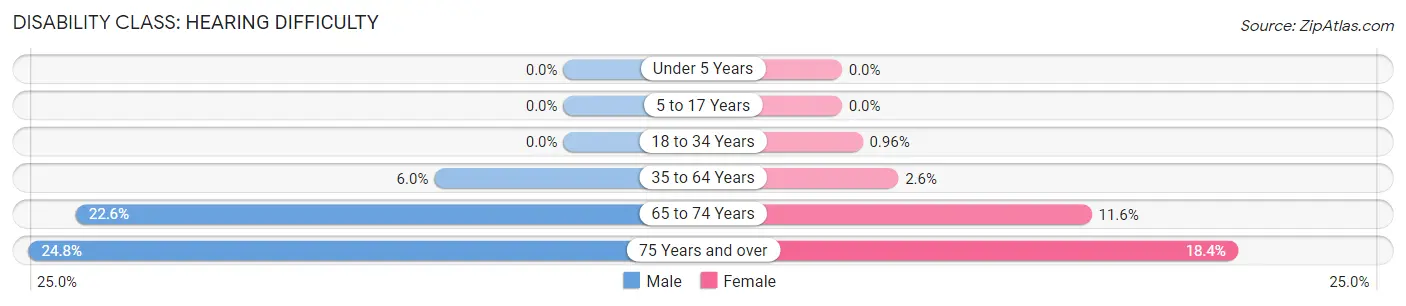
| Age Bracket | Male | Female |
| Under 5 Years | 0 (0.0%) | 0 (0.0%) |
| 5 to 17 Years | 0 (0.0%) | 0 (0.0%) |
| 18 to 34 Years | 0 (0.0%) | 22 (1.0%) |
| 35 to 64 Years | 158 (6.0%) | 95 (2.6%) |
| 65 to 74 Years | 126 (22.6%) | 80 (11.6%) |
| 75 Years and over | 134 (24.8%) | 149 (18.4%) |
Disability Class: Vision Difficulty
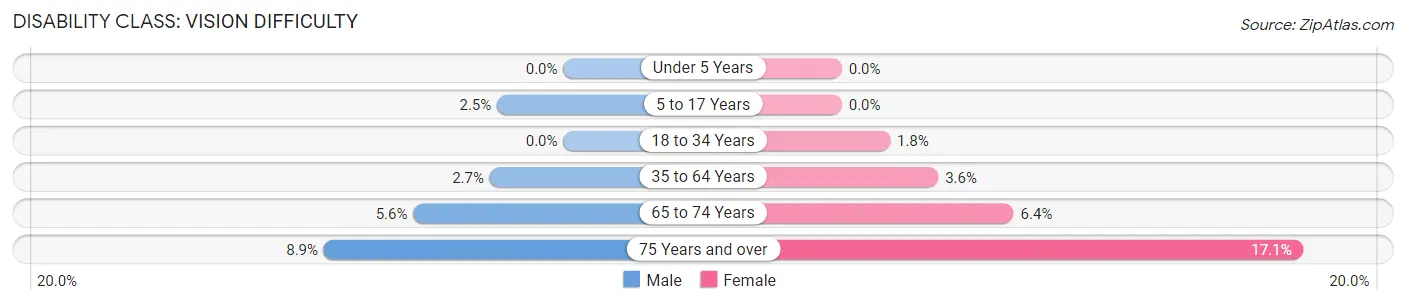
| Age Bracket | Male | Female |
| Under 5 Years | 0 (0.0%) | 0 (0.0%) |
| 5 to 17 Years | 39 (2.5%) | 0 (0.0%) |
| 18 to 34 Years | 0 (0.0%) | 41 (1.8%) |
| 35 to 64 Years | 72 (2.7%) | 130 (3.6%) |
| 65 to 74 Years | 31 (5.6%) | 44 (6.4%) |
| 75 Years and over | 48 (8.9%) | 139 (17.1%) |
Disability Class: Cognitive Difficulty
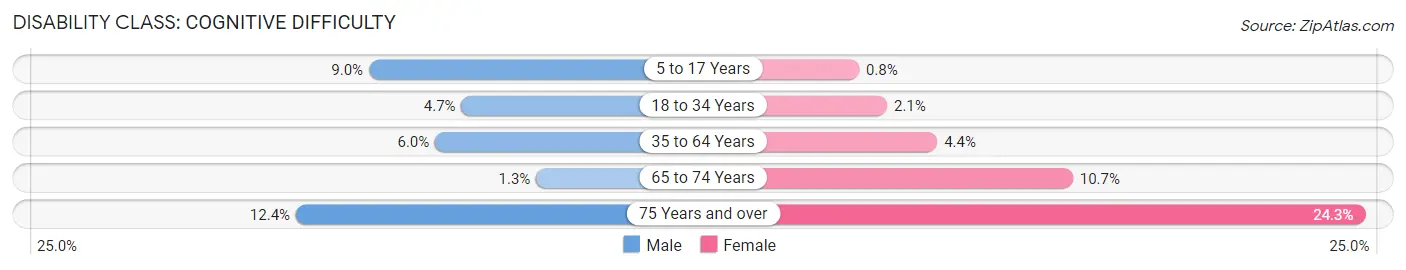
| Age Bracket | Male | Female |
| 5 to 17 Years | 143 (9.0%) | 9 (0.8%) |
| 18 to 34 Years | 78 (4.7%) | 48 (2.1%) |
| 35 to 64 Years | 157 (5.9%) | 161 (4.4%) |
| 65 to 74 Years | 7 (1.3%) | 74 (10.7%) |
| 75 Years and over | 67 (12.4%) | 197 (24.3%) |
Disability Class: Ambulatory Difficulty
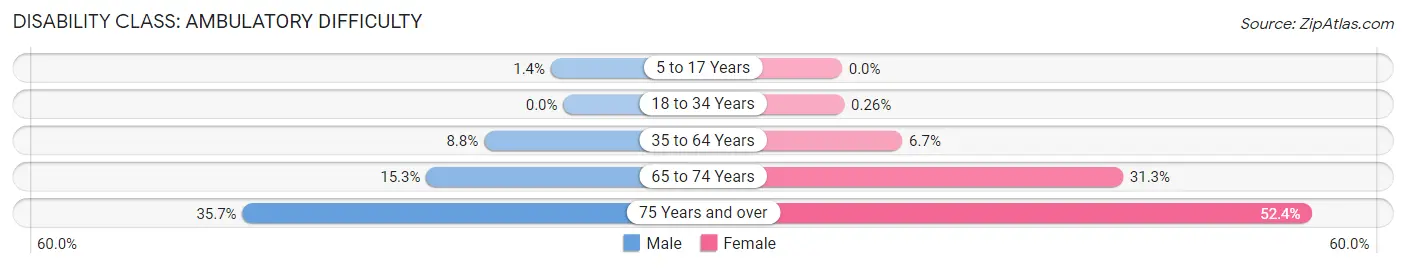
| Age Bracket | Male | Female |
| 5 to 17 Years | 22 (1.4%) | 0 (0.0%) |
| 18 to 34 Years | 0 (0.0%) | 6 (0.3%) |
| 35 to 64 Years | 233 (8.8%) | 244 (6.7%) |
| 65 to 74 Years | 85 (15.3%) | 216 (31.3%) |
| 75 Years and over | 193 (35.7%) | 425 (52.4%) |
Disability Class: Self-Care Difficulty
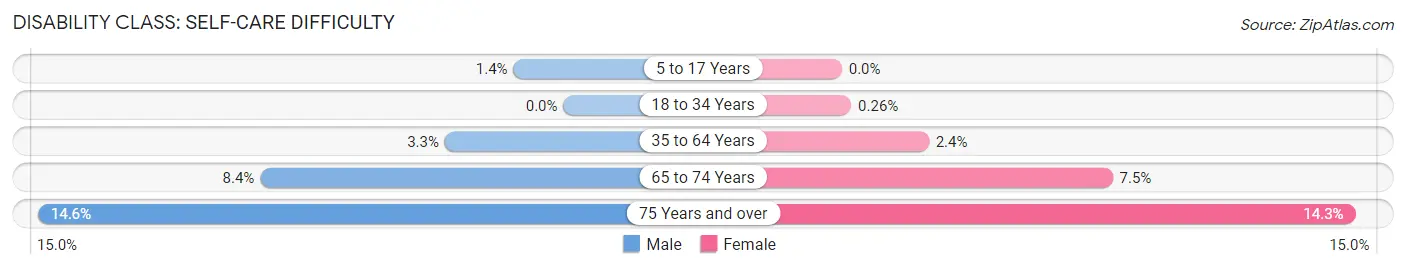
| Age Bracket | Male | Female |
| 5 to 17 Years | 22 (1.4%) | 0 (0.0%) |
| 18 to 34 Years | 0 (0.0%) | 6 (0.3%) |
| 35 to 64 Years | 87 (3.3%) | 88 (2.4%) |
| 65 to 74 Years | 47 (8.4%) | 52 (7.5%) |
| 75 Years and over | 79 (14.6%) | 116 (14.3%) |
Technology Access in Millbrook
Computing Device Access in Millbrook
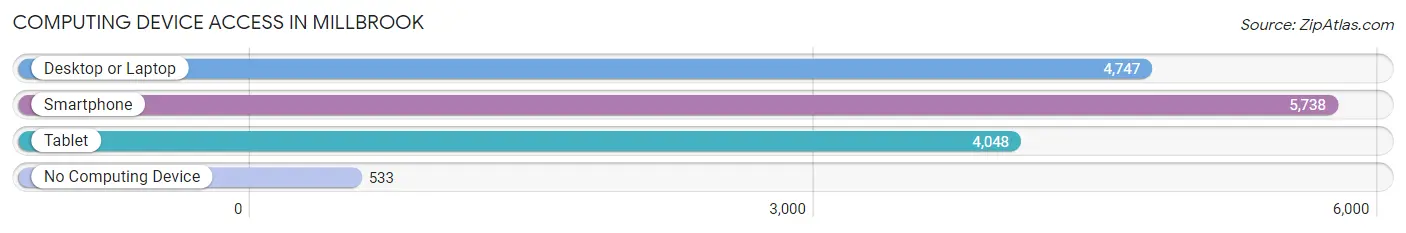
| Device Type | # Households | % Households |
| Desktop or Laptop | 4,747 | 71.5% |
| Smartphone | 5,738 | 86.4% |
| Tablet | 4,048 | 60.9% |
| No Computing Device | 533 | 8.0% |
| Total | 6,643 | 100.0% |
Internet Access in Millbrook
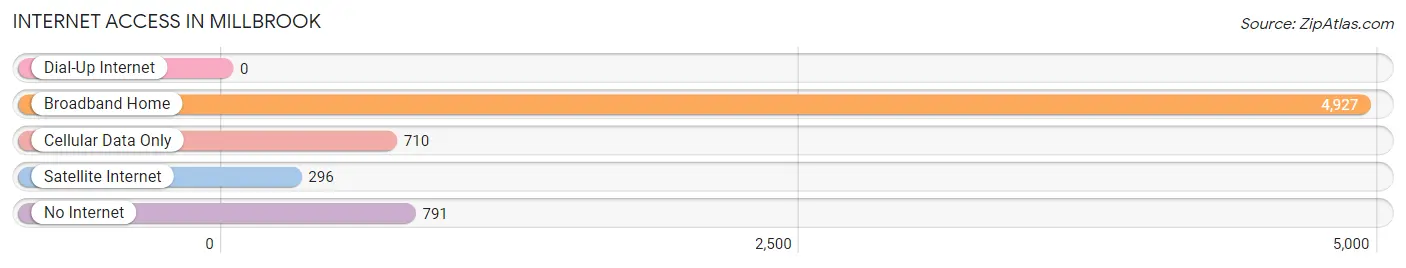
| Internet Type | # Households | % Households |
| Dial-Up Internet | 0 | 0.0% |
| Broadband Home | 4,927 | 74.2% |
| Cellular Data Only | 710 | 10.7% |
| Satellite Internet | 296 | 4.5% |
| No Internet | 791 | 11.9% |
| Total | 6,643 | 100.0% |
Millbrook Summary
Millbrook, Alabama is a small city located in Elmore County, Alabama. It is situated on the banks of the Coosa River, about 20 miles east of Montgomery. The city has a population of approximately 15,000 people and is part of the Montgomery Metropolitan Statistical Area.
History
Millbrook was founded in 1820 by a group of settlers from Georgia. The town was originally called “Mill Creek”, but was later changed to “Millbrook”. The name was chosen to reflect the abundance of mills in the area. The town was incorporated in 1887 and has since grown to become a thriving community.
Geography
Millbrook is located in the central part of Elmore County, Alabama. It is situated on the banks of the Coosa River, about 20 miles east of Montgomery. The city has a total area of 8.3 square miles, all of which is land. The terrain is mostly flat, with some rolling hills in the northern part of the city.
Economy
Millbrook’s economy is largely based on agriculture and manufacturing. The city is home to several large farms, as well as several factories and industrial plants. The city is also home to several retail stores, restaurants, and other businesses.
Demographics
As of the 2010 census, Millbrook had a population of 15,640 people. The racial makeup of the city was 79.2% White, 17.2% African American, 0.4% Native American, 0.7% Asian, 0.1% Pacific Islander, 1.2% from other races, and 1.2% from two or more races. Hispanic or Latino of any race were 2.7% of the population.
The median income for a household in Millbrook was $41,945, and the median income for a family was $50,945. Males had a median income of $37,945 versus $27,945 for females. The per capita income for the city was $20,945. About 11.2% of families and 14.2% of the population were below the poverty line, including 19.2% of those under age 18 and 8.2% of those age 65 or over.
Millbrook is a small city with a rich history and a diverse population. It is home to several large farms and factories, as well as numerous retail stores, restaurants, and other businesses. The city has a median income that is slightly higher than the national average, and the poverty rate is lower than the national average. Millbrook is a great place to live and work, and it is a great place to raise a family.
Common Questions
What is Per Capita Income in Millbrook?
Per Capita income in Millbrook is $33,605.
What is the Median Family Income in Millbrook?
Median Family Income in Millbrook is $80,920.
What is the Median Household income in Millbrook?
Median Household Income in Millbrook is $63,521.
What is Income or Wage Gap in Millbrook?
Income or Wage Gap in Millbrook is 9.0%.
Women in Millbrook earn 91.0 cents for every dollar earned by a man.
What is Inequality or Gini Index in Millbrook?
Inequality or Gini Index in Millbrook is 0.41.
What is the Total Population of Millbrook?
Total Population of Millbrook is 16,631.
What is the Total Male Population of Millbrook?
Total Male Population of Millbrook is 7,446.
What is the Total Female Population of Millbrook?
Total Female Population of Millbrook is 9,185.
What is the Ratio of Males per 100 Females in Millbrook?
There are 81.07 Males per 100 Females in Millbrook.
What is the Ratio of Females per 100 Males in Millbrook?
There are 123.35 Females per 100 Males in Millbrook.
What is the Median Population Age in Millbrook?
Median Population Age in Millbrook is 36.8 Years.
What is the Average Family Size in Millbrook
Average Family Size in Millbrook is 3.1 People.
What is the Average Household Size in Millbrook
Average Household Size in Millbrook is 2.5 People.
How Large is the Labor Force in Millbrook?
There are 8,168 People in the Labor Forcein in Millbrook.
What is the Percentage of People in the Labor Force in Millbrook?
61.3% of People are in the Labor Force in Millbrook.
What is the Unemployment Rate in Millbrook?
Unemployment Rate in Millbrook is 4.5%.