Rutledge, AL Map & Demographics
Rutledge Map
Rutledge Overview
$42,326
PER CAPITA INCOME
$29,297
AVG FAMILY INCOME
42.2%
WAGE / INCOME GAP [ % ]
57.8¢/ $1
WAGE / INCOME GAP [ $ ]
0.57
INEQUALITY / GINI INDEX
237
TOTAL POPULATION
75
MALE POPULATION
162
FEMALE POPULATION
46.30
MALES / 100 FEMALES
216.00
FEMALES / 100 MALES
37.3
MEDIAN AGE
3.0
AVG FAMILY SIZE
2.3
AVG HOUSEHOLD SIZE
101
LABOR FORCE [ PEOPLE ]
61.6%
PERCENT IN LABOR FORCE
Rutledge Zip Codes
Rutledge Area Codes
Income in Rutledge
Income Overview in Rutledge
| Characteristic | Number | Measure |
| Per Capita Income | 237 | $42,326 |
| Median Family Income | 63 | $29,297 |
| Mean Family Income | 63 | $77,771 |
| Median Household Income | 103 | $0 |
| Mean Household Income | 103 | $62,971 |
| Income Deficit | 63 | $0 |
| Wage / Income Gap (%) | 237 | 42.15% |
| Wage / Income Gap ($) | 237 | 57.85¢ per $1 |
| Gini / Inequality Index | 237 | 0.57 |
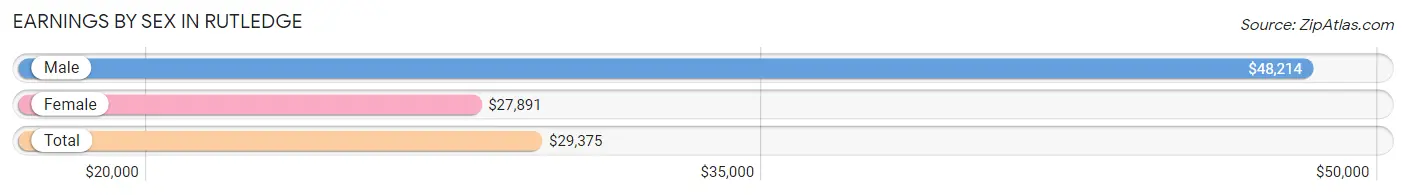
Earnings by Sex in Rutledge
Average Earnings in Rutledge are $29,375, $48,214 for men and $27,891 for women, a difference of 42.1%.
| Sex | Number | Average Earnings |
| Male | 38 (34.9%) | $48,214 |
| Female | 71 (65.1%) | $27,891 |
| Total | 109 (100.0%) | $29,375 |
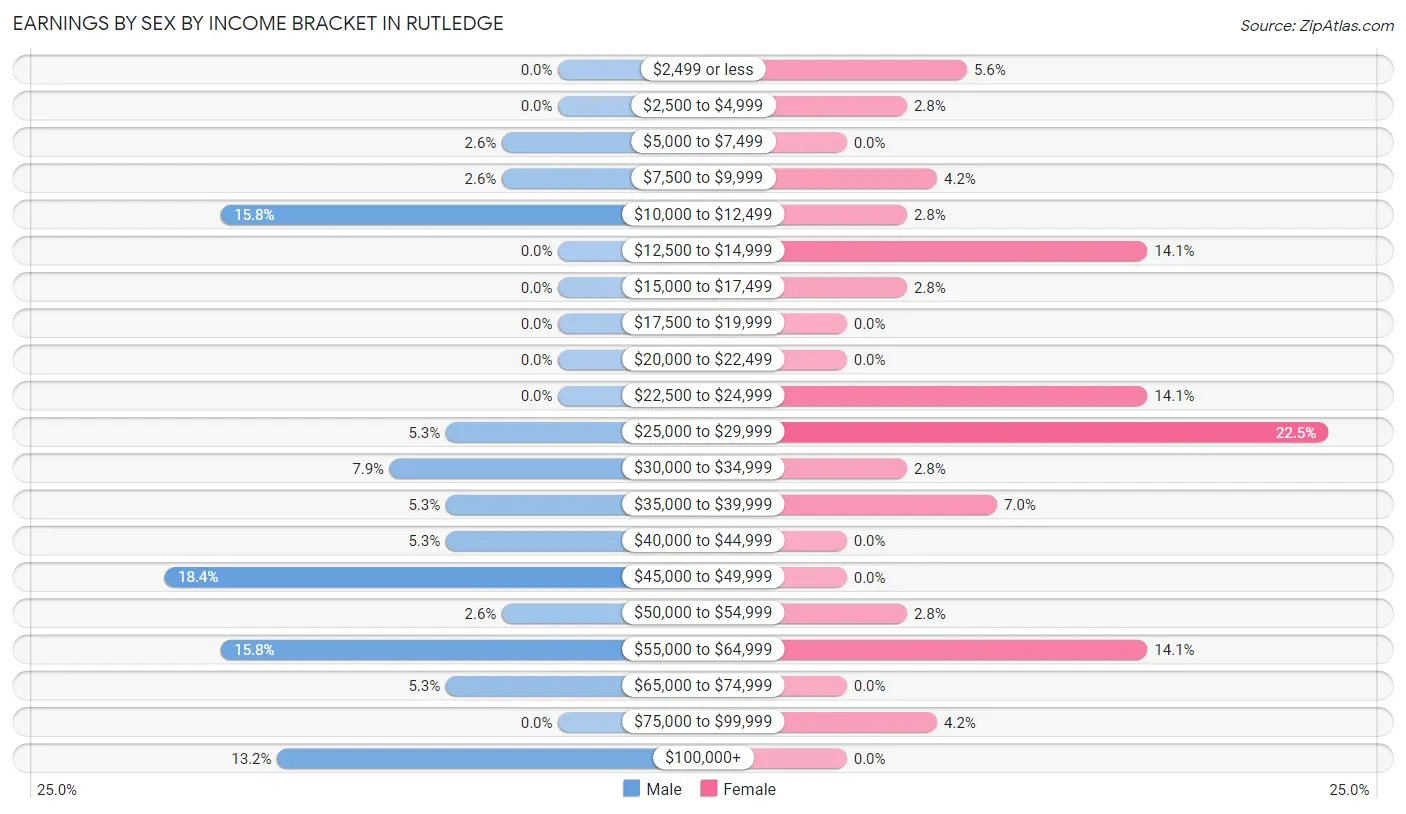
Earnings by Sex by Income Bracket in Rutledge
The most common earnings brackets in Rutledge are $45,000 to $49,999 for men (7 | 18.4%) and $25,000 to $29,999 for women (16 | 22.5%).
| Income | Male | Female |
| $2,499 or less | 0 (0.0%) | 4 (5.6%) |
| $2,500 to $4,999 | 0 (0.0%) | 2 (2.8%) |
| $5,000 to $7,499 | 1 (2.6%) | 0 (0.0%) |
| $7,500 to $9,999 | 1 (2.6%) | 3 (4.2%) |
| $10,000 to $12,499 | 6 (15.8%) | 2 (2.8%) |
| $12,500 to $14,999 | 0 (0.0%) | 10 (14.1%) |
| $15,000 to $17,499 | 0 (0.0%) | 2 (2.8%) |
| $17,500 to $19,999 | 0 (0.0%) | 0 (0.0%) |
| $20,000 to $22,499 | 0 (0.0%) | 0 (0.0%) |
| $22,500 to $24,999 | 0 (0.0%) | 10 (14.1%) |
| $25,000 to $29,999 | 2 (5.3%) | 16 (22.5%) |
| $30,000 to $34,999 | 3 (7.9%) | 2 (2.8%) |
| $35,000 to $39,999 | 2 (5.3%) | 5 (7.0%) |
| $40,000 to $44,999 | 2 (5.3%) | 0 (0.0%) |
| $45,000 to $49,999 | 7 (18.4%) | 0 (0.0%) |
| $50,000 to $54,999 | 1 (2.6%) | 2 (2.8%) |
| $55,000 to $64,999 | 6 (15.8%) | 10 (14.1%) |
| $65,000 to $74,999 | 2 (5.3%) | 0 (0.0%) |
| $75,000 to $99,999 | 0 (0.0%) | 3 (4.2%) |
| $100,000+ | 5 (13.2%) | 0 (0.0%) |
| Total | 38 (100.0%) | 71 (100.0%) |
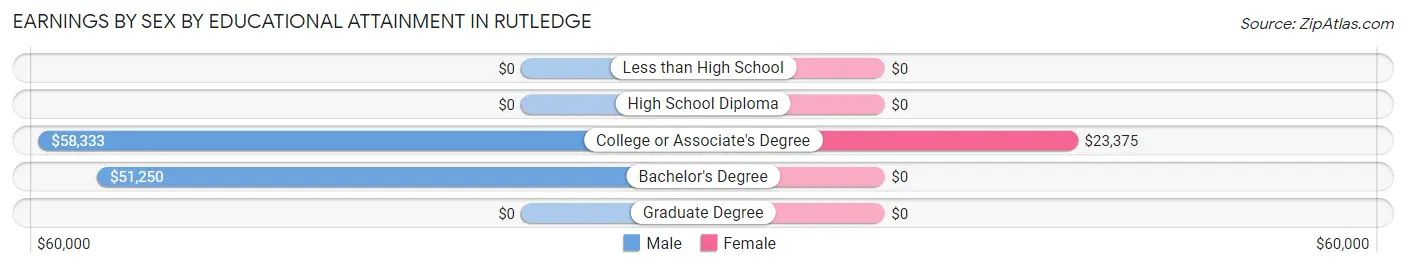
Earnings by Sex by Educational Attainment in Rutledge
Average earnings in Rutledge are $47,679 for men and $27,891 for women, a difference of 41.5%. Men with an educational attainment of college or associate's degree enjoy the highest average annual earnings of $58,333, while those with bachelor's degree education earn the least with $51,250. Women with an educational attainment of college or associate's degree earn the most with the average annual earnings of $23,375, while those with college or associate's degree education have the smallest earnings of $23,375.
| Educational Attainment | Male Income | Female Income |
| Less than High School | - | - |
| High School Diploma | - | - |
| College or Associate's Degree | $58,333 | $23,375 |
| Bachelor's Degree | $51,250 | $0 |
| Graduate Degree | - | - |
| Total | $47,679 | $27,891 |
Family Income in Rutledge
Family Income Brackets in Rutledge
According to the Rutledge family income data, there are 16 families falling into the $25,000 to $34,999 income range, which is the most common income bracket and makes up 25.4% of all families.
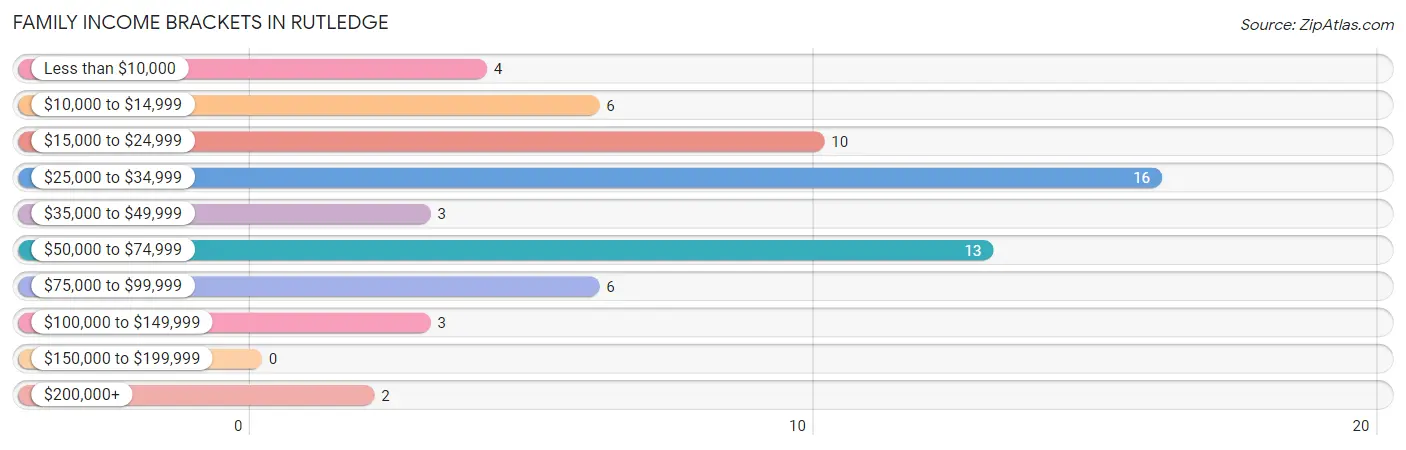
| Income Bracket | # Families | % Families |
| Less than $10,000 | 4 | 6.3% |
| $10,000 to $14,999 | 6 | 9.5% |
| $15,000 to $24,999 | 10 | 15.9% |
| $25,000 to $34,999 | 16 | 25.4% |
| $35,000 to $49,999 | 3 | 4.8% |
| $50,000 to $74,999 | 13 | 20.6% |
| $75,000 to $99,999 | 6 | 9.5% |
| $100,000 to $149,999 | 3 | 4.8% |
| $150,000 to $199,999 | 0 | 0.0% |
| $200,000+ | 2 | 3.2% |
Family Income by Famaliy Size in Rutledge
2-person families (52 | 82.5%) account for the highest median family income in Rutledge with $29,219 per family, while 2-person families (52 | 82.5%) have the highest median income of $14,610 per family member.
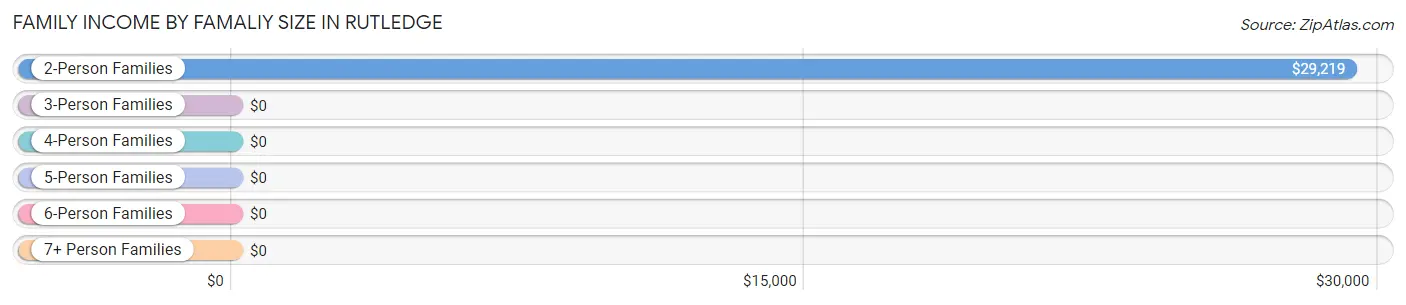
| Income Bracket | # Families | Median Income |
| 2-Person Families | 52 (82.5%) | $29,219 |
| 3-Person Families | 1 (1.6%) | $0 |
| 4-Person Families | 5 (7.9%) | $0 |
| 5-Person Families | 5 (7.9%) | $0 |
| 6-Person Families | 0 (0.0%) | $0 |
| 7+ Person Families | 0 (0.0%) | $0 |
| Total | 63 (100.0%) | $29,297 |
Family Income by Number of Earners in Rutledge
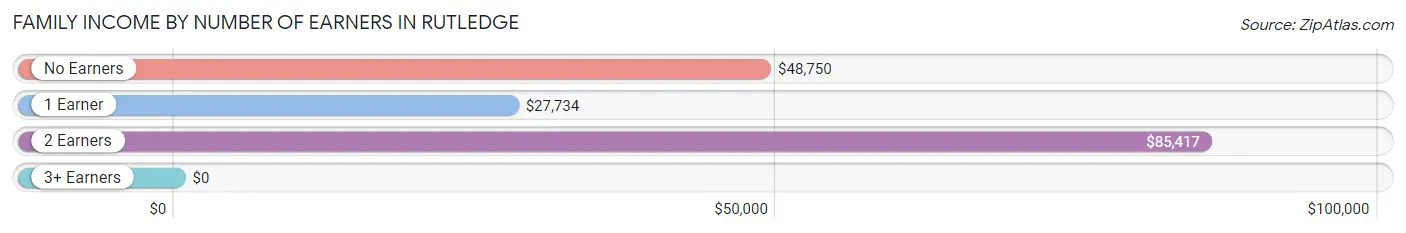
| Number of Earners | # Families | Median Income |
| No Earners | 9 (14.3%) | $48,750 |
| 1 Earner | 37 (58.7%) | $27,734 |
| 2 Earners | 17 (27.0%) | $85,417 |
| 3+ Earners | 0 (0.0%) | $0 |
| Total | 63 (100.0%) | $29,297 |
Household Income in Rutledge
Household Income Brackets in Rutledge
With 31 households falling in the category, the $50,000 to $74,999 income range is the most frequent in Rutledge, accounting for 30.1% of all households.
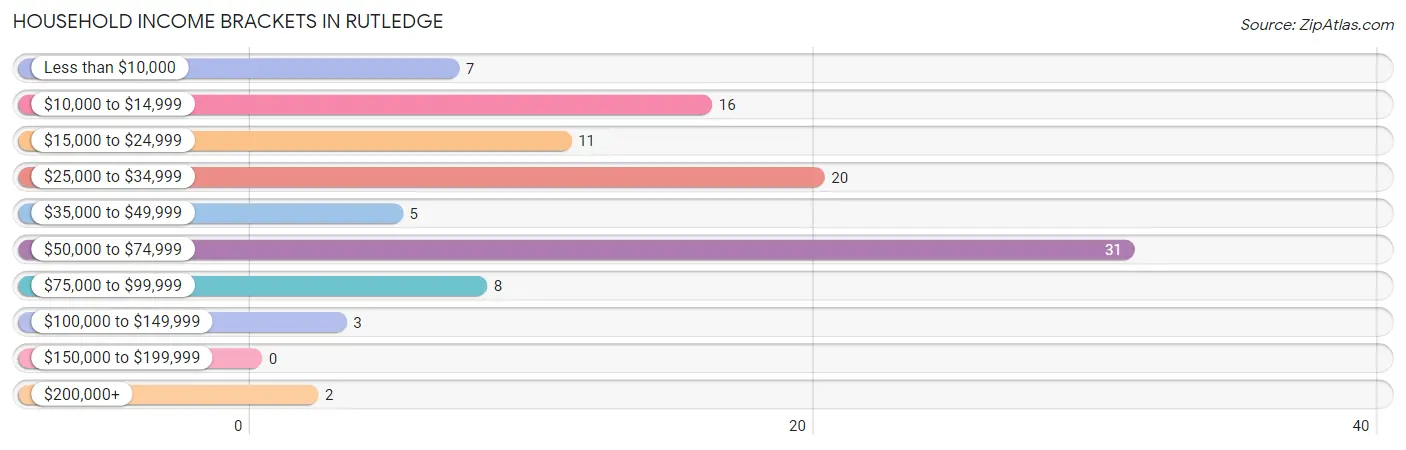
| Income Bracket | # Households | % Households |
| Less than $10,000 | 7 | 6.8% |
| $10,000 to $14,999 | 16 | 15.5% |
| $15,000 to $24,999 | 11 | 10.7% |
| $25,000 to $34,999 | 20 | 19.4% |
| $35,000 to $49,999 | 5 | 4.9% |
| $50,000 to $74,999 | 31 | 30.1% |
| $75,000 to $99,999 | 8 | 7.8% |
| $100,000 to $149,999 | 3 | 2.9% |
| $150,000 to $199,999 | 0 | 0.0% |
| $200,000+ | 2 | 1.9% |
Household Income by Householder Age in Rutledge
The median household income in Rutledge is $0, with the highest median household income of $54,500 found in the 45 to 64 years age bracket for the primary householder. A total of 28 households (27.2%) fall into this category. Meanwhile, the 15 to 24 years age bracket for the primary householder has the lowest median household income of $0, with 2 households (1.9%) in this group.
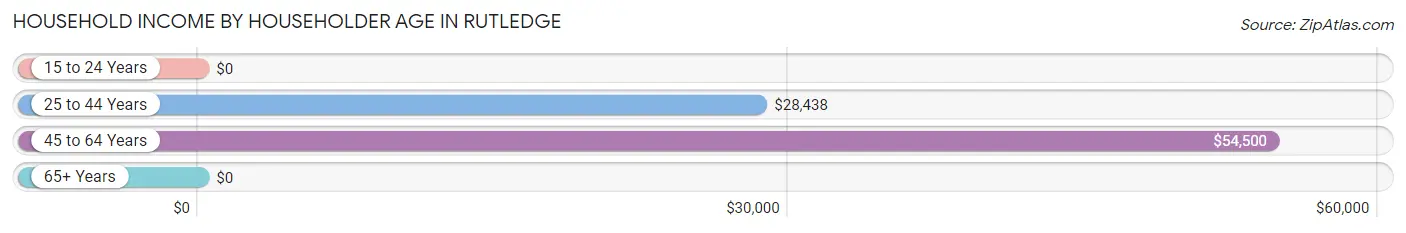
| Income Bracket | # Households | Median Income |
| 15 to 24 Years | 2 (1.9%) | $0 |
| 25 to 44 Years | 46 (44.7%) | $28,438 |
| 45 to 64 Years | 28 (27.2%) | $54,500 |
| 65+ Years | 27 (26.2%) | $0 |
| Total | 103 (100.0%) | $0 |
Poverty in Rutledge
Income Below Poverty by Sex and Age in Rutledge
With 32.0% poverty level for males and 35.8% for females among the residents of Rutledge, 12 to 14 year old males and 45 to 54 year old females are the most vulnerable to poverty, with 7 males (100.0%) and 2 females (100.0%) in their respective age groups living below the poverty level.
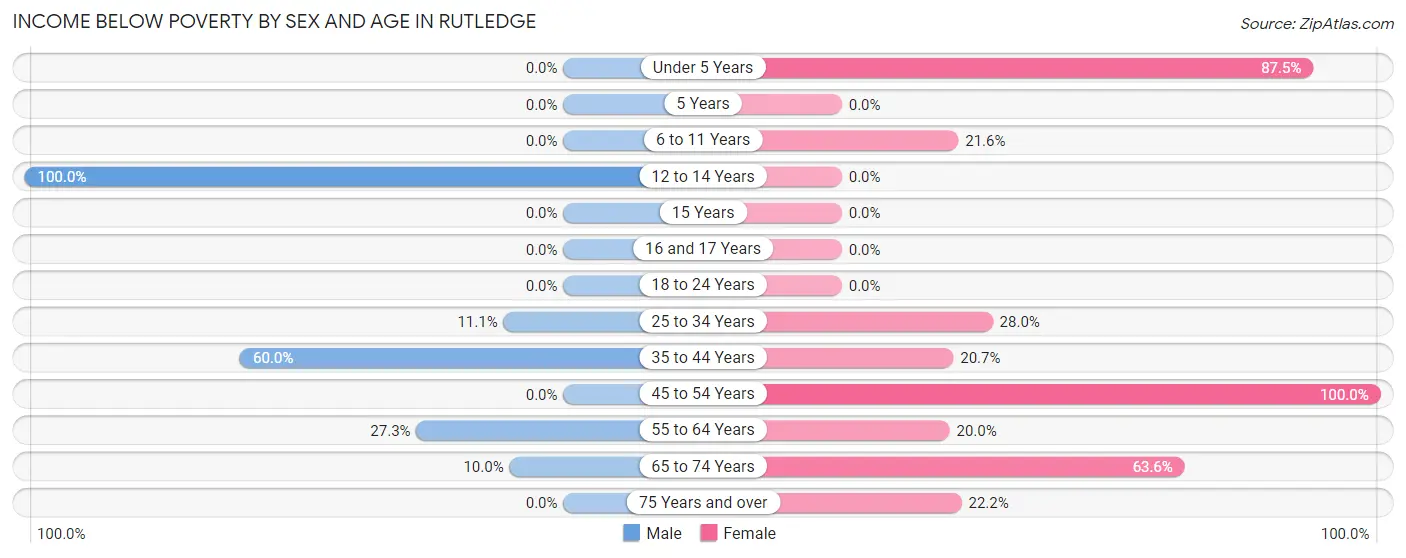
| Age Bracket | Male | Female |
| Under 5 Years | 0 (0.0%) | 21 (87.5%) |
| 5 Years | 0 (0.0%) | 0 (0.0%) |
| 6 to 11 Years | 0 (0.0%) | 8 (21.6%) |
| 12 to 14 Years | 7 (100.0%) | 0 (0.0%) |
| 15 Years | 0 (0.0%) | 0 (0.0%) |
| 16 and 17 Years | 0 (0.0%) | 0 (0.0%) |
| 18 to 24 Years | 0 (0.0%) | 0 (0.0%) |
| 25 to 34 Years | 1 (11.1%) | 7 (28.0%) |
| 35 to 44 Years | 12 (60.0%) | 6 (20.7%) |
| 45 to 54 Years | 0 (0.0%) | 2 (100.0%) |
| 55 to 64 Years | 3 (27.3%) | 5 (20.0%) |
| 65 to 74 Years | 1 (10.0%) | 7 (63.6%) |
| 75 Years and over | 0 (0.0%) | 2 (22.2%) |
| Total | 24 (32.0%) | 58 (35.8%) |
Income Above Poverty by Sex and Age in Rutledge
According to the poverty statistics in Rutledge, males aged under 5 years and females aged 55 to 64 years are the age groups that are most secure financially, with 100.0% of males and 80.0% of females in these age groups living above the poverty line.
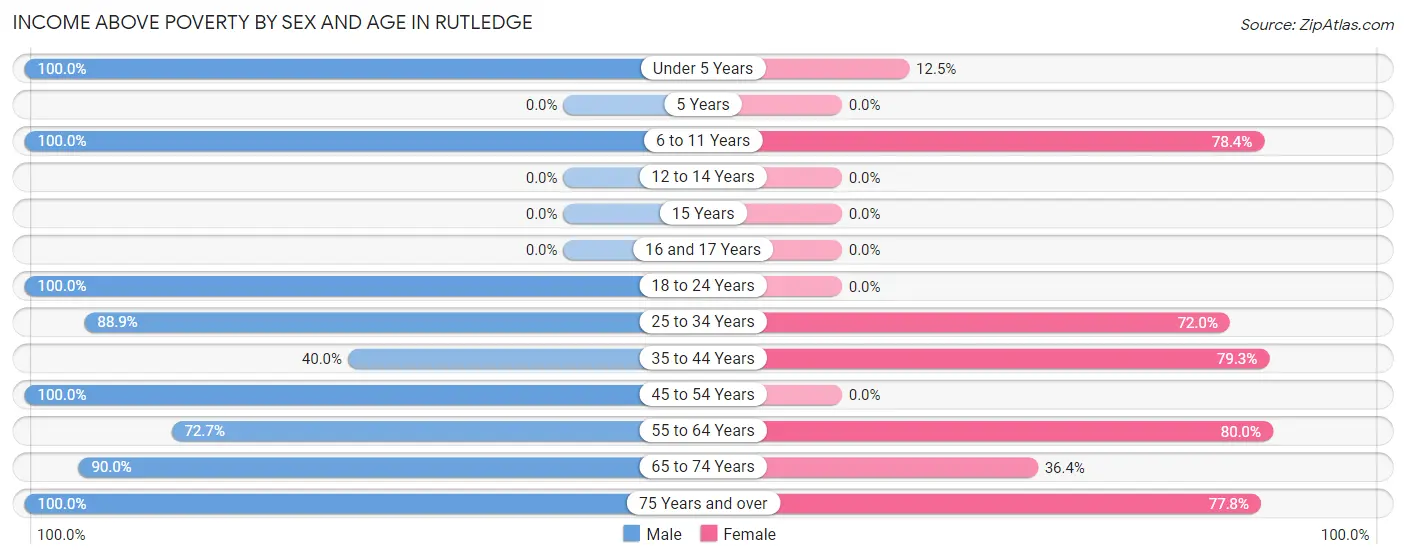
| Age Bracket | Male | Female |
| Under 5 Years | 2 (100.0%) | 3 (12.5%) |
| 5 Years | 0 (0.0%) | 0 (0.0%) |
| 6 to 11 Years | 3 (100.0%) | 29 (78.4%) |
| 12 to 14 Years | 0 (0.0%) | 0 (0.0%) |
| 15 Years | 0 (0.0%) | 0 (0.0%) |
| 16 and 17 Years | 0 (0.0%) | 0 (0.0%) |
| 18 to 24 Years | 7 (100.0%) | 0 (0.0%) |
| 25 to 34 Years | 8 (88.9%) | 18 (72.0%) |
| 35 to 44 Years | 8 (40.0%) | 23 (79.3%) |
| 45 to 54 Years | 2 (100.0%) | 0 (0.0%) |
| 55 to 64 Years | 8 (72.7%) | 20 (80.0%) |
| 65 to 74 Years | 9 (90.0%) | 4 (36.4%) |
| 75 Years and over | 4 (100.0%) | 7 (77.8%) |
| Total | 51 (68.0%) | 104 (64.2%) |
Income Below Poverty Among Married-Couple Families in Rutledge
The poverty statistics for married-couple families in Rutledge show that 31.0% or 9 of the total 29 families live below the poverty line. Families with 3 or 4 children have the highest poverty rate of 100.0%, comprising of 5 families. On the other hand, families with 1 or 2 children have the lowest poverty rate of 0.0%, which includes 0 families.
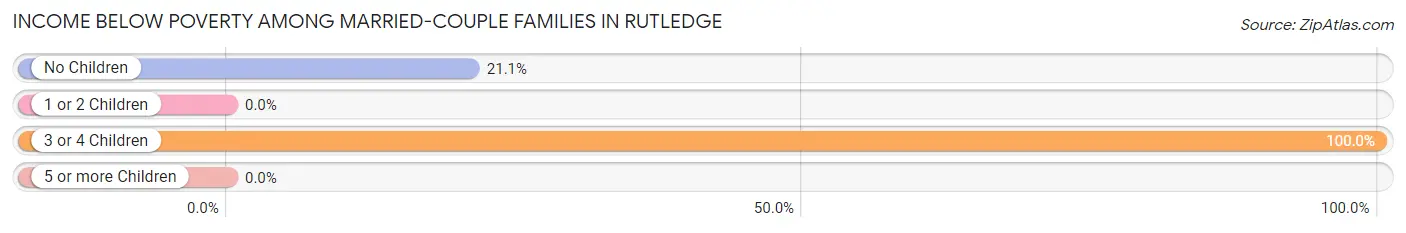
| Children | Above Poverty | Below Poverty |
| No Children | 15 (78.9%) | 4 (21.0%) |
| 1 or 2 Children | 5 (100.0%) | 0 (0.0%) |
| 3 or 4 Children | 0 (0.0%) | 5 (100.0%) |
| 5 or more Children | 0 (0.0%) | 0 (0.0%) |
| Total | 20 (69.0%) | 9 (31.0%) |
Income Below Poverty Among Single-Parent Households in Rutledge
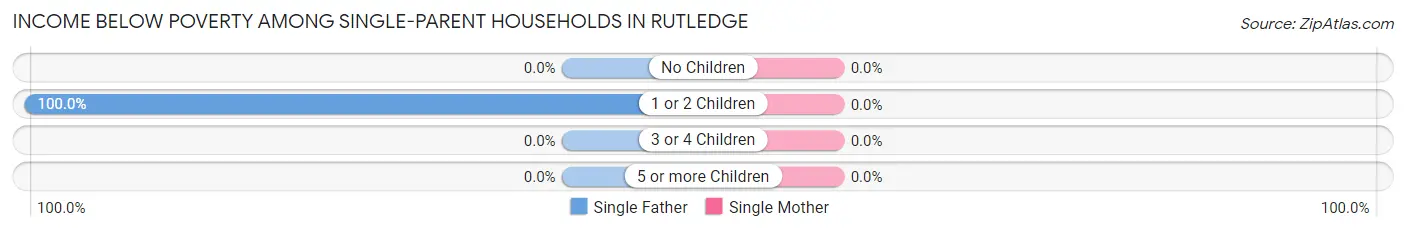
| Children | Single Father | Single Mother |
| No Children | 0 (0.0%) | 0 (0.0%) |
| 1 or 2 Children | 6 (100.0%) | 0 (0.0%) |
| 3 or 4 Children | 0 (0.0%) | 0 (0.0%) |
| 5 or more Children | 0 (0.0%) | 0 (0.0%) |
| Total | 6 (100.0%) | 0 (0.0%) |
Income Below Poverty Among Married-Couple vs Single-Parent Households in Rutledge
The poverty data for Rutledge shows that 9 of the married-couple family households (31.0%) and 6 of the single-parent households (17.6%) are living below the poverty level. Within the married-couple family households, those with 3 or 4 children have the highest poverty rate, with 5 households (100.0%) falling below the poverty line. Among the single-parent households, those with 1 or 2 children have the highest poverty rate, with 6 household (22.2%) living below poverty.
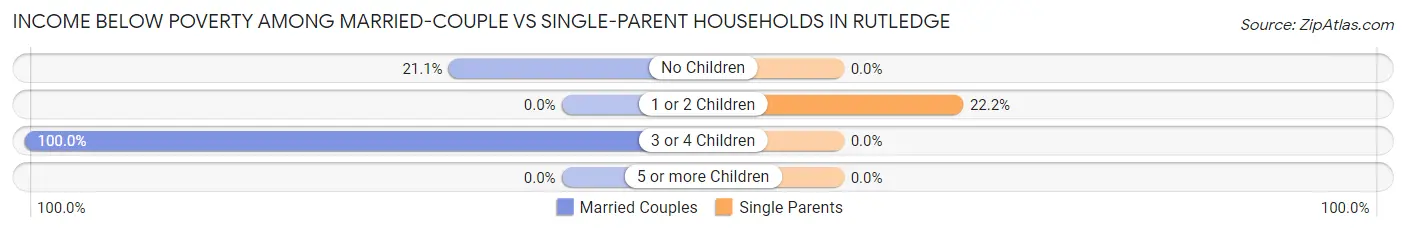
| Children | Married-Couple Families | Single-Parent Households |
| No Children | 4 (21.0%) | 0 (0.0%) |
| 1 or 2 Children | 0 (0.0%) | 6 (22.2%) |
| 3 or 4 Children | 5 (100.0%) | 0 (0.0%) |
| 5 or more Children | 0 (0.0%) | 0 (0.0%) |
| Total | 9 (31.0%) | 6 (17.6%) |
Race in Rutledge
The most populous races in Rutledge are White / Caucasian (160 | 67.5%), Black / African American (73 | 30.8%), and Native / Alaskan (4 | 1.7%).
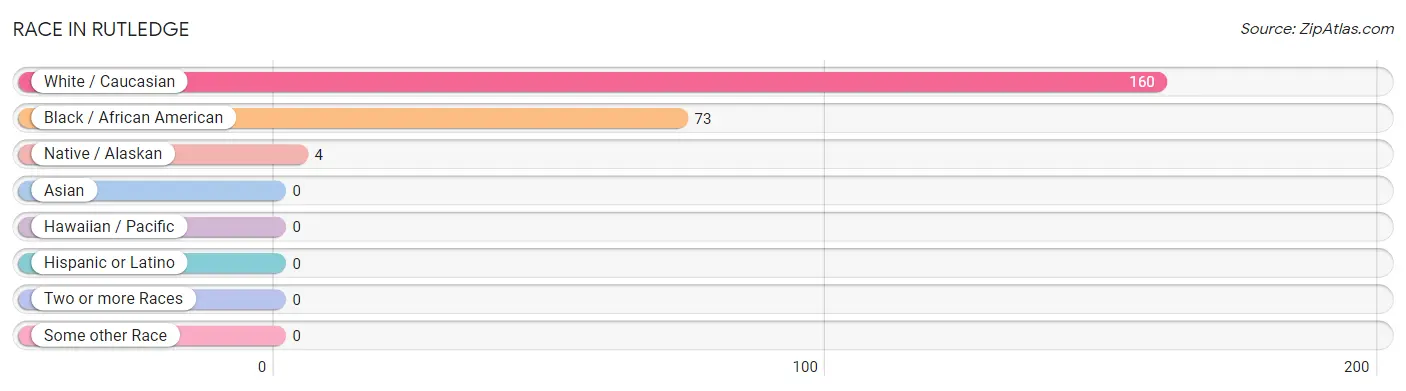
| Race | # Population | % Population |
| Asian | 0 | 0.0% |
| Black / African American | 73 | 30.8% |
| Hawaiian / Pacific | 0 | 0.0% |
| Hispanic or Latino | 0 | 0.0% |
| Native / Alaskan | 4 | 1.7% |
| White / Caucasian | 160 | 67.5% |
| Two or more Races | 0 | 0.0% |
| Some other Race | 0 | 0.0% |
| Total | 237 | 100.0% |
Ancestry in Rutledge
The most populous ancestries reported in Rutledge are American (80 | 33.8%), English (16 | 6.8%), Choctaw (4 | 1.7%), Danish (2 | 0.8%), and European (2 | 0.8%), together accounting for 43.9% of all Rutledge residents.
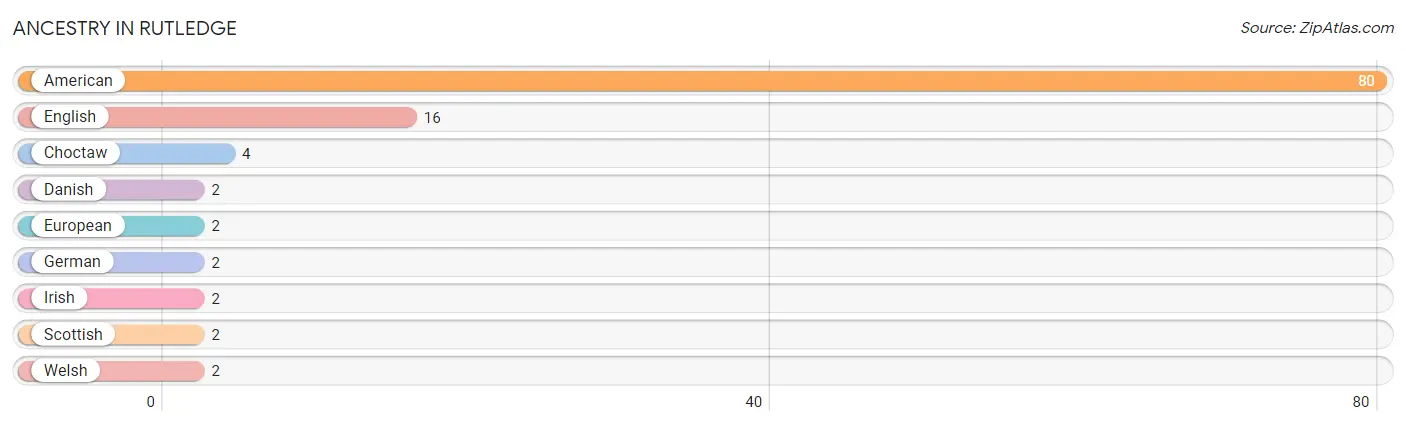
| Ancestry | # Population | % Population |
| American | 80 | 33.8% |
| Choctaw | 4 | 1.7% |
| Danish | 2 | 0.8% |
| English | 16 | 6.8% |
| European | 2 | 0.8% |
| German | 2 | 0.8% |
| Irish | 2 | 0.8% |
| Scottish | 2 | 0.8% |
| Welsh | 2 | 0.8% | View All 9 Rows |
Immigrants in Rutledge

| Immigration Origin | # Population | % Population | View All 0 Rows |
Sex and Age in Rutledge
Sex and Age in Rutledge
The most populous age groups in Rutledge are 35 to 39 Years (14 | 18.7%) for men and 10 to 14 Years (25 | 15.4%) for women.
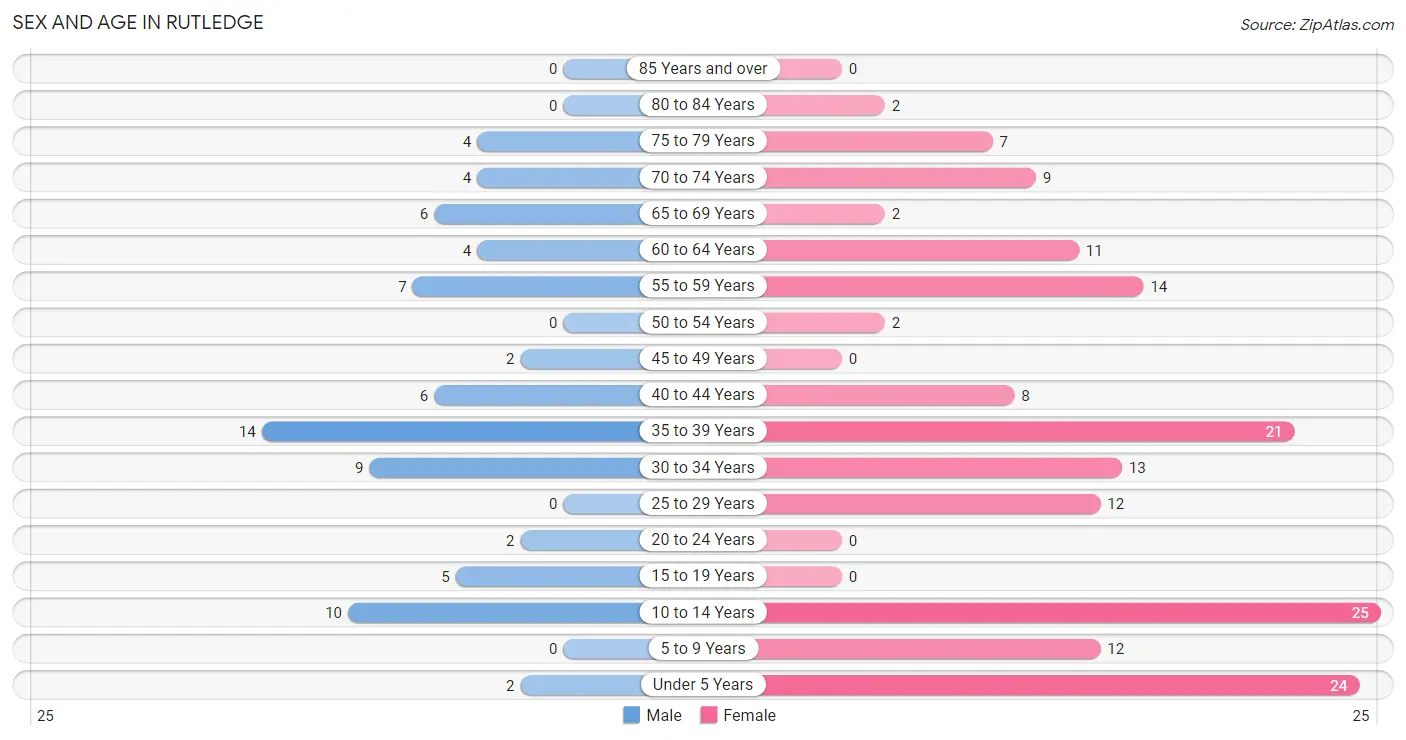
| Age Bracket | Male | Female |
| Under 5 Years | 2 (2.7%) | 24 (14.8%) |
| 5 to 9 Years | 0 (0.0%) | 12 (7.4%) |
| 10 to 14 Years | 10 (13.3%) | 25 (15.4%) |
| 15 to 19 Years | 5 (6.7%) | 0 (0.0%) |
| 20 to 24 Years | 2 (2.7%) | 0 (0.0%) |
| 25 to 29 Years | 0 (0.0%) | 12 (7.4%) |
| 30 to 34 Years | 9 (12.0%) | 13 (8.0%) |
| 35 to 39 Years | 14 (18.7%) | 21 (13.0%) |
| 40 to 44 Years | 6 (8.0%) | 8 (4.9%) |
| 45 to 49 Years | 2 (2.7%) | 0 (0.0%) |
| 50 to 54 Years | 0 (0.0%) | 2 (1.2%) |
| 55 to 59 Years | 7 (9.3%) | 14 (8.6%) |
| 60 to 64 Years | 4 (5.3%) | 11 (6.8%) |
| 65 to 69 Years | 6 (8.0%) | 2 (1.2%) |
| 70 to 74 Years | 4 (5.3%) | 9 (5.6%) |
| 75 to 79 Years | 4 (5.3%) | 7 (4.3%) |
| 80 to 84 Years | 0 (0.0%) | 2 (1.2%) |
| 85 Years and over | 0 (0.0%) | 0 (0.0%) |
| Total | 75 (100.0%) | 162 (100.0%) |
Families and Households in Rutledge
Median Family Size in Rutledge
The median family size in Rutledge is 2.95 persons per family, with married-couple families (29 | 46.0%) accounting for the largest median family size of 3.59 persons per family. On the other hand, single male/father families (6 | 9.5%) represent the smallest median family size with 2.17 persons per family.
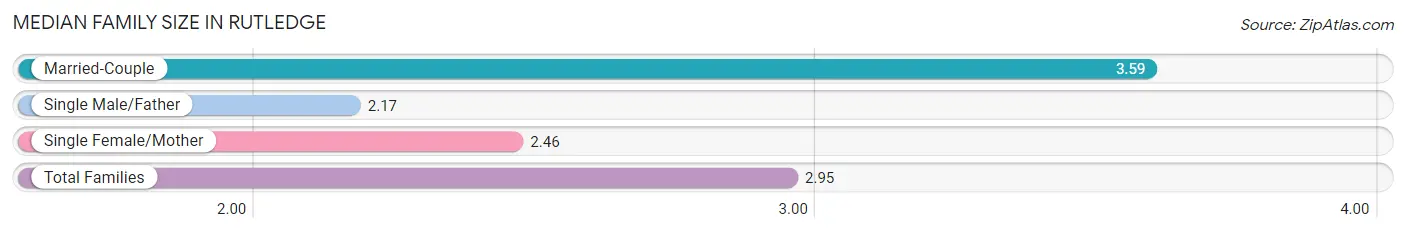
| Family Type | # Families | Family Size |
| Married-Couple | 29 (46.0%) | 3.59 |
| Single Male/Father | 6 (9.5%) | 2.17 |
| Single Female/Mother | 28 (44.4%) | 2.46 |
| Total Families | 63 (100.0%) | 2.95 |
Median Household Size in Rutledge
The median household size in Rutledge is 2.30 persons per household, with married-couple households (29 | 28.2%) accounting for the largest median household size of 3.59 persons per household. non-family households (40 | 38.8%) represent the smallest median household size with 1.13 persons per household.
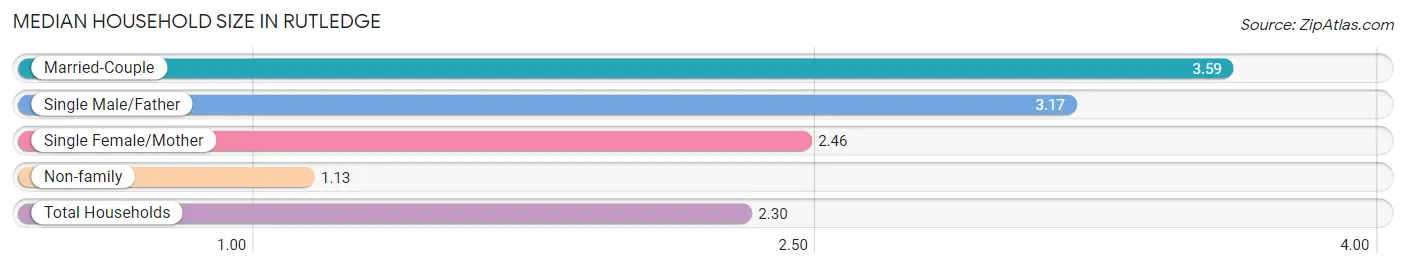
| Household Type | # Households | Household Size |
| Married-Couple | 29 (28.2%) | 3.59 |
| Single Male/Father | 6 (5.8%) | 3.17 |
| Single Female/Mother | 28 (27.2%) | 2.46 |
| Non-family | 40 (38.8%) | 1.13 |
| Total Households | 103 (100.0%) | 2.30 |
Household Size by Marriage Status in Rutledge
Out of a total of 103 households in Rutledge, 63 (61.2%) are family households, while 40 (38.8%) are nonfamily households. The most numerous type of family households are 2-person households, comprising 46, and the most common type of nonfamily households are 1-person households, comprising 38.
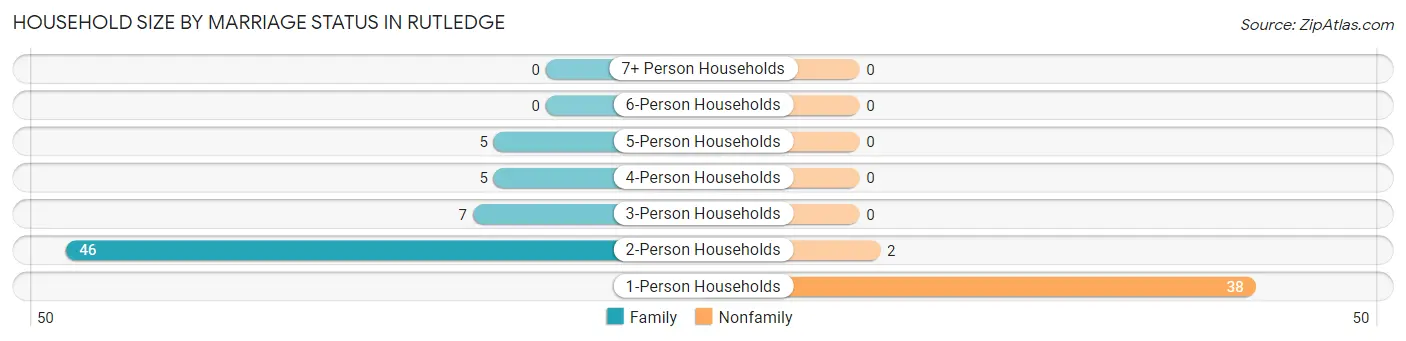
| Household Size | Family Households | Nonfamily Households |
| 1-Person Households | - | 38 (36.9%) |
| 2-Person Households | 46 (44.7%) | 2 (1.9%) |
| 3-Person Households | 7 (6.8%) | 0 (0.0%) |
| 4-Person Households | 5 (4.9%) | 0 (0.0%) |
| 5-Person Households | 5 (4.9%) | 0 (0.0%) |
| 6-Person Households | 0 (0.0%) | 0 (0.0%) |
| 7+ Person Households | 0 (0.0%) | 0 (0.0%) |
| Total | 63 (61.2%) | 40 (38.8%) |
Female Fertility in Rutledge
Fertility by Age in Rutledge
Average fertility rate in Rutledge is 74.0 births per 1,000 women. Women in the age bracket of 20 to 34 years have the highest fertility rate with 80.0 births per 1,000 women. Women in the age bracket of 20 to 34 years acount for 50.0% of all women with births.
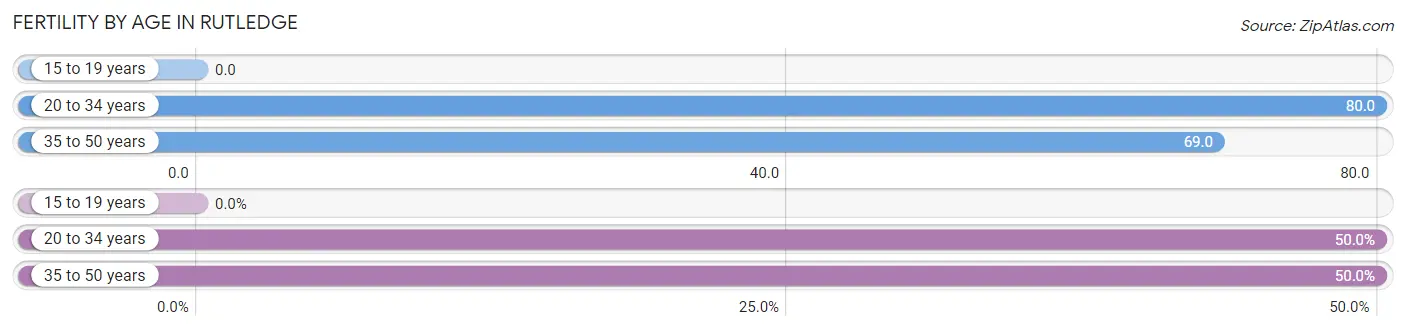
| Age Bracket | Women with Births | Births / 1,000 Women |
| 15 to 19 years | 0 (0.0%) | 0.0 |
| 20 to 34 years | 2 (50.0%) | 80.0 |
| 35 to 50 years | 2 (50.0%) | 69.0 |
| Total | 4 (100.0%) | 74.0 |
Fertility by Age by Marriage Status in Rutledge
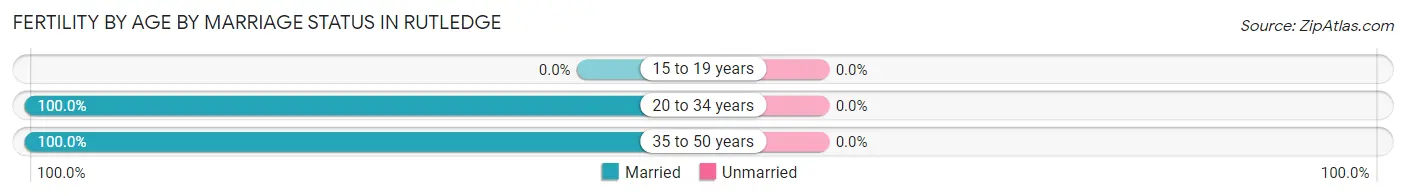
| Age Bracket | Married | Unmarried |
| 15 to 19 years | 0 (0.0%) | 0 (0.0%) |
| 20 to 34 years | 2 (100.0%) | 0 (0.0%) |
| 35 to 50 years | 2 (100.0%) | 0 (0.0%) |
| Total | 4 (100.0%) | 0 (0.0%) |
Fertility by Education in Rutledge
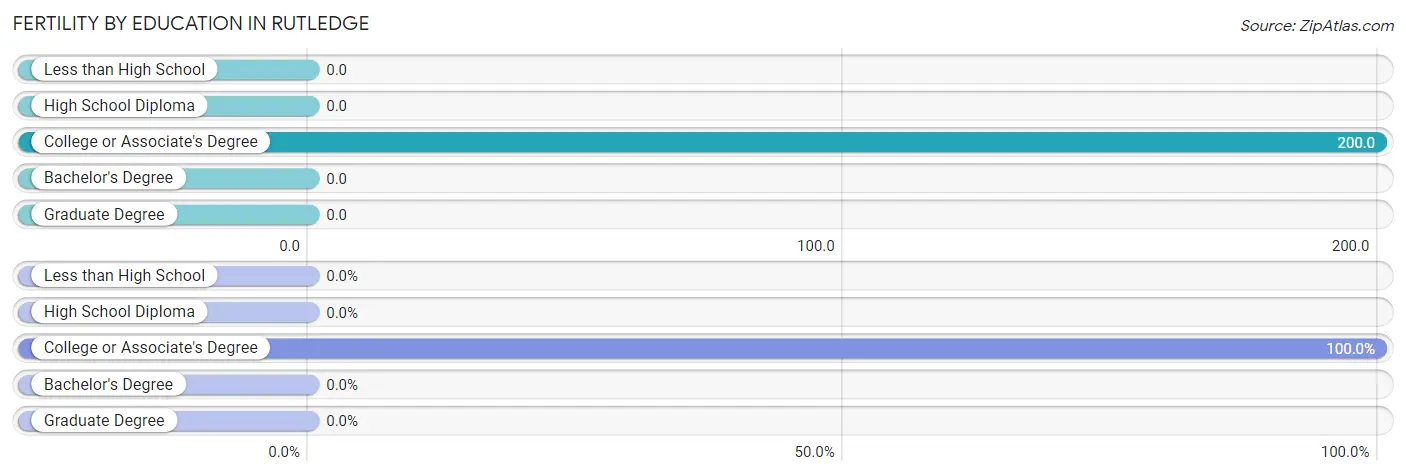
| Educational Attainment | Women with Births | Births / 1,000 Women |
| Less than High School | 0 (0.0%) | 0.0 |
| High School Diploma | 0 (0.0%) | 0.0 |
| College or Associate's Degree | 4 (100.0%) | 200.0 |
| Bachelor's Degree | 0 (0.0%) | 0.0 |
| Graduate Degree | 0 (0.0%) | 0.0 |
| Total | 4 (100.0%) | 74.0 |
Fertility by Education by Marriage Status in Rutledge
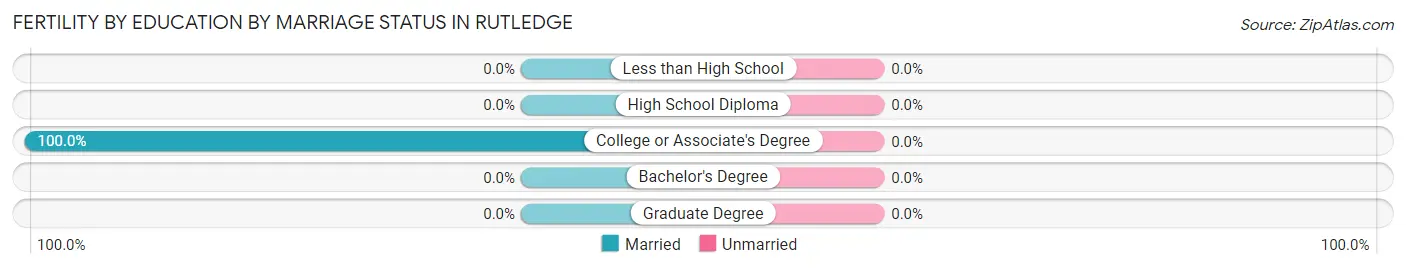
| Educational Attainment | Married | Unmarried |
| Less than High School | 0 (0.0%) | 0 (0.0%) |
| High School Diploma | 0 (0.0%) | 0 (0.0%) |
| College or Associate's Degree | 4 (100.0%) | 0 (0.0%) |
| Bachelor's Degree | 0 (0.0%) | 0 (0.0%) |
| Graduate Degree | 0 (0.0%) | 0 (0.0%) |
| Total | 4 (100.0%) | 0 (0.0%) |
Employment Characteristics in Rutledge
Employment by Class of Employer in Rutledge
Among the 101 employed individuals in Rutledge, private company employees (74 | 73.3%), not-for-profit organizations (8 | 7.9%), and local government employees (8 | 7.9%) make up the most common classes of employment.
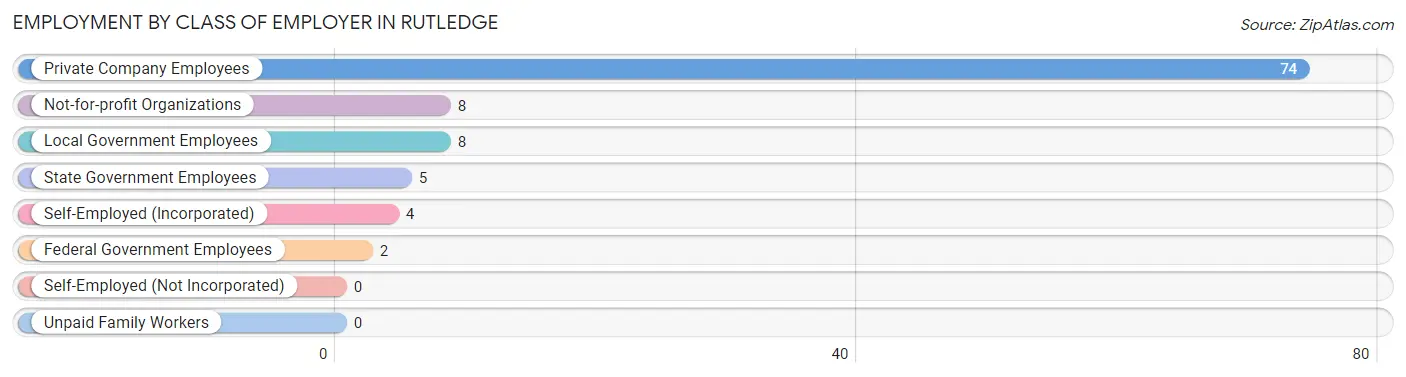
| Employer Class | # Employees | % Employees |
| Private Company Employees | 74 | 73.3% |
| Self-Employed (Incorporated) | 4 | 4.0% |
| Self-Employed (Not Incorporated) | 0 | 0.0% |
| Not-for-profit Organizations | 8 | 7.9% |
| Local Government Employees | 8 | 7.9% |
| State Government Employees | 5 | 5.0% |
| Federal Government Employees | 2 | 2.0% |
| Unpaid Family Workers | 0 | 0.0% |
| Total | 101 | 100.0% |
Employment Status by Age in Rutledge
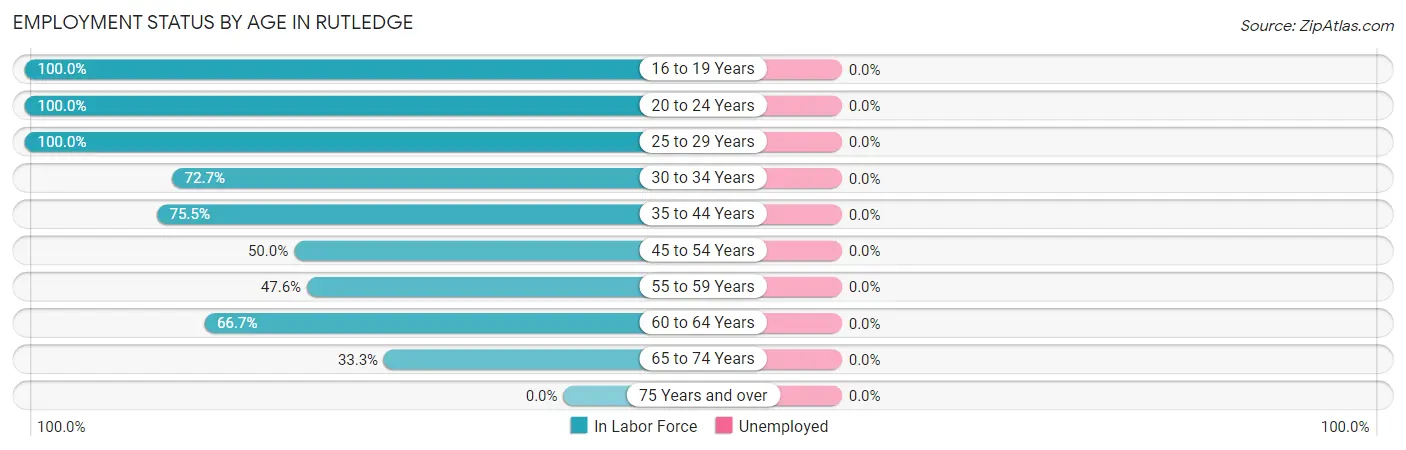
| Age Bracket | In Labor Force | Unemployed |
| 16 to 19 Years | 5 (100.0%) | 0 (0.0%) |
| 20 to 24 Years | 2 (100.0%) | 0 (0.0%) |
| 25 to 29 Years | 12 (100.0%) | 0 (0.0%) |
| 30 to 34 Years | 16 (72.7%) | 0 (0.0%) |
| 35 to 44 Years | 37 (75.5%) | 0 (0.0%) |
| 45 to 54 Years | 2 (50.0%) | 0 (0.0%) |
| 55 to 59 Years | 10 (47.6%) | 0 (0.0%) |
| 60 to 64 Years | 10 (66.7%) | 0 (0.0%) |
| 65 to 74 Years | 7 (33.3%) | 0 (0.0%) |
| 75 Years and over | 0 (0.0%) | 0 (0.0%) |
| Total | 101 (61.6%) | 0 (0.0%) |
Employment Status by Educational Attainment in Rutledge
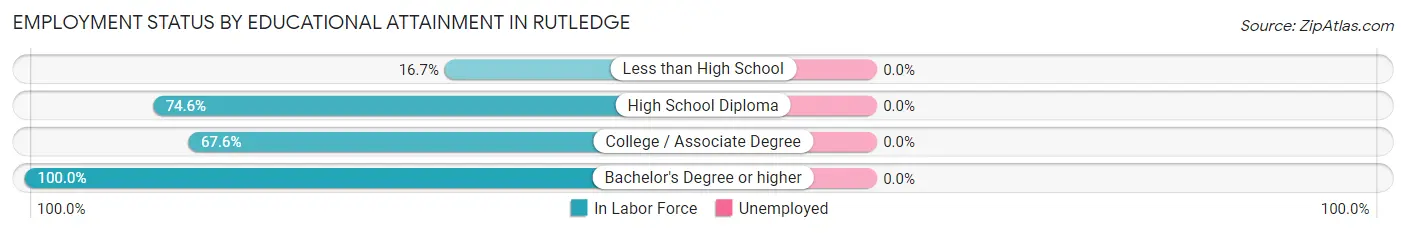
| Educational Attainment | In Labor Force | Unemployed |
| Less than High School | 2 (16.7%) | 0 (0.0%) |
| High School Diploma | 44 (74.6%) | 0 (0.0%) |
| College / Associate Degree | 23 (67.6%) | 0 (0.0%) |
| Bachelor's Degree or higher | 18 (100.0%) | 0 (0.0%) |
| Total | 87 (70.7%) | 0 (0.0%) |
Employment Occupations by Sex in Rutledge
Management, Business, Science and Arts Occupations
The most common Management, Business, Science and Arts occupations in Rutledge are Computers, Engineering & Science (7 | 6.9%), Architecture & Engineering (7 | 6.9%), Community & Social Service (6 | 5.9%), Management (5 | 5.0%), and Education Instruction & Library (4 | 4.0%).
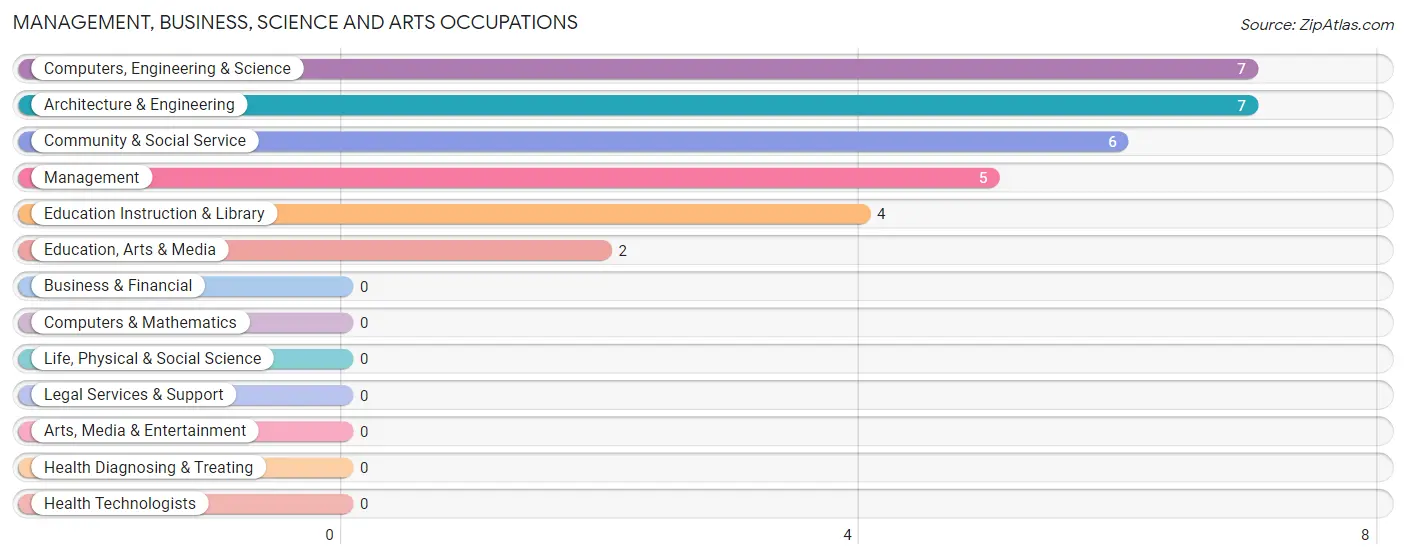
Management, Business, Science and Arts Occupations by Sex
Within the Management, Business, Science and Arts occupations in Rutledge, the most male-oriented occupations are Computers, Engineering & Science (100.0%), Architecture & Engineering (100.0%), and Education, Arts & Media (100.0%), while the most female-oriented occupations are Management (100.0%), Education Instruction & Library (100.0%), and Community & Social Service (66.7%).
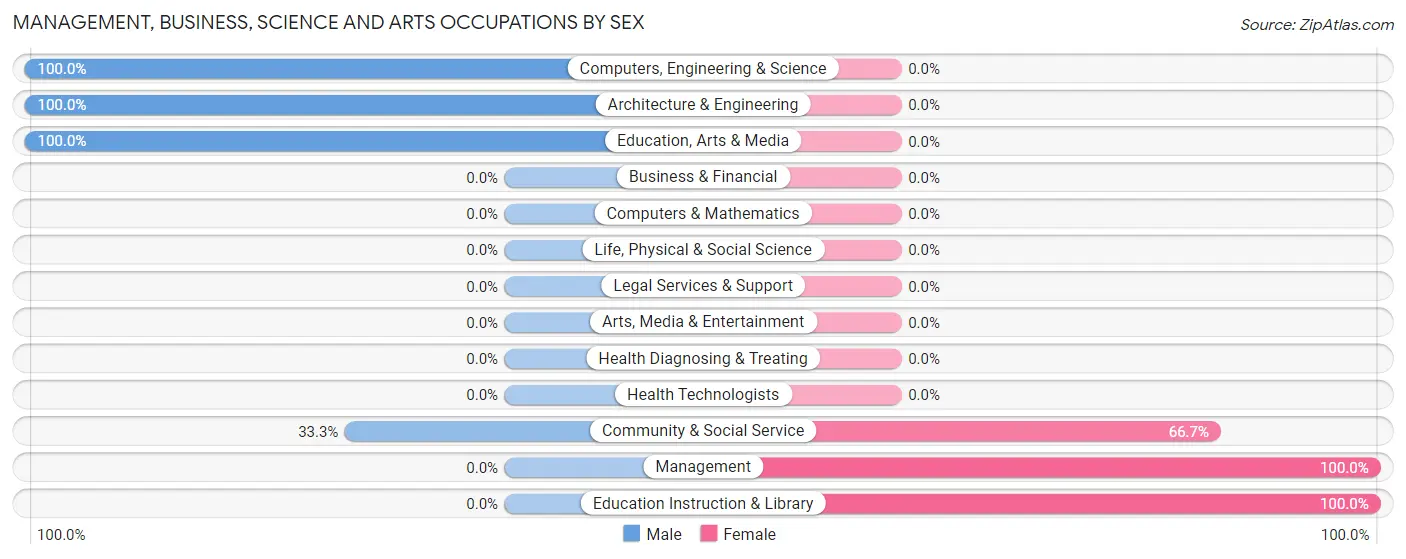
| Occupation | Male | Female |
| Management | 0 (0.0%) | 5 (100.0%) |
| Business & Financial | 0 (0.0%) | 0 (0.0%) |
| Computers, Engineering & Science | 7 (100.0%) | 0 (0.0%) |
| Computers & Mathematics | 0 (0.0%) | 0 (0.0%) |
| Architecture & Engineering | 7 (100.0%) | 0 (0.0%) |
| Life, Physical & Social Science | 0 (0.0%) | 0 (0.0%) |
| Community & Social Service | 2 (33.3%) | 4 (66.7%) |
| Education, Arts & Media | 2 (100.0%) | 0 (0.0%) |
| Legal Services & Support | 0 (0.0%) | 0 (0.0%) |
| Education Instruction & Library | 0 (0.0%) | 4 (100.0%) |
| Arts, Media & Entertainment | 0 (0.0%) | 0 (0.0%) |
| Health Diagnosing & Treating | 0 (0.0%) | 0 (0.0%) |
| Health Technologists | 0 (0.0%) | 0 (0.0%) |
| Total (Category) | 9 (50.0%) | 9 (50.0%) |
| Total (Overall) | 37 (36.6%) | 64 (63.4%) |
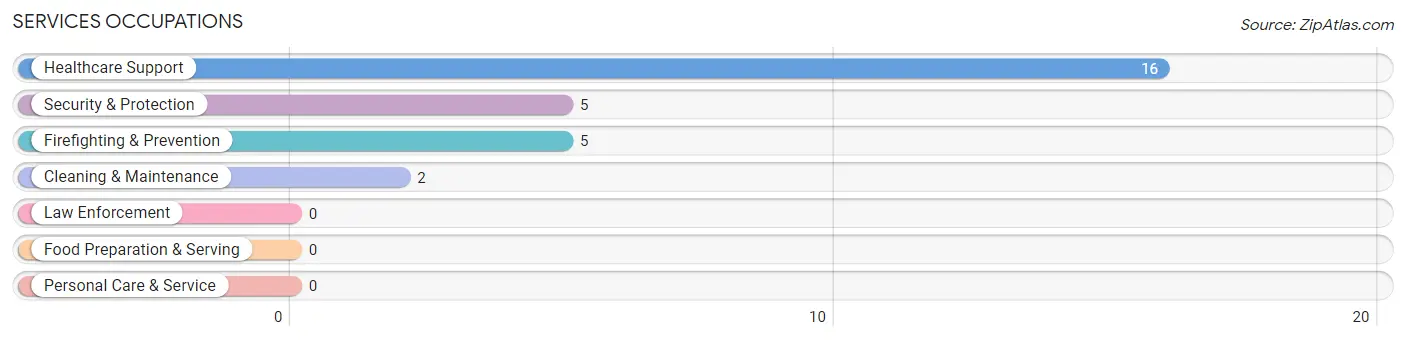
Services Occupations
The most common Services occupations in Rutledge are Healthcare Support (16 | 15.8%), Security & Protection (5 | 5.0%), Firefighting & Prevention (5 | 5.0%), and Cleaning & Maintenance (2 | 2.0%).
Services Occupations by Sex
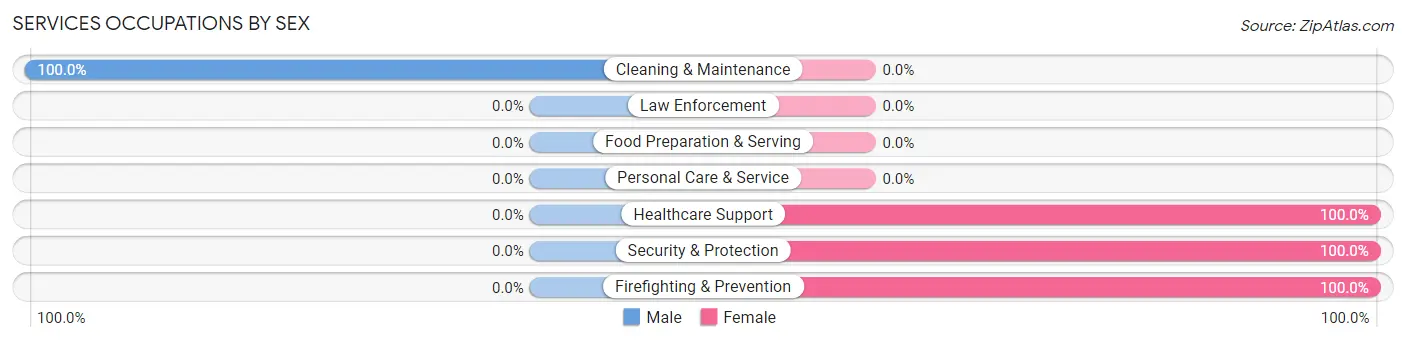
| Occupation | Male | Female |
| Healthcare Support | 0 (0.0%) | 16 (100.0%) |
| Security & Protection | 0 (0.0%) | 5 (100.0%) |
| Firefighting & Prevention | 0 (0.0%) | 5 (100.0%) |
| Law Enforcement | 0 (0.0%) | 0 (0.0%) |
| Food Preparation & Serving | 0 (0.0%) | 0 (0.0%) |
| Cleaning & Maintenance | 2 (100.0%) | 0 (0.0%) |
| Personal Care & Service | 0 (0.0%) | 0 (0.0%) |
| Total (Category) | 2 (8.7%) | 21 (91.3%) |
| Total (Overall) | 37 (36.6%) | 64 (63.4%) |
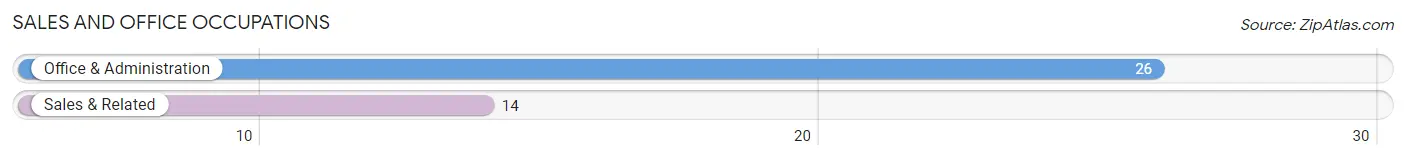
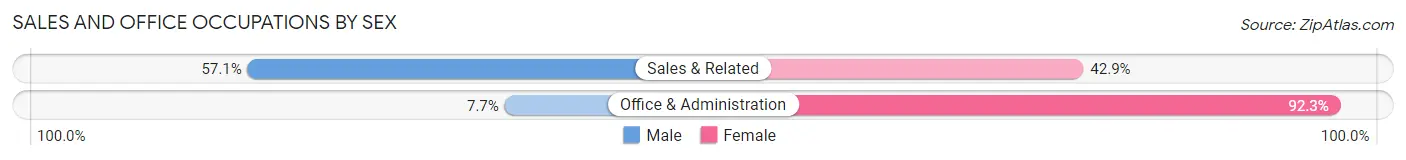
Sales and Office Occupations
The most common Sales and Office occupations in Rutledge are Office & Administration (26 | 25.7%), and Sales & Related (14 | 13.9%).
Sales and Office Occupations by Sex
| Occupation | Male | Female |
| Sales & Related | 8 (57.1%) | 6 (42.9%) |
| Office & Administration | 2 (7.7%) | 24 (92.3%) |
| Total (Category) | 10 (25.0%) | 30 (75.0%) |
| Total (Overall) | 37 (36.6%) | 64 (63.4%) |
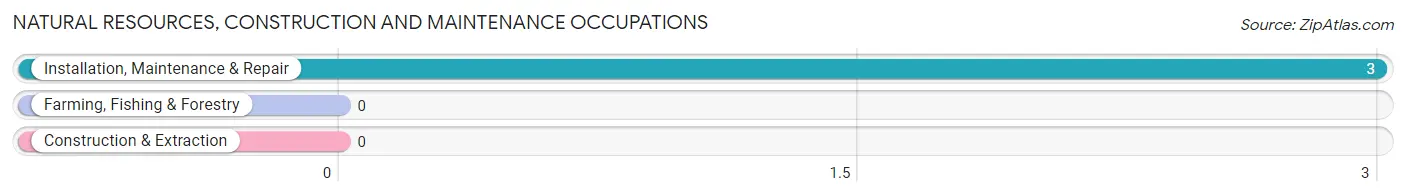
Natural Resources, Construction and Maintenance Occupations
The most common Natural Resources, Construction and Maintenance occupations in Rutledge are , and Installation, Maintenance & Repair (3 | 3.0%).
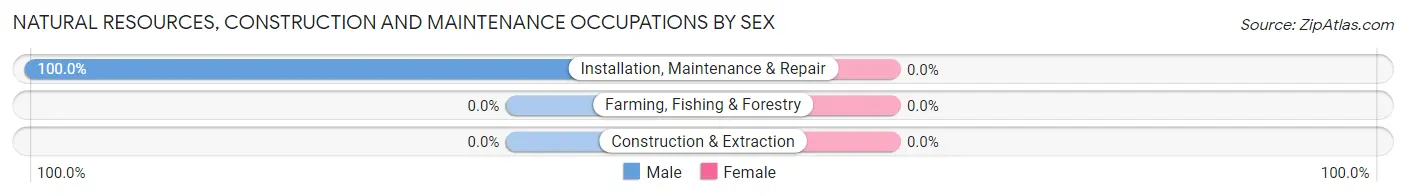
Natural Resources, Construction and Maintenance Occupations by Sex
| Occupation | Male | Female |
| Farming, Fishing & Forestry | 0 (0.0%) | 0 (0.0%) |
| Construction & Extraction | 0 (0.0%) | 0 (0.0%) |
| Installation, Maintenance & Repair | 3 (100.0%) | 0 (0.0%) |
| Total (Category) | 3 (100.0%) | 0 (0.0%) |
| Total (Overall) | 37 (36.6%) | 64 (63.4%) |
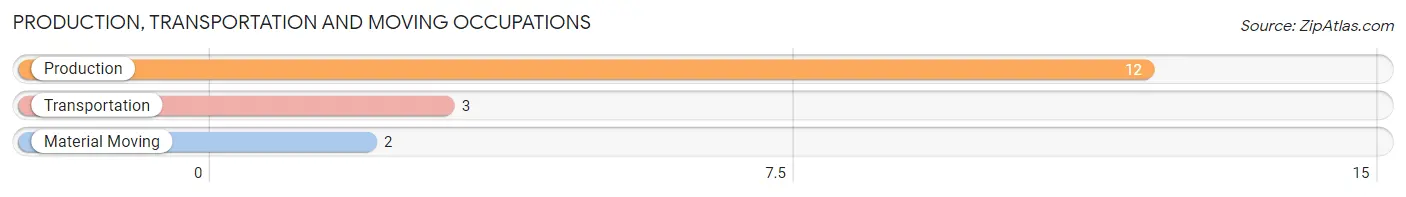
Production, Transportation and Moving Occupations
The most common Production, Transportation and Moving occupations in Rutledge are Production (12 | 11.9%), Transportation (3 | 3.0%), and Material Moving (2 | 2.0%).
Production, Transportation and Moving Occupations by Sex
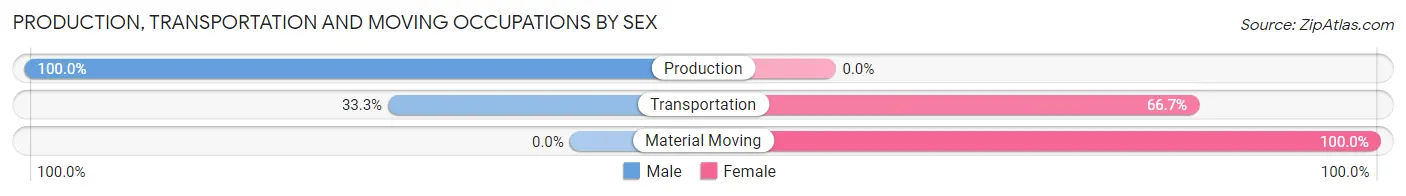
| Occupation | Male | Female |
| Production | 12 (100.0%) | 0 (0.0%) |
| Transportation | 1 (33.3%) | 2 (66.7%) |
| Material Moving | 0 (0.0%) | 2 (100.0%) |
| Total (Category) | 13 (76.5%) | 4 (23.5%) |
| Total (Overall) | 37 (36.6%) | 64 (63.4%) |
Employment Industries by Sex in Rutledge
Employment Industries in Rutledge
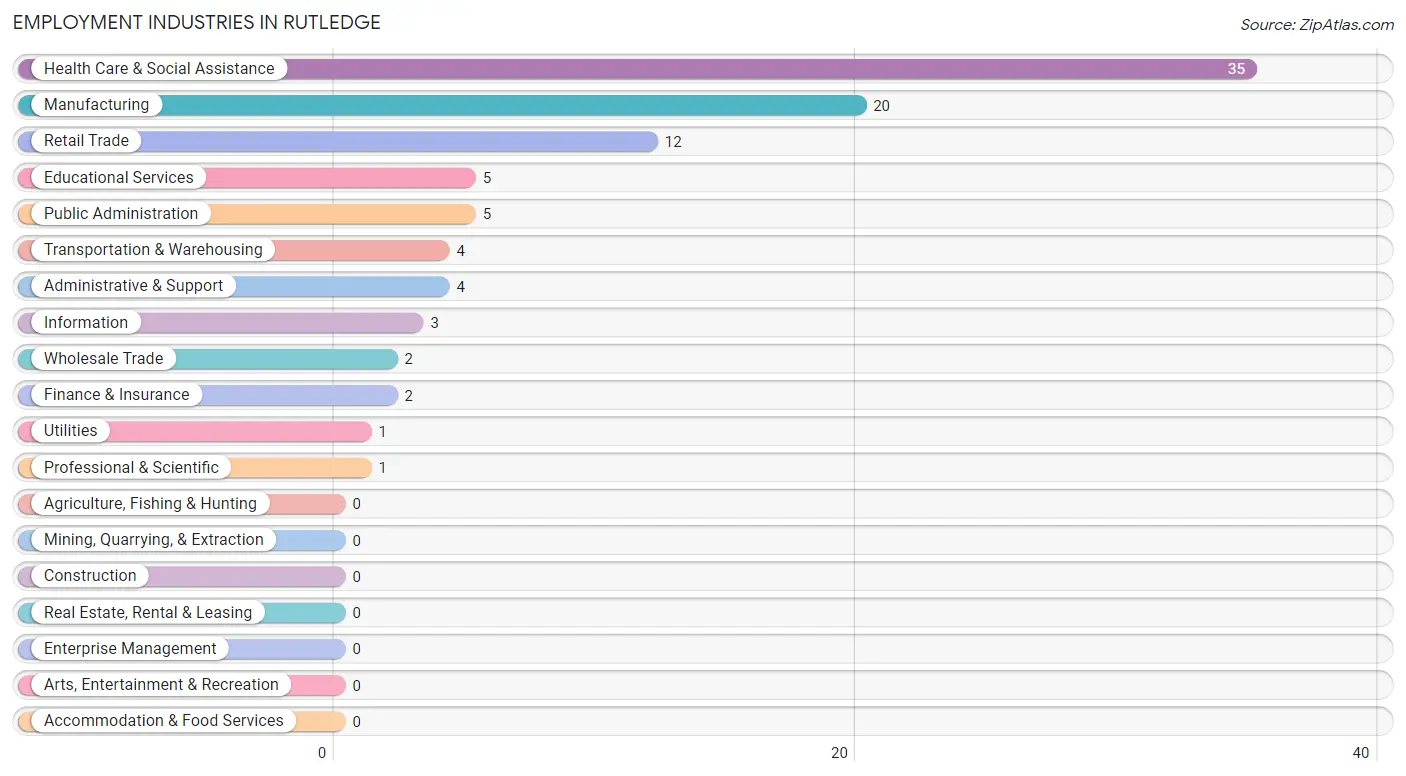
The major employment industries in Rutledge include Health Care & Social Assistance (35 | 34.6%), Manufacturing (20 | 19.8%), Retail Trade (12 | 11.9%), Educational Services (5 | 5.0%), and Public Administration (5 | 5.0%).
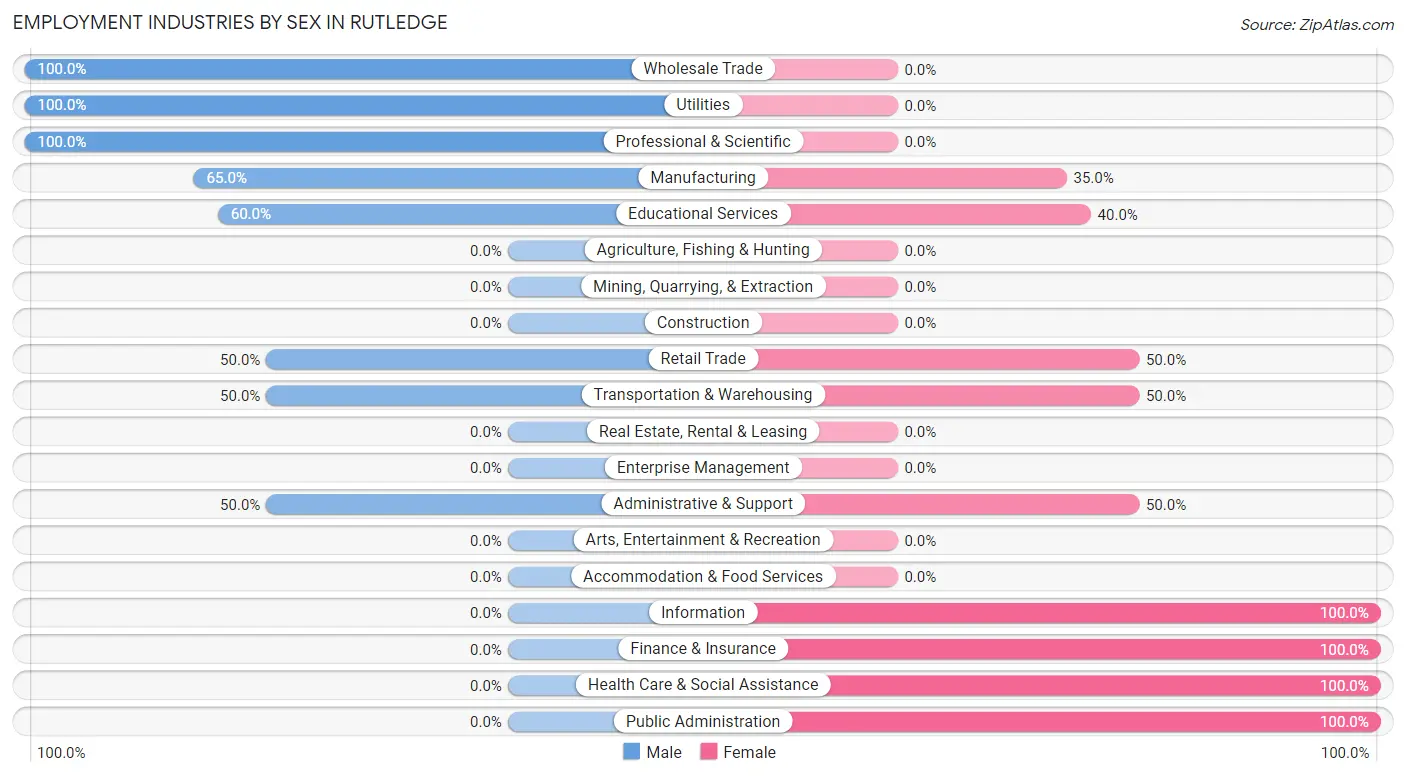
Employment Industries by Sex in Rutledge
The Rutledge industries that see more men than women are Wholesale Trade (100.0%), Utilities (100.0%), and Professional & Scientific (100.0%), whereas the industries that tend to have a higher number of women are Information (100.0%), Finance & Insurance (100.0%), and Health Care & Social Assistance (100.0%).
| Industry | Male | Female |
| Agriculture, Fishing & Hunting | 0 (0.0%) | 0 (0.0%) |
| Mining, Quarrying, & Extraction | 0 (0.0%) | 0 (0.0%) |
| Construction | 0 (0.0%) | 0 (0.0%) |
| Manufacturing | 13 (65.0%) | 7 (35.0%) |
| Wholesale Trade | 2 (100.0%) | 0 (0.0%) |
| Retail Trade | 6 (50.0%) | 6 (50.0%) |
| Transportation & Warehousing | 2 (50.0%) | 2 (50.0%) |
| Utilities | 1 (100.0%) | 0 (0.0%) |
| Information | 0 (0.0%) | 3 (100.0%) |
| Finance & Insurance | 0 (0.0%) | 2 (100.0%) |
| Real Estate, Rental & Leasing | 0 (0.0%) | 0 (0.0%) |
| Professional & Scientific | 1 (100.0%) | 0 (0.0%) |
| Enterprise Management | 0 (0.0%) | 0 (0.0%) |
| Administrative & Support | 2 (50.0%) | 2 (50.0%) |
| Educational Services | 3 (60.0%) | 2 (40.0%) |
| Health Care & Social Assistance | 0 (0.0%) | 35 (100.0%) |
| Arts, Entertainment & Recreation | 0 (0.0%) | 0 (0.0%) |
| Accommodation & Food Services | 0 (0.0%) | 0 (0.0%) |
| Public Administration | 0 (0.0%) | 5 (100.0%) |
| Total | 37 (36.6%) | 64 (63.4%) |
Education in Rutledge
School Enrollment in Rutledge
The most common levels of schooling among the 49 students in Rutledge are elementary school (37 | 75.5%), middle school (10 | 20.4%), and college / undergraduate (2 | 4.1%).
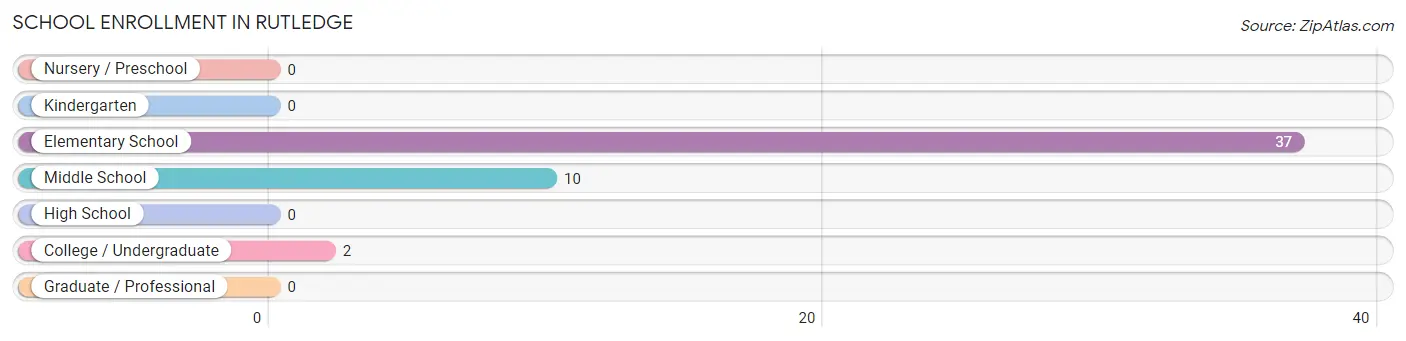
| School Level | # Students | % Students |
| Nursery / Preschool | 0 | 0.0% |
| Kindergarten | 0 | 0.0% |
| Elementary School | 37 | 75.5% |
| Middle School | 10 | 20.4% |
| High School | 0 | 0.0% |
| College / Undergraduate | 2 | 4.1% |
| Graduate / Professional | 0 | 0.0% |
| Total | 49 | 100.0% |
School Enrollment by Age by Funding Source in Rutledge
Out of a total of 49 students who are enrolled in schools in Rutledge, 1 (2.0%) attend a private institution, while the remaining 48 (98.0%) are enrolled in public schools. The age group of 5 to 9 year old has the highest likelihood of being enrolled in private schools, with 1 (8.3% in the age bracket) enrolled. Conversely, the age group of 10 to 14 year olds has the lowest likelihood of being enrolled in a private school, with 35 (100.0% in the age bracket) attending a public institution.
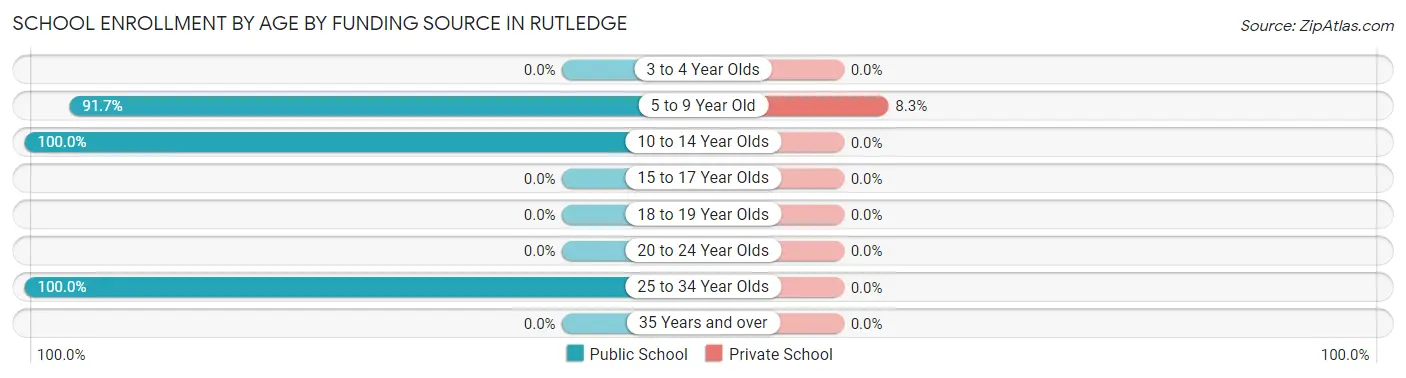
| Age Bracket | Public School | Private School |
| 3 to 4 Year Olds | 0 (0.0%) | 0 (0.0%) |
| 5 to 9 Year Old | 11 (91.7%) | 1 (8.3%) |
| 10 to 14 Year Olds | 35 (100.0%) | 0 (0.0%) |
| 15 to 17 Year Olds | 0 (0.0%) | 0 (0.0%) |
| 18 to 19 Year Olds | 0 (0.0%) | 0 (0.0%) |
| 20 to 24 Year Olds | 0 (0.0%) | 0 (0.0%) |
| 25 to 34 Year Olds | 2 (100.0%) | 0 (0.0%) |
| 35 Years and over | 0 (0.0%) | 0 (0.0%) |
| Total | 48 (98.0%) | 1 (2.0%) |
Educational Attainment by Field of Study in Rutledge
Bio, nature & agricultural (12 | 37.5%), literature & languages (10 | 31.2%), psychology (5 | 15.6%), business (2 | 6.2%), and liberal arts & history (2 | 6.2%) are the most common fields of study among 32 individuals in Rutledge who have obtained a bachelor's degree or higher.
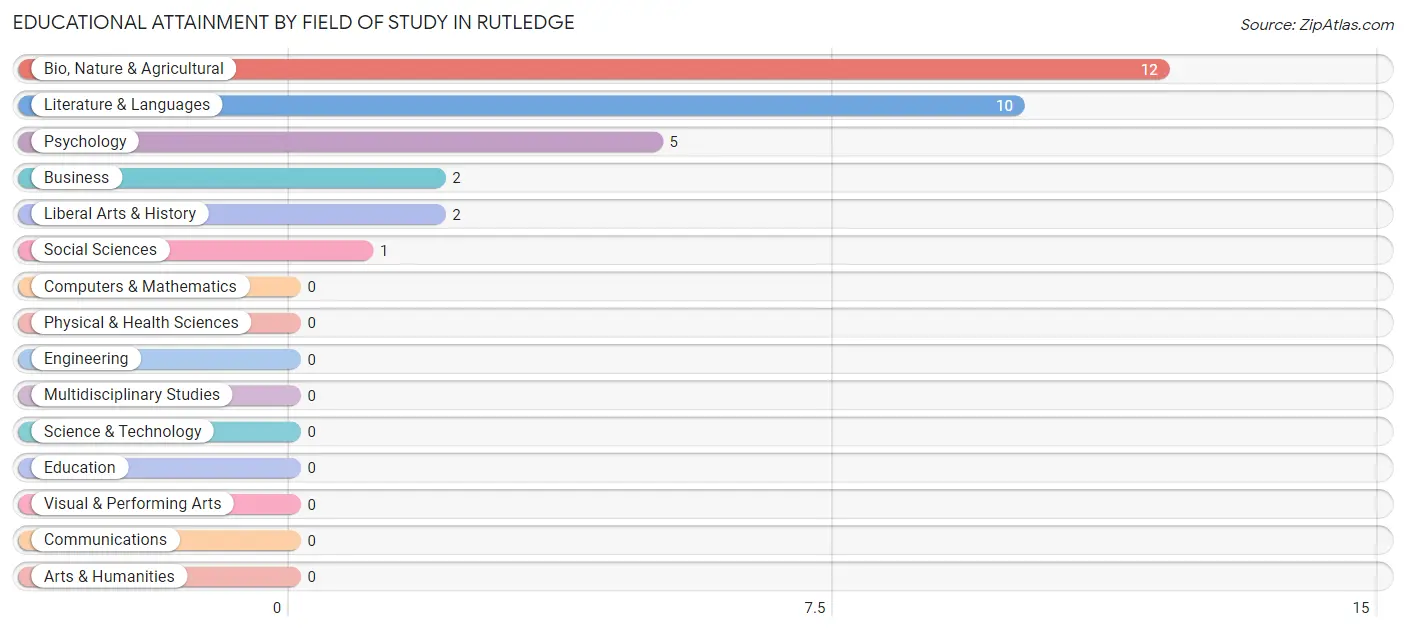
| Field of Study | # Graduates | % Graduates |
| Computers & Mathematics | 0 | 0.0% |
| Bio, Nature & Agricultural | 12 | 37.5% |
| Physical & Health Sciences | 0 | 0.0% |
| Psychology | 5 | 15.6% |
| Social Sciences | 1 | 3.1% |
| Engineering | 0 | 0.0% |
| Multidisciplinary Studies | 0 | 0.0% |
| Science & Technology | 0 | 0.0% |
| Business | 2 | 6.2% |
| Education | 0 | 0.0% |
| Literature & Languages | 10 | 31.2% |
| Liberal Arts & History | 2 | 6.2% |
| Visual & Performing Arts | 0 | 0.0% |
| Communications | 0 | 0.0% |
| Arts & Humanities | 0 | 0.0% |
| Total | 32 | 100.0% |
Transportation & Commute in Rutledge
Vehicle Availability by Sex in Rutledge
The most prevalent vehicle ownership categories in Rutledge are males with 2 vehicles (22, accounting for 59.5%) and females with 2 vehicles (30, making up 34.4%).
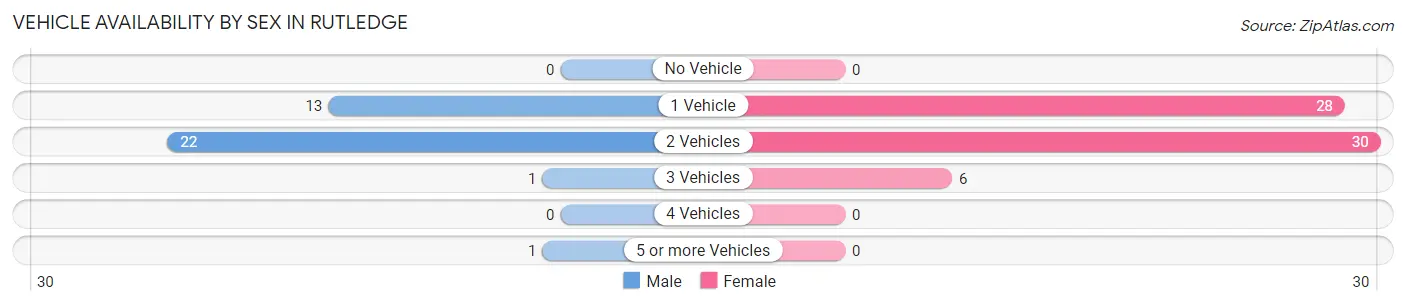
| Vehicles Available | Male | Female |
| No Vehicle | 0 (0.0%) | 0 (0.0%) |
| 1 Vehicle | 13 (35.1%) | 28 (43.8%) |
| 2 Vehicles | 22 (59.5%) | 30 (46.9%) |
| 3 Vehicles | 1 (2.7%) | 6 (9.4%) |
| 4 Vehicles | 0 (0.0%) | 0 (0.0%) |
| 5 or more Vehicles | 1 (2.7%) | 0 (0.0%) |
| Total | 37 (100.0%) | 64 (100.0%) |
Commute Time in Rutledge
The most frequently occuring commute durations in Rutledge are 45 to 59 minutes (29 commuters, 31.5%), 30 to 34 minutes (19 commuters, 20.6%), and 10 to 14 minutes (12 commuters, 13.0%).
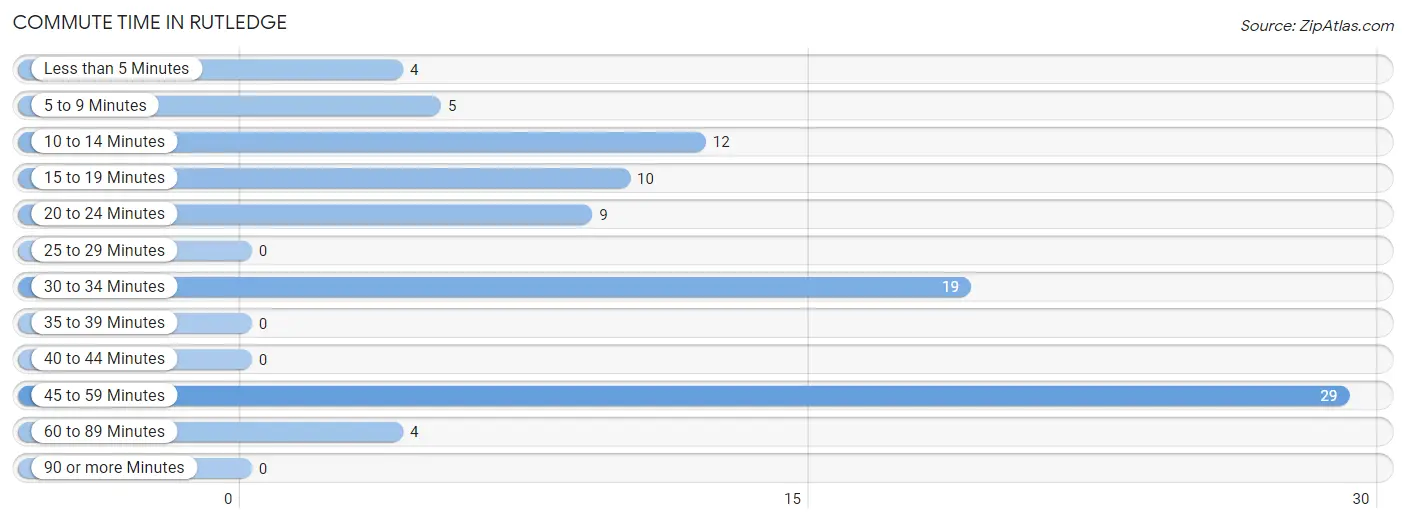
| Commute Time | # Commuters | % Commuters |
| Less than 5 Minutes | 4 | 4.3% |
| 5 to 9 Minutes | 5 | 5.4% |
| 10 to 14 Minutes | 12 | 13.0% |
| 15 to 19 Minutes | 10 | 10.9% |
| 20 to 24 Minutes | 9 | 9.8% |
| 25 to 29 Minutes | 0 | 0.0% |
| 30 to 34 Minutes | 19 | 20.6% |
| 35 to 39 Minutes | 0 | 0.0% |
| 40 to 44 Minutes | 0 | 0.0% |
| 45 to 59 Minutes | 29 | 31.5% |
| 60 to 89 Minutes | 4 | 4.3% |
| 90 or more Minutes | 0 | 0.0% |
Commute Time by Sex in Rutledge
The most common commute times in Rutledge are 10 to 14 minutes (10 commuters, 27.0%) for males and 45 to 59 minutes (20 commuters, 36.4%) for females.
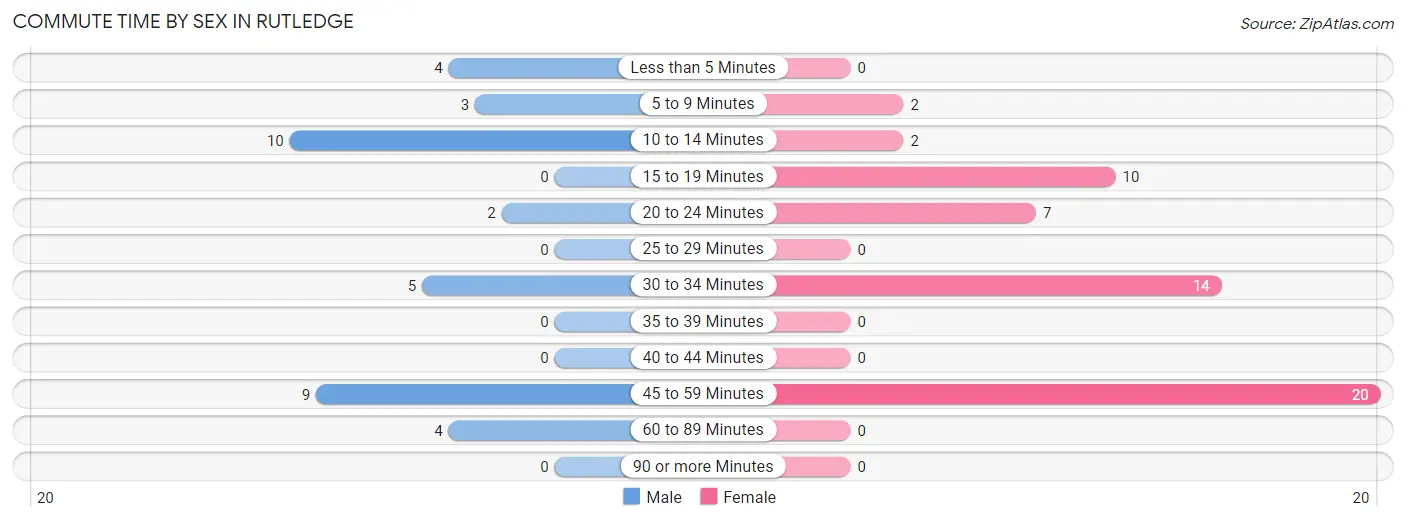
| Commute Time | Male | Female |
| Less than 5 Minutes | 4 (10.8%) | 0 (0.0%) |
| 5 to 9 Minutes | 3 (8.1%) | 2 (3.6%) |
| 10 to 14 Minutes | 10 (27.0%) | 2 (3.6%) |
| 15 to 19 Minutes | 0 (0.0%) | 10 (18.2%) |
| 20 to 24 Minutes | 2 (5.4%) | 7 (12.7%) |
| 25 to 29 Minutes | 0 (0.0%) | 0 (0.0%) |
| 30 to 34 Minutes | 5 (13.5%) | 14 (25.5%) |
| 35 to 39 Minutes | 0 (0.0%) | 0 (0.0%) |
| 40 to 44 Minutes | 0 (0.0%) | 0 (0.0%) |
| 45 to 59 Minutes | 9 (24.3%) | 20 (36.4%) |
| 60 to 89 Minutes | 4 (10.8%) | 0 (0.0%) |
| 90 or more Minutes | 0 (0.0%) | 0 (0.0%) |
Time of Departure to Work by Sex in Rutledge
The most frequent times of departure to work in Rutledge are 5:30 AM to 5:59 AM (15, 40.5%) for males and 7:00 AM to 7:29 AM (28, 50.9%) for females.
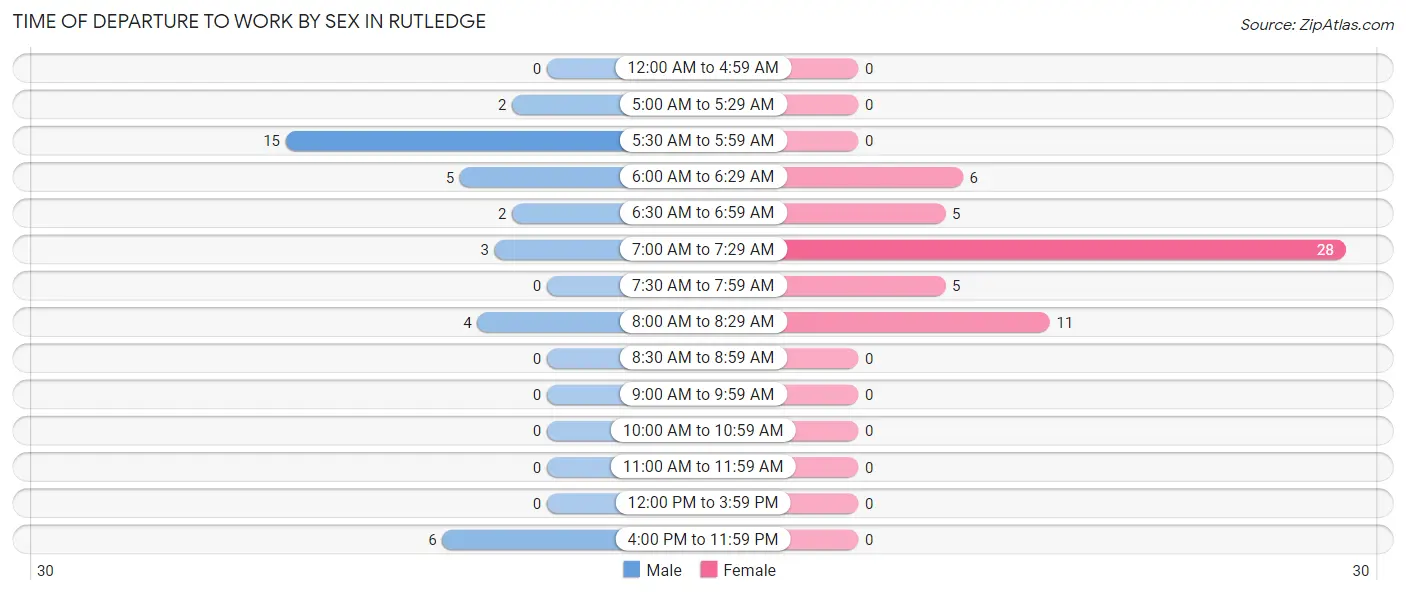
| Time of Departure | Male | Female |
| 12:00 AM to 4:59 AM | 0 (0.0%) | 0 (0.0%) |
| 5:00 AM to 5:29 AM | 2 (5.4%) | 0 (0.0%) |
| 5:30 AM to 5:59 AM | 15 (40.5%) | 0 (0.0%) |
| 6:00 AM to 6:29 AM | 5 (13.5%) | 6 (10.9%) |
| 6:30 AM to 6:59 AM | 2 (5.4%) | 5 (9.1%) |
| 7:00 AM to 7:29 AM | 3 (8.1%) | 28 (50.9%) |
| 7:30 AM to 7:59 AM | 0 (0.0%) | 5 (9.1%) |
| 8:00 AM to 8:29 AM | 4 (10.8%) | 11 (20.0%) |
| 8:30 AM to 8:59 AM | 0 (0.0%) | 0 (0.0%) |
| 9:00 AM to 9:59 AM | 0 (0.0%) | 0 (0.0%) |
| 10:00 AM to 10:59 AM | 0 (0.0%) | 0 (0.0%) |
| 11:00 AM to 11:59 AM | 0 (0.0%) | 0 (0.0%) |
| 12:00 PM to 3:59 PM | 0 (0.0%) | 0 (0.0%) |
| 4:00 PM to 11:59 PM | 6 (16.2%) | 0 (0.0%) |
| Total | 37 (100.0%) | 55 (100.0%) |
Housing Occupancy in Rutledge
Occupancy by Ownership in Rutledge
Of the total 103 dwellings in Rutledge, owner-occupied units account for 74 (71.8%), while renter-occupied units make up 29 (28.2%).
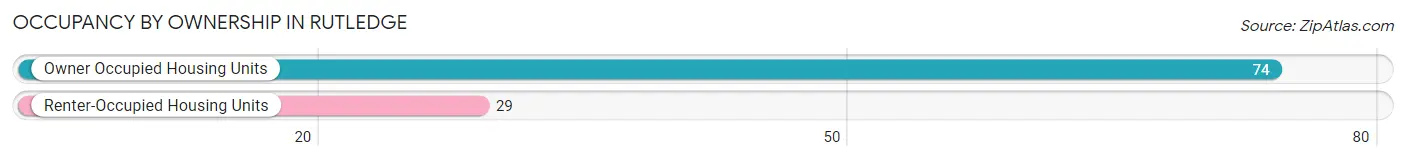
| Occupancy | # Housing Units | % Housing Units |
| Owner Occupied Housing Units | 74 | 71.8% |
| Renter-Occupied Housing Units | 29 | 28.2% |
| Total Occupied Housing Units | 103 | 100.0% |
Occupancy by Household Size in Rutledge
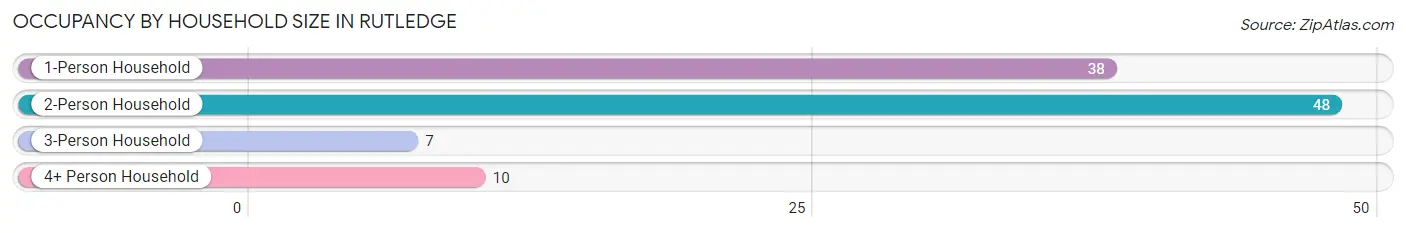
| Household Size | # Housing Units | % Housing Units |
| 1-Person Household | 38 | 36.9% |
| 2-Person Household | 48 | 46.6% |
| 3-Person Household | 7 | 6.8% |
| 4+ Person Household | 10 | 9.7% |
| Total Housing Units | 103 | 100.0% |
Occupancy by Ownership by Household Size in Rutledge
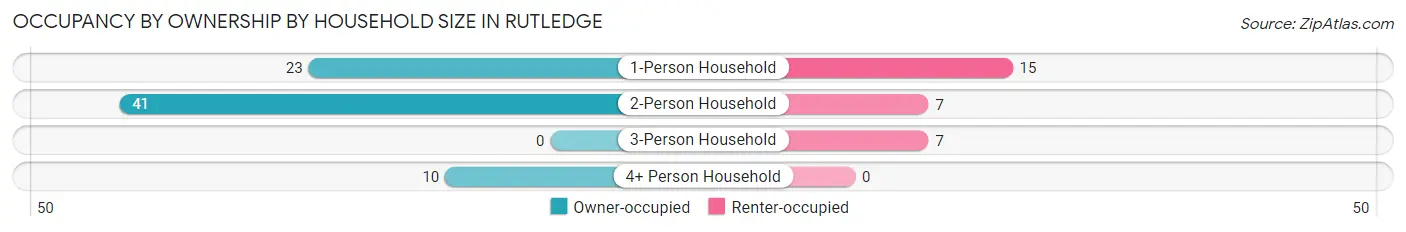
| Household Size | Owner-occupied | Renter-occupied |
| 1-Person Household | 23 (60.5%) | 15 (39.5%) |
| 2-Person Household | 41 (85.4%) | 7 (14.6%) |
| 3-Person Household | 0 (0.0%) | 7 (100.0%) |
| 4+ Person Household | 10 (100.0%) | 0 (0.0%) |
| Total Housing Units | 74 (71.8%) | 29 (28.2%) |
Occupancy by Educational Attainment in Rutledge
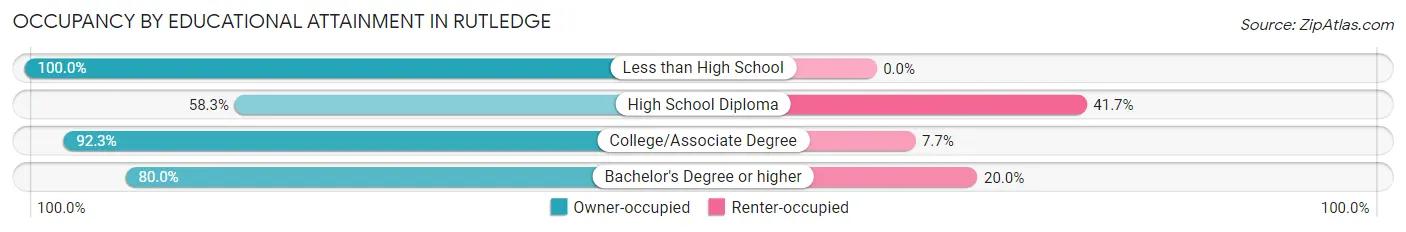
| Household Size | Owner-occupied | Renter-occupied |
| Less than High School | 7 (100.0%) | 0 (0.0%) |
| High School Diploma | 35 (58.3%) | 25 (41.7%) |
| College/Associate Degree | 24 (92.3%) | 2 (7.7%) |
| Bachelor's Degree or higher | 8 (80.0%) | 2 (20.0%) |
Occupancy by Age of Householder in Rutledge
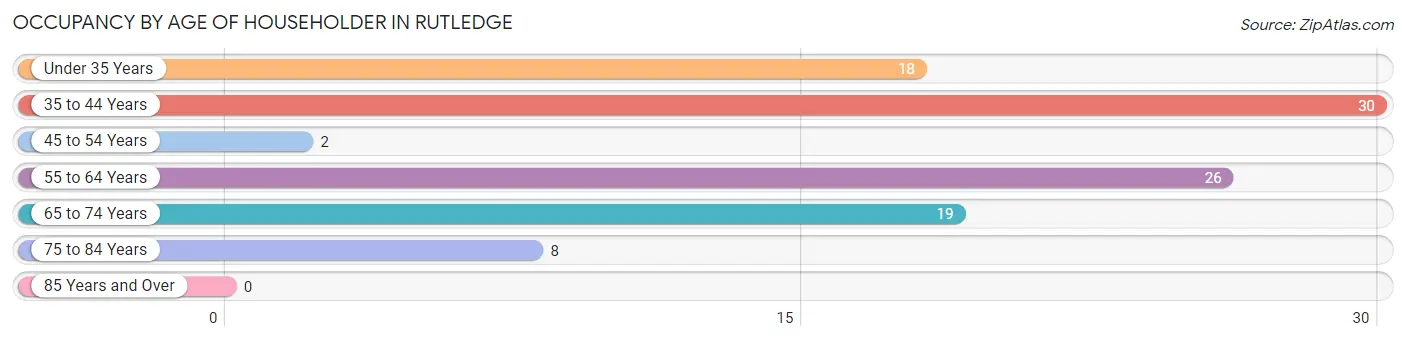
| Age Bracket | # Households | % Households |
| Under 35 Years | 18 | 17.5% |
| 35 to 44 Years | 30 | 29.1% |
| 45 to 54 Years | 2 | 1.9% |
| 55 to 64 Years | 26 | 25.2% |
| 65 to 74 Years | 19 | 18.4% |
| 75 to 84 Years | 8 | 7.8% |
| 85 Years and Over | 0 | 0.0% |
| Total | 103 | 100.0% |
Housing Finances in Rutledge
Median Income by Occupancy in Rutledge
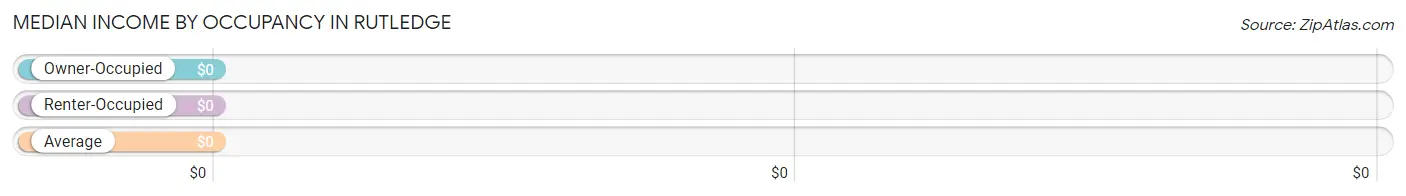
| Occupancy Type | # Households | Median Income |
| Owner-Occupied | 74 (71.8%) | $0 |
| Renter-Occupied | 29 (28.2%) | $0 |
| Average | 103 (100.0%) | $0 |
Occupancy by Householder Income Bracket in Rutledge
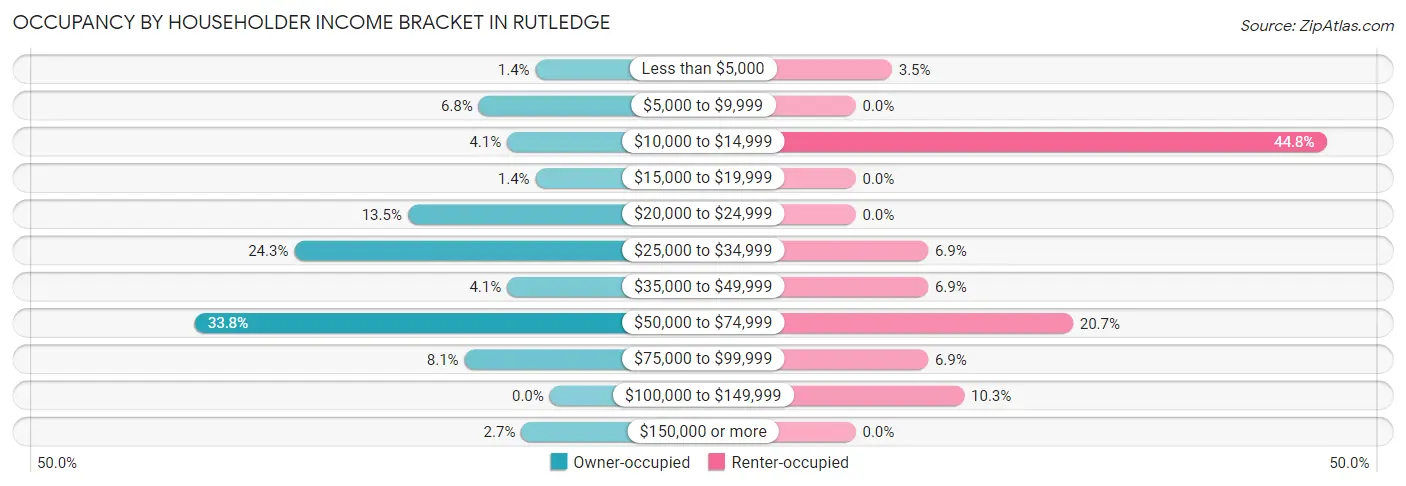
| Income Bracket | Owner-occupied | Renter-occupied |
| Less than $5,000 | 1 (1.3%) | 1 (3.5%) |
| $5,000 to $9,999 | 5 (6.8%) | 0 (0.0%) |
| $10,000 to $14,999 | 3 (4.1%) | 13 (44.8%) |
| $15,000 to $19,999 | 1 (1.3%) | 0 (0.0%) |
| $20,000 to $24,999 | 10 (13.5%) | 0 (0.0%) |
| $25,000 to $34,999 | 18 (24.3%) | 2 (6.9%) |
| $35,000 to $49,999 | 3 (4.1%) | 2 (6.9%) |
| $50,000 to $74,999 | 25 (33.8%) | 6 (20.7%) |
| $75,000 to $99,999 | 6 (8.1%) | 2 (6.9%) |
| $100,000 to $149,999 | 0 (0.0%) | 3 (10.3%) |
| $150,000 or more | 2 (2.7%) | 0 (0.0%) |
| Total | 74 (100.0%) | 29 (100.0%) |
Monthly Housing Cost Tiers in Rutledge
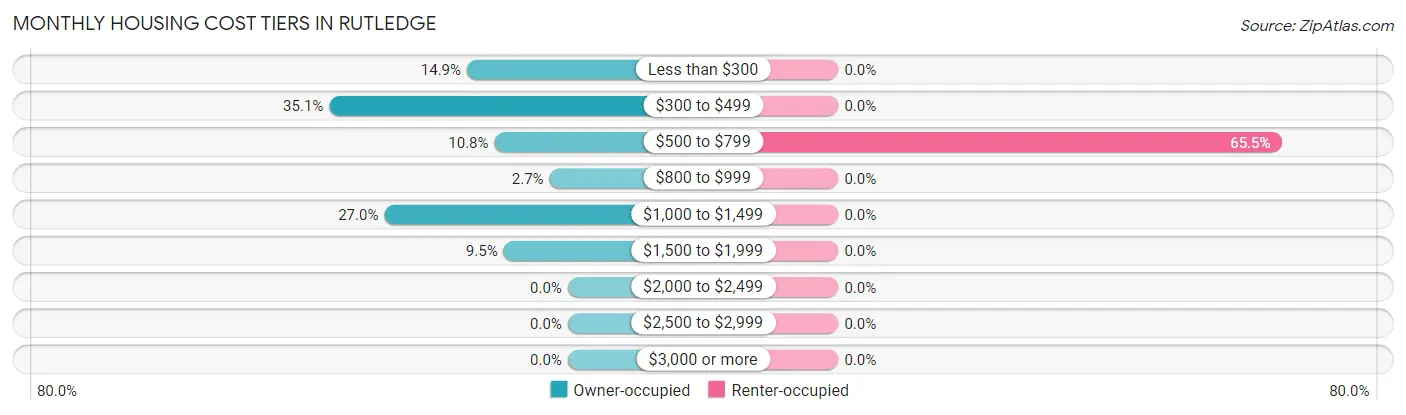
| Monthly Cost | Owner-occupied | Renter-occupied |
| Less than $300 | 11 (14.9%) | 0 (0.0%) |
| $300 to $499 | 26 (35.1%) | 0 (0.0%) |
| $500 to $799 | 8 (10.8%) | 19 (65.5%) |
| $800 to $999 | 2 (2.7%) | 0 (0.0%) |
| $1,000 to $1,499 | 20 (27.0%) | 0 (0.0%) |
| $1,500 to $1,999 | 7 (9.5%) | 0 (0.0%) |
| $2,000 to $2,499 | 0 (0.0%) | 0 (0.0%) |
| $2,500 to $2,999 | 0 (0.0%) | 0 (0.0%) |
| $3,000 or more | 0 (0.0%) | 0 (0.0%) |
| Total | 74 (100.0%) | 29 (100.0%) |
Physical Housing Characteristics in Rutledge
Housing Structures in Rutledge
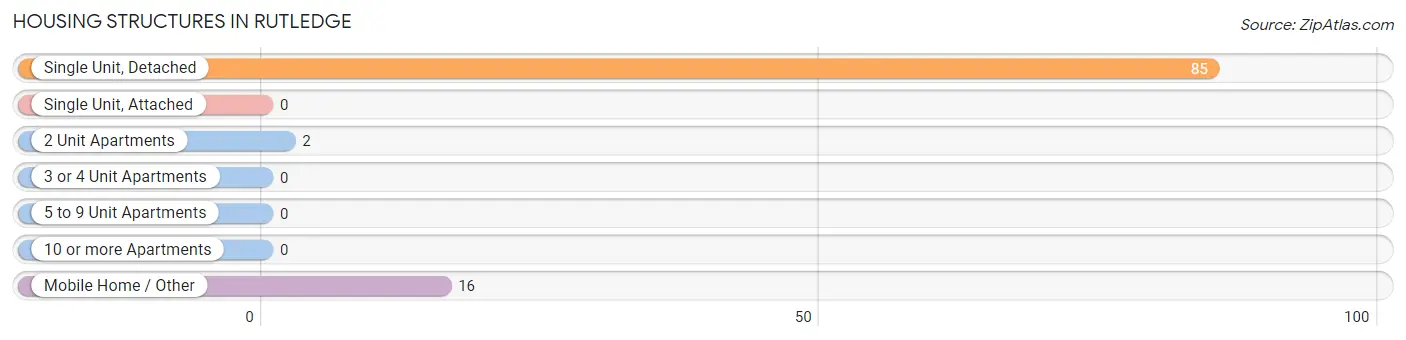
| Structure Type | # Housing Units | % Housing Units |
| Single Unit, Detached | 85 | 82.5% |
| Single Unit, Attached | 0 | 0.0% |
| 2 Unit Apartments | 2 | 1.9% |
| 3 or 4 Unit Apartments | 0 | 0.0% |
| 5 to 9 Unit Apartments | 0 | 0.0% |
| 10 or more Apartments | 0 | 0.0% |
| Mobile Home / Other | 16 | 15.5% |
| Total | 103 | 100.0% |
Housing Structures by Occupancy in Rutledge
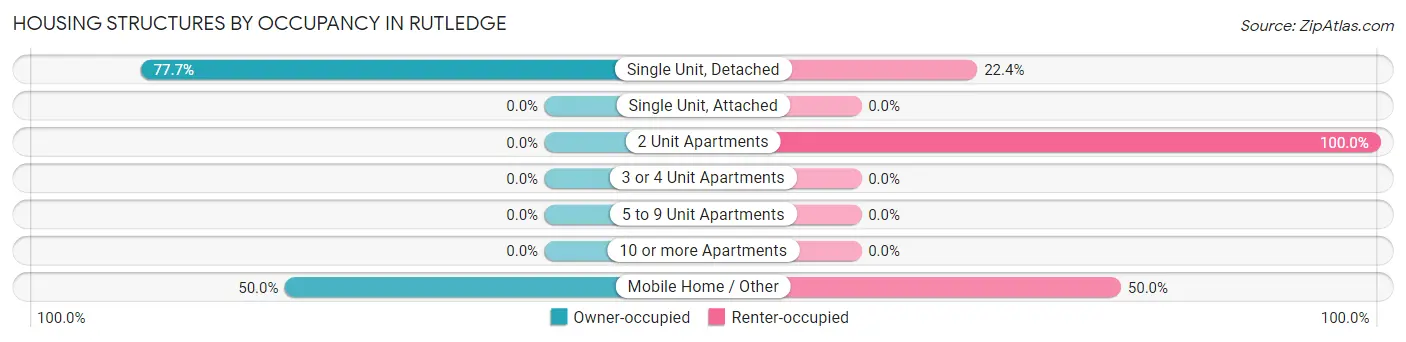
| Structure Type | Owner-occupied | Renter-occupied |
| Single Unit, Detached | 66 (77.6%) | 19 (22.4%) |
| Single Unit, Attached | 0 (0.0%) | 0 (0.0%) |
| 2 Unit Apartments | 0 (0.0%) | 2 (100.0%) |
| 3 or 4 Unit Apartments | 0 (0.0%) | 0 (0.0%) |
| 5 to 9 Unit Apartments | 0 (0.0%) | 0 (0.0%) |
| 10 or more Apartments | 0 (0.0%) | 0 (0.0%) |
| Mobile Home / Other | 8 (50.0%) | 8 (50.0%) |
| Total | 74 (71.8%) | 29 (28.2%) |
Housing Structures by Number of Rooms in Rutledge
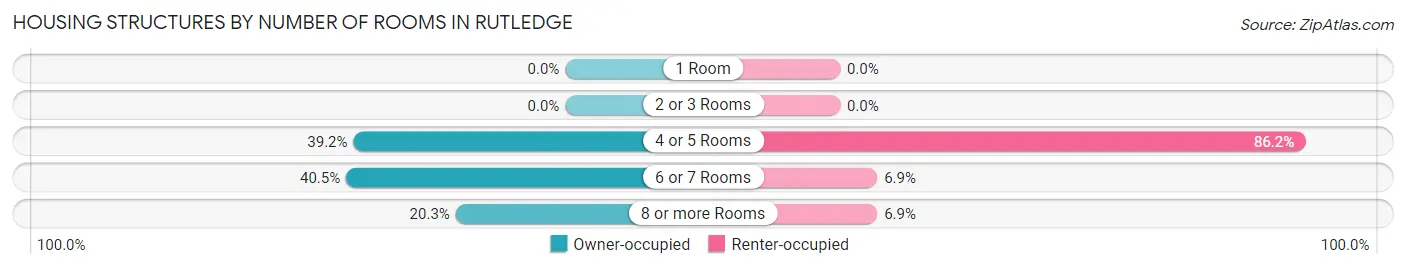
| Number of Rooms | Owner-occupied | Renter-occupied |
| 1 Room | 0 (0.0%) | 0 (0.0%) |
| 2 or 3 Rooms | 0 (0.0%) | 0 (0.0%) |
| 4 or 5 Rooms | 29 (39.2%) | 25 (86.2%) |
| 6 or 7 Rooms | 30 (40.5%) | 2 (6.9%) |
| 8 or more Rooms | 15 (20.3%) | 2 (6.9%) |
| Total | 74 (100.0%) | 29 (100.0%) |
Housing Structure by Heating Type in Rutledge
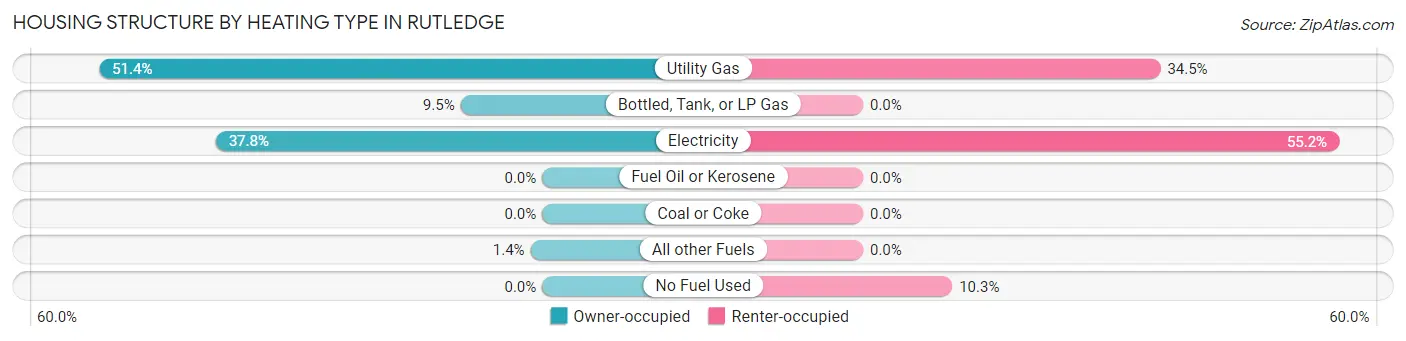
| Heating Type | Owner-occupied | Renter-occupied |
| Utility Gas | 38 (51.3%) | 10 (34.5%) |
| Bottled, Tank, or LP Gas | 7 (9.5%) | 0 (0.0%) |
| Electricity | 28 (37.8%) | 16 (55.2%) |
| Fuel Oil or Kerosene | 0 (0.0%) | 0 (0.0%) |
| Coal or Coke | 0 (0.0%) | 0 (0.0%) |
| All other Fuels | 1 (1.3%) | 0 (0.0%) |
| No Fuel Used | 0 (0.0%) | 3 (10.3%) |
| Total | 74 (100.0%) | 29 (100.0%) |
Household Vehicle Usage in Rutledge
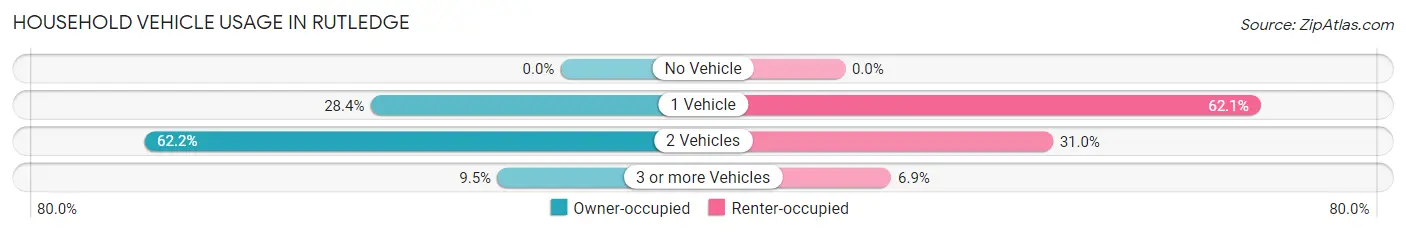
| Vehicles per Household | Owner-occupied | Renter-occupied |
| No Vehicle | 0 (0.0%) | 0 (0.0%) |
| 1 Vehicle | 21 (28.4%) | 18 (62.1%) |
| 2 Vehicles | 46 (62.2%) | 9 (31.0%) |
| 3 or more Vehicles | 7 (9.5%) | 2 (6.9%) |
| Total | 74 (100.0%) | 29 (100.0%) |
Real Estate & Mortgages in Rutledge
Real Estate and Mortgage Overview in Rutledge
| Characteristic | Without Mortgage | With Mortgage |
| Housing Units | 40 | 34 |
| Median Property Value | $47,800 | $120,000 |
| Median Household Income | $28,889 | $0 |
| Monthly Housing Costs | $320 | $0 |
| Real Estate Taxes | - | - |
Property Value by Mortgage Status in Rutledge
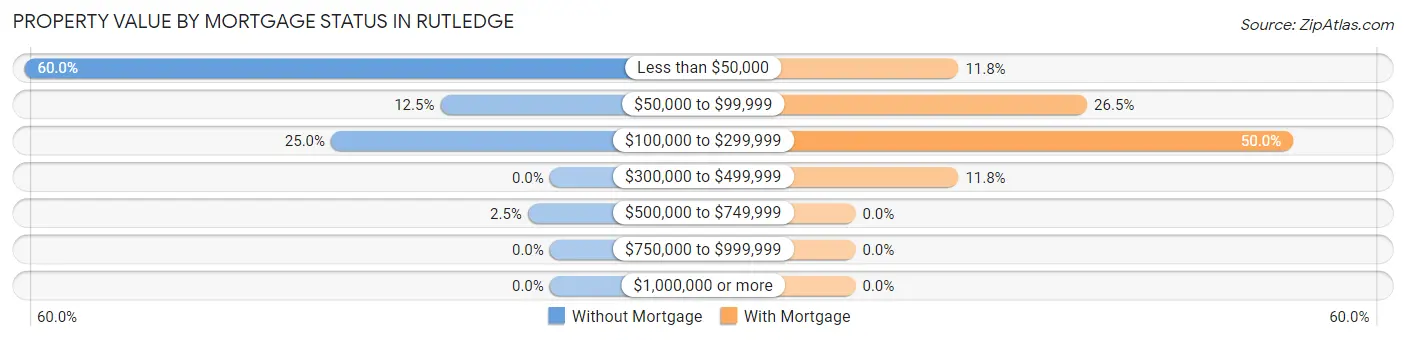
| Property Value | Without Mortgage | With Mortgage |
| Less than $50,000 | 24 (60.0%) | 4 (11.8%) |
| $50,000 to $99,999 | 5 (12.5%) | 9 (26.5%) |
| $100,000 to $299,999 | 10 (25.0%) | 17 (50.0%) |
| $300,000 to $499,999 | 0 (0.0%) | 4 (11.8%) |
| $500,000 to $749,999 | 1 (2.5%) | 0 (0.0%) |
| $750,000 to $999,999 | 0 (0.0%) | 0 (0.0%) |
| $1,000,000 or more | 0 (0.0%) | 0 (0.0%) |
| Total | 40 (100.0%) | 34 (100.0%) |
Household Income by Mortgage Status in Rutledge
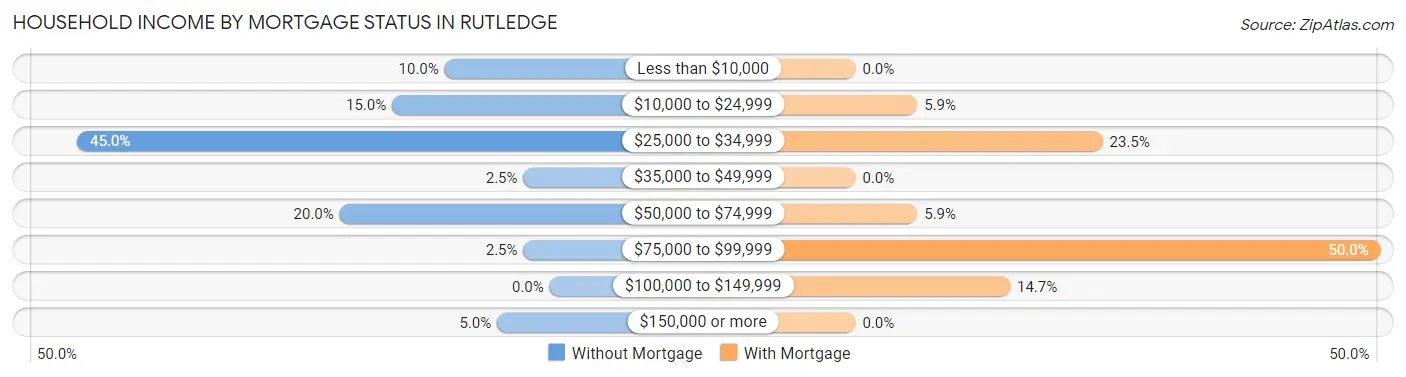
| Household Income | Without Mortgage | With Mortgage |
| Less than $10,000 | 4 (10.0%) | 0 (0.0%) |
| $10,000 to $24,999 | 6 (15.0%) | 2 (5.9%) |
| $25,000 to $34,999 | 18 (45.0%) | 8 (23.5%) |
| $35,000 to $49,999 | 1 (2.5%) | 0 (0.0%) |
| $50,000 to $74,999 | 8 (20.0%) | 2 (5.9%) |
| $75,000 to $99,999 | 1 (2.5%) | 17 (50.0%) |
| $100,000 to $149,999 | 0 (0.0%) | 5 (14.7%) |
| $150,000 or more | 2 (5.0%) | 0 (0.0%) |
| Total | 40 (100.0%) | 34 (100.0%) |
Property Value to Household Income Ratio in Rutledge
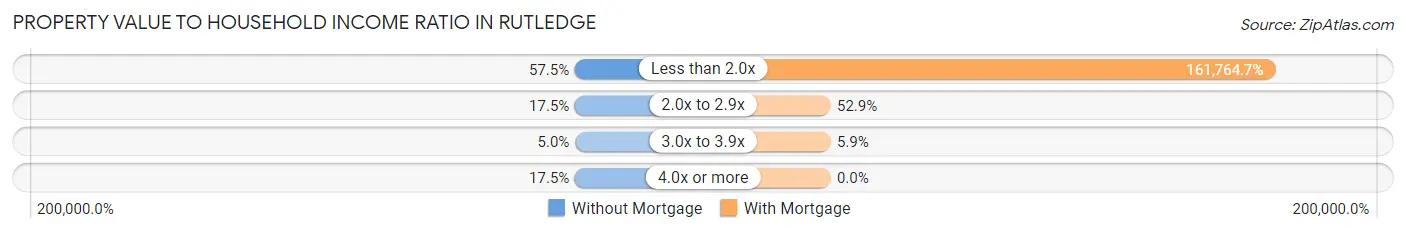
| Value-to-Income Ratio | Without Mortgage | With Mortgage |
| Less than 2.0x | 23 (57.5%) | 55,000 (161,764.7%) |
| 2.0x to 2.9x | 7 (17.5%) | 18 (52.9%) |
| 3.0x to 3.9x | 2 (5.0%) | 2 (5.9%) |
| 4.0x or more | 7 (17.5%) | 0 (0.0%) |
| Total | 40 (100.0%) | 34 (100.0%) |
Real Estate Taxes by Mortgage Status in Rutledge
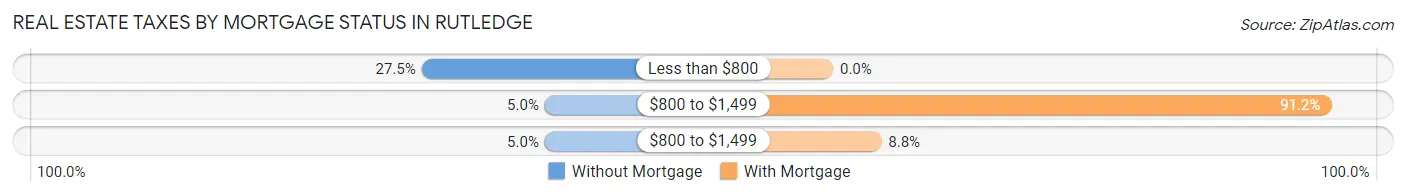
| Property Taxes | Without Mortgage | With Mortgage |
| Less than $800 | 11 (27.5%) | 0 (0.0%) |
| $800 to $1,499 | 2 (5.0%) | 31 (91.2%) |
| $800 to $1,499 | 2 (5.0%) | 3 (8.8%) |
| Total | 40 (100.0%) | 34 (100.0%) |
Health & Disability in Rutledge
Health Insurance Coverage by Age in Rutledge
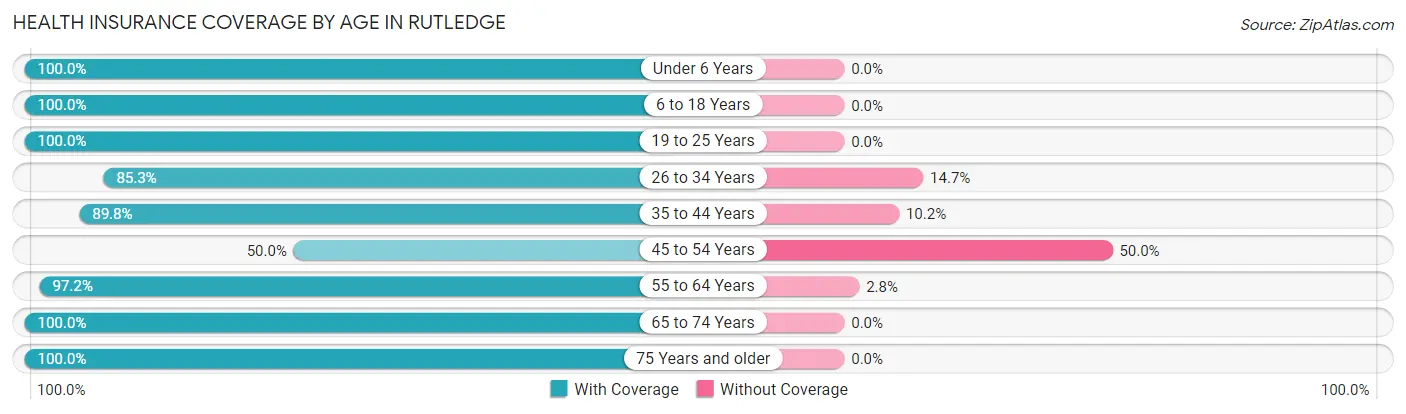
| Age Bracket | With Coverage | Without Coverage |
| Under 6 Years | 26 (100.0%) | 0 (0.0%) |
| 6 to 18 Years | 47 (100.0%) | 0 (0.0%) |
| 19 to 25 Years | 7 (100.0%) | 0 (0.0%) |
| 26 to 34 Years | 29 (85.3%) | 5 (14.7%) |
| 35 to 44 Years | 44 (89.8%) | 5 (10.2%) |
| 45 to 54 Years | 2 (50.0%) | 2 (50.0%) |
| 55 to 64 Years | 35 (97.2%) | 1 (2.8%) |
| 65 to 74 Years | 21 (100.0%) | 0 (0.0%) |
| 75 Years and older | 13 (100.0%) | 0 (0.0%) |
| Total | 224 (94.5%) | 13 (5.5%) |
Health Insurance Coverage by Citizenship Status in Rutledge
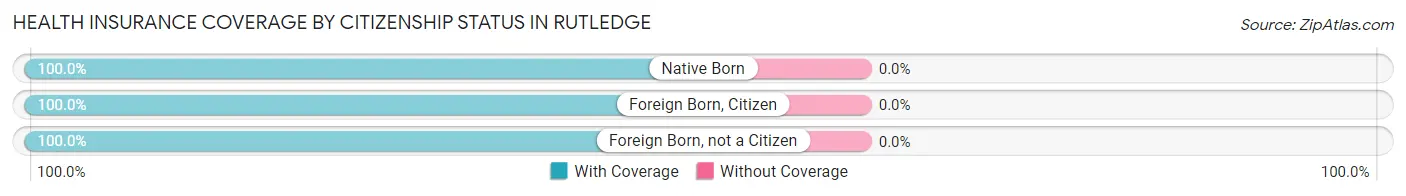
| Citizenship Status | With Coverage | Without Coverage |
| Native Born | 26 (100.0%) | 0 (0.0%) |
| Foreign Born, Citizen | 47 (100.0%) | 0 (0.0%) |
| Foreign Born, not a Citizen | 7 (100.0%) | 0 (0.0%) |
Health Insurance Coverage by Household Income in Rutledge
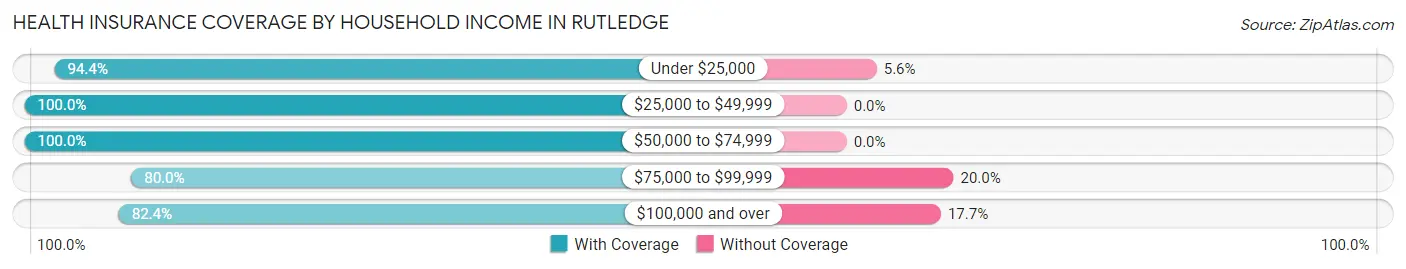
| Household Income | With Coverage | Without Coverage |
| Under $25,000 | 84 (94.4%) | 5 (5.6%) |
| $25,000 to $49,999 | 54 (100.0%) | 0 (0.0%) |
| $50,000 to $74,999 | 52 (100.0%) | 0 (0.0%) |
| $75,000 to $99,999 | 20 (80.0%) | 5 (20.0%) |
| $100,000 and over | 14 (82.4%) | 3 (17.6%) |
Public vs Private Health Insurance Coverage by Age in Rutledge
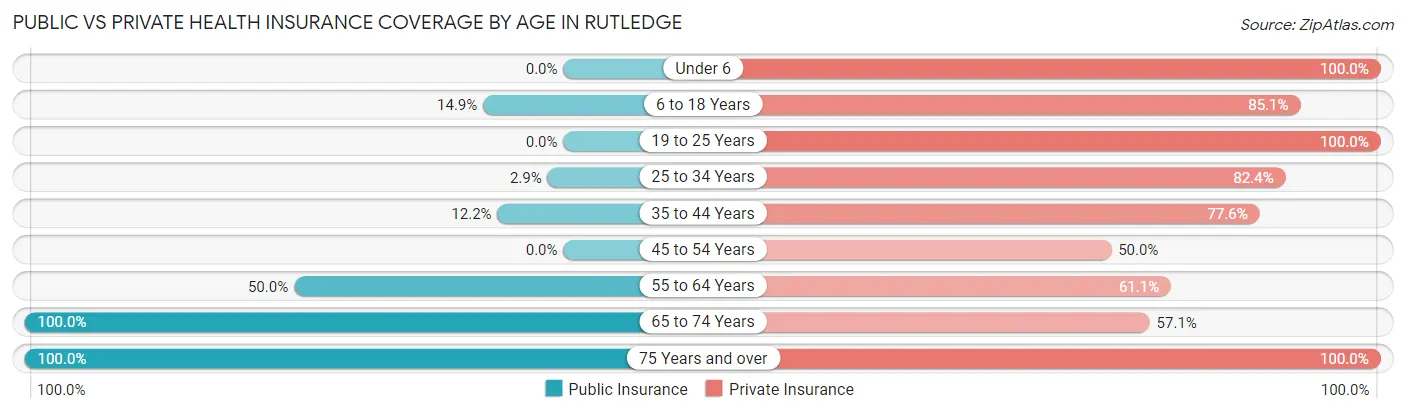
| Age Bracket | Public Insurance | Private Insurance |
| Under 6 | 0 (0.0%) | 26 (100.0%) |
| 6 to 18 Years | 7 (14.9%) | 40 (85.1%) |
| 19 to 25 Years | 0 (0.0%) | 7 (100.0%) |
| 25 to 34 Years | 1 (2.9%) | 28 (82.4%) |
| 35 to 44 Years | 6 (12.2%) | 38 (77.5%) |
| 45 to 54 Years | 0 (0.0%) | 2 (50.0%) |
| 55 to 64 Years | 18 (50.0%) | 22 (61.1%) |
| 65 to 74 Years | 21 (100.0%) | 12 (57.1%) |
| 75 Years and over | 13 (100.0%) | 13 (100.0%) |
| Total | 66 (27.9%) | 188 (79.3%) |
Disability Status by Sex by Age in Rutledge
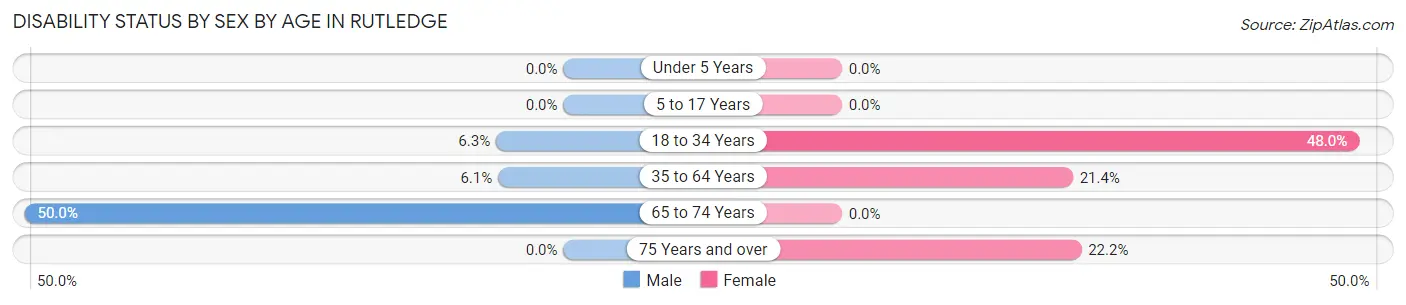
| Age Bracket | Male | Female |
| Under 5 Years | 0 (0.0%) | 0 (0.0%) |
| 5 to 17 Years | 0 (0.0%) | 0 (0.0%) |
| 18 to 34 Years | 1 (6.2%) | 12 (48.0%) |
| 35 to 64 Years | 2 (6.1%) | 12 (21.4%) |
| 65 to 74 Years | 5 (50.0%) | 0 (0.0%) |
| 75 Years and over | 0 (0.0%) | 2 (22.2%) |
Disability Class by Sex by Age in Rutledge
Disability Class: Hearing Difficulty
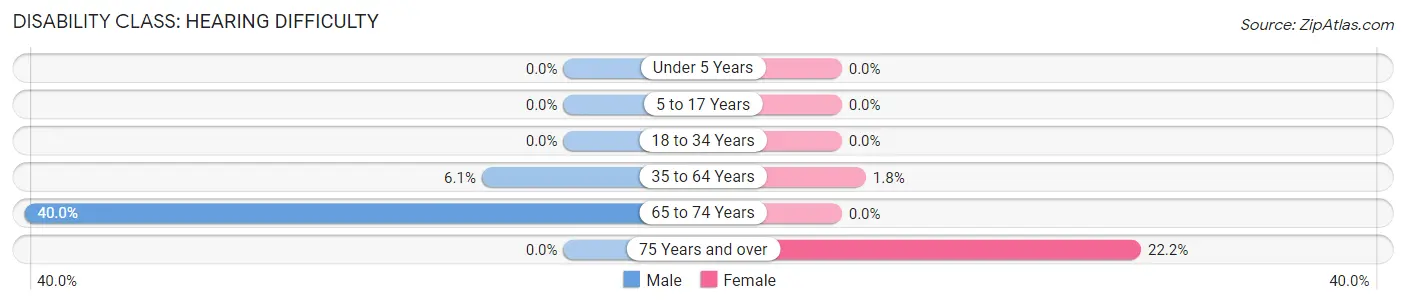
| Age Bracket | Male | Female |
| Under 5 Years | 0 (0.0%) | 0 (0.0%) |
| 5 to 17 Years | 0 (0.0%) | 0 (0.0%) |
| 18 to 34 Years | 0 (0.0%) | 0 (0.0%) |
| 35 to 64 Years | 2 (6.1%) | 1 (1.8%) |
| 65 to 74 Years | 4 (40.0%) | 0 (0.0%) |
| 75 Years and over | 0 (0.0%) | 2 (22.2%) |
Disability Class: Vision Difficulty
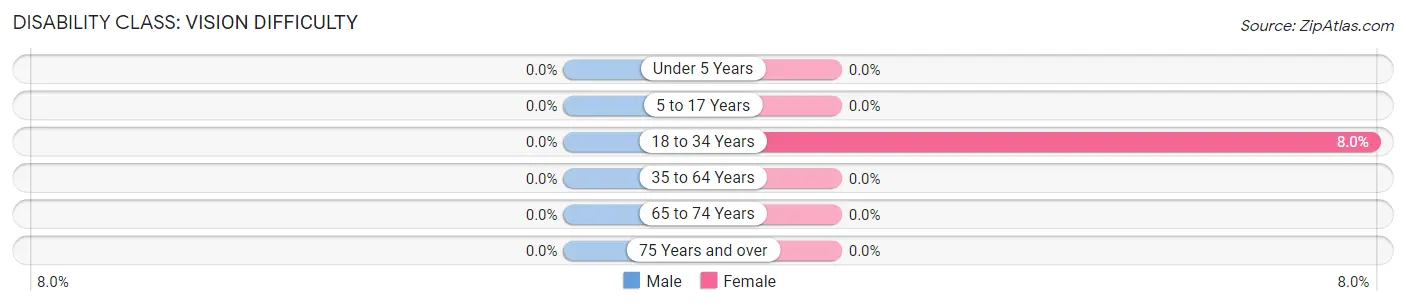
| Age Bracket | Male | Female |
| Under 5 Years | 0 (0.0%) | 0 (0.0%) |
| 5 to 17 Years | 0 (0.0%) | 0 (0.0%) |
| 18 to 34 Years | 0 (0.0%) | 2 (8.0%) |
| 35 to 64 Years | 0 (0.0%) | 0 (0.0%) |
| 65 to 74 Years | 0 (0.0%) | 0 (0.0%) |
| 75 Years and over | 0 (0.0%) | 0 (0.0%) |
Disability Class: Cognitive Difficulty
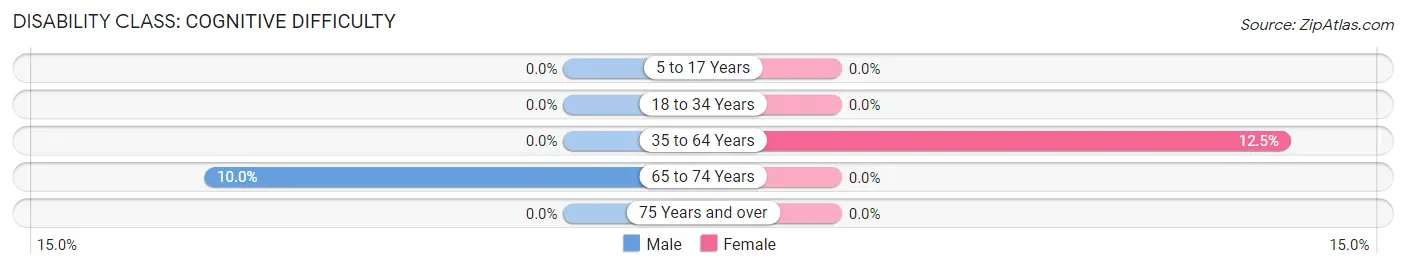
| Age Bracket | Male | Female |
| 5 to 17 Years | 0 (0.0%) | 0 (0.0%) |
| 18 to 34 Years | 0 (0.0%) | 0 (0.0%) |
| 35 to 64 Years | 0 (0.0%) | 7 (12.5%) |
| 65 to 74 Years | 1 (10.0%) | 0 (0.0%) |
| 75 Years and over | 0 (0.0%) | 0 (0.0%) |
Disability Class: Ambulatory Difficulty
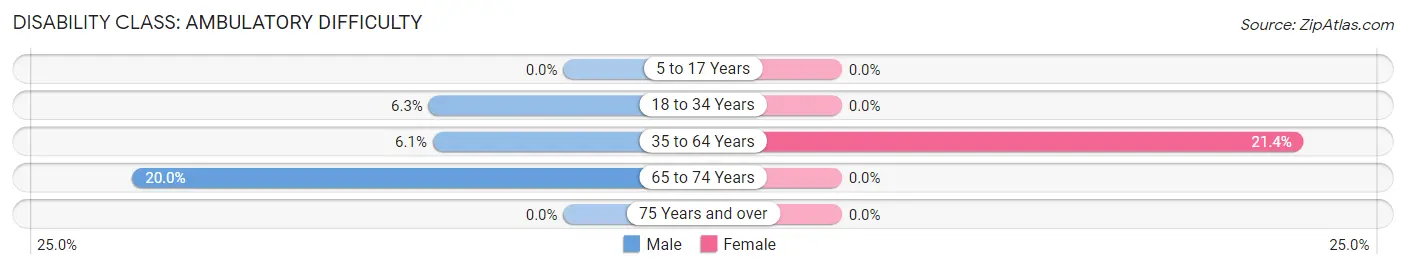
| Age Bracket | Male | Female |
| 5 to 17 Years | 0 (0.0%) | 0 (0.0%) |
| 18 to 34 Years | 1 (6.2%) | 0 (0.0%) |
| 35 to 64 Years | 2 (6.1%) | 12 (21.4%) |
| 65 to 74 Years | 2 (20.0%) | 0 (0.0%) |
| 75 Years and over | 0 (0.0%) | 0 (0.0%) |
Disability Class: Self-Care Difficulty
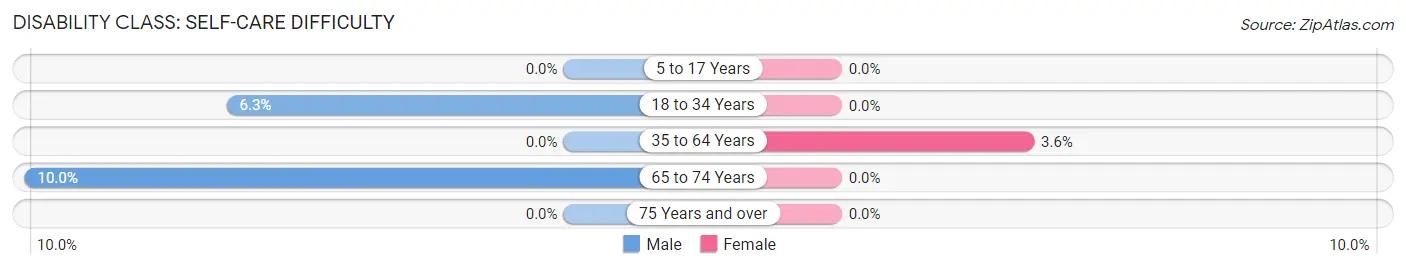
| Age Bracket | Male | Female |
| 5 to 17 Years | 0 (0.0%) | 0 (0.0%) |
| 18 to 34 Years | 1 (6.2%) | 0 (0.0%) |
| 35 to 64 Years | 0 (0.0%) | 2 (3.6%) |
| 65 to 74 Years | 1 (10.0%) | 0 (0.0%) |
| 75 Years and over | 0 (0.0%) | 0 (0.0%) |
Technology Access in Rutledge
Computing Device Access in Rutledge
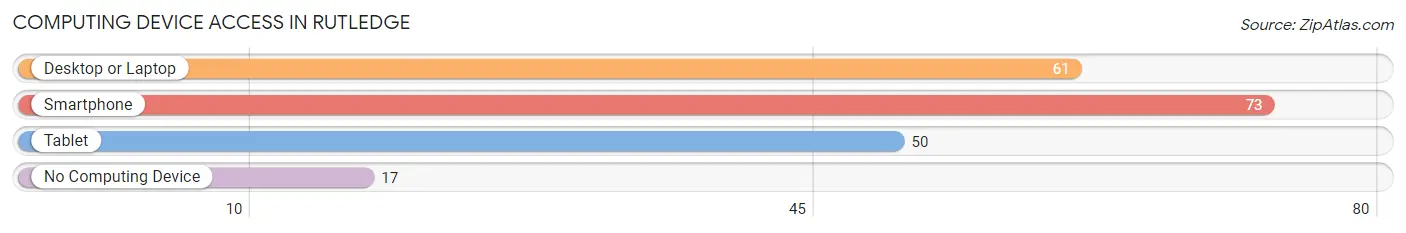
| Device Type | # Households | % Households |
| Desktop or Laptop | 61 | 59.2% |
| Smartphone | 73 | 70.9% |
| Tablet | 50 | 48.5% |
| No Computing Device | 17 | 16.5% |
| Total | 103 | 100.0% |
Internet Access in Rutledge
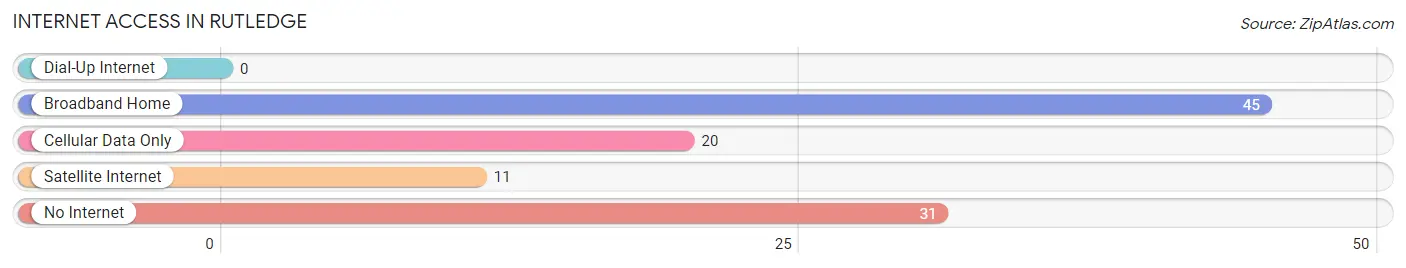
| Internet Type | # Households | % Households |
| Dial-Up Internet | 0 | 0.0% |
| Broadband Home | 45 | 43.7% |
| Cellular Data Only | 20 | 19.4% |
| Satellite Internet | 11 | 10.7% |
| No Internet | 31 | 30.1% |
| Total | 103 | 100.0% |
Rutledge Summary
Rutledge is a small town located in Morgan County, Alabama. It is situated in the foothills of the Appalachian Mountains and is part of the Huntsville-Decatur Combined Statistical Area. The town has a population of approximately 1,000 people and is known for its rural charm and friendly atmosphere.
History
Rutledge was founded in 1818 by a group of settlers from North Carolina. The town was named after the Rutledge family, who were among the first settlers. The town was originally a farming community, but in the late 19th century, it became a center for the timber industry. The town was also home to several sawmills and gristmills.
In the early 20th century, Rutledge began to experience a period of growth and development. The town was incorporated in 1915 and the first mayor was elected in 1916. The town was also home to several businesses, including a bank, a hotel, a general store, and a post office.
Geography
Rutledge is located in the foothills of the Appalachian Mountains in Morgan County, Alabama. The town is situated at the intersection of U.S. Highway 72 and Alabama State Route 36. The town is surrounded by rolling hills and forests, and is located approximately 25 miles east of Huntsville.
Economy
Rutledge is a small, rural town with a population of approximately 1,000 people. The town is home to several small businesses, including a bank, a hotel, a general store, and a post office. The town is also home to several farms and ranches, and is a popular destination for hunting and fishing.
Demographics
As of the 2010 census, the population of Rutledge was 1,000 people. The racial makeup of the town was 97.2% White, 0.7% African American, 0.3% Native American, 0.2% Asian, 0.1% Pacific Islander, and 1.5% from other races. The median household income was $30,000, and the median family income was $35,000. The per capita income was $14,000.
Conclusion
Rutledge is a small, rural town located in Morgan County, Alabama. The town has a population of approximately 1,000 people and is known for its rural charm and friendly atmosphere. The town is home to several small businesses, farms, and ranches, and is a popular destination for hunting and fishing. The town has a diverse population and a median household income of $30,000.
Common Questions
What is Per Capita Income in Rutledge?
Per Capita income in Rutledge is $42,326.
What is the Median Family Income in Rutledge?
Median Family Income in Rutledge is $29,297.
What is Income or Wage Gap in Rutledge?
Income or Wage Gap in Rutledge is 42.2%.
Women in Rutledge earn 57.8 cents for every dollar earned by a man.
What is Inequality or Gini Index in Rutledge?
Inequality or Gini Index in Rutledge is 0.57.
What is the Total Population of Rutledge?
Total Population of Rutledge is 237.
What is the Total Male Population of Rutledge?
Total Male Population of Rutledge is 75.
What is the Total Female Population of Rutledge?
Total Female Population of Rutledge is 162.
What is the Ratio of Males per 100 Females in Rutledge?
There are 46.30 Males per 100 Females in Rutledge.
What is the Ratio of Females per 100 Males in Rutledge?
There are 216.00 Females per 100 Males in Rutledge.
What is the Median Population Age in Rutledge?
Median Population Age in Rutledge is 37.3 Years.
What is the Average Family Size in Rutledge
Average Family Size in Rutledge is 3.0 People.
What is the Average Household Size in Rutledge
Average Household Size in Rutledge is 2.3 People.
How Large is the Labor Force in Rutledge?
There are 101 People in the Labor Forcein in Rutledge.
What is the Percentage of People in the Labor Force in Rutledge?
61.6% of People are in the Labor Force in Rutledge.