Sanford, AL Map & Demographics
Sanford Map
Sanford Overview
$15,533
PER CAPITA INCOME
$38,333
AVG FAMILY INCOME
47.6%
WAGE / INCOME GAP [ % ]
52.4¢/ $1
WAGE / INCOME GAP [ $ ]
0.46
INEQUALITY / GINI INDEX
273
TOTAL POPULATION
143
MALE POPULATION
130
FEMALE POPULATION
110.00
MALES / 100 FEMALES
90.91
FEMALES / 100 MALES
35.9
MEDIAN AGE
3.1
AVG FAMILY SIZE
2.8
AVG HOUSEHOLD SIZE
84
LABOR FORCE [ PEOPLE ]
39.3%
PERCENT IN LABOR FORCE
3.6%
UNEMPLOYMENT RATE
Sanford Area Codes
Income in Sanford
Income Overview in Sanford
| Characteristic | Number | Measure |
| Per Capita Income | 273 | $15,533 |
| Median Family Income | 84 | $38,333 |
| Mean Family Income | 84 | $44,075 |
| Median Household Income | 96 | $0 |
| Mean Household Income | 96 | $41,974 |
| Income Deficit | 84 | $0 |
| Wage / Income Gap (%) | 273 | 47.62% |
| Wage / Income Gap ($) | 273 | 52.38¢ per $1 |
| Gini / Inequality Index | 273 | 0.46 |
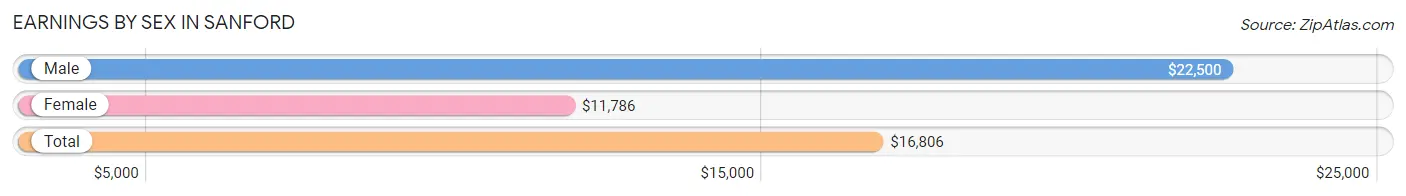
Earnings by Sex in Sanford
Average Earnings in Sanford are $16,806, $22,500 for men and $11,786 for women, a difference of 47.6%.
| Sex | Number | Average Earnings |
| Male | 44 (52.4%) | $22,500 |
| Female | 40 (47.6%) | $11,786 |
| Total | 84 (100.0%) | $16,806 |
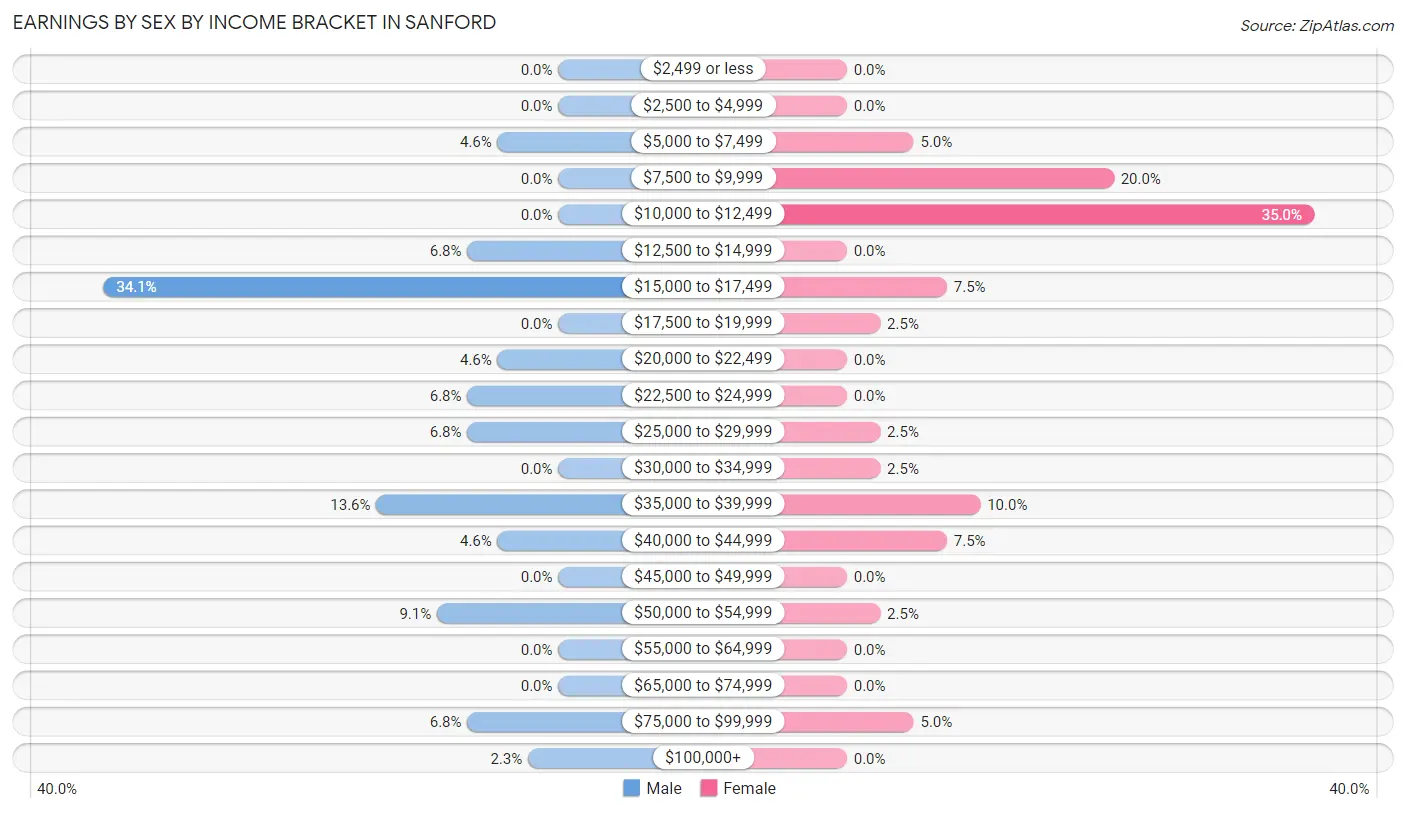
Earnings by Sex by Income Bracket in Sanford
The most common earnings brackets in Sanford are $15,000 to $17,499 for men (15 | 34.1%) and $10,000 to $12,499 for women (14 | 35.0%).
| Income | Male | Female |
| $2,499 or less | 0 (0.0%) | 0 (0.0%) |
| $2,500 to $4,999 | 0 (0.0%) | 0 (0.0%) |
| $5,000 to $7,499 | 2 (4.5%) | 2 (5.0%) |
| $7,500 to $9,999 | 0 (0.0%) | 8 (20.0%) |
| $10,000 to $12,499 | 0 (0.0%) | 14 (35.0%) |
| $12,500 to $14,999 | 3 (6.8%) | 0 (0.0%) |
| $15,000 to $17,499 | 15 (34.1%) | 3 (7.5%) |
| $17,500 to $19,999 | 0 (0.0%) | 1 (2.5%) |
| $20,000 to $22,499 | 2 (4.5%) | 0 (0.0%) |
| $22,500 to $24,999 | 3 (6.8%) | 0 (0.0%) |
| $25,000 to $29,999 | 3 (6.8%) | 1 (2.5%) |
| $30,000 to $34,999 | 0 (0.0%) | 1 (2.5%) |
| $35,000 to $39,999 | 6 (13.6%) | 4 (10.0%) |
| $40,000 to $44,999 | 2 (4.5%) | 3 (7.5%) |
| $45,000 to $49,999 | 0 (0.0%) | 0 (0.0%) |
| $50,000 to $54,999 | 4 (9.1%) | 1 (2.5%) |
| $55,000 to $64,999 | 0 (0.0%) | 0 (0.0%) |
| $65,000 to $74,999 | 0 (0.0%) | 0 (0.0%) |
| $75,000 to $99,999 | 3 (6.8%) | 2 (5.0%) |
| $100,000+ | 1 (2.3%) | 0 (0.0%) |
| Total | 44 (100.0%) | 40 (100.0%) |
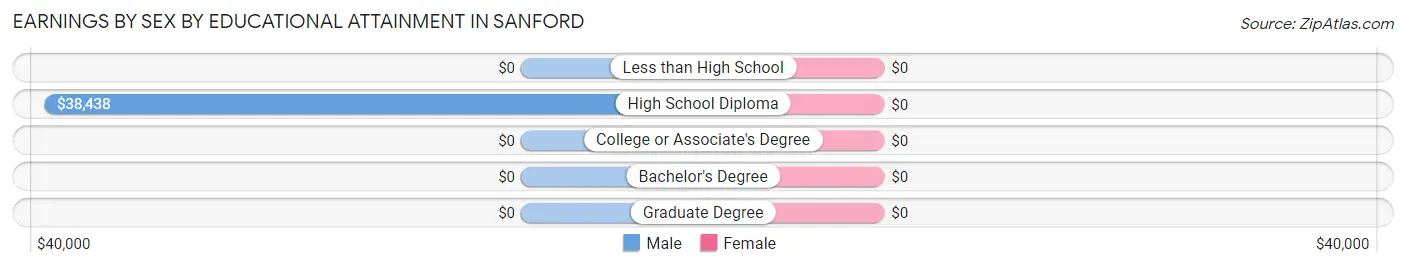
Earnings by Sex by Educational Attainment in Sanford
| Educational Attainment | Male Income | Female Income |
| Less than High School | - | - |
| High School Diploma | $38,438 | $0 |
| College or Associate's Degree | - | - |
| Bachelor's Degree | - | - |
| Graduate Degree | - | - |
| Total | $25,000 | $0 |
Family Income in Sanford
Family Income Brackets in Sanford
According to the Sanford family income data, there are 17 families falling into the $10,000 to $14,999 income range, which is the most common income bracket and makes up 20.2% of all families. Conversely, the $150,000 to $199,999 income bracket is the least frequent group with only 1 families (1.2%) belonging to this category.
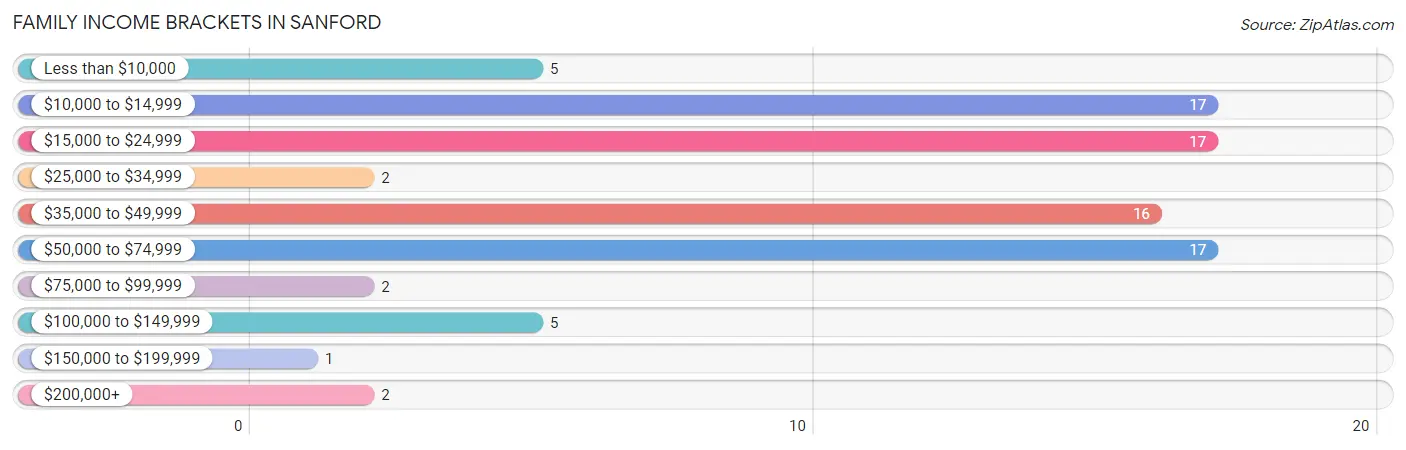
| Income Bracket | # Families | % Families |
| Less than $10,000 | 5 | 6.0% |
| $10,000 to $14,999 | 17 | 20.2% |
| $15,000 to $24,999 | 17 | 20.2% |
| $25,000 to $34,999 | 2 | 2.4% |
| $35,000 to $49,999 | 16 | 19.0% |
| $50,000 to $74,999 | 17 | 20.2% |
| $75,000 to $99,999 | 2 | 2.4% |
| $100,000 to $149,999 | 5 | 6.0% |
| $150,000 to $199,999 | 1 | 1.2% |
| $200,000+ | 2 | 2.4% |
Family Income by Famaliy Size in Sanford
2-person families (55 | 65.5%) account for the highest median family income in Sanford with $48,875 per family, while 2-person families (55 | 65.5%) have the highest median income of $24,438 per family member.
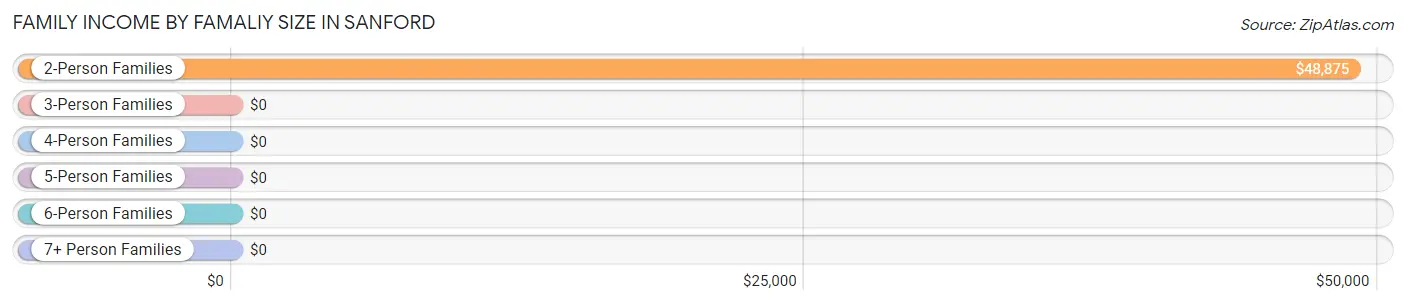
| Income Bracket | # Families | Median Income |
| 2-Person Families | 55 (65.5%) | $48,875 |
| 3-Person Families | 9 (10.7%) | $0 |
| 4-Person Families | 15 (17.9%) | $0 |
| 5-Person Families | 2 (2.4%) | $0 |
| 6-Person Families | 0 (0.0%) | $0 |
| 7+ Person Families | 3 (3.6%) | $0 |
| Total | 84 (100.0%) | $38,333 |
Family Income by Number of Earners in Sanford
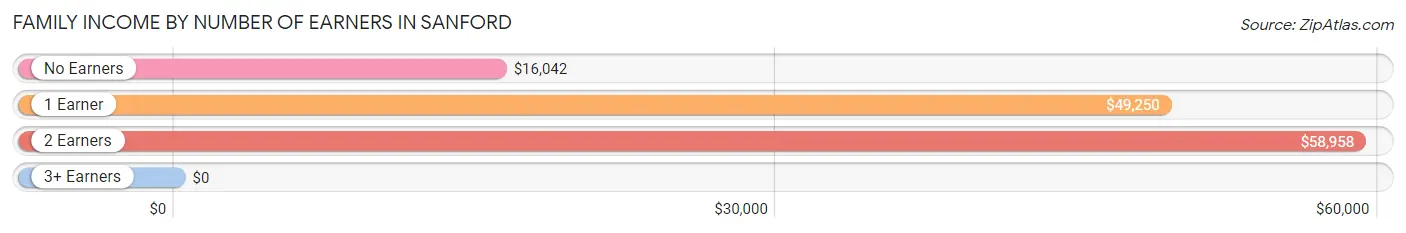
| Number of Earners | # Families | Median Income |
| No Earners | 37 (44.1%) | $16,042 |
| 1 Earner | 30 (35.7%) | $49,250 |
| 2 Earners | 15 (17.9%) | $58,958 |
| 3+ Earners | 2 (2.4%) | $0 |
| Total | 84 (100.0%) | $38,333 |
Household Income in Sanford
Household Income Brackets in Sanford
With 21 households falling in the category, the $10,000 to $14,999 income range is the most frequent in Sanford, accounting for 21.9% of all households. In contrast, only 1 households (1.0%) fall into the $150,000 to $199,999 income bracket, making it the least populous group.
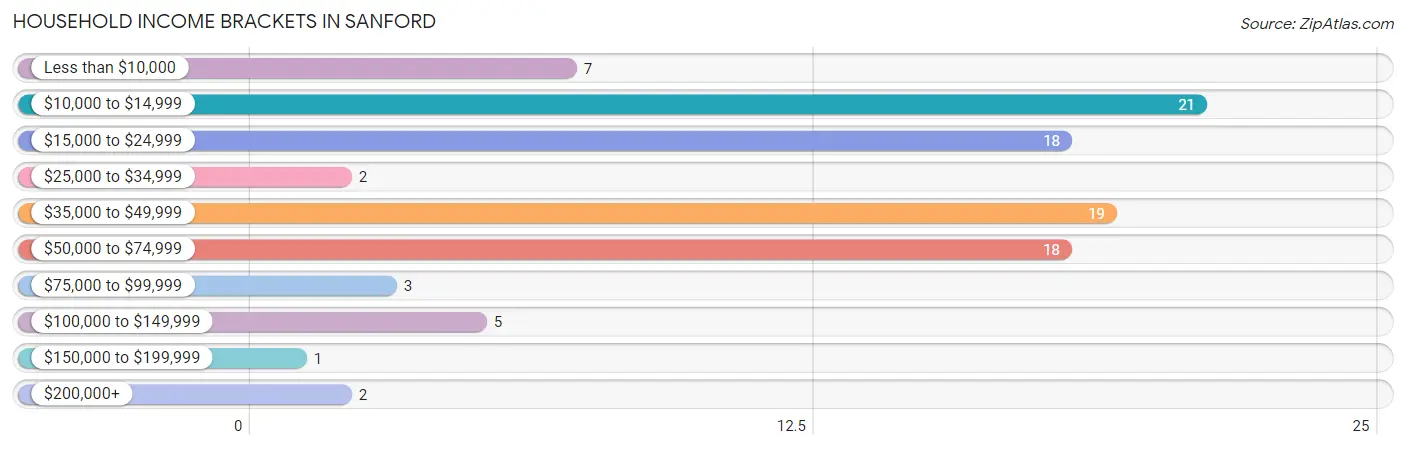
| Income Bracket | # Households | % Households |
| Less than $10,000 | 7 | 7.3% |
| $10,000 to $14,999 | 21 | 21.9% |
| $15,000 to $24,999 | 18 | 18.8% |
| $25,000 to $34,999 | 2 | 2.1% |
| $35,000 to $49,999 | 19 | 19.8% |
| $50,000 to $74,999 | 18 | 18.8% |
| $75,000 to $99,999 | 3 | 3.1% |
| $100,000 to $149,999 | 5 | 5.2% |
| $150,000 to $199,999 | 1 | 1.0% |
| $200,000+ | 2 | 2.1% |
Household Income by Householder Age in Sanford
The median household income in Sanford is $0, with the highest median household income of $53,000 found in the 45 to 64 years age bracket for the primary householder. A total of 32 households (33.3%) fall into this category.
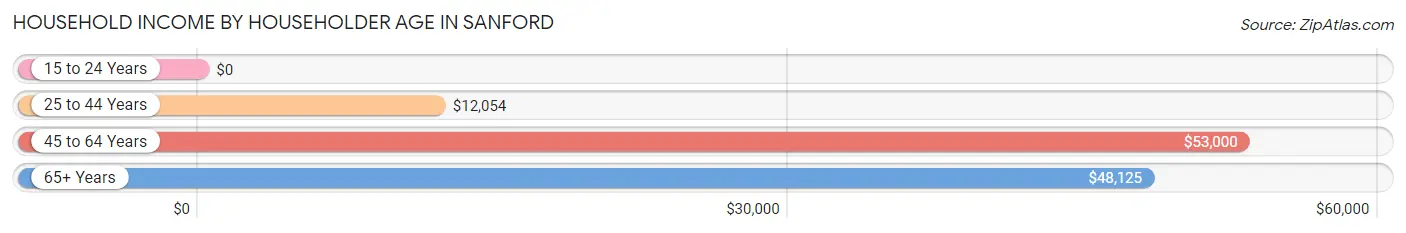
| Income Bracket | # Households | Median Income |
| 15 to 24 Years | 0 (0.0%) | $0 |
| 25 to 44 Years | 33 (34.4%) | $12,054 |
| 45 to 64 Years | 32 (33.3%) | $53,000 |
| 65+ Years | 31 (32.3%) | $48,125 |
| Total | 96 (100.0%) | $0 |
Poverty in Sanford
Income Below Poverty by Sex and Age in Sanford
With 52.4% poverty level for males and 46.9% for females among the residents of Sanford, 16 and 17 year old males and under 5 year old females are the most vulnerable to poverty, with 20 males (100.0%) and 22 females (100.0%) in their respective age groups living below the poverty level.
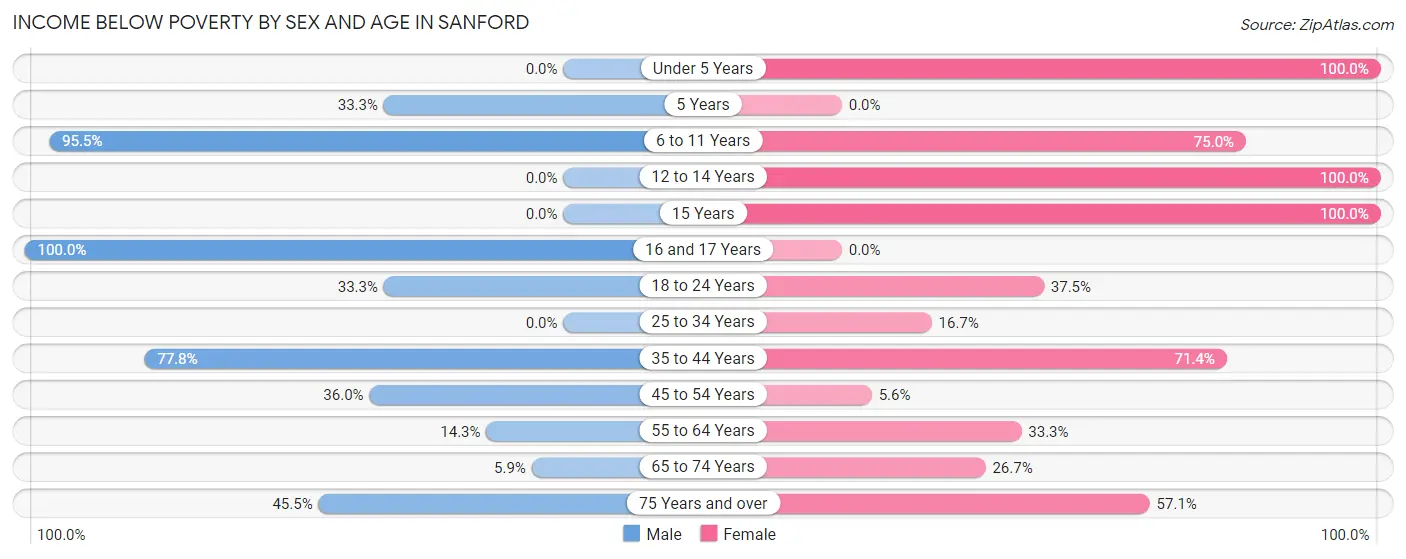
| Age Bracket | Male | Female |
| Under 5 Years | 0 (0.0%) | 22 (100.0%) |
| 5 Years | 1 (33.3%) | 0 (0.0%) |
| 6 to 11 Years | 21 (95.5%) | 6 (75.0%) |
| 12 to 14 Years | 0 (0.0%) | 1 (100.0%) |
| 15 Years | 0 (0.0%) | 1 (100.0%) |
| 16 and 17 Years | 20 (100.0%) | 0 (0.0%) |
| 18 to 24 Years | 3 (33.3%) | 3 (37.5%) |
| 25 to 34 Years | 0 (0.0%) | 3 (16.7%) |
| 35 to 44 Years | 14 (77.8%) | 10 (71.4%) |
| 45 to 54 Years | 9 (36.0%) | 1 (5.6%) |
| 55 to 64 Years | 1 (14.3%) | 6 (33.3%) |
| 65 to 74 Years | 1 (5.9%) | 4 (26.7%) |
| 75 Years and over | 5 (45.5%) | 4 (57.1%) |
| Total | 75 (52.4%) | 61 (46.9%) |
Income Above Poverty by Sex and Age in Sanford
According to the poverty statistics in Sanford, males aged under 5 years and females aged 45 to 54 years are the age groups that are most secure financially, with 100.0% of males and 94.4% of females in these age groups living above the poverty line.
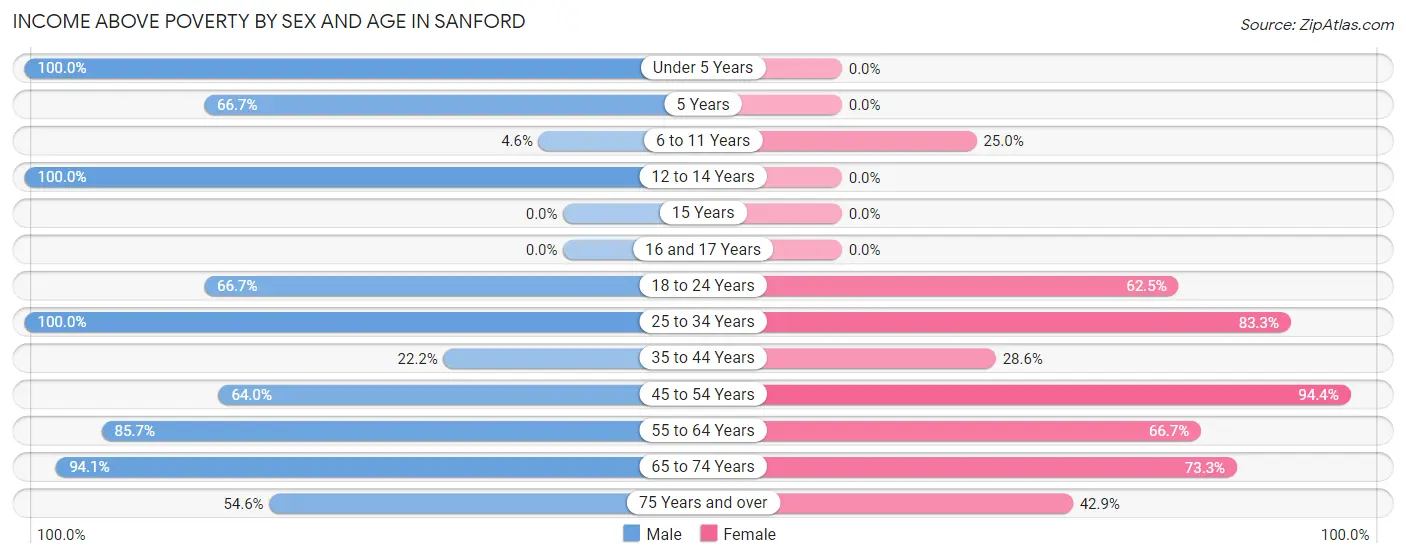
| Age Bracket | Male | Female |
| Under 5 Years | 1 (100.0%) | 0 (0.0%) |
| 5 Years | 2 (66.7%) | 0 (0.0%) |
| 6 to 11 Years | 1 (4.5%) | 2 (25.0%) |
| 12 to 14 Years | 1 (100.0%) | 0 (0.0%) |
| 15 Years | 0 (0.0%) | 0 (0.0%) |
| 16 and 17 Years | 0 (0.0%) | 0 (0.0%) |
| 18 to 24 Years | 6 (66.7%) | 5 (62.5%) |
| 25 to 34 Years | 9 (100.0%) | 15 (83.3%) |
| 35 to 44 Years | 4 (22.2%) | 4 (28.6%) |
| 45 to 54 Years | 16 (64.0%) | 17 (94.4%) |
| 55 to 64 Years | 6 (85.7%) | 12 (66.7%) |
| 65 to 74 Years | 16 (94.1%) | 11 (73.3%) |
| 75 Years and over | 6 (54.5%) | 3 (42.9%) |
| Total | 68 (47.5%) | 69 (53.1%) |
Income Below Poverty Among Married-Couple Families in Sanford
The poverty statistics for married-couple families in Sanford show that 28.6% or 14 of the total 49 families live below the poverty line. Families with 5 or more children have the highest poverty rate of 100.0%, comprising of 1 families. On the other hand, families with 1 or 2 children have the lowest poverty rate of 0.0%, which includes 0 families.
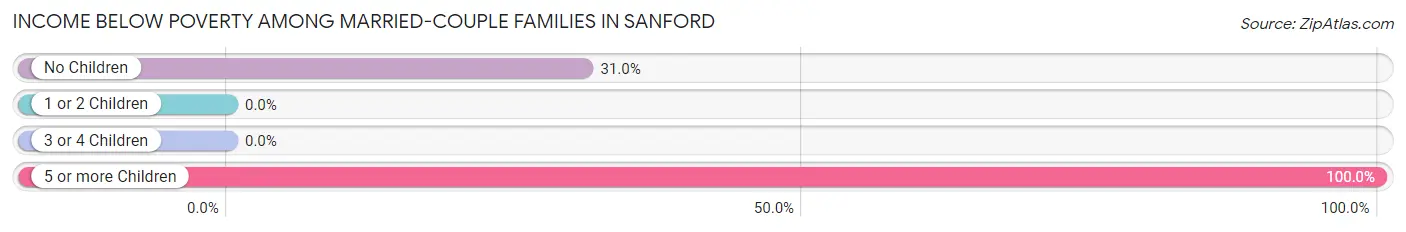
| Children | Above Poverty | Below Poverty |
| No Children | 29 (69.1%) | 13 (30.9%) |
| 1 or 2 Children | 6 (100.0%) | 0 (0.0%) |
| 3 or 4 Children | 0 (0.0%) | 0 (0.0%) |
| 5 or more Children | 0 (0.0%) | 1 (100.0%) |
| Total | 35 (71.4%) | 14 (28.6%) |
Income Below Poverty Among Single-Parent Households in Sanford
According to the poverty data in Sanford, 51.8% or 14 single-father households and 75.0% or 6 single-mother households are living below the poverty line. Among single-father households, those with 3 or 4 children have the highest poverty rate, with 14 households (100.0%) experiencing poverty. Likewise, among single-mother households, those with no children have the highest poverty rate, with 1 households (100.0%) falling below the poverty line.
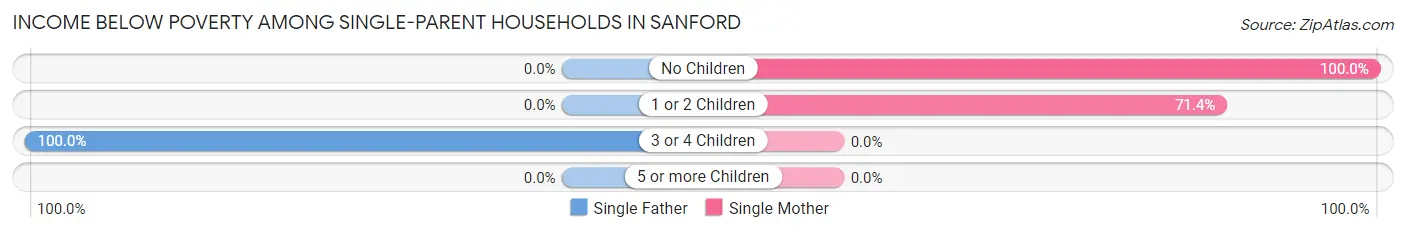
| Children | Single Father | Single Mother |
| No Children | 0 (0.0%) | 1 (100.0%) |
| 1 or 2 Children | 0 (0.0%) | 5 (71.4%) |
| 3 or 4 Children | 14 (100.0%) | 0 (0.0%) |
| 5 or more Children | 0 (0.0%) | 0 (0.0%) |
| Total | 14 (51.8%) | 6 (75.0%) |
Income Below Poverty Among Married-Couple vs Single-Parent Households in Sanford
The poverty data for Sanford shows that 14 of the married-couple family households (28.6%) and 20 of the single-parent households (57.1%) are living below the poverty level. Within the married-couple family households, those with 5 or more children have the highest poverty rate, with 1 households (100.0%) falling below the poverty line. Among the single-parent households, those with 3 or 4 children have the highest poverty rate, with 14 household (100.0%) living below poverty.
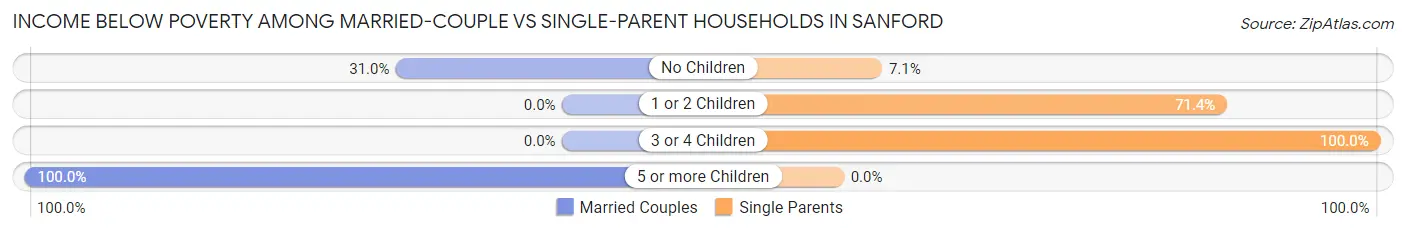
| Children | Married-Couple Families | Single-Parent Households |
| No Children | 13 (30.9%) | 1 (7.1%) |
| 1 or 2 Children | 0 (0.0%) | 5 (71.4%) |
| 3 or 4 Children | 0 (0.0%) | 14 (100.0%) |
| 5 or more Children | 1 (100.0%) | 0 (0.0%) |
| Total | 14 (28.6%) | 20 (57.1%) |
Race in Sanford
The most populous races in Sanford are White / Caucasian (259 | 94.9%), Hispanic or Latino (40 | 14.6%), and Two or more Races (14 | 5.1%).
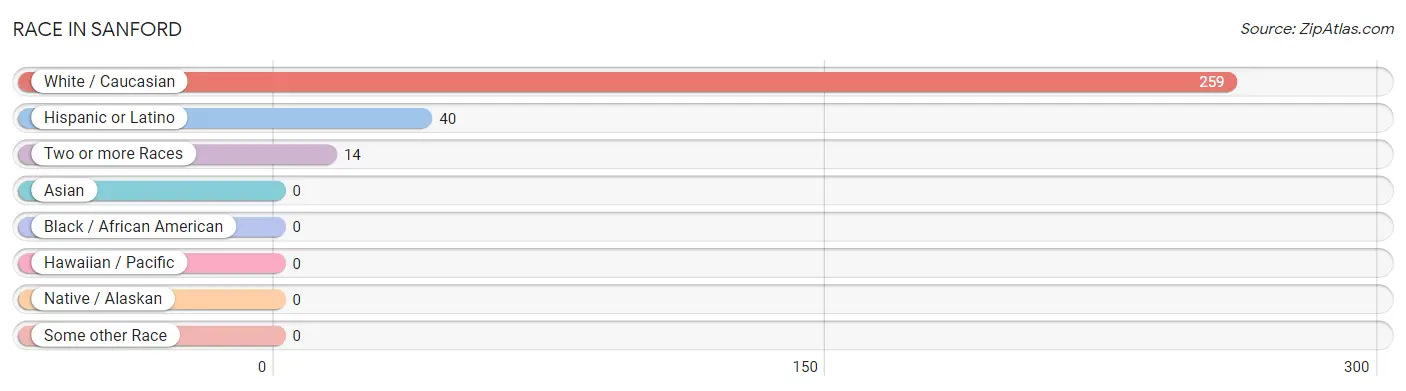
| Race | # Population | % Population |
| Asian | 0 | 0.0% |
| Black / African American | 0 | 0.0% |
| Hawaiian / Pacific | 0 | 0.0% |
| Hispanic or Latino | 40 | 14.6% |
| Native / Alaskan | 0 | 0.0% |
| White / Caucasian | 259 | 94.9% |
| Two or more Races | 14 | 5.1% |
| Some other Race | 0 | 0.0% |
| Total | 273 | 100.0% |
Ancestry in Sanford
The most populous ancestries reported in Sanford are Mexican (40 | 14.6%), American (21 | 7.7%), English (14 | 5.1%), French (14 | 5.1%), and Irish (11 | 4.0%), together accounting for 36.6% of all Sanford residents.
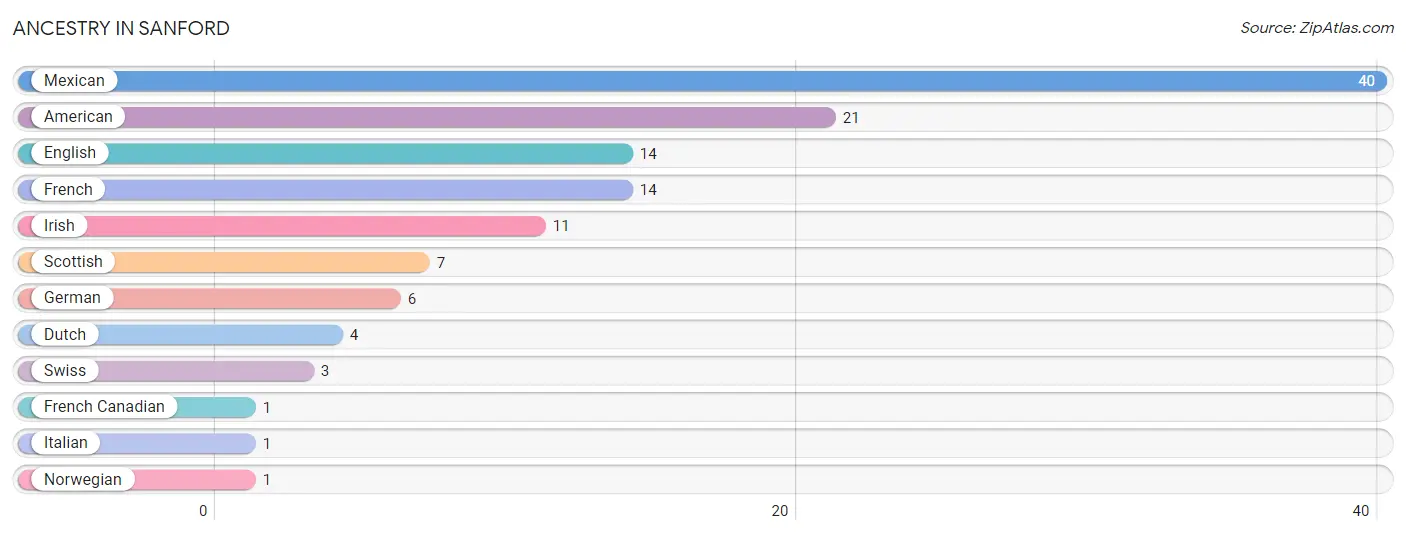
| Ancestry | # Population | % Population |
| American | 21 | 7.7% |
| Dutch | 4 | 1.5% |
| English | 14 | 5.1% |
| French | 14 | 5.1% |
| French Canadian | 1 | 0.4% |
| German | 6 | 2.2% |
| Irish | 11 | 4.0% |
| Italian | 1 | 0.4% |
| Mexican | 40 | 14.6% |
| Norwegian | 1 | 0.4% |
| Scottish | 7 | 2.6% |
| Swiss | 3 | 1.1% | View All 12 Rows |
Immigrants in Sanford

| Immigration Origin | # Population | % Population | View All 0 Rows |
Sex and Age in Sanford
Sex and Age in Sanford
The most populous age groups in Sanford are 5 to 9 Years (25 | 17.5%) for men and Under 5 Years (22 | 16.9%) for women.
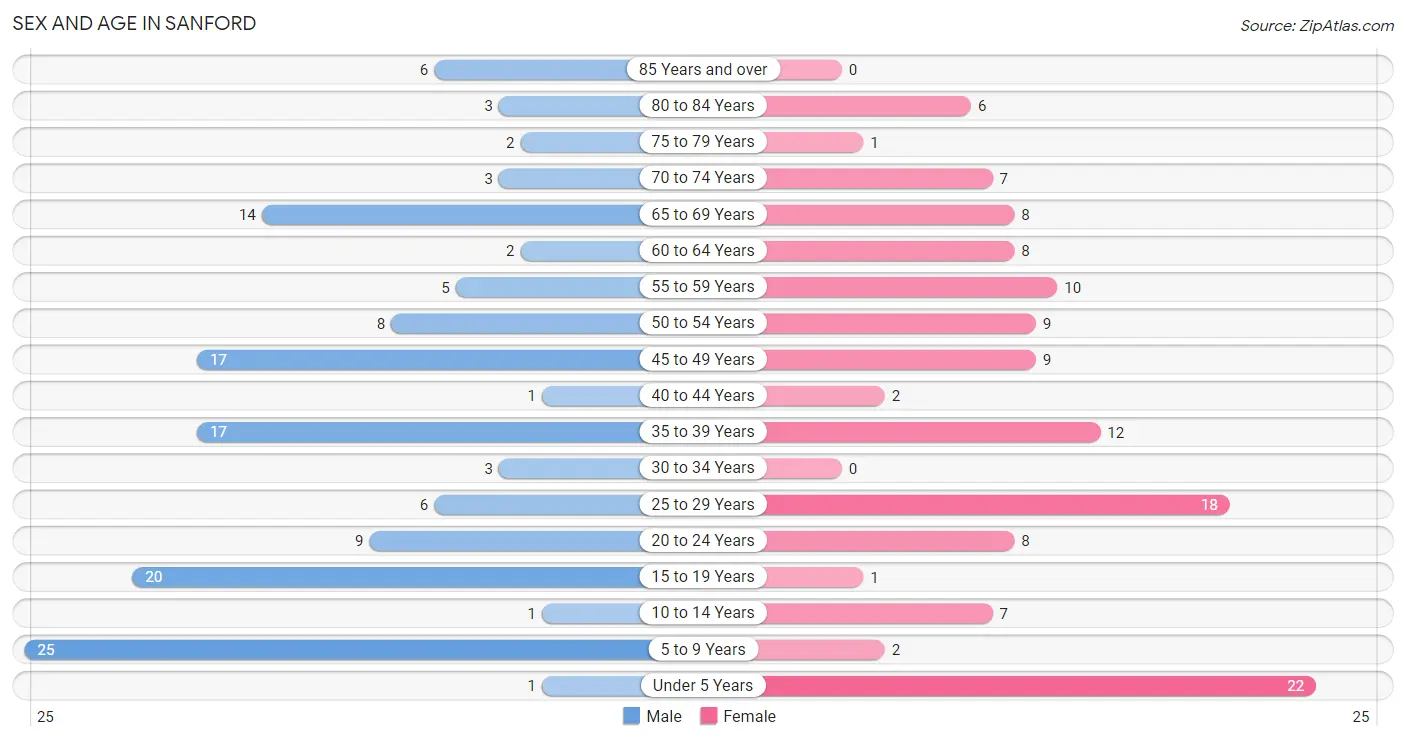
| Age Bracket | Male | Female |
| Under 5 Years | 1 (0.7%) | 22 (16.9%) |
| 5 to 9 Years | 25 (17.5%) | 2 (1.5%) |
| 10 to 14 Years | 1 (0.7%) | 7 (5.4%) |
| 15 to 19 Years | 20 (14.0%) | 1 (0.8%) |
| 20 to 24 Years | 9 (6.3%) | 8 (6.1%) |
| 25 to 29 Years | 6 (4.2%) | 18 (13.9%) |
| 30 to 34 Years | 3 (2.1%) | 0 (0.0%) |
| 35 to 39 Years | 17 (11.9%) | 12 (9.2%) |
| 40 to 44 Years | 1 (0.7%) | 2 (1.5%) |
| 45 to 49 Years | 17 (11.9%) | 9 (6.9%) |
| 50 to 54 Years | 8 (5.6%) | 9 (6.9%) |
| 55 to 59 Years | 5 (3.5%) | 10 (7.7%) |
| 60 to 64 Years | 2 (1.4%) | 8 (6.1%) |
| 65 to 69 Years | 14 (9.8%) | 8 (6.1%) |
| 70 to 74 Years | 3 (2.1%) | 7 (5.4%) |
| 75 to 79 Years | 2 (1.4%) | 1 (0.8%) |
| 80 to 84 Years | 3 (2.1%) | 6 (4.6%) |
| 85 Years and over | 6 (4.2%) | 0 (0.0%) |
| Total | 143 (100.0%) | 130 (100.0%) |
Families and Households in Sanford
Median Family Size in Sanford
The median family size in Sanford is 3.11 persons per family, with single male/father families (27 | 32.1%) accounting for the largest median family size of 3.81 persons per family. On the other hand, married-couple families (49 | 58.3%) represent the smallest median family size with 2.63 persons per family.
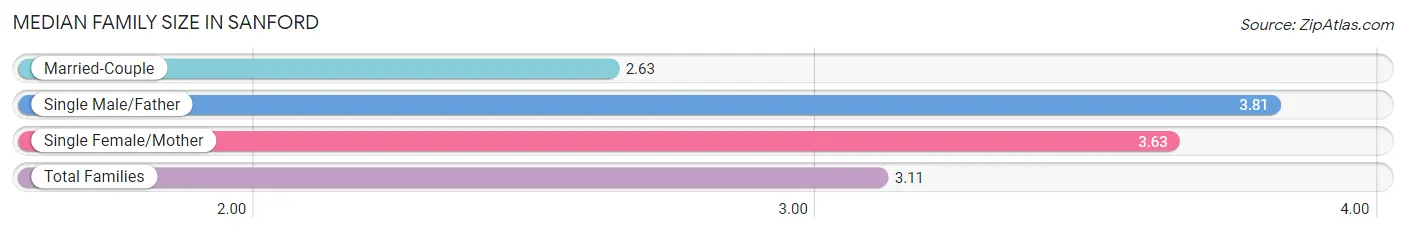
| Family Type | # Families | Family Size |
| Married-Couple | 49 (58.3%) | 2.63 |
| Single Male/Father | 27 (32.1%) | 3.81 |
| Single Female/Mother | 8 (9.5%) | 3.63 |
| Total Families | 84 (100.0%) | 3.11 |
Median Household Size in Sanford
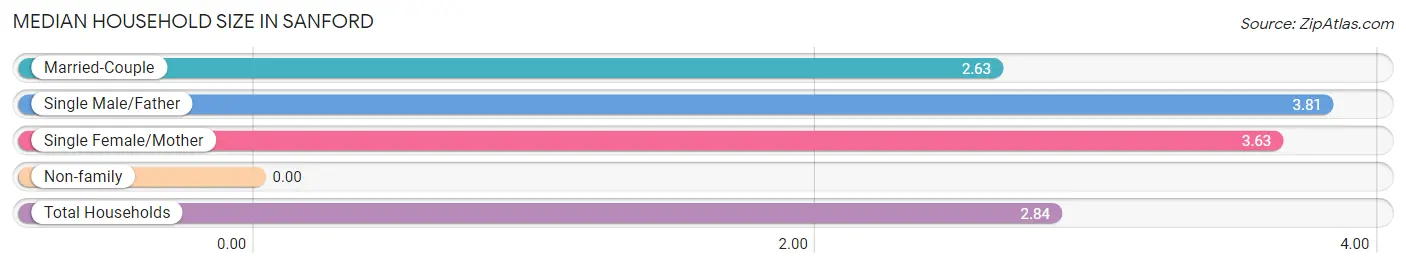
| Household Type | # Households | Household Size |
| Married-Couple | 49 (51.0%) | 2.63 |
| Single Male/Father | 27 (28.1%) | 3.81 |
| Single Female/Mother | 8 (8.3%) | 3.63 |
| Non-family | 12 (12.5%) | - |
| Total Households | 96 (100.0%) | 2.84 |
Household Size by Marriage Status in Sanford
Out of a total of 96 households in Sanford, 84 (87.5%) are family households, while 12 (12.5%) are nonfamily households. The most numerous type of family households are 2-person households, comprising 55, and the most common type of nonfamily households are 1-person households, comprising 12.
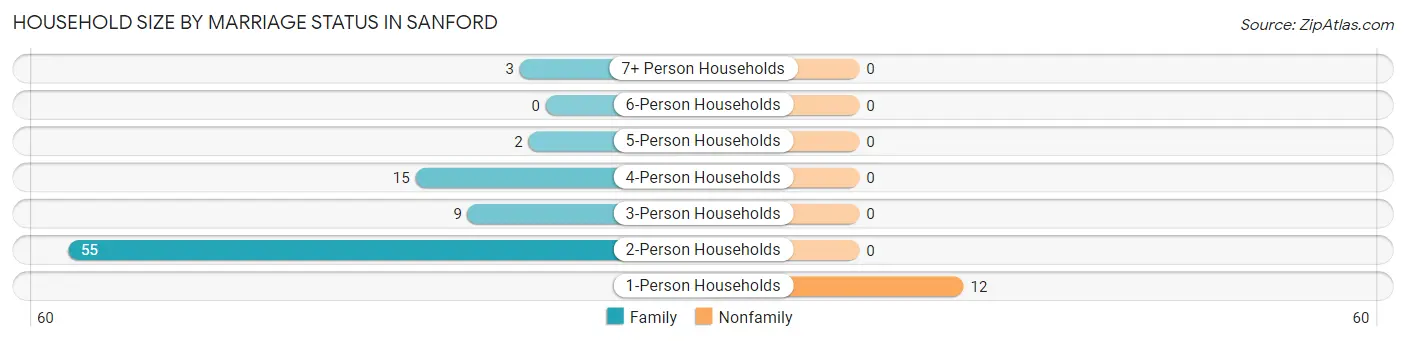
| Household Size | Family Households | Nonfamily Households |
| 1-Person Households | - | 12 (12.5%) |
| 2-Person Households | 55 (57.3%) | 0 (0.0%) |
| 3-Person Households | 9 (9.4%) | 0 (0.0%) |
| 4-Person Households | 15 (15.6%) | 0 (0.0%) |
| 5-Person Households | 2 (2.1%) | 0 (0.0%) |
| 6-Person Households | 0 (0.0%) | 0 (0.0%) |
| 7+ Person Households | 3 (3.1%) | 0 (0.0%) |
| Total | 84 (87.5%) | 12 (12.5%) |
Female Fertility in Sanford
Fertility by Age in Sanford
| Age Bracket | Women with Births | Births / 1,000 Women |
| 15 to 19 years | 0 (0.0%) | 0.0 |
| 20 to 34 years | 0 (0.0%) | 0.0 |
| 35 to 50 years | 0 (0.0%) | 0.0 |
| Total | 0 (0.0%) | 0.0 |
Fertility by Age by Marriage Status in Sanford
| Age Bracket | Married | Unmarried |
| 15 to 19 years | 0 (0.0%) | 0 (0.0%) |
| 20 to 34 years | 0 (0.0%) | 0 (0.0%) |
| 35 to 50 years | 0 (0.0%) | 0 (0.0%) |
| Total | 0 (0.0%) | 0 (0.0%) |
Fertility by Education in Sanford
| Educational Attainment | Women with Births | Births / 1,000 Women |
| Less than High School | 0 (0.0%) | 0.0 |
| High School Diploma | 0 (0.0%) | 0.0 |
| College or Associate's Degree | 0 (0.0%) | 0.0 |
| Bachelor's Degree | 0 (0.0%) | 0.0 |
| Graduate Degree | 0 (0.0%) | 0.0 |
| Total | 0 (0.0%) | 0.0 |
Fertility by Education by Marriage Status in Sanford
| Educational Attainment | Married | Unmarried |
| Less than High School | 0 (0.0%) | 0 (0.0%) |
| High School Diploma | 0 (0.0%) | 0 (0.0%) |
| College or Associate's Degree | 0 (0.0%) | 0 (0.0%) |
| Bachelor's Degree | 0 (0.0%) | 0 (0.0%) |
| Graduate Degree | 0 (0.0%) | 0 (0.0%) |
| Total | 0 (0.0%) | 0 (0.0%) |
Employment Characteristics in Sanford
Employment by Class of Employer in Sanford
Among the 81 employed individuals in Sanford, private company employees (40 | 49.4%), local government employees (22 | 27.2%), and self-employed (incorporated) (6 | 7.4%) make up the most common classes of employment.
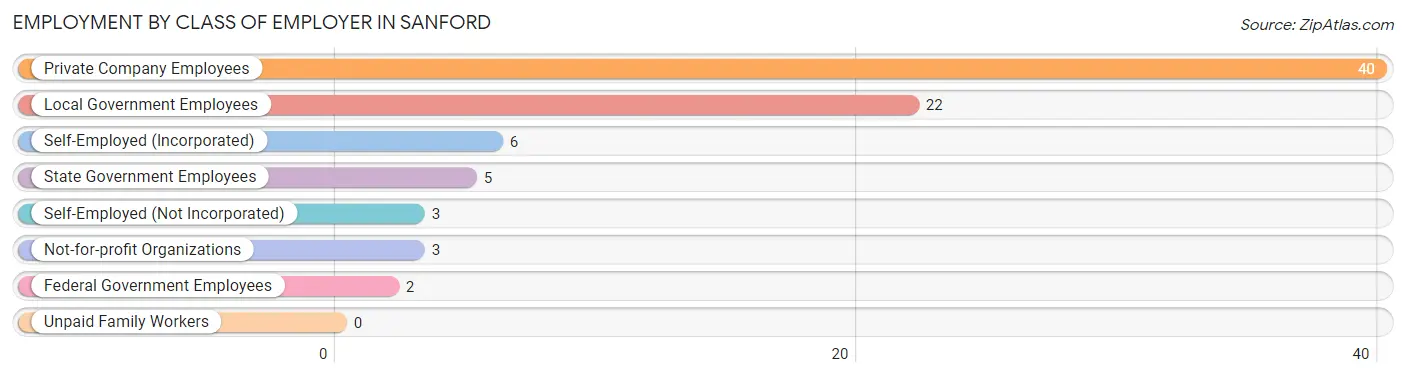
| Employer Class | # Employees | % Employees |
| Private Company Employees | 40 | 49.4% |
| Self-Employed (Incorporated) | 6 | 7.4% |
| Self-Employed (Not Incorporated) | 3 | 3.7% |
| Not-for-profit Organizations | 3 | 3.7% |
| Local Government Employees | 22 | 27.2% |
| State Government Employees | 5 | 6.2% |
| Federal Government Employees | 2 | 2.5% |
| Unpaid Family Workers | 0 | 0.0% |
| Total | 81 | 100.0% |
Employment Status by Age in Sanford
According to the labor force statistics for Sanford, out of the total population over 16 years of age (214), 39.3% or 84 individuals are in the labor force, with 3.6% or 3 of them unemployed. The age group with the highest labor force participation rate is 30 to 34 years, with 100.0% or 3 individuals in the labor force. Within the labor force, the 20 to 24 years age range has the highest percentage of unemployed individuals, with 21.4% or 3 of them being unemployed.
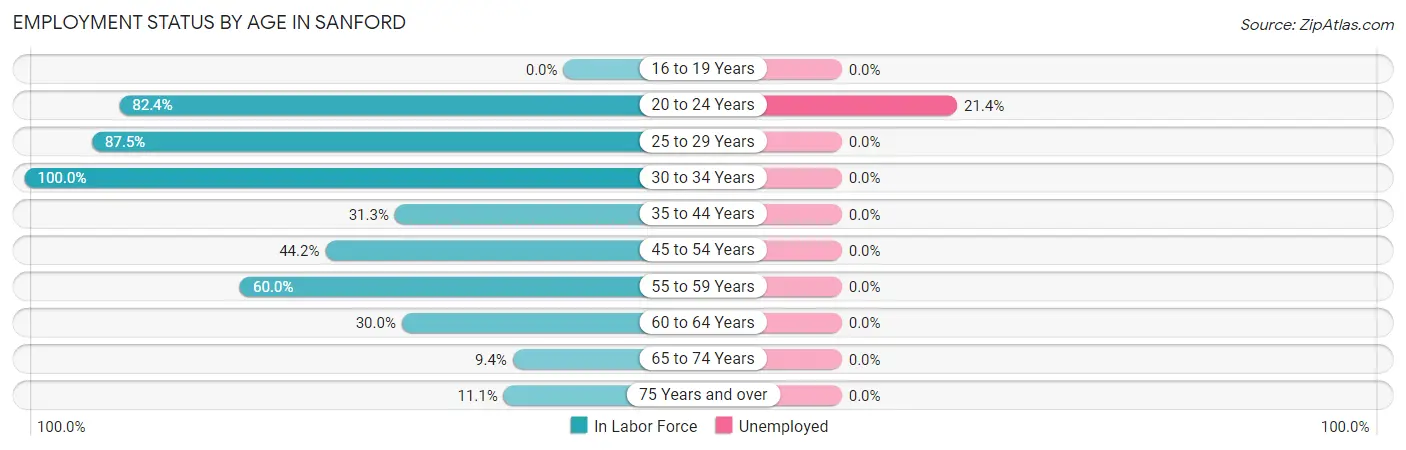
| Age Bracket | In Labor Force | Unemployed |
| 16 to 19 Years | 0 (0.0%) | 0 (0.0%) |
| 20 to 24 Years | 14 (82.4%) | 3 (21.4%) |
| 25 to 29 Years | 21 (87.5%) | 0 (0.0%) |
| 30 to 34 Years | 3 (100.0%) | 0 (0.0%) |
| 35 to 44 Years | 10 (31.3%) | 0 (0.0%) |
| 45 to 54 Years | 19 (44.2%) | 0 (0.0%) |
| 55 to 59 Years | 9 (60.0%) | 0 (0.0%) |
| 60 to 64 Years | 3 (30.0%) | 0 (0.0%) |
| 65 to 74 Years | 3 (9.4%) | 0 (0.0%) |
| 75 Years and over | 2 (11.1%) | 0 (0.0%) |
| Total | 84 (39.3%) | 3 (3.6%) |
Employment Status by Educational Attainment in Sanford
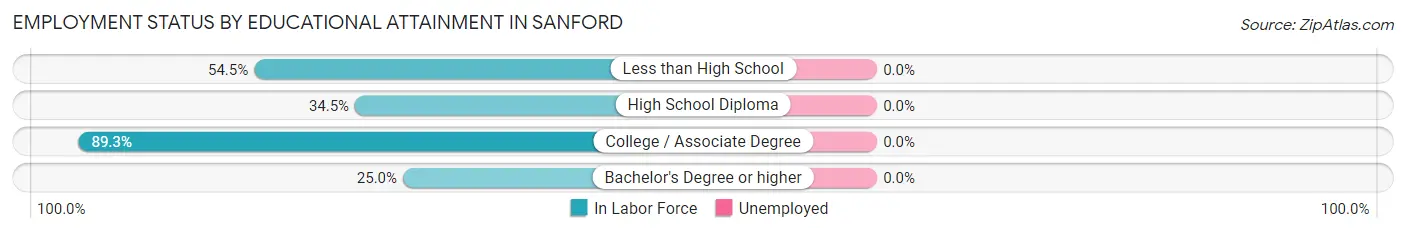
| Educational Attainment | In Labor Force | Unemployed |
| Less than High School | 18 (54.5%) | 0 (0.0%) |
| High School Diploma | 20 (34.5%) | 0 (0.0%) |
| College / Associate Degree | 25 (89.3%) | 0 (0.0%) |
| Bachelor's Degree or higher | 2 (25.0%) | 0 (0.0%) |
| Total | 65 (51.2%) | 0 (0.0%) |
Employment Occupations by Sex in Sanford
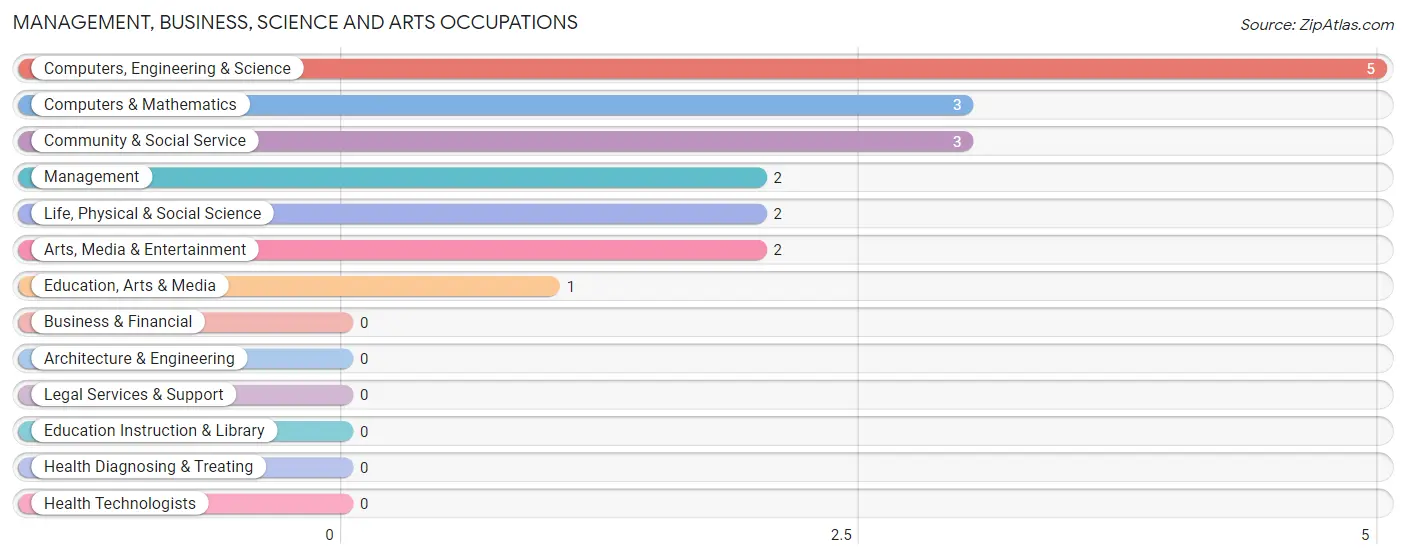
Management, Business, Science and Arts Occupations
The most common Management, Business, Science and Arts occupations in Sanford are Computers, Engineering & Science (5 | 6.2%), Computers & Mathematics (3 | 3.7%), Community & Social Service (3 | 3.7%), Management (2 | 2.5%), and Life, Physical & Social Science (2 | 2.5%).
Management, Business, Science and Arts Occupations by Sex
Within the Management, Business, Science and Arts occupations in Sanford, the most male-oriented occupations are Management (100.0%), Computers & Mathematics (100.0%), and Arts, Media & Entertainment (100.0%), while the most female-oriented occupations are Life, Physical & Social Science (100.0%), Education, Arts & Media (100.0%), and Computers, Engineering & Science (40.0%).
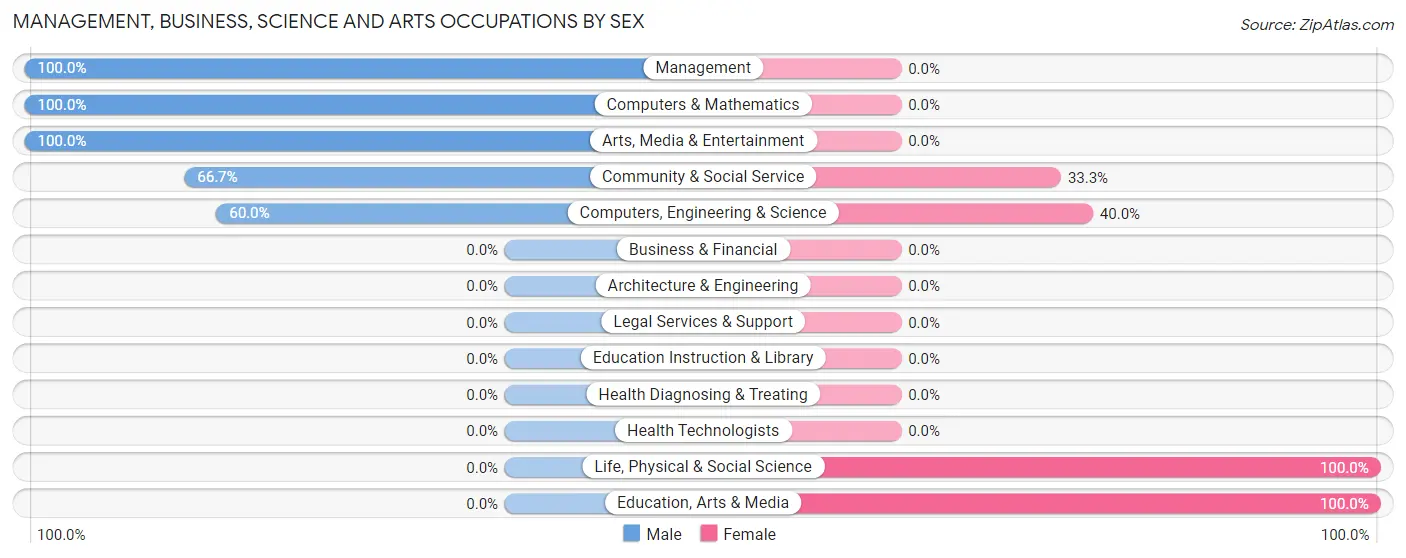
| Occupation | Male | Female |
| Management | 2 (100.0%) | 0 (0.0%) |
| Business & Financial | 0 (0.0%) | 0 (0.0%) |
| Computers, Engineering & Science | 3 (60.0%) | 2 (40.0%) |
| Computers & Mathematics | 3 (100.0%) | 0 (0.0%) |
| Architecture & Engineering | 0 (0.0%) | 0 (0.0%) |
| Life, Physical & Social Science | 0 (0.0%) | 2 (100.0%) |
| Community & Social Service | 2 (66.7%) | 1 (33.3%) |
| Education, Arts & Media | 0 (0.0%) | 1 (100.0%) |
| Legal Services & Support | 0 (0.0%) | 0 (0.0%) |
| Education Instruction & Library | 0 (0.0%) | 0 (0.0%) |
| Arts, Media & Entertainment | 2 (100.0%) | 0 (0.0%) |
| Health Diagnosing & Treating | 0 (0.0%) | 0 (0.0%) |
| Health Technologists | 0 (0.0%) | 0 (0.0%) |
| Total (Category) | 7 (70.0%) | 3 (30.0%) |
| Total (Overall) | 44 (54.3%) | 37 (45.7%) |
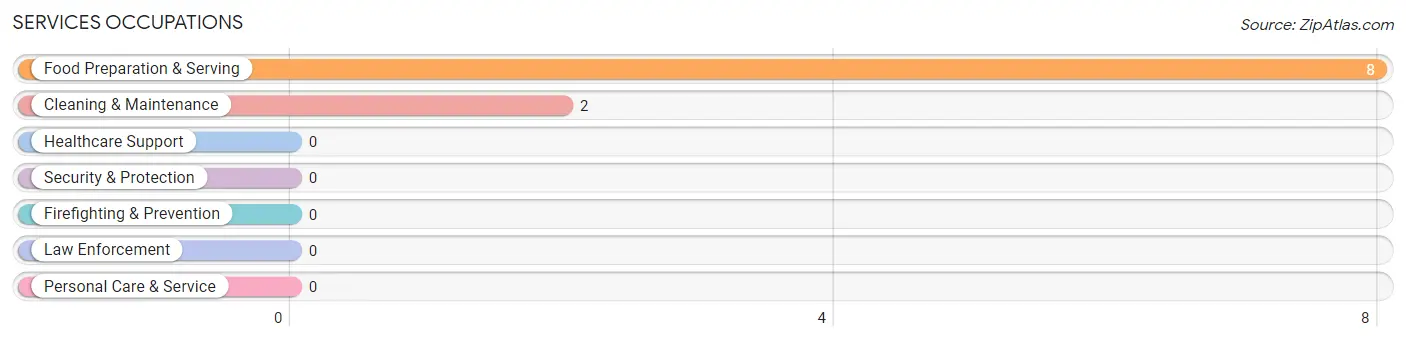
Services Occupations
The most common Services occupations in Sanford are Food Preparation & Serving (8 | 9.9%), and Cleaning & Maintenance (2 | 2.5%).
Services Occupations by Sex
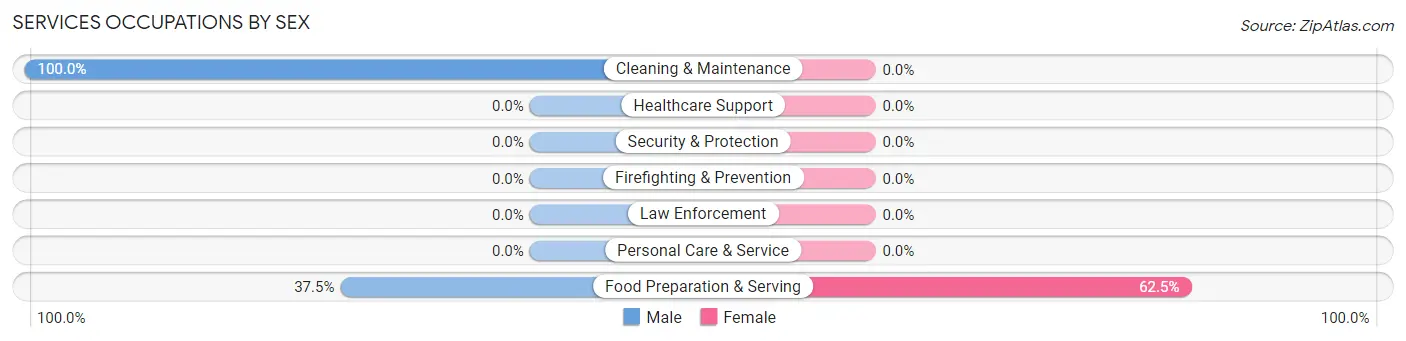
| Occupation | Male | Female |
| Healthcare Support | 0 (0.0%) | 0 (0.0%) |
| Security & Protection | 0 (0.0%) | 0 (0.0%) |
| Firefighting & Prevention | 0 (0.0%) | 0 (0.0%) |
| Law Enforcement | 0 (0.0%) | 0 (0.0%) |
| Food Preparation & Serving | 3 (37.5%) | 5 (62.5%) |
| Cleaning & Maintenance | 2 (100.0%) | 0 (0.0%) |
| Personal Care & Service | 0 (0.0%) | 0 (0.0%) |
| Total (Category) | 5 (50.0%) | 5 (50.0%) |
| Total (Overall) | 44 (54.3%) | 37 (45.7%) |
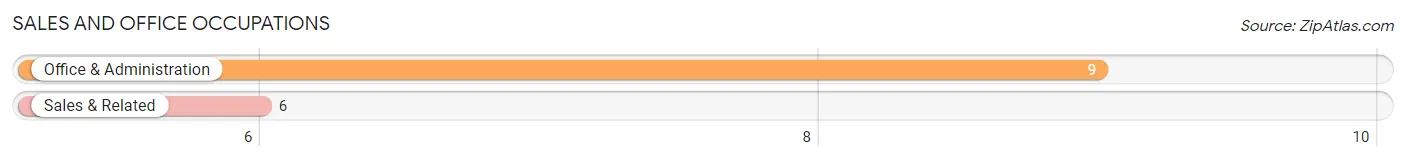
Sales and Office Occupations
The most common Sales and Office occupations in Sanford are Office & Administration (9 | 11.1%), and Sales & Related (6 | 7.4%).
Sales and Office Occupations by Sex
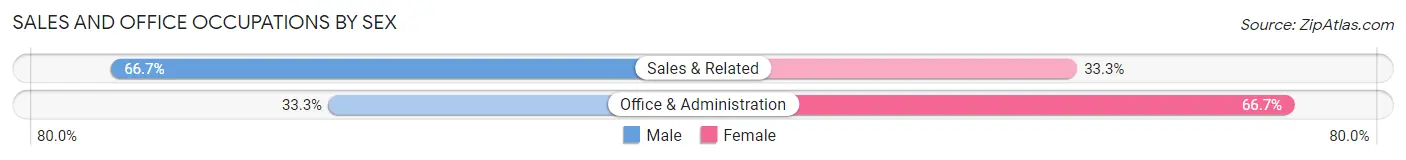
| Occupation | Male | Female |
| Sales & Related | 4 (66.7%) | 2 (33.3%) |
| Office & Administration | 3 (33.3%) | 6 (66.7%) |
| Total (Category) | 7 (46.7%) | 8 (53.3%) |
| Total (Overall) | 44 (54.3%) | 37 (45.7%) |
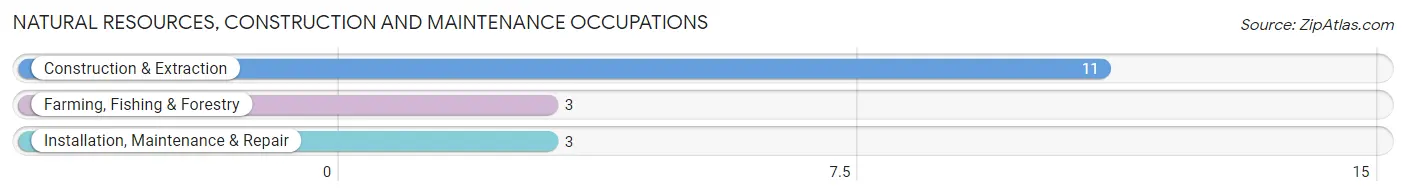
Natural Resources, Construction and Maintenance Occupations
The most common Natural Resources, Construction and Maintenance occupations in Sanford are Construction & Extraction (11 | 13.6%), Farming, Fishing & Forestry (3 | 3.7%), and Installation, Maintenance & Repair (3 | 3.7%).
Natural Resources, Construction and Maintenance Occupations by Sex
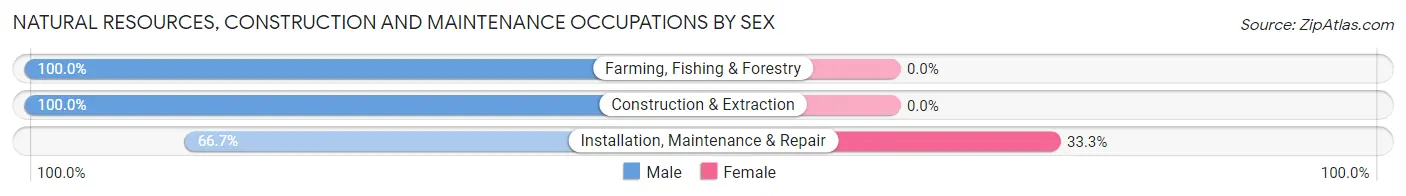
| Occupation | Male | Female |
| Farming, Fishing & Forestry | 3 (100.0%) | 0 (0.0%) |
| Construction & Extraction | 11 (100.0%) | 0 (0.0%) |
| Installation, Maintenance & Repair | 2 (66.7%) | 1 (33.3%) |
| Total (Category) | 16 (94.1%) | 1 (5.9%) |
| Total (Overall) | 44 (54.3%) | 37 (45.7%) |
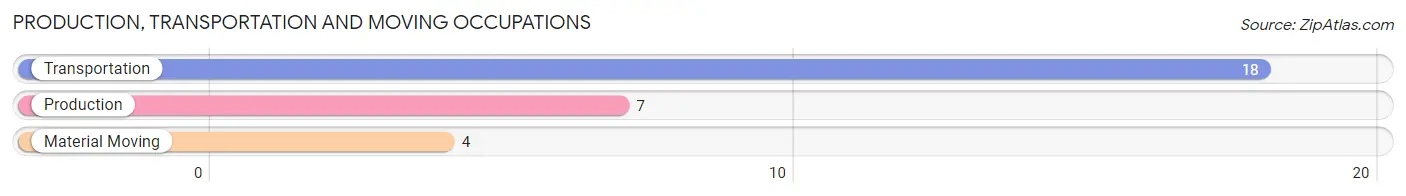
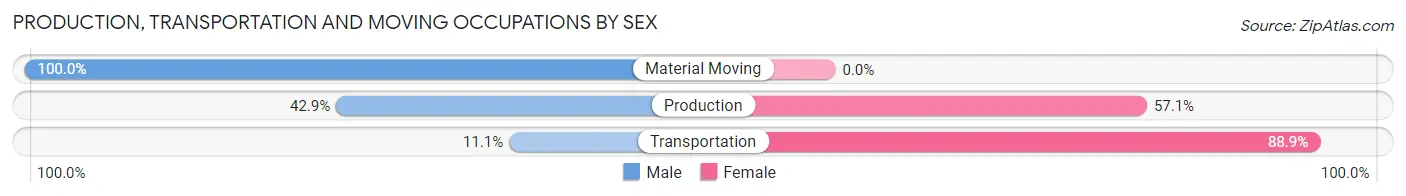
Production, Transportation and Moving Occupations
The most common Production, Transportation and Moving occupations in Sanford are Transportation (18 | 22.2%), Production (7 | 8.6%), and Material Moving (4 | 4.9%).
Production, Transportation and Moving Occupations by Sex
| Occupation | Male | Female |
| Production | 3 (42.9%) | 4 (57.1%) |
| Transportation | 2 (11.1%) | 16 (88.9%) |
| Material Moving | 4 (100.0%) | 0 (0.0%) |
| Total (Category) | 9 (31.0%) | 20 (69.0%) |
| Total (Overall) | 44 (54.3%) | 37 (45.7%) |
Employment Industries by Sex in Sanford
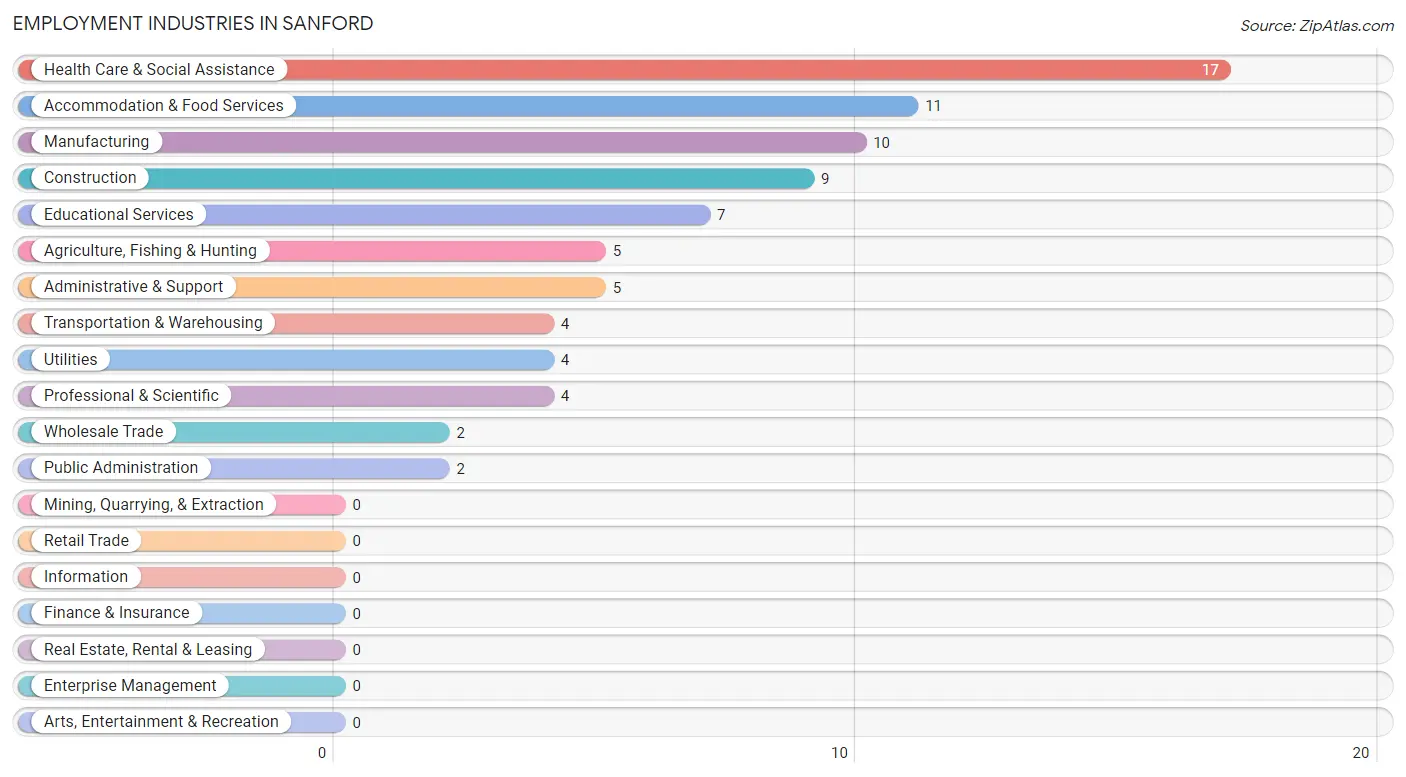
Employment Industries in Sanford
The major employment industries in Sanford include Health Care & Social Assistance (17 | 21.0%), Accommodation & Food Services (11 | 13.6%), Manufacturing (10 | 12.3%), Construction (9 | 11.1%), and Educational Services (7 | 8.6%).
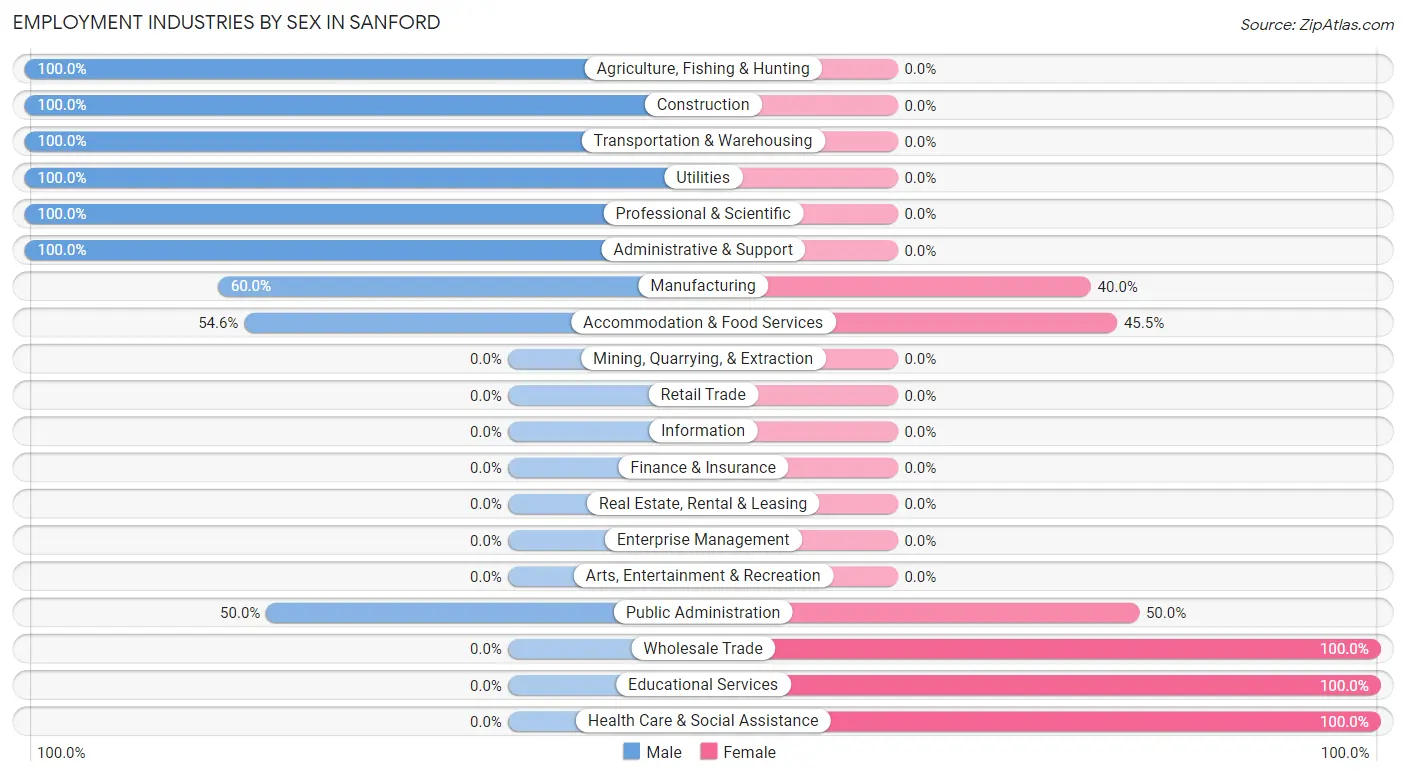
Employment Industries by Sex in Sanford
The Sanford industries that see more men than women are Agriculture, Fishing & Hunting (100.0%), Construction (100.0%), and Transportation & Warehousing (100.0%), whereas the industries that tend to have a higher number of women are Wholesale Trade (100.0%), Educational Services (100.0%), and Health Care & Social Assistance (100.0%).
| Industry | Male | Female |
| Agriculture, Fishing & Hunting | 5 (100.0%) | 0 (0.0%) |
| Mining, Quarrying, & Extraction | 0 (0.0%) | 0 (0.0%) |
| Construction | 9 (100.0%) | 0 (0.0%) |
| Manufacturing | 6 (60.0%) | 4 (40.0%) |
| Wholesale Trade | 0 (0.0%) | 2 (100.0%) |
| Retail Trade | 0 (0.0%) | 0 (0.0%) |
| Transportation & Warehousing | 4 (100.0%) | 0 (0.0%) |
| Utilities | 4 (100.0%) | 0 (0.0%) |
| Information | 0 (0.0%) | 0 (0.0%) |
| Finance & Insurance | 0 (0.0%) | 0 (0.0%) |
| Real Estate, Rental & Leasing | 0 (0.0%) | 0 (0.0%) |
| Professional & Scientific | 4 (100.0%) | 0 (0.0%) |
| Enterprise Management | 0 (0.0%) | 0 (0.0%) |
| Administrative & Support | 5 (100.0%) | 0 (0.0%) |
| Educational Services | 0 (0.0%) | 7 (100.0%) |
| Health Care & Social Assistance | 0 (0.0%) | 17 (100.0%) |
| Arts, Entertainment & Recreation | 0 (0.0%) | 0 (0.0%) |
| Accommodation & Food Services | 6 (54.5%) | 5 (45.5%) |
| Public Administration | 1 (50.0%) | 1 (50.0%) |
| Total | 44 (54.3%) | 37 (45.7%) |
Education in Sanford
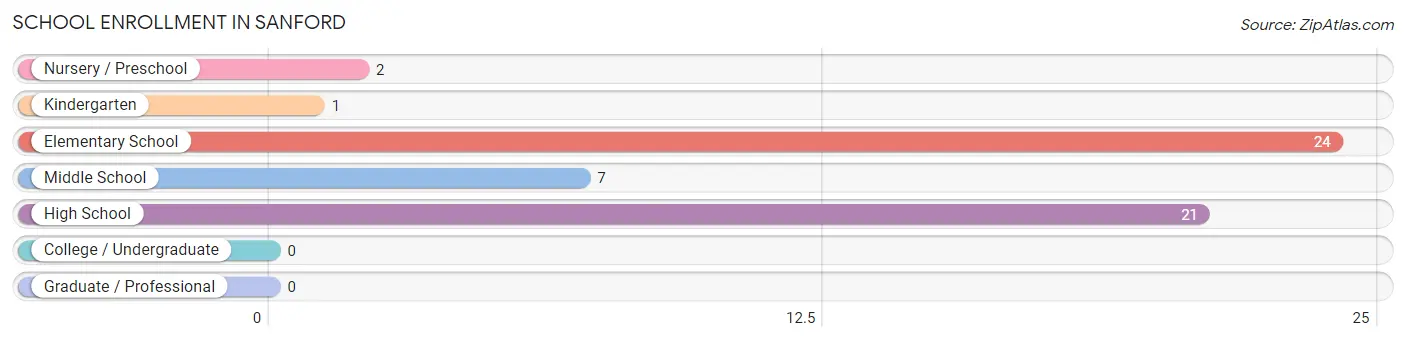
School Enrollment in Sanford
The most common levels of schooling among the 55 students in Sanford are elementary school (24 | 43.6%), high school (21 | 38.2%), and middle school (7 | 12.7%).
| School Level | # Students | % Students |
| Nursery / Preschool | 2 | 3.6% |
| Kindergarten | 1 | 1.8% |
| Elementary School | 24 | 43.6% |
| Middle School | 7 | 12.7% |
| High School | 21 | 38.2% |
| College / Undergraduate | 0 | 0.0% |
| Graduate / Professional | 0 | 0.0% |
| Total | 55 | 100.0% |
School Enrollment by Age by Funding Source in Sanford
Out of a total of 55 students who are enrolled in schools in Sanford, 6 (10.9%) attend a private institution, while the remaining 49 (89.1%) are enrolled in public schools. The age group of 15 to 17 year olds has the highest likelihood of being enrolled in private schools, with 3 (14.3% in the age bracket) enrolled. Conversely, the age group of 5 to 9 year old has the lowest likelihood of being enrolled in a private school, with 24 (92.3% in the age bracket) attending a public institution.
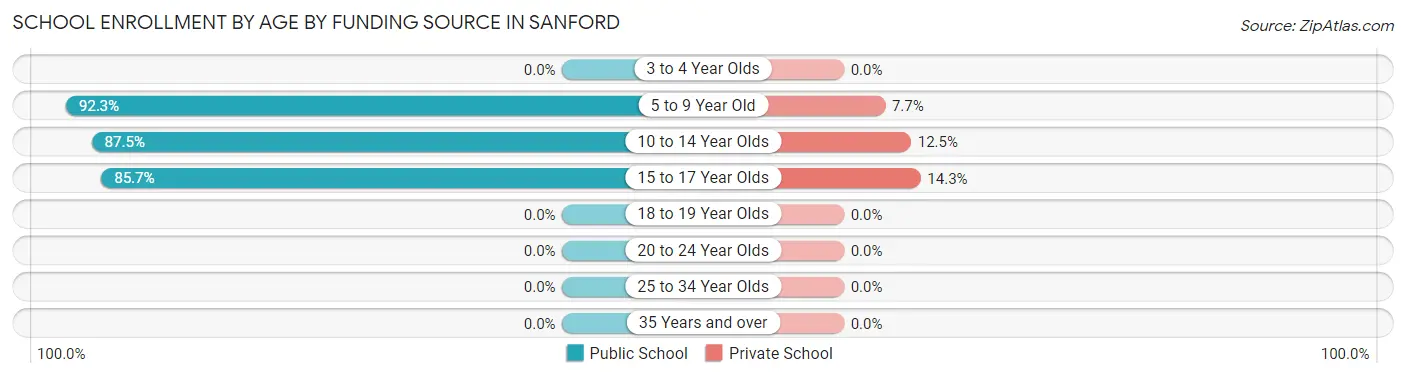
| Age Bracket | Public School | Private School |
| 3 to 4 Year Olds | 0 (0.0%) | 0 (0.0%) |
| 5 to 9 Year Old | 24 (92.3%) | 2 (7.7%) |
| 10 to 14 Year Olds | 7 (87.5%) | 1 (12.5%) |
| 15 to 17 Year Olds | 18 (85.7%) | 3 (14.3%) |
| 18 to 19 Year Olds | 0 (0.0%) | 0 (0.0%) |
| 20 to 24 Year Olds | 0 (0.0%) | 0 (0.0%) |
| 25 to 34 Year Olds | 0 (0.0%) | 0 (0.0%) |
| 35 Years and over | 0 (0.0%) | 0 (0.0%) |
| Total | 49 (89.1%) | 6 (10.9%) |
Educational Attainment by Field of Study in Sanford
Psychology (10 | 38.5%), education (5 | 19.2%), visual & performing arts (5 | 19.2%), business (4 | 15.4%), and bio, nature & agricultural (1 | 3.8%) are the most common fields of study among 26 individuals in Sanford who have obtained a bachelor's degree or higher.
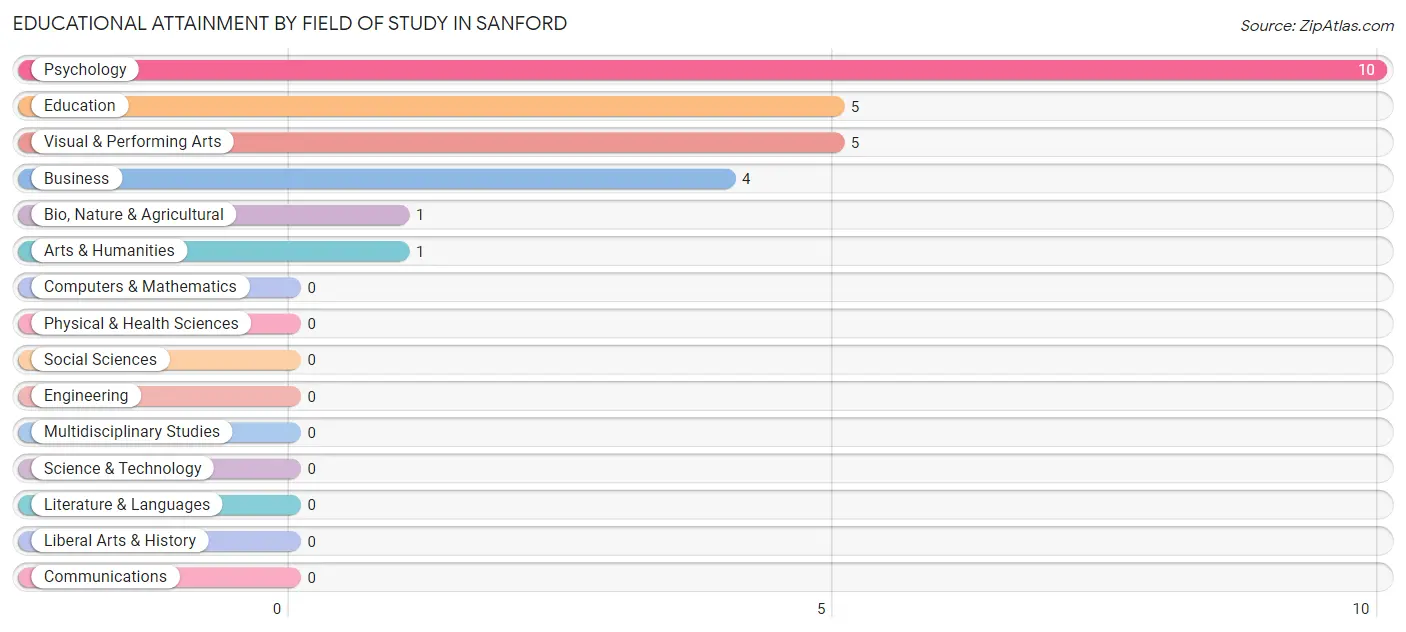
| Field of Study | # Graduates | % Graduates |
| Computers & Mathematics | 0 | 0.0% |
| Bio, Nature & Agricultural | 1 | 3.8% |
| Physical & Health Sciences | 0 | 0.0% |
| Psychology | 10 | 38.5% |
| Social Sciences | 0 | 0.0% |
| Engineering | 0 | 0.0% |
| Multidisciplinary Studies | 0 | 0.0% |
| Science & Technology | 0 | 0.0% |
| Business | 4 | 15.4% |
| Education | 5 | 19.2% |
| Literature & Languages | 0 | 0.0% |
| Liberal Arts & History | 0 | 0.0% |
| Visual & Performing Arts | 5 | 19.2% |
| Communications | 0 | 0.0% |
| Arts & Humanities | 1 | 3.8% |
| Total | 26 | 100.0% |
Transportation & Commute in Sanford
Vehicle Availability by Sex in Sanford
The most prevalent vehicle ownership categories in Sanford are males with 5 or more vehicles (16, accounting for 36.4%) and females with 5 or more vehicles (5, making up 43.2%).
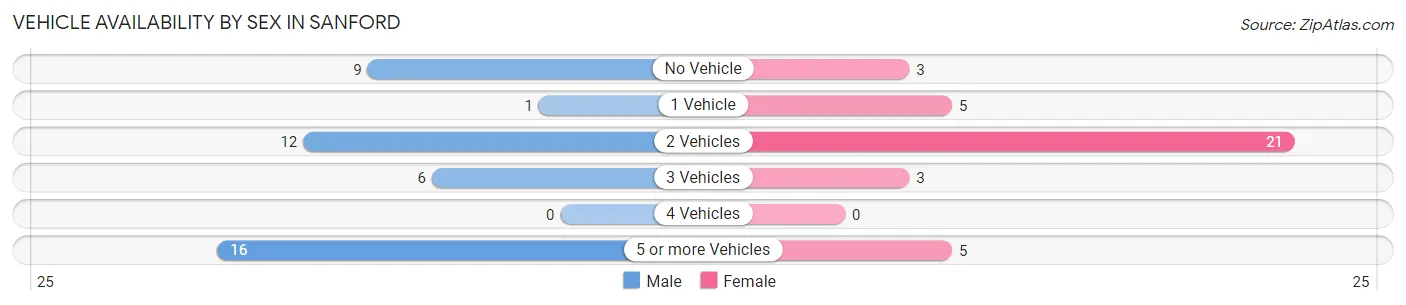
| Vehicles Available | Male | Female |
| No Vehicle | 9 (20.4%) | 3 (8.1%) |
| 1 Vehicle | 1 (2.3%) | 5 (13.5%) |
| 2 Vehicles | 12 (27.3%) | 21 (56.8%) |
| 3 Vehicles | 6 (13.6%) | 3 (8.1%) |
| 4 Vehicles | 0 (0.0%) | 0 (0.0%) |
| 5 or more Vehicles | 16 (36.4%) | 5 (13.5%) |
| Total | 44 (100.0%) | 37 (100.0%) |
Commute Time in Sanford
The most frequently occuring commute durations in Sanford are 10 to 14 minutes (30 commuters, 37.0%), 15 to 19 minutes (20 commuters, 24.7%), and 20 to 24 minutes (11 commuters, 13.6%).
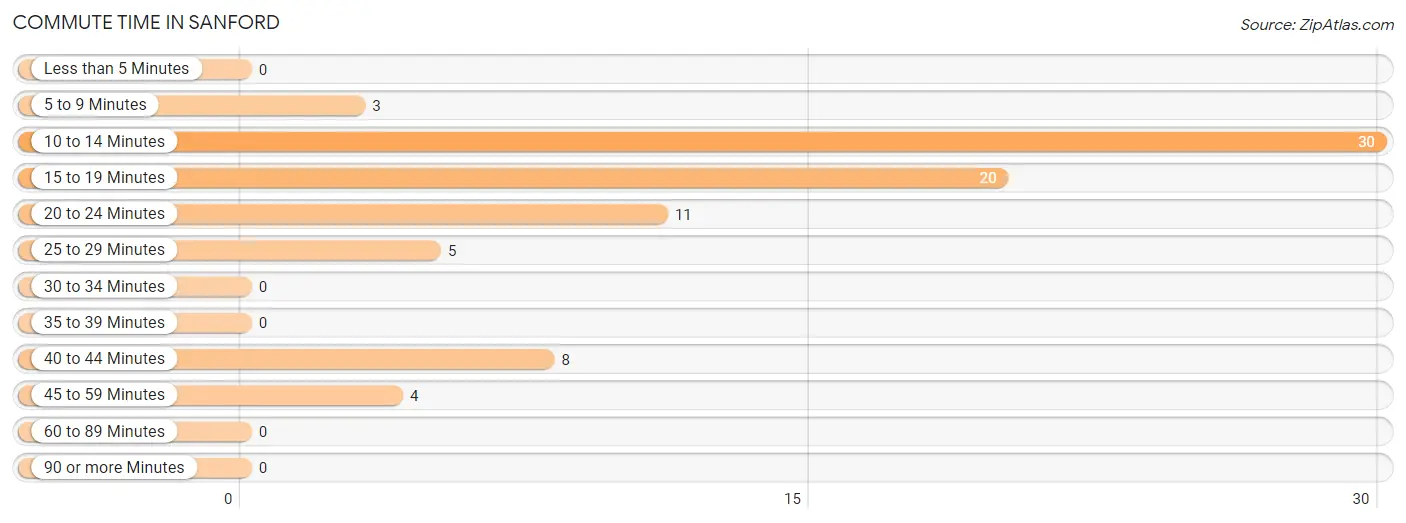
| Commute Time | # Commuters | % Commuters |
| Less than 5 Minutes | 0 | 0.0% |
| 5 to 9 Minutes | 3 | 3.7% |
| 10 to 14 Minutes | 30 | 37.0% |
| 15 to 19 Minutes | 20 | 24.7% |
| 20 to 24 Minutes | 11 | 13.6% |
| 25 to 29 Minutes | 5 | 6.2% |
| 30 to 34 Minutes | 0 | 0.0% |
| 35 to 39 Minutes | 0 | 0.0% |
| 40 to 44 Minutes | 8 | 9.9% |
| 45 to 59 Minutes | 4 | 4.9% |
| 60 to 89 Minutes | 0 | 0.0% |
| 90 or more Minutes | 0 | 0.0% |
Commute Time by Sex in Sanford
The most common commute times in Sanford are 15 to 19 minutes (18 commuters, 40.9%) for males and 10 to 14 minutes (19 commuters, 51.3%) for females.
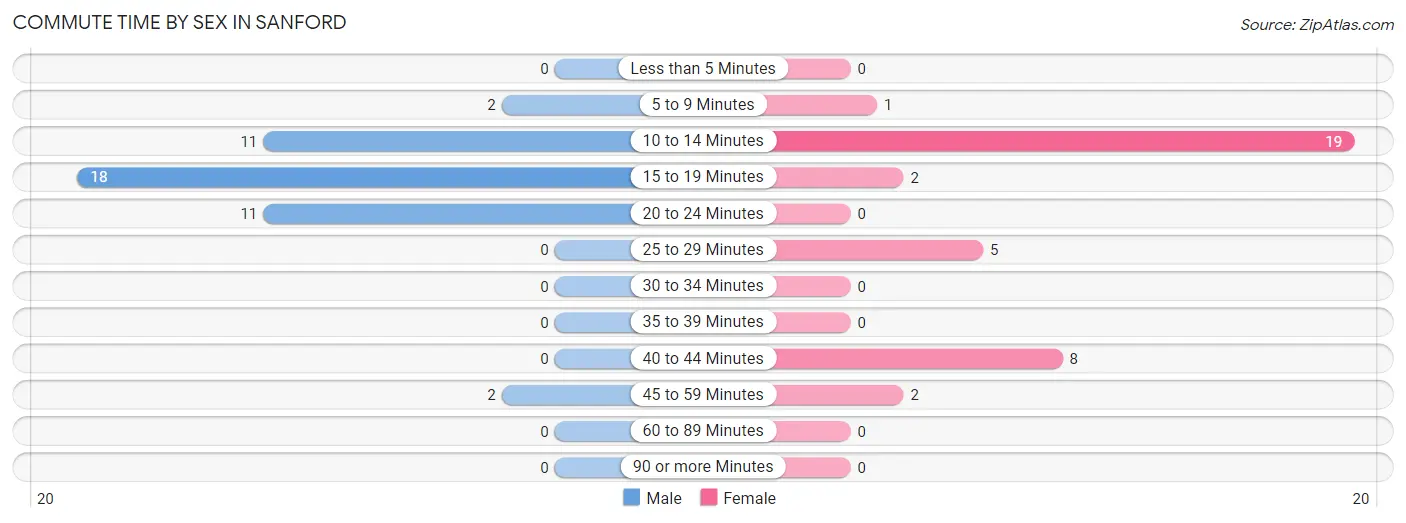
| Commute Time | Male | Female |
| Less than 5 Minutes | 0 (0.0%) | 0 (0.0%) |
| 5 to 9 Minutes | 2 (4.5%) | 1 (2.7%) |
| 10 to 14 Minutes | 11 (25.0%) | 19 (51.3%) |
| 15 to 19 Minutes | 18 (40.9%) | 2 (5.4%) |
| 20 to 24 Minutes | 11 (25.0%) | 0 (0.0%) |
| 25 to 29 Minutes | 0 (0.0%) | 5 (13.5%) |
| 30 to 34 Minutes | 0 (0.0%) | 0 (0.0%) |
| 35 to 39 Minutes | 0 (0.0%) | 0 (0.0%) |
| 40 to 44 Minutes | 0 (0.0%) | 8 (21.6%) |
| 45 to 59 Minutes | 2 (4.5%) | 2 (5.4%) |
| 60 to 89 Minutes | 0 (0.0%) | 0 (0.0%) |
| 90 or more Minutes | 0 (0.0%) | 0 (0.0%) |
Time of Departure to Work by Sex in Sanford
The most frequent times of departure to work in Sanford are 7:00 AM to 7:29 AM (10, 22.7%) for males and 6:00 AM to 6:29 AM (22, 59.5%) for females.
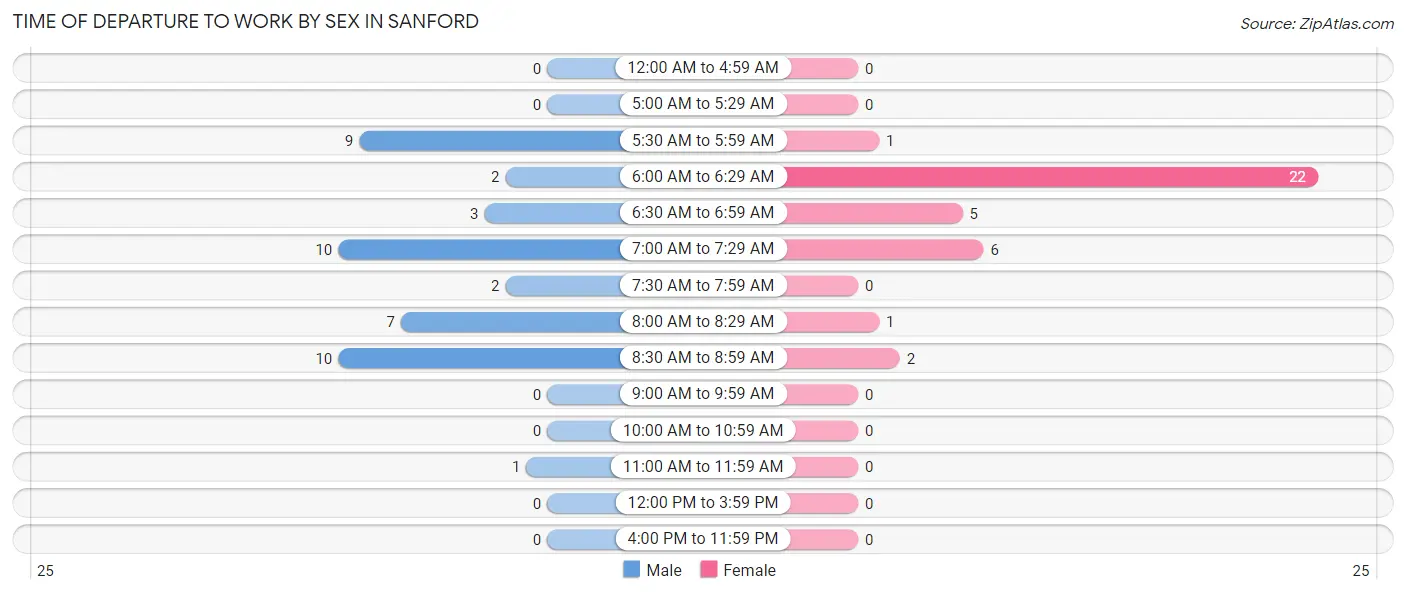
| Time of Departure | Male | Female |
| 12:00 AM to 4:59 AM | 0 (0.0%) | 0 (0.0%) |
| 5:00 AM to 5:29 AM | 0 (0.0%) | 0 (0.0%) |
| 5:30 AM to 5:59 AM | 9 (20.4%) | 1 (2.7%) |
| 6:00 AM to 6:29 AM | 2 (4.5%) | 22 (59.5%) |
| 6:30 AM to 6:59 AM | 3 (6.8%) | 5 (13.5%) |
| 7:00 AM to 7:29 AM | 10 (22.7%) | 6 (16.2%) |
| 7:30 AM to 7:59 AM | 2 (4.5%) | 0 (0.0%) |
| 8:00 AM to 8:29 AM | 7 (15.9%) | 1 (2.7%) |
| 8:30 AM to 8:59 AM | 10 (22.7%) | 2 (5.4%) |
| 9:00 AM to 9:59 AM | 0 (0.0%) | 0 (0.0%) |
| 10:00 AM to 10:59 AM | 0 (0.0%) | 0 (0.0%) |
| 11:00 AM to 11:59 AM | 1 (2.3%) | 0 (0.0%) |
| 12:00 PM to 3:59 PM | 0 (0.0%) | 0 (0.0%) |
| 4:00 PM to 11:59 PM | 0 (0.0%) | 0 (0.0%) |
| Total | 44 (100.0%) | 37 (100.0%) |
Housing Occupancy in Sanford
Occupancy by Ownership in Sanford
Of the total 96 dwellings in Sanford, owner-occupied units account for 70 (72.9%), while renter-occupied units make up 26 (27.1%).
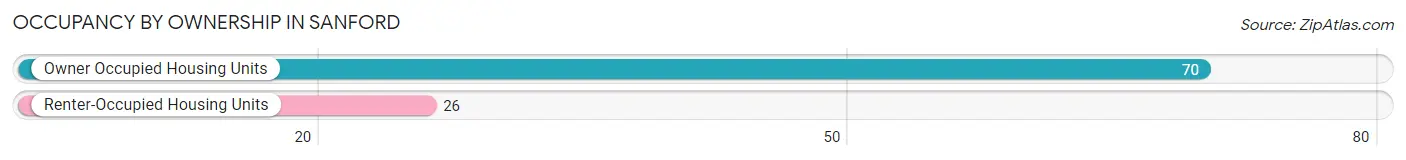
| Occupancy | # Housing Units | % Housing Units |
| Owner Occupied Housing Units | 70 | 72.9% |
| Renter-Occupied Housing Units | 26 | 27.1% |
| Total Occupied Housing Units | 96 | 100.0% |
Occupancy by Household Size in Sanford
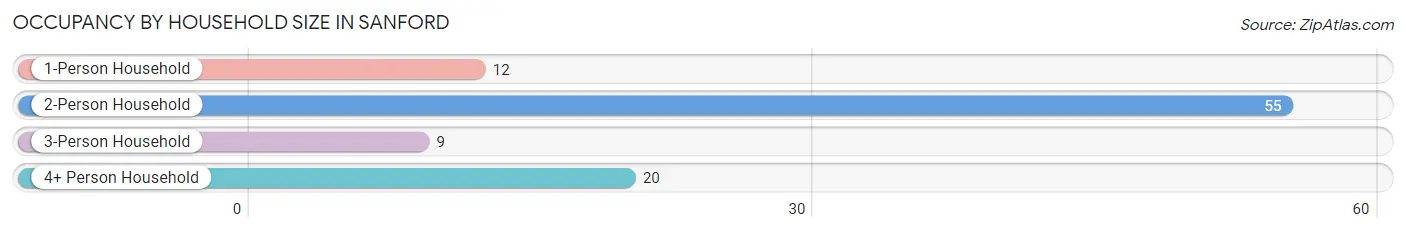
| Household Size | # Housing Units | % Housing Units |
| 1-Person Household | 12 | 12.5% |
| 2-Person Household | 55 | 57.3% |
| 3-Person Household | 9 | 9.4% |
| 4+ Person Household | 20 | 20.8% |
| Total Housing Units | 96 | 100.0% |
Occupancy by Ownership by Household Size in Sanford
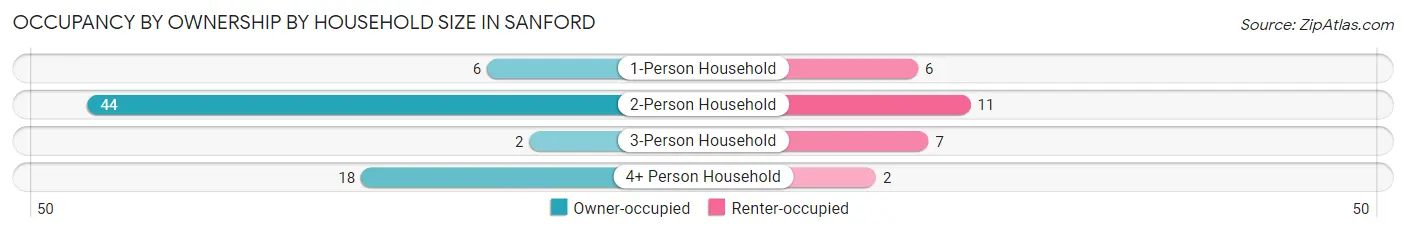
| Household Size | Owner-occupied | Renter-occupied |
| 1-Person Household | 6 (50.0%) | 6 (50.0%) |
| 2-Person Household | 44 (80.0%) | 11 (20.0%) |
| 3-Person Household | 2 (22.2%) | 7 (77.8%) |
| 4+ Person Household | 18 (90.0%) | 2 (10.0%) |
| Total Housing Units | 70 (72.9%) | 26 (27.1%) |
Occupancy by Educational Attainment in Sanford
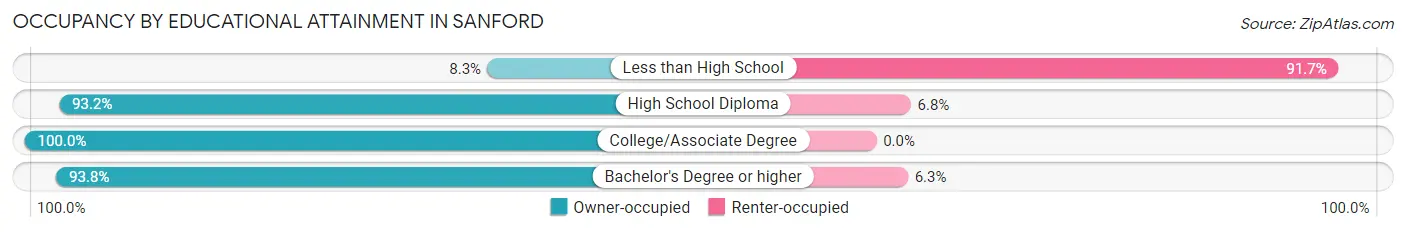
| Household Size | Owner-occupied | Renter-occupied |
| Less than High School | 2 (8.3%) | 22 (91.7%) |
| High School Diploma | 41 (93.2%) | 3 (6.8%) |
| College/Associate Degree | 12 (100.0%) | 0 (0.0%) |
| Bachelor's Degree or higher | 15 (93.8%) | 1 (6.2%) |
Occupancy by Age of Householder in Sanford
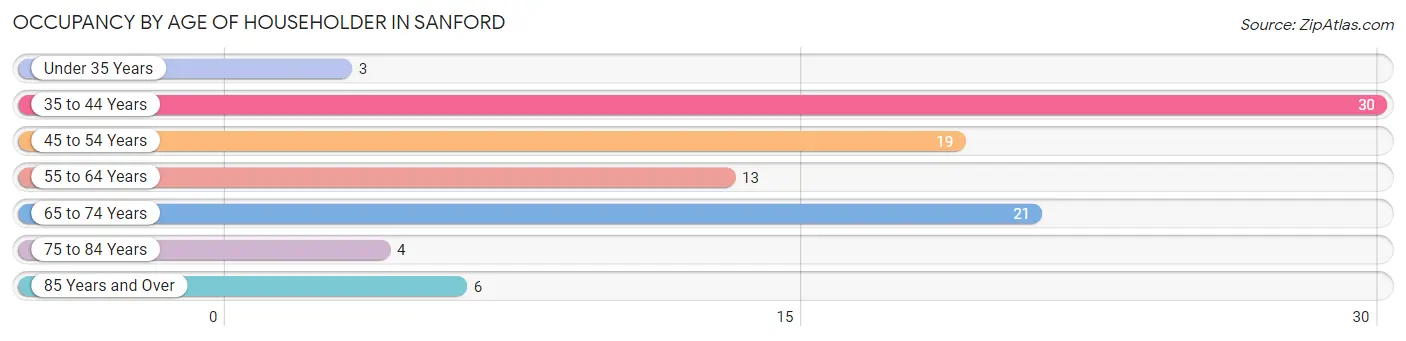
| Age Bracket | # Households | % Households |
| Under 35 Years | 3 | 3.1% |
| 35 to 44 Years | 30 | 31.2% |
| 45 to 54 Years | 19 | 19.8% |
| 55 to 64 Years | 13 | 13.5% |
| 65 to 74 Years | 21 | 21.9% |
| 75 to 84 Years | 4 | 4.2% |
| 85 Years and Over | 6 | 6.2% |
| Total | 96 | 100.0% |
Housing Finances in Sanford
Median Income by Occupancy in Sanford
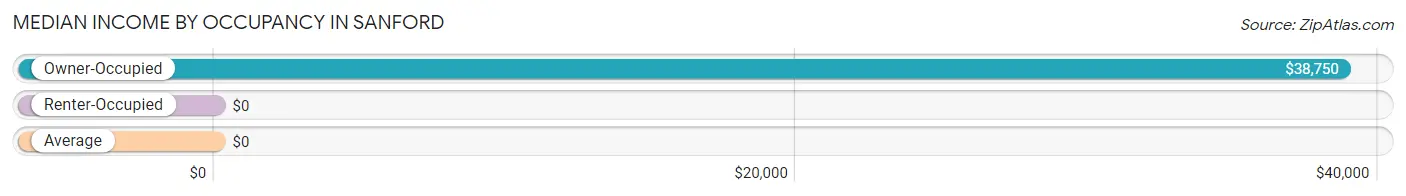
| Occupancy Type | # Households | Median Income |
| Owner-Occupied | 70 (72.9%) | $38,750 |
| Renter-Occupied | 26 (27.1%) | $0 |
| Average | 96 (100.0%) | $0 |
Occupancy by Householder Income Bracket in Sanford
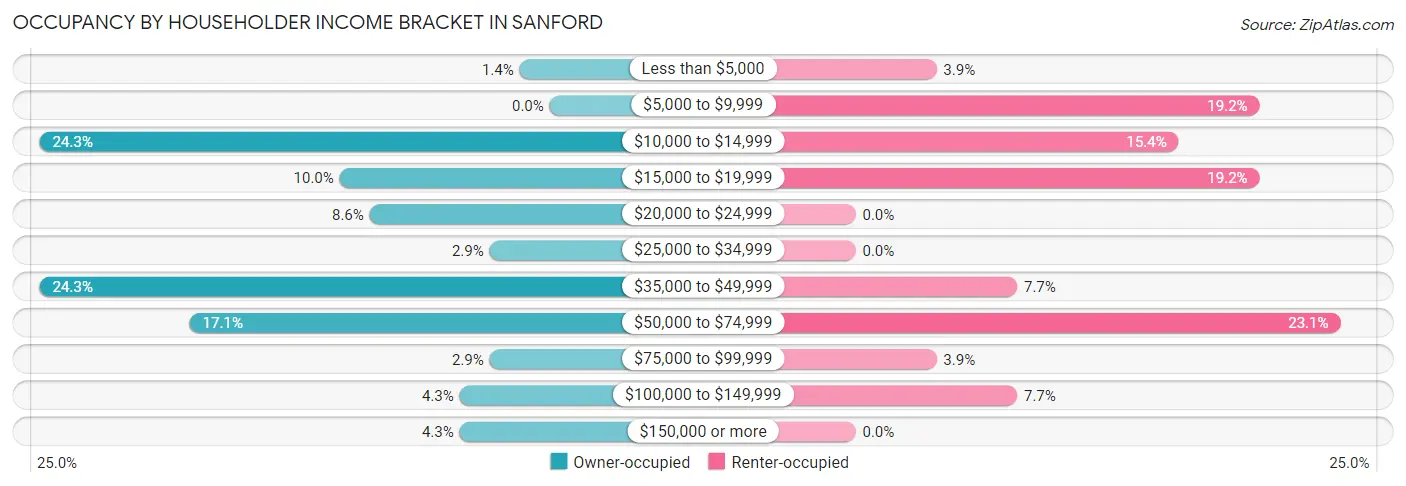
| Income Bracket | Owner-occupied | Renter-occupied |
| Less than $5,000 | 1 (1.4%) | 1 (3.8%) |
| $5,000 to $9,999 | 0 (0.0%) | 5 (19.2%) |
| $10,000 to $14,999 | 17 (24.3%) | 4 (15.4%) |
| $15,000 to $19,999 | 7 (10.0%) | 5 (19.2%) |
| $20,000 to $24,999 | 6 (8.6%) | 0 (0.0%) |
| $25,000 to $34,999 | 2 (2.9%) | 0 (0.0%) |
| $35,000 to $49,999 | 17 (24.3%) | 2 (7.7%) |
| $50,000 to $74,999 | 12 (17.1%) | 6 (23.1%) |
| $75,000 to $99,999 | 2 (2.9%) | 1 (3.8%) |
| $100,000 to $149,999 | 3 (4.3%) | 2 (7.7%) |
| $150,000 or more | 3 (4.3%) | 0 (0.0%) |
| Total | 70 (100.0%) | 26 (100.0%) |
Monthly Housing Cost Tiers in Sanford
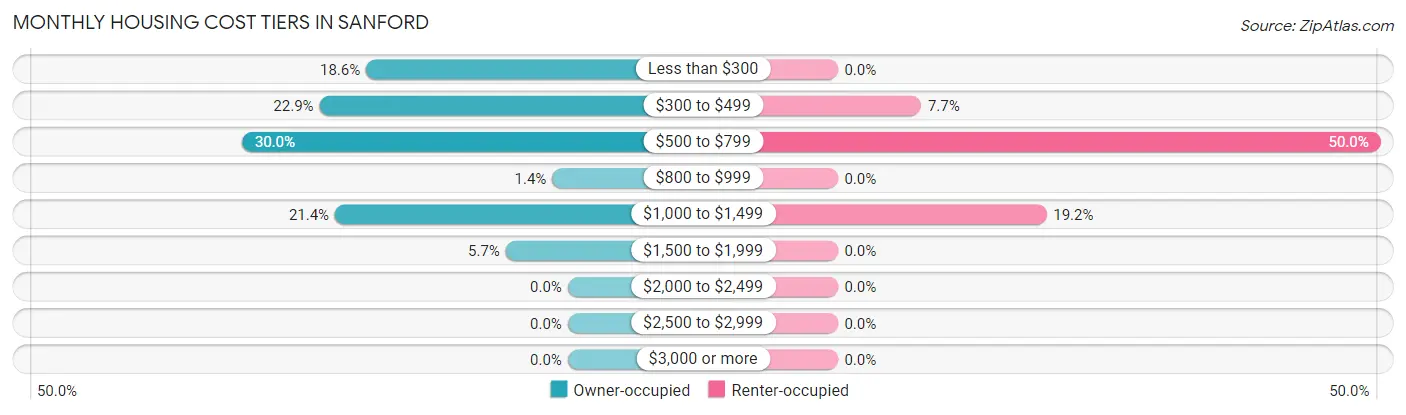
| Monthly Cost | Owner-occupied | Renter-occupied |
| Less than $300 | 13 (18.6%) | 0 (0.0%) |
| $300 to $499 | 16 (22.9%) | 2 (7.7%) |
| $500 to $799 | 21 (30.0%) | 13 (50.0%) |
| $800 to $999 | 1 (1.4%) | 0 (0.0%) |
| $1,000 to $1,499 | 15 (21.4%) | 5 (19.2%) |
| $1,500 to $1,999 | 4 (5.7%) | 0 (0.0%) |
| $2,000 to $2,499 | 0 (0.0%) | 0 (0.0%) |
| $2,500 to $2,999 | 0 (0.0%) | 0 (0.0%) |
| $3,000 or more | 0 (0.0%) | 0 (0.0%) |
| Total | 70 (100.0%) | 26 (100.0%) |
Physical Housing Characteristics in Sanford
Housing Structures in Sanford
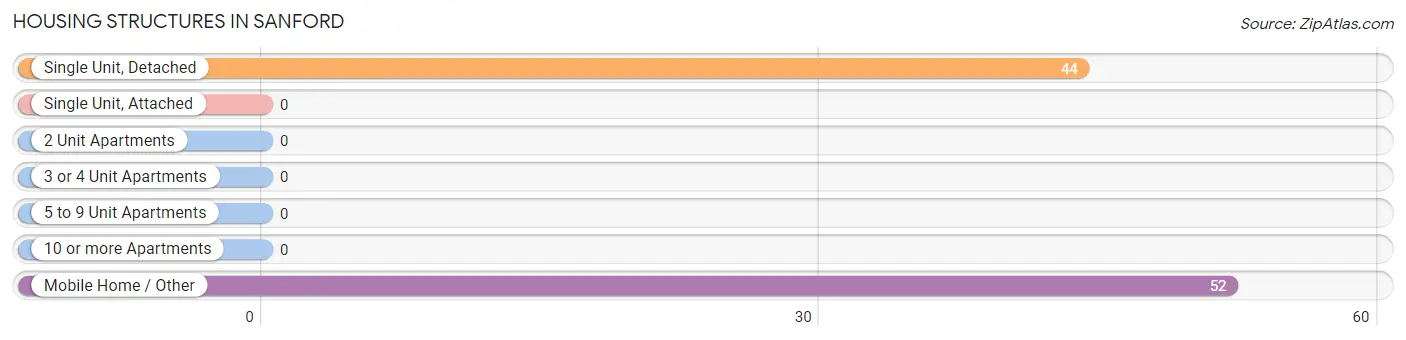
| Structure Type | # Housing Units | % Housing Units |
| Single Unit, Detached | 44 | 45.8% |
| Single Unit, Attached | 0 | 0.0% |
| 2 Unit Apartments | 0 | 0.0% |
| 3 or 4 Unit Apartments | 0 | 0.0% |
| 5 to 9 Unit Apartments | 0 | 0.0% |
| 10 or more Apartments | 0 | 0.0% |
| Mobile Home / Other | 52 | 54.2% |
| Total | 96 | 100.0% |
Housing Structures by Occupancy in Sanford
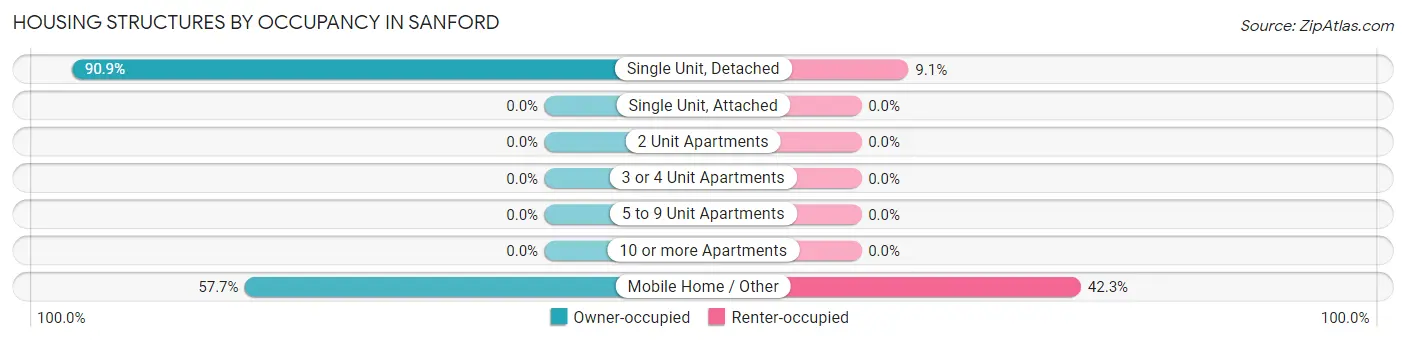
| Structure Type | Owner-occupied | Renter-occupied |
| Single Unit, Detached | 40 (90.9%) | 4 (9.1%) |
| Single Unit, Attached | 0 (0.0%) | 0 (0.0%) |
| 2 Unit Apartments | 0 (0.0%) | 0 (0.0%) |
| 3 or 4 Unit Apartments | 0 (0.0%) | 0 (0.0%) |
| 5 to 9 Unit Apartments | 0 (0.0%) | 0 (0.0%) |
| 10 or more Apartments | 0 (0.0%) | 0 (0.0%) |
| Mobile Home / Other | 30 (57.7%) | 22 (42.3%) |
| Total | 70 (72.9%) | 26 (27.1%) |
Housing Structures by Number of Rooms in Sanford
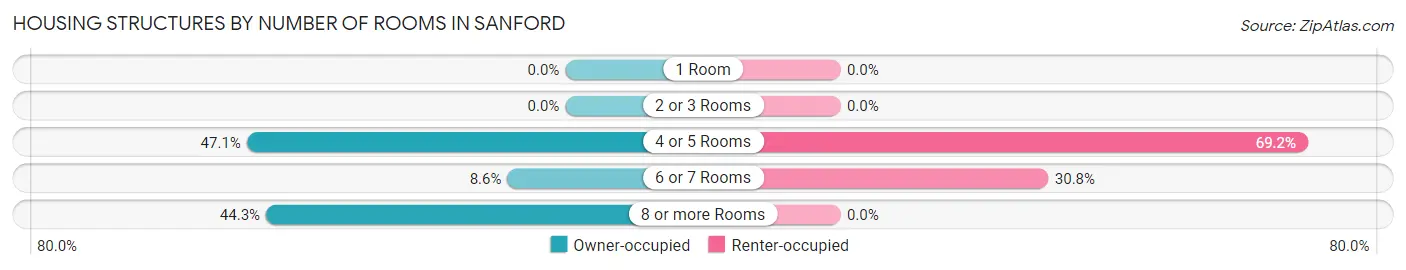
| Number of Rooms | Owner-occupied | Renter-occupied |
| 1 Room | 0 (0.0%) | 0 (0.0%) |
| 2 or 3 Rooms | 0 (0.0%) | 0 (0.0%) |
| 4 or 5 Rooms | 33 (47.1%) | 18 (69.2%) |
| 6 or 7 Rooms | 6 (8.6%) | 8 (30.8%) |
| 8 or more Rooms | 31 (44.3%) | 0 (0.0%) |
| Total | 70 (100.0%) | 26 (100.0%) |
Housing Structure by Heating Type in Sanford
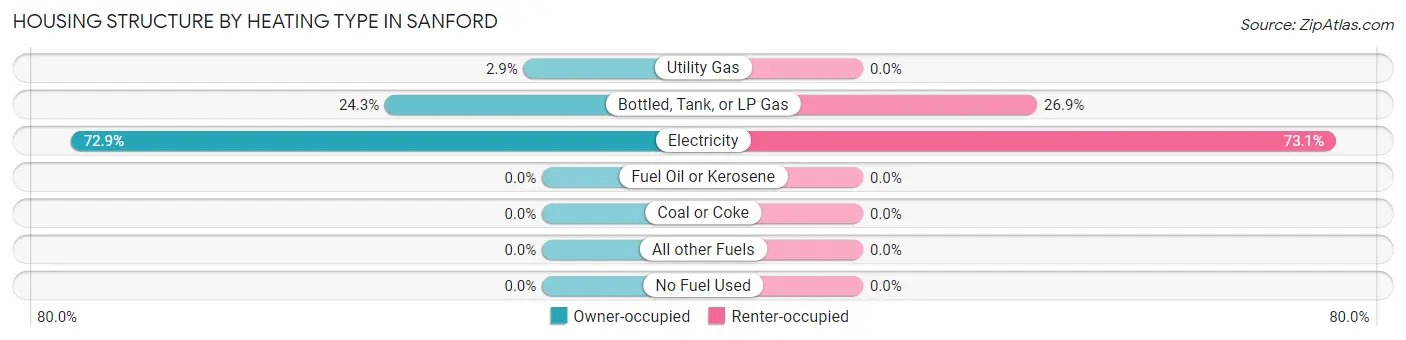
| Heating Type | Owner-occupied | Renter-occupied |
| Utility Gas | 2 (2.9%) | 0 (0.0%) |
| Bottled, Tank, or LP Gas | 17 (24.3%) | 7 (26.9%) |
| Electricity | 51 (72.9%) | 19 (73.1%) |
| Fuel Oil or Kerosene | 0 (0.0%) | 0 (0.0%) |
| Coal or Coke | 0 (0.0%) | 0 (0.0%) |
| All other Fuels | 0 (0.0%) | 0 (0.0%) |
| No Fuel Used | 0 (0.0%) | 0 (0.0%) |
| Total | 70 (100.0%) | 26 (100.0%) |
Household Vehicle Usage in Sanford
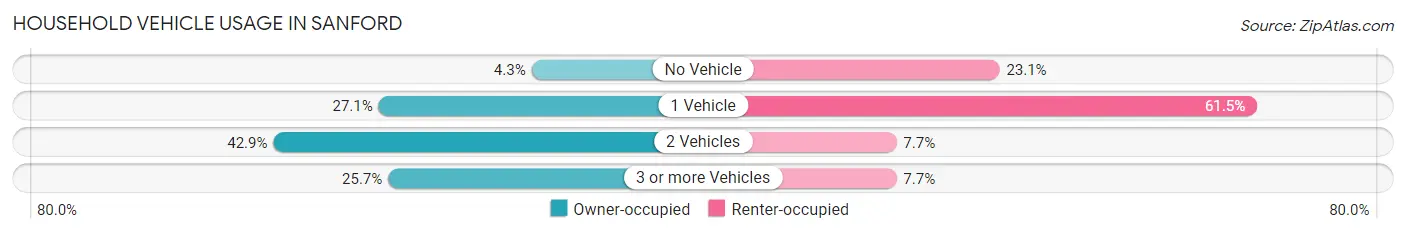
| Vehicles per Household | Owner-occupied | Renter-occupied |
| No Vehicle | 3 (4.3%) | 6 (23.1%) |
| 1 Vehicle | 19 (27.1%) | 16 (61.5%) |
| 2 Vehicles | 30 (42.9%) | 2 (7.7%) |
| 3 or more Vehicles | 18 (25.7%) | 2 (7.7%) |
| Total | 70 (100.0%) | 26 (100.0%) |
Real Estate & Mortgages in Sanford
Real Estate and Mortgage Overview in Sanford
| Characteristic | Without Mortgage | With Mortgage |
| Housing Units | 48 | 22 |
| Median Property Value | - | - |
| Median Household Income | $18,750 | $1 |
| Monthly Housing Costs | $444 | $0 |
| Real Estate Taxes | $264 | $0 |
Property Value by Mortgage Status in Sanford
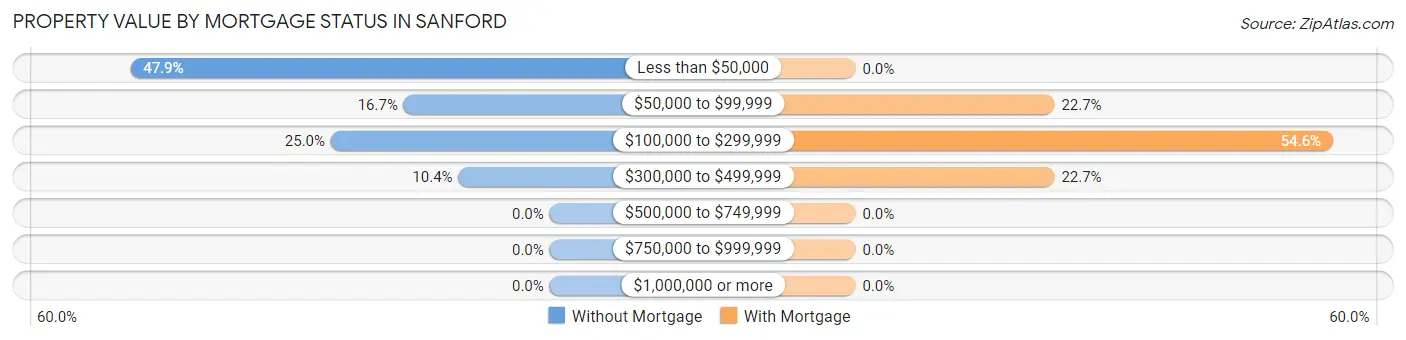
| Property Value | Without Mortgage | With Mortgage |
| Less than $50,000 | 23 (47.9%) | 0 (0.0%) |
| $50,000 to $99,999 | 8 (16.7%) | 5 (22.7%) |
| $100,000 to $299,999 | 12 (25.0%) | 12 (54.5%) |
| $300,000 to $499,999 | 5 (10.4%) | 5 (22.7%) |
| $500,000 to $749,999 | 0 (0.0%) | 0 (0.0%) |
| $750,000 to $999,999 | 0 (0.0%) | 0 (0.0%) |
| $1,000,000 or more | 0 (0.0%) | 0 (0.0%) |
| Total | 48 (100.0%) | 22 (100.0%) |
Household Income by Mortgage Status in Sanford
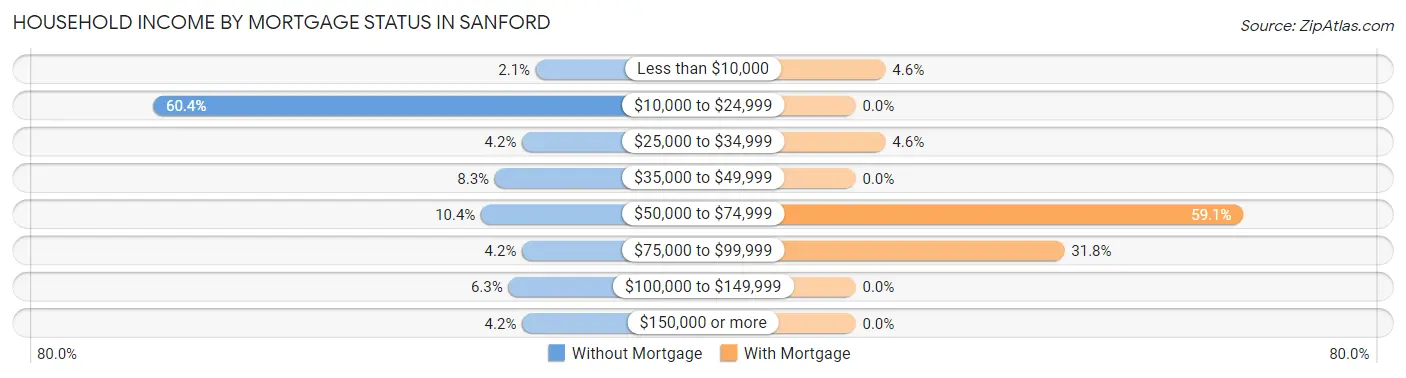
| Household Income | Without Mortgage | With Mortgage |
| Less than $10,000 | 1 (2.1%) | 1 (4.5%) |
| $10,000 to $24,999 | 29 (60.4%) | 0 (0.0%) |
| $25,000 to $34,999 | 2 (4.2%) | 1 (4.5%) |
| $35,000 to $49,999 | 4 (8.3%) | 0 (0.0%) |
| $50,000 to $74,999 | 5 (10.4%) | 13 (59.1%) |
| $75,000 to $99,999 | 2 (4.2%) | 7 (31.8%) |
| $100,000 to $149,999 | 3 (6.2%) | 0 (0.0%) |
| $150,000 or more | 2 (4.2%) | 0 (0.0%) |
| Total | 48 (100.0%) | 22 (100.0%) |
Property Value to Household Income Ratio in Sanford
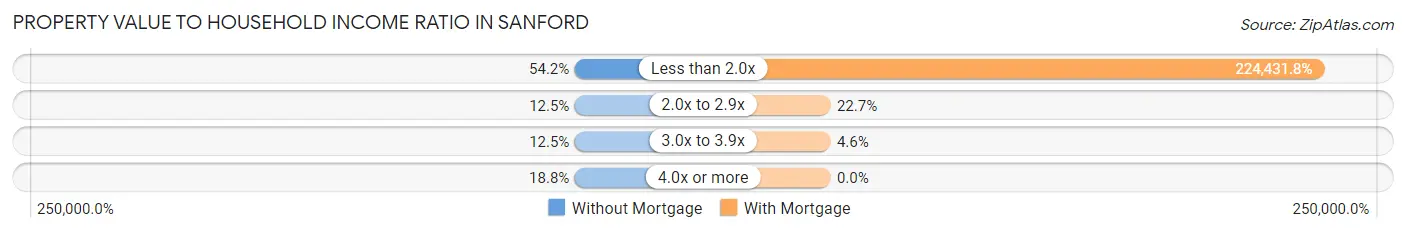
| Value-to-Income Ratio | Without Mortgage | With Mortgage |
| Less than 2.0x | 26 (54.2%) | 49,375 (224,431.8%) |
| 2.0x to 2.9x | 6 (12.5%) | 5 (22.7%) |
| 3.0x to 3.9x | 6 (12.5%) | 1 (4.5%) |
| 4.0x or more | 9 (18.8%) | 0 (0.0%) |
| Total | 48 (100.0%) | 22 (100.0%) |
Real Estate Taxes by Mortgage Status in Sanford
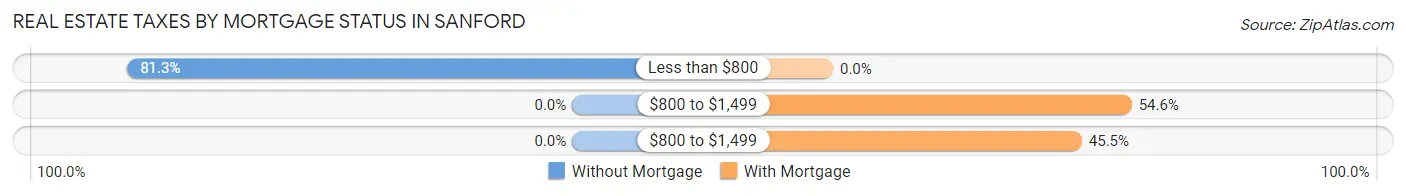
| Property Taxes | Without Mortgage | With Mortgage |
| Less than $800 | 39 (81.2%) | 0 (0.0%) |
| $800 to $1,499 | 0 (0.0%) | 12 (54.5%) |
| $800 to $1,499 | 0 (0.0%) | 10 (45.5%) |
| Total | 48 (100.0%) | 22 (100.0%) |
Health & Disability in Sanford
Health Insurance Coverage by Age in Sanford
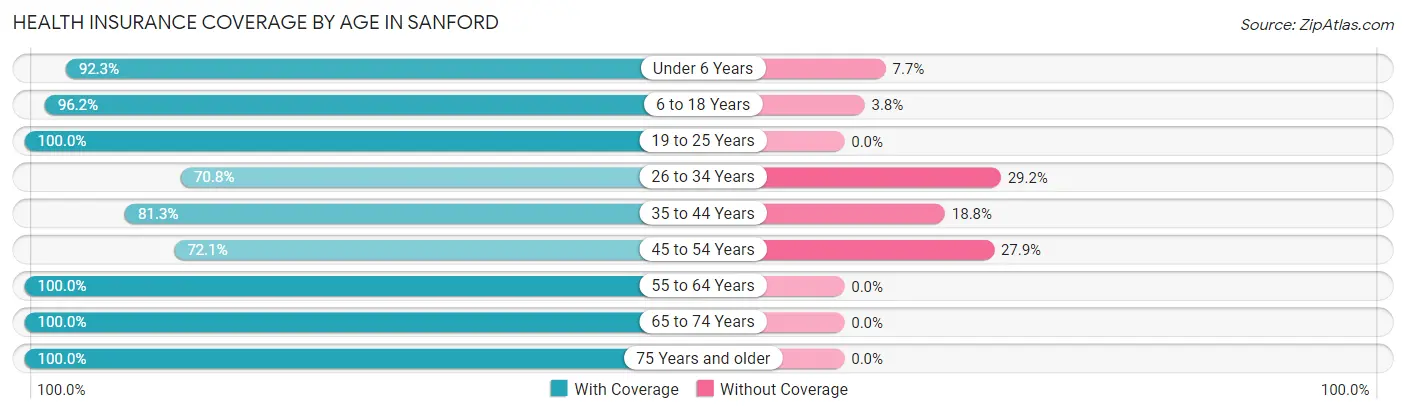
| Age Bracket | With Coverage | Without Coverage |
| Under 6 Years | 24 (92.3%) | 2 (7.7%) |
| 6 to 18 Years | 51 (96.2%) | 2 (3.8%) |
| 19 to 25 Years | 20 (100.0%) | 0 (0.0%) |
| 26 to 34 Years | 17 (70.8%) | 7 (29.2%) |
| 35 to 44 Years | 26 (81.2%) | 6 (18.8%) |
| 45 to 54 Years | 31 (72.1%) | 12 (27.9%) |
| 55 to 64 Years | 25 (100.0%) | 0 (0.0%) |
| 65 to 74 Years | 32 (100.0%) | 0 (0.0%) |
| 75 Years and older | 18 (100.0%) | 0 (0.0%) |
| Total | 244 (89.4%) | 29 (10.6%) |
Health Insurance Coverage by Citizenship Status in Sanford
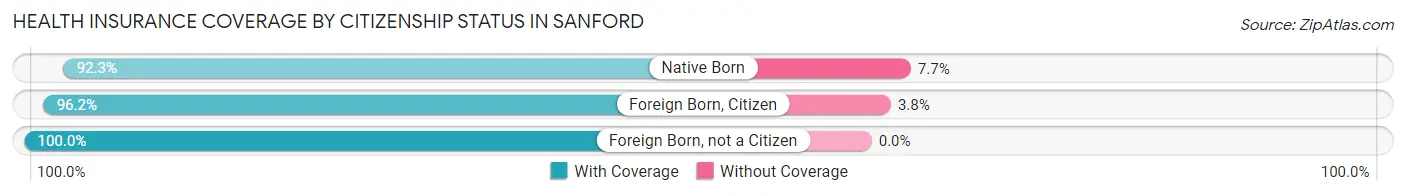
| Citizenship Status | With Coverage | Without Coverage |
| Native Born | 24 (92.3%) | 2 (7.7%) |
| Foreign Born, Citizen | 51 (96.2%) | 2 (3.8%) |
| Foreign Born, not a Citizen | 20 (100.0%) | 0 (0.0%) |
Health Insurance Coverage by Household Income in Sanford
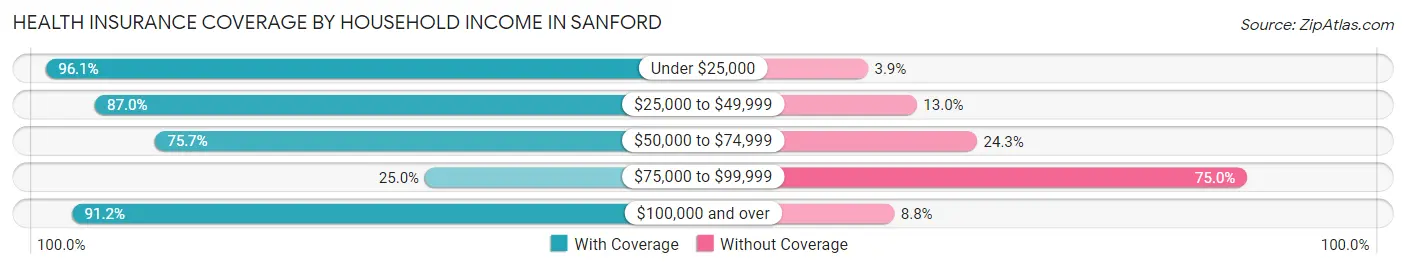
| Household Income | With Coverage | Without Coverage |
| Under $25,000 | 124 (96.1%) | 5 (3.9%) |
| $25,000 to $49,999 | 60 (87.0%) | 9 (13.0%) |
| $50,000 to $74,999 | 28 (75.7%) | 9 (24.3%) |
| $75,000 to $99,999 | 1 (25.0%) | 3 (75.0%) |
| $100,000 and over | 31 (91.2%) | 3 (8.8%) |
Public vs Private Health Insurance Coverage by Age in Sanford
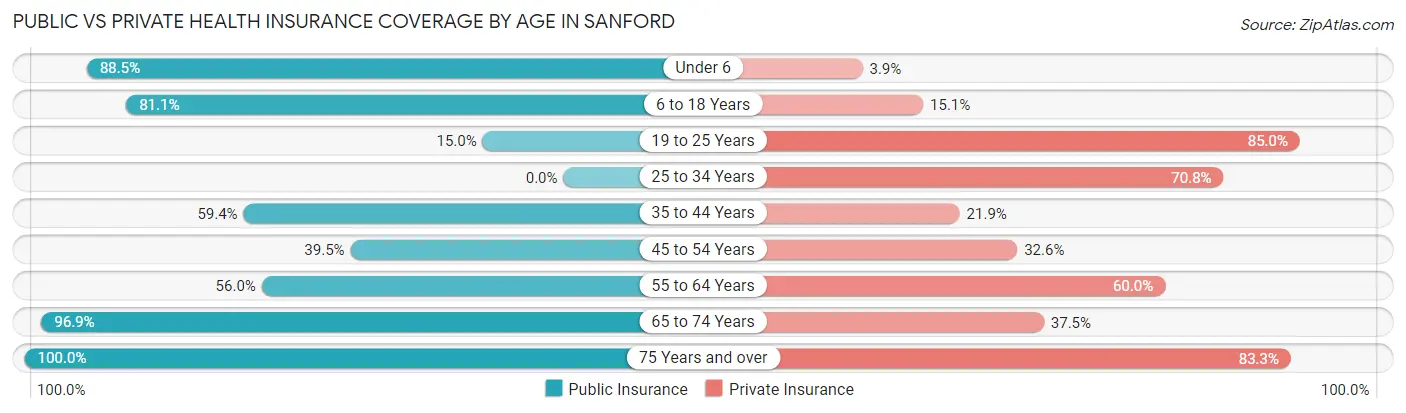
| Age Bracket | Public Insurance | Private Insurance |
| Under 6 | 23 (88.5%) | 1 (3.8%) |
| 6 to 18 Years | 43 (81.1%) | 8 (15.1%) |
| 19 to 25 Years | 3 (15.0%) | 17 (85.0%) |
| 25 to 34 Years | 0 (0.0%) | 17 (70.8%) |
| 35 to 44 Years | 19 (59.4%) | 7 (21.9%) |
| 45 to 54 Years | 17 (39.5%) | 14 (32.6%) |
| 55 to 64 Years | 14 (56.0%) | 15 (60.0%) |
| 65 to 74 Years | 31 (96.9%) | 12 (37.5%) |
| 75 Years and over | 18 (100.0%) | 15 (83.3%) |
| Total | 168 (61.5%) | 106 (38.8%) |
Disability Status by Sex by Age in Sanford
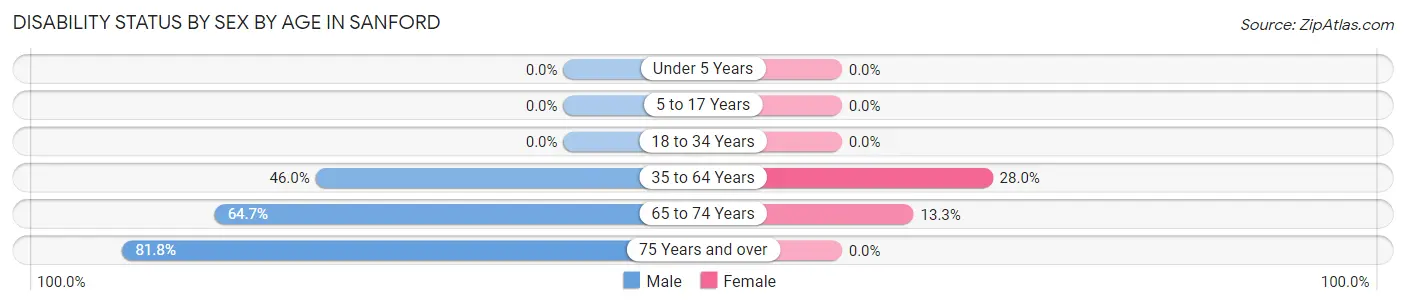
| Age Bracket | Male | Female |
| Under 5 Years | 0 (0.0%) | 0 (0.0%) |
| 5 to 17 Years | 0 (0.0%) | 0 (0.0%) |
| 18 to 34 Years | 0 (0.0%) | 0 (0.0%) |
| 35 to 64 Years | 23 (46.0%) | 14 (28.0%) |
| 65 to 74 Years | 11 (64.7%) | 2 (13.3%) |
| 75 Years and over | 9 (81.8%) | 0 (0.0%) |
Disability Class by Sex by Age in Sanford
Disability Class: Hearing Difficulty
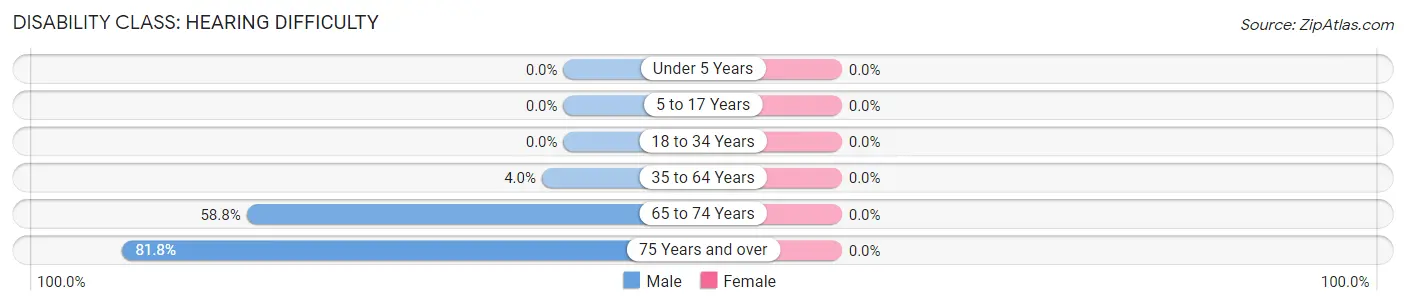
| Age Bracket | Male | Female |
| Under 5 Years | 0 (0.0%) | 0 (0.0%) |
| 5 to 17 Years | 0 (0.0%) | 0 (0.0%) |
| 18 to 34 Years | 0 (0.0%) | 0 (0.0%) |
| 35 to 64 Years | 2 (4.0%) | 0 (0.0%) |
| 65 to 74 Years | 10 (58.8%) | 0 (0.0%) |
| 75 Years and over | 9 (81.8%) | 0 (0.0%) |
Disability Class: Vision Difficulty
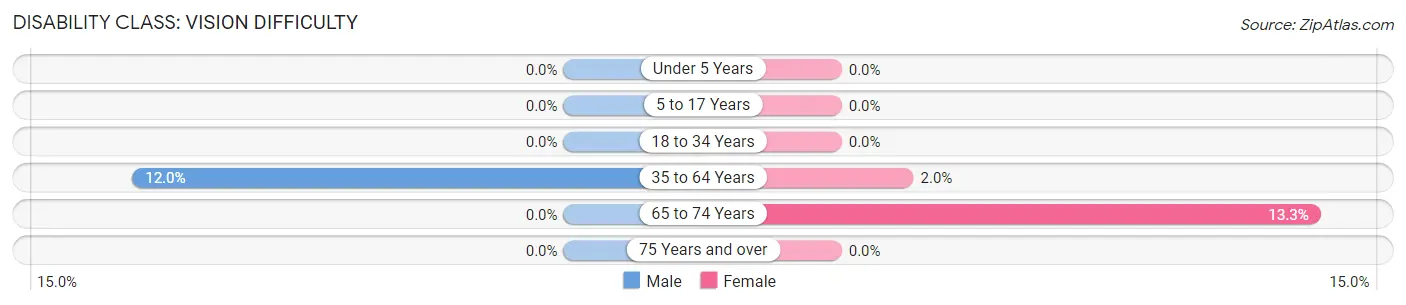
| Age Bracket | Male | Female |
| Under 5 Years | 0 (0.0%) | 0 (0.0%) |
| 5 to 17 Years | 0 (0.0%) | 0 (0.0%) |
| 18 to 34 Years | 0 (0.0%) | 0 (0.0%) |
| 35 to 64 Years | 6 (12.0%) | 1 (2.0%) |
| 65 to 74 Years | 0 (0.0%) | 2 (13.3%) |
| 75 Years and over | 0 (0.0%) | 0 (0.0%) |
Disability Class: Cognitive Difficulty
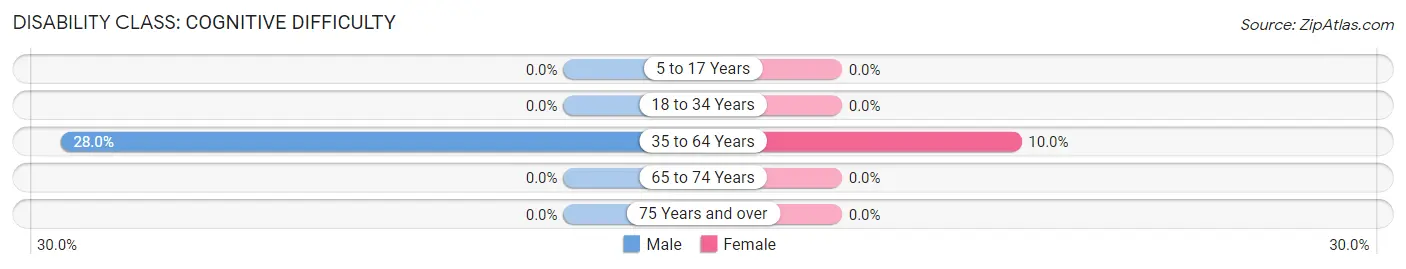
| Age Bracket | Male | Female |
| 5 to 17 Years | 0 (0.0%) | 0 (0.0%) |
| 18 to 34 Years | 0 (0.0%) | 0 (0.0%) |
| 35 to 64 Years | 14 (28.0%) | 5 (10.0%) |
| 65 to 74 Years | 0 (0.0%) | 0 (0.0%) |
| 75 Years and over | 0 (0.0%) | 0 (0.0%) |
Disability Class: Ambulatory Difficulty
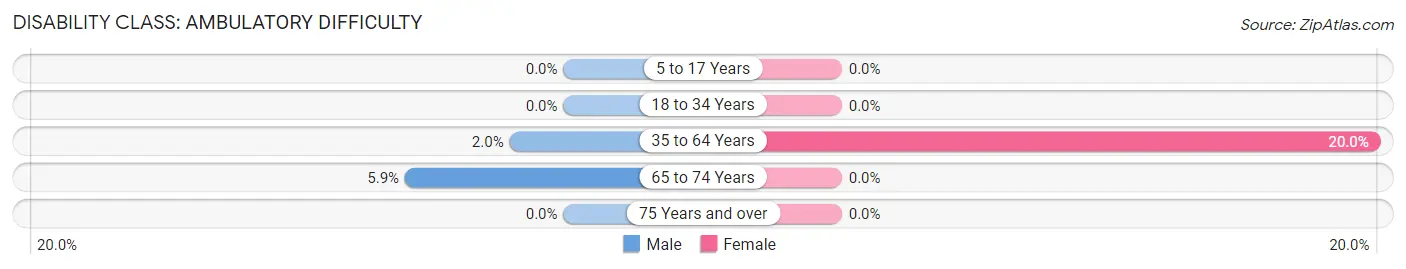
| Age Bracket | Male | Female |
| 5 to 17 Years | 0 (0.0%) | 0 (0.0%) |
| 18 to 34 Years | 0 (0.0%) | 0 (0.0%) |
| 35 to 64 Years | 1 (2.0%) | 10 (20.0%) |
| 65 to 74 Years | 1 (5.9%) | 0 (0.0%) |
| 75 Years and over | 0 (0.0%) | 0 (0.0%) |
Disability Class: Self-Care Difficulty
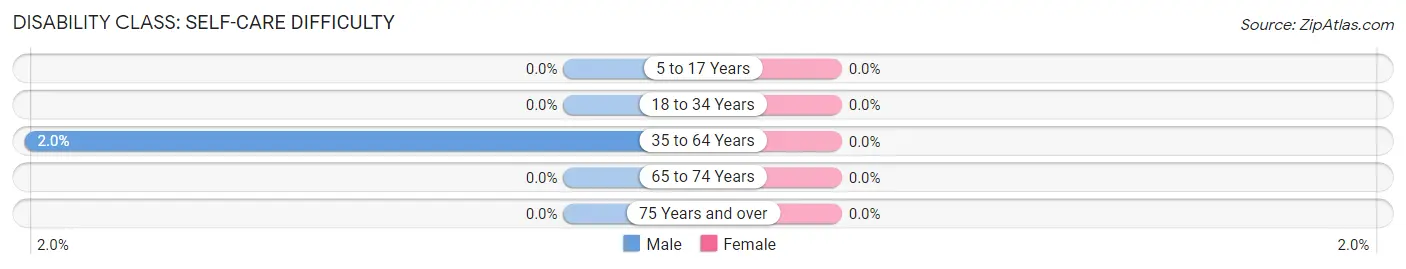
| Age Bracket | Male | Female |
| 5 to 17 Years | 0 (0.0%) | 0 (0.0%) |
| 18 to 34 Years | 0 (0.0%) | 0 (0.0%) |
| 35 to 64 Years | 1 (2.0%) | 0 (0.0%) |
| 65 to 74 Years | 0 (0.0%) | 0 (0.0%) |
| 75 Years and over | 0 (0.0%) | 0 (0.0%) |
Technology Access in Sanford
Computing Device Access in Sanford
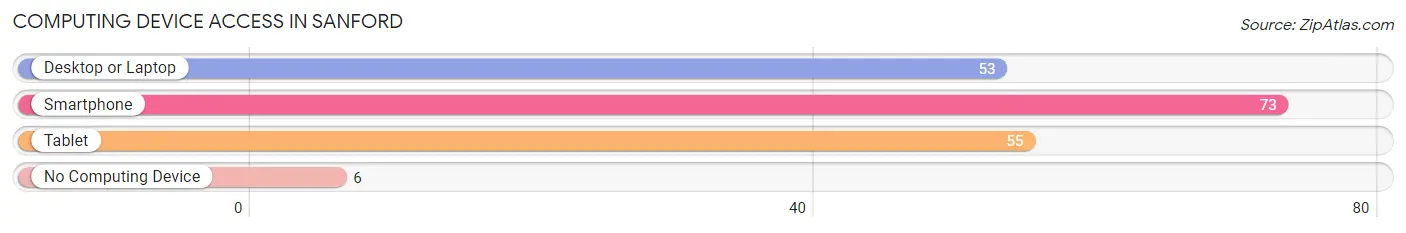
| Device Type | # Households | % Households |
| Desktop or Laptop | 53 | 55.2% |
| Smartphone | 73 | 76.0% |
| Tablet | 55 | 57.3% |
| No Computing Device | 6 | 6.2% |
| Total | 96 | 100.0% |
Internet Access in Sanford
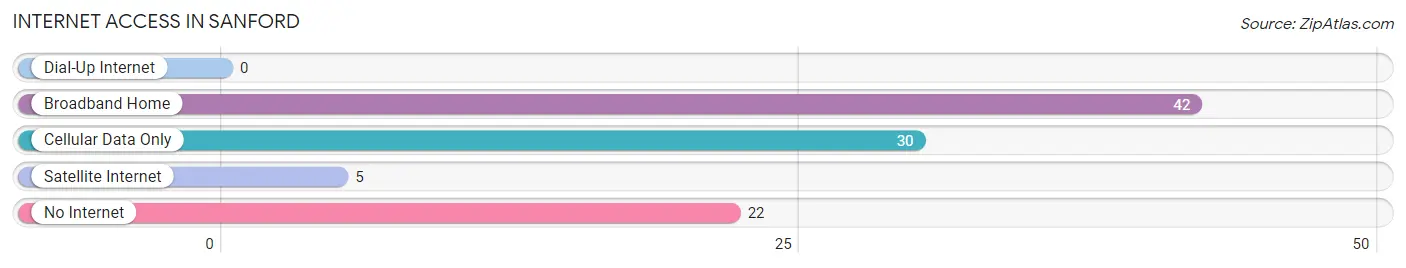
| Internet Type | # Households | % Households |
| Dial-Up Internet | 0 | 0.0% |
| Broadband Home | 42 | 43.8% |
| Cellular Data Only | 30 | 31.2% |
| Satellite Internet | 5 | 5.2% |
| No Internet | 22 | 22.9% |
| Total | 96 | 100.0% |
Sanford Summary
Sanford is a small town located in the state of Alabama, in the United States. It is situated in the northwest corner of the state, in the foothills of the Appalachian Mountains. The town is located in the county of Limestone, and is part of the Huntsville-Decatur Combined Statistical Area. The population of Sanford was estimated to be 1,845 in the year 2020.
History
Sanford was founded in 1818 by a group of settlers from North Carolina. The town was named after the Sanford family, who were among the first settlers. The town was originally a farming community, and the main crops grown were cotton, corn, and wheat. The town was also known for its production of wool and leather goods.
In the late 19th century, Sanford began to experience a period of growth and development. The town was incorporated in 1891, and the first mayor was elected in 1892. The town was connected to the railroad in 1895, and this allowed for the growth of the local economy.
In the early 20th century, Sanford experienced a period of decline. The Great Depression caused many businesses to close, and the population of the town decreased. However, the town experienced a resurgence in the 1950s, when the local economy began to diversify.
Geography
Sanford is located in the northwest corner of Alabama, in the foothills of the Appalachian Mountains. The town is situated in the county of Limestone, and is part of the Huntsville-Decatur Combined Statistical Area. The town is located at an elevation of 845 feet above sea level.
The climate in Sanford is humid subtropical, with hot summers and mild winters. The average annual temperature is around 68 degrees Fahrenheit, and the average annual precipitation is around 50 inches.
Economy
The economy of Sanford is largely based on agriculture and manufacturing. The town is home to several large farms, which produce a variety of crops, including cotton, corn, and wheat. The town is also home to several manufacturing companies, which produce a variety of products, including furniture, clothing, and automotive parts.
The town is also home to several small businesses, including restaurants, retail stores, and service providers. The town is also home to several educational institutions, including a community college and a technical school.
Demographics
As of the 2020 census, the population of Sanford was estimated to be 1,845. The racial makeup of the town was 79.3% White, 17.2% African American, 0.7% Native American, 0.3% Asian, 0.1% Pacific Islander, and 2.4% from other races. The median household income was $37,941, and the median family income was $45,941.
Conclusion
Sanford is a small town located in the northwest corner of Alabama, in the foothills of the Appalachian Mountains. The town has a long history, and has experienced periods of growth and decline. The economy of Sanford is largely based on agriculture and manufacturing, and the town is home to several small businesses. The population of Sanford was estimated to be 1,845 in the year 2020, and the racial makeup of the town was 79.3% White, 17.2% African American, 0.7% Native American, 0.3% Asian, 0.1% Pacific Islander, and 2.4% from other races.
Common Questions
What is Per Capita Income in Sanford?
Per Capita income in Sanford is $15,533.
What is the Median Family Income in Sanford?
Median Family Income in Sanford is $38,333.
What is Income or Wage Gap in Sanford?
Income or Wage Gap in Sanford is 47.6%.
Women in Sanford earn 52.4 cents for every dollar earned by a man.
What is Inequality or Gini Index in Sanford?
Inequality or Gini Index in Sanford is 0.46.
What is the Total Population of Sanford?
Total Population of Sanford is 273.
What is the Total Male Population of Sanford?
Total Male Population of Sanford is 143.
What is the Total Female Population of Sanford?
Total Female Population of Sanford is 130.
What is the Ratio of Males per 100 Females in Sanford?
There are 110.00 Males per 100 Females in Sanford.
What is the Ratio of Females per 100 Males in Sanford?
There are 90.91 Females per 100 Males in Sanford.
What is the Median Population Age in Sanford?
Median Population Age in Sanford is 35.9 Years.
What is the Average Family Size in Sanford
Average Family Size in Sanford is 3.1 People.
What is the Average Household Size in Sanford
Average Household Size in Sanford is 2.8 People.
How Large is the Labor Force in Sanford?
There are 84 People in the Labor Forcein in Sanford.
What is the Percentage of People in the Labor Force in Sanford?
39.3% of People are in the Labor Force in Sanford.
What is the Unemployment Rate in Sanford?
Unemployment Rate in Sanford is 3.6%.