Dunnavant, AL Map & Demographics
Dunnavant Map
Dunnavant Overview
$37,852
PER CAPITA INCOME
$77,948
AVG FAMILY INCOME
$64,107
AVG HOUSEHOLD INCOME
59.5%
WAGE / INCOME GAP [ % ]
40.5¢/ $1
WAGE / INCOME GAP [ $ ]
0.41
INEQUALITY / GINI INDEX
1,134
TOTAL POPULATION
616
MALE POPULATION
518
FEMALE POPULATION
118.92
MALES / 100 FEMALES
84.09
FEMALES / 100 MALES
52.3
MEDIAN AGE
2.6
AVG FAMILY SIZE
2.4
AVG HOUSEHOLD SIZE
690
LABOR FORCE [ PEOPLE ]
68.5%
PERCENT IN LABOR FORCE
Income in Dunnavant
Income Overview in Dunnavant
Per Capita Income in Dunnavant is $37,852, while median incomes of families and households are $77,948 and $64,107 respectively.
| Characteristic | Number | Measure |
| Per Capita Income | 1,134 | $37,852 |
| Median Family Income | 367 | $77,948 |
| Mean Family Income | 367 | $90,304 |
| Median Household Income | 478 | $64,107 |
| Mean Household Income | 478 | $77,732 |
| Income Deficit | 367 | $0 |
| Wage / Income Gap (%) | 1,134 | 59.51% |
| Wage / Income Gap ($) | 1,134 | 40.49¢ per $1 |
| Gini / Inequality Index | 1,134 | 0.41 |
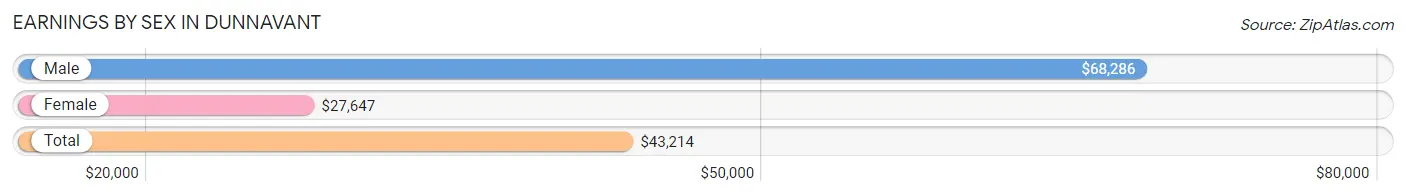
Earnings by Sex in Dunnavant
Average Earnings in Dunnavant are $43,214, $68,286 for men and $27,647 for women, a difference of 59.5%.
| Sex | Number | Average Earnings |
| Male | 408 (59.1%) | $68,286 |
| Female | 282 (40.9%) | $27,647 |
| Total | 690 (100.0%) | $43,214 |
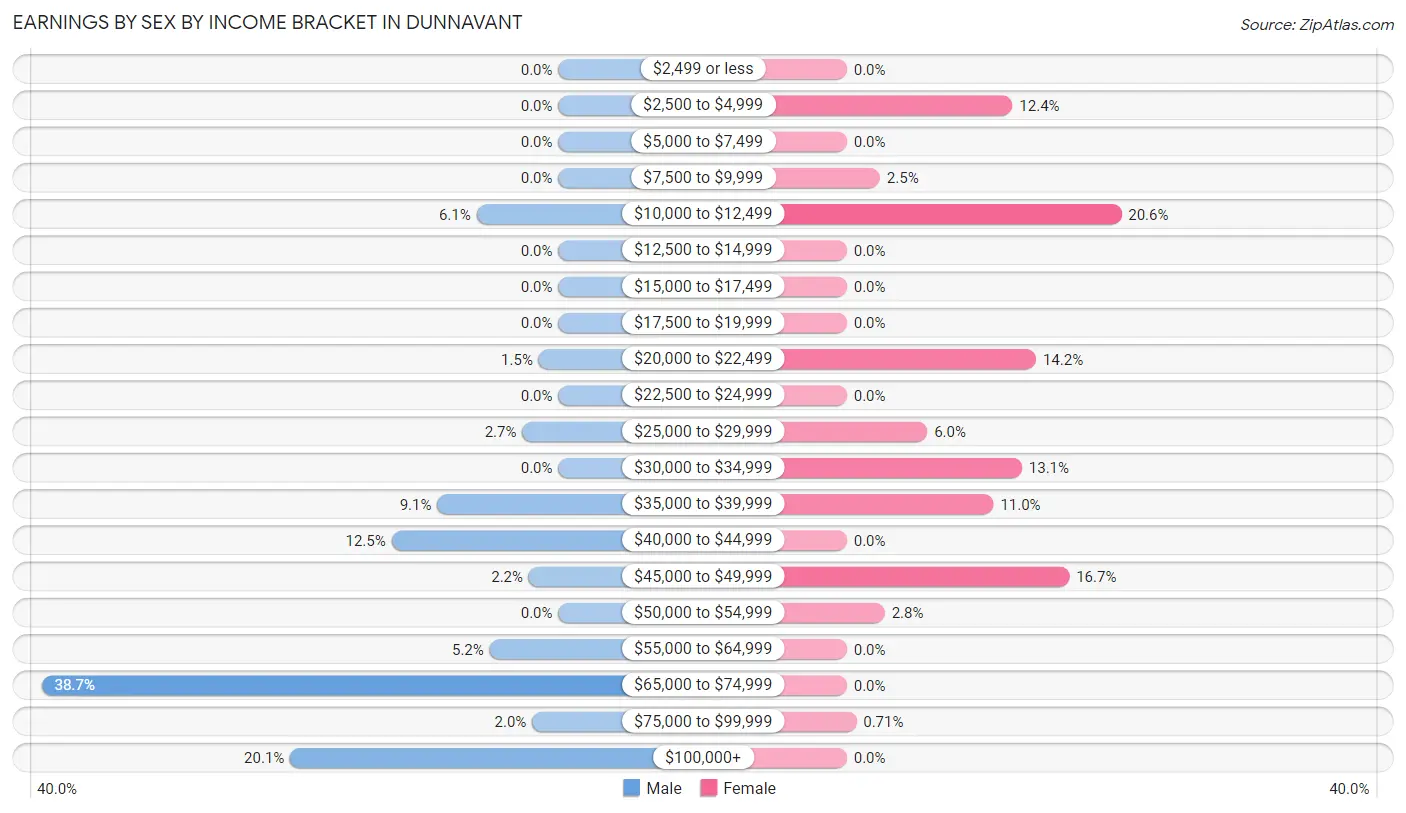
Earnings by Sex by Income Bracket in Dunnavant
The most common earnings brackets in Dunnavant are $65,000 to $74,999 for men (158 | 38.7%) and $10,000 to $12,499 for women (58 | 20.6%).
| Income | Male | Female |
| $2,499 or less | 0 (0.0%) | 0 (0.0%) |
| $2,500 to $4,999 | 0 (0.0%) | 35 (12.4%) |
| $5,000 to $7,499 | 0 (0.0%) | 0 (0.0%) |
| $7,500 to $9,999 | 0 (0.0%) | 7 (2.5%) |
| $10,000 to $12,499 | 25 (6.1%) | 58 (20.6%) |
| $12,500 to $14,999 | 0 (0.0%) | 0 (0.0%) |
| $15,000 to $17,499 | 0 (0.0%) | 0 (0.0%) |
| $17,500 to $19,999 | 0 (0.0%) | 0 (0.0%) |
| $20,000 to $22,499 | 6 (1.5%) | 40 (14.2%) |
| $22,500 to $24,999 | 0 (0.0%) | 0 (0.0%) |
| $25,000 to $29,999 | 11 (2.7%) | 17 (6.0%) |
| $30,000 to $34,999 | 0 (0.0%) | 37 (13.1%) |
| $35,000 to $39,999 | 37 (9.1%) | 31 (11.0%) |
| $40,000 to $44,999 | 51 (12.5%) | 0 (0.0%) |
| $45,000 to $49,999 | 9 (2.2%) | 47 (16.7%) |
| $50,000 to $54,999 | 0 (0.0%) | 8 (2.8%) |
| $55,000 to $64,999 | 21 (5.1%) | 0 (0.0%) |
| $65,000 to $74,999 | 158 (38.7%) | 0 (0.0%) |
| $75,000 to $99,999 | 8 (2.0%) | 2 (0.7%) |
| $100,000+ | 82 (20.1%) | 0 (0.0%) |
| Total | 408 (100.0%) | 282 (100.0%) |
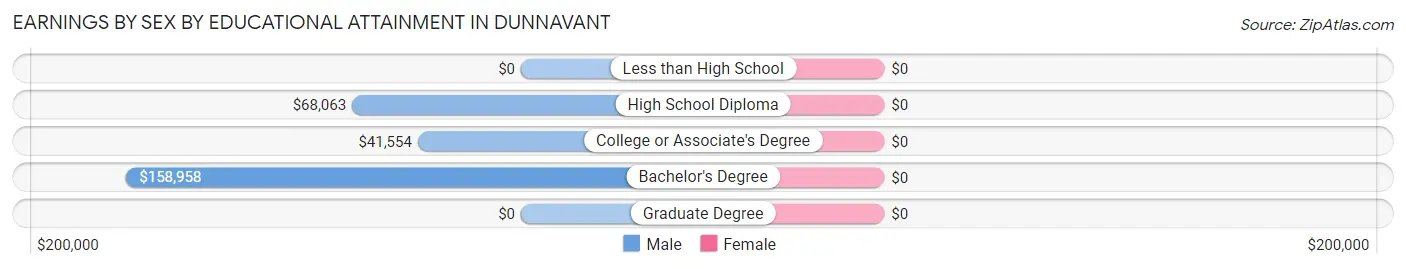
Earnings by Sex by Educational Attainment in Dunnavant
| Educational Attainment | Male Income | Female Income |
| Less than High School | - | - |
| High School Diploma | $68,063 | $0 |
| College or Associate's Degree | $41,554 | $0 |
| Bachelor's Degree | $158,958 | $0 |
| Graduate Degree | - | - |
| Total | $68,286 | $21,063 |
Family Income in Dunnavant
Family Income Brackets in Dunnavant
According to the Dunnavant family income data, there are 120 families falling into the $75,000 to $99,999 income range, which is the most common income bracket and makes up 32.7% of all families.
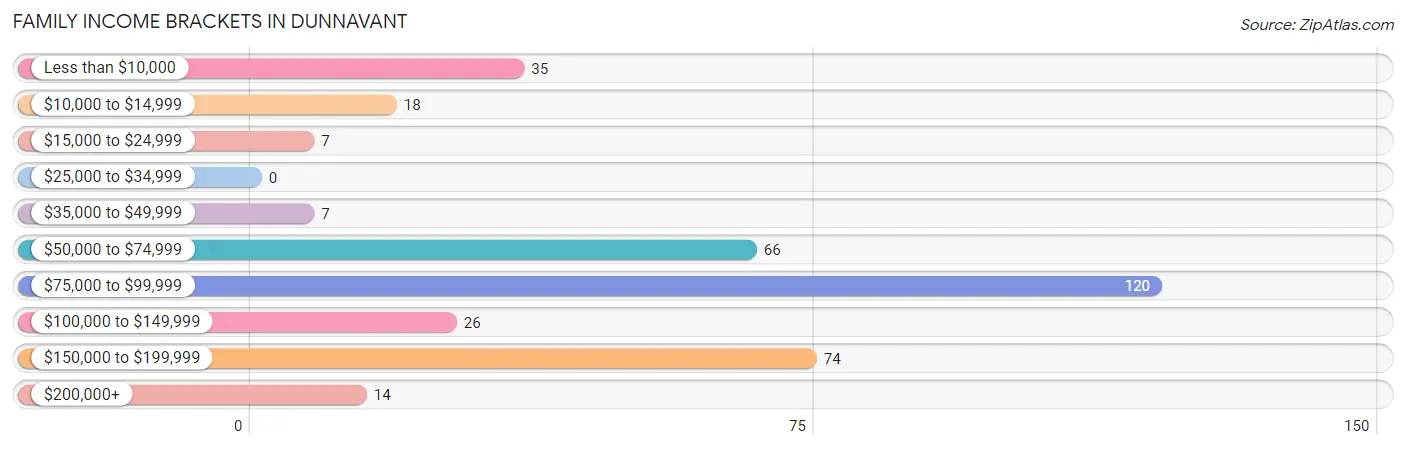
| Income Bracket | # Families | % Families |
| Less than $10,000 | 35 | 9.5% |
| $10,000 to $14,999 | 18 | 4.9% |
| $15,000 to $24,999 | 7 | 1.9% |
| $25,000 to $34,999 | 0 | 0.0% |
| $35,000 to $49,999 | 7 | 1.9% |
| $50,000 to $74,999 | 66 | 18.0% |
| $75,000 to $99,999 | 120 | 32.7% |
| $100,000 to $149,999 | 26 | 7.1% |
| $150,000 to $199,999 | 74 | 20.2% |
| $200,000+ | 14 | 3.8% |
Family Income by Famaliy Size in Dunnavant
2-person families (272 | 74.1%) account for the highest median family income in Dunnavant with $78,255 per family, while 2-person families (272 | 74.1%) have the highest median income of $39,128 per family member.
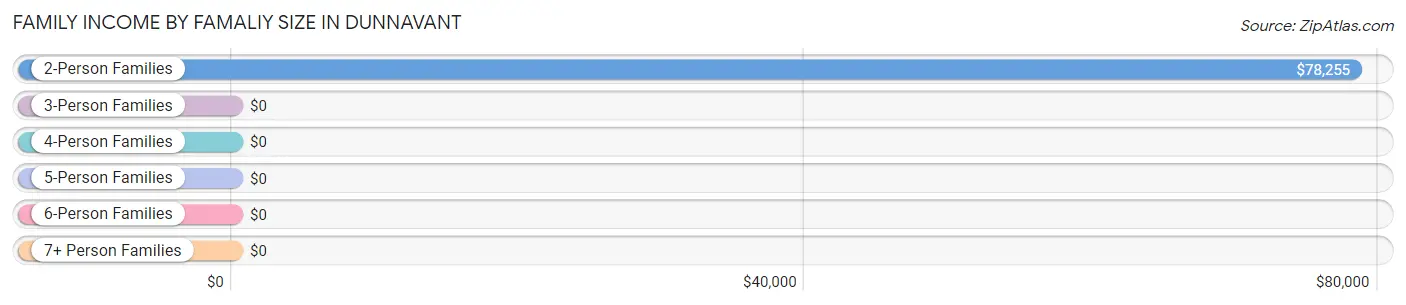
| Income Bracket | # Families | Median Income |
| 2-Person Families | 272 (74.1%) | $78,255 |
| 3-Person Families | 77 (21.0%) | $0 |
| 4-Person Families | 18 (4.9%) | $0 |
| 5-Person Families | 0 (0.0%) | $0 |
| 6-Person Families | 0 (0.0%) | $0 |
| 7+ Person Families | 0 (0.0%) | $0 |
| Total | 367 (100.0%) | $77,948 |
Family Income by Number of Earners in Dunnavant
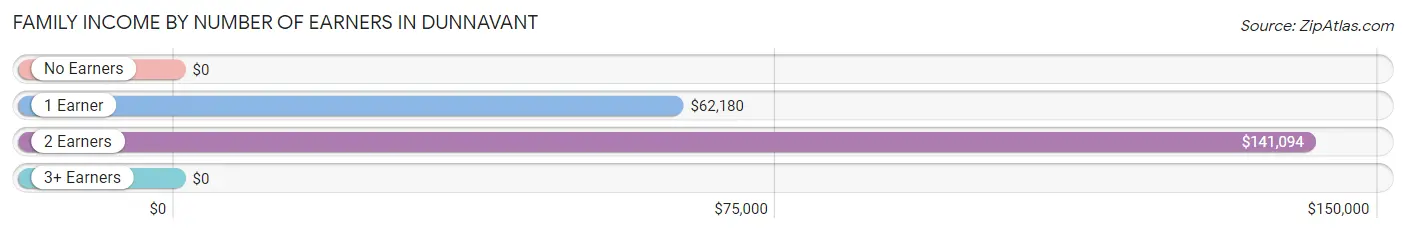
| Number of Earners | # Families | Median Income |
| No Earners | 29 (7.9%) | $0 |
| 1 Earner | 181 (49.3%) | $62,180 |
| 2 Earners | 157 (42.8%) | $141,094 |
| 3+ Earners | 0 (0.0%) | $0 |
| Total | 367 (100.0%) | $77,948 |
Household Income in Dunnavant
Household Income Brackets in Dunnavant
With 120 households falling in the category, the $75,000 to $99,999 income range is the most frequent in Dunnavant, accounting for 25.1% of all households. In contrast, only 14 households (2.9%) fall into the $200,000+ income bracket, making it the least populous group.
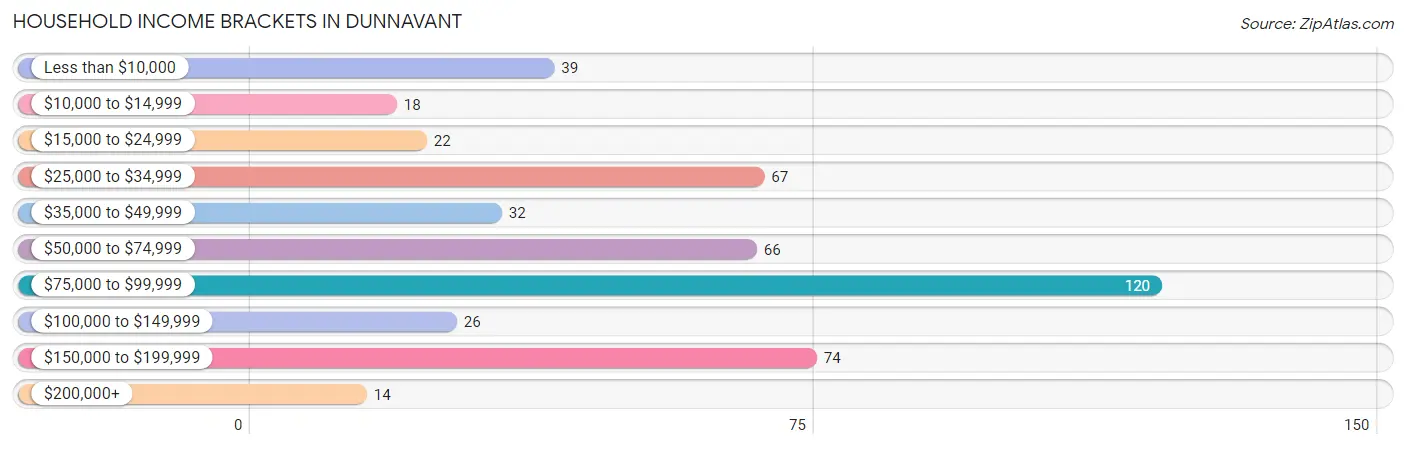
| Income Bracket | # Households | % Households |
| Less than $10,000 | 39 | 8.2% |
| $10,000 to $14,999 | 18 | 3.8% |
| $15,000 to $24,999 | 22 | 4.6% |
| $25,000 to $34,999 | 67 | 14.0% |
| $35,000 to $49,999 | 32 | 6.7% |
| $50,000 to $74,999 | 66 | 13.8% |
| $75,000 to $99,999 | 120 | 25.1% |
| $100,000 to $149,999 | 26 | 5.4% |
| $150,000 to $199,999 | 74 | 15.5% |
| $200,000+ | 14 | 2.9% |
Household Income by Householder Age in Dunnavant
The median household income in Dunnavant is $64,107, with the highest median household income of $78,939 found in the 65+ years age bracket for the primary householder. A total of 197 households (41.2%) fall into this category. Meanwhile, the 15 to 24 years age bracket for the primary householder has the lowest median household income of $0, with 17 households (3.6%) in this group.
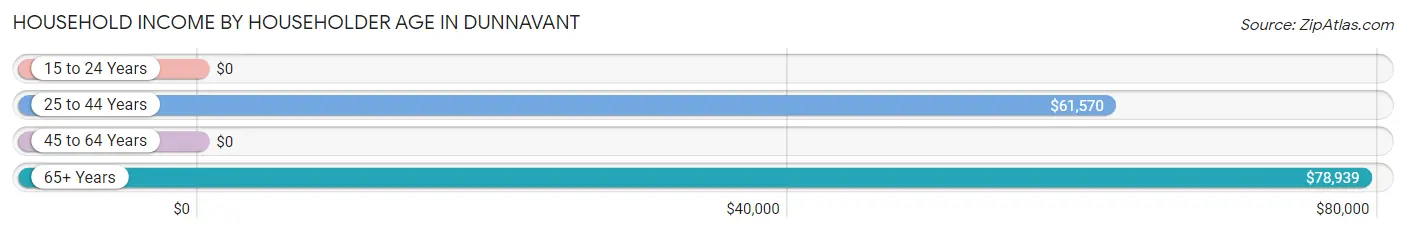
| Income Bracket | # Households | Median Income |
| 15 to 24 Years | 17 (3.6%) | $0 |
| 25 to 44 Years | 138 (28.9%) | $61,570 |
| 45 to 64 Years | 126 (26.4%) | $0 |
| 65+ Years | 197 (41.2%) | $78,939 |
| Total | 478 (100.0%) | $64,107 |
Poverty in Dunnavant
Income Below Poverty by Sex and Age in Dunnavant
With 19.2% poverty level for males and 8.9% for females among the residents of Dunnavant, 15 year old males and 35 to 44 year old females are the most vulnerable to poverty, with 18 males (100.0%) and 42 females (50.6%) in their respective age groups living below the poverty level.
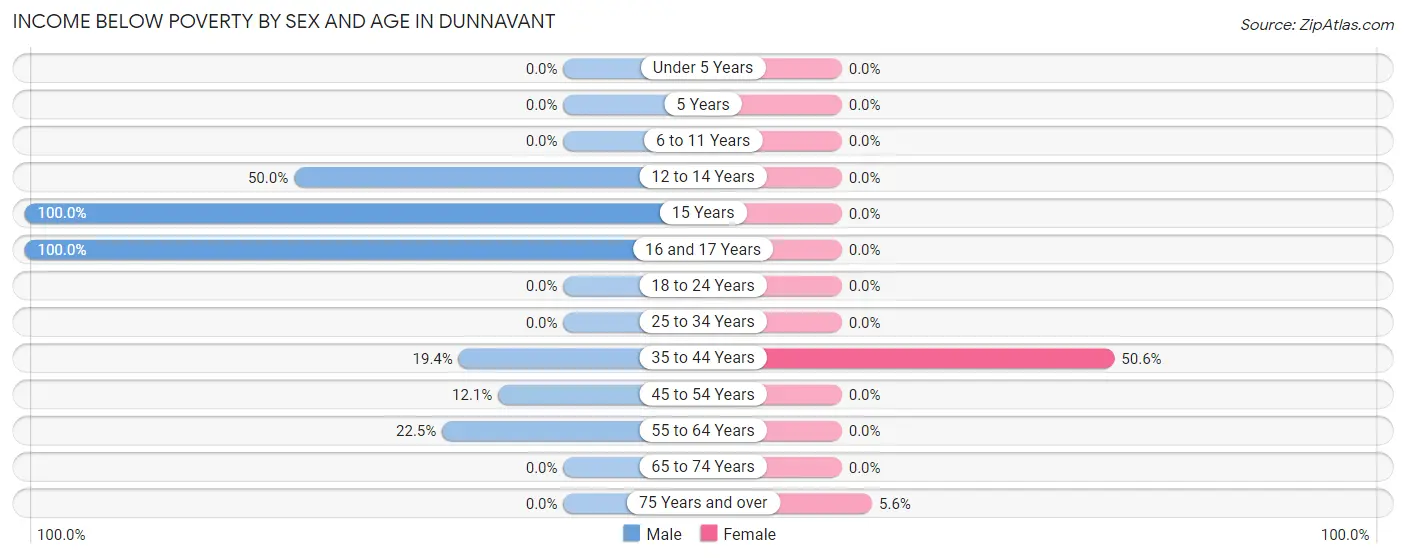
| Age Bracket | Male | Female |
| Under 5 Years | 0 (0.0%) | 0 (0.0%) |
| 5 Years | 0 (0.0%) | 0 (0.0%) |
| 6 to 11 Years | 0 (0.0%) | 0 (0.0%) |
| 12 to 14 Years | 8 (50.0%) | 0 (0.0%) |
| 15 Years | 18 (100.0%) | 0 (0.0%) |
| 16 and 17 Years | 40 (100.0%) | 0 (0.0%) |
| 18 to 24 Years | 0 (0.0%) | 0 (0.0%) |
| 25 to 34 Years | 0 (0.0%) | 0 (0.0%) |
| 35 to 44 Years | 7 (19.4%) | 42 (50.6%) |
| 45 to 54 Years | 27 (12.1%) | 0 (0.0%) |
| 55 to 64 Years | 18 (22.5%) | 0 (0.0%) |
| 65 to 74 Years | 0 (0.0%) | 0 (0.0%) |
| 75 Years and over | 0 (0.0%) | 4 (5.6%) |
| Total | 118 (19.2%) | 46 (8.9%) |
Income Above Poverty by Sex and Age in Dunnavant
According to the poverty statistics in Dunnavant, males aged under 5 years and females aged 6 to 11 years are the age groups that are most secure financially, with 100.0% of males and 100.0% of females in these age groups living above the poverty line.
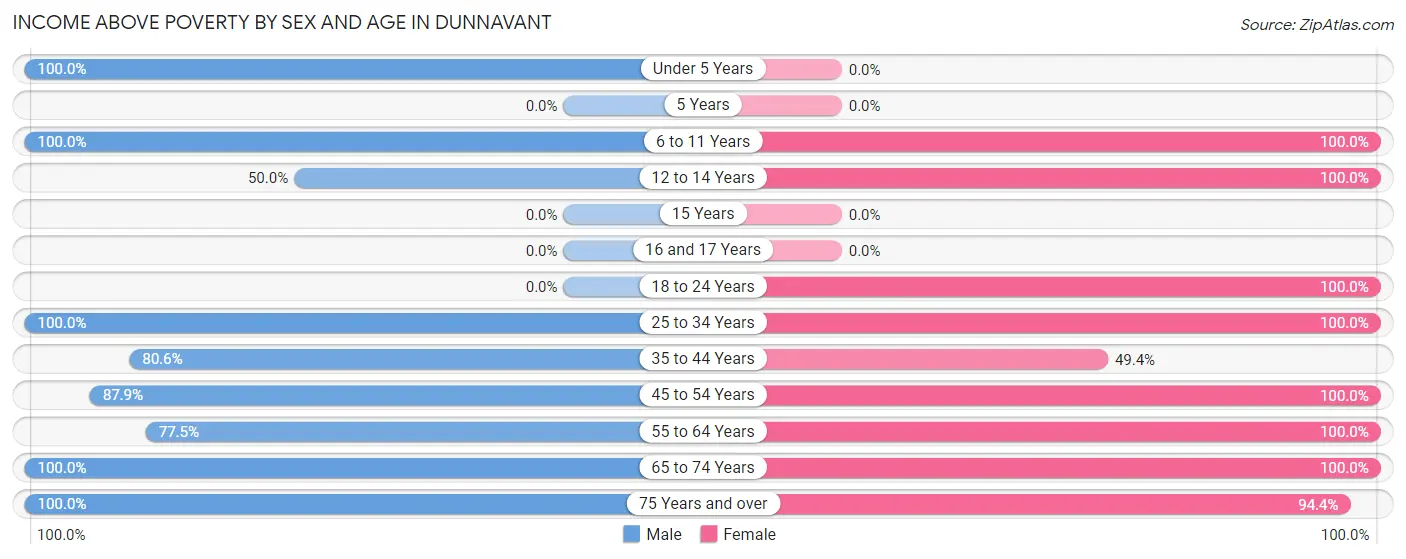
| Age Bracket | Male | Female |
| Under 5 Years | 67 (100.0%) | 0 (0.0%) |
| 5 Years | 0 (0.0%) | 0 (0.0%) |
| 6 to 11 Years | 2 (100.0%) | 15 (100.0%) |
| 12 to 14 Years | 8 (50.0%) | 8 (100.0%) |
| 15 Years | 0 (0.0%) | 0 (0.0%) |
| 16 and 17 Years | 0 (0.0%) | 0 (0.0%) |
| 18 to 24 Years | 0 (0.0%) | 70 (100.0%) |
| 25 to 34 Years | 71 (100.0%) | 17 (100.0%) |
| 35 to 44 Years | 29 (80.6%) | 41 (49.4%) |
| 45 to 54 Years | 196 (87.9%) | 32 (100.0%) |
| 55 to 64 Years | 62 (77.5%) | 104 (100.0%) |
| 65 to 74 Years | 59 (100.0%) | 118 (100.0%) |
| 75 Years and over | 4 (100.0%) | 67 (94.4%) |
| Total | 498 (80.8%) | 472 (91.1%) |
Income Below Poverty Among Married-Couple Families in Dunnavant
The poverty statistics for married-couple families in Dunnavant show that 3.1% or 7 of the total 228 families live below the poverty line. Families with 1 or 2 children have the highest poverty rate of 9.7%, comprising of 7 families. On the other hand, families with no children have the lowest poverty rate of 0.0%, which includes 0 families.
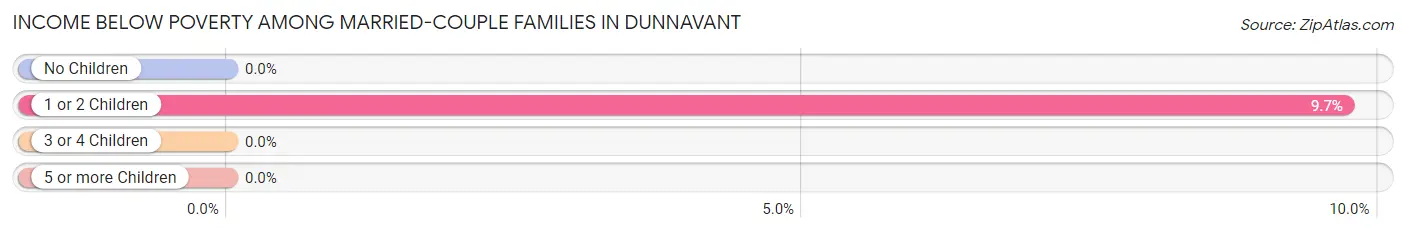
| Children | Above Poverty | Below Poverty |
| No Children | 156 (100.0%) | 0 (0.0%) |
| 1 or 2 Children | 65 (90.3%) | 7 (9.7%) |
| 3 or 4 Children | 0 (0.0%) | 0 (0.0%) |
| 5 or more Children | 0 (0.0%) | 0 (0.0%) |
| Total | 221 (96.9%) | 7 (3.1%) |
Income Below Poverty Among Single-Parent Households in Dunnavant
According to the poverty data in Dunnavant, 100.0% or 18 single-father households and 28.9% or 35 single-mother households are living below the poverty line. Among single-father households, those with 1 or 2 children have the highest poverty rate, with 18 households (100.0%) experiencing poverty. Likewise, among single-mother households, those with 1 or 2 children have the highest poverty rate, with 35 households (100.0%) falling below the poverty line.
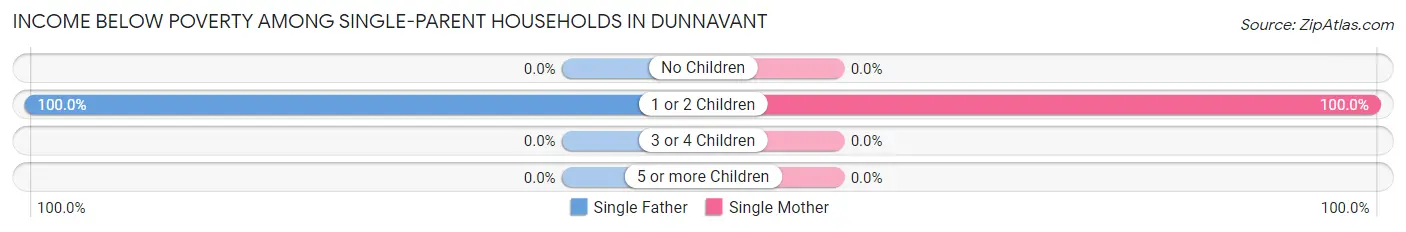
| Children | Single Father | Single Mother |
| No Children | 0 (0.0%) | 0 (0.0%) |
| 1 or 2 Children | 18 (100.0%) | 35 (100.0%) |
| 3 or 4 Children | 0 (0.0%) | 0 (0.0%) |
| 5 or more Children | 0 (0.0%) | 0 (0.0%) |
| Total | 18 (100.0%) | 35 (28.9%) |
Income Below Poverty Among Married-Couple vs Single-Parent Households in Dunnavant
The poverty data for Dunnavant shows that 7 of the married-couple family households (3.1%) and 53 of the single-parent households (38.1%) are living below the poverty level. Within the married-couple family households, those with 1 or 2 children have the highest poverty rate, with 7 households (9.7%) falling below the poverty line. Among the single-parent households, those with 1 or 2 children have the highest poverty rate, with 53 household (100.0%) living below poverty.
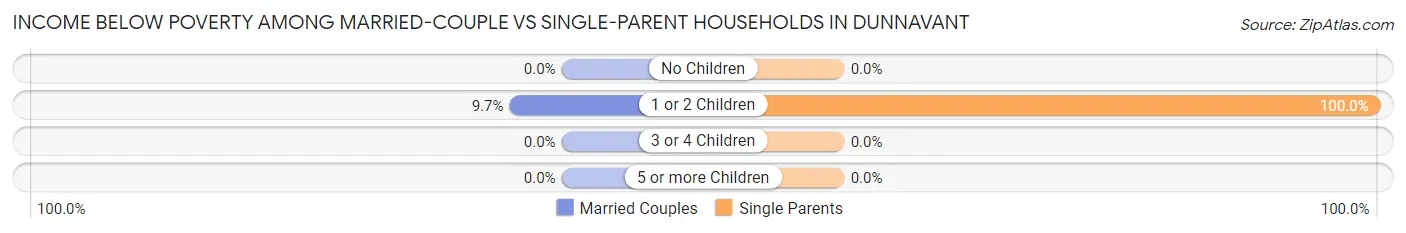
| Children | Married-Couple Families | Single-Parent Households |
| No Children | 0 (0.0%) | 0 (0.0%) |
| 1 or 2 Children | 7 (9.7%) | 53 (100.0%) |
| 3 or 4 Children | 0 (0.0%) | 0 (0.0%) |
| 5 or more Children | 0 (0.0%) | 0 (0.0%) |
| Total | 7 (3.1%) | 53 (38.1%) |
Race in Dunnavant
The most populous races in Dunnavant are White / Caucasian (1,073 | 94.6%), Two or more Races (58 | 5.1%), and Black / African American (3 | 0.3%).
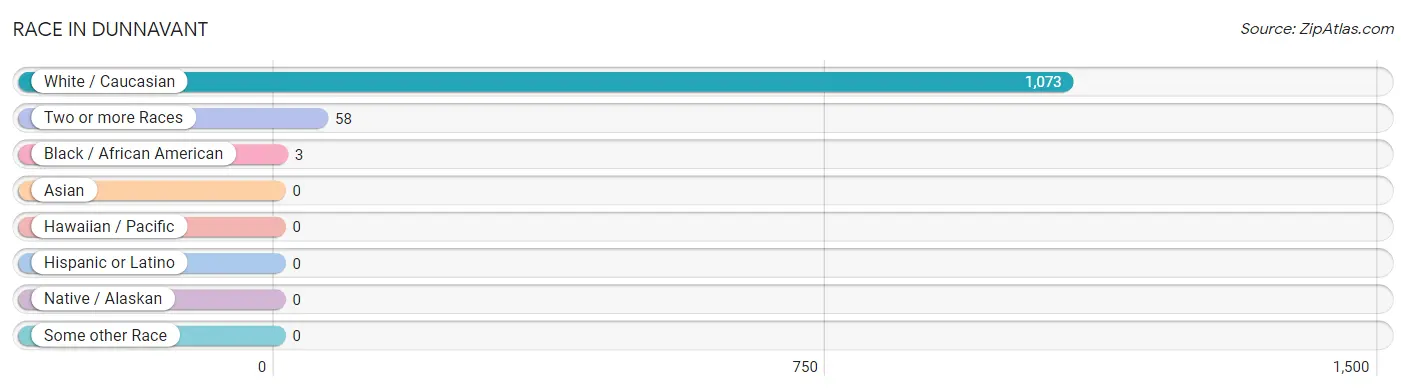
| Race | # Population | % Population |
| Asian | 0 | 0.0% |
| Black / African American | 3 | 0.3% |
| Hawaiian / Pacific | 0 | 0.0% |
| Hispanic or Latino | 0 | 0.0% |
| Native / Alaskan | 0 | 0.0% |
| White / Caucasian | 1,073 | 94.6% |
| Two or more Races | 58 | 5.1% |
| Some other Race | 0 | 0.0% |
| Total | 1,134 | 100.0% |
Ancestry in Dunnavant
The most populous ancestries reported in Dunnavant are American (272 | 24.0%), Irish (217 | 19.1%), English (68 | 6.0%), Italian (67 | 5.9%), and Polish (67 | 5.9%), together accounting for 61.0% of all Dunnavant residents.
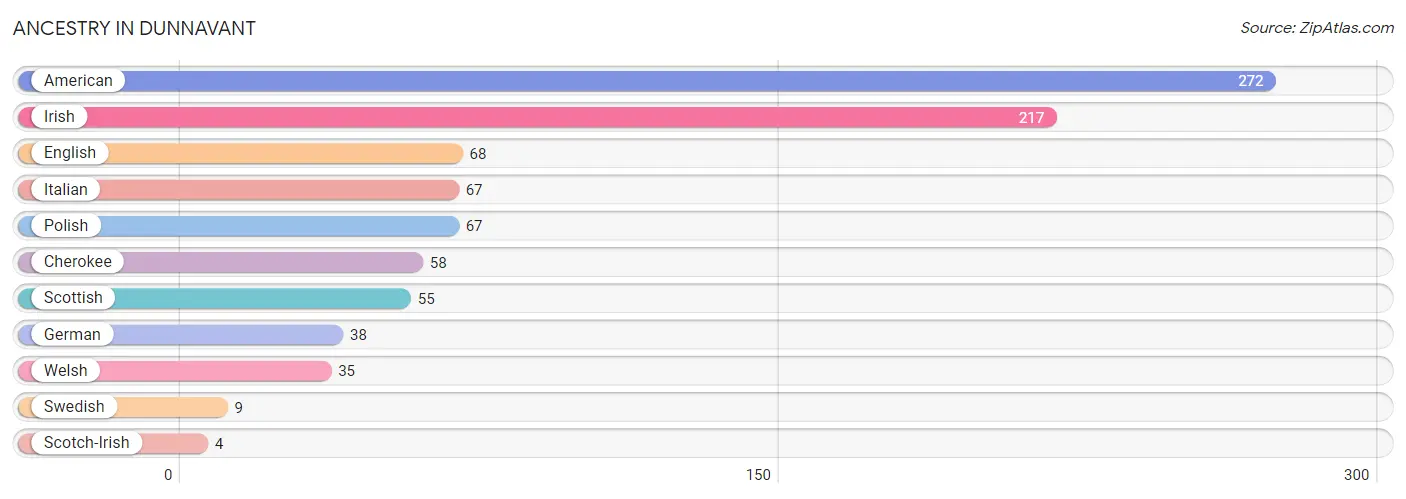
| Ancestry | # Population | % Population |
| American | 272 | 24.0% |
| Cherokee | 58 | 5.1% |
| English | 68 | 6.0% |
| German | 38 | 3.4% |
| Irish | 217 | 19.1% |
| Italian | 67 | 5.9% |
| Polish | 67 | 5.9% |
| Scotch-Irish | 4 | 0.4% |
| Scottish | 55 | 4.9% |
| Swedish | 9 | 0.8% |
| Welsh | 35 | 3.1% | View All 11 Rows |
Immigrants in Dunnavant

| Immigration Origin | # Population | % Population | View All 0 Rows |
Sex and Age in Dunnavant
Sex and Age in Dunnavant
The most populous age groups in Dunnavant are 50 to 54 Years (176 | 28.6%) for men and 65 to 69 Years (108 | 20.8%) for women.
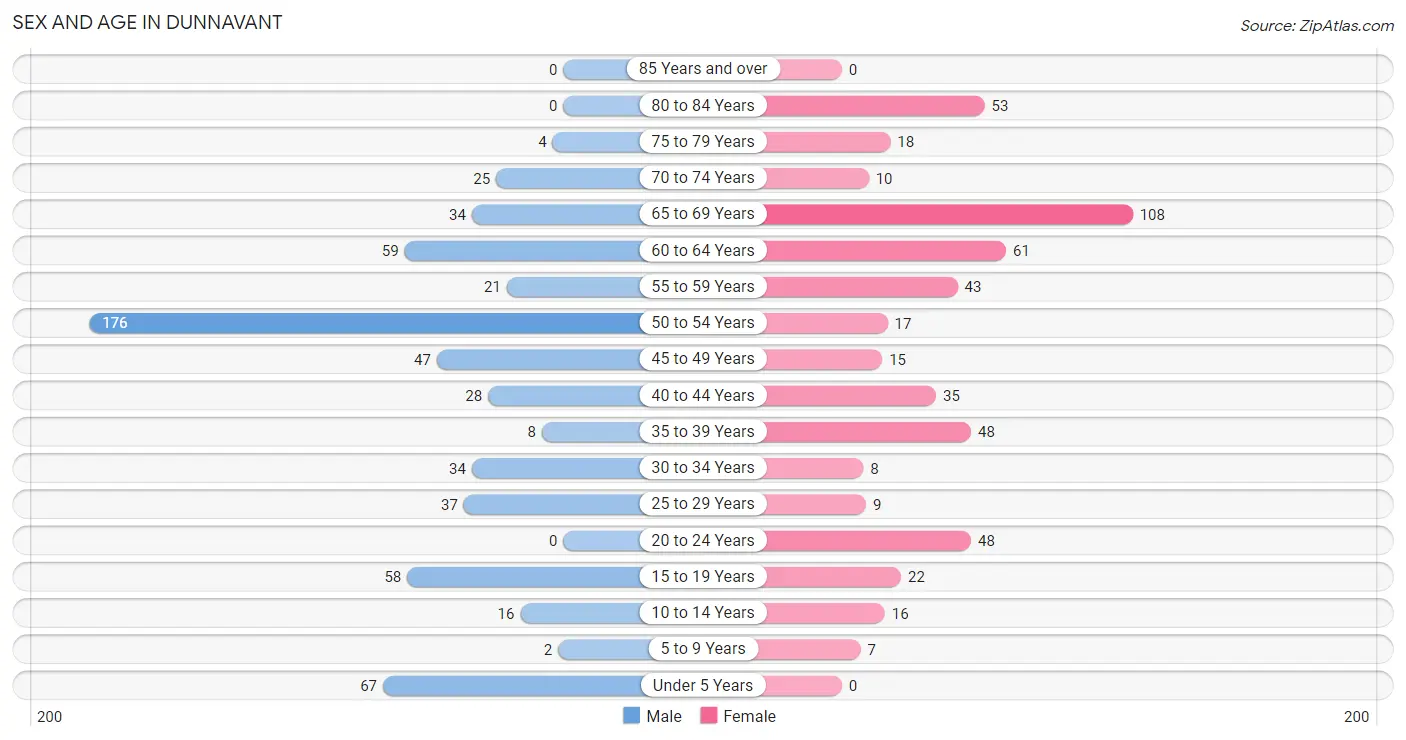
| Age Bracket | Male | Female |
| Under 5 Years | 67 (10.9%) | 0 (0.0%) |
| 5 to 9 Years | 2 (0.3%) | 7 (1.3%) |
| 10 to 14 Years | 16 (2.6%) | 16 (3.1%) |
| 15 to 19 Years | 58 (9.4%) | 22 (4.3%) |
| 20 to 24 Years | 0 (0.0%) | 48 (9.3%) |
| 25 to 29 Years | 37 (6.0%) | 9 (1.7%) |
| 30 to 34 Years | 34 (5.5%) | 8 (1.5%) |
| 35 to 39 Years | 8 (1.3%) | 48 (9.3%) |
| 40 to 44 Years | 28 (4.5%) | 35 (6.8%) |
| 45 to 49 Years | 47 (7.6%) | 15 (2.9%) |
| 50 to 54 Years | 176 (28.6%) | 17 (3.3%) |
| 55 to 59 Years | 21 (3.4%) | 43 (8.3%) |
| 60 to 64 Years | 59 (9.6%) | 61 (11.8%) |
| 65 to 69 Years | 34 (5.5%) | 108 (20.8%) |
| 70 to 74 Years | 25 (4.1%) | 10 (1.9%) |
| 75 to 79 Years | 4 (0.6%) | 18 (3.5%) |
| 80 to 84 Years | 0 (0.0%) | 53 (10.2%) |
| 85 Years and over | 0 (0.0%) | 0 (0.0%) |
| Total | 616 (100.0%) | 518 (100.0%) |
Families and Households in Dunnavant
Median Family Size in Dunnavant
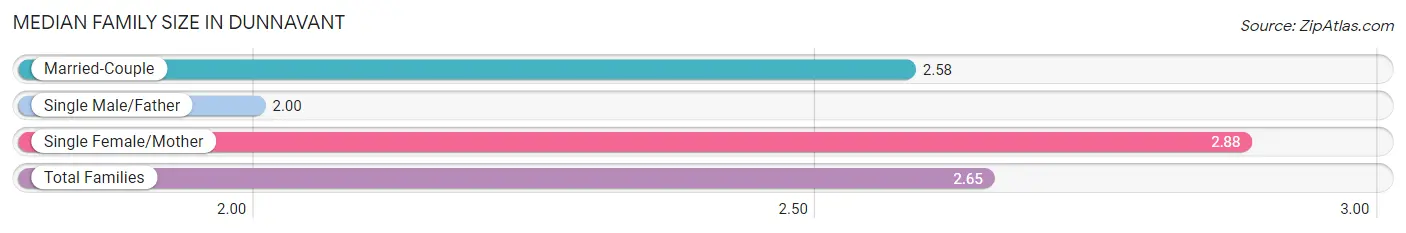
The median family size in Dunnavant is 2.65 persons per family, with single female/mother families (121 | 33.0%) accounting for the largest median family size of 2.88 persons per family. On the other hand, single male/father families (18 | 4.9%) represent the smallest median family size with 2.00 persons per family.
| Family Type | # Families | Family Size |
| Married-Couple | 228 (62.1%) | 2.58 |
| Single Male/Father | 18 (4.9%) | 2.00 |
| Single Female/Mother | 121 (33.0%) | 2.88 |
| Total Families | 367 (100.0%) | 2.65 |
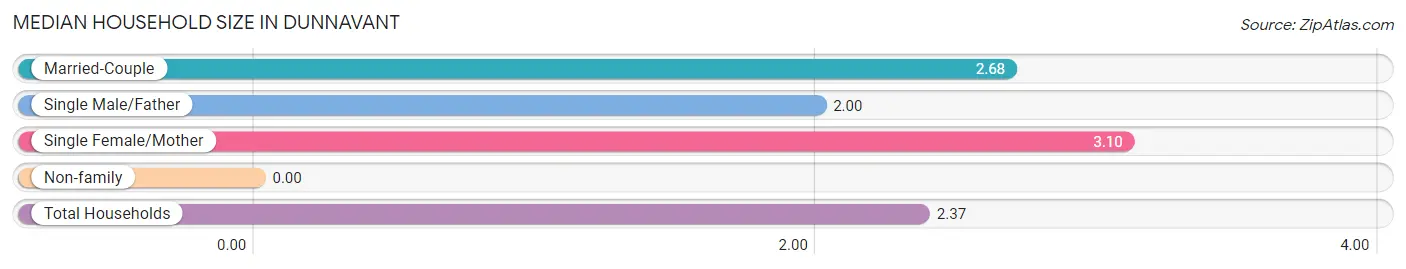
Median Household Size in Dunnavant
| Household Type | # Households | Household Size |
| Married-Couple | 228 (47.7%) | 2.68 |
| Single Male/Father | 18 (3.8%) | 2.00 |
| Single Female/Mother | 121 (25.3%) | 3.10 |
| Non-family | 111 (23.2%) | - |
| Total Households | 478 (100.0%) | 2.37 |
Household Size by Marriage Status in Dunnavant
Out of a total of 478 households in Dunnavant, 367 (76.8%) are family households, while 111 (23.2%) are nonfamily households. The most numerous type of family households are 2-person households, comprising 223, and the most common type of nonfamily households are 1-person households, comprising 111.
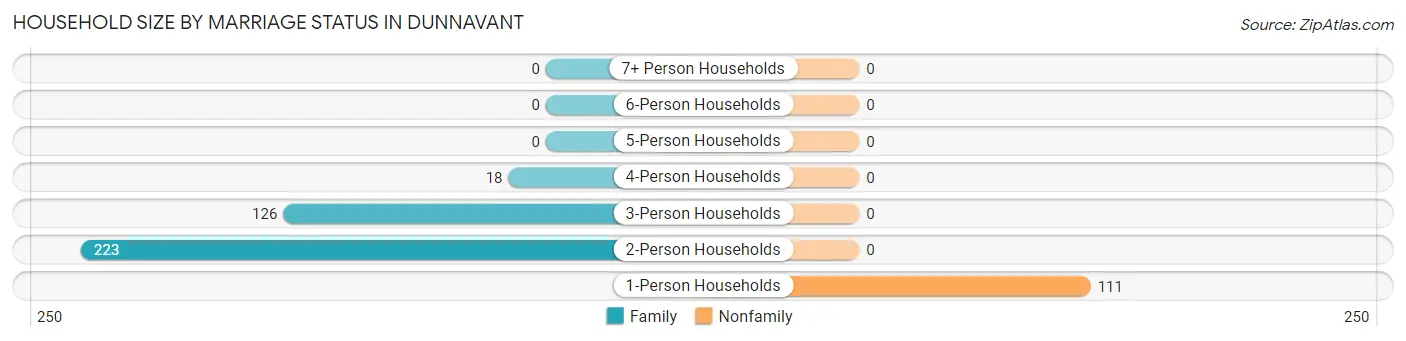
| Household Size | Family Households | Nonfamily Households |
| 1-Person Households | - | 111 (23.2%) |
| 2-Person Households | 223 (46.7%) | 0 (0.0%) |
| 3-Person Households | 126 (26.4%) | 0 (0.0%) |
| 4-Person Households | 18 (3.8%) | 0 (0.0%) |
| 5-Person Households | 0 (0.0%) | 0 (0.0%) |
| 6-Person Households | 0 (0.0%) | 0 (0.0%) |
| 7+ Person Households | 0 (0.0%) | 0 (0.0%) |
| Total | 367 (76.8%) | 111 (23.2%) |
Female Fertility in Dunnavant
Fertility by Age in Dunnavant
Average fertility rate in Dunnavant is 85.0 births per 1,000 women. Women in the age bracket of 20 to 34 years have the highest fertility rate with 262.0 births per 1,000 women. Women in the age bracket of 20 to 34 years acount for 100.0% of all women with births.
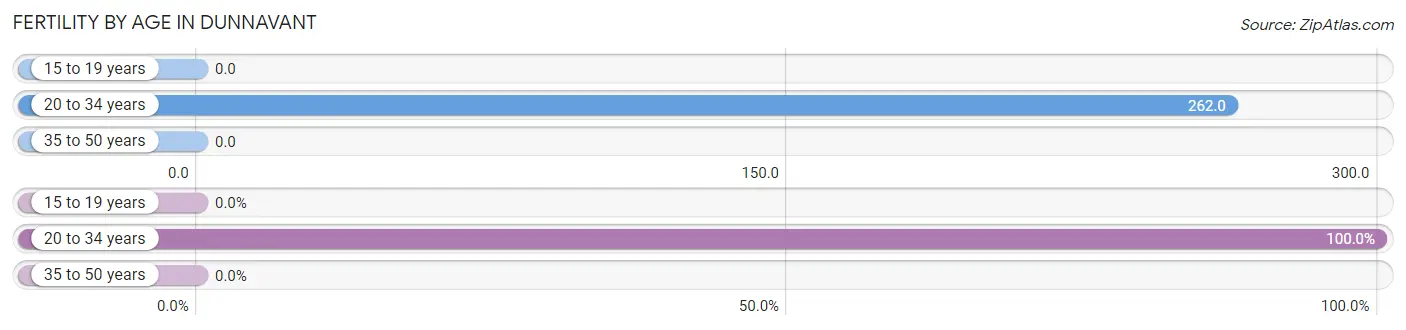
| Age Bracket | Women with Births | Births / 1,000 Women |
| 15 to 19 years | 0 (0.0%) | 0.0 |
| 20 to 34 years | 17 (100.0%) | 262.0 |
| 35 to 50 years | 0 (0.0%) | 0.0 |
| Total | 17 (100.0%) | 85.0 |
Fertility by Age by Marriage Status in Dunnavant
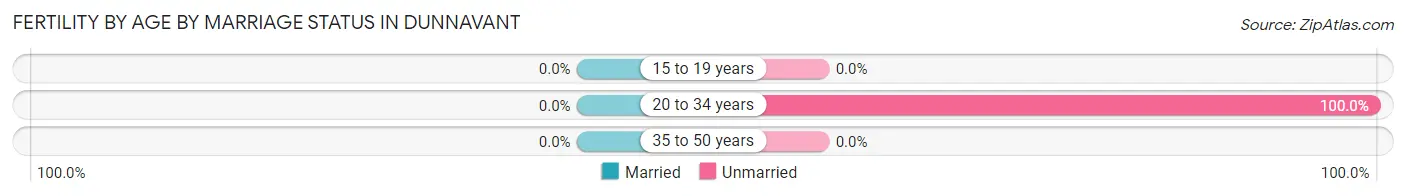
| Age Bracket | Married | Unmarried |
| 15 to 19 years | 0 (0.0%) | 0 (0.0%) |
| 20 to 34 years | 0 (0.0%) | 17 (100.0%) |
| 35 to 50 years | 0 (0.0%) | 0 (0.0%) |
| Total | 0 (0.0%) | 17 (100.0%) |
Fertility by Education in Dunnavant
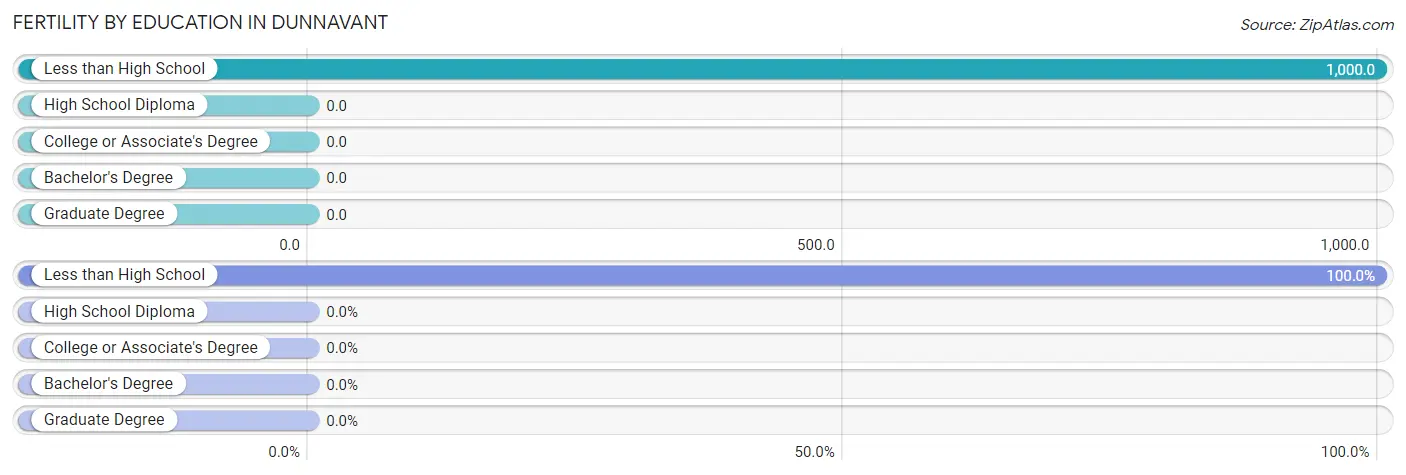
| Educational Attainment | Women with Births | Births / 1,000 Women |
| Less than High School | 17 (100.0%) | 1,000.0 |
| High School Diploma | 0 (0.0%) | 0.0 |
| College or Associate's Degree | 0 (0.0%) | 0.0 |
| Bachelor's Degree | 0 (0.0%) | 0.0 |
| Graduate Degree | 0 (0.0%) | 0.0 |
| Total | 17 (100.0%) | 85.0 |
Fertility by Education by Marriage Status in Dunnavant
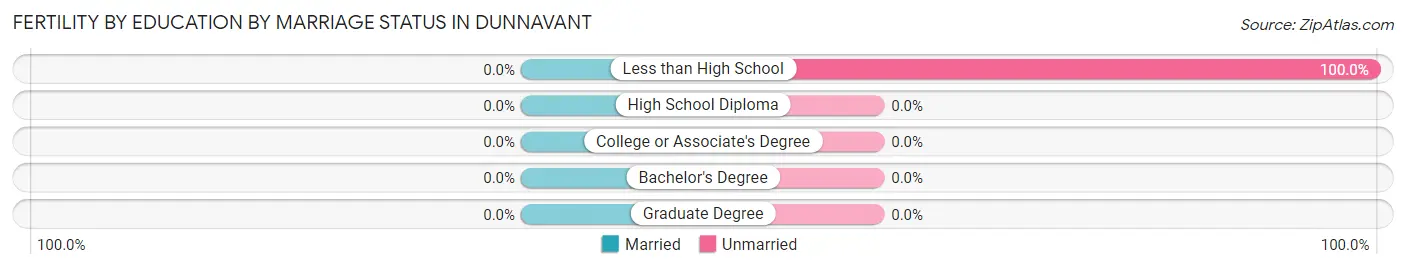
| Educational Attainment | Married | Unmarried |
| Less than High School | 0 (0.0%) | 17 (100.0%) |
| High School Diploma | 0 (0.0%) | 0 (0.0%) |
| College or Associate's Degree | 0 (0.0%) | 0 (0.0%) |
| Bachelor's Degree | 0 (0.0%) | 0 (0.0%) |
| Graduate Degree | 0 (0.0%) | 0 (0.0%) |
| Total | 0 (0.0%) | 17 (100.0%) |
Employment Characteristics in Dunnavant
Employment by Class of Employer in Dunnavant
Among the 690 employed individuals in Dunnavant, private company employees (524 | 75.9%), self-employed (not incorporated) (83 | 12.0%), and local government employees (37 | 5.4%) make up the most common classes of employment.
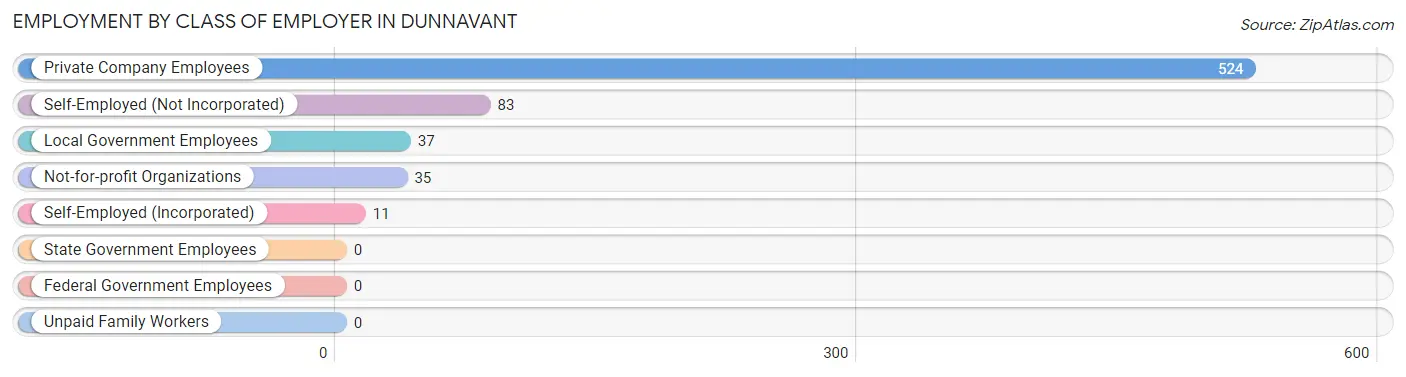
| Employer Class | # Employees | % Employees |
| Private Company Employees | 524 | 75.9% |
| Self-Employed (Incorporated) | 11 | 1.6% |
| Self-Employed (Not Incorporated) | 83 | 12.0% |
| Not-for-profit Organizations | 35 | 5.1% |
| Local Government Employees | 37 | 5.4% |
| State Government Employees | 0 | 0.0% |
| Federal Government Employees | 0 | 0.0% |
| Unpaid Family Workers | 0 | 0.0% |
| Total | 690 | 100.0% |
Employment Status by Age in Dunnavant
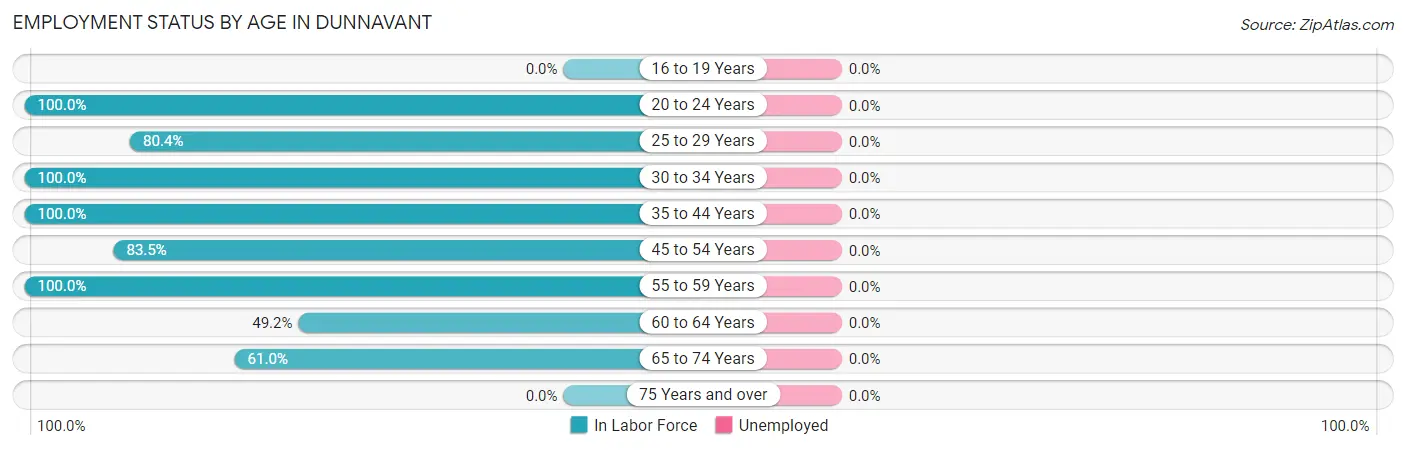
| Age Bracket | In Labor Force | Unemployed |
| 16 to 19 Years | 0 (0.0%) | 0 (0.0%) |
| 20 to 24 Years | 48 (100.0%) | 0 (0.0%) |
| 25 to 29 Years | 37 (80.4%) | 0 (0.0%) |
| 30 to 34 Years | 42 (100.0%) | 0 (0.0%) |
| 35 to 44 Years | 119 (100.0%) | 0 (0.0%) |
| 45 to 54 Years | 213 (83.5%) | 0 (0.0%) |
| 55 to 59 Years | 64 (100.0%) | 0 (0.0%) |
| 60 to 64 Years | 59 (49.2%) | 0 (0.0%) |
| 65 to 74 Years | 108 (61.0%) | 0 (0.0%) |
| 75 Years and over | 0 (0.0%) | 0 (0.0%) |
| Total | 690 (68.5%) | 0 (0.0%) |
Employment Status by Educational Attainment in Dunnavant
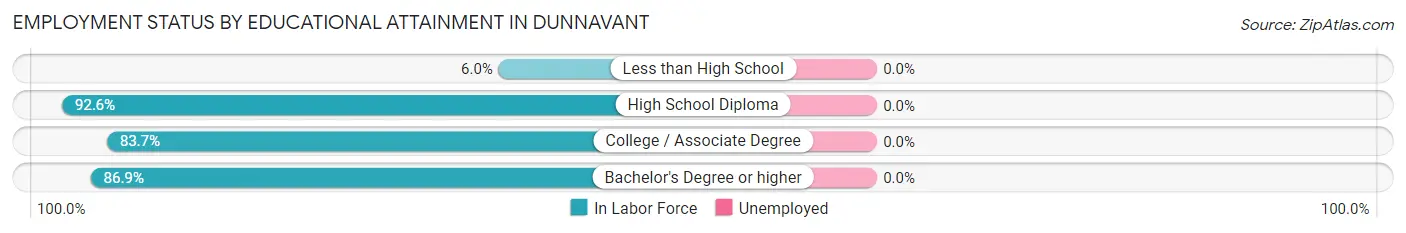
| Educational Attainment | In Labor Force | Unemployed |
| Less than High School | 3 (6.0%) | 0 (0.0%) |
| High School Diploma | 299 (92.6%) | 0 (0.0%) |
| College / Associate Degree | 139 (83.7%) | 0 (0.0%) |
| Bachelor's Degree or higher | 93 (86.9%) | 0 (0.0%) |
| Total | 534 (82.7%) | 0 (0.0%) |
Employment Occupations by Sex in Dunnavant
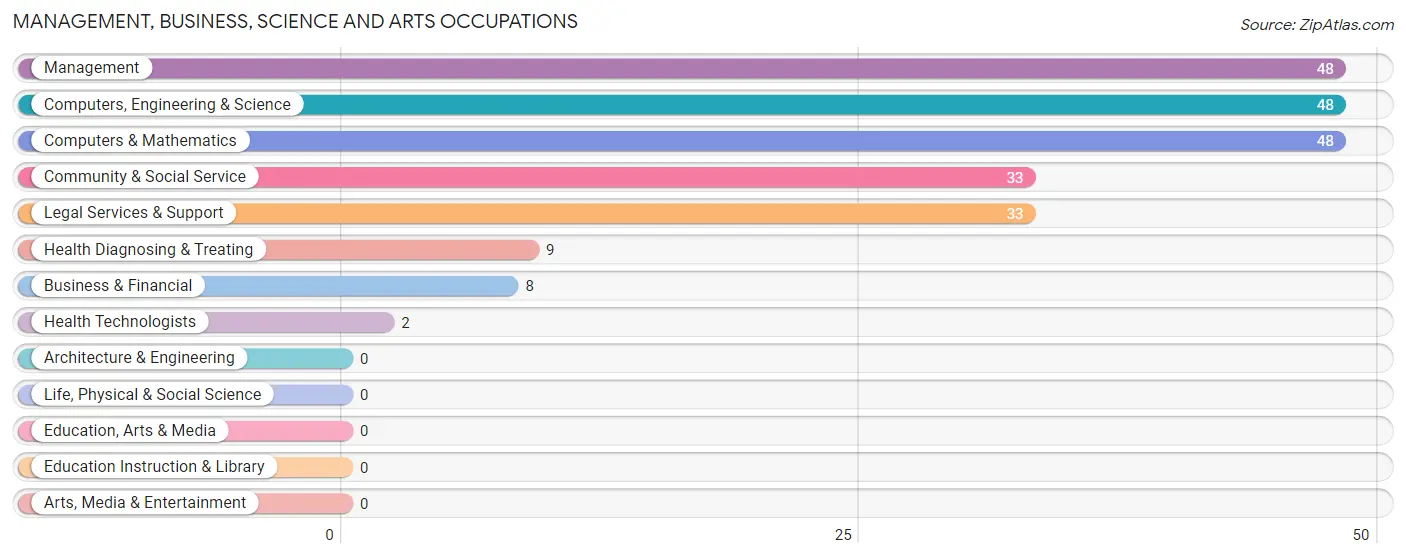
Management, Business, Science and Arts Occupations
The most common Management, Business, Science and Arts occupations in Dunnavant are Management (48 | 7.0%), Computers, Engineering & Science (48 | 7.0%), Computers & Mathematics (48 | 7.0%), Community & Social Service (33 | 4.8%), and Legal Services & Support (33 | 4.8%).
Management, Business, Science and Arts Occupations by Sex
Within the Management, Business, Science and Arts occupations in Dunnavant, the most male-oriented occupations are Computers, Engineering & Science (100.0%), Computers & Mathematics (100.0%), and Management (70.8%), while the most female-oriented occupations are Business & Financial (100.0%), Community & Social Service (100.0%), and Legal Services & Support (100.0%).
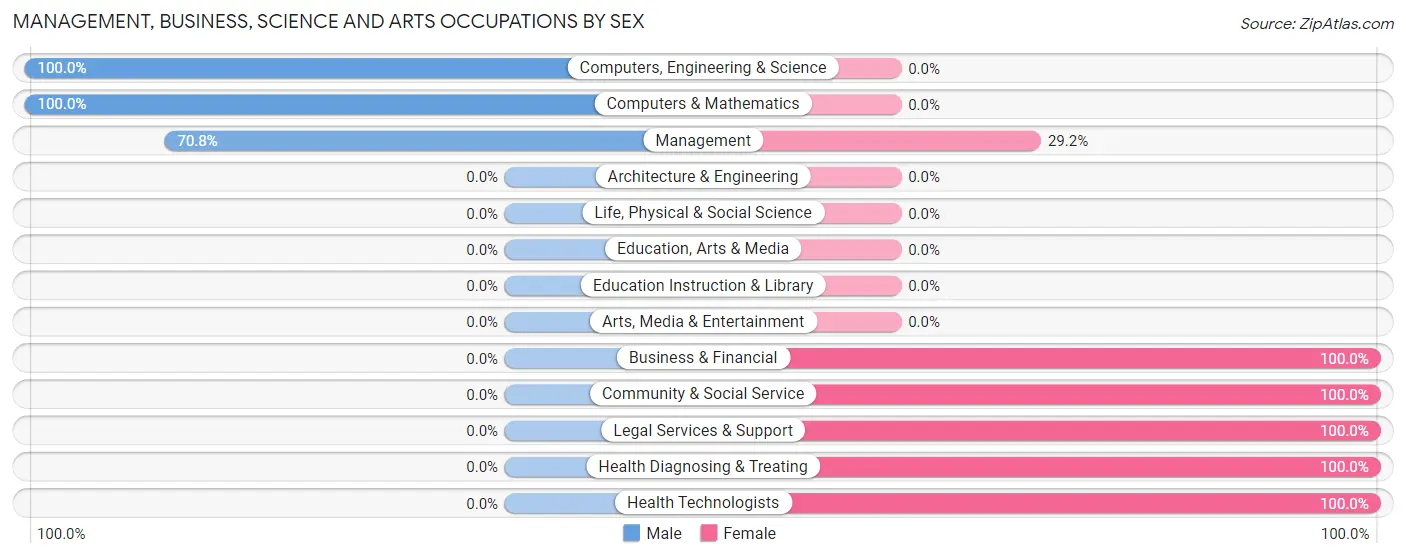
| Occupation | Male | Female |
| Management | 34 (70.8%) | 14 (29.2%) |
| Business & Financial | 0 (0.0%) | 8 (100.0%) |
| Computers, Engineering & Science | 48 (100.0%) | 0 (0.0%) |
| Computers & Mathematics | 48 (100.0%) | 0 (0.0%) |
| Architecture & Engineering | 0 (0.0%) | 0 (0.0%) |
| Life, Physical & Social Science | 0 (0.0%) | 0 (0.0%) |
| Community & Social Service | 0 (0.0%) | 33 (100.0%) |
| Education, Arts & Media | 0 (0.0%) | 0 (0.0%) |
| Legal Services & Support | 0 (0.0%) | 33 (100.0%) |
| Education Instruction & Library | 0 (0.0%) | 0 (0.0%) |
| Arts, Media & Entertainment | 0 (0.0%) | 0 (0.0%) |
| Health Diagnosing & Treating | 0 (0.0%) | 9 (100.0%) |
| Health Technologists | 0 (0.0%) | 2 (100.0%) |
| Total (Category) | 82 (56.2%) | 64 (43.8%) |
| Total (Overall) | 408 (59.1%) | 282 (40.9%) |
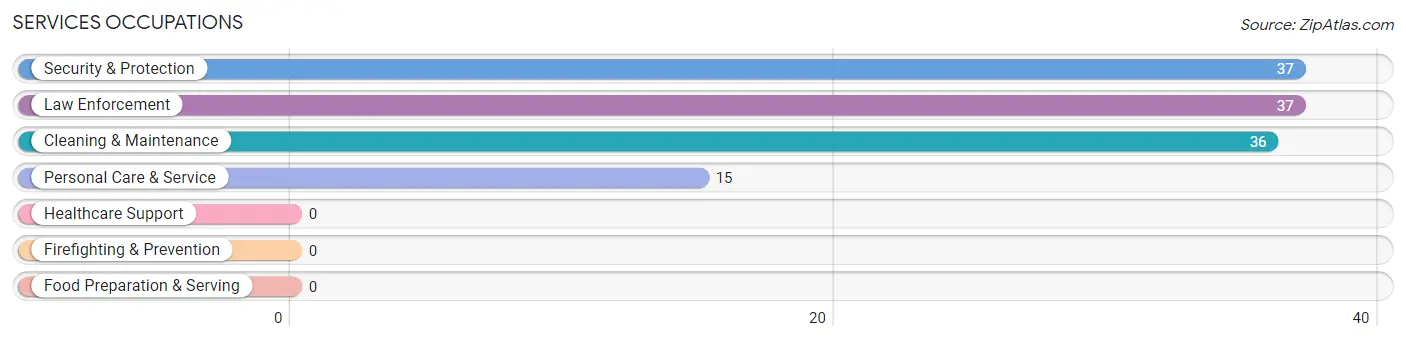
Services Occupations
The most common Services occupations in Dunnavant are Security & Protection (37 | 5.4%), Law Enforcement (37 | 5.4%), Cleaning & Maintenance (36 | 5.2%), and Personal Care & Service (15 | 2.2%).
Services Occupations by Sex
Within the Services occupations in Dunnavant, the most male-oriented occupations are Security & Protection (100.0%), Law Enforcement (100.0%), and Cleaning & Maintenance (30.6%), while the most female-oriented occupations are Personal Care & Service (100.0%), and Cleaning & Maintenance (69.4%).
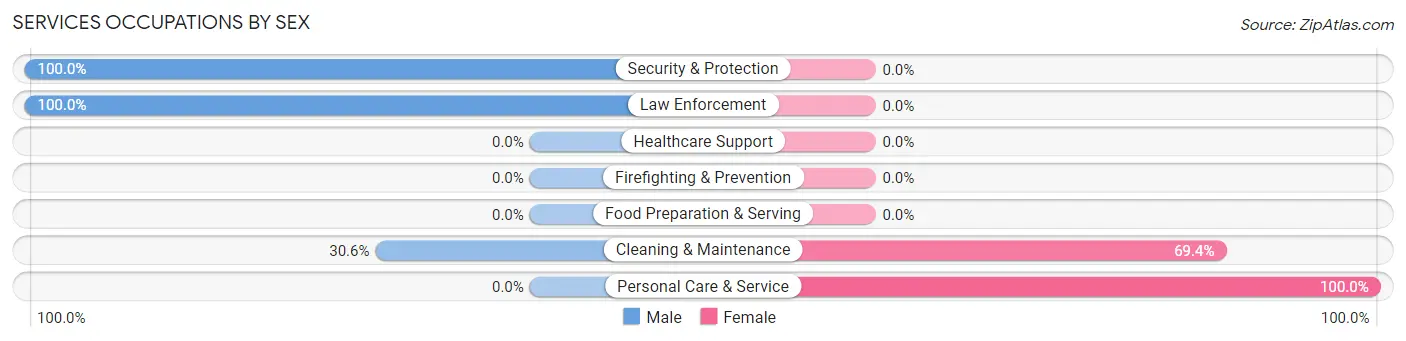
| Occupation | Male | Female |
| Healthcare Support | 0 (0.0%) | 0 (0.0%) |
| Security & Protection | 37 (100.0%) | 0 (0.0%) |
| Firefighting & Prevention | 0 (0.0%) | 0 (0.0%) |
| Law Enforcement | 37 (100.0%) | 0 (0.0%) |
| Food Preparation & Serving | 0 (0.0%) | 0 (0.0%) |
| Cleaning & Maintenance | 11 (30.6%) | 25 (69.4%) |
| Personal Care & Service | 0 (0.0%) | 15 (100.0%) |
| Total (Category) | 48 (54.5%) | 40 (45.5%) |
| Total (Overall) | 408 (59.1%) | 282 (40.9%) |
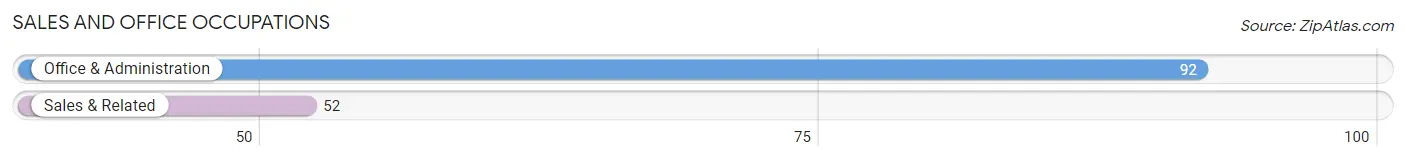
Sales and Office Occupations
The most common Sales and Office occupations in Dunnavant are Office & Administration (92 | 13.3%), and Sales & Related (52 | 7.5%).
Sales and Office Occupations by Sex
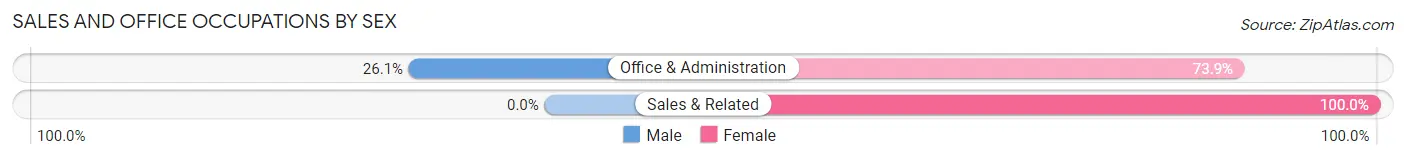
| Occupation | Male | Female |
| Sales & Related | 0 (0.0%) | 52 (100.0%) |
| Office & Administration | 24 (26.1%) | 68 (73.9%) |
| Total (Category) | 24 (16.7%) | 120 (83.3%) |
| Total (Overall) | 408 (59.1%) | 282 (40.9%) |
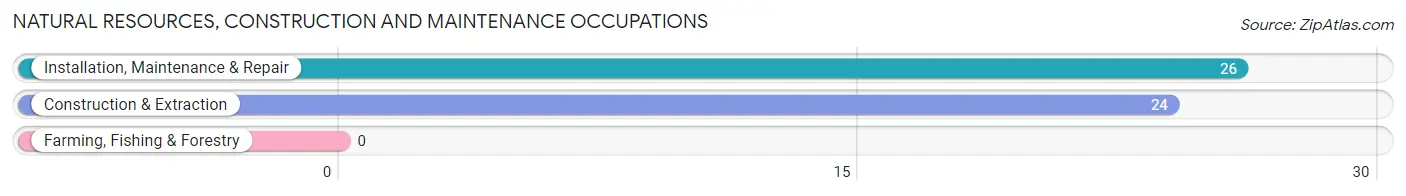
Natural Resources, Construction and Maintenance Occupations
The most common Natural Resources, Construction and Maintenance occupations in Dunnavant are Installation, Maintenance & Repair (26 | 3.8%), and Construction & Extraction (24 | 3.5%).
Natural Resources, Construction and Maintenance Occupations by Sex
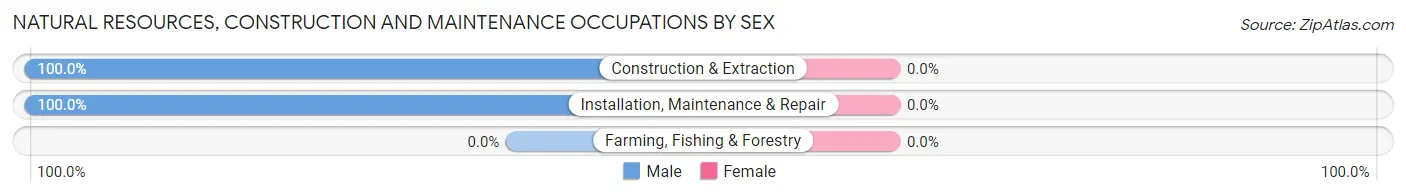
| Occupation | Male | Female |
| Farming, Fishing & Forestry | 0 (0.0%) | 0 (0.0%) |
| Construction & Extraction | 24 (100.0%) | 0 (0.0%) |
| Installation, Maintenance & Repair | 26 (100.0%) | 0 (0.0%) |
| Total (Category) | 50 (100.0%) | 0 (0.0%) |
| Total (Overall) | 408 (59.1%) | 282 (40.9%) |
Production, Transportation and Moving Occupations
The most common Production, Transportation and Moving occupations in Dunnavant are Transportation (158 | 22.9%), and Production (104 | 15.1%).
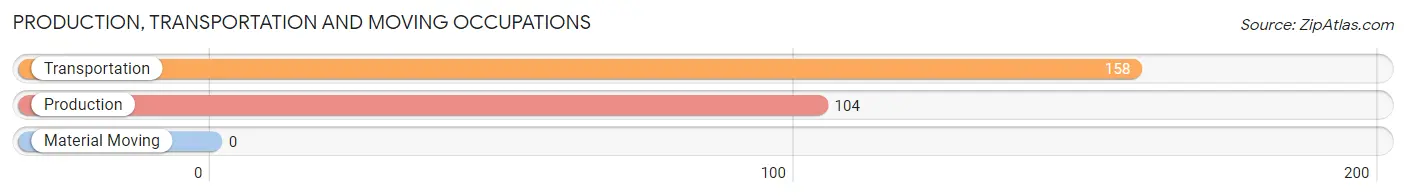
Production, Transportation and Moving Occupations by Sex
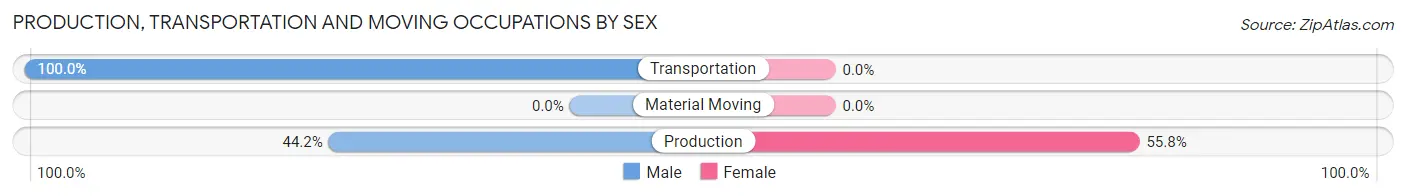
| Occupation | Male | Female |
| Production | 46 (44.2%) | 58 (55.8%) |
| Transportation | 158 (100.0%) | 0 (0.0%) |
| Material Moving | 0 (0.0%) | 0 (0.0%) |
| Total (Category) | 204 (77.9%) | 58 (22.1%) |
| Total (Overall) | 408 (59.1%) | 282 (40.9%) |
Employment Industries by Sex in Dunnavant
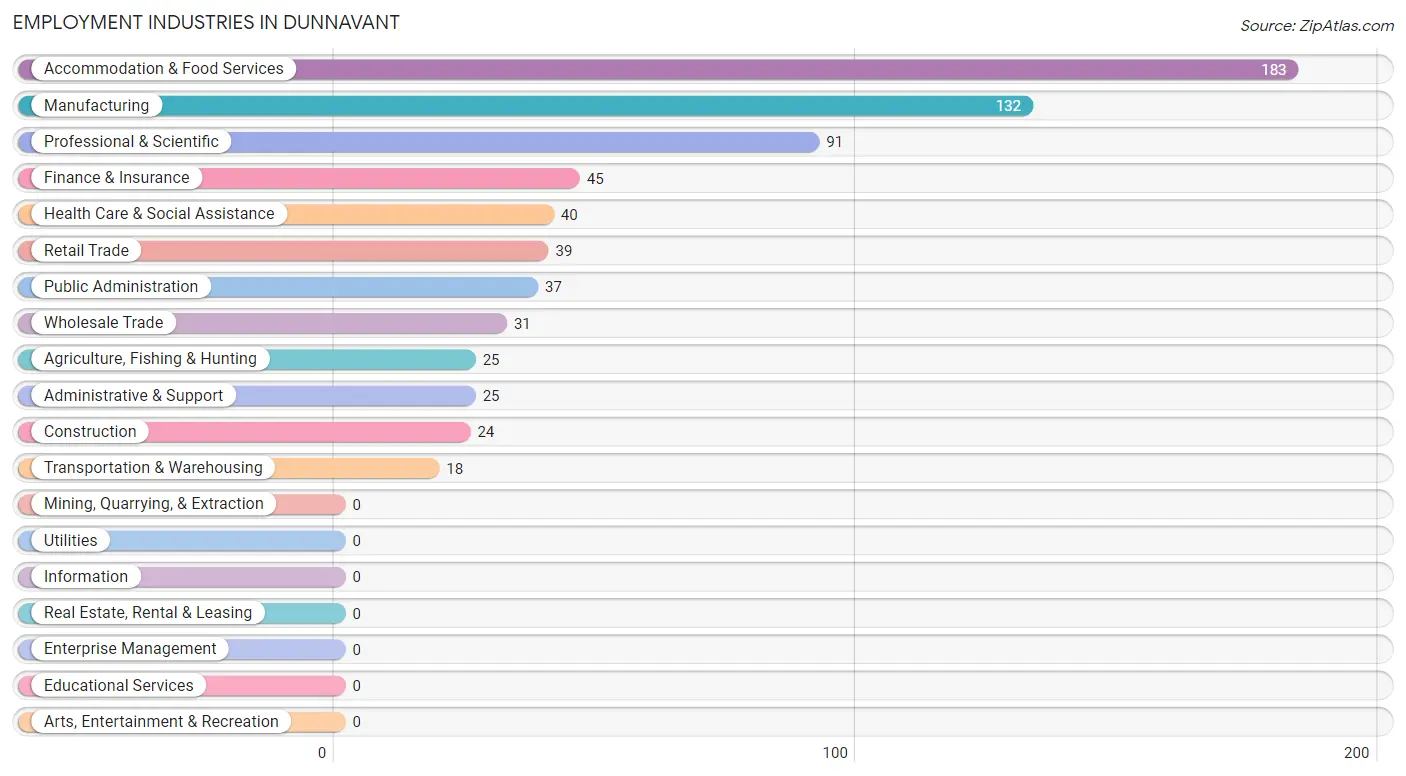
Employment Industries in Dunnavant
The major employment industries in Dunnavant include Accommodation & Food Services (183 | 26.5%), Manufacturing (132 | 19.1%), Professional & Scientific (91 | 13.2%), Finance & Insurance (45 | 6.5%), and Health Care & Social Assistance (40 | 5.8%).
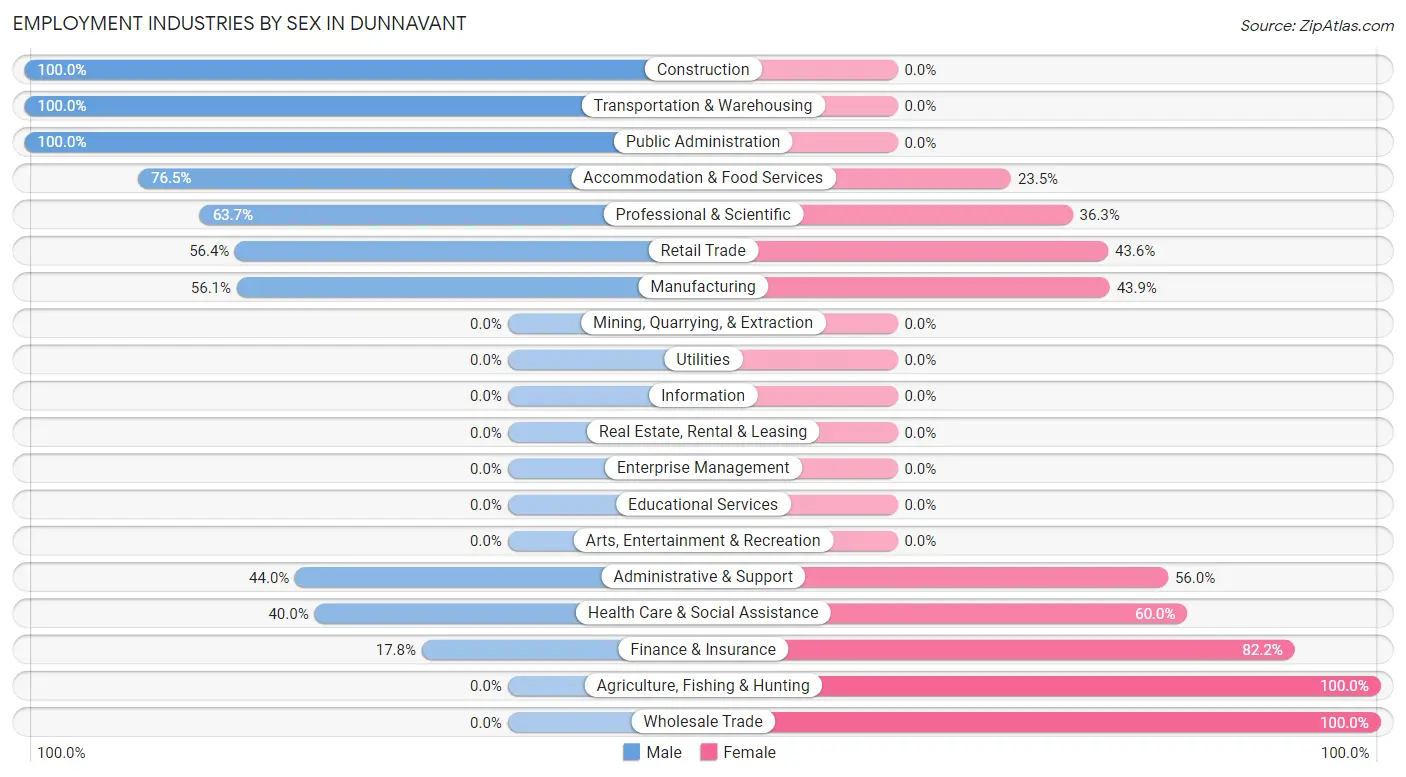
Employment Industries by Sex in Dunnavant
The Dunnavant industries that see more men than women are Construction (100.0%), Transportation & Warehousing (100.0%), and Public Administration (100.0%), whereas the industries that tend to have a higher number of women are Agriculture, Fishing & Hunting (100.0%), Wholesale Trade (100.0%), and Finance & Insurance (82.2%).
| Industry | Male | Female |
| Agriculture, Fishing & Hunting | 0 (0.0%) | 25 (100.0%) |
| Mining, Quarrying, & Extraction | 0 (0.0%) | 0 (0.0%) |
| Construction | 24 (100.0%) | 0 (0.0%) |
| Manufacturing | 74 (56.1%) | 58 (43.9%) |
| Wholesale Trade | 0 (0.0%) | 31 (100.0%) |
| Retail Trade | 22 (56.4%) | 17 (43.6%) |
| Transportation & Warehousing | 18 (100.0%) | 0 (0.0%) |
| Utilities | 0 (0.0%) | 0 (0.0%) |
| Information | 0 (0.0%) | 0 (0.0%) |
| Finance & Insurance | 8 (17.8%) | 37 (82.2%) |
| Real Estate, Rental & Leasing | 0 (0.0%) | 0 (0.0%) |
| Professional & Scientific | 58 (63.7%) | 33 (36.3%) |
| Enterprise Management | 0 (0.0%) | 0 (0.0%) |
| Administrative & Support | 11 (44.0%) | 14 (56.0%) |
| Educational Services | 0 (0.0%) | 0 (0.0%) |
| Health Care & Social Assistance | 16 (40.0%) | 24 (60.0%) |
| Arts, Entertainment & Recreation | 0 (0.0%) | 0 (0.0%) |
| Accommodation & Food Services | 140 (76.5%) | 43 (23.5%) |
| Public Administration | 37 (100.0%) | 0 (0.0%) |
| Total | 408 (59.1%) | 282 (40.9%) |
Education in Dunnavant
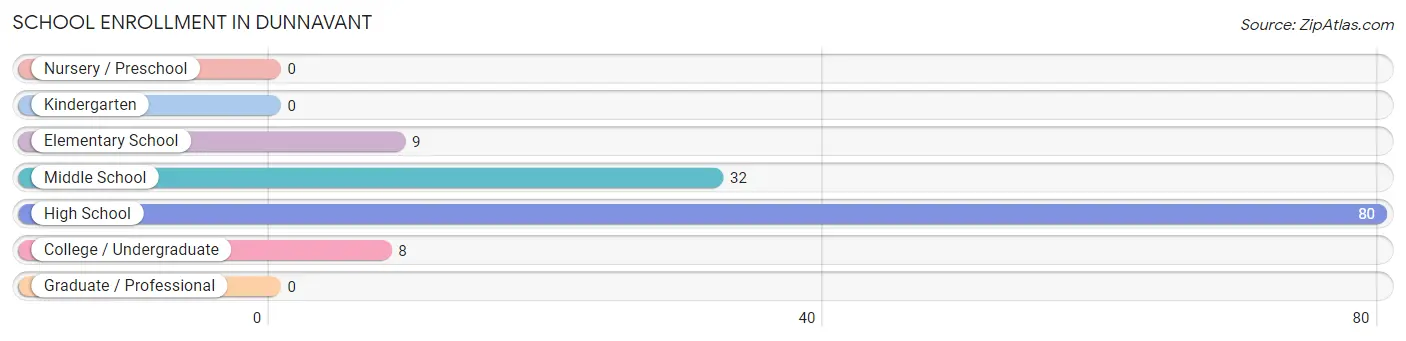
School Enrollment in Dunnavant
The most common levels of schooling among the 129 students in Dunnavant are high school (80 | 62.0%), middle school (32 | 24.8%), and elementary school (9 | 7.0%).
| School Level | # Students | % Students |
| Nursery / Preschool | 0 | 0.0% |
| Kindergarten | 0 | 0.0% |
| Elementary School | 9 | 7.0% |
| Middle School | 32 | 24.8% |
| High School | 80 | 62.0% |
| College / Undergraduate | 8 | 6.2% |
| Graduate / Professional | 0 | 0.0% |
| Total | 129 | 100.0% |
School Enrollment by Age by Funding Source in Dunnavant
Out of a total of 129 students who are enrolled in schools in Dunnavant, 8 (6.2%) attend a private institution, while the remaining 121 (93.8%) are enrolled in public schools. The age group of 10 to 14 year olds has the highest likelihood of being enrolled in private schools, with 8 (25.0% in the age bracket) enrolled. Conversely, the age group of 5 to 9 year old has the lowest likelihood of being enrolled in a private school, with 9 (100.0% in the age bracket) attending a public institution.
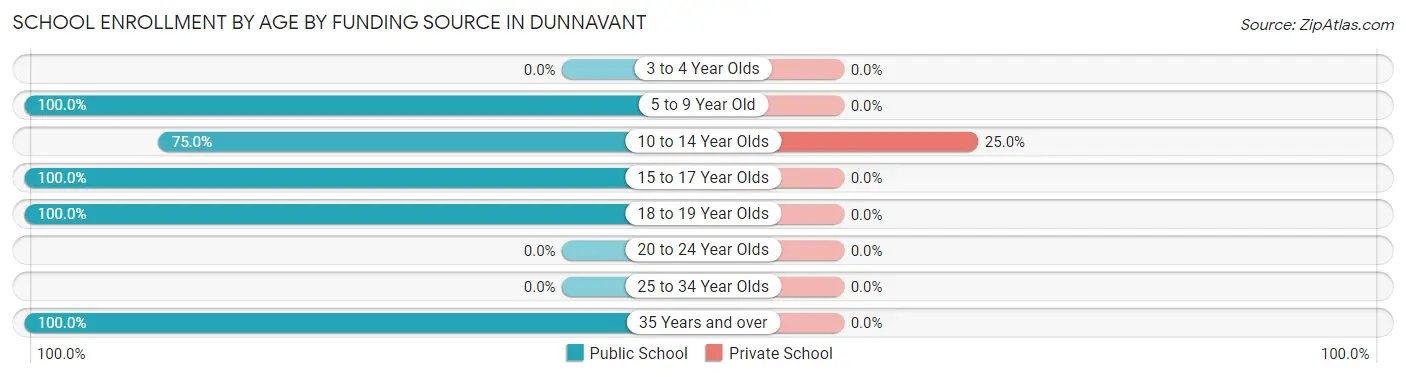
| Age Bracket | Public School | Private School |
| 3 to 4 Year Olds | 0 (0.0%) | 0 (0.0%) |
| 5 to 9 Year Old | 9 (100.0%) | 0 (0.0%) |
| 10 to 14 Year Olds | 24 (75.0%) | 8 (25.0%) |
| 15 to 17 Year Olds | 58 (100.0%) | 0 (0.0%) |
| 18 to 19 Year Olds | 22 (100.0%) | 0 (0.0%) |
| 20 to 24 Year Olds | 0 (0.0%) | 0 (0.0%) |
| 25 to 34 Year Olds | 0 (0.0%) | 0 (0.0%) |
| 35 Years and over | 8 (100.0%) | 0 (0.0%) |
| Total | 121 (93.8%) | 8 (6.2%) |
Educational Attainment by Field of Study in Dunnavant
Bio, nature & agricultural (67 | 26.6%), physical & health sciences (58 | 23.0%), science & technology (48 | 19.1%), business (33 | 13.1%), and education (22 | 8.7%) are the most common fields of study among 252 individuals in Dunnavant who have obtained a bachelor's degree or higher.
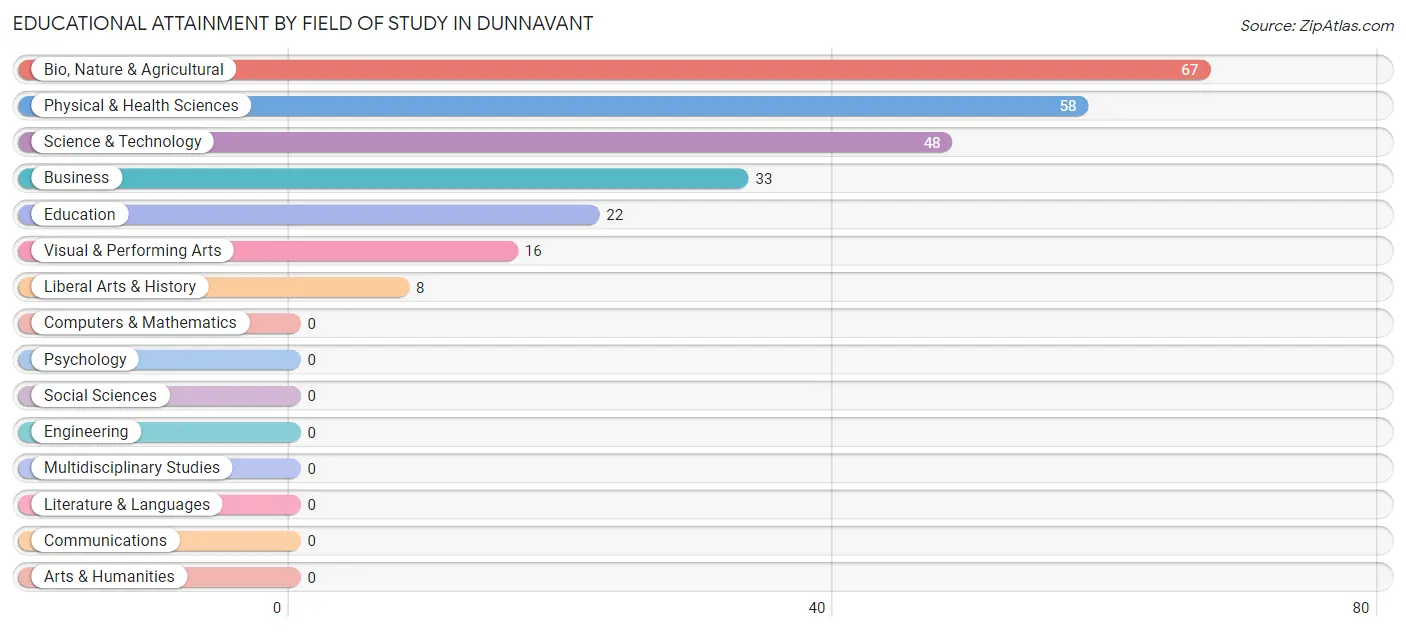
| Field of Study | # Graduates | % Graduates |
| Computers & Mathematics | 0 | 0.0% |
| Bio, Nature & Agricultural | 67 | 26.6% |
| Physical & Health Sciences | 58 | 23.0% |
| Psychology | 0 | 0.0% |
| Social Sciences | 0 | 0.0% |
| Engineering | 0 | 0.0% |
| Multidisciplinary Studies | 0 | 0.0% |
| Science & Technology | 48 | 19.1% |
| Business | 33 | 13.1% |
| Education | 22 | 8.7% |
| Literature & Languages | 0 | 0.0% |
| Liberal Arts & History | 8 | 3.2% |
| Visual & Performing Arts | 16 | 6.4% |
| Communications | 0 | 0.0% |
| Arts & Humanities | 0 | 0.0% |
| Total | 252 | 100.0% |
Transportation & Commute in Dunnavant
Vehicle Availability by Sex in Dunnavant
The most prevalent vehicle ownership categories in Dunnavant are males with 4 vehicles (143, accounting for 35.0%) and females with 4 vehicles (2, making up 50.7%).
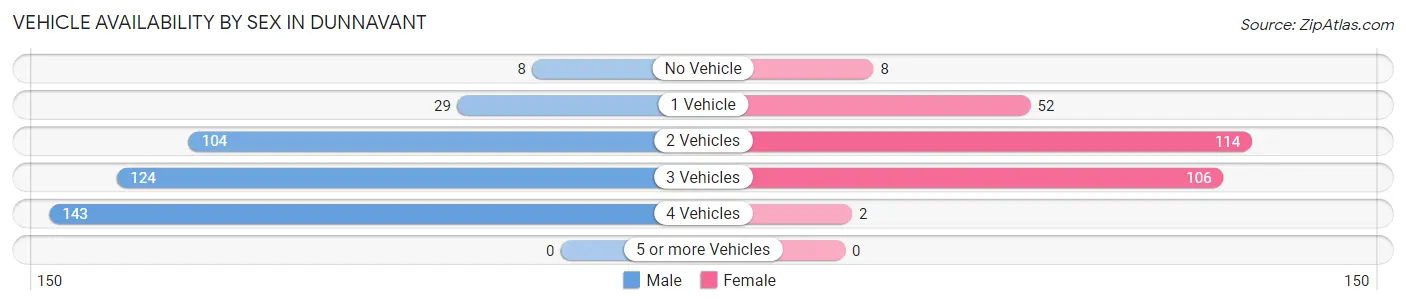
| Vehicles Available | Male | Female |
| No Vehicle | 8 (2.0%) | 8 (2.8%) |
| 1 Vehicle | 29 (7.1%) | 52 (18.4%) |
| 2 Vehicles | 104 (25.5%) | 114 (40.4%) |
| 3 Vehicles | 124 (30.4%) | 106 (37.6%) |
| 4 Vehicles | 143 (35.0%) | 2 (0.7%) |
| 5 or more Vehicles | 0 (0.0%) | 0 (0.0%) |
| Total | 408 (100.0%) | 282 (100.0%) |
Commute Time in Dunnavant
The most frequently occuring commute durations in Dunnavant are 45 to 59 minutes (191 commuters, 35.2%), 30 to 34 minutes (82 commuters, 15.1%), and 15 to 19 minutes (77 commuters, 14.2%).
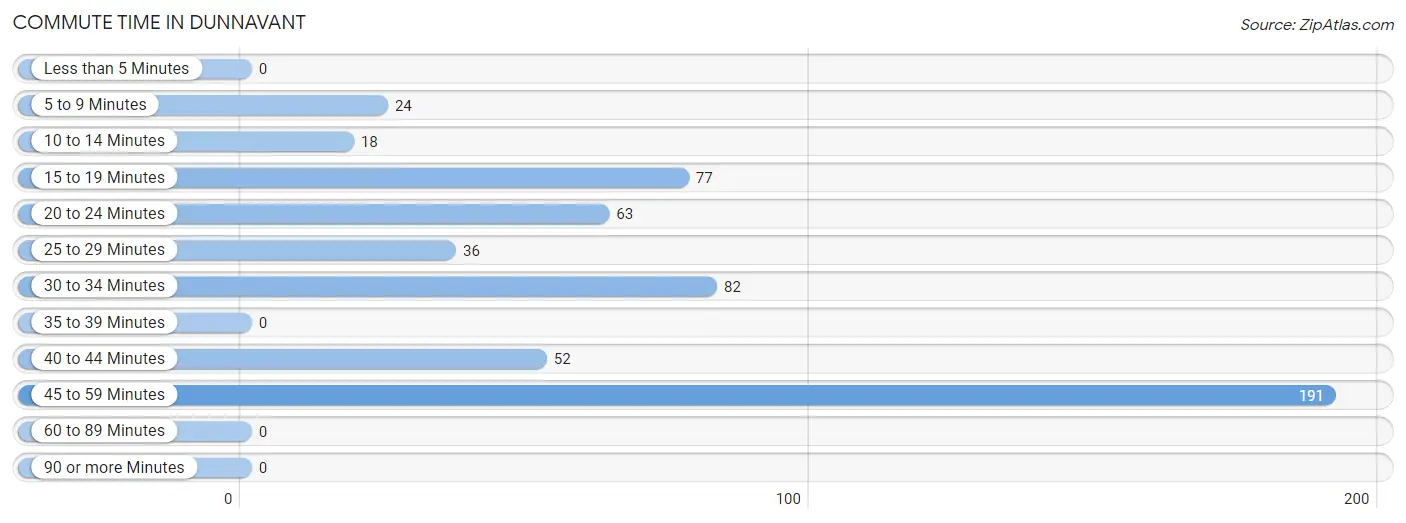
| Commute Time | # Commuters | % Commuters |
| Less than 5 Minutes | 0 | 0.0% |
| 5 to 9 Minutes | 24 | 4.4% |
| 10 to 14 Minutes | 18 | 3.3% |
| 15 to 19 Minutes | 77 | 14.2% |
| 20 to 24 Minutes | 63 | 11.6% |
| 25 to 29 Minutes | 36 | 6.6% |
| 30 to 34 Minutes | 82 | 15.1% |
| 35 to 39 Minutes | 0 | 0.0% |
| 40 to 44 Minutes | 52 | 9.6% |
| 45 to 59 Minutes | 191 | 35.2% |
| 60 to 89 Minutes | 0 | 0.0% |
| 90 or more Minutes | 0 | 0.0% |
Commute Time by Sex in Dunnavant
The most common commute times in Dunnavant are 45 to 59 minutes (184 commuters, 52.3%) for males and 15 to 19 minutes (60 commuters, 31.4%) for females.
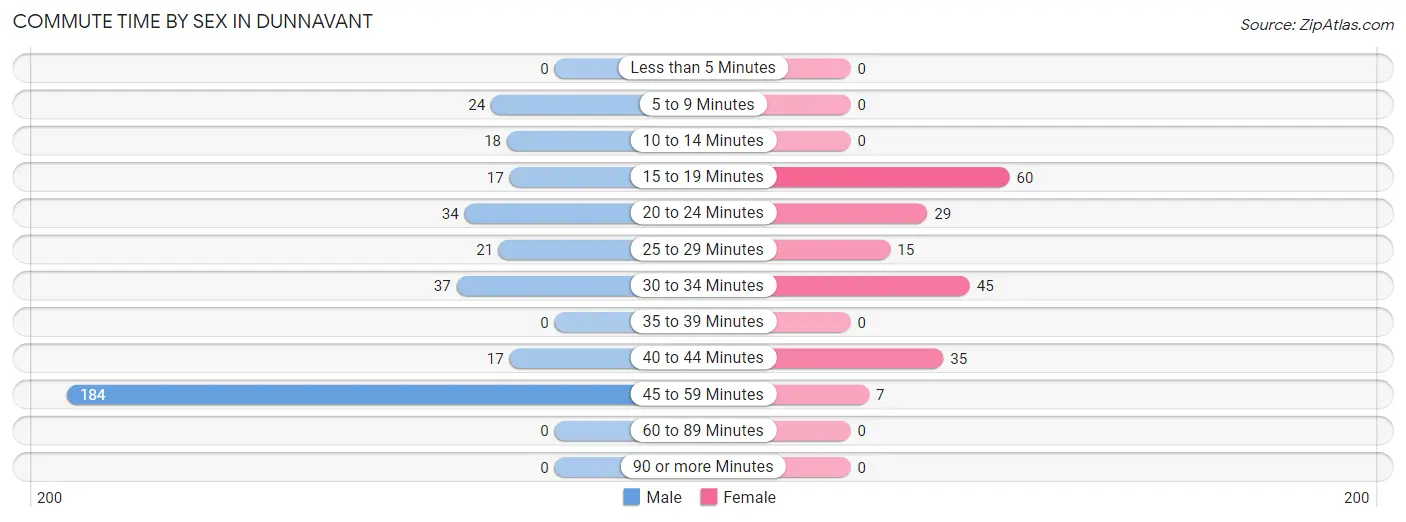
| Commute Time | Male | Female |
| Less than 5 Minutes | 0 (0.0%) | 0 (0.0%) |
| 5 to 9 Minutes | 24 (6.8%) | 0 (0.0%) |
| 10 to 14 Minutes | 18 (5.1%) | 0 (0.0%) |
| 15 to 19 Minutes | 17 (4.8%) | 60 (31.4%) |
| 20 to 24 Minutes | 34 (9.7%) | 29 (15.2%) |
| 25 to 29 Minutes | 21 (6.0%) | 15 (7.9%) |
| 30 to 34 Minutes | 37 (10.5%) | 45 (23.6%) |
| 35 to 39 Minutes | 0 (0.0%) | 0 (0.0%) |
| 40 to 44 Minutes | 17 (4.8%) | 35 (18.3%) |
| 45 to 59 Minutes | 184 (52.3%) | 7 (3.7%) |
| 60 to 89 Minutes | 0 (0.0%) | 0 (0.0%) |
| 90 or more Minutes | 0 (0.0%) | 0 (0.0%) |
Time of Departure to Work by Sex in Dunnavant
The most frequent times of departure to work in Dunnavant are 5:30 AM to 5:59 AM (156, 44.3%) for males and 8:30 AM to 8:59 AM (35, 18.3%) for females.
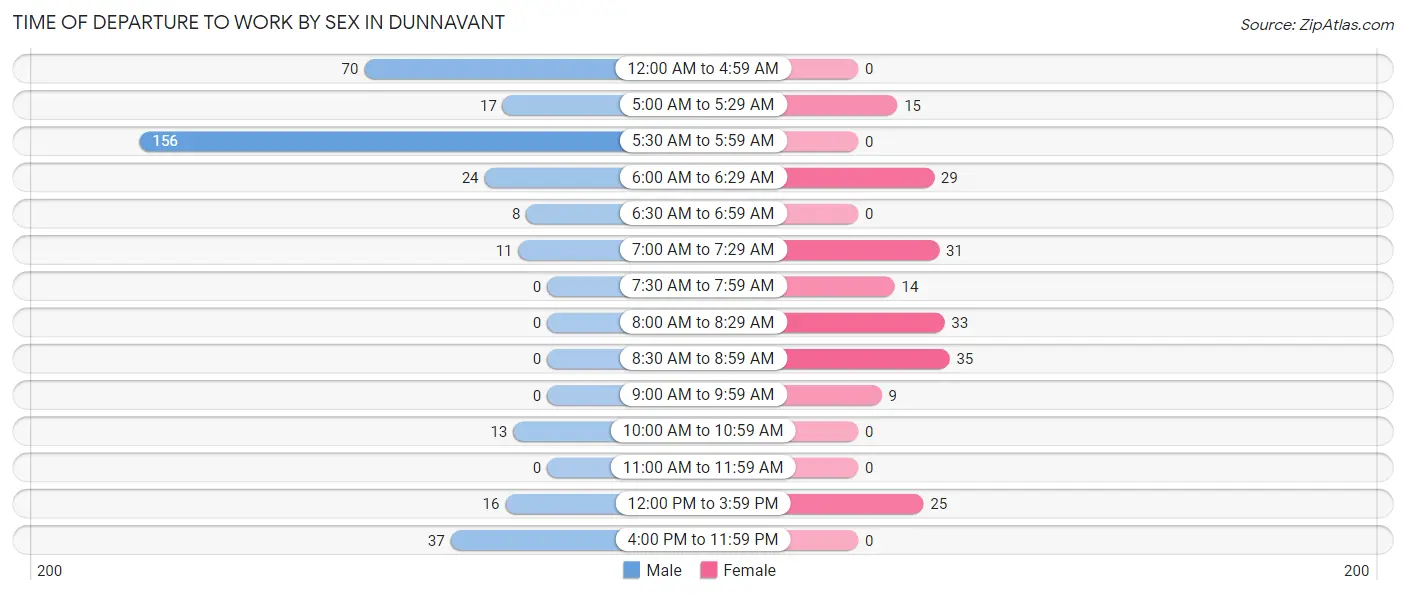
| Time of Departure | Male | Female |
| 12:00 AM to 4:59 AM | 70 (19.9%) | 0 (0.0%) |
| 5:00 AM to 5:29 AM | 17 (4.8%) | 15 (7.9%) |
| 5:30 AM to 5:59 AM | 156 (44.3%) | 0 (0.0%) |
| 6:00 AM to 6:29 AM | 24 (6.8%) | 29 (15.2%) |
| 6:30 AM to 6:59 AM | 8 (2.3%) | 0 (0.0%) |
| 7:00 AM to 7:29 AM | 11 (3.1%) | 31 (16.2%) |
| 7:30 AM to 7:59 AM | 0 (0.0%) | 14 (7.3%) |
| 8:00 AM to 8:29 AM | 0 (0.0%) | 33 (17.3%) |
| 8:30 AM to 8:59 AM | 0 (0.0%) | 35 (18.3%) |
| 9:00 AM to 9:59 AM | 0 (0.0%) | 9 (4.7%) |
| 10:00 AM to 10:59 AM | 13 (3.7%) | 0 (0.0%) |
| 11:00 AM to 11:59 AM | 0 (0.0%) | 0 (0.0%) |
| 12:00 PM to 3:59 PM | 16 (4.5%) | 25 (13.1%) |
| 4:00 PM to 11:59 PM | 37 (10.5%) | 0 (0.0%) |
| Total | 352 (100.0%) | 191 (100.0%) |
Housing Occupancy in Dunnavant
Occupancy by Ownership in Dunnavant
Of the total 478 dwellings in Dunnavant, owner-occupied units account for 383 (80.1%), while renter-occupied units make up 95 (19.9%).
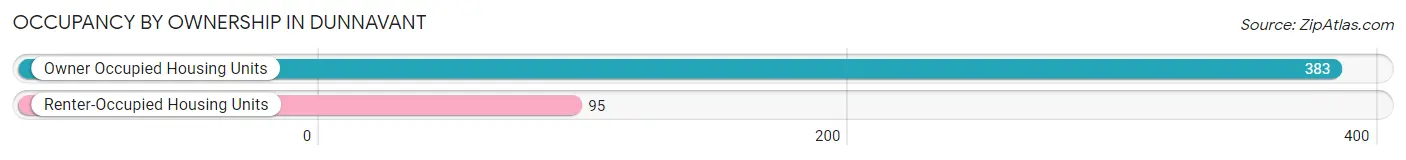
| Occupancy | # Housing Units | % Housing Units |
| Owner Occupied Housing Units | 383 | 80.1% |
| Renter-Occupied Housing Units | 95 | 19.9% |
| Total Occupied Housing Units | 478 | 100.0% |
Occupancy by Household Size in Dunnavant
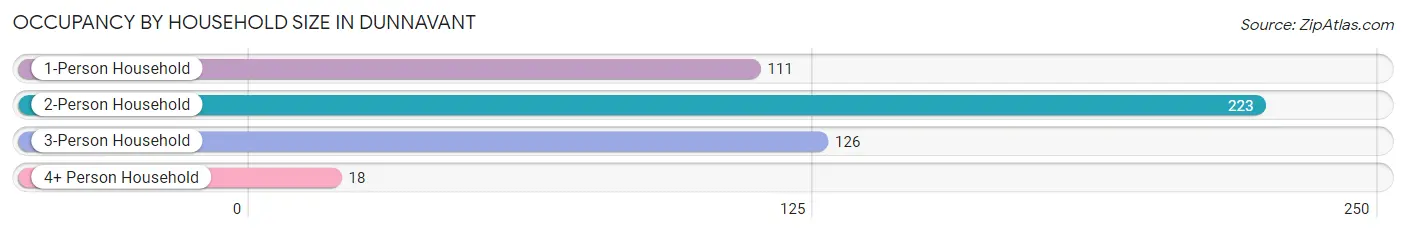
| Household Size | # Housing Units | % Housing Units |
| 1-Person Household | 111 | 23.2% |
| 2-Person Household | 223 | 46.7% |
| 3-Person Household | 126 | 26.4% |
| 4+ Person Household | 18 | 3.8% |
| Total Housing Units | 478 | 100.0% |
Occupancy by Ownership by Household Size in Dunnavant
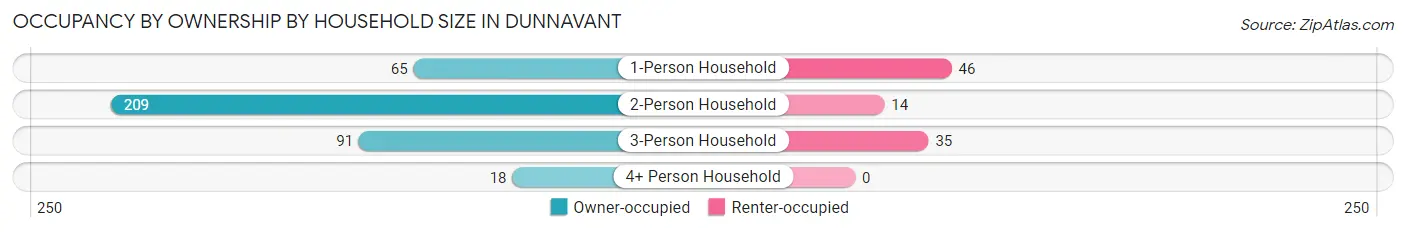
| Household Size | Owner-occupied | Renter-occupied |
| 1-Person Household | 65 (58.6%) | 46 (41.4%) |
| 2-Person Household | 209 (93.7%) | 14 (6.3%) |
| 3-Person Household | 91 (72.2%) | 35 (27.8%) |
| 4+ Person Household | 18 (100.0%) | 0 (0.0%) |
| Total Housing Units | 383 (80.1%) | 95 (19.9%) |
Occupancy by Educational Attainment in Dunnavant
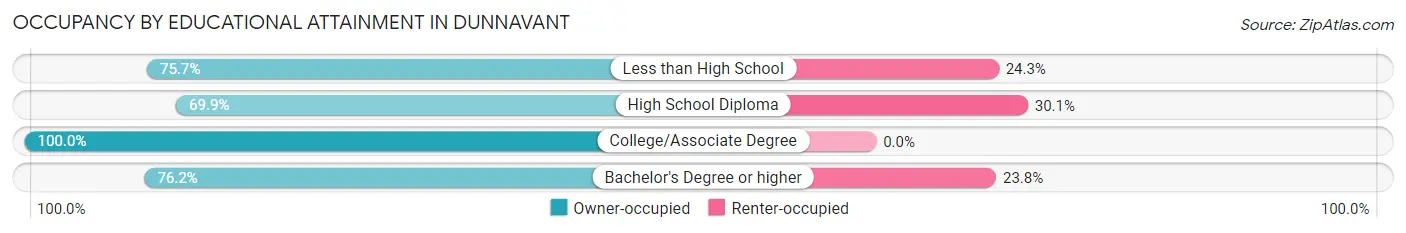
| Household Size | Owner-occupied | Renter-occupied |
| Less than High School | 53 (75.7%) | 17 (24.3%) |
| High School Diploma | 114 (69.9%) | 49 (30.1%) |
| College/Associate Degree | 123 (100.0%) | 0 (0.0%) |
| Bachelor's Degree or higher | 93 (76.2%) | 29 (23.8%) |
Occupancy by Age of Householder in Dunnavant
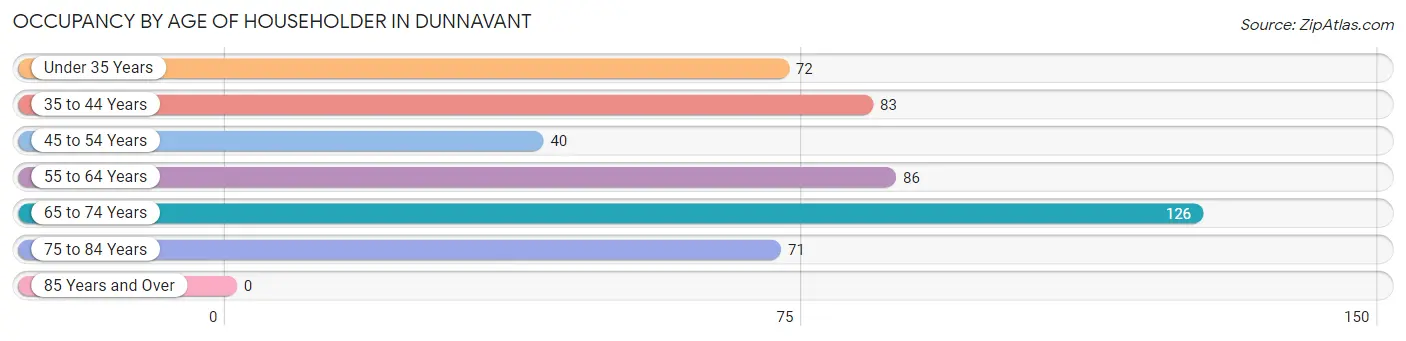
| Age Bracket | # Households | % Households |
| Under 35 Years | 72 | 15.1% |
| 35 to 44 Years | 83 | 17.4% |
| 45 to 54 Years | 40 | 8.4% |
| 55 to 64 Years | 86 | 18.0% |
| 65 to 74 Years | 126 | 26.4% |
| 75 to 84 Years | 71 | 14.8% |
| 85 Years and Over | 0 | 0.0% |
| Total | 478 | 100.0% |
Housing Finances in Dunnavant
Median Income by Occupancy in Dunnavant
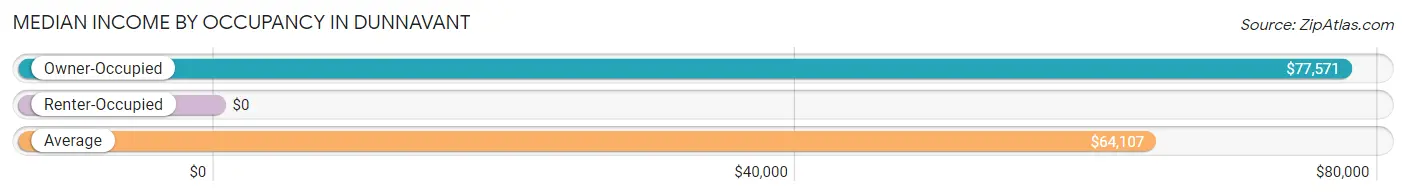
| Occupancy Type | # Households | Median Income |
| Owner-Occupied | 383 (80.1%) | $77,571 |
| Renter-Occupied | 95 (19.9%) | $0 |
| Average | 478 (100.0%) | $64,107 |
Occupancy by Householder Income Bracket in Dunnavant
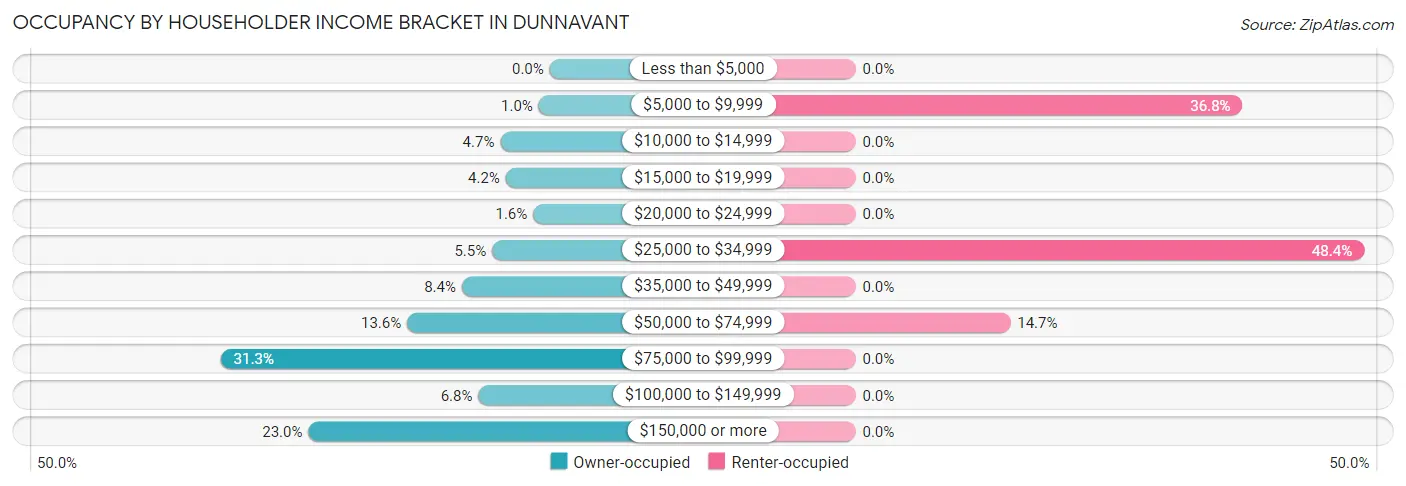
| Income Bracket | Owner-occupied | Renter-occupied |
| Less than $5,000 | 0 (0.0%) | 0 (0.0%) |
| $5,000 to $9,999 | 4 (1.0%) | 35 (36.8%) |
| $10,000 to $14,999 | 18 (4.7%) | 0 (0.0%) |
| $15,000 to $19,999 | 16 (4.2%) | 0 (0.0%) |
| $20,000 to $24,999 | 6 (1.6%) | 0 (0.0%) |
| $25,000 to $34,999 | 21 (5.5%) | 46 (48.4%) |
| $35,000 to $49,999 | 32 (8.4%) | 0 (0.0%) |
| $50,000 to $74,999 | 52 (13.6%) | 14 (14.7%) |
| $75,000 to $99,999 | 120 (31.3%) | 0 (0.0%) |
| $100,000 to $149,999 | 26 (6.8%) | 0 (0.0%) |
| $150,000 or more | 88 (23.0%) | 0 (0.0%) |
| Total | 383 (100.0%) | 95 (100.0%) |
Monthly Housing Cost Tiers in Dunnavant
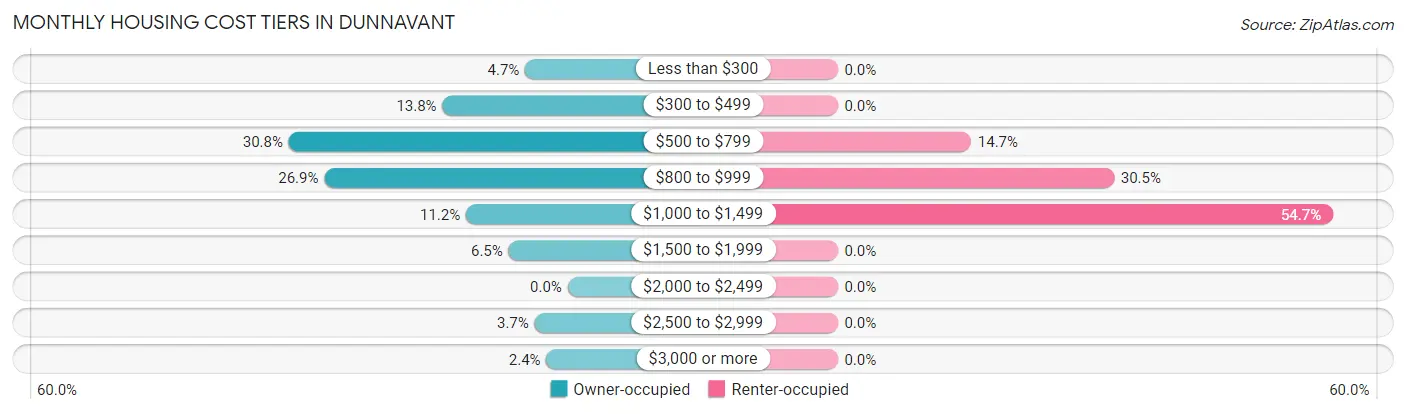
| Monthly Cost | Owner-occupied | Renter-occupied |
| Less than $300 | 18 (4.7%) | 0 (0.0%) |
| $300 to $499 | 53 (13.8%) | 0 (0.0%) |
| $500 to $799 | 118 (30.8%) | 14 (14.7%) |
| $800 to $999 | 103 (26.9%) | 29 (30.5%) |
| $1,000 to $1,499 | 43 (11.2%) | 52 (54.7%) |
| $1,500 to $1,999 | 25 (6.5%) | 0 (0.0%) |
| $2,000 to $2,499 | 0 (0.0%) | 0 (0.0%) |
| $2,500 to $2,999 | 14 (3.7%) | 0 (0.0%) |
| $3,000 or more | 9 (2.4%) | 0 (0.0%) |
| Total | 383 (100.0%) | 95 (100.0%) |
Physical Housing Characteristics in Dunnavant
Housing Structures in Dunnavant
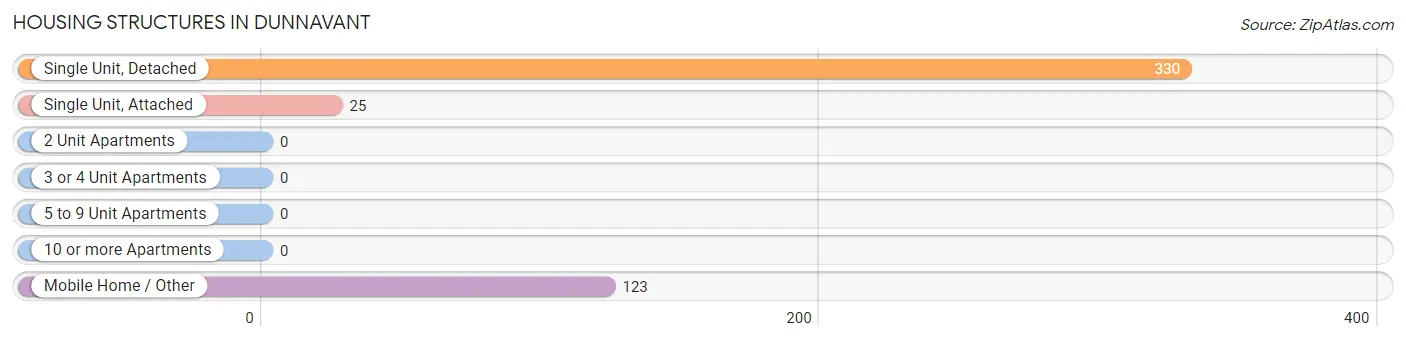
| Structure Type | # Housing Units | % Housing Units |
| Single Unit, Detached | 330 | 69.0% |
| Single Unit, Attached | 25 | 5.2% |
| 2 Unit Apartments | 0 | 0.0% |
| 3 or 4 Unit Apartments | 0 | 0.0% |
| 5 to 9 Unit Apartments | 0 | 0.0% |
| 10 or more Apartments | 0 | 0.0% |
| Mobile Home / Other | 123 | 25.7% |
| Total | 478 | 100.0% |
Housing Structures by Occupancy in Dunnavant
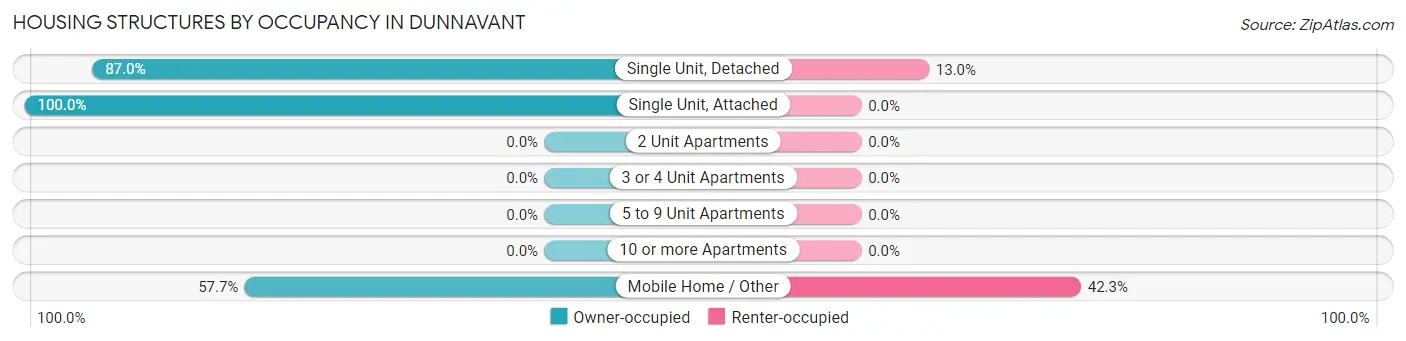
| Structure Type | Owner-occupied | Renter-occupied |
| Single Unit, Detached | 287 (87.0%) | 43 (13.0%) |
| Single Unit, Attached | 25 (100.0%) | 0 (0.0%) |
| 2 Unit Apartments | 0 (0.0%) | 0 (0.0%) |
| 3 or 4 Unit Apartments | 0 (0.0%) | 0 (0.0%) |
| 5 to 9 Unit Apartments | 0 (0.0%) | 0 (0.0%) |
| 10 or more Apartments | 0 (0.0%) | 0 (0.0%) |
| Mobile Home / Other | 71 (57.7%) | 52 (42.3%) |
| Total | 383 (80.1%) | 95 (19.9%) |
Housing Structures by Number of Rooms in Dunnavant
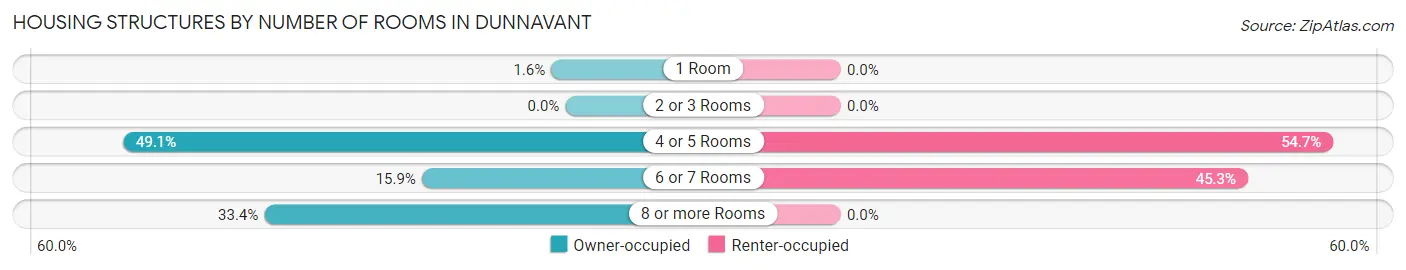
| Number of Rooms | Owner-occupied | Renter-occupied |
| 1 Room | 6 (1.6%) | 0 (0.0%) |
| 2 or 3 Rooms | 0 (0.0%) | 0 (0.0%) |
| 4 or 5 Rooms | 188 (49.1%) | 52 (54.7%) |
| 6 or 7 Rooms | 61 (15.9%) | 43 (45.3%) |
| 8 or more Rooms | 128 (33.4%) | 0 (0.0%) |
| Total | 383 (100.0%) | 95 (100.0%) |
Housing Structure by Heating Type in Dunnavant
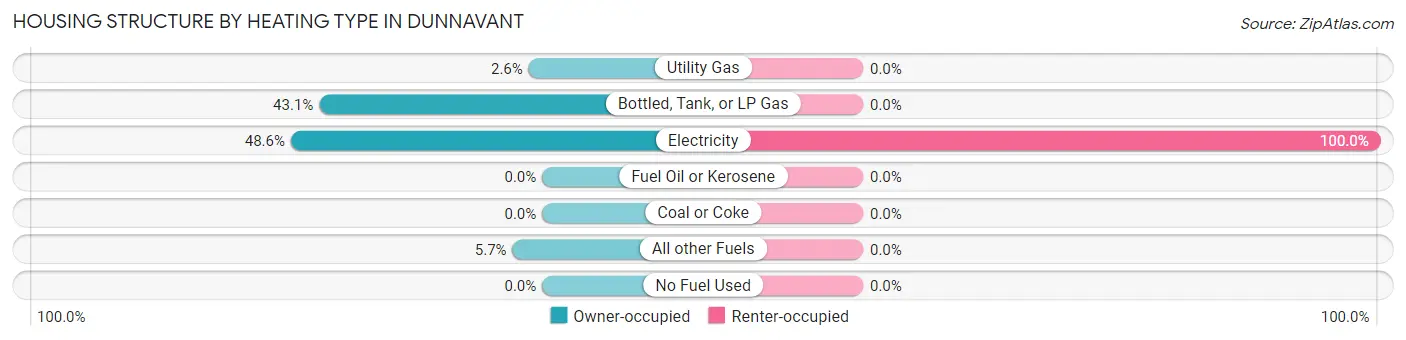
| Heating Type | Owner-occupied | Renter-occupied |
| Utility Gas | 10 (2.6%) | 0 (0.0%) |
| Bottled, Tank, or LP Gas | 165 (43.1%) | 0 (0.0%) |
| Electricity | 186 (48.6%) | 95 (100.0%) |
| Fuel Oil or Kerosene | 0 (0.0%) | 0 (0.0%) |
| Coal or Coke | 0 (0.0%) | 0 (0.0%) |
| All other Fuels | 22 (5.7%) | 0 (0.0%) |
| No Fuel Used | 0 (0.0%) | 0 (0.0%) |
| Total | 383 (100.0%) | 95 (100.0%) |
Household Vehicle Usage in Dunnavant
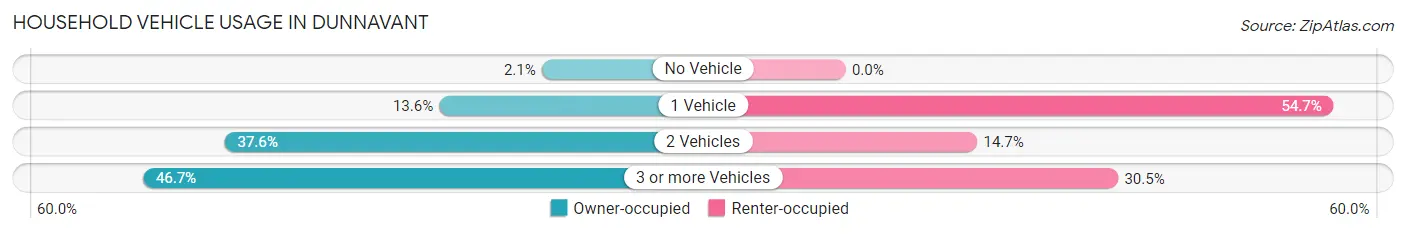
| Vehicles per Household | Owner-occupied | Renter-occupied |
| No Vehicle | 8 (2.1%) | 0 (0.0%) |
| 1 Vehicle | 52 (13.6%) | 52 (54.7%) |
| 2 Vehicles | 144 (37.6%) | 14 (14.7%) |
| 3 or more Vehicles | 179 (46.7%) | 29 (30.5%) |
| Total | 383 (100.0%) | 95 (100.0%) |
Real Estate & Mortgages in Dunnavant
Real Estate and Mortgage Overview in Dunnavant
| Characteristic | Without Mortgage | With Mortgage |
| Housing Units | 213 | 170 |
| Median Property Value | $193,800 | $0 |
| Median Household Income | $78,137 | $30 |
| Monthly Housing Costs | $730 | $9 |
| Real Estate Taxes | $734 | $0 |
Property Value by Mortgage Status in Dunnavant
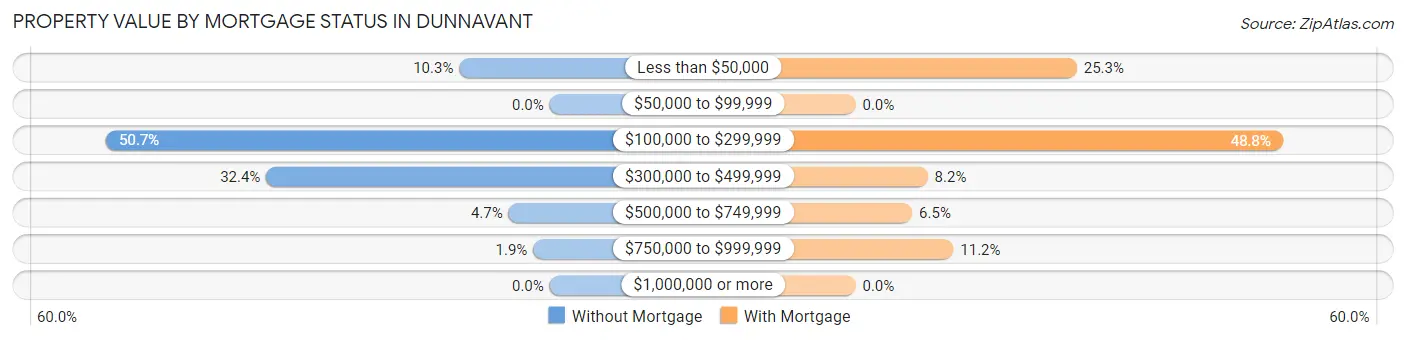
| Property Value | Without Mortgage | With Mortgage |
| Less than $50,000 | 22 (10.3%) | 43 (25.3%) |
| $50,000 to $99,999 | 0 (0.0%) | 0 (0.0%) |
| $100,000 to $299,999 | 108 (50.7%) | 83 (48.8%) |
| $300,000 to $499,999 | 69 (32.4%) | 14 (8.2%) |
| $500,000 to $749,999 | 10 (4.7%) | 11 (6.5%) |
| $750,000 to $999,999 | 4 (1.9%) | 19 (11.2%) |
| $1,000,000 or more | 0 (0.0%) | 0 (0.0%) |
| Total | 213 (100.0%) | 170 (100.0%) |
Household Income by Mortgage Status in Dunnavant
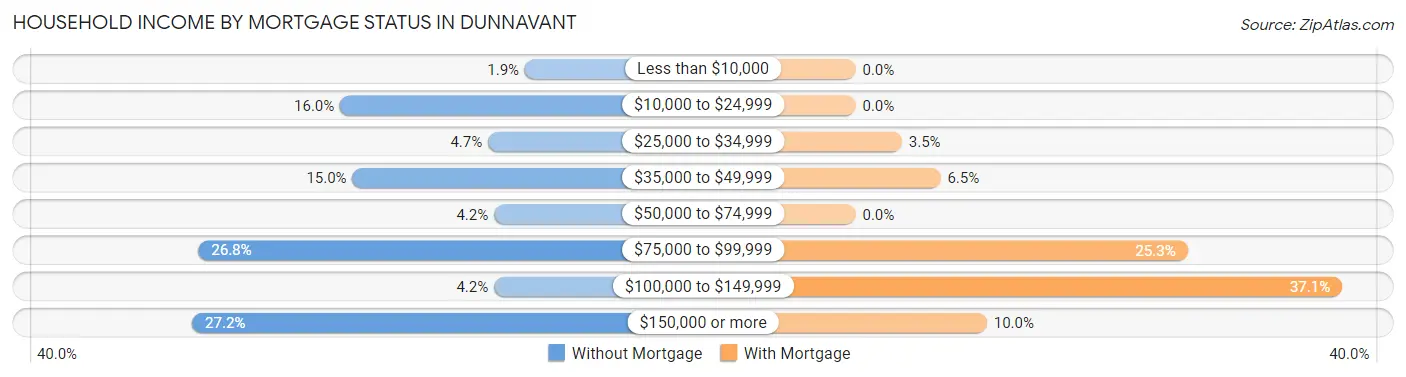
| Household Income | Without Mortgage | With Mortgage |
| Less than $10,000 | 4 (1.9%) | 0 (0.0%) |
| $10,000 to $24,999 | 34 (16.0%) | 0 (0.0%) |
| $25,000 to $34,999 | 10 (4.7%) | 6 (3.5%) |
| $35,000 to $49,999 | 32 (15.0%) | 11 (6.5%) |
| $50,000 to $74,999 | 9 (4.2%) | 0 (0.0%) |
| $75,000 to $99,999 | 57 (26.8%) | 43 (25.3%) |
| $100,000 to $149,999 | 9 (4.2%) | 63 (37.1%) |
| $150,000 or more | 58 (27.2%) | 17 (10.0%) |
| Total | 213 (100.0%) | 170 (100.0%) |
Property Value to Household Income Ratio in Dunnavant
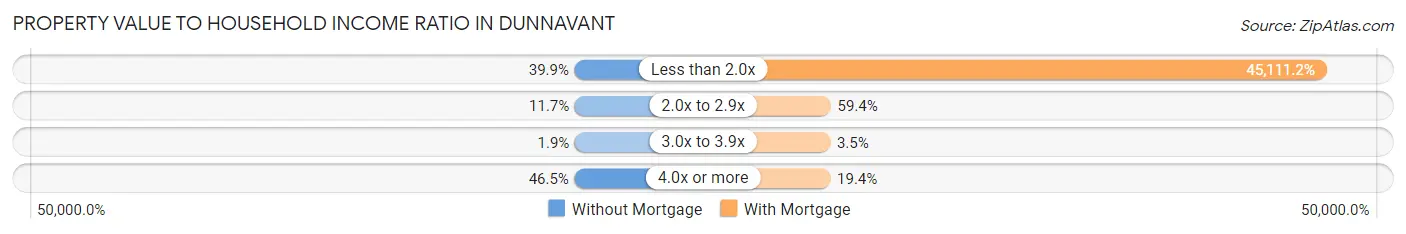
| Value-to-Income Ratio | Without Mortgage | With Mortgage |
| Less than 2.0x | 85 (39.9%) | 76,689 (45,111.2%) |
| 2.0x to 2.9x | 25 (11.7%) | 101 (59.4%) |
| 3.0x to 3.9x | 4 (1.9%) | 6 (3.5%) |
| 4.0x or more | 99 (46.5%) | 33 (19.4%) |
| Total | 213 (100.0%) | 170 (100.0%) |
Real Estate Taxes by Mortgage Status in Dunnavant
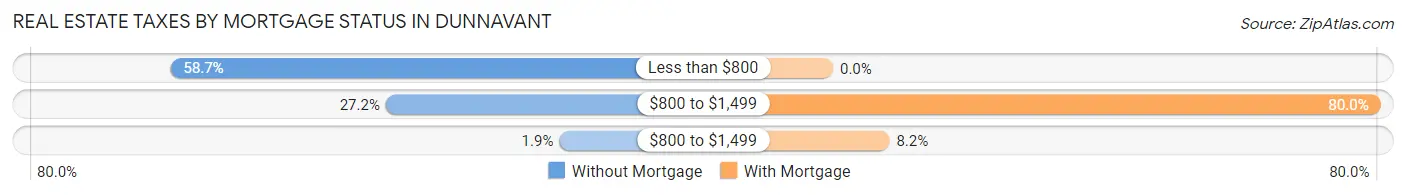
| Property Taxes | Without Mortgage | With Mortgage |
| Less than $800 | 125 (58.7%) | 0 (0.0%) |
| $800 to $1,499 | 58 (27.2%) | 136 (80.0%) |
| $800 to $1,499 | 4 (1.9%) | 14 (8.2%) |
| Total | 213 (100.0%) | 170 (100.0%) |
Health & Disability in Dunnavant
Health Insurance Coverage by Age in Dunnavant
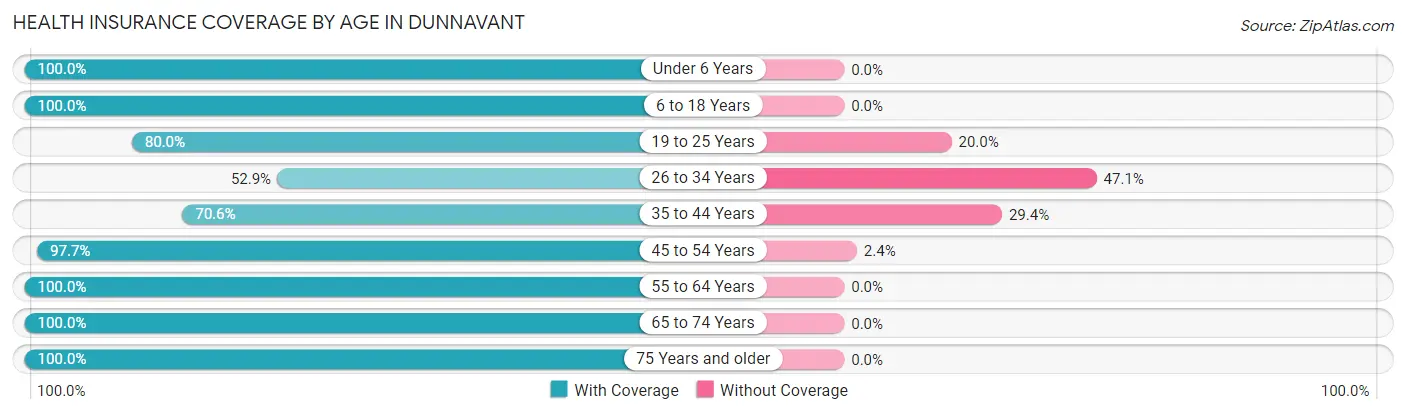
| Age Bracket | With Coverage | Without Coverage |
| Under 6 Years | 67 (100.0%) | 0 (0.0%) |
| 6 to 18 Years | 121 (100.0%) | 0 (0.0%) |
| 19 to 25 Years | 68 (80.0%) | 17 (20.0%) |
| 26 to 34 Years | 27 (52.9%) | 24 (47.1%) |
| 35 to 44 Years | 84 (70.6%) | 35 (29.4%) |
| 45 to 54 Years | 249 (97.7%) | 6 (2.4%) |
| 55 to 64 Years | 184 (100.0%) | 0 (0.0%) |
| 65 to 74 Years | 177 (100.0%) | 0 (0.0%) |
| 75 Years and older | 75 (100.0%) | 0 (0.0%) |
| Total | 1,052 (92.8%) | 82 (7.2%) |
Health Insurance Coverage by Citizenship Status in Dunnavant
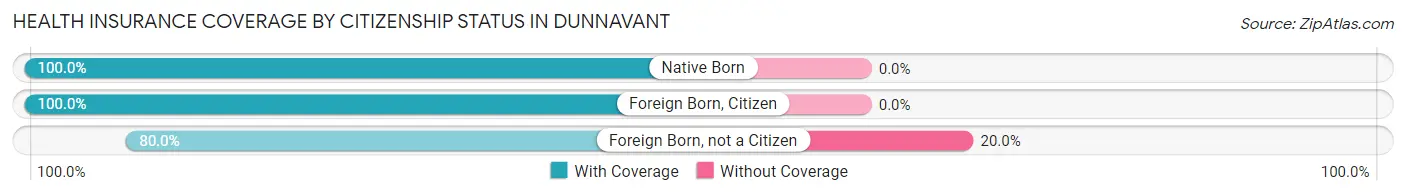
| Citizenship Status | With Coverage | Without Coverage |
| Native Born | 67 (100.0%) | 0 (0.0%) |
| Foreign Born, Citizen | 121 (100.0%) | 0 (0.0%) |
| Foreign Born, not a Citizen | 68 (80.0%) | 17 (20.0%) |
Health Insurance Coverage by Household Income in Dunnavant
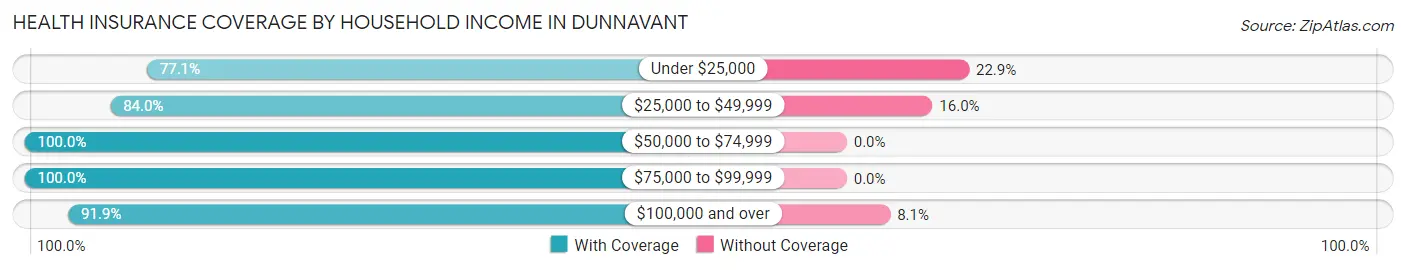
| Household Income | With Coverage | Without Coverage |
| Under $25,000 | 138 (77.1%) | 41 (22.9%) |
| $25,000 to $49,999 | 89 (84.0%) | 17 (16.0%) |
| $50,000 to $74,999 | 183 (100.0%) | 0 (0.0%) |
| $75,000 to $99,999 | 371 (100.0%) | 0 (0.0%) |
| $100,000 and over | 271 (91.9%) | 24 (8.1%) |
Public vs Private Health Insurance Coverage by Age in Dunnavant
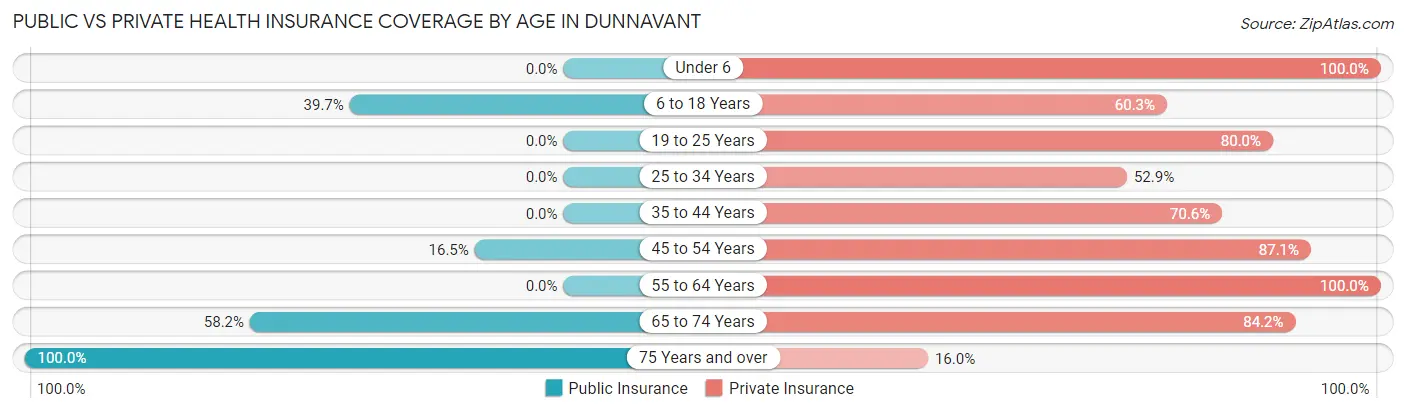
| Age Bracket | Public Insurance | Private Insurance |
| Under 6 | 0 (0.0%) | 67 (100.0%) |
| 6 to 18 Years | 48 (39.7%) | 73 (60.3%) |
| 19 to 25 Years | 0 (0.0%) | 68 (80.0%) |
| 25 to 34 Years | 0 (0.0%) | 27 (52.9%) |
| 35 to 44 Years | 0 (0.0%) | 84 (70.6%) |
| 45 to 54 Years | 42 (16.5%) | 222 (87.1%) |
| 55 to 64 Years | 0 (0.0%) | 184 (100.0%) |
| 65 to 74 Years | 103 (58.2%) | 149 (84.2%) |
| 75 Years and over | 75 (100.0%) | 12 (16.0%) |
| Total | 268 (23.6%) | 886 (78.1%) |
Disability Status by Sex by Age in Dunnavant
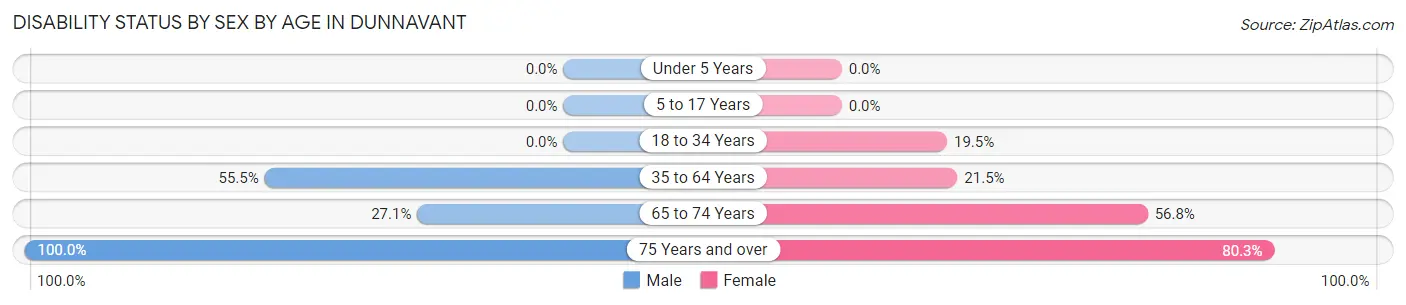
| Age Bracket | Male | Female |
| Under 5 Years | 0 (0.0%) | 0 (0.0%) |
| 5 to 17 Years | 0 (0.0%) | 0 (0.0%) |
| 18 to 34 Years | 0 (0.0%) | 17 (19.5%) |
| 35 to 64 Years | 188 (55.5%) | 47 (21.5%) |
| 65 to 74 Years | 16 (27.1%) | 67 (56.8%) |
| 75 Years and over | 4 (100.0%) | 57 (80.3%) |
Disability Class by Sex by Age in Dunnavant
Disability Class: Hearing Difficulty
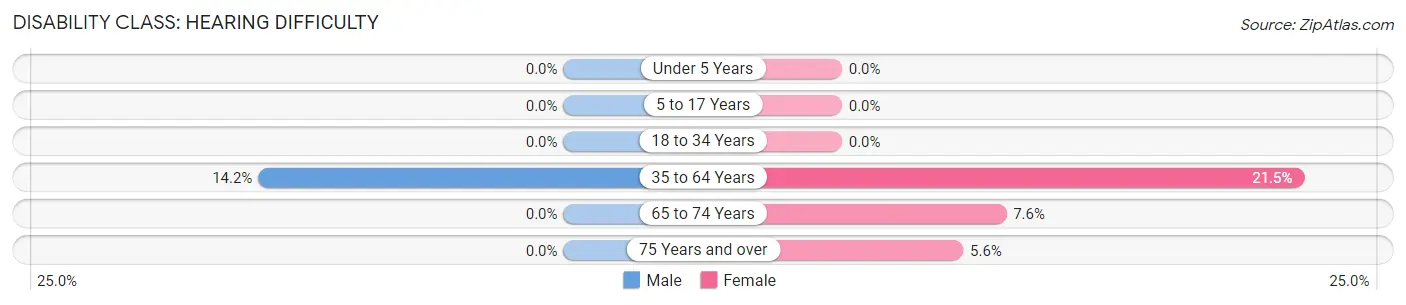
| Age Bracket | Male | Female |
| Under 5 Years | 0 (0.0%) | 0 (0.0%) |
| 5 to 17 Years | 0 (0.0%) | 0 (0.0%) |
| 18 to 34 Years | 0 (0.0%) | 0 (0.0%) |
| 35 to 64 Years | 48 (14.2%) | 47 (21.5%) |
| 65 to 74 Years | 0 (0.0%) | 9 (7.6%) |
| 75 Years and over | 0 (0.0%) | 4 (5.6%) |
Disability Class: Vision Difficulty
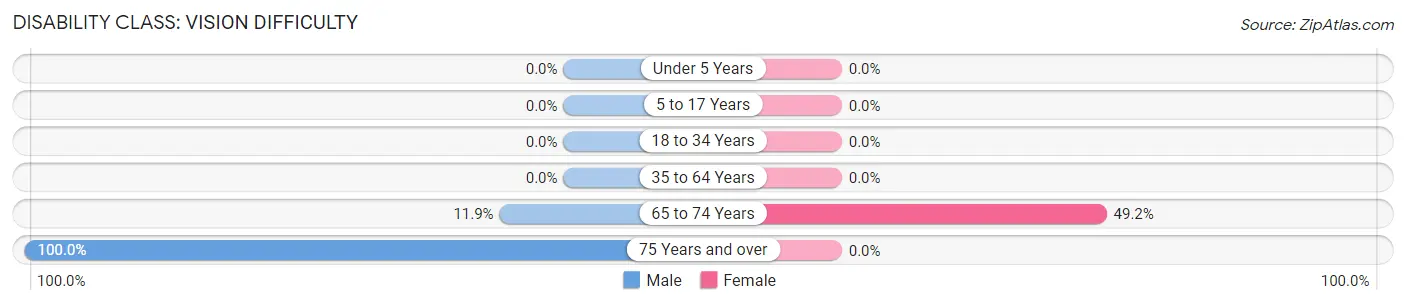
| Age Bracket | Male | Female |
| Under 5 Years | 0 (0.0%) | 0 (0.0%) |
| 5 to 17 Years | 0 (0.0%) | 0 (0.0%) |
| 18 to 34 Years | 0 (0.0%) | 0 (0.0%) |
| 35 to 64 Years | 0 (0.0%) | 0 (0.0%) |
| 65 to 74 Years | 7 (11.9%) | 58 (49.1%) |
| 75 Years and over | 4 (100.0%) | 0 (0.0%) |
Disability Class: Cognitive Difficulty
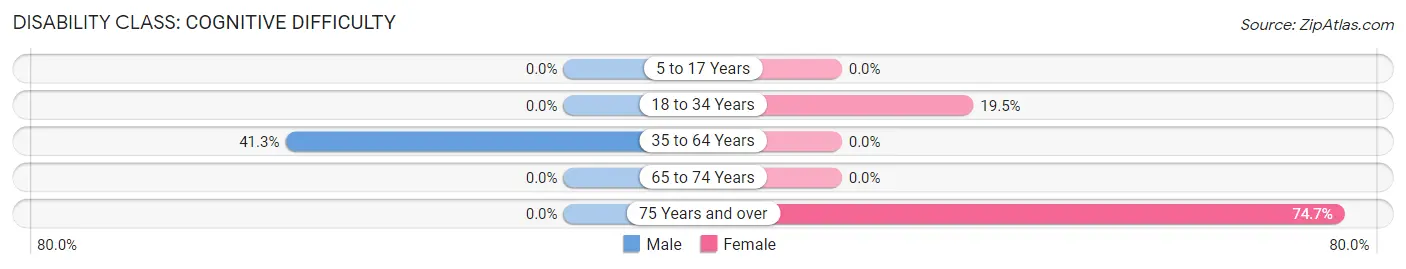
| Age Bracket | Male | Female |
| 5 to 17 Years | 0 (0.0%) | 0 (0.0%) |
| 18 to 34 Years | 0 (0.0%) | 17 (19.5%) |
| 35 to 64 Years | 140 (41.3%) | 0 (0.0%) |
| 65 to 74 Years | 0 (0.0%) | 0 (0.0%) |
| 75 Years and over | 0 (0.0%) | 53 (74.7%) |
Disability Class: Ambulatory Difficulty
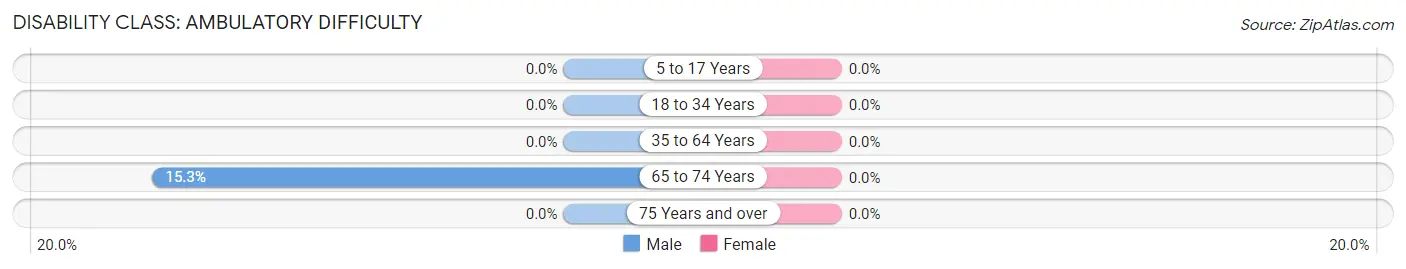
| Age Bracket | Male | Female |
| 5 to 17 Years | 0 (0.0%) | 0 (0.0%) |
| 18 to 34 Years | 0 (0.0%) | 0 (0.0%) |
| 35 to 64 Years | 0 (0.0%) | 0 (0.0%) |
| 65 to 74 Years | 9 (15.2%) | 0 (0.0%) |
| 75 Years and over | 0 (0.0%) | 0 (0.0%) |
Disability Class: Self-Care Difficulty
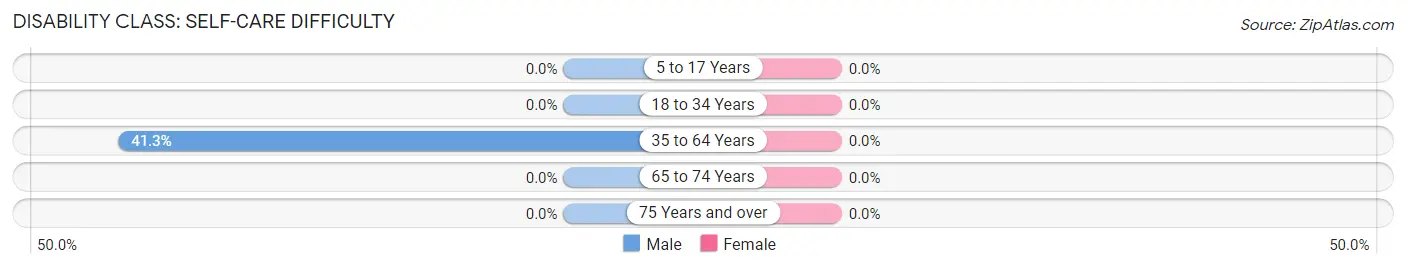
| Age Bracket | Male | Female |
| 5 to 17 Years | 0 (0.0%) | 0 (0.0%) |
| 18 to 34 Years | 0 (0.0%) | 0 (0.0%) |
| 35 to 64 Years | 140 (41.3%) | 0 (0.0%) |
| 65 to 74 Years | 0 (0.0%) | 0 (0.0%) |
| 75 Years and over | 0 (0.0%) | 0 (0.0%) |
Technology Access in Dunnavant
Computing Device Access in Dunnavant
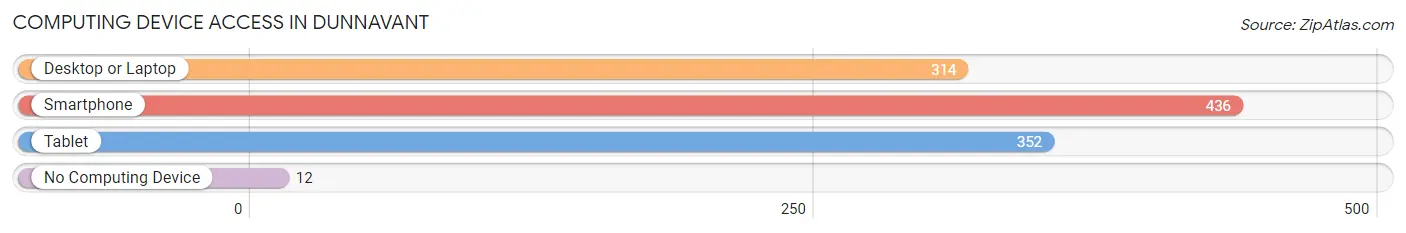
| Device Type | # Households | % Households |
| Desktop or Laptop | 314 | 65.7% |
| Smartphone | 436 | 91.2% |
| Tablet | 352 | 73.6% |
| No Computing Device | 12 | 2.5% |
| Total | 478 | 100.0% |
Internet Access in Dunnavant
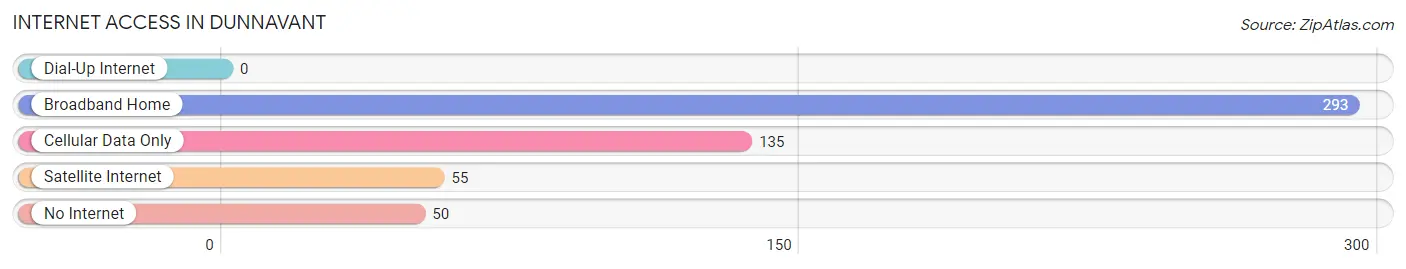
| Internet Type | # Households | % Households |
| Dial-Up Internet | 0 | 0.0% |
| Broadband Home | 293 | 61.3% |
| Cellular Data Only | 135 | 28.2% |
| Satellite Internet | 55 | 11.5% |
| No Internet | 50 | 10.5% |
| Total | 478 | 100.0% |
Dunnavant Summary
Dunnavant is a small unincorporated community located in Shelby County, Alabama. It is situated approximately 20 miles south of Birmingham and is part of the Birmingham-Hoover Metropolitan Statistical Area. The population of Dunnavant was estimated to be 1,845 in 2019.
History
The area that is now Dunnavant was first settled in the early 1800s by the Dunn family. The family owned a large plantation in the area and the community was named after them. The town was officially incorporated in 1887 and was home to a post office, a general store, and a few other businesses.
In the early 1900s, the town began to decline as the railroad bypassed it and the population began to move away. By the mid-1900s, the town had become a small rural community with a population of less than 500.
Geography
Dunnavant is located in the foothills of the Appalachian Mountains in the southeastern corner of Shelby County. It is situated at an elevation of 830 feet above sea level. The town is bordered by the cities of Chelsea and Montevallo to the north, and the towns of Wilsonville and Vandiver to the south.
The climate in Dunnavant is humid subtropical, with hot, humid summers and mild winters. The average annual temperature is around 64°F, with an average high of 87°F in the summer and an average low of 41°F in the winter.
Economy
The economy of Dunnavant is largely based on agriculture. The town is home to several farms, which produce a variety of crops, including corn, soybeans, cotton, and hay. The town also has a few small businesses, including a gas station, a convenience store, and a few restaurants.
Demographics
As of the 2010 census, the population of Dunnavant was 1,717. The racial makeup of the town was 97.3% White, 0.9% African American, 0.2% Native American, 0.2% Asian, and 1.4% from other races. The median household income was $45,938, and the median family income was $51,938.
Conclusion
Dunnavant is a small unincorporated community located in Shelby County, Alabama. It is situated approximately 20 miles south of Birmingham and is part of the Birmingham-Hoover Metropolitan Statistical Area. The population of Dunnavant was estimated to be 1,845 in 2019. The town is largely agricultural, with a few small businesses, and has a population that is predominantly white.
Common Questions
What is Per Capita Income in Dunnavant?
Per Capita income in Dunnavant is $37,852.
What is the Median Family Income in Dunnavant?
Median Family Income in Dunnavant is $77,948.
What is the Median Household income in Dunnavant?
Median Household Income in Dunnavant is $64,107.
What is Income or Wage Gap in Dunnavant?
Income or Wage Gap in Dunnavant is 59.5%.
Women in Dunnavant earn 40.5 cents for every dollar earned by a man.
What is Inequality or Gini Index in Dunnavant?
Inequality or Gini Index in Dunnavant is 0.41.
What is the Total Population of Dunnavant?
Total Population of Dunnavant is 1,134.
What is the Total Male Population of Dunnavant?
Total Male Population of Dunnavant is 616.
What is the Total Female Population of Dunnavant?
Total Female Population of Dunnavant is 518.
What is the Ratio of Males per 100 Females in Dunnavant?
There are 118.92 Males per 100 Females in Dunnavant.
What is the Ratio of Females per 100 Males in Dunnavant?
There are 84.09 Females per 100 Males in Dunnavant.
What is the Median Population Age in Dunnavant?
Median Population Age in Dunnavant is 52.3 Years.
What is the Average Family Size in Dunnavant
Average Family Size in Dunnavant is 2.6 People.
What is the Average Household Size in Dunnavant
Average Household Size in Dunnavant is 2.4 People.
How Large is the Labor Force in Dunnavant?
There are 690 People in the Labor Forcein in Dunnavant.
What is the Percentage of People in the Labor Force in Dunnavant?
68.5% of People are in the Labor Force in Dunnavant.