New Hope, AL Map & Demographics
New Hope Map
New Hope Overview
$28,201
PER CAPITA INCOME
$110,938
AVG FAMILY INCOME
$76,680
AVG HOUSEHOLD INCOME
15.2%
WAGE / INCOME GAP [ % ]
84.8¢/ $1
WAGE / INCOME GAP [ $ ]
0.37
INEQUALITY / GINI INDEX
2,875
TOTAL POPULATION
1,431
MALE POPULATION
1,444
FEMALE POPULATION
99.10
MALES / 100 FEMALES
100.91
FEMALES / 100 MALES
34.2
MEDIAN AGE
3.7
AVG FAMILY SIZE
3.0
AVG HOUSEHOLD SIZE
1,408
LABOR FORCE [ PEOPLE ]
72.4%
PERCENT IN LABOR FORCE
7.9%
UNEMPLOYMENT RATE
New Hope Zip Codes
New Hope Area Codes
Income in New Hope
Income Overview in New Hope
Per Capita Income in New Hope is $28,201, while median incomes of families and households are $110,938 and $76,680 respectively.
| Characteristic | Number | Measure |
| Per Capita Income | 2,875 | $28,201 |
| Median Family Income | 697 | $110,938 |
| Mean Family Income | 697 | $96,616 |
| Median Household Income | 943 | $76,680 |
| Mean Household Income | 943 | $84,808 |
| Income Deficit | 697 | $0 |
| Wage / Income Gap (%) | 2,875 | 15.17% |
| Wage / Income Gap ($) | 2,875 | 84.83¢ per $1 |
| Gini / Inequality Index | 2,875 | 0.37 |
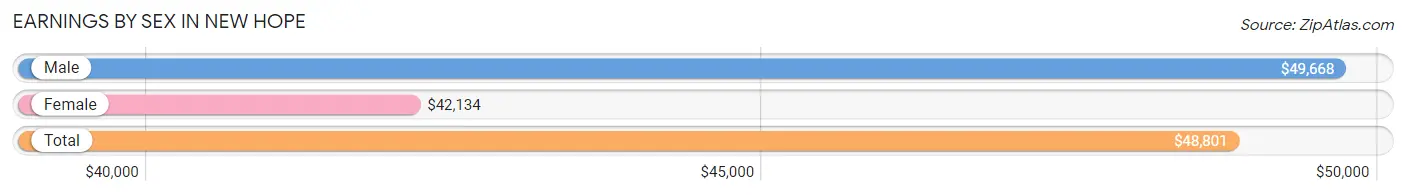
Earnings by Sex in New Hope
Average Earnings in New Hope are $48,801, $49,668 for men and $42,134 for women, a difference of 15.2%.
| Sex | Number | Average Earnings |
| Male | 650 (48.1%) | $49,668 |
| Female | 700 (51.8%) | $42,134 |
| Total | 1,350 (100.0%) | $48,801 |
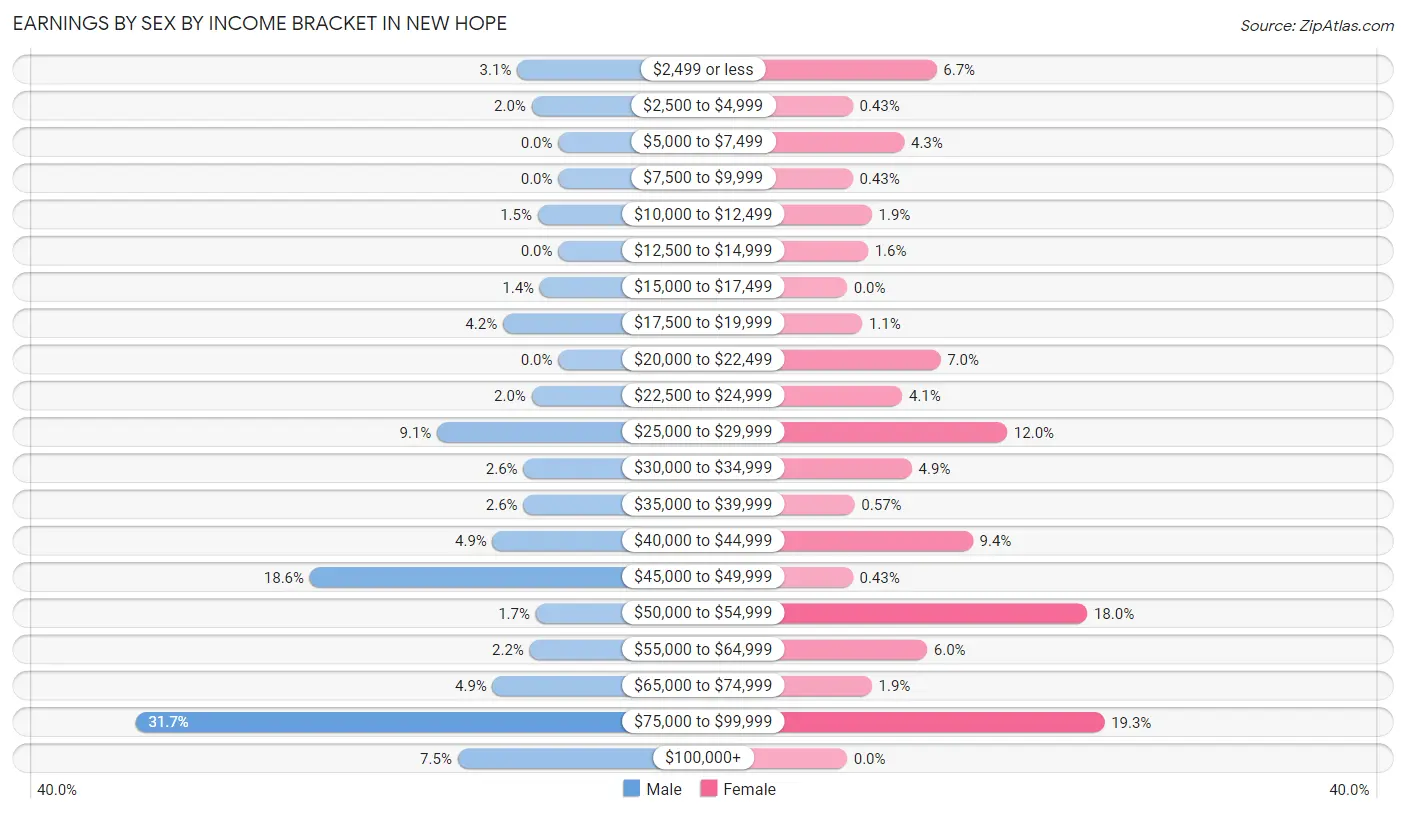
Earnings by Sex by Income Bracket in New Hope
The most common earnings brackets in New Hope are $75,000 to $99,999 for men (206 | 31.7%) and $75,000 to $99,999 for women (135 | 19.3%).
| Income | Male | Female |
| $2,499 or less | 20 (3.1%) | 47 (6.7%) |
| $2,500 to $4,999 | 13 (2.0%) | 3 (0.4%) |
| $5,000 to $7,499 | 0 (0.0%) | 30 (4.3%) |
| $7,500 to $9,999 | 0 (0.0%) | 3 (0.4%) |
| $10,000 to $12,499 | 10 (1.5%) | 13 (1.9%) |
| $12,500 to $14,999 | 0 (0.0%) | 11 (1.6%) |
| $15,000 to $17,499 | 9 (1.4%) | 0 (0.0%) |
| $17,500 to $19,999 | 27 (4.2%) | 8 (1.1%) |
| $20,000 to $22,499 | 0 (0.0%) | 49 (7.0%) |
| $22,500 to $24,999 | 13 (2.0%) | 29 (4.1%) |
| $25,000 to $29,999 | 59 (9.1%) | 84 (12.0%) |
| $30,000 to $34,999 | 17 (2.6%) | 34 (4.9%) |
| $35,000 to $39,999 | 17 (2.6%) | 4 (0.6%) |
| $40,000 to $44,999 | 32 (4.9%) | 66 (9.4%) |
| $45,000 to $49,999 | 121 (18.6%) | 3 (0.4%) |
| $50,000 to $54,999 | 11 (1.7%) | 126 (18.0%) |
| $55,000 to $64,999 | 14 (2.1%) | 42 (6.0%) |
| $65,000 to $74,999 | 32 (4.9%) | 13 (1.9%) |
| $75,000 to $99,999 | 206 (31.7%) | 135 (19.3%) |
| $100,000+ | 49 (7.5%) | 0 (0.0%) |
| Total | 650 (100.0%) | 700 (100.0%) |
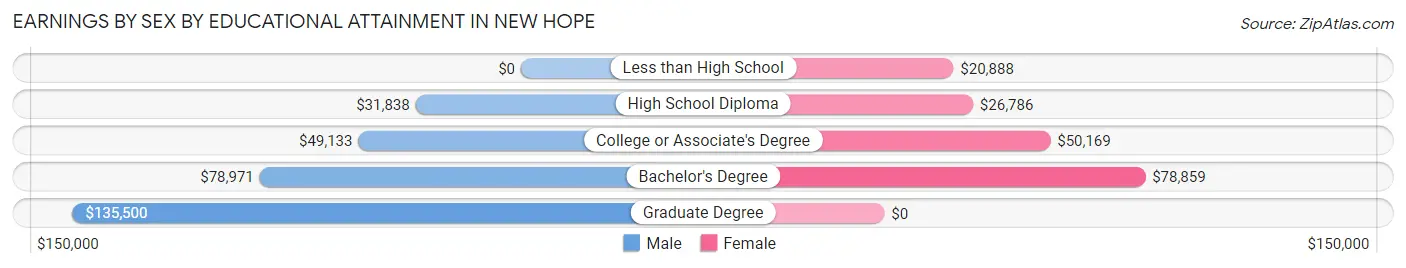
Earnings by Sex by Educational Attainment in New Hope
Average earnings in New Hope are $63,000 for men and $45,417 for women, a difference of 27.9%. Men with an educational attainment of graduate degree enjoy the highest average annual earnings of $135,500, while those with high school diploma education earn the least with $31,838. Women with an educational attainment of bachelor's degree earn the most with the average annual earnings of $78,859, while those with less than high school education have the smallest earnings of $20,888.
| Educational Attainment | Male Income | Female Income |
| Less than High School | - | - |
| High School Diploma | $31,838 | $26,786 |
| College or Associate's Degree | $49,133 | $50,169 |
| Bachelor's Degree | $78,971 | $78,859 |
| Graduate Degree | $135,500 | $0 |
| Total | $63,000 | $45,417 |
Family Income in New Hope
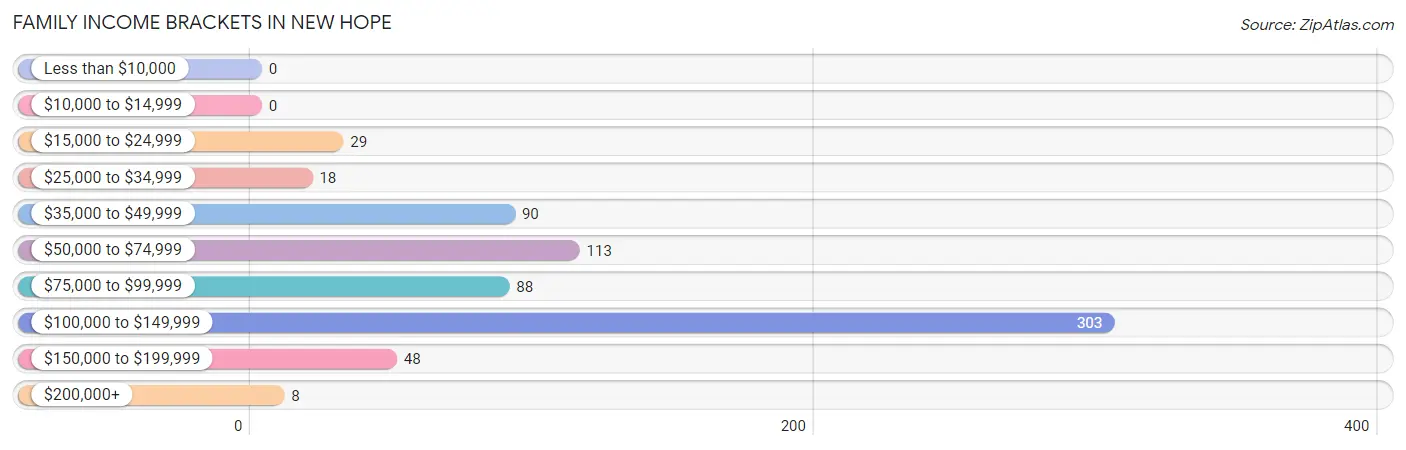
Family Income Brackets in New Hope
According to the New Hope family income data, there are 303 families falling into the $100,000 to $149,999 income range, which is the most common income bracket and makes up 43.5% of all families.
| Income Bracket | # Families | % Families |
| Less than $10,000 | 0 | 0.0% |
| $10,000 to $14,999 | 0 | 0.0% |
| $15,000 to $24,999 | 29 | 4.2% |
| $25,000 to $34,999 | 18 | 2.6% |
| $35,000 to $49,999 | 90 | 12.9% |
| $50,000 to $74,999 | 113 | 16.2% |
| $75,000 to $99,999 | 88 | 12.6% |
| $100,000 to $149,999 | 303 | 43.5% |
| $150,000 to $199,999 | 48 | 6.9% |
| $200,000+ | 8 | 1.1% |
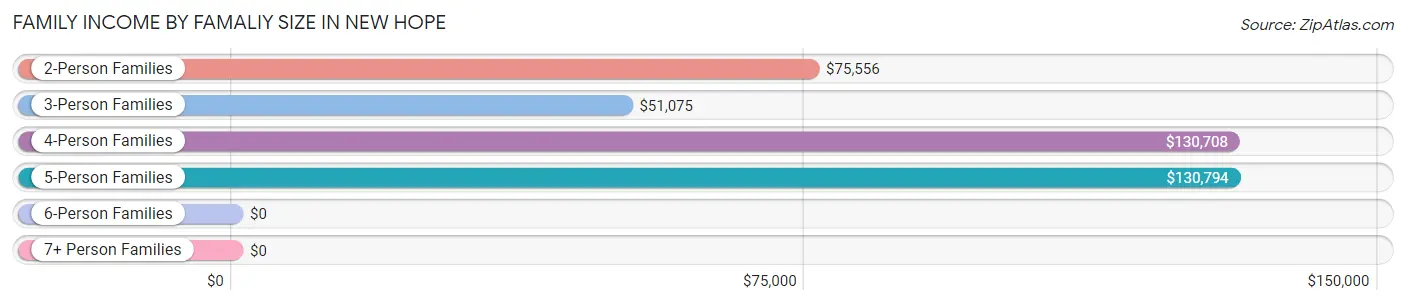
Family Income by Famaliy Size in New Hope
5-person families (131 | 18.8%) account for the highest median family income in New Hope with $130,794 per family, while 2-person families (178 | 25.5%) have the highest median income of $37,778 per family member.
| Income Bracket | # Families | Median Income |
| 2-Person Families | 178 (25.5%) | $75,556 |
| 3-Person Families | 125 (17.9%) | $51,075 |
| 4-Person Families | 255 (36.6%) | $130,708 |
| 5-Person Families | 131 (18.8%) | $130,794 |
| 6-Person Families | 0 (0.0%) | $0 |
| 7+ Person Families | 8 (1.1%) | $0 |
| Total | 697 (100.0%) | $110,938 |
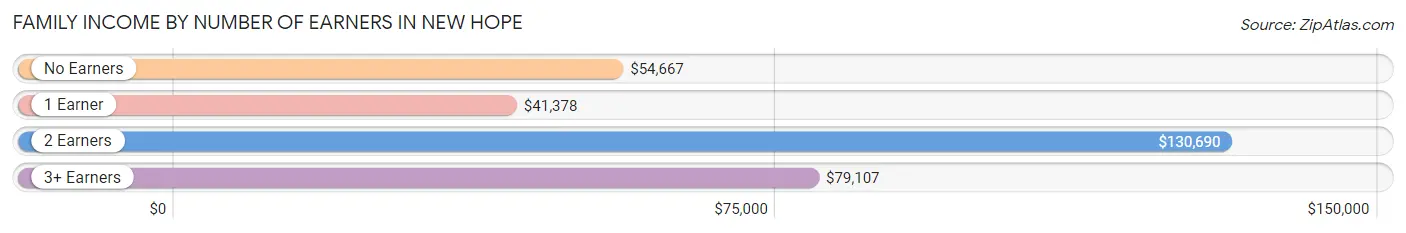
Family Income by Number of Earners in New Hope
The median family income in New Hope is $110,938, with families comprising 2 earners (458) having the highest median family income of $130,690, while families with 1 earner (145) have the lowest median family income of $41,378, accounting for 65.7% and 20.8% of families, respectively.
| Number of Earners | # Families | Median Income |
| No Earners | 60 (8.6%) | $54,667 |
| 1 Earner | 145 (20.8%) | $41,378 |
| 2 Earners | 458 (65.7%) | $130,690 |
| 3+ Earners | 34 (4.9%) | $79,107 |
| Total | 697 (100.0%) | $110,938 |
Household Income in New Hope
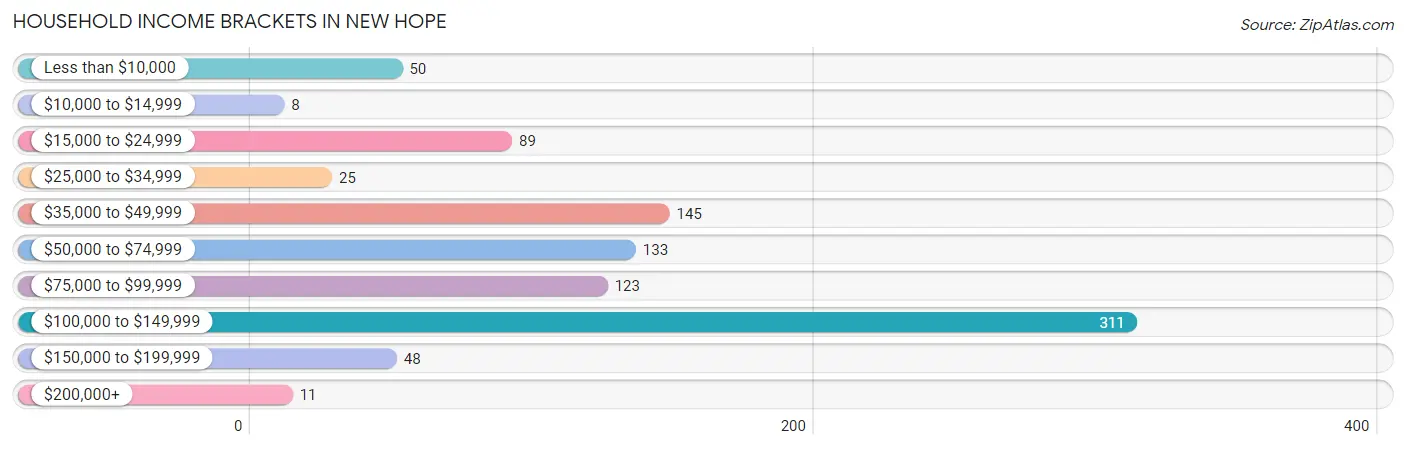
Household Income Brackets in New Hope
With 311 households falling in the category, the $100,000 to $149,999 income range is the most frequent in New Hope, accounting for 33.0% of all households. In contrast, only 8 households (0.9%) fall into the $10,000 to $14,999 income bracket, making it the least populous group.
| Income Bracket | # Households | % Households |
| Less than $10,000 | 50 | 5.3% |
| $10,000 to $14,999 | 8 | 0.8% |
| $15,000 to $24,999 | 89 | 9.4% |
| $25,000 to $34,999 | 25 | 2.7% |
| $35,000 to $49,999 | 145 | 15.4% |
| $50,000 to $74,999 | 133 | 14.1% |
| $75,000 to $99,999 | 123 | 13.0% |
| $100,000 to $149,999 | 311 | 33.0% |
| $150,000 to $199,999 | 48 | 5.1% |
| $200,000+ | 11 | 1.2% |
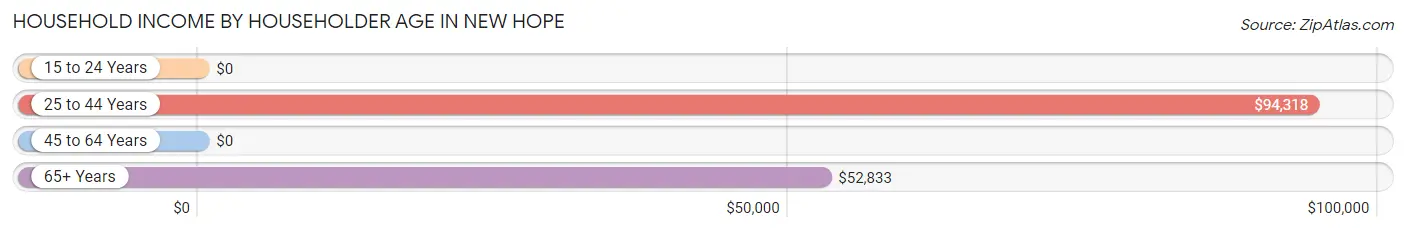
Household Income by Householder Age in New Hope
The median household income in New Hope is $76,680, with the highest median household income of $94,318 found in the 25 to 44 years age bracket for the primary householder. A total of 402 households (42.6%) fall into this category. Meanwhile, the 15 to 24 years age bracket for the primary householder has the lowest median household income of $0, with 16 households (1.7%) in this group.
| Income Bracket | # Households | Median Income |
| 15 to 24 Years | 16 (1.7%) | $0 |
| 25 to 44 Years | 402 (42.6%) | $94,318 |
| 45 to 64 Years | 347 (36.8%) | $0 |
| 65+ Years | 178 (18.9%) | $52,833 |
| Total | 943 (100.0%) | $76,680 |
Poverty in New Hope
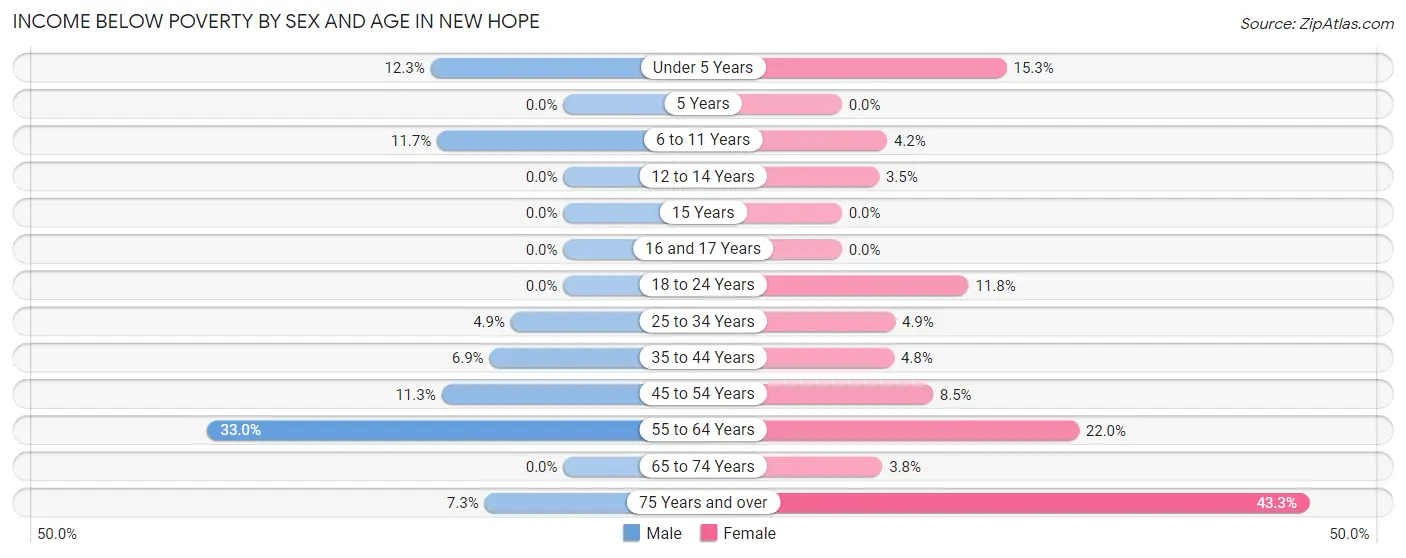
Income Below Poverty by Sex and Age in New Hope
With 8.5% poverty level for males and 8.6% for females among the residents of New Hope, 55 to 64 year old males and 75 year old and over females are the most vulnerable to poverty, with 35 males (33.0%) and 26 females (43.3%) in their respective age groups living below the poverty level.
| Age Bracket | Male | Female |
| Under 5 Years | 9 (12.3%) | 13 (15.3%) |
| 5 Years | 0 (0.0%) | 0 (0.0%) |
| 6 to 11 Years | 28 (11.7%) | 8 (4.2%) |
| 12 to 14 Years | 0 (0.0%) | 6 (3.5%) |
| 15 Years | 0 (0.0%) | 0 (0.0%) |
| 16 and 17 Years | 0 (0.0%) | 0 (0.0%) |
| 18 to 24 Years | 0 (0.0%) | 8 (11.8%) |
| 25 to 34 Years | 6 (4.9%) | 13 (4.9%) |
| 35 to 44 Years | 21 (6.9%) | 12 (4.8%) |
| 45 to 54 Years | 19 (11.3%) | 12 (8.5%) |
| 55 to 64 Years | 35 (33.0%) | 22 (22.0%) |
| 65 to 74 Years | 0 (0.0%) | 3 (3.7%) |
| 75 Years and over | 3 (7.3%) | 26 (43.3%) |
| Total | 121 (8.5%) | 123 (8.6%) |
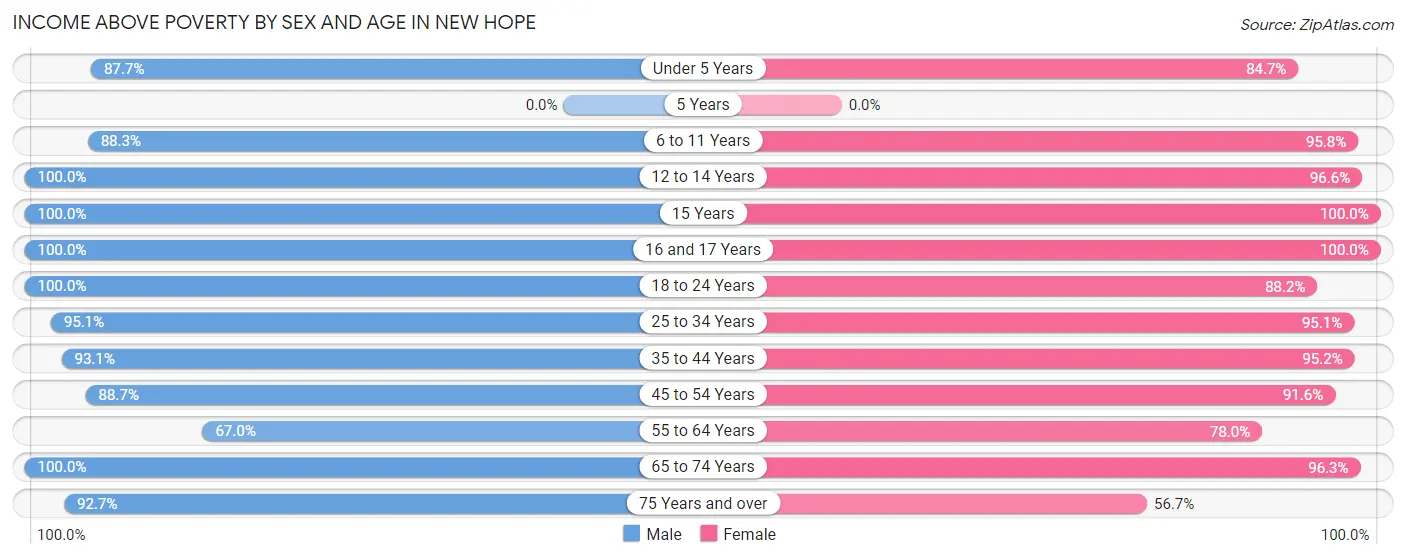
Income Above Poverty by Sex and Age in New Hope
According to the poverty statistics in New Hope, males aged 12 to 14 years and females aged 15 years are the age groups that are most secure financially, with 100.0% of males and 100.0% of females in these age groups living above the poverty line.
| Age Bracket | Male | Female |
| Under 5 Years | 64 (87.7%) | 72 (84.7%) |
| 5 Years | 0 (0.0%) | 0 (0.0%) |
| 6 to 11 Years | 211 (88.3%) | 183 (95.8%) |
| 12 to 14 Years | 3 (100.0%) | 168 (96.6%) |
| 15 Years | 147 (100.0%) | 8 (100.0%) |
| 16 and 17 Years | 31 (100.0%) | 15 (100.0%) |
| 18 to 24 Years | 113 (100.0%) | 60 (88.2%) |
| 25 to 34 Years | 117 (95.1%) | 250 (95.1%) |
| 35 to 44 Years | 285 (93.1%) | 236 (95.2%) |
| 45 to 54 Years | 149 (88.7%) | 130 (91.5%) |
| 55 to 64 Years | 71 (67.0%) | 78 (78.0%) |
| 65 to 74 Years | 81 (100.0%) | 77 (96.3%) |
| 75 Years and over | 38 (92.7%) | 34 (56.7%) |
| Total | 1,310 (91.5%) | 1,311 (91.4%) |
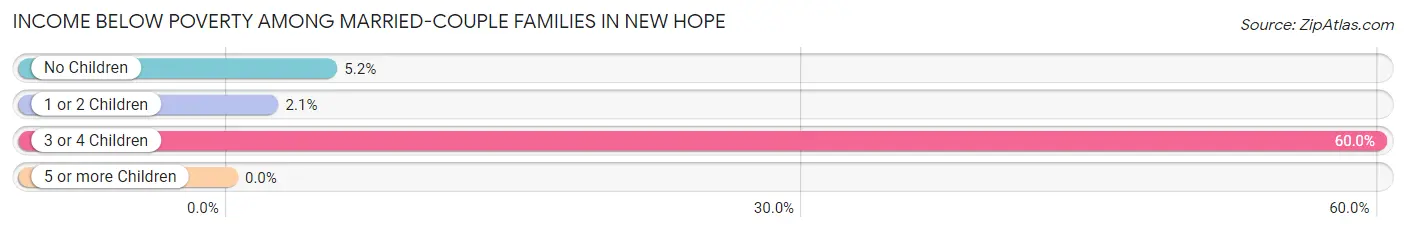
Income Below Poverty Among Married-Couple Families in New Hope
The poverty statistics for married-couple families in New Hope show that 4.9% or 29 of the total 598 families live below the poverty line. Families with 3 or 4 children have the highest poverty rate of 60.0%, comprising of 12 families. On the other hand, families with 1 or 2 children have the lowest poverty rate of 2.1%, which includes 9 families.
| Children | Above Poverty | Below Poverty |
| No Children | 146 (94.8%) | 8 (5.2%) |
| 1 or 2 Children | 415 (97.9%) | 9 (2.1%) |
| 3 or 4 Children | 8 (40.0%) | 12 (60.0%) |
| 5 or more Children | 0 (0.0%) | 0 (0.0%) |
| Total | 569 (95.2%) | 29 (4.9%) |
Income Below Poverty Among Single-Parent Households in New Hope
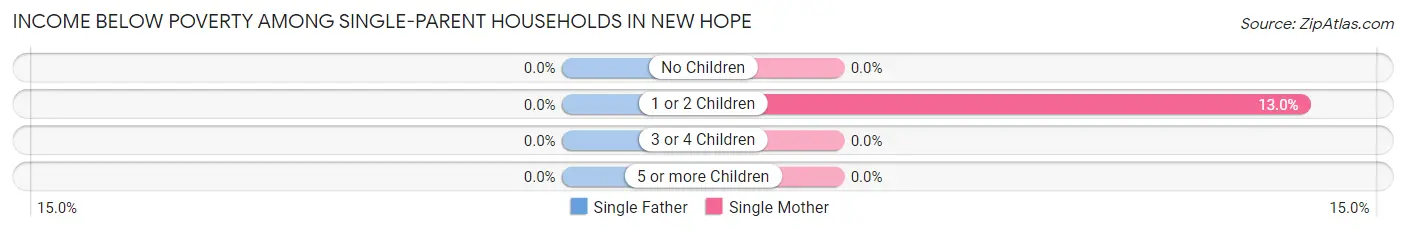
| Children | Single Father | Single Mother |
| No Children | 0 (0.0%) | 0 (0.0%) |
| 1 or 2 Children | 0 (0.0%) | 6 (13.0%) |
| 3 or 4 Children | 0 (0.0%) | 0 (0.0%) |
| 5 or more Children | 0 (0.0%) | 0 (0.0%) |
| Total | 0 (0.0%) | 6 (7.8%) |
Income Below Poverty Among Married-Couple vs Single-Parent Households in New Hope
The poverty data for New Hope shows that 29 of the married-couple family households (4.9%) and 6 of the single-parent households (6.1%) are living below the poverty level. Within the married-couple family households, those with 3 or 4 children have the highest poverty rate, with 12 households (60.0%) falling below the poverty line. Among the single-parent households, those with 1 or 2 children have the highest poverty rate, with 6 household (12.5%) living below poverty.
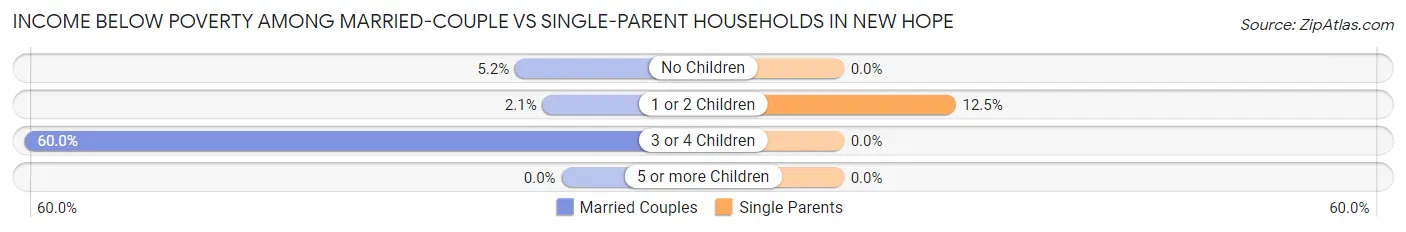
| Children | Married-Couple Families | Single-Parent Households |
| No Children | 8 (5.2%) | 0 (0.0%) |
| 1 or 2 Children | 9 (2.1%) | 6 (12.5%) |
| 3 or 4 Children | 12 (60.0%) | 0 (0.0%) |
| 5 or more Children | 0 (0.0%) | 0 (0.0%) |
| Total | 29 (4.9%) | 6 (6.1%) |
Race in New Hope
The most populous races in New Hope are White / Caucasian (2,778 | 96.6%), Native / Alaskan (39 | 1.4%), and Black / African American (34 | 1.2%).
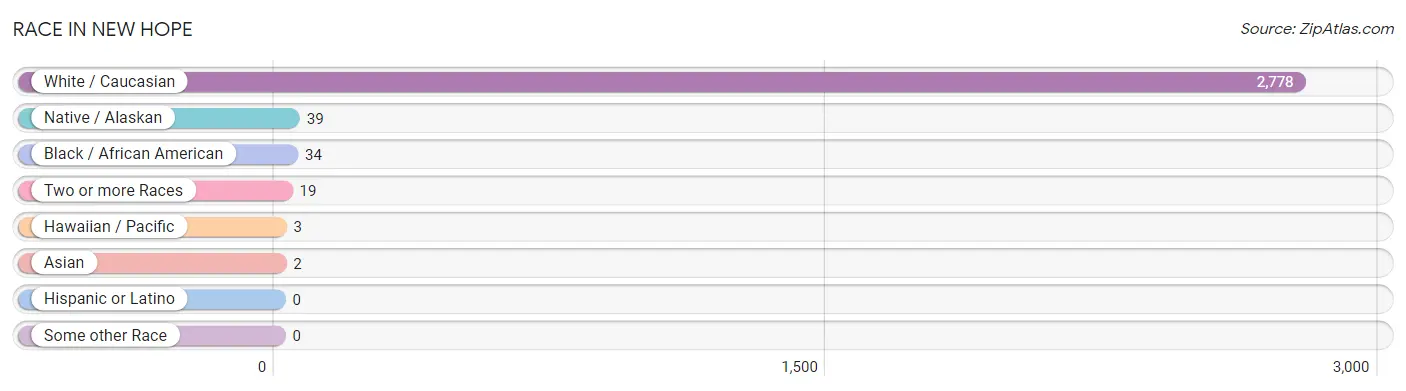
| Race | # Population | % Population |
| Asian | 2 | 0.1% |
| Black / African American | 34 | 1.2% |
| Hawaiian / Pacific | 3 | 0.1% |
| Hispanic or Latino | 0 | 0.0% |
| Native / Alaskan | 39 | 1.4% |
| White / Caucasian | 2,778 | 96.6% |
| Two or more Races | 19 | 0.7% |
| Some other Race | 0 | 0.0% |
| Total | 2,875 | 100.0% |
Ancestry in New Hope
The most populous ancestries reported in New Hope are American (419 | 14.6%), Irish (152 | 5.3%), Italian (120 | 4.2%), English (110 | 3.8%), and German (107 | 3.7%), together accounting for 31.6% of all New Hope residents.
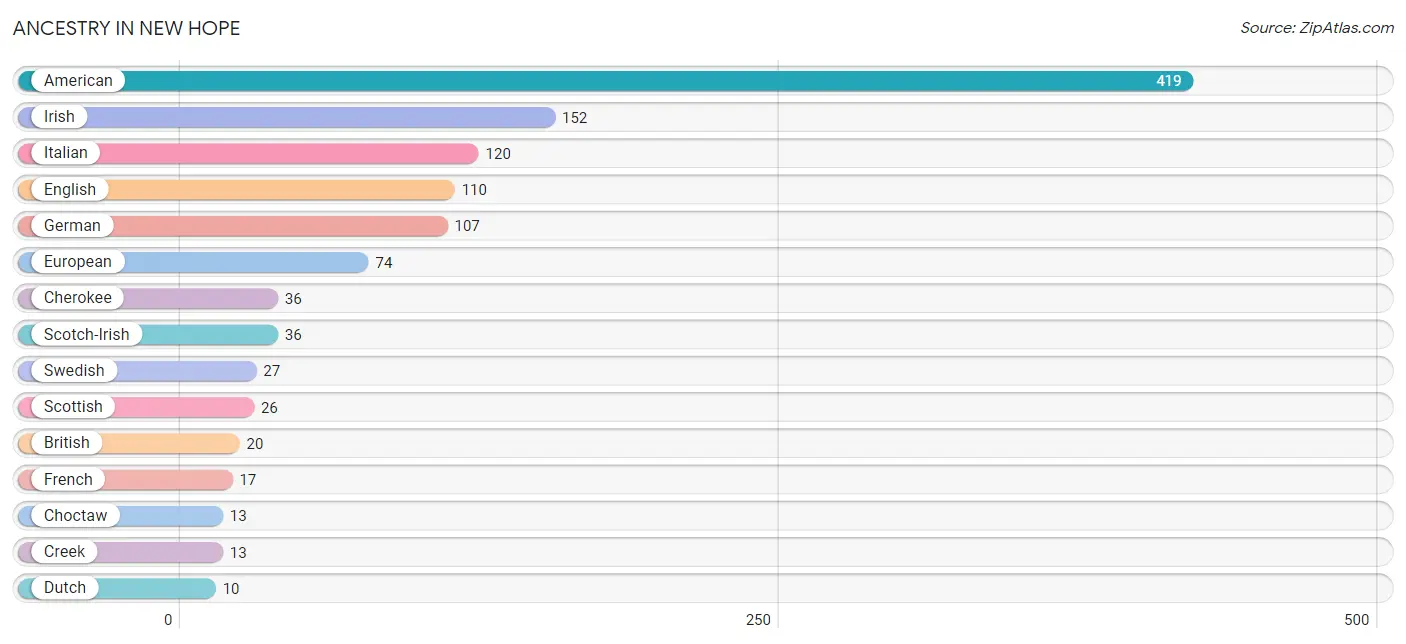
| Ancestry | # Population | % Population |
| American | 419 | 14.6% |
| British | 20 | 0.7% |
| Canadian | 3 | 0.1% |
| Cherokee | 36 | 1.3% |
| Choctaw | 13 | 0.4% |
| Creek | 13 | 0.4% |
| Dutch | 10 | 0.4% |
| English | 110 | 3.8% |
| European | 74 | 2.6% |
| Fijian | 3 | 0.1% |
| French | 17 | 0.6% |
| French Canadian | 7 | 0.2% |
| German | 107 | 3.7% |
| Irish | 152 | 5.3% |
| Italian | 120 | 4.2% |
| Native Hawaiian | 6 | 0.2% |
| Portuguese | 10 | 0.4% |
| Scotch-Irish | 36 | 1.3% |
| Scottish | 26 | 0.9% |
| Swedish | 27 | 0.9% | View All 20 Rows |
Immigrants in New Hope
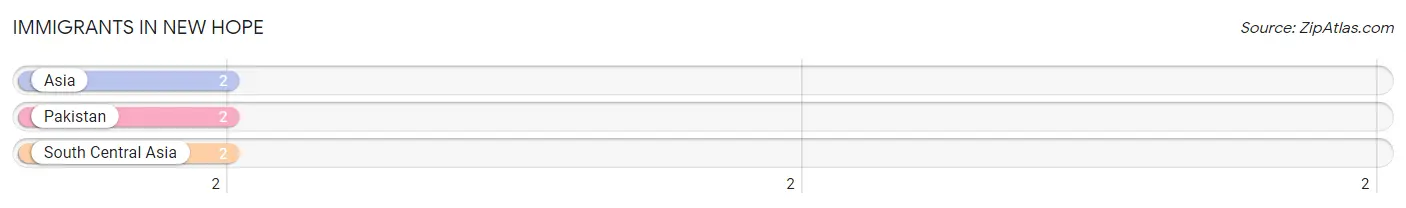
The most numerous immigrant groups reported in New Hope came from Asia (2 | 0.1%), Pakistan (2 | 0.1%), and South Central Asia (2 | 0.1%), together accounting for 0.2% of all New Hope residents.
| Immigration Origin | # Population | % Population |
| Asia | 2 | 0.1% |
| Pakistan | 2 | 0.1% |
| South Central Asia | 2 | 0.1% | View All 3 Rows |
Sex and Age in New Hope
Sex and Age in New Hope
The most populous age groups in New Hope are 35 to 39 Years (251 | 17.5%) for men and 10 to 14 Years (337 | 23.3%) for women.
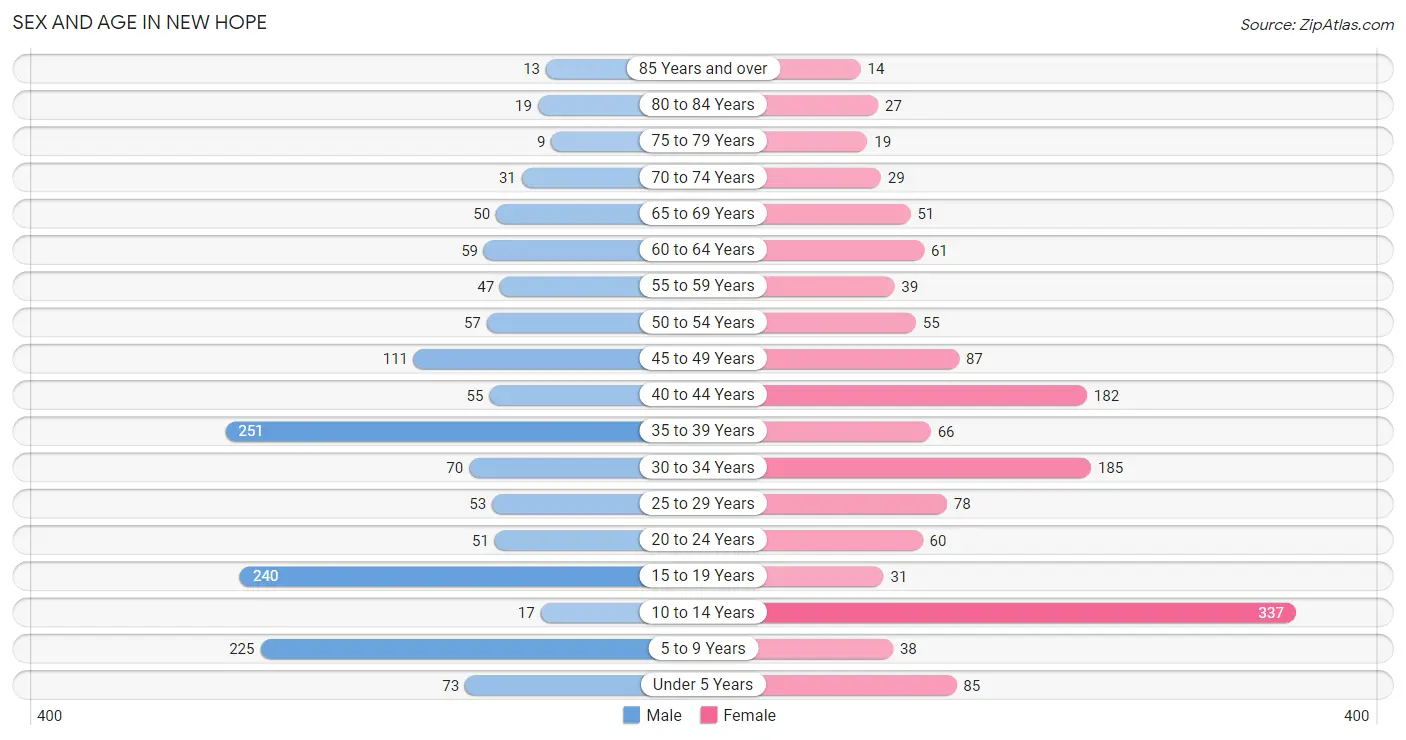
| Age Bracket | Male | Female |
| Under 5 Years | 73 (5.1%) | 85 (5.9%) |
| 5 to 9 Years | 225 (15.7%) | 38 (2.6%) |
| 10 to 14 Years | 17 (1.2%) | 337 (23.3%) |
| 15 to 19 Years | 240 (16.8%) | 31 (2.1%) |
| 20 to 24 Years | 51 (3.6%) | 60 (4.2%) |
| 25 to 29 Years | 53 (3.7%) | 78 (5.4%) |
| 30 to 34 Years | 70 (4.9%) | 185 (12.8%) |
| 35 to 39 Years | 251 (17.5%) | 66 (4.6%) |
| 40 to 44 Years | 55 (3.8%) | 182 (12.6%) |
| 45 to 49 Years | 111 (7.8%) | 87 (6.0%) |
| 50 to 54 Years | 57 (4.0%) | 55 (3.8%) |
| 55 to 59 Years | 47 (3.3%) | 39 (2.7%) |
| 60 to 64 Years | 59 (4.1%) | 61 (4.2%) |
| 65 to 69 Years | 50 (3.5%) | 51 (3.5%) |
| 70 to 74 Years | 31 (2.2%) | 29 (2.0%) |
| 75 to 79 Years | 9 (0.6%) | 19 (1.3%) |
| 80 to 84 Years | 19 (1.3%) | 27 (1.9%) |
| 85 Years and over | 13 (0.9%) | 14 (1.0%) |
| Total | 1,431 (100.0%) | 1,444 (100.0%) |
Families and Households in New Hope
Median Family Size in New Hope
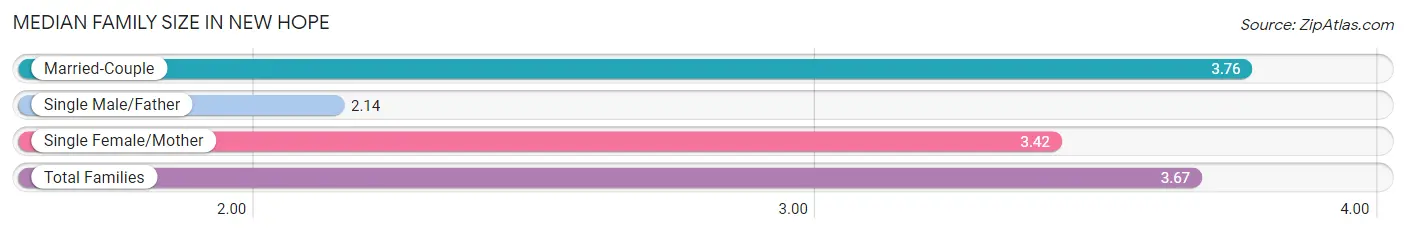
The median family size in New Hope is 3.67 persons per family, with married-couple families (598 | 85.8%) accounting for the largest median family size of 3.76 persons per family. On the other hand, single male/father families (22 | 3.2%) represent the smallest median family size with 2.14 persons per family.
| Family Type | # Families | Family Size |
| Married-Couple | 598 (85.8%) | 3.76 |
| Single Male/Father | 22 (3.2%) | 2.14 |
| Single Female/Mother | 77 (11.1%) | 3.42 |
| Total Families | 697 (100.0%) | 3.67 |
Median Household Size in New Hope
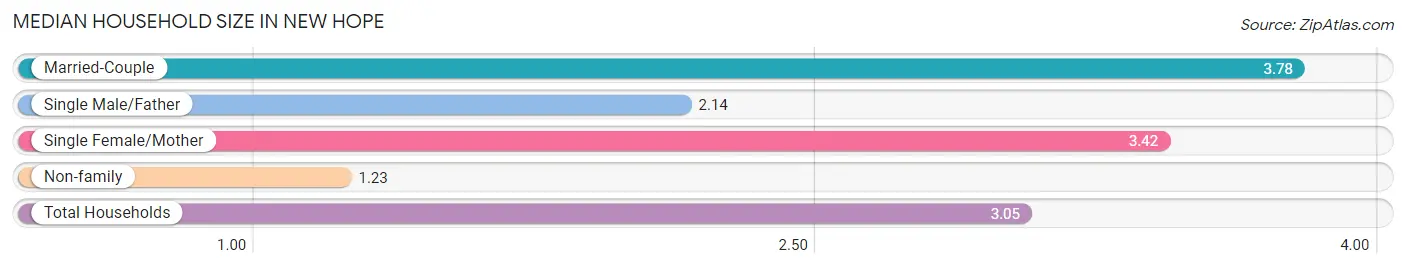
The median household size in New Hope is 3.05 persons per household, with married-couple households (598 | 63.4%) accounting for the largest median household size of 3.78 persons per household. non-family households (246 | 26.1%) represent the smallest median household size with 1.23 persons per household.
| Household Type | # Households | Household Size |
| Married-Couple | 598 (63.4%) | 3.78 |
| Single Male/Father | 22 (2.3%) | 2.14 |
| Single Female/Mother | 77 (8.2%) | 3.42 |
| Non-family | 246 (26.1%) | 1.23 |
| Total Households | 943 (100.0%) | 3.05 |
Household Size by Marriage Status in New Hope
Out of a total of 943 households in New Hope, 697 (73.9%) are family households, while 246 (26.1%) are nonfamily households. The most numerous type of family households are 4-person households, comprising 255, and the most common type of nonfamily households are 1-person households, comprising 208.
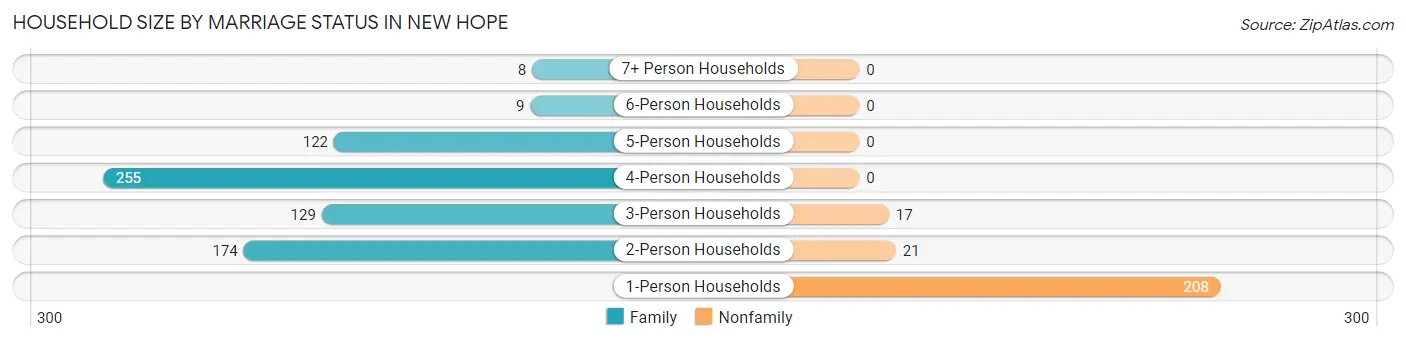
| Household Size | Family Households | Nonfamily Households |
| 1-Person Households | - | 208 (22.1%) |
| 2-Person Households | 174 (18.4%) | 21 (2.2%) |
| 3-Person Households | 129 (13.7%) | 17 (1.8%) |
| 4-Person Households | 255 (27.0%) | 0 (0.0%) |
| 5-Person Households | 122 (12.9%) | 0 (0.0%) |
| 6-Person Households | 9 (0.9%) | 0 (0.0%) |
| 7+ Person Households | 8 (0.9%) | 0 (0.0%) |
| Total | 697 (73.9%) | 246 (26.1%) |
Female Fertility in New Hope
Fertility by Age in New Hope
Average fertility rate in New Hope is 26.0 births per 1,000 women. Women in the age bracket of 20 to 34 years have the highest fertility rate with 56.0 births per 1,000 women. Women in the age bracket of 20 to 34 years acount for 100.0% of all women with births.
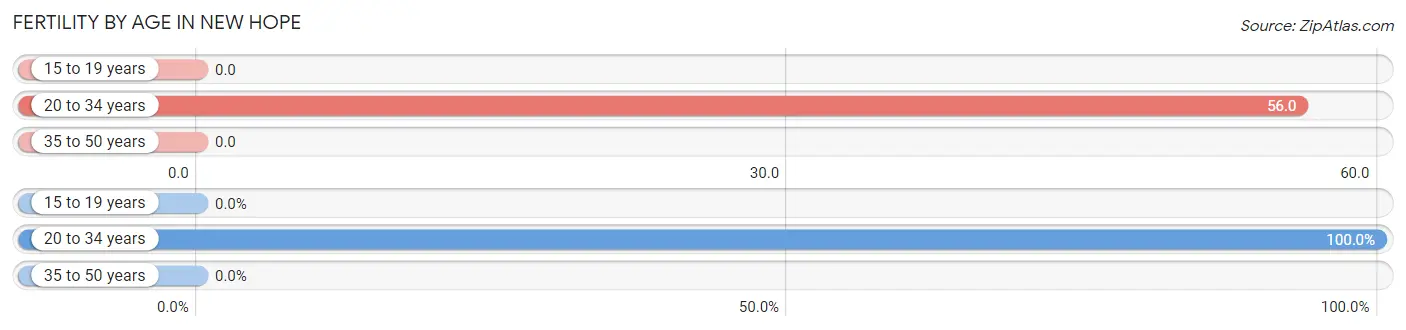
| Age Bracket | Women with Births | Births / 1,000 Women |
| 15 to 19 years | 0 (0.0%) | 0.0 |
| 20 to 34 years | 18 (100.0%) | 56.0 |
| 35 to 50 years | 0 (0.0%) | 0.0 |
| Total | 18 (100.0%) | 26.0 |
Fertility by Age by Marriage Status in New Hope
44.4% of women with births (18) in New Hope are married. The highest percentage of unmarried women with births falls into 20 to 34 years age bracket with 55.6% of them unmarried at the time of birth, while the lowest percentage of unmarried women with births belong to 20 to 34 years age bracket with 55.6% of them unmarried.
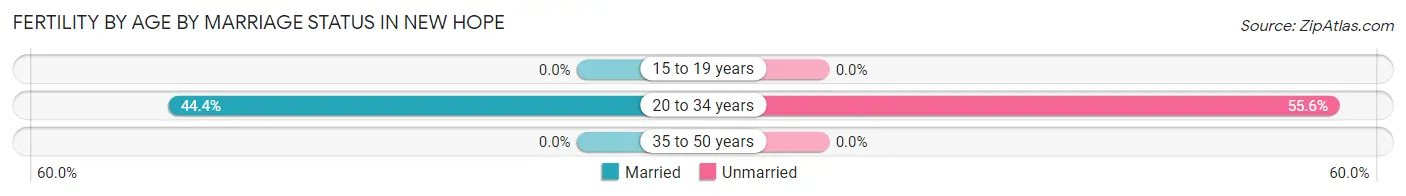
| Age Bracket | Married | Unmarried |
| 15 to 19 years | 0 (0.0%) | 0 (0.0%) |
| 20 to 34 years | 8 (44.4%) | 10 (55.6%) |
| 35 to 50 years | 0 (0.0%) | 0 (0.0%) |
| Total | 8 (44.4%) | 10 (55.6%) |
Fertility by Education in New Hope
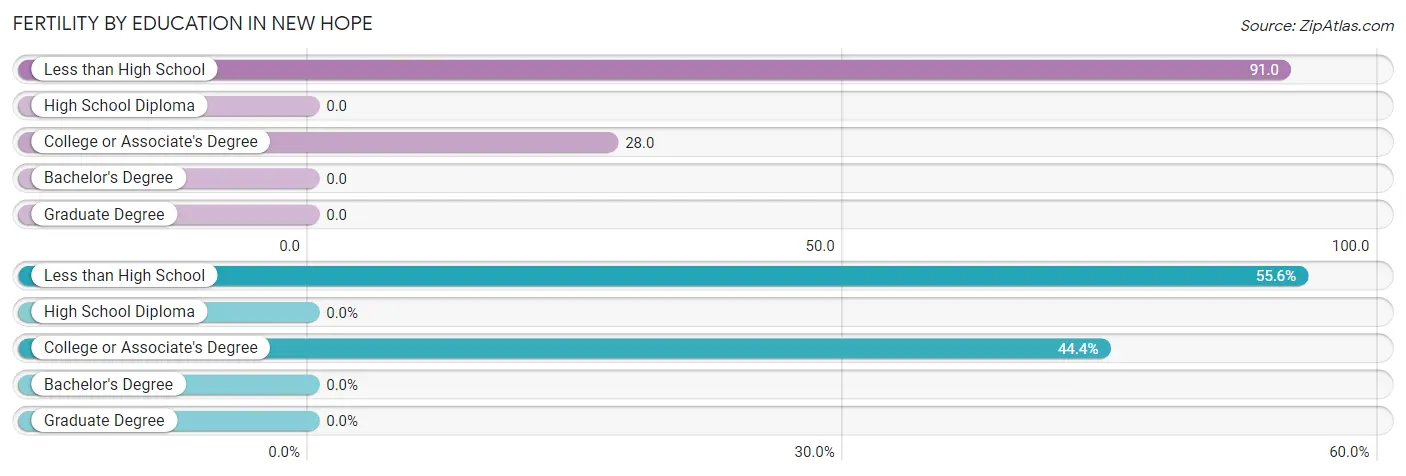
| Educational Attainment | Women with Births | Births / 1,000 Women |
| Less than High School | 10 (55.6%) | 91.0 |
| High School Diploma | 0 (0.0%) | 0.0 |
| College or Associate's Degree | 8 (44.4%) | 28.0 |
| Bachelor's Degree | 0 (0.0%) | 0.0 |
| Graduate Degree | 0 (0.0%) | 0.0 |
| Total | 18 (100.0%) | 26.0 |
Fertility by Education by Marriage Status in New Hope
55.6% of women with births in New Hope are unmarried. Women with the educational attainment of college or associate's degree are most likely to be married with 100.0% of them married at childbirth, while women with the educational attainment of less than high school are least likely to be married with 100.0% of them unmarried at childbirth.
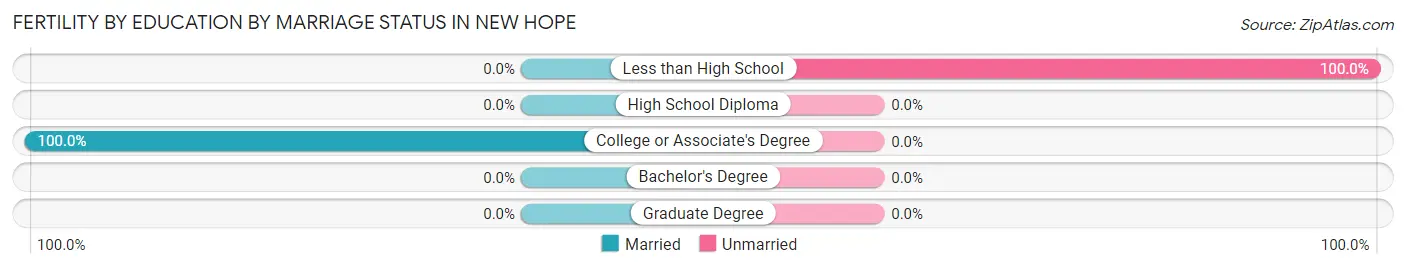
| Educational Attainment | Married | Unmarried |
| Less than High School | 0 (0.0%) | 10 (100.0%) |
| High School Diploma | 0 (0.0%) | 0 (0.0%) |
| College or Associate's Degree | 8 (100.0%) | 0 (0.0%) |
| Bachelor's Degree | 0 (0.0%) | 0 (0.0%) |
| Graduate Degree | 0 (0.0%) | 0 (0.0%) |
| Total | 8 (44.4%) | 10 (55.6%) |
Employment Characteristics in New Hope
Employment by Class of Employer in New Hope
Among the 1,295 employed individuals in New Hope, private company employees (1,054 | 81.4%), local government employees (170 | 13.1%), and self-employed (not incorporated) (28 | 2.2%) make up the most common classes of employment.
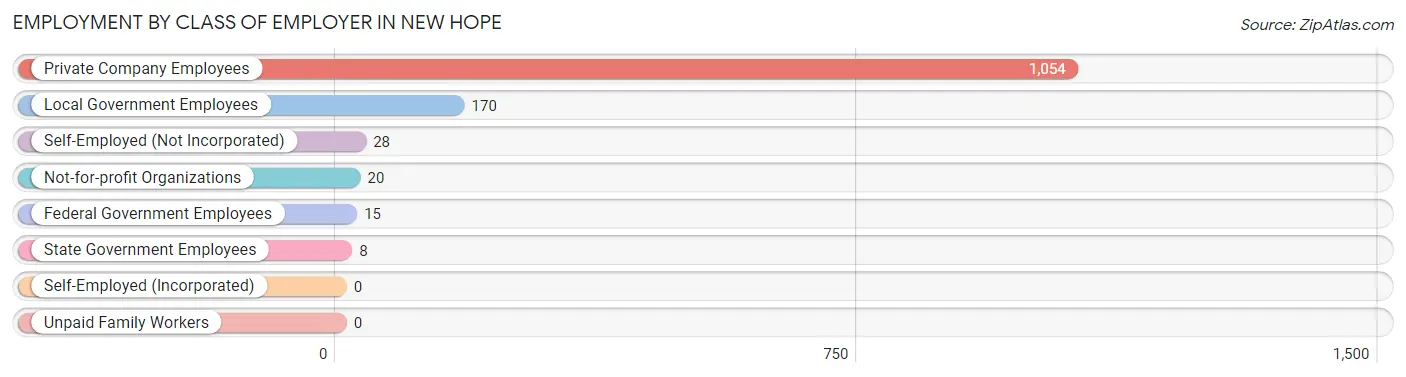
| Employer Class | # Employees | % Employees |
| Private Company Employees | 1,054 | 81.4% |
| Self-Employed (Incorporated) | 0 | 0.0% |
| Self-Employed (Not Incorporated) | 28 | 2.2% |
| Not-for-profit Organizations | 20 | 1.5% |
| Local Government Employees | 170 | 13.1% |
| State Government Employees | 8 | 0.6% |
| Federal Government Employees | 15 | 1.2% |
| Unpaid Family Workers | 0 | 0.0% |
| Total | 1,295 | 100.0% |
Employment Status by Age in New Hope
According to the labor force statistics for New Hope, out of the total population over 16 years of age (1,945), 72.4% or 1,408 individuals are in the labor force, with 7.9% or 111 of them unemployed. The age group with the highest labor force participation rate is 25 to 29 years, with 96.9% or 127 individuals in the labor force. Within the labor force, the 16 to 19 years age range has the highest percentage of unemployed individuals, with 57.5% or 50 of them being unemployed.
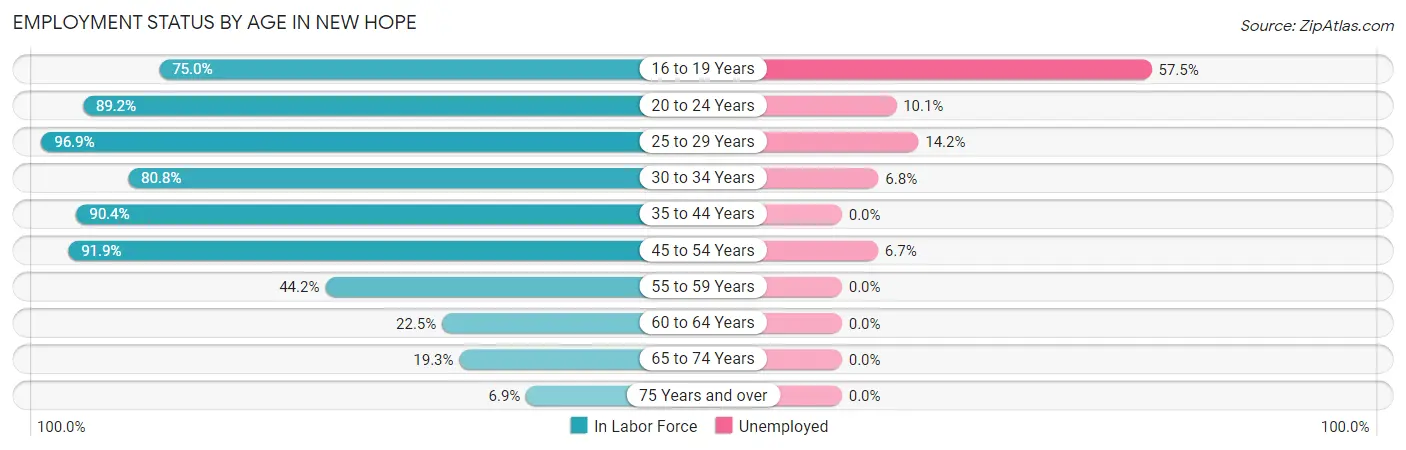
| Age Bracket | In Labor Force | Unemployed |
| 16 to 19 Years | 87 (75.0%) | 50 (57.5%) |
| 20 to 24 Years | 99 (89.2%) | 10 (10.1%) |
| 25 to 29 Years | 127 (96.9%) | 18 (14.2%) |
| 30 to 34 Years | 206 (80.8%) | 14 (6.8%) |
| 35 to 44 Years | 501 (90.4%) | 0 (0.0%) |
| 45 to 54 Years | 285 (91.9%) | 19 (6.7%) |
| 55 to 59 Years | 38 (44.2%) | 0 (0.0%) |
| 60 to 64 Years | 27 (22.5%) | 0 (0.0%) |
| 65 to 74 Years | 31 (19.3%) | 0 (0.0%) |
| 75 Years and over | 7 (6.9%) | 0 (0.0%) |
| Total | 1,408 (72.4%) | 111 (7.9%) |
Employment Status by Educational Attainment in New Hope
According to labor force statistics for New Hope, 81.3% of individuals (1,184) out of the total population between 25 and 64 years of age (1,456) are in the labor force, with 4.3% or 51 of them being unemployed. The group with the highest labor force participation rate are those with the educational attainment of college / associate degree, with 95.2% or 458 individuals in the labor force. Within the labor force, individuals with high school diploma education have the highest percentage of unemployment, with 15.0% or 45 of them being unemployed.
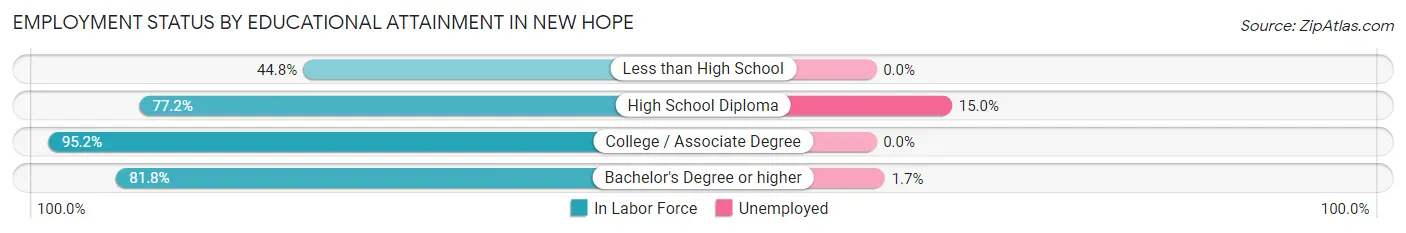
| Educational Attainment | In Labor Force | Unemployed |
| Less than High School | 65 (44.8%) | 0 (0.0%) |
| High School Diploma | 301 (77.2%) | 58 (15.0%) |
| College / Associate Degree | 458 (95.2%) | 0 (0.0%) |
| Bachelor's Degree or higher | 360 (81.8%) | 7 (1.7%) |
| Total | 1,184 (81.3%) | 63 (4.3%) |
Employment Occupations by Sex in New Hope
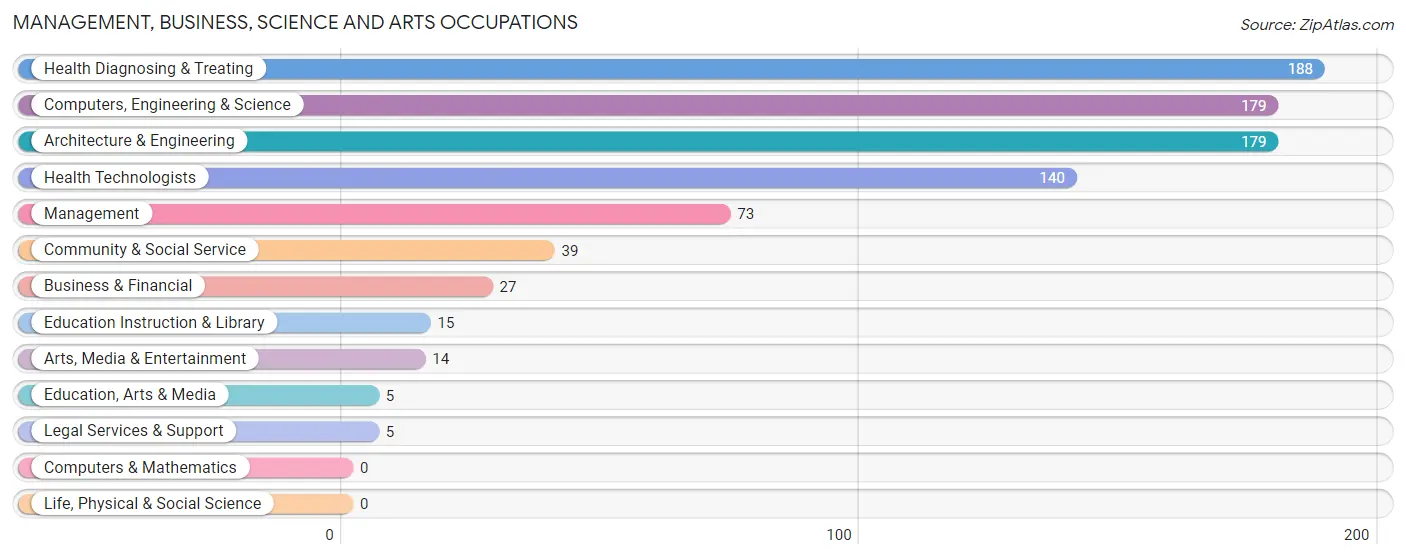
Management, Business, Science and Arts Occupations
The most common Management, Business, Science and Arts occupations in New Hope are Health Diagnosing & Treating (188 | 14.5%), Computers, Engineering & Science (179 | 13.8%), Architecture & Engineering (179 | 13.8%), Health Technologists (140 | 10.8%), and Management (73 | 5.6%).
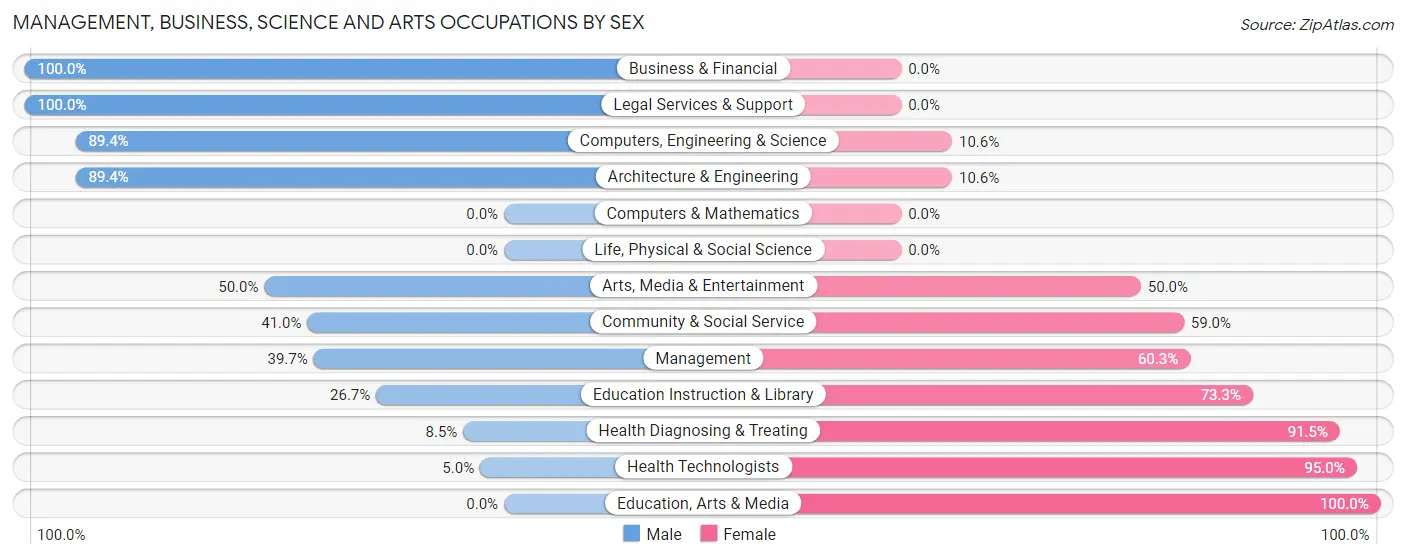
Management, Business, Science and Arts Occupations by Sex
Within the Management, Business, Science and Arts occupations in New Hope, the most male-oriented occupations are Business & Financial (100.0%), Legal Services & Support (100.0%), and Computers, Engineering & Science (89.4%), while the most female-oriented occupations are Education, Arts & Media (100.0%), Health Technologists (95.0%), and Health Diagnosing & Treating (91.5%).
| Occupation | Male | Female |
| Management | 29 (39.7%) | 44 (60.3%) |
| Business & Financial | 27 (100.0%) | 0 (0.0%) |
| Computers, Engineering & Science | 160 (89.4%) | 19 (10.6%) |
| Computers & Mathematics | 0 (0.0%) | 0 (0.0%) |
| Architecture & Engineering | 160 (89.4%) | 19 (10.6%) |
| Life, Physical & Social Science | 0 (0.0%) | 0 (0.0%) |
| Community & Social Service | 16 (41.0%) | 23 (59.0%) |
| Education, Arts & Media | 0 (0.0%) | 5 (100.0%) |
| Legal Services & Support | 5 (100.0%) | 0 (0.0%) |
| Education Instruction & Library | 4 (26.7%) | 11 (73.3%) |
| Arts, Media & Entertainment | 7 (50.0%) | 7 (50.0%) |
| Health Diagnosing & Treating | 16 (8.5%) | 172 (91.5%) |
| Health Technologists | 7 (5.0%) | 133 (95.0%) |
| Total (Category) | 248 (49.0%) | 258 (51.0%) |
| Total (Overall) | 645 (49.7%) | 652 (50.3%) |
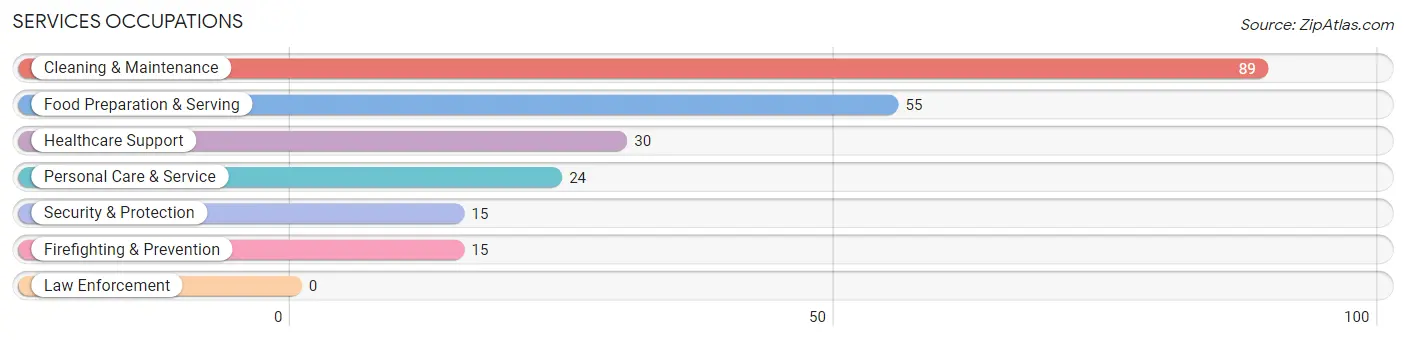
Services Occupations
The most common Services occupations in New Hope are Cleaning & Maintenance (89 | 6.9%), Food Preparation & Serving (55 | 4.2%), Healthcare Support (30 | 2.3%), Personal Care & Service (24 | 1.8%), and Security & Protection (15 | 1.2%).
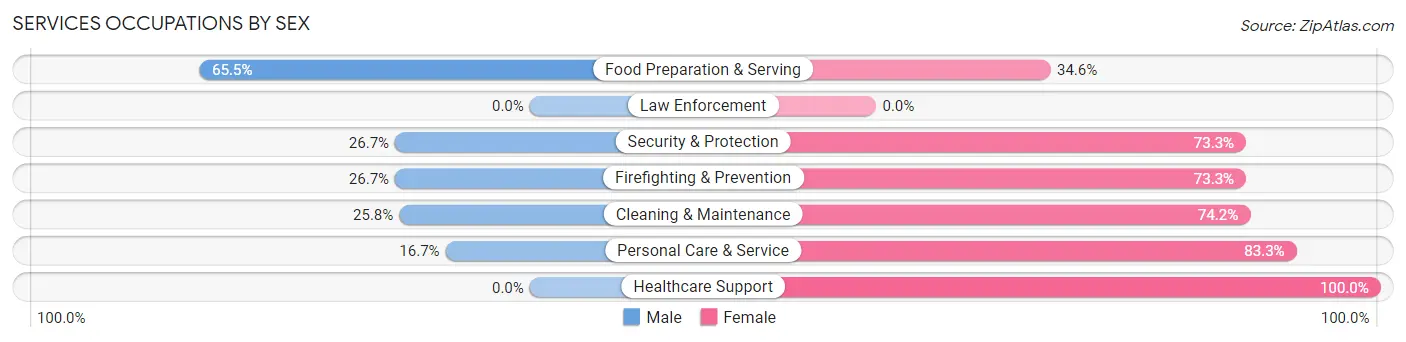
Services Occupations by Sex
Within the Services occupations in New Hope, the most male-oriented occupations are Food Preparation & Serving (65.4%), Security & Protection (26.7%), and Firefighting & Prevention (26.7%), while the most female-oriented occupations are Healthcare Support (100.0%), Personal Care & Service (83.3%), and Cleaning & Maintenance (74.2%).
| Occupation | Male | Female |
| Healthcare Support | 0 (0.0%) | 30 (100.0%) |
| Security & Protection | 4 (26.7%) | 11 (73.3%) |
| Firefighting & Prevention | 4 (26.7%) | 11 (73.3%) |
| Law Enforcement | 0 (0.0%) | 0 (0.0%) |
| Food Preparation & Serving | 36 (65.4%) | 19 (34.5%) |
| Cleaning & Maintenance | 23 (25.8%) | 66 (74.2%) |
| Personal Care & Service | 4 (16.7%) | 20 (83.3%) |
| Total (Category) | 67 (31.5%) | 146 (68.5%) |
| Total (Overall) | 645 (49.7%) | 652 (50.3%) |
Sales and Office Occupations
The most common Sales and Office occupations in New Hope are Sales & Related (156 | 12.0%), and Office & Administration (125 | 9.6%).

Sales and Office Occupations by Sex
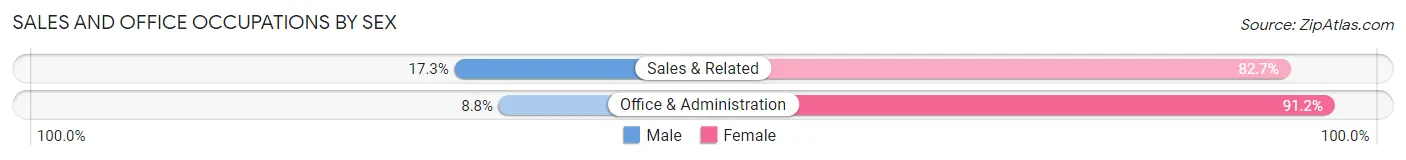
| Occupation | Male | Female |
| Sales & Related | 27 (17.3%) | 129 (82.7%) |
| Office & Administration | 11 (8.8%) | 114 (91.2%) |
| Total (Category) | 38 (13.5%) | 243 (86.5%) |
| Total (Overall) | 645 (49.7%) | 652 (50.3%) |
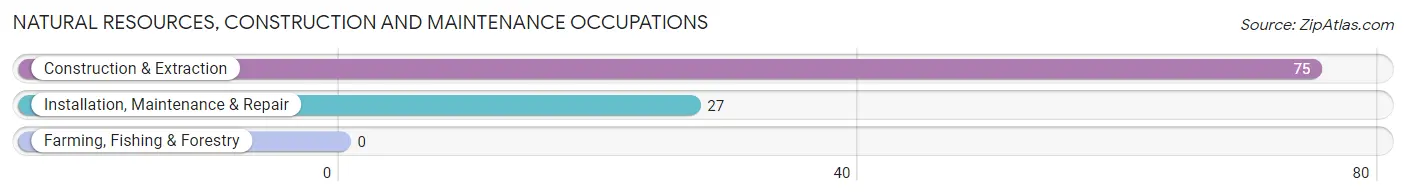
Natural Resources, Construction and Maintenance Occupations
The most common Natural Resources, Construction and Maintenance occupations in New Hope are Construction & Extraction (75 | 5.8%), and Installation, Maintenance & Repair (27 | 2.1%).
Natural Resources, Construction and Maintenance Occupations by Sex
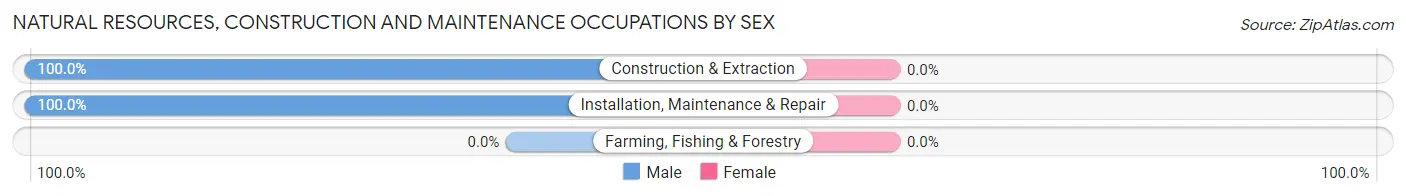
| Occupation | Male | Female |
| Farming, Fishing & Forestry | 0 (0.0%) | 0 (0.0%) |
| Construction & Extraction | 75 (100.0%) | 0 (0.0%) |
| Installation, Maintenance & Repair | 27 (100.0%) | 0 (0.0%) |
| Total (Category) | 102 (100.0%) | 0 (0.0%) |
| Total (Overall) | 645 (49.7%) | 652 (50.3%) |
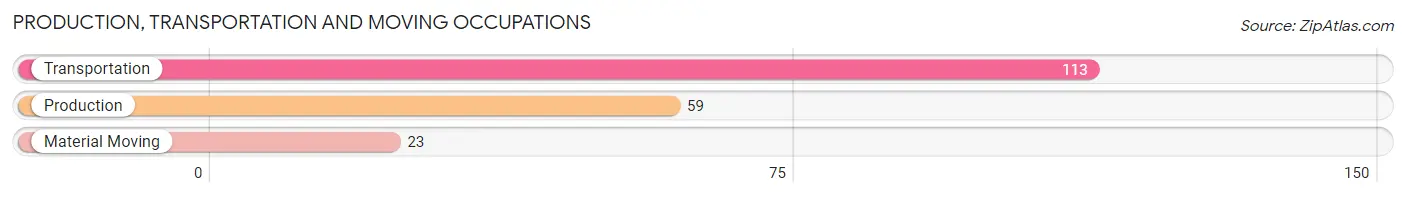
Production, Transportation and Moving Occupations
The most common Production, Transportation and Moving occupations in New Hope are Transportation (113 | 8.7%), Production (59 | 4.5%), and Material Moving (23 | 1.8%).
Production, Transportation and Moving Occupations by Sex
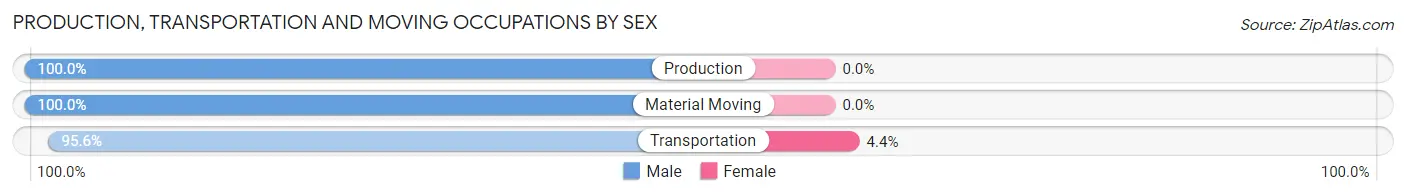
| Occupation | Male | Female |
| Production | 59 (100.0%) | 0 (0.0%) |
| Transportation | 108 (95.6%) | 5 (4.4%) |
| Material Moving | 23 (100.0%) | 0 (0.0%) |
| Total (Category) | 190 (97.4%) | 5 (2.6%) |
| Total (Overall) | 645 (49.7%) | 652 (50.3%) |
Employment Industries by Sex in New Hope
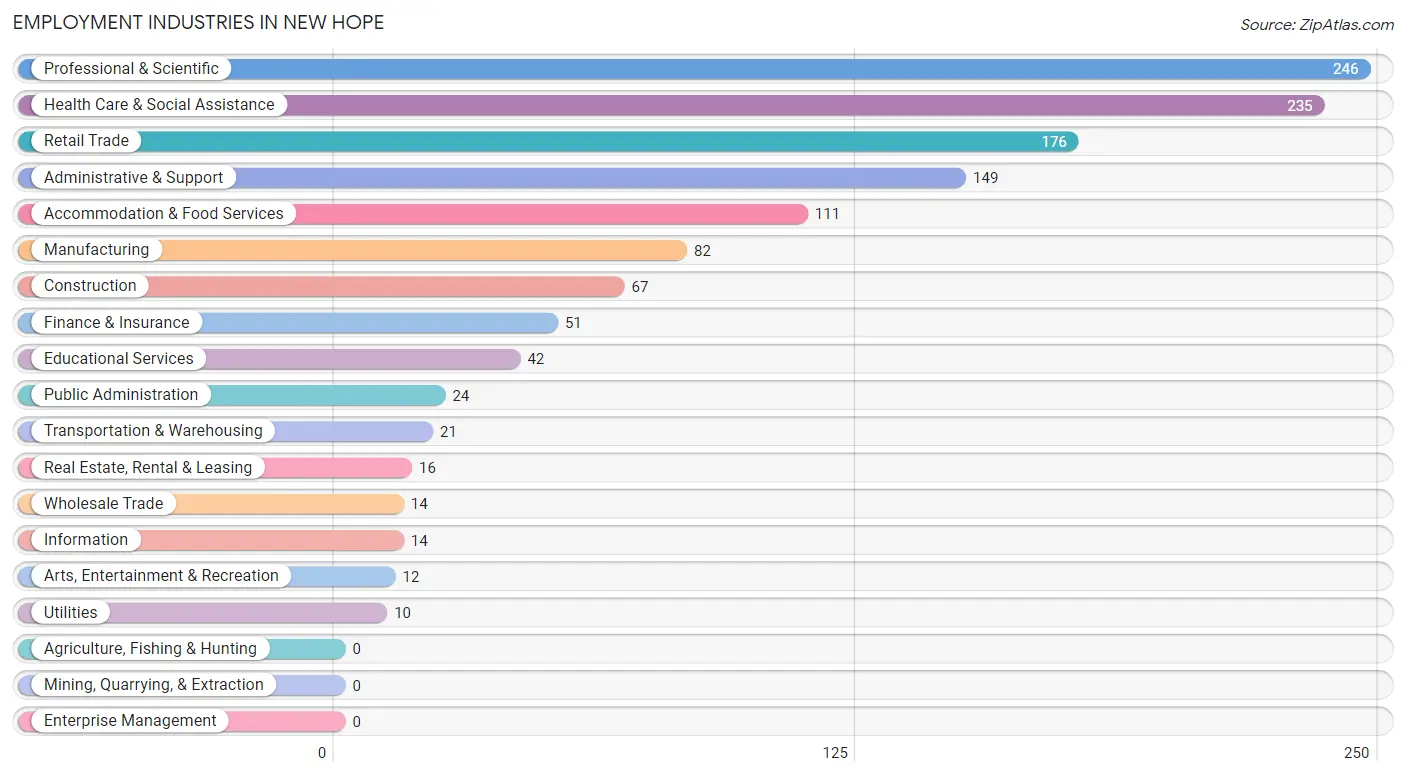
Employment Industries in New Hope
The major employment industries in New Hope include Professional & Scientific (246 | 19.0%), Health Care & Social Assistance (235 | 18.1%), Retail Trade (176 | 13.6%), Administrative & Support (149 | 11.5%), and Accommodation & Food Services (111 | 8.6%).
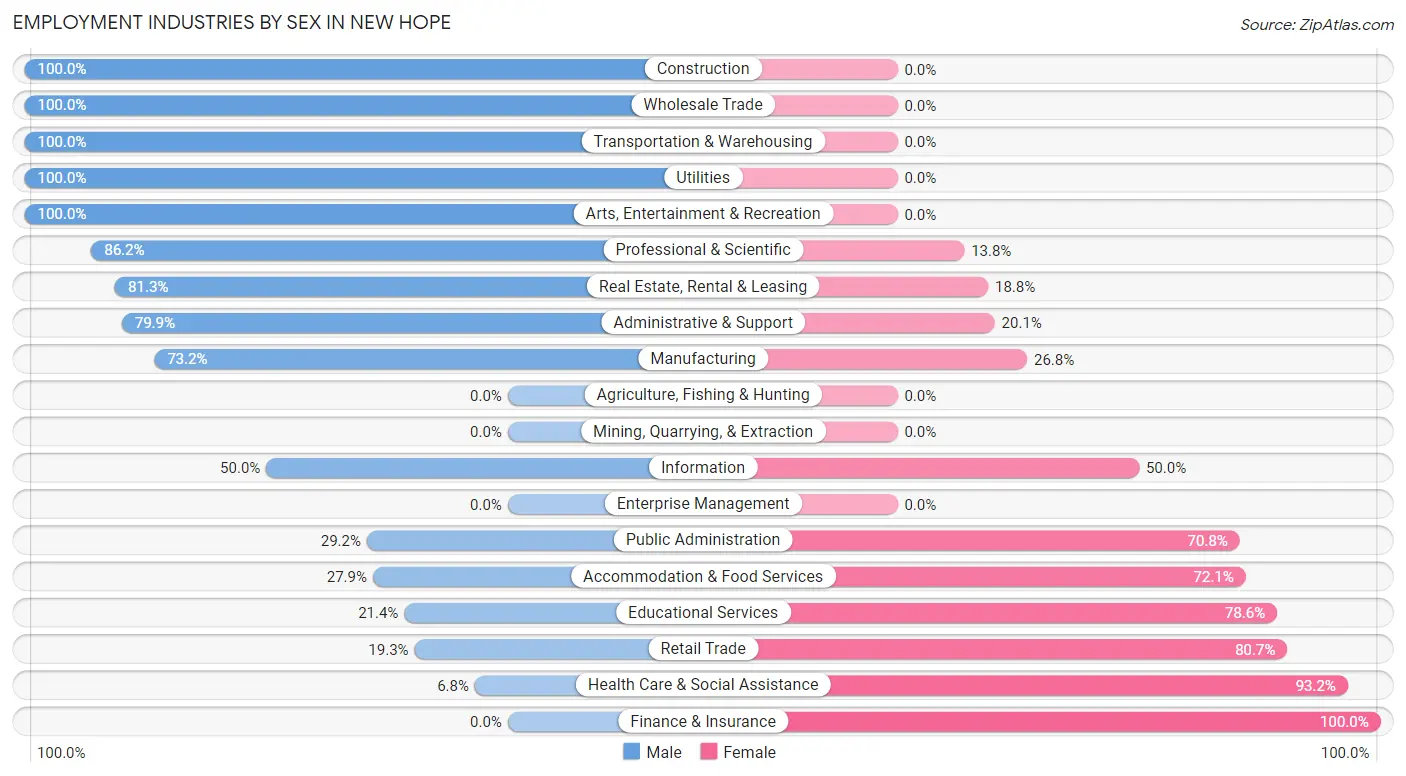
Employment Industries by Sex in New Hope
The New Hope industries that see more men than women are Construction (100.0%), Wholesale Trade (100.0%), and Transportation & Warehousing (100.0%), whereas the industries that tend to have a higher number of women are Finance & Insurance (100.0%), Health Care & Social Assistance (93.2%), and Retail Trade (80.7%).
| Industry | Male | Female |
| Agriculture, Fishing & Hunting | 0 (0.0%) | 0 (0.0%) |
| Mining, Quarrying, & Extraction | 0 (0.0%) | 0 (0.0%) |
| Construction | 67 (100.0%) | 0 (0.0%) |
| Manufacturing | 60 (73.2%) | 22 (26.8%) |
| Wholesale Trade | 14 (100.0%) | 0 (0.0%) |
| Retail Trade | 34 (19.3%) | 142 (80.7%) |
| Transportation & Warehousing | 21 (100.0%) | 0 (0.0%) |
| Utilities | 10 (100.0%) | 0 (0.0%) |
| Information | 7 (50.0%) | 7 (50.0%) |
| Finance & Insurance | 0 (0.0%) | 51 (100.0%) |
| Real Estate, Rental & Leasing | 13 (81.2%) | 3 (18.8%) |
| Professional & Scientific | 212 (86.2%) | 34 (13.8%) |
| Enterprise Management | 0 (0.0%) | 0 (0.0%) |
| Administrative & Support | 119 (79.9%) | 30 (20.1%) |
| Educational Services | 9 (21.4%) | 33 (78.6%) |
| Health Care & Social Assistance | 16 (6.8%) | 219 (93.2%) |
| Arts, Entertainment & Recreation | 12 (100.0%) | 0 (0.0%) |
| Accommodation & Food Services | 31 (27.9%) | 80 (72.1%) |
| Public Administration | 7 (29.2%) | 17 (70.8%) |
| Total | 645 (49.7%) | 652 (50.3%) |
Education in New Hope
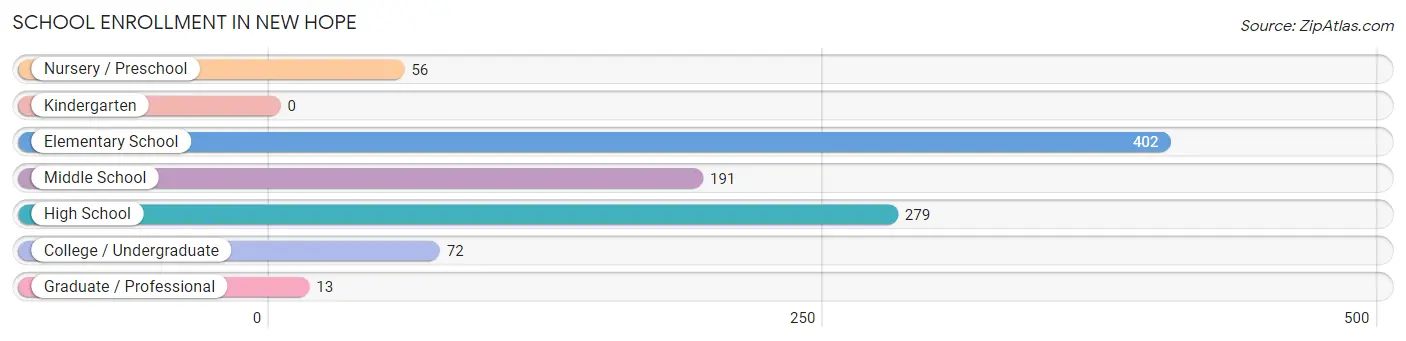
School Enrollment in New Hope
The most common levels of schooling among the 1,013 students in New Hope are elementary school (402 | 39.7%), high school (279 | 27.5%), and middle school (191 | 18.9%).
| School Level | # Students | % Students |
| Nursery / Preschool | 56 | 5.5% |
| Kindergarten | 0 | 0.0% |
| Elementary School | 402 | 39.7% |
| Middle School | 191 | 18.9% |
| High School | 279 | 27.5% |
| College / Undergraduate | 72 | 7.1% |
| Graduate / Professional | 13 | 1.3% |
| Total | 1,013 | 100.0% |
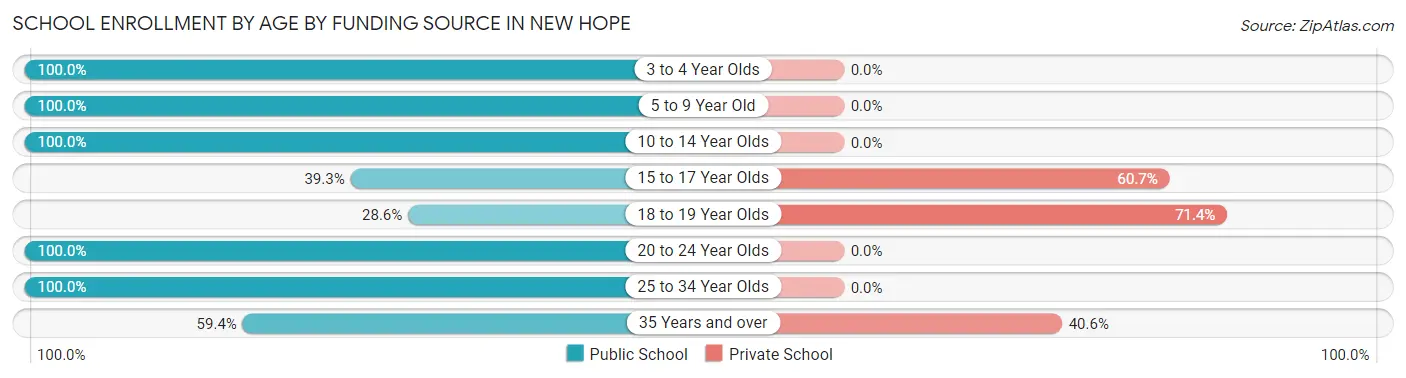
School Enrollment by Age by Funding Source in New Hope
Out of a total of 1,013 students who are enrolled in schools in New Hope, 185 (18.3%) attend a private institution, while the remaining 828 (81.7%) are enrolled in public schools. The age group of 18 to 19 year olds has the highest likelihood of being enrolled in private schools, with 50 (71.4% in the age bracket) enrolled. Conversely, the age group of 3 to 4 year olds has the lowest likelihood of being enrolled in a private school, with 40 (100.0% in the age bracket) attending a public institution.
| Age Bracket | Public School | Private School |
| 3 to 4 Year Olds | 40 (100.0%) | 0 (0.0%) |
| 5 to 9 Year Old | 263 (100.0%) | 0 (0.0%) |
| 10 to 14 Year Olds | 354 (100.0%) | 0 (0.0%) |
| 15 to 17 Year Olds | 79 (39.3%) | 122 (60.7%) |
| 18 to 19 Year Olds | 20 (28.6%) | 50 (71.4%) |
| 20 to 24 Year Olds | 26 (100.0%) | 0 (0.0%) |
| 25 to 34 Year Olds | 27 (100.0%) | 0 (0.0%) |
| 35 Years and over | 19 (59.4%) | 13 (40.6%) |
| Total | 828 (81.7%) | 185 (18.3%) |
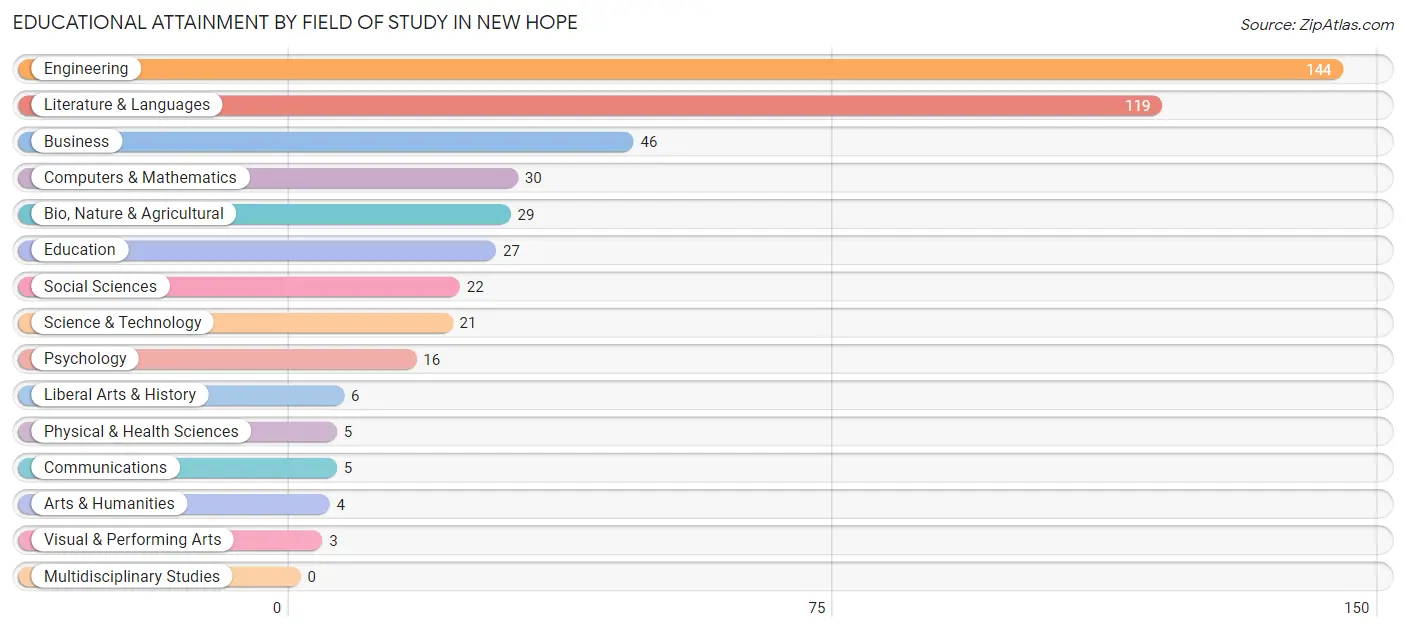
Educational Attainment by Field of Study in New Hope
Engineering (144 | 30.2%), literature & languages (119 | 24.9%), business (46 | 9.6%), computers & mathematics (30 | 6.3%), and bio, nature & agricultural (29 | 6.1%) are the most common fields of study among 477 individuals in New Hope who have obtained a bachelor's degree or higher.
| Field of Study | # Graduates | % Graduates |
| Computers & Mathematics | 30 | 6.3% |
| Bio, Nature & Agricultural | 29 | 6.1% |
| Physical & Health Sciences | 5 | 1.1% |
| Psychology | 16 | 3.4% |
| Social Sciences | 22 | 4.6% |
| Engineering | 144 | 30.2% |
| Multidisciplinary Studies | 0 | 0.0% |
| Science & Technology | 21 | 4.4% |
| Business | 46 | 9.6% |
| Education | 27 | 5.7% |
| Literature & Languages | 119 | 24.9% |
| Liberal Arts & History | 6 | 1.3% |
| Visual & Performing Arts | 3 | 0.6% |
| Communications | 5 | 1.1% |
| Arts & Humanities | 4 | 0.8% |
| Total | 477 | 100.0% |
Transportation & Commute in New Hope
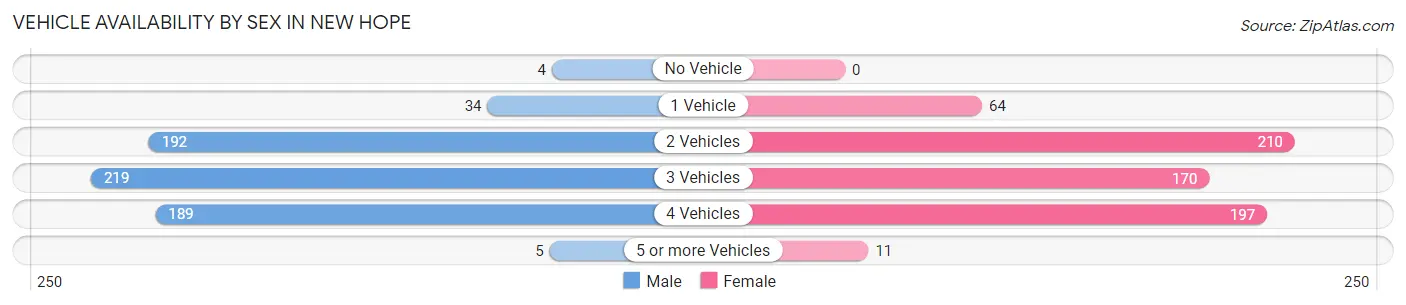
Vehicle Availability by Sex in New Hope
The most prevalent vehicle ownership categories in New Hope are males with 3 vehicles (219, accounting for 34.1%) and females with 3 vehicles (170, making up 33.6%).
| Vehicles Available | Male | Female |
| No Vehicle | 4 (0.6%) | 0 (0.0%) |
| 1 Vehicle | 34 (5.3%) | 64 (9.8%) |
| 2 Vehicles | 192 (29.9%) | 210 (32.2%) |
| 3 Vehicles | 219 (34.1%) | 170 (26.1%) |
| 4 Vehicles | 189 (29.4%) | 197 (30.2%) |
| 5 or more Vehicles | 5 (0.8%) | 11 (1.7%) |
| Total | 643 (100.0%) | 652 (100.0%) |
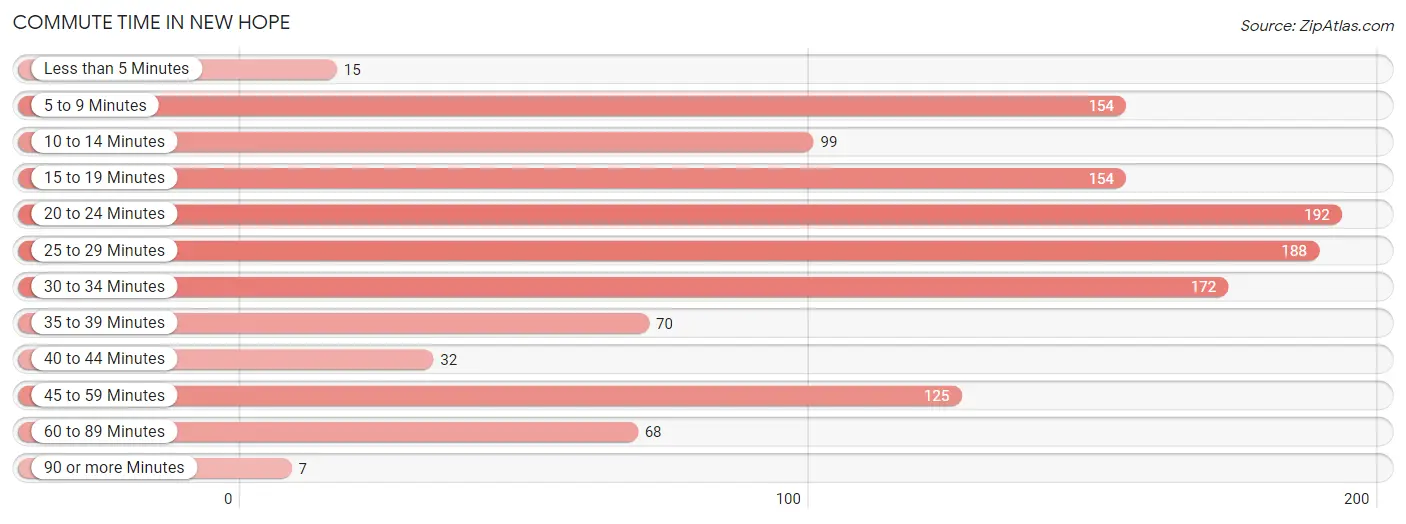
Commute Time in New Hope
The most frequently occuring commute durations in New Hope are 20 to 24 minutes (192 commuters, 15.0%), 25 to 29 minutes (188 commuters, 14.7%), and 30 to 34 minutes (172 commuters, 13.5%).
| Commute Time | # Commuters | % Commuters |
| Less than 5 Minutes | 15 | 1.2% |
| 5 to 9 Minutes | 154 | 12.1% |
| 10 to 14 Minutes | 99 | 7.8% |
| 15 to 19 Minutes | 154 | 12.1% |
| 20 to 24 Minutes | 192 | 15.0% |
| 25 to 29 Minutes | 188 | 14.7% |
| 30 to 34 Minutes | 172 | 13.5% |
| 35 to 39 Minutes | 70 | 5.5% |
| 40 to 44 Minutes | 32 | 2.5% |
| 45 to 59 Minutes | 125 | 9.8% |
| 60 to 89 Minutes | 68 | 5.3% |
| 90 or more Minutes | 7 | 0.5% |
Commute Time by Sex in New Hope
The most common commute times in New Hope are 20 to 24 minutes (178 commuters, 28.5%) for males and 5 to 9 minutes (141 commuters, 21.6%) for females.
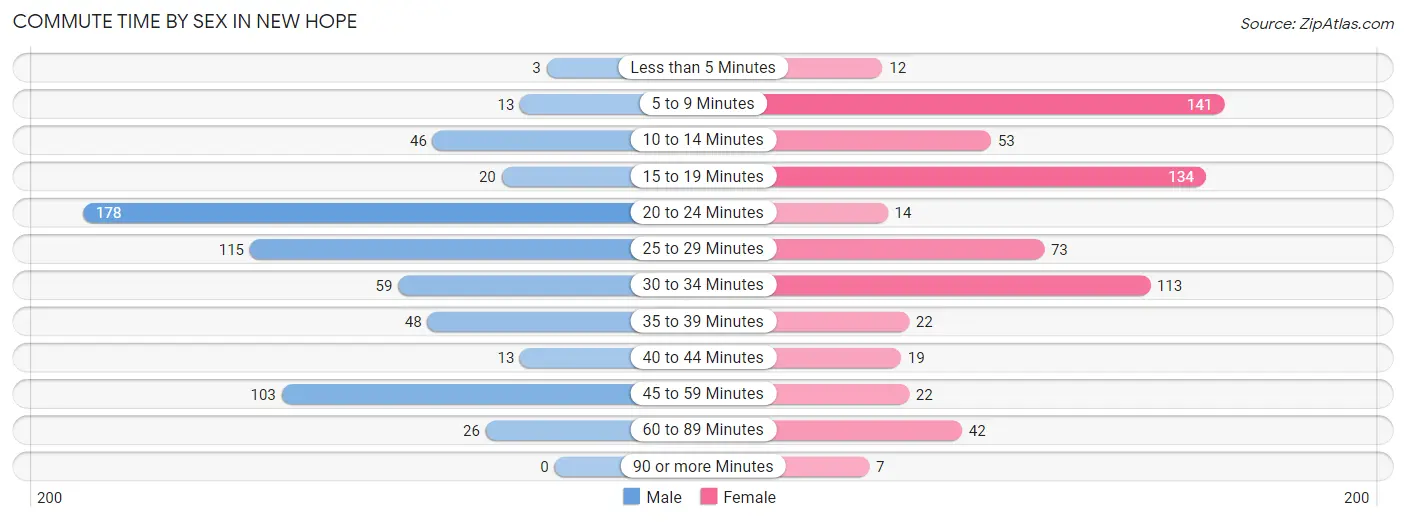
| Commute Time | Male | Female |
| Less than 5 Minutes | 3 (0.5%) | 12 (1.8%) |
| 5 to 9 Minutes | 13 (2.1%) | 141 (21.6%) |
| 10 to 14 Minutes | 46 (7.4%) | 53 (8.1%) |
| 15 to 19 Minutes | 20 (3.2%) | 134 (20.5%) |
| 20 to 24 Minutes | 178 (28.5%) | 14 (2.1%) |
| 25 to 29 Minutes | 115 (18.4%) | 73 (11.2%) |
| 30 to 34 Minutes | 59 (9.5%) | 113 (17.3%) |
| 35 to 39 Minutes | 48 (7.7%) | 22 (3.4%) |
| 40 to 44 Minutes | 13 (2.1%) | 19 (2.9%) |
| 45 to 59 Minutes | 103 (16.5%) | 22 (3.4%) |
| 60 to 89 Minutes | 26 (4.2%) | 42 (6.4%) |
| 90 or more Minutes | 0 (0.0%) | 7 (1.1%) |
Time of Departure to Work by Sex in New Hope
The most frequent times of departure to work in New Hope are 7:00 AM to 7:29 AM (211, 33.8%) for males and 8:00 AM to 8:29 AM (158, 24.2%) for females.
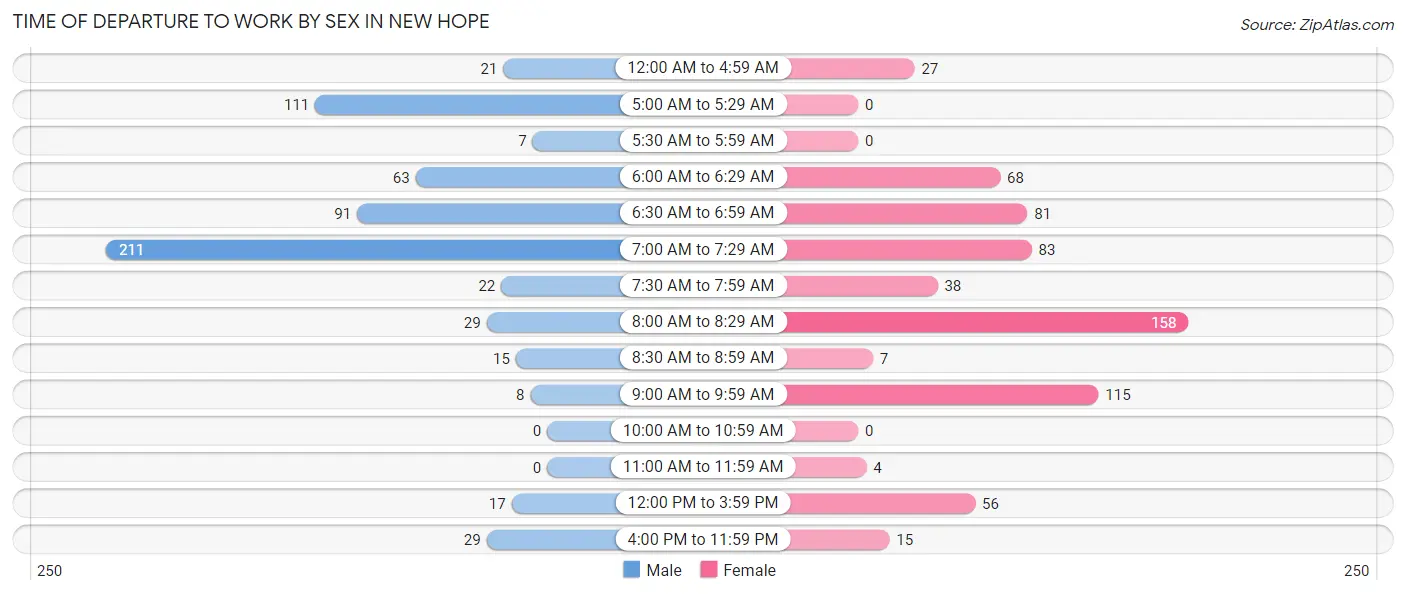
| Time of Departure | Male | Female |
| 12:00 AM to 4:59 AM | 21 (3.4%) | 27 (4.1%) |
| 5:00 AM to 5:29 AM | 111 (17.8%) | 0 (0.0%) |
| 5:30 AM to 5:59 AM | 7 (1.1%) | 0 (0.0%) |
| 6:00 AM to 6:29 AM | 63 (10.1%) | 68 (10.4%) |
| 6:30 AM to 6:59 AM | 91 (14.6%) | 81 (12.4%) |
| 7:00 AM to 7:29 AM | 211 (33.8%) | 83 (12.7%) |
| 7:30 AM to 7:59 AM | 22 (3.5%) | 38 (5.8%) |
| 8:00 AM to 8:29 AM | 29 (4.6%) | 158 (24.2%) |
| 8:30 AM to 8:59 AM | 15 (2.4%) | 7 (1.1%) |
| 9:00 AM to 9:59 AM | 8 (1.3%) | 115 (17.6%) |
| 10:00 AM to 10:59 AM | 0 (0.0%) | 0 (0.0%) |
| 11:00 AM to 11:59 AM | 0 (0.0%) | 4 (0.6%) |
| 12:00 PM to 3:59 PM | 17 (2.7%) | 56 (8.6%) |
| 4:00 PM to 11:59 PM | 29 (4.6%) | 15 (2.3%) |
| Total | 624 (100.0%) | 652 (100.0%) |
Housing Occupancy in New Hope
Occupancy by Ownership in New Hope
Of the total 943 dwellings in New Hope, owner-occupied units account for 726 (77.0%), while renter-occupied units make up 217 (23.0%).
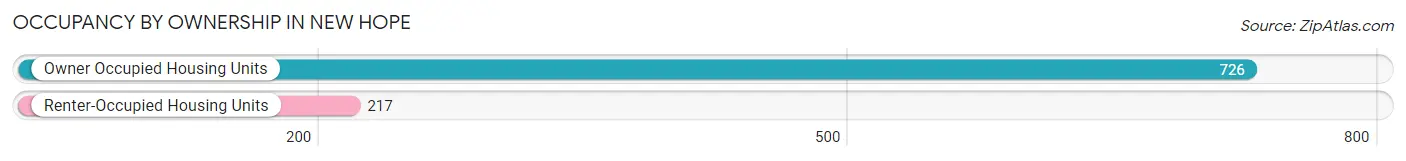
| Occupancy | # Housing Units | % Housing Units |
| Owner Occupied Housing Units | 726 | 77.0% |
| Renter-Occupied Housing Units | 217 | 23.0% |
| Total Occupied Housing Units | 943 | 100.0% |
Occupancy by Household Size in New Hope
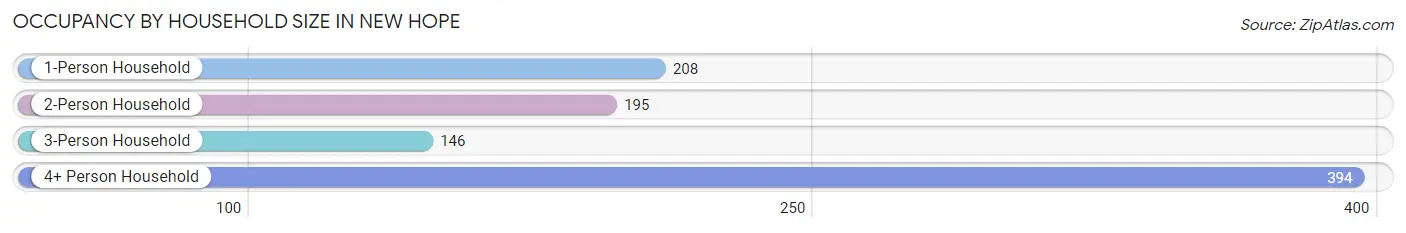
| Household Size | # Housing Units | % Housing Units |
| 1-Person Household | 208 | 22.1% |
| 2-Person Household | 195 | 20.7% |
| 3-Person Household | 146 | 15.5% |
| 4+ Person Household | 394 | 41.8% |
| Total Housing Units | 943 | 100.0% |
Occupancy by Ownership by Household Size in New Hope
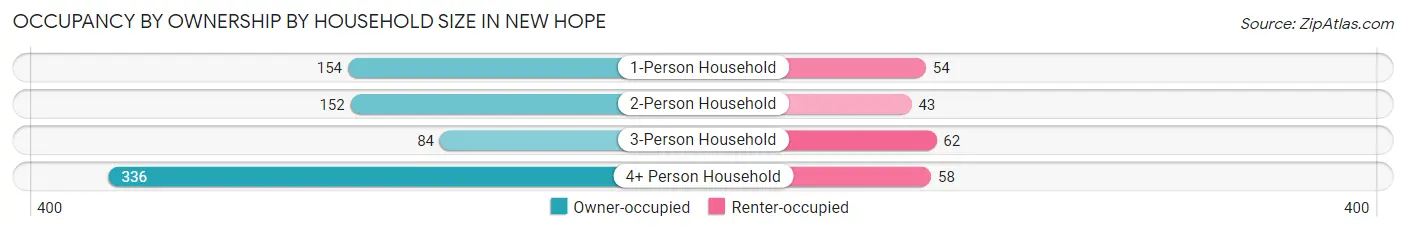
| Household Size | Owner-occupied | Renter-occupied |
| 1-Person Household | 154 (74.0%) | 54 (26.0%) |
| 2-Person Household | 152 (77.9%) | 43 (22.1%) |
| 3-Person Household | 84 (57.5%) | 62 (42.5%) |
| 4+ Person Household | 336 (85.3%) | 58 (14.7%) |
| Total Housing Units | 726 (77.0%) | 217 (23.0%) |
Occupancy by Educational Attainment in New Hope
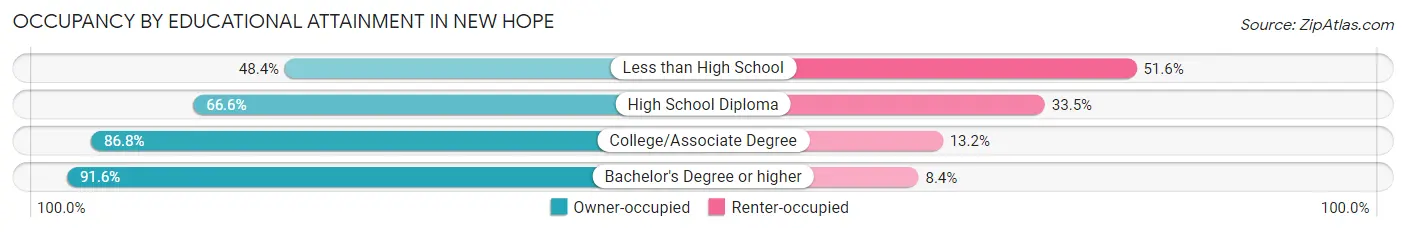
| Household Size | Owner-occupied | Renter-occupied |
| Less than High School | 60 (48.4%) | 64 (51.6%) |
| High School Diploma | 185 (66.5%) | 93 (33.5%) |
| College/Associate Degree | 263 (86.8%) | 40 (13.2%) |
| Bachelor's Degree or higher | 218 (91.6%) | 20 (8.4%) |
Occupancy by Age of Householder in New Hope
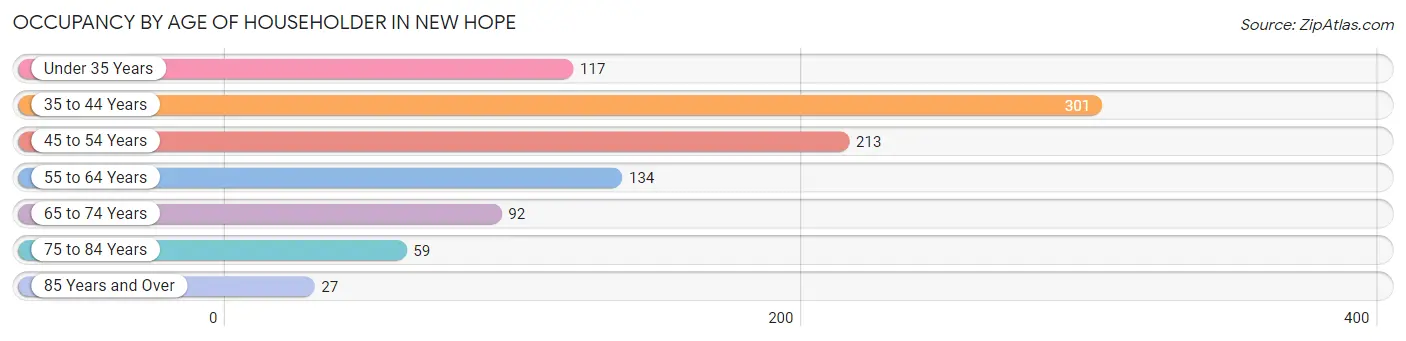
| Age Bracket | # Households | % Households |
| Under 35 Years | 117 | 12.4% |
| 35 to 44 Years | 301 | 31.9% |
| 45 to 54 Years | 213 | 22.6% |
| 55 to 64 Years | 134 | 14.2% |
| 65 to 74 Years | 92 | 9.8% |
| 75 to 84 Years | 59 | 6.3% |
| 85 Years and Over | 27 | 2.9% |
| Total | 943 | 100.0% |
Housing Finances in New Hope
Median Income by Occupancy in New Hope
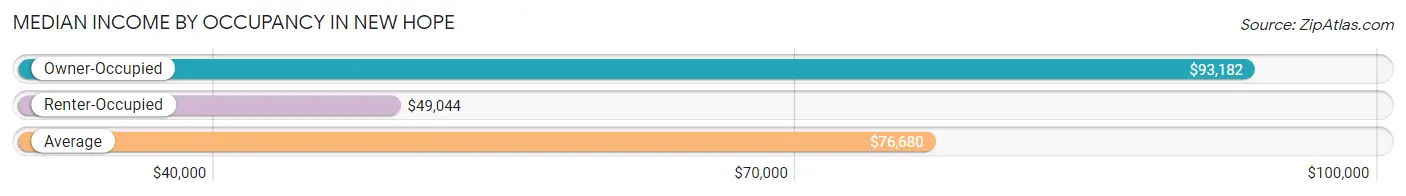
| Occupancy Type | # Households | Median Income |
| Owner-Occupied | 726 (77.0%) | $93,182 |
| Renter-Occupied | 217 (23.0%) | $49,044 |
| Average | 943 (100.0%) | $76,680 |
Occupancy by Householder Income Bracket in New Hope
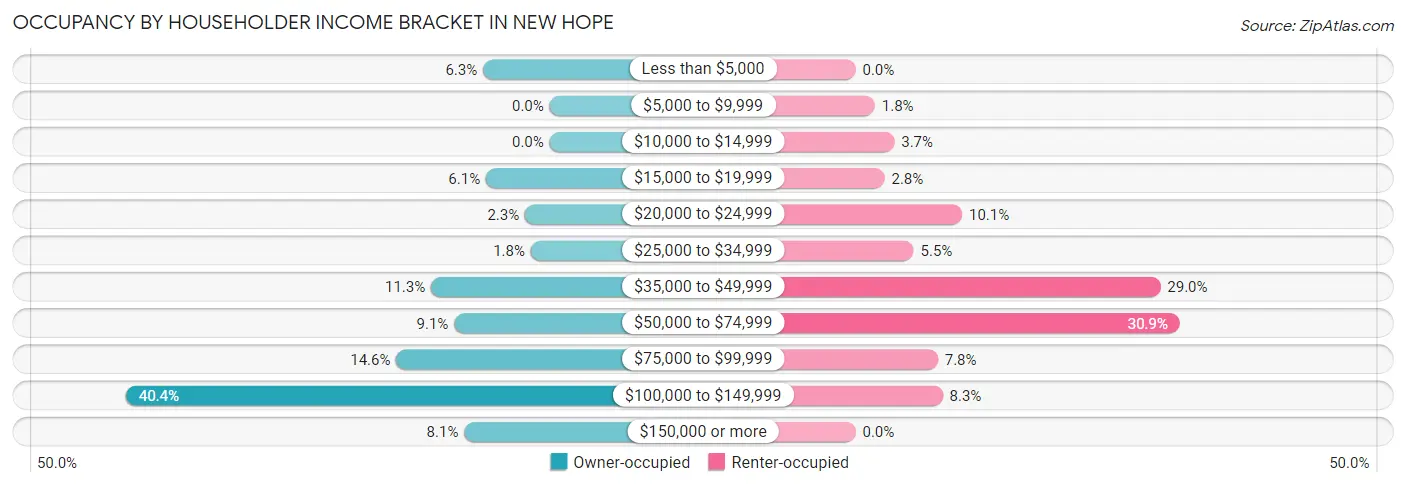
| Income Bracket | Owner-occupied | Renter-occupied |
| Less than $5,000 | 46 (6.3%) | 0 (0.0%) |
| $5,000 to $9,999 | 0 (0.0%) | 4 (1.8%) |
| $10,000 to $14,999 | 0 (0.0%) | 8 (3.7%) |
| $15,000 to $19,999 | 44 (6.1%) | 6 (2.8%) |
| $20,000 to $24,999 | 17 (2.3%) | 22 (10.1%) |
| $25,000 to $34,999 | 13 (1.8%) | 12 (5.5%) |
| $35,000 to $49,999 | 82 (11.3%) | 63 (29.0%) |
| $50,000 to $74,999 | 66 (9.1%) | 67 (30.9%) |
| $75,000 to $99,999 | 106 (14.6%) | 17 (7.8%) |
| $100,000 to $149,999 | 293 (40.4%) | 18 (8.3%) |
| $150,000 or more | 59 (8.1%) | 0 (0.0%) |
| Total | 726 (100.0%) | 217 (100.0%) |
Monthly Housing Cost Tiers in New Hope
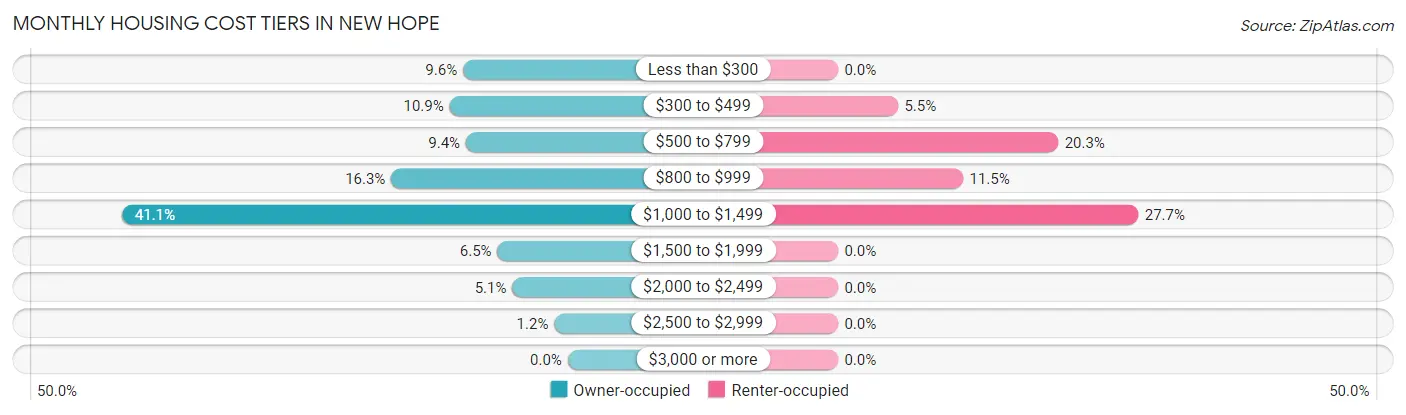
| Monthly Cost | Owner-occupied | Renter-occupied |
| Less than $300 | 70 (9.6%) | 0 (0.0%) |
| $300 to $499 | 79 (10.9%) | 12 (5.5%) |
| $500 to $799 | 68 (9.4%) | 44 (20.3%) |
| $800 to $999 | 118 (16.3%) | 25 (11.5%) |
| $1,000 to $1,499 | 298 (41.0%) | 60 (27.7%) |
| $1,500 to $1,999 | 47 (6.5%) | 0 (0.0%) |
| $2,000 to $2,499 | 37 (5.1%) | 0 (0.0%) |
| $2,500 to $2,999 | 9 (1.2%) | 0 (0.0%) |
| $3,000 or more | 0 (0.0%) | 0 (0.0%) |
| Total | 726 (100.0%) | 217 (100.0%) |
Physical Housing Characteristics in New Hope
Housing Structures in New Hope
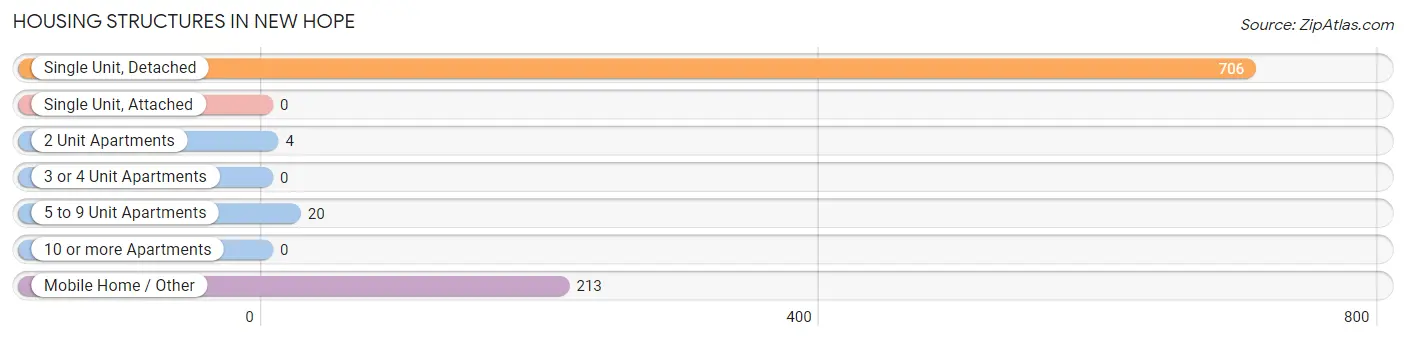
| Structure Type | # Housing Units | % Housing Units |
| Single Unit, Detached | 706 | 74.9% |
| Single Unit, Attached | 0 | 0.0% |
| 2 Unit Apartments | 4 | 0.4% |
| 3 or 4 Unit Apartments | 0 | 0.0% |
| 5 to 9 Unit Apartments | 20 | 2.1% |
| 10 or more Apartments | 0 | 0.0% |
| Mobile Home / Other | 213 | 22.6% |
| Total | 943 | 100.0% |
Housing Structures by Occupancy in New Hope
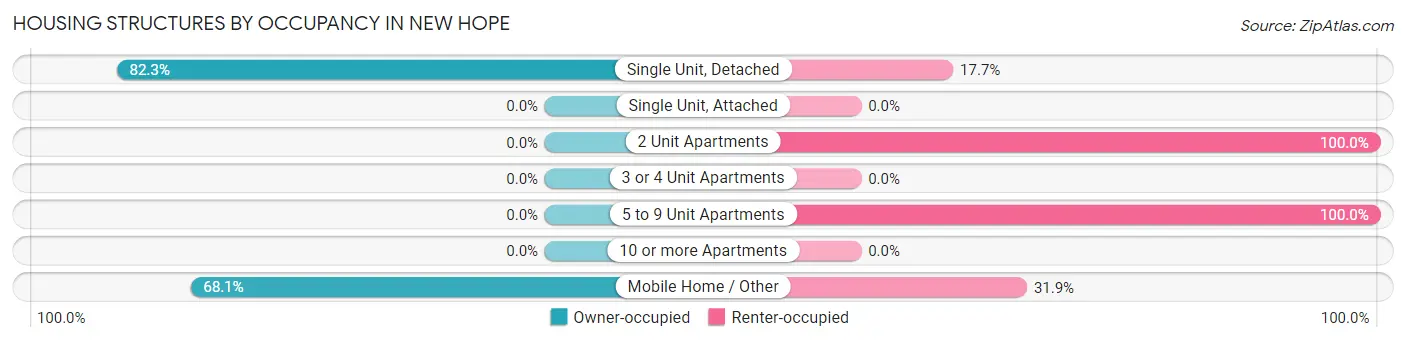
| Structure Type | Owner-occupied | Renter-occupied |
| Single Unit, Detached | 581 (82.3%) | 125 (17.7%) |
| Single Unit, Attached | 0 (0.0%) | 0 (0.0%) |
| 2 Unit Apartments | 0 (0.0%) | 4 (100.0%) |
| 3 or 4 Unit Apartments | 0 (0.0%) | 0 (0.0%) |
| 5 to 9 Unit Apartments | 0 (0.0%) | 20 (100.0%) |
| 10 or more Apartments | 0 (0.0%) | 0 (0.0%) |
| Mobile Home / Other | 145 (68.1%) | 68 (31.9%) |
| Total | 726 (77.0%) | 217 (23.0%) |
Housing Structures by Number of Rooms in New Hope
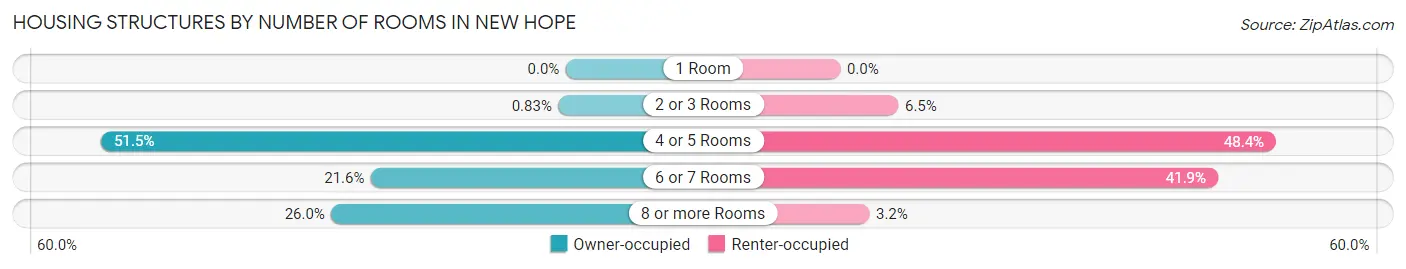
| Number of Rooms | Owner-occupied | Renter-occupied |
| 1 Room | 0 (0.0%) | 0 (0.0%) |
| 2 or 3 Rooms | 6 (0.8%) | 14 (6.5%) |
| 4 or 5 Rooms | 374 (51.5%) | 105 (48.4%) |
| 6 or 7 Rooms | 157 (21.6%) | 91 (41.9%) |
| 8 or more Rooms | 189 (26.0%) | 7 (3.2%) |
| Total | 726 (100.0%) | 217 (100.0%) |
Housing Structure by Heating Type in New Hope
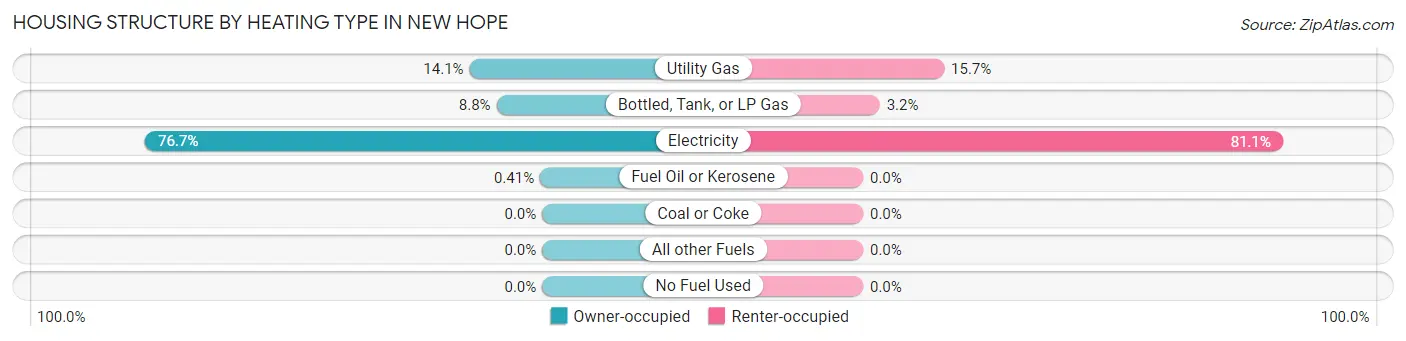
| Heating Type | Owner-occupied | Renter-occupied |
| Utility Gas | 102 (14.1%) | 34 (15.7%) |
| Bottled, Tank, or LP Gas | 64 (8.8%) | 7 (3.2%) |
| Electricity | 557 (76.7%) | 176 (81.1%) |
| Fuel Oil or Kerosene | 3 (0.4%) | 0 (0.0%) |
| Coal or Coke | 0 (0.0%) | 0 (0.0%) |
| All other Fuels | 0 (0.0%) | 0 (0.0%) |
| No Fuel Used | 0 (0.0%) | 0 (0.0%) |
| Total | 726 (100.0%) | 217 (100.0%) |
Household Vehicle Usage in New Hope
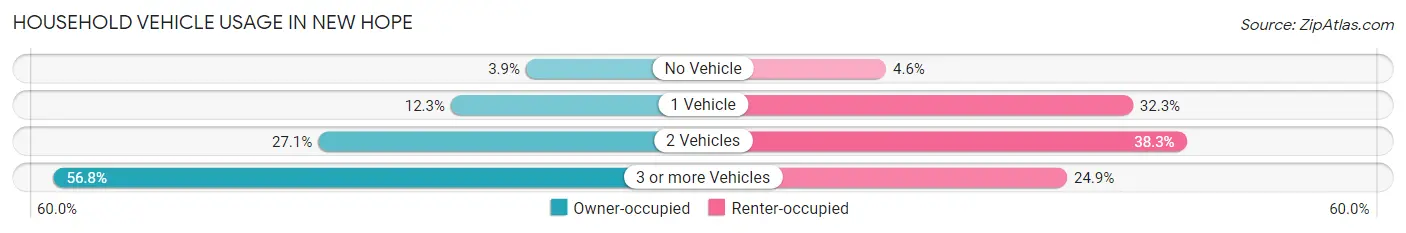
| Vehicles per Household | Owner-occupied | Renter-occupied |
| No Vehicle | 28 (3.9%) | 10 (4.6%) |
| 1 Vehicle | 89 (12.3%) | 70 (32.3%) |
| 2 Vehicles | 197 (27.1%) | 83 (38.3%) |
| 3 or more Vehicles | 412 (56.8%) | 54 (24.9%) |
| Total | 726 (100.0%) | 217 (100.0%) |
Real Estate & Mortgages in New Hope
Real Estate and Mortgage Overview in New Hope
| Characteristic | Without Mortgage | With Mortgage |
| Housing Units | 165 | 561 |
| Median Property Value | $116,500 | $162,400 |
| Median Household Income | $44,125 | $54 |
| Monthly Housing Costs | $399 | $0 |
| Real Estate Taxes | $398 | $9 |
Property Value by Mortgage Status in New Hope
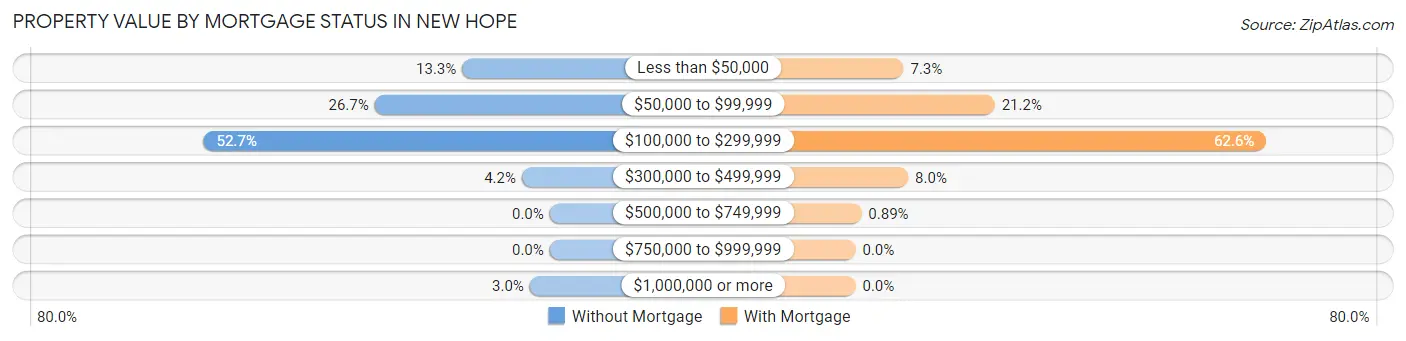
| Property Value | Without Mortgage | With Mortgage |
| Less than $50,000 | 22 (13.3%) | 41 (7.3%) |
| $50,000 to $99,999 | 44 (26.7%) | 119 (21.2%) |
| $100,000 to $299,999 | 87 (52.7%) | 351 (62.6%) |
| $300,000 to $499,999 | 7 (4.2%) | 45 (8.0%) |
| $500,000 to $749,999 | 0 (0.0%) | 5 (0.9%) |
| $750,000 to $999,999 | 0 (0.0%) | 0 (0.0%) |
| $1,000,000 or more | 5 (3.0%) | 0 (0.0%) |
| Total | 165 (100.0%) | 561 (100.0%) |
Household Income by Mortgage Status in New Hope
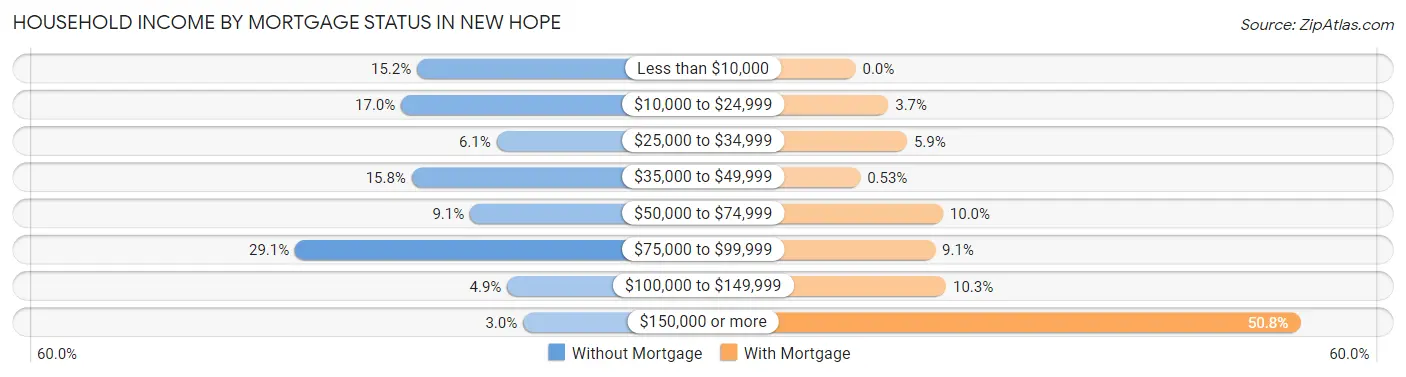
| Household Income | Without Mortgage | With Mortgage |
| Less than $10,000 | 25 (15.1%) | 0 (0.0%) |
| $10,000 to $24,999 | 28 (17.0%) | 21 (3.7%) |
| $25,000 to $34,999 | 10 (6.1%) | 33 (5.9%) |
| $35,000 to $49,999 | 26 (15.8%) | 3 (0.5%) |
| $50,000 to $74,999 | 15 (9.1%) | 56 (10.0%) |
| $75,000 to $99,999 | 48 (29.1%) | 51 (9.1%) |
| $100,000 to $149,999 | 8 (4.9%) | 58 (10.3%) |
| $150,000 or more | 5 (3.0%) | 285 (50.8%) |
| Total | 165 (100.0%) | 561 (100.0%) |
Property Value to Household Income Ratio in New Hope
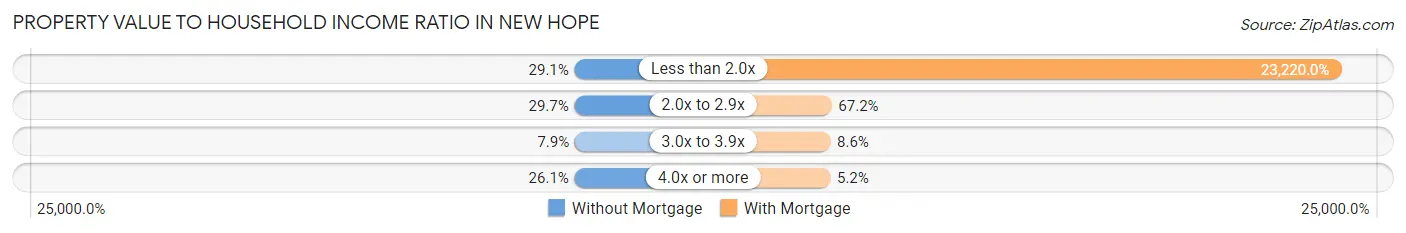
| Value-to-Income Ratio | Without Mortgage | With Mortgage |
| Less than 2.0x | 48 (29.1%) | 130,264 (23,220.0%) |
| 2.0x to 2.9x | 49 (29.7%) | 377 (67.2%) |
| 3.0x to 3.9x | 13 (7.9%) | 48 (8.6%) |
| 4.0x or more | 43 (26.1%) | 29 (5.2%) |
| Total | 165 (100.0%) | 561 (100.0%) |
Real Estate Taxes by Mortgage Status in New Hope
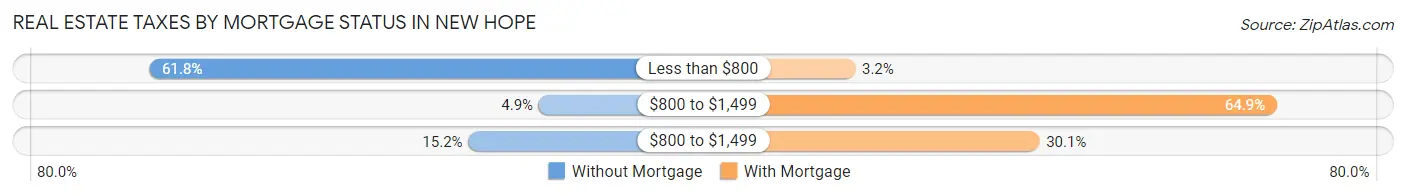
| Property Taxes | Without Mortgage | With Mortgage |
| Less than $800 | 102 (61.8%) | 18 (3.2%) |
| $800 to $1,499 | 8 (4.9%) | 364 (64.9%) |
| $800 to $1,499 | 25 (15.1%) | 169 (30.1%) |
| Total | 165 (100.0%) | 561 (100.0%) |
Health & Disability in New Hope
Health Insurance Coverage by Age in New Hope
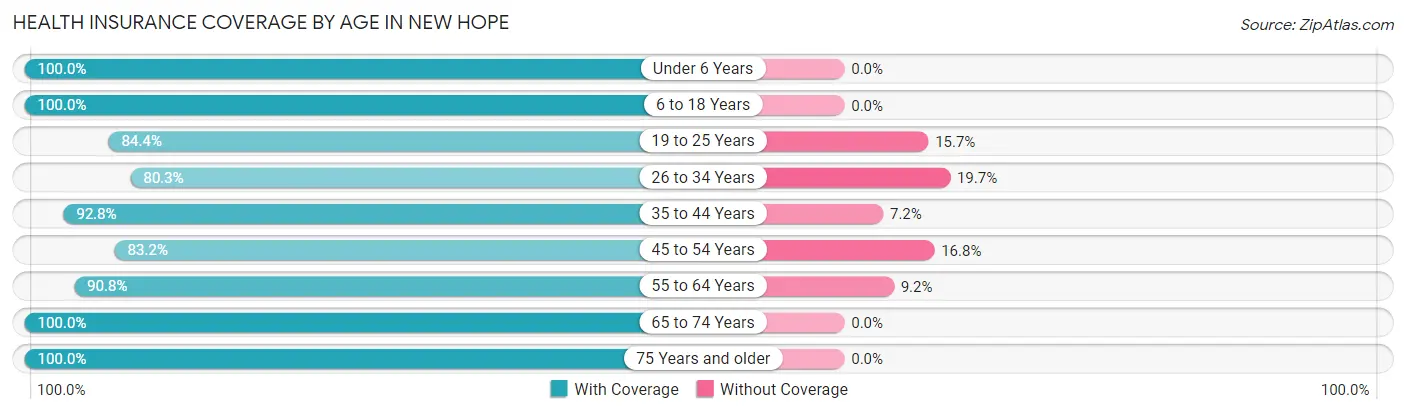
| Age Bracket | With Coverage | Without Coverage |
| Under 6 Years | 168 (100.0%) | 0 (0.0%) |
| 6 to 18 Years | 878 (100.0%) | 0 (0.0%) |
| 19 to 25 Years | 124 (84.4%) | 23 (15.7%) |
| 26 to 34 Years | 281 (80.3%) | 69 (19.7%) |
| 35 to 44 Years | 514 (92.8%) | 40 (7.2%) |
| 45 to 54 Years | 258 (83.2%) | 52 (16.8%) |
| 55 to 64 Years | 187 (90.8%) | 19 (9.2%) |
| 65 to 74 Years | 161 (100.0%) | 0 (0.0%) |
| 75 Years and older | 101 (100.0%) | 0 (0.0%) |
| Total | 2,672 (92.9%) | 203 (7.1%) |
Health Insurance Coverage by Citizenship Status in New Hope
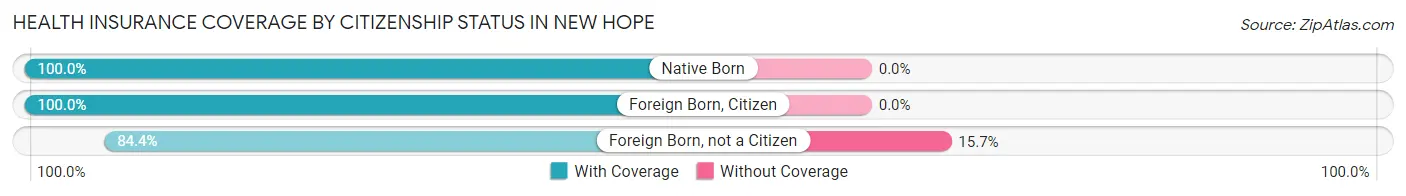
| Citizenship Status | With Coverage | Without Coverage |
| Native Born | 168 (100.0%) | 0 (0.0%) |
| Foreign Born, Citizen | 878 (100.0%) | 0 (0.0%) |
| Foreign Born, not a Citizen | 124 (84.4%) | 23 (15.7%) |
Health Insurance Coverage by Household Income in New Hope
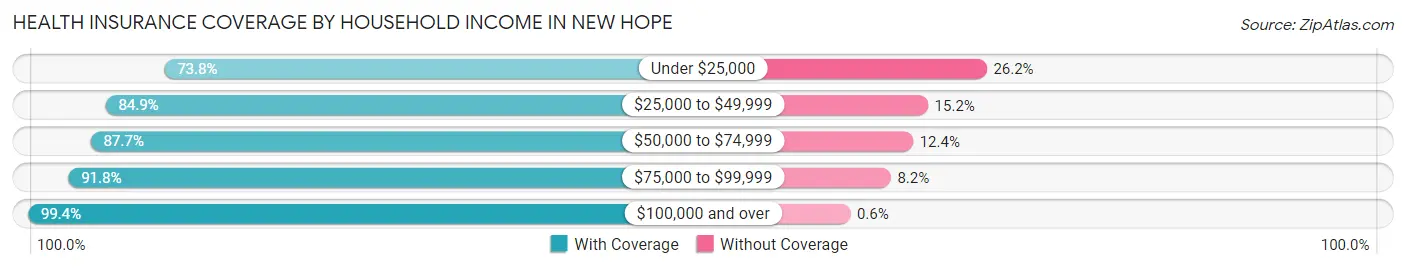
| Household Income | With Coverage | Without Coverage |
| Under $25,000 | 127 (73.8%) | 45 (26.2%) |
| $25,000 to $49,999 | 409 (84.9%) | 73 (15.1%) |
| $50,000 to $74,999 | 355 (87.6%) | 50 (12.3%) |
| $75,000 to $99,999 | 292 (91.8%) | 26 (8.2%) |
| $100,000 and over | 1,489 (99.4%) | 9 (0.6%) |
Public vs Private Health Insurance Coverage by Age in New Hope
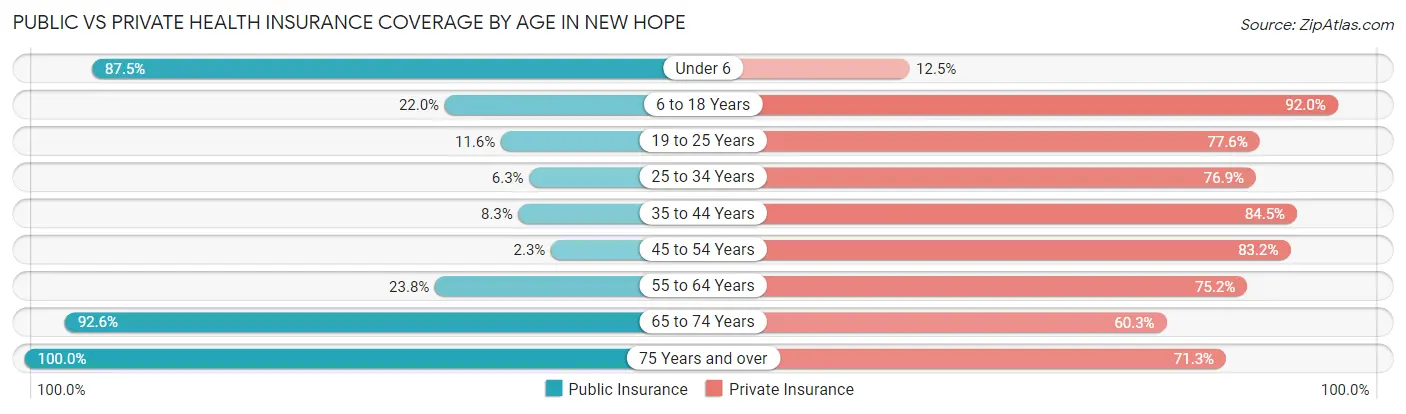
| Age Bracket | Public Insurance | Private Insurance |
| Under 6 | 147 (87.5%) | 21 (12.5%) |
| 6 to 18 Years | 193 (22.0%) | 808 (92.0%) |
| 19 to 25 Years | 17 (11.6%) | 114 (77.5%) |
| 25 to 34 Years | 22 (6.3%) | 269 (76.9%) |
| 35 to 44 Years | 46 (8.3%) | 468 (84.5%) |
| 45 to 54 Years | 7 (2.3%) | 258 (83.2%) |
| 55 to 64 Years | 49 (23.8%) | 155 (75.2%) |
| 65 to 74 Years | 149 (92.5%) | 97 (60.3%) |
| 75 Years and over | 101 (100.0%) | 72 (71.3%) |
| Total | 731 (25.4%) | 2,262 (78.7%) |
Disability Status by Sex by Age in New Hope
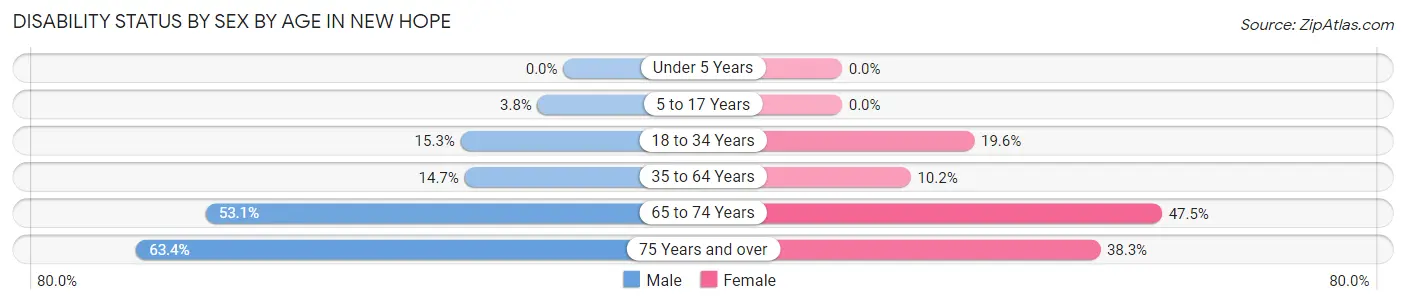
| Age Bracket | Male | Female |
| Under 5 Years | 0 (0.0%) | 0 (0.0%) |
| 5 to 17 Years | 16 (3.8%) | 0 (0.0%) |
| 18 to 34 Years | 36 (15.2%) | 65 (19.6%) |
| 35 to 64 Years | 85 (14.7%) | 50 (10.2%) |
| 65 to 74 Years | 43 (53.1%) | 38 (47.5%) |
| 75 Years and over | 26 (63.4%) | 23 (38.3%) |
Disability Class by Sex by Age in New Hope
Disability Class: Hearing Difficulty
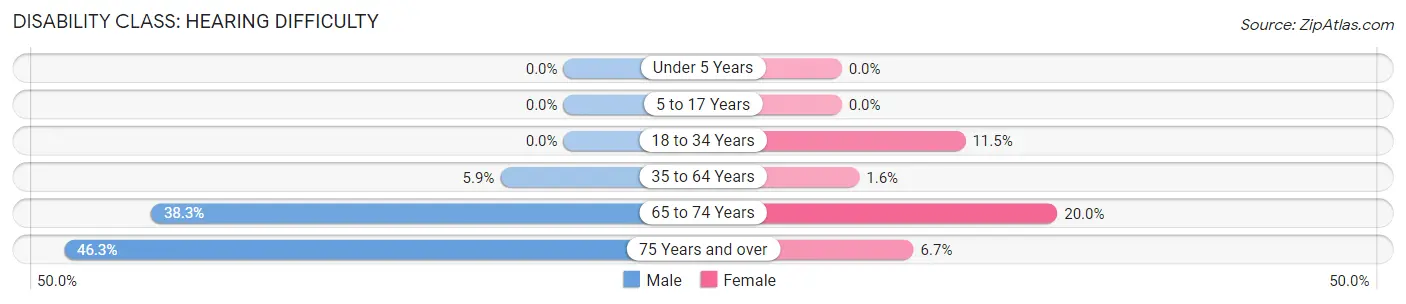
| Age Bracket | Male | Female |
| Under 5 Years | 0 (0.0%) | 0 (0.0%) |
| 5 to 17 Years | 0 (0.0%) | 0 (0.0%) |
| 18 to 34 Years | 0 (0.0%) | 38 (11.5%) |
| 35 to 64 Years | 34 (5.9%) | 8 (1.6%) |
| 65 to 74 Years | 31 (38.3%) | 16 (20.0%) |
| 75 Years and over | 19 (46.3%) | 4 (6.7%) |
Disability Class: Vision Difficulty
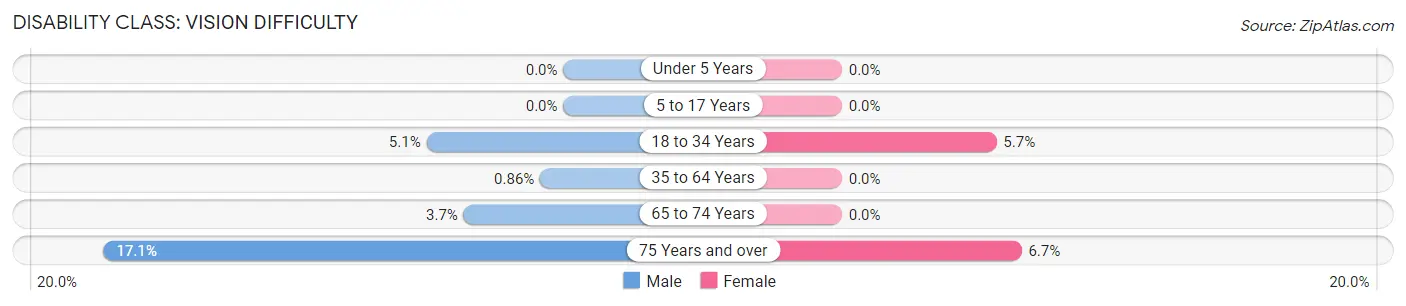
| Age Bracket | Male | Female |
| Under 5 Years | 0 (0.0%) | 0 (0.0%) |
| 5 to 17 Years | 0 (0.0%) | 0 (0.0%) |
| 18 to 34 Years | 12 (5.1%) | 19 (5.7%) |
| 35 to 64 Years | 5 (0.9%) | 0 (0.0%) |
| 65 to 74 Years | 3 (3.7%) | 0 (0.0%) |
| 75 Years and over | 7 (17.1%) | 4 (6.7%) |
Disability Class: Cognitive Difficulty
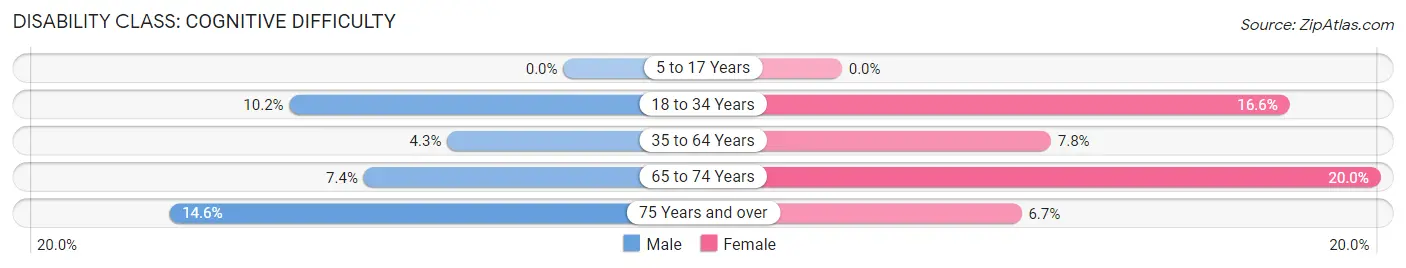
| Age Bracket | Male | Female |
| 5 to 17 Years | 0 (0.0%) | 0 (0.0%) |
| 18 to 34 Years | 24 (10.2%) | 55 (16.6%) |
| 35 to 64 Years | 25 (4.3%) | 38 (7.8%) |
| 65 to 74 Years | 6 (7.4%) | 16 (20.0%) |
| 75 Years and over | 6 (14.6%) | 4 (6.7%) |
Disability Class: Ambulatory Difficulty
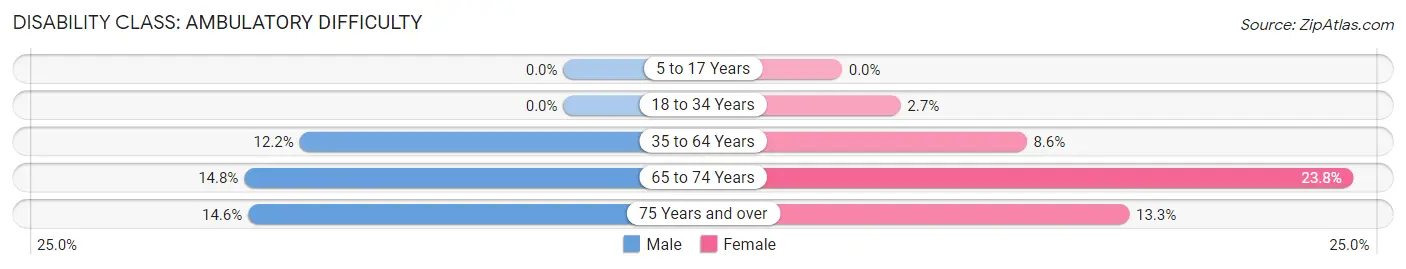
| Age Bracket | Male | Female |
| 5 to 17 Years | 0 (0.0%) | 0 (0.0%) |
| 18 to 34 Years | 0 (0.0%) | 9 (2.7%) |
| 35 to 64 Years | 71 (12.2%) | 42 (8.6%) |
| 65 to 74 Years | 12 (14.8%) | 19 (23.7%) |
| 75 Years and over | 6 (14.6%) | 8 (13.3%) |
Disability Class: Self-Care Difficulty
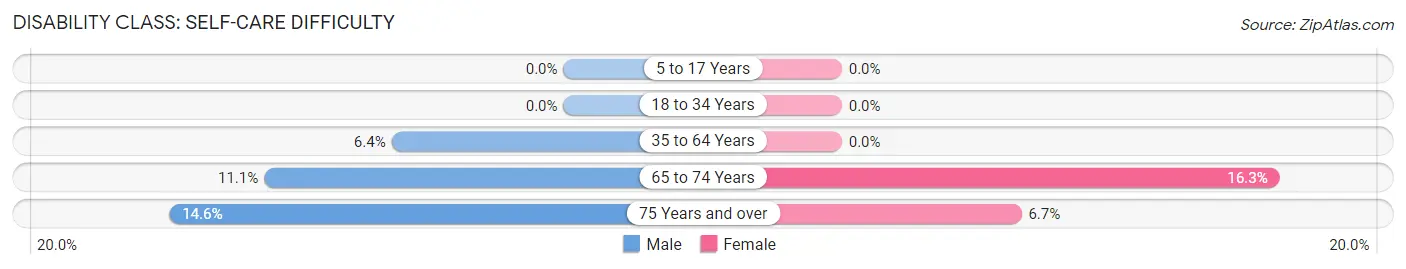
| Age Bracket | Male | Female |
| 5 to 17 Years | 0 (0.0%) | 0 (0.0%) |
| 18 to 34 Years | 0 (0.0%) | 0 (0.0%) |
| 35 to 64 Years | 37 (6.4%) | 0 (0.0%) |
| 65 to 74 Years | 9 (11.1%) | 13 (16.3%) |
| 75 Years and over | 6 (14.6%) | 4 (6.7%) |
Technology Access in New Hope
Computing Device Access in New Hope
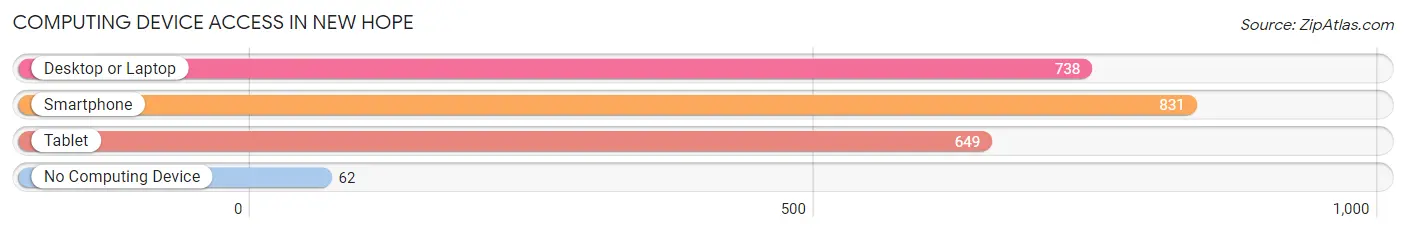
| Device Type | # Households | % Households |
| Desktop or Laptop | 738 | 78.3% |
| Smartphone | 831 | 88.1% |
| Tablet | 649 | 68.8% |
| No Computing Device | 62 | 6.6% |
| Total | 943 | 100.0% |
Internet Access in New Hope
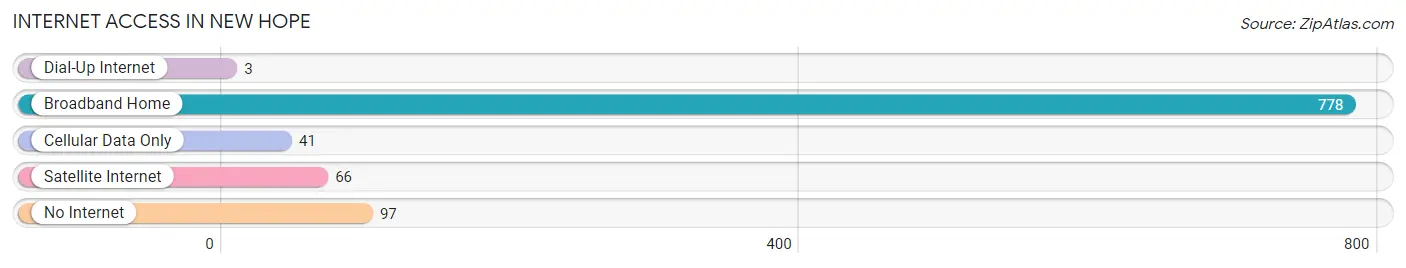
| Internet Type | # Households | % Households |
| Dial-Up Internet | 3 | 0.3% |
| Broadband Home | 778 | 82.5% |
| Cellular Data Only | 41 | 4.3% |
| Satellite Internet | 66 | 7.0% |
| No Internet | 97 | 10.3% |
| Total | 943 | 100.0% |
New Hope Summary
New Hope is a small town located in Madison County, Alabama. It is situated in the northern part of the state, just south of Huntsville. The town was founded in 1818 and has a population of approximately 2,000 people.
History
New Hope was founded in 1818 by a group of settlers from North Carolina. The town was originally known as “New Hope Settlement” and was located on the banks of the Flint River. The settlers were attracted to the area due to its fertile soil and abundant natural resources. The town was officially incorporated in 1820 and was named after the biblical city of New Hope.
The town quickly grew and prospered due to its location on the Flint River, which provided a convenient transportation route for goods and services. The town was also home to several mills, which provided employment for many of the town’s residents.
In the late 19th century, the town experienced a period of growth and development. The town was home to several churches, schools, and businesses. The town also had a railroad station, which connected it to other parts of the state.
In the early 20th century, the town experienced a period of decline. The railroad station was closed and the mills began to close as well. The town’s population began to decline as well, and by the 1950s, the town had a population of only about 500 people.
Geography
New Hope is located in northern Alabama, just south of Huntsville. The town is situated on the banks of the Flint River, which provides a convenient transportation route for goods and services. The town is surrounded by rolling hills and forests, and is located in a rural area.
The town has a total area of 2.2 square miles, all of which is land. The town has a humid subtropical climate, with hot summers and mild winters.
Economy
New Hope’s economy is largely based on agriculture. The town is home to several farms, which produce a variety of crops, including corn, soybeans, and cotton. The town also has several small businesses, including restaurants, convenience stores, and gas stations.
The town is also home to several manufacturing companies, which produce a variety of products, including furniture, clothing, and automotive parts. The town is also home to several small businesses, including a grocery store, a hardware store, and a pharmacy.
Demographics
As of the 2010 census, New Hope had a population of 2,000 people. The town has a median household income of $37,000 and a median family income of $45,000. The town is predominantly white, with about 90% of the population being white. The town also has a small African American population, with about 5% of the population being African American. The town also has a small Hispanic population, with about 2% of the population being Hispanic.
New Hope is a small town with a rich history and a vibrant economy. The town is home to several businesses, churches, and schools, and is a great place to live and work. The town is also home to a diverse population, with a variety of ethnic backgrounds and cultures.
Common Questions
What is Per Capita Income in New Hope?
Per Capita income in New Hope is $28,201.
What is the Median Family Income in New Hope?
Median Family Income in New Hope is $110,938.
What is the Median Household income in New Hope?
Median Household Income in New Hope is $76,680.
What is Income or Wage Gap in New Hope?
Income or Wage Gap in New Hope is 15.2%.
Women in New Hope earn 84.8 cents for every dollar earned by a man.
What is Inequality or Gini Index in New Hope?
Inequality or Gini Index in New Hope is 0.37.
What is the Total Population of New Hope?
Total Population of New Hope is 2,875.
What is the Total Male Population of New Hope?
Total Male Population of New Hope is 1,431.
What is the Total Female Population of New Hope?
Total Female Population of New Hope is 1,444.
What is the Ratio of Males per 100 Females in New Hope?
There are 99.10 Males per 100 Females in New Hope.
What is the Ratio of Females per 100 Males in New Hope?
There are 100.91 Females per 100 Males in New Hope.
What is the Median Population Age in New Hope?
Median Population Age in New Hope is 34.2 Years.
What is the Average Family Size in New Hope
Average Family Size in New Hope is 3.7 People.
What is the Average Household Size in New Hope
Average Household Size in New Hope is 3.0 People.
How Large is the Labor Force in New Hope?
There are 1,408 People in the Labor Forcein in New Hope.
What is the Percentage of People in the Labor Force in New Hope?
72.4% of People are in the Labor Force in New Hope.
What is the Unemployment Rate in New Hope?
Unemployment Rate in New Hope is 7.9%.