Helena, AL Map & Demographics
Helena Map
Helena Overview
$48,087
PER CAPITA INCOME
$120,279
AVG FAMILY INCOME
$107,360
AVG HOUSEHOLD INCOME
33.5%
WAGE / INCOME GAP [ % ]
66.5¢/ $1
WAGE / INCOME GAP [ $ ]
0.41
INEQUALITY / GINI INDEX
21,036
TOTAL POPULATION
10,067
MALE POPULATION
10,969
FEMALE POPULATION
91.78
MALES / 100 FEMALES
108.96
FEMALES / 100 MALES
38.2
MEDIAN AGE
3.3
AVG FAMILY SIZE
2.8
AVG HOUSEHOLD SIZE
11,252
LABOR FORCE [ PEOPLE ]
70.3%
PERCENT IN LABOR FORCE
2.1%
UNEMPLOYMENT RATE
Helena Zip Codes
Helena Area Codes
Income in Helena
Income Overview in Helena
Per Capita Income in Helena is $48,087, while median incomes of families and households are $120,279 and $107,360 respectively.
| Characteristic | Number | Measure |
| Per Capita Income | 21,036 | $48,087 |
| Median Family Income | 5,620 | $120,279 |
| Mean Family Income | 5,620 | $143,691 |
| Median Household Income | 7,480 | $107,360 |
| Mean Household Income | 7,480 | $130,619 |
| Income Deficit | 5,620 | $0 |
| Wage / Income Gap (%) | 21,036 | 33.48% |
| Wage / Income Gap ($) | 21,036 | 66.52¢ per $1 |
| Gini / Inequality Index | 21,036 | 0.41 |
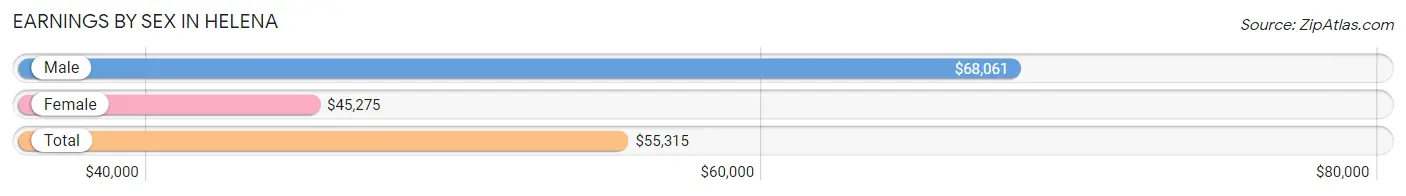
Earnings by Sex in Helena
Average Earnings in Helena are $55,315, $68,061 for men and $45,275 for women, a difference of 33.5%.
| Sex | Number | Average Earnings |
| Male | 6,383 (53.6%) | $68,061 |
| Female | 5,534 (46.4%) | $45,275 |
| Total | 11,917 (100.0%) | $55,315 |
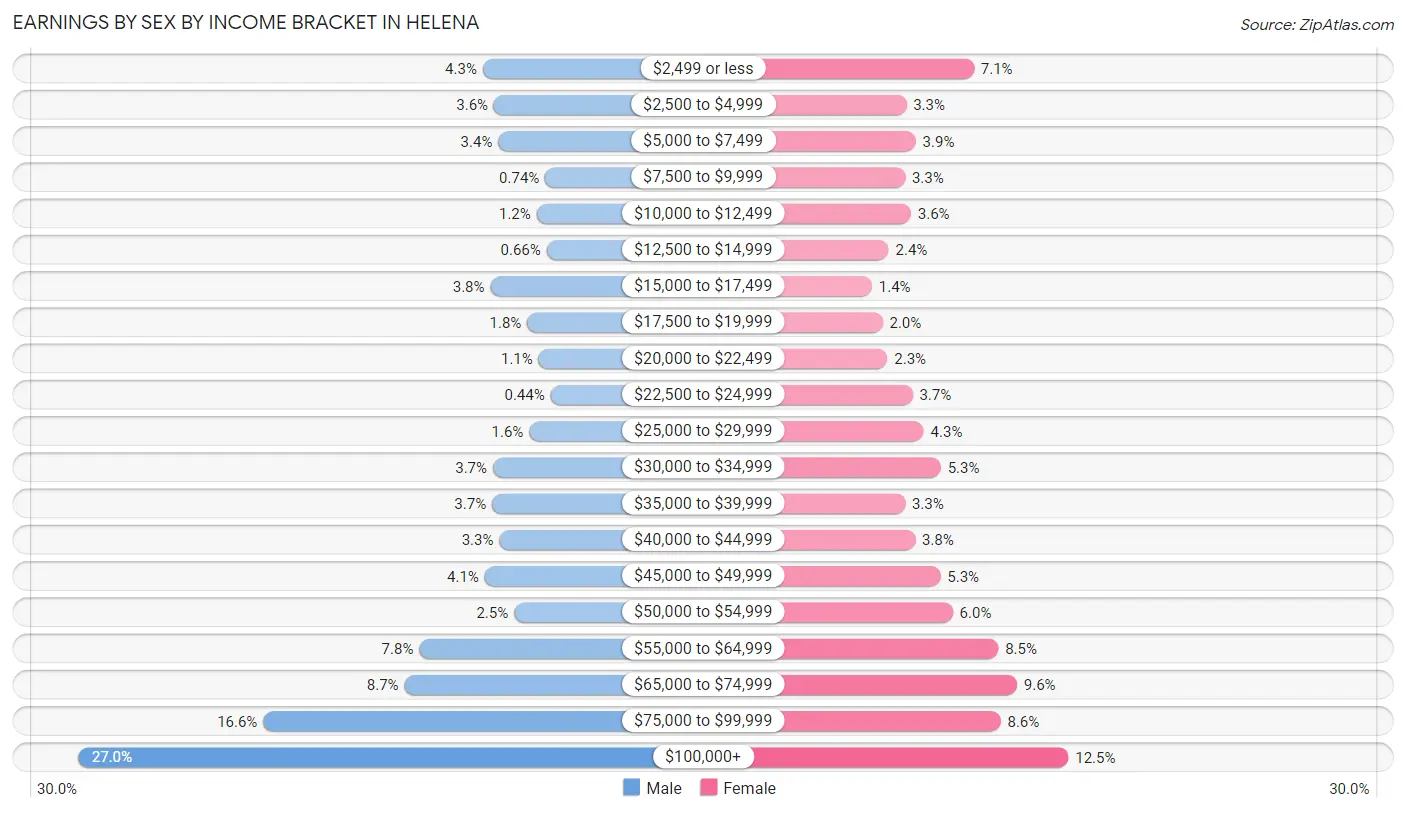
Earnings by Sex by Income Bracket in Helena
The most common earnings brackets in Helena are $100,000+ for men (1,720 | 27.0%) and $100,000+ for women (689 | 12.4%).
| Income | Male | Female |
| $2,499 or less | 271 (4.3%) | 395 (7.1%) |
| $2,500 to $4,999 | 231 (3.6%) | 185 (3.3%) |
| $5,000 to $7,499 | 216 (3.4%) | 214 (3.9%) |
| $7,500 to $9,999 | 47 (0.7%) | 181 (3.3%) |
| $10,000 to $12,499 | 78 (1.2%) | 199 (3.6%) |
| $12,500 to $14,999 | 42 (0.7%) | 130 (2.4%) |
| $15,000 to $17,499 | 244 (3.8%) | 78 (1.4%) |
| $17,500 to $19,999 | 112 (1.8%) | 111 (2.0%) |
| $20,000 to $22,499 | 71 (1.1%) | 126 (2.3%) |
| $22,500 to $24,999 | 28 (0.4%) | 204 (3.7%) |
| $25,000 to $29,999 | 105 (1.6%) | 239 (4.3%) |
| $30,000 to $34,999 | 235 (3.7%) | 292 (5.3%) |
| $35,000 to $39,999 | 238 (3.7%) | 181 (3.3%) |
| $40,000 to $44,999 | 212 (3.3%) | 212 (3.8%) |
| $45,000 to $49,999 | 264 (4.1%) | 291 (5.3%) |
| $50,000 to $54,999 | 159 (2.5%) | 329 (5.9%) |
| $55,000 to $64,999 | 499 (7.8%) | 471 (8.5%) |
| $65,000 to $74,999 | 552 (8.6%) | 529 (9.6%) |
| $75,000 to $99,999 | 1,059 (16.6%) | 478 (8.6%) |
| $100,000+ | 1,720 (27.0%) | 689 (12.4%) |
| Total | 6,383 (100.0%) | 5,534 (100.0%) |
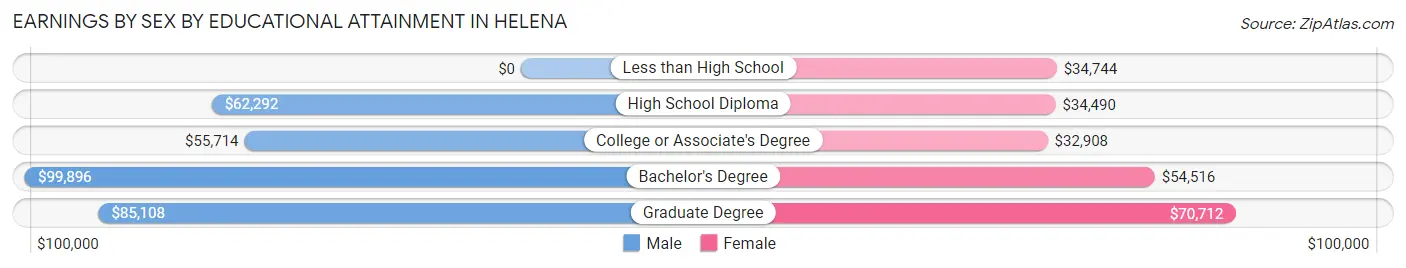
Earnings by Sex by Educational Attainment in Helena
Average earnings in Helena are $74,962 for men and $49,151 for women, a difference of 34.4%. Men with an educational attainment of bachelor's degree enjoy the highest average annual earnings of $99,896, while those with college or associate's degree education earn the least with $55,714. Women with an educational attainment of graduate degree earn the most with the average annual earnings of $70,712, while those with college or associate's degree education have the smallest earnings of $32,908.
| Educational Attainment | Male Income | Female Income |
| Less than High School | - | - |
| High School Diploma | $62,292 | $34,490 |
| College or Associate's Degree | $55,714 | $32,908 |
| Bachelor's Degree | $99,896 | $54,516 |
| Graduate Degree | $85,108 | $70,712 |
| Total | $74,962 | $49,151 |
Family Income in Helena
Family Income Brackets in Helena
According to the Helena family income data, there are 1,607 families falling into the $100,000 to $149,999 income range, which is the most common income bracket and makes up 28.6% of all families. Conversely, the $10,000 to $14,999 income bracket is the least frequent group with only 22 families (0.4%) belonging to this category.
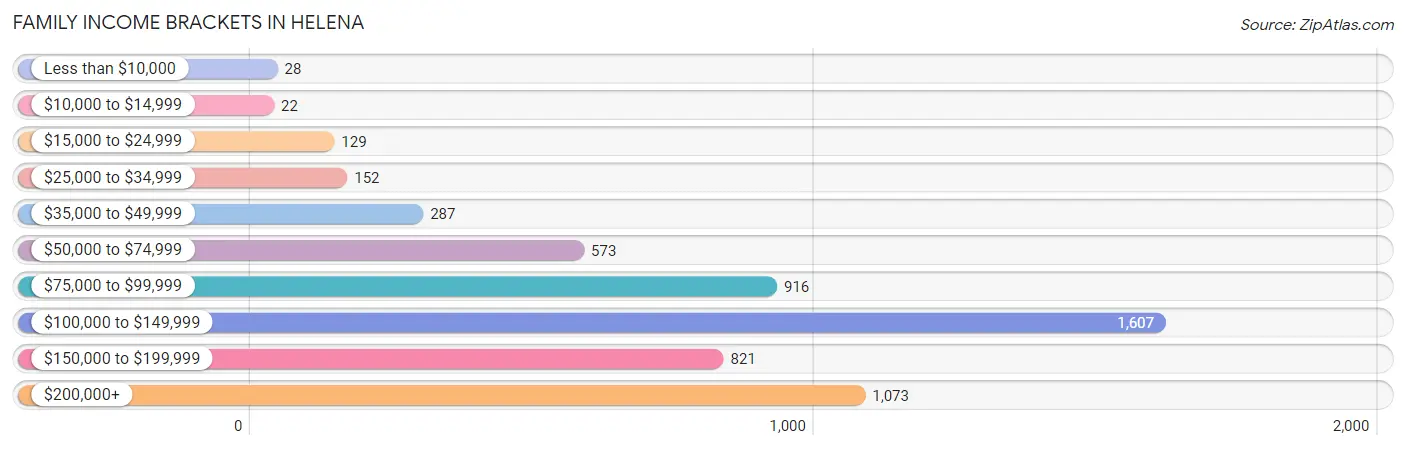
| Income Bracket | # Families | % Families |
| Less than $10,000 | 28 | 0.5% |
| $10,000 to $14,999 | 22 | 0.4% |
| $15,000 to $24,999 | 129 | 2.3% |
| $25,000 to $34,999 | 152 | 2.7% |
| $35,000 to $49,999 | 287 | 5.1% |
| $50,000 to $74,999 | 573 | 10.2% |
| $75,000 to $99,999 | 916 | 16.3% |
| $100,000 to $149,999 | 1,607 | 28.6% |
| $150,000 to $199,999 | 821 | 14.6% |
| $200,000+ | 1,073 | 19.1% |
Family Income by Famaliy Size in Helena
5-person families (430 | 7.6%) account for the highest median family income in Helena with $146,406 per family, while 2-person families (2,220 | 39.5%) have the highest median income of $49,450 per family member.
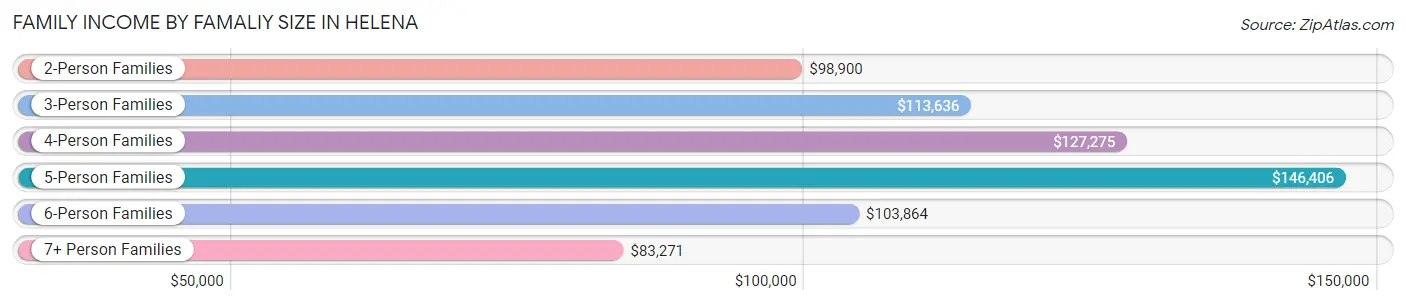
| Income Bracket | # Families | Median Income |
| 2-Person Families | 2,220 (39.5%) | $98,900 |
| 3-Person Families | 1,208 (21.5%) | $113,636 |
| 4-Person Families | 1,647 (29.3%) | $127,275 |
| 5-Person Families | 430 (7.6%) | $146,406 |
| 6-Person Families | 50 (0.9%) | $103,864 |
| 7+ Person Families | 65 (1.2%) | $83,271 |
| Total | 5,620 (100.0%) | $120,279 |
Family Income by Number of Earners in Helena
The median family income in Helena is $120,279, with families comprising 3+ earners (887) having the highest median family income of $163,281, while families with no earners (564) have the lowest median family income of $61,650, accounting for 15.8% and 10.0% of families, respectively.
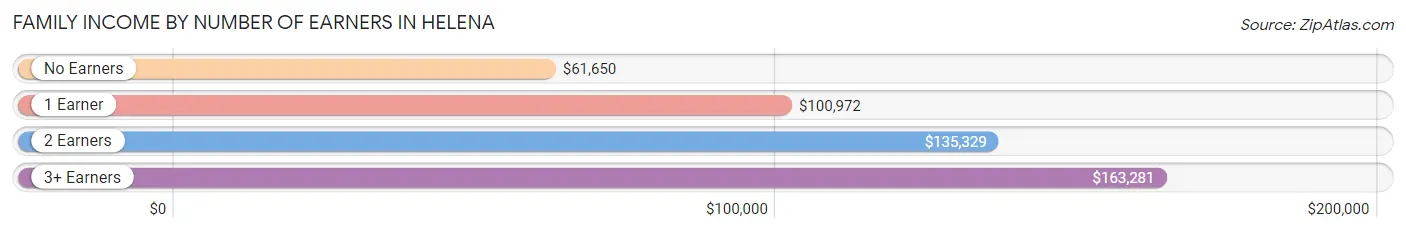
| Number of Earners | # Families | Median Income |
| No Earners | 564 (10.0%) | $61,650 |
| 1 Earner | 1,519 (27.0%) | $100,972 |
| 2 Earners | 2,650 (47.1%) | $135,329 |
| 3+ Earners | 887 (15.8%) | $163,281 |
| Total | 5,620 (100.0%) | $120,279 |
Household Income in Helena
Household Income Brackets in Helena
With 2,072 households falling in the category, the $100,000 to $149,999 income range is the most frequent in Helena, accounting for 27.7% of all households. In contrast, only 37 households (0.5%) fall into the $10,000 to $14,999 income bracket, making it the least populous group.
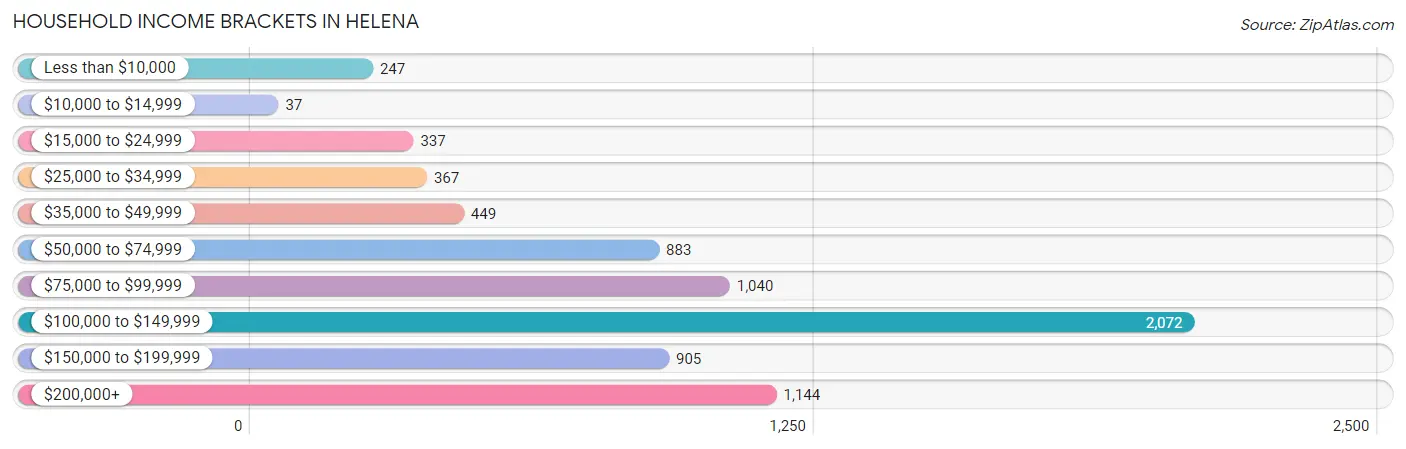
| Income Bracket | # Households | % Households |
| Less than $10,000 | 247 | 3.3% |
| $10,000 to $14,999 | 37 | 0.5% |
| $15,000 to $24,999 | 337 | 4.5% |
| $25,000 to $34,999 | 367 | 4.9% |
| $35,000 to $49,999 | 449 | 6.0% |
| $50,000 to $74,999 | 883 | 11.8% |
| $75,000 to $99,999 | 1,040 | 13.9% |
| $100,000 to $149,999 | 2,072 | 27.7% |
| $150,000 to $199,999 | 905 | 12.1% |
| $200,000+ | 1,144 | 15.3% |
Household Income by Householder Age in Helena
The median household income in Helena is $107,360, with the highest median household income of $125,332 found in the 45 to 64 years age bracket for the primary householder. A total of 3,073 households (41.1%) fall into this category. Meanwhile, the 15 to 24 years age bracket for the primary householder has the lowest median household income of $59,028, with 55 households (0.7%) in this group.
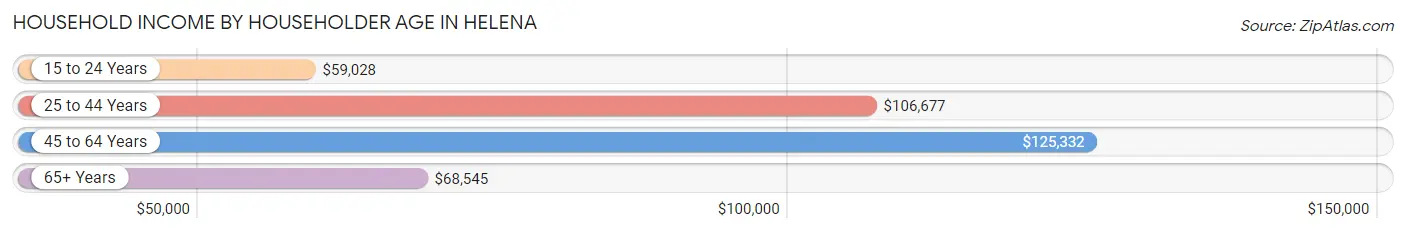
| Income Bracket | # Households | Median Income |
| 15 to 24 Years | 55 (0.7%) | $59,028 |
| 25 to 44 Years | 2,736 (36.6%) | $106,677 |
| 45 to 64 Years | 3,073 (41.1%) | $125,332 |
| 65+ Years | 1,616 (21.6%) | $68,545 |
| Total | 7,480 (100.0%) | $107,360 |
Poverty in Helena
Income Below Poverty by Sex and Age in Helena
With 2.7% poverty level for males and 4.3% for females among the residents of Helena, 25 to 34 year old males and 5 year old females are the most vulnerable to poverty, with 132 males (9.7%) and 92 females (31.3%) in their respective age groups living below the poverty level.
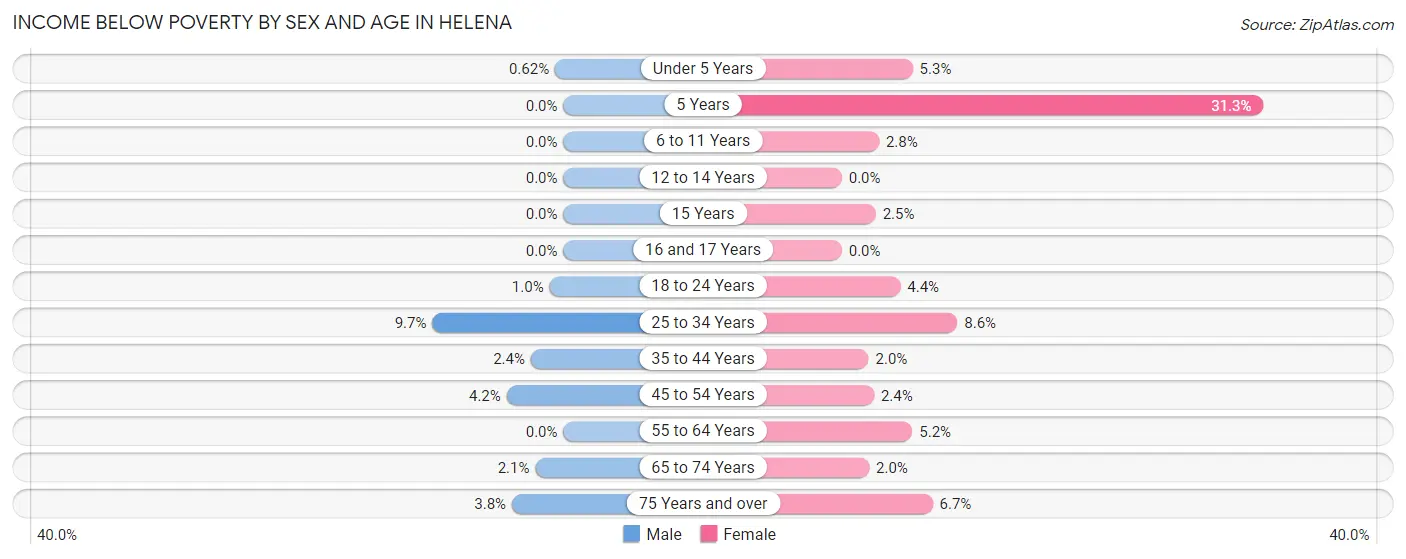
| Age Bracket | Male | Female |
| Under 5 Years | 4 (0.6%) | 32 (5.3%) |
| 5 Years | 0 (0.0%) | 92 (31.3%) |
| 6 to 11 Years | 0 (0.0%) | 33 (2.8%) |
| 12 to 14 Years | 0 (0.0%) | 0 (0.0%) |
| 15 Years | 0 (0.0%) | 3 (2.5%) |
| 16 and 17 Years | 0 (0.0%) | 0 (0.0%) |
| 18 to 24 Years | 9 (1.0%) | 16 (4.3%) |
| 25 to 34 Years | 132 (9.7%) | 122 (8.6%) |
| 35 to 44 Years | 37 (2.4%) | 34 (2.0%) |
| 45 to 54 Years | 62 (4.2%) | 44 (2.4%) |
| 55 to 64 Years | 0 (0.0%) | 49 (5.2%) |
| 65 to 74 Years | 19 (2.1%) | 25 (2.0%) |
| 75 Years and over | 10 (3.8%) | 19 (6.7%) |
| Total | 273 (2.7%) | 469 (4.3%) |
Income Above Poverty by Sex and Age in Helena
According to the poverty statistics in Helena, males aged 5 years and females aged 12 to 14 years are the age groups that are most secure financially, with 100.0% of males and 100.0% of females in these age groups living above the poverty line.
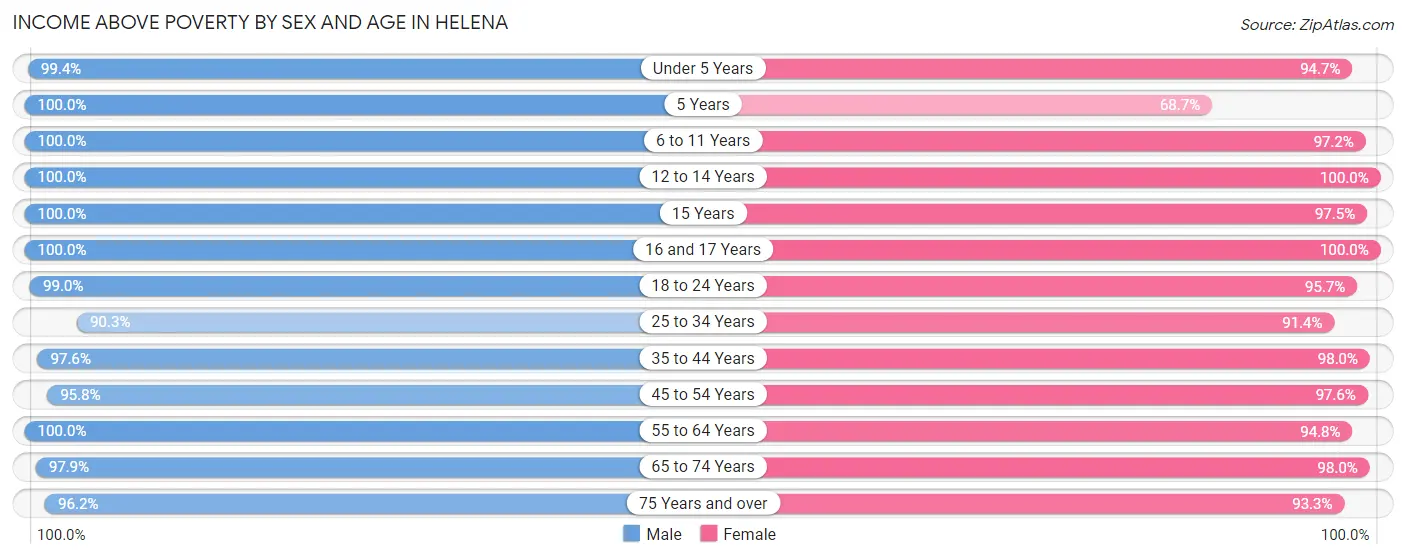
| Age Bracket | Male | Female |
| Under 5 Years | 642 (99.4%) | 576 (94.7%) |
| 5 Years | 97 (100.0%) | 202 (68.7%) |
| 6 to 11 Years | 609 (100.0%) | 1,164 (97.2%) |
| 12 to 14 Years | 603 (100.0%) | 560 (100.0%) |
| 15 Years | 218 (100.0%) | 116 (97.5%) |
| 16 and 17 Years | 342 (100.0%) | 363 (100.0%) |
| 18 to 24 Years | 868 (99.0%) | 352 (95.7%) |
| 25 to 34 Years | 1,224 (90.3%) | 1,300 (91.4%) |
| 35 to 44 Years | 1,495 (97.6%) | 1,674 (98.0%) |
| 45 to 54 Years | 1,409 (95.8%) | 1,800 (97.6%) |
| 55 to 64 Years | 1,079 (100.0%) | 887 (94.8%) |
| 65 to 74 Years | 893 (97.9%) | 1,207 (98.0%) |
| 75 Years and over | 252 (96.2%) | 263 (93.3%) |
| Total | 9,731 (97.3%) | 10,464 (95.7%) |
Income Below Poverty Among Married-Couple Families in Helena
The poverty statistics for married-couple families in Helena show that 2.2% or 106 of the total 4,849 families live below the poverty line. Families with no children have the highest poverty rate of 4.5%, comprising of 106 families. On the other hand, families with 1 or 2 children have the lowest poverty rate of 0.0%, which includes 0 families.
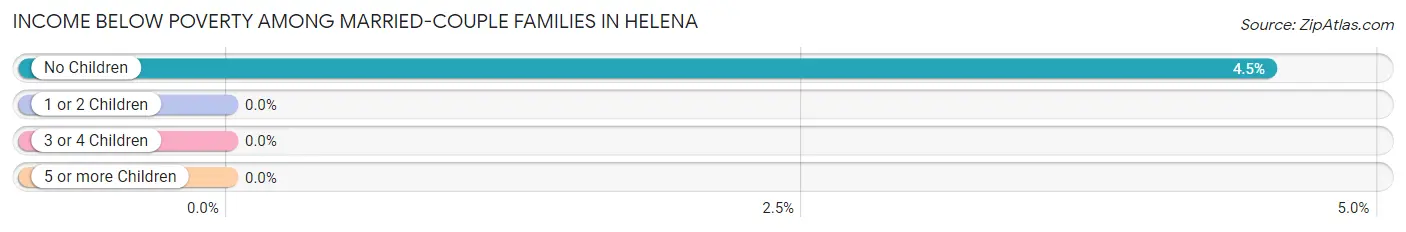
| Children | Above Poverty | Below Poverty |
| No Children | 2,237 (95.5%) | 106 (4.5%) |
| 1 or 2 Children | 2,232 (100.0%) | 0 (0.0%) |
| 3 or 4 Children | 256 (100.0%) | 0 (0.0%) |
| 5 or more Children | 18 (100.0%) | 0 (0.0%) |
| Total | 4,743 (97.8%) | 106 (2.2%) |
Income Below Poverty Among Single-Parent Households in Helena
According to the poverty data in Helena, 9.7% or 22 single-father households and 9.9% or 54 single-mother households are living below the poverty line. Among single-father households, those with 1 or 2 children have the highest poverty rate, with 22 households (34.9%) experiencing poverty. Likewise, among single-mother households, those with 3 or 4 children have the highest poverty rate, with 30 households (40.0%) falling below the poverty line.
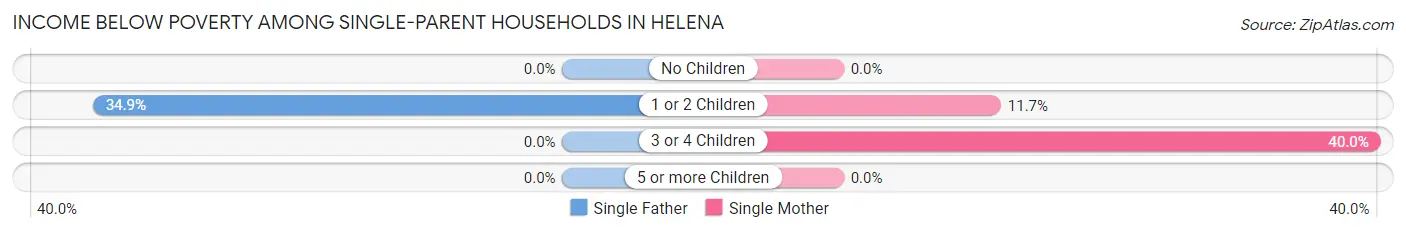
| Children | Single Father | Single Mother |
| No Children | 0 (0.0%) | 0 (0.0%) |
| 1 or 2 Children | 22 (34.9%) | 24 (11.7%) |
| 3 or 4 Children | 0 (0.0%) | 30 (40.0%) |
| 5 or more Children | 0 (0.0%) | 0 (0.0%) |
| Total | 22 (9.7%) | 54 (9.9%) |
Income Below Poverty Among Married-Couple vs Single-Parent Households in Helena
The poverty data for Helena shows that 106 of the married-couple family households (2.2%) and 76 of the single-parent households (9.9%) are living below the poverty level. Within the married-couple family households, those with no children have the highest poverty rate, with 106 households (4.5%) falling below the poverty line. Among the single-parent households, those with 1 or 2 children have the highest poverty rate, with 46 household (17.2%) living below poverty.
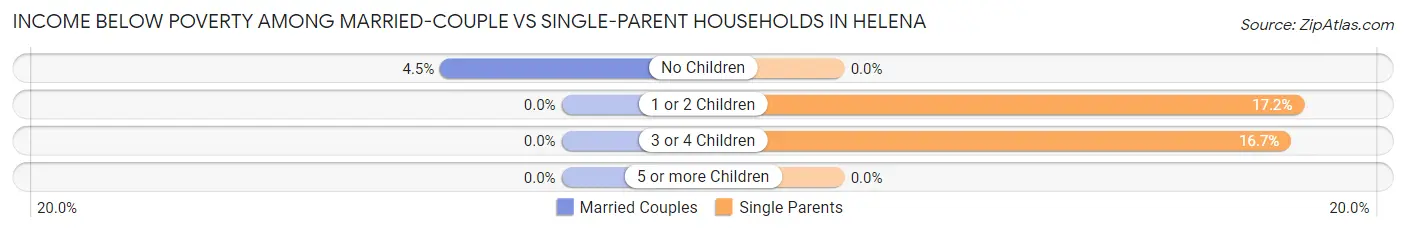
| Children | Married-Couple Families | Single-Parent Households |
| No Children | 106 (4.5%) | 0 (0.0%) |
| 1 or 2 Children | 0 (0.0%) | 46 (17.2%) |
| 3 or 4 Children | 0 (0.0%) | 30 (16.7%) |
| 5 or more Children | 0 (0.0%) | 0 (0.0%) |
| Total | 106 (2.2%) | 76 (9.9%) |
Race in Helena
The most populous races in Helena are White / Caucasian (15,393 | 73.2%), Black / African American (3,931 | 18.7%), and Two or more Races (1,081 | 5.1%).
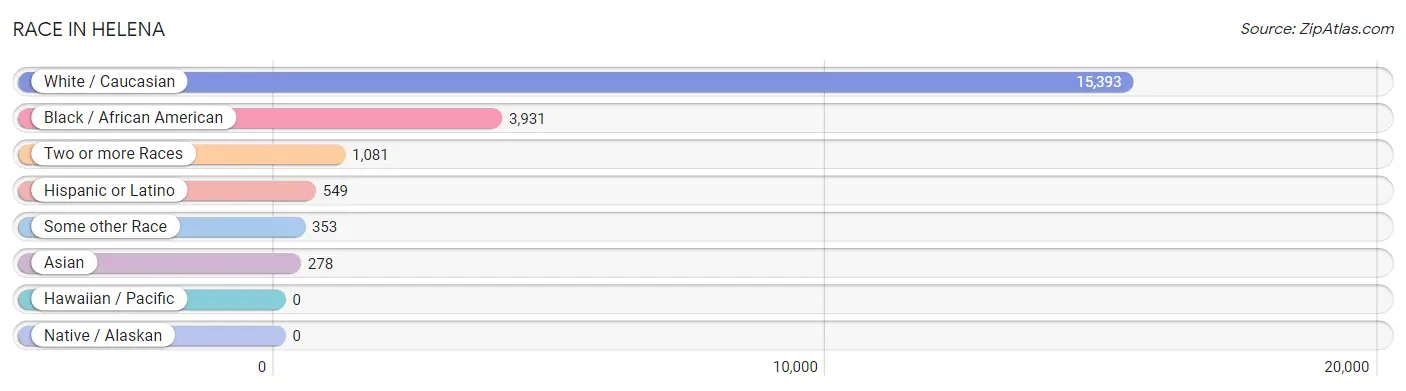
| Race | # Population | % Population |
| Asian | 278 | 1.3% |
| Black / African American | 3,931 | 18.7% |
| Hawaiian / Pacific | 0 | 0.0% |
| Hispanic or Latino | 549 | 2.6% |
| Native / Alaskan | 0 | 0.0% |
| White / Caucasian | 15,393 | 73.2% |
| Two or more Races | 1,081 | 5.1% |
| Some other Race | 353 | 1.7% |
| Total | 21,036 | 100.0% |
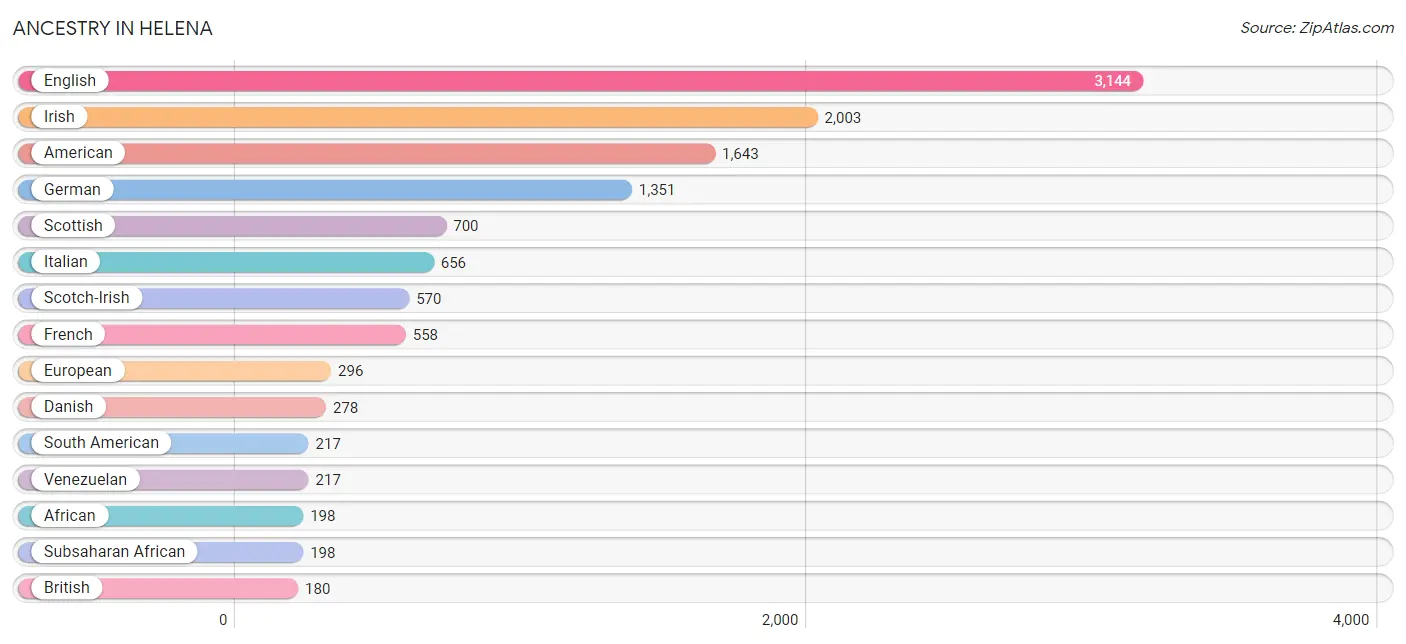
Ancestry in Helena
The most populous ancestries reported in Helena are English (3,144 | 14.9%), Irish (2,003 | 9.5%), American (1,643 | 7.8%), German (1,351 | 6.4%), and Scottish (700 | 3.3%), together accounting for 42.0% of all Helena residents.
| Ancestry | # Population | % Population |
| African | 198 | 0.9% |
| Albanian | 10 | 0.1% |
| American | 1,643 | 7.8% |
| Arab | 116 | 0.5% |
| Bhutanese | 5 | 0.0% |
| British | 180 | 0.9% |
| Canadian | 10 | 0.1% |
| Central American | 61 | 0.3% |
| Cherokee | 43 | 0.2% |
| Costa Rican | 8 | 0.0% |
| Creek | 2 | 0.0% |
| Cuban | 33 | 0.2% |
| Czech | 58 | 0.3% |
| Danish | 278 | 1.3% |
| Dominican | 46 | 0.2% |
| Dutch | 178 | 0.9% |
| Eastern European | 88 | 0.4% |
| English | 3,144 | 14.9% |
| European | 296 | 1.4% |
| Finnish | 13 | 0.1% |
| French | 558 | 2.6% |
| French Canadian | 31 | 0.2% |
| German | 1,351 | 6.4% |
| Greek | 71 | 0.3% |
| Hungarian | 61 | 0.3% |
| Indian (Asian) | 168 | 0.8% |
| Iranian | 16 | 0.1% |
| Irish | 2,003 | 9.5% |
| Italian | 656 | 3.1% |
| Jamaican | 27 | 0.1% |
| Korean | 144 | 0.7% |
| Lebanese | 107 | 0.5% |
| Mexican | 134 | 0.6% |
| Moroccan | 9 | 0.0% |
| Northern European | 106 | 0.5% |
| Norwegian | 95 | 0.4% |
| Polish | 136 | 0.6% |
| Portuguese | 35 | 0.2% |
| Puerto Rican | 58 | 0.3% |
| Romanian | 7 | 0.0% |
| Russian | 10 | 0.1% |
| Salvadoran | 53 | 0.3% |
| Scotch-Irish | 570 | 2.7% |
| Scottish | 700 | 3.3% |
| Slovak | 65 | 0.3% |
| South American | 217 | 1.0% |
| Sri Lankan | 49 | 0.2% |
| Subsaharan African | 198 | 0.9% |
| Swedish | 67 | 0.3% |
| Swiss | 48 | 0.2% |
| Thai | 15 | 0.1% |
| Ukrainian | 52 | 0.3% |
| Venezuelan | 217 | 1.0% |
| Welsh | 115 | 0.5% | View All 54 Rows |
Immigrants in Helena
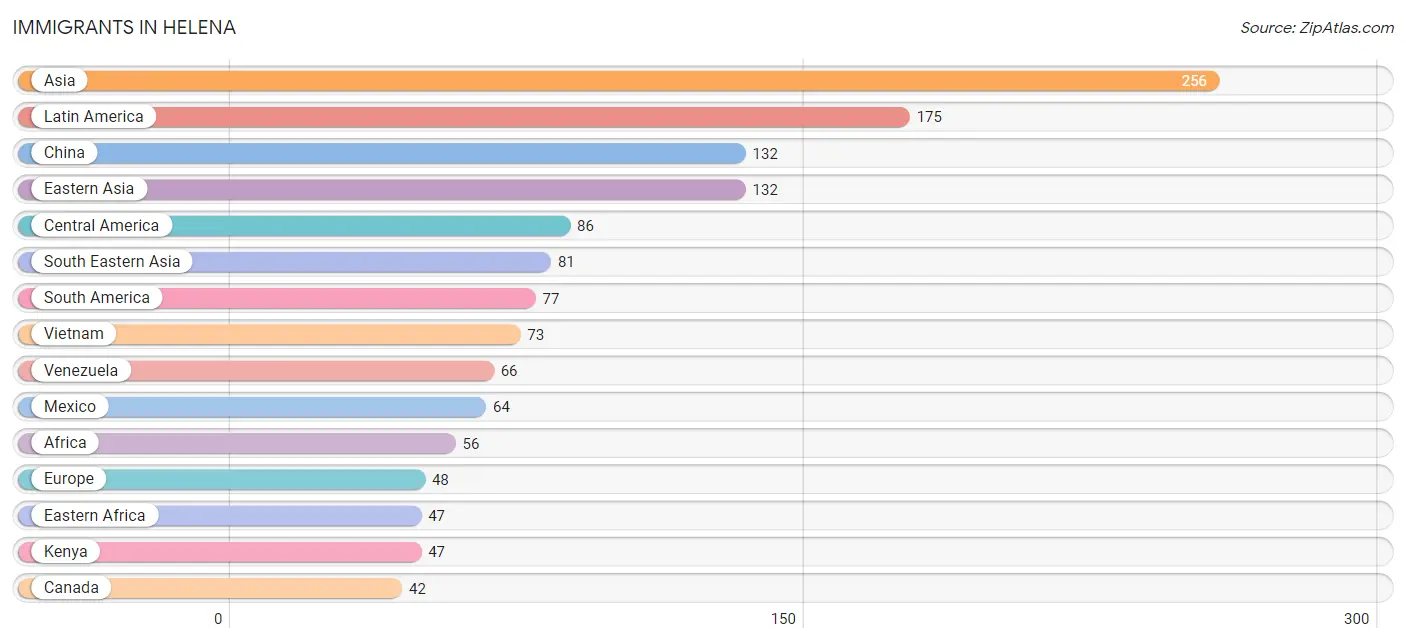
The most numerous immigrant groups reported in Helena came from Asia (256 | 1.2%), Latin America (175 | 0.8%), China (132 | 0.6%), Eastern Asia (132 | 0.6%), and Central America (86 | 0.4%), together accounting for 3.7% of all Helena residents.
| Immigration Origin | # Population | % Population |
| Africa | 56 | 0.3% |
| Asia | 256 | 1.2% |
| Canada | 42 | 0.2% |
| Caribbean | 12 | 0.1% |
| Central America | 86 | 0.4% |
| Chile | 11 | 0.1% |
| China | 132 | 0.6% |
| Czechoslovakia | 10 | 0.1% |
| Dominican Republic | 5 | 0.0% |
| Eastern Africa | 47 | 0.2% |
| Eastern Asia | 132 | 0.6% |
| Eastern Europe | 32 | 0.2% |
| El Salvador | 22 | 0.1% |
| England | 9 | 0.0% |
| Europe | 48 | 0.2% |
| Germany | 7 | 0.0% |
| Iran | 16 | 0.1% |
| Jamaica | 7 | 0.0% |
| Kenya | 47 | 0.2% |
| Latin America | 175 | 0.8% |
| Lebanon | 19 | 0.1% |
| Mexico | 64 | 0.3% |
| Morocco | 9 | 0.0% |
| Northern Africa | 9 | 0.0% |
| Northern Europe | 9 | 0.0% |
| Philippines | 8 | 0.0% |
| South America | 77 | 0.4% |
| South Central Asia | 16 | 0.1% |
| South Eastern Asia | 81 | 0.4% |
| Ukraine | 22 | 0.1% |
| Venezuela | 66 | 0.3% |
| Vietnam | 73 | 0.4% |
| Western Asia | 27 | 0.1% |
| Western Europe | 7 | 0.0% | View All 34 Rows |
Sex and Age in Helena
Sex and Age in Helena
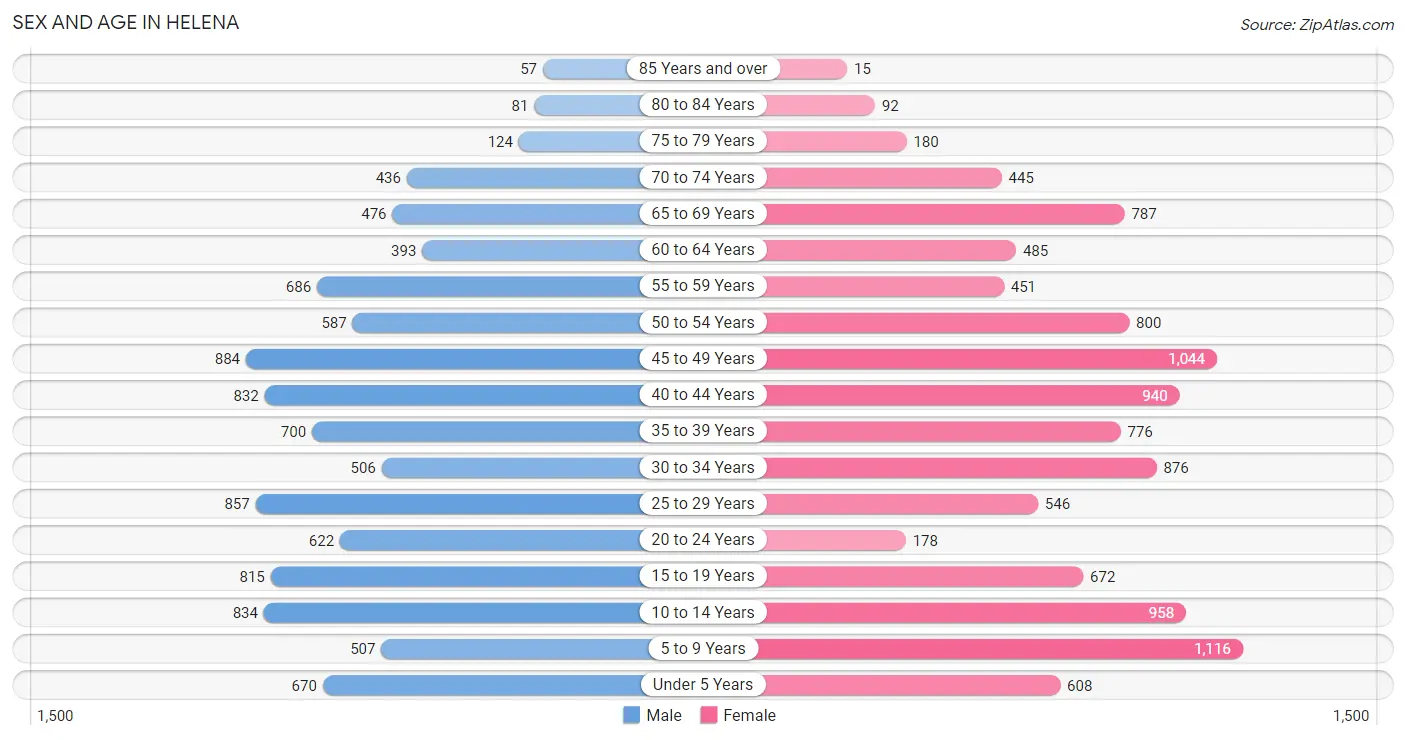
The most populous age groups in Helena are 45 to 49 Years (884 | 8.8%) for men and 5 to 9 Years (1,116 | 10.2%) for women.
| Age Bracket | Male | Female |
| Under 5 Years | 670 (6.7%) | 608 (5.5%) |
| 5 to 9 Years | 507 (5.0%) | 1,116 (10.2%) |
| 10 to 14 Years | 834 (8.3%) | 958 (8.7%) |
| 15 to 19 Years | 815 (8.1%) | 672 (6.1%) |
| 20 to 24 Years | 622 (6.2%) | 178 (1.6%) |
| 25 to 29 Years | 857 (8.5%) | 546 (5.0%) |
| 30 to 34 Years | 506 (5.0%) | 876 (8.0%) |
| 35 to 39 Years | 700 (7.0%) | 776 (7.1%) |
| 40 to 44 Years | 832 (8.3%) | 940 (8.6%) |
| 45 to 49 Years | 884 (8.8%) | 1,044 (9.5%) |
| 50 to 54 Years | 587 (5.8%) | 800 (7.3%) |
| 55 to 59 Years | 686 (6.8%) | 451 (4.1%) |
| 60 to 64 Years | 393 (3.9%) | 485 (4.4%) |
| 65 to 69 Years | 476 (4.7%) | 787 (7.2%) |
| 70 to 74 Years | 436 (4.3%) | 445 (4.1%) |
| 75 to 79 Years | 124 (1.2%) | 180 (1.6%) |
| 80 to 84 Years | 81 (0.8%) | 92 (0.8%) |
| 85 Years and over | 57 (0.6%) | 15 (0.1%) |
| Total | 10,067 (100.0%) | 10,969 (100.0%) |
Families and Households in Helena
Median Family Size in Helena
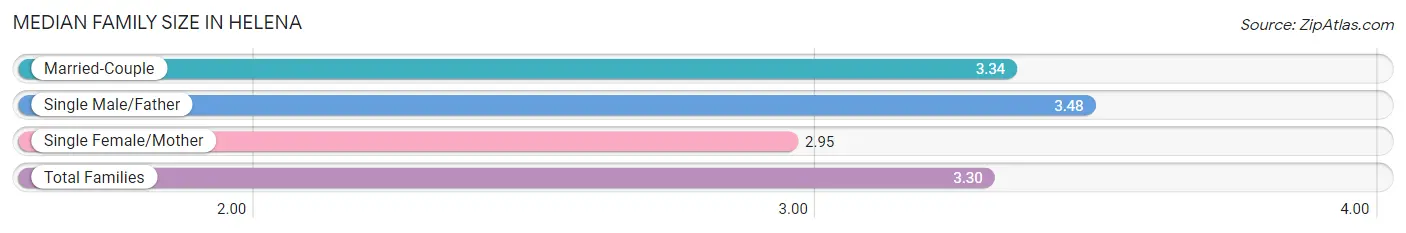
The median family size in Helena is 3.30 persons per family, with single male/father families (227 | 4.0%) accounting for the largest median family size of 3.48 persons per family. On the other hand, single female/mother families (544 | 9.7%) represent the smallest median family size with 2.95 persons per family.
| Family Type | # Families | Family Size |
| Married-Couple | 4,849 (86.3%) | 3.34 |
| Single Male/Father | 227 (4.0%) | 3.48 |
| Single Female/Mother | 544 (9.7%) | 2.95 |
| Total Families | 5,620 (100.0%) | 3.30 |
Median Household Size in Helena
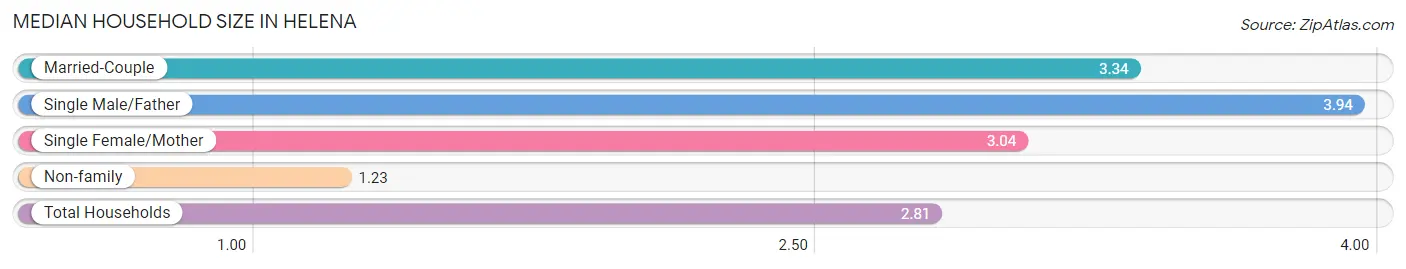
The median household size in Helena is 2.81 persons per household, with single male/father households (227 | 3.0%) accounting for the largest median household size of 3.94 persons per household. non-family households (1,860 | 24.9%) represent the smallest median household size with 1.23 persons per household.
| Household Type | # Households | Household Size |
| Married-Couple | 4,849 (64.8%) | 3.34 |
| Single Male/Father | 227 (3.0%) | 3.94 |
| Single Female/Mother | 544 (7.3%) | 3.04 |
| Non-family | 1,860 (24.9%) | 1.23 |
| Total Households | 7,480 (100.0%) | 2.81 |
Household Size by Marriage Status in Helena
Out of a total of 7,480 households in Helena, 5,620 (75.1%) are family households, while 1,860 (24.9%) are nonfamily households. The most numerous type of family households are 2-person households, comprising 2,195, and the most common type of nonfamily households are 1-person households, comprising 1,575.
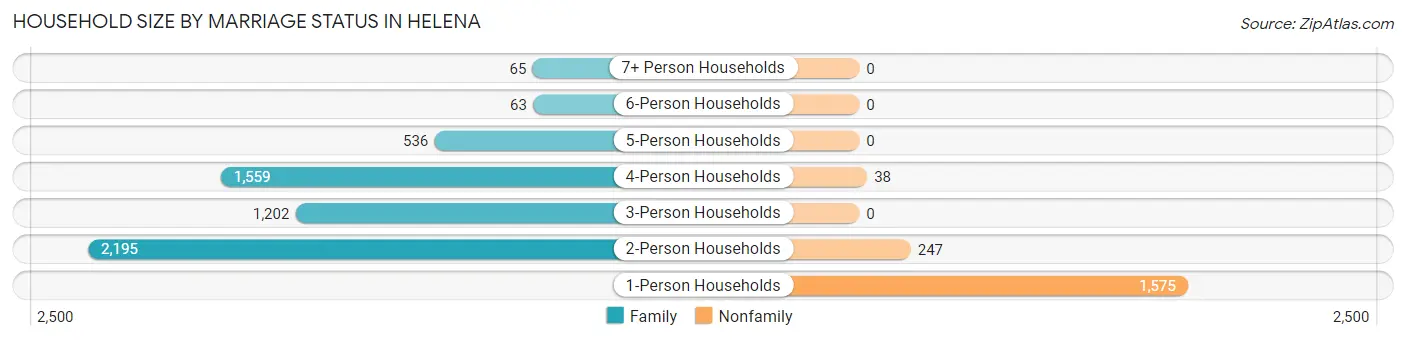
| Household Size | Family Households | Nonfamily Households |
| 1-Person Households | - | 1,575 (21.1%) |
| 2-Person Households | 2,195 (29.3%) | 247 (3.3%) |
| 3-Person Households | 1,202 (16.1%) | 0 (0.0%) |
| 4-Person Households | 1,559 (20.8%) | 38 (0.5%) |
| 5-Person Households | 536 (7.2%) | 0 (0.0%) |
| 6-Person Households | 63 (0.8%) | 0 (0.0%) |
| 7+ Person Households | 65 (0.9%) | 0 (0.0%) |
| Total | 5,620 (75.1%) | 1,860 (24.9%) |
Female Fertility in Helena
Fertility by Age in Helena
Average fertility rate in Helena is 45.0 births per 1,000 women. Women in the age bracket of 20 to 34 years have the highest fertility rate with 82.0 births per 1,000 women. Women in the age bracket of 20 to 34 years acount for 56.7% of all women with births.
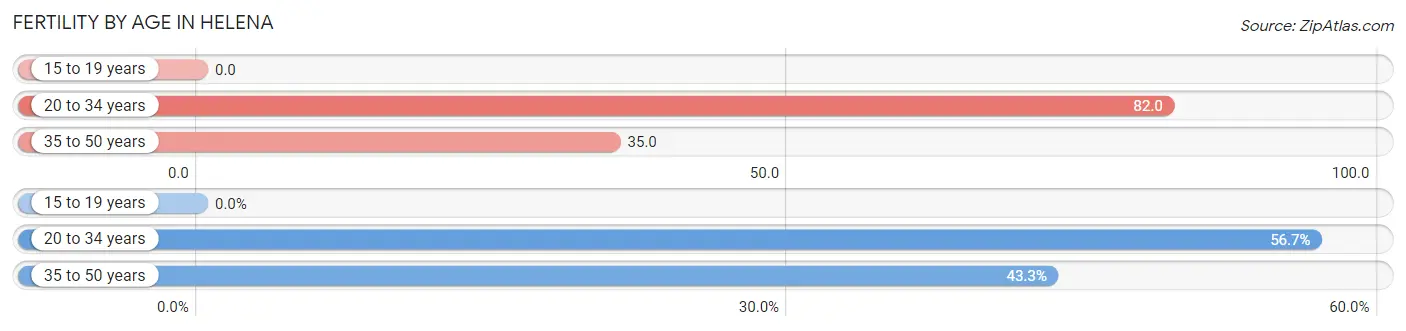
| Age Bracket | Women with Births | Births / 1,000 Women |
| 15 to 19 years | 0 (0.0%) | 0.0 |
| 20 to 34 years | 131 (56.7%) | 82.0 |
| 35 to 50 years | 100 (43.3%) | 35.0 |
| Total | 231 (100.0%) | 45.0 |
Fertility by Age by Marriage Status in Helena
90.5% of women with births (231) in Helena are married. The highest percentage of unmarried women with births falls into 20 to 34 years age bracket with 10.7% of them unmarried at the time of birth, while the lowest percentage of unmarried women with births belong to 35 to 50 years age bracket with 8.0% of them unmarried.
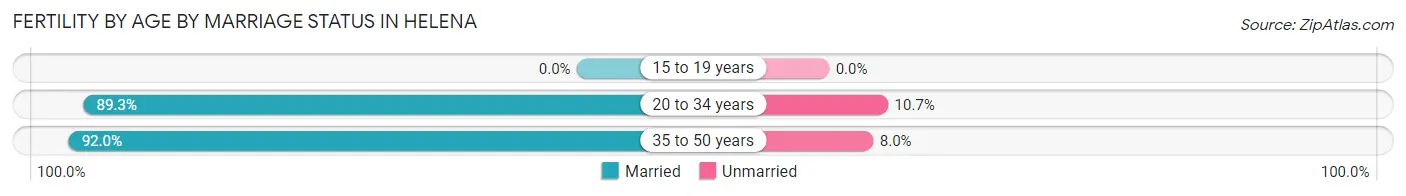
| Age Bracket | Married | Unmarried |
| 15 to 19 years | 0 (0.0%) | 0 (0.0%) |
| 20 to 34 years | 117 (89.3%) | 14 (10.7%) |
| 35 to 50 years | 92 (92.0%) | 8 (8.0%) |
| Total | 209 (90.5%) | 22 (9.5%) |
Fertility by Education in Helena
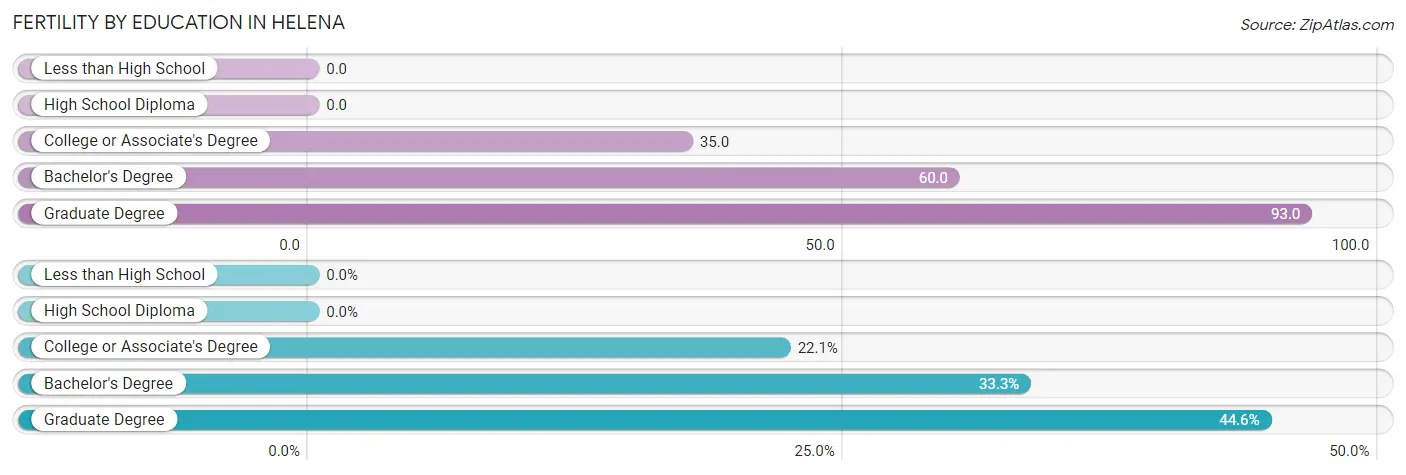
| Educational Attainment | Women with Births | Births / 1,000 Women |
| Less than High School | 0 (0.0%) | 0.0 |
| High School Diploma | 0 (0.0%) | 0.0 |
| College or Associate's Degree | 51 (22.1%) | 35.0 |
| Bachelor's Degree | 77 (33.3%) | 60.0 |
| Graduate Degree | 103 (44.6%) | 93.0 |
| Total | 231 (100.0%) | 45.0 |
Fertility by Education by Marriage Status in Helena
9.5% of women with births in Helena are unmarried. Women with the educational attainment of bachelor's degree are most likely to be married with 100.0% of them married at childbirth, while women with the educational attainment of college or associate's degree are least likely to be married with 43.1% of them unmarried at childbirth.
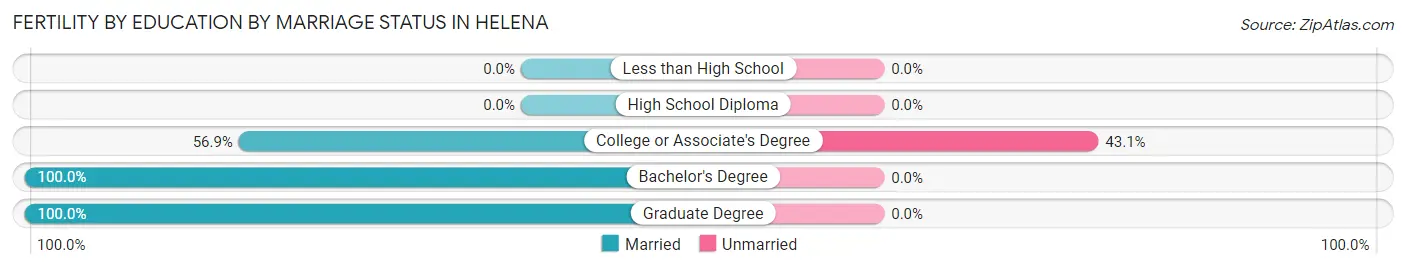
| Educational Attainment | Married | Unmarried |
| Less than High School | 0 (0.0%) | 0 (0.0%) |
| High School Diploma | 0 (0.0%) | 0 (0.0%) |
| College or Associate's Degree | 29 (56.9%) | 22 (43.1%) |
| Bachelor's Degree | 77 (100.0%) | 0 (0.0%) |
| Graduate Degree | 103 (100.0%) | 0 (0.0%) |
| Total | 209 (90.5%) | 22 (9.5%) |
Employment Characteristics in Helena
Employment by Class of Employer in Helena
Among the 10,918 employed individuals in Helena, private company employees (7,428 | 68.0%), not-for-profit organizations (909 | 8.3%), and local government employees (758 | 6.9%) make up the most common classes of employment.
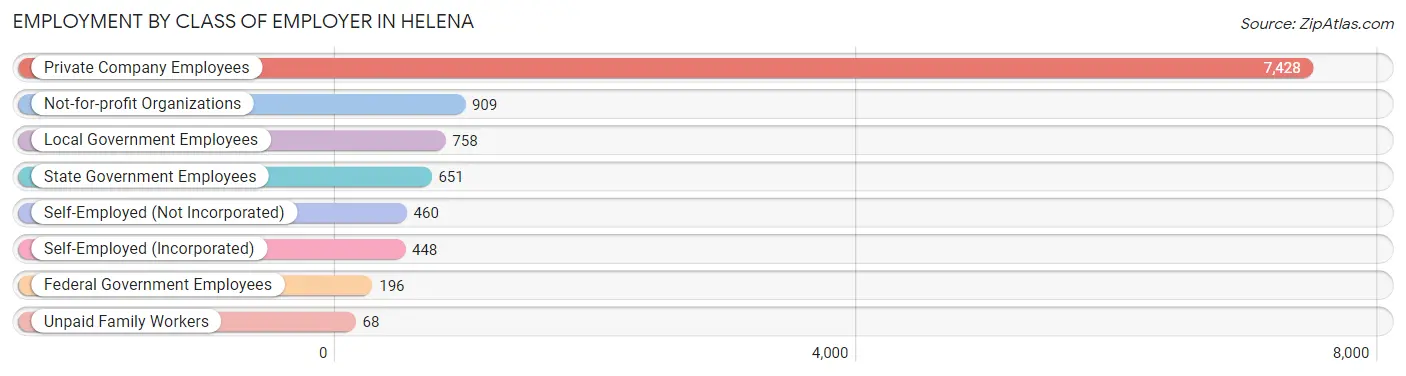
| Employer Class | # Employees | % Employees |
| Private Company Employees | 7,428 | 68.0% |
| Self-Employed (Incorporated) | 448 | 4.1% |
| Self-Employed (Not Incorporated) | 460 | 4.2% |
| Not-for-profit Organizations | 909 | 8.3% |
| Local Government Employees | 758 | 6.9% |
| State Government Employees | 651 | 6.0% |
| Federal Government Employees | 196 | 1.8% |
| Unpaid Family Workers | 68 | 0.6% |
| Total | 10,918 | 100.0% |
Employment Status by Age in Helena
According to the labor force statistics for Helena, out of the total population over 16 years of age (16,006), 70.3% or 11,252 individuals are in the labor force, with 2.1% or 236 of them unemployed. The age group with the highest labor force participation rate is 30 to 34 years, with 95.2% or 1,316 individuals in the labor force. Within the labor force, the 25 to 29 years age range has the highest percentage of unemployed individuals, with 8.8% or 106 of them being unemployed.
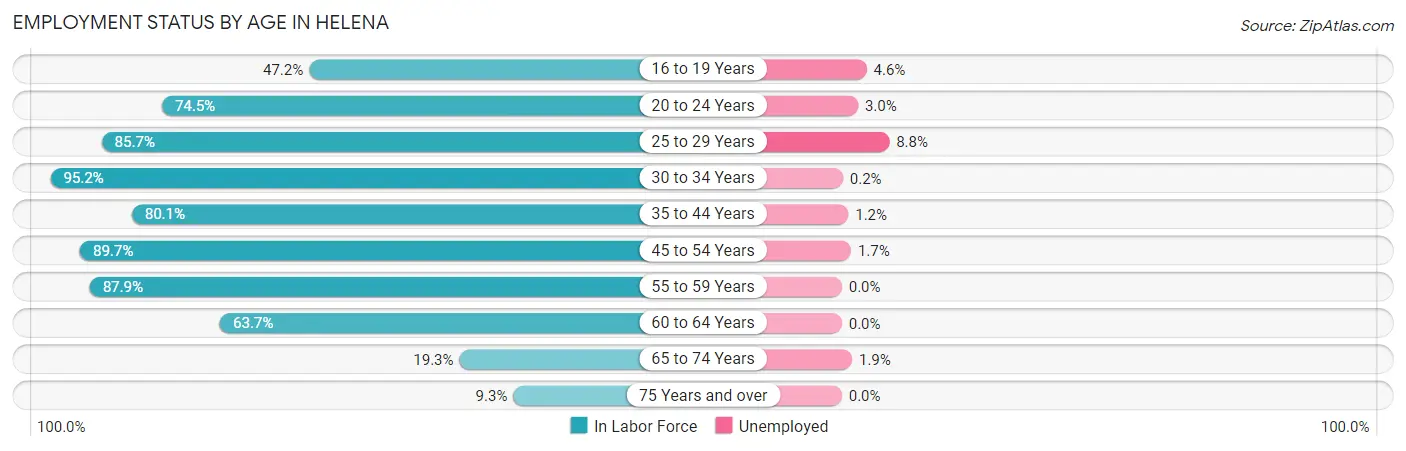
| Age Bracket | In Labor Force | Unemployed |
| 16 to 19 Years | 543 (47.2%) | 25 (4.6%) |
| 20 to 24 Years | 596 (74.5%) | 18 (3.0%) |
| 25 to 29 Years | 1,202 (85.7%) | 106 (8.8%) |
| 30 to 34 Years | 1,316 (95.2%) | 3 (0.2%) |
| 35 to 44 Years | 2,602 (80.1%) | 31 (1.2%) |
| 45 to 54 Years | 2,974 (89.7%) | 51 (1.7%) |
| 55 to 59 Years | 999 (87.9%) | 0 (0.0%) |
| 60 to 64 Years | 559 (63.7%) | 0 (0.0%) |
| 65 to 74 Years | 414 (19.3%) | 8 (1.9%) |
| 75 Years and over | 51 (9.3%) | 0 (0.0%) |
| Total | 11,252 (70.3%) | 236 (2.1%) |
Employment Status by Educational Attainment in Helena
According to labor force statistics for Helena, 84.9% of individuals (9,647) out of the total population between 25 and 64 years of age (11,363) are in the labor force, with 2.0% or 193 of them being unemployed. The group with the highest labor force participation rate are those with the educational attainment of bachelor's degree or higher, with 89.1% or 5,097 individuals in the labor force. Within the labor force, individuals with college / associate degree education have the highest percentage of unemployment, with 5.9% or 177 of them being unemployed.
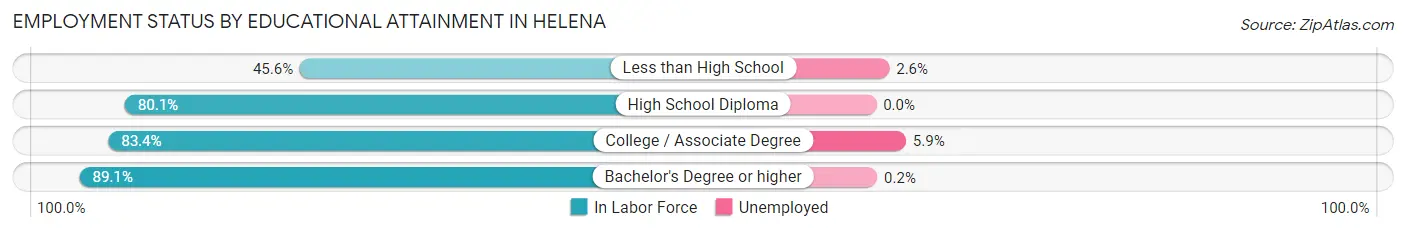
| Educational Attainment | In Labor Force | Unemployed |
| Less than High School | 115 (45.6%) | 7 (2.6%) |
| High School Diploma | 1,443 (80.1%) | 0 (0.0%) |
| College / Associate Degree | 2,993 (83.4%) | 212 (5.9%) |
| Bachelor's Degree or higher | 5,097 (89.1%) | 11 (0.2%) |
| Total | 9,647 (84.9%) | 227 (2.0%) |
Employment Occupations by Sex in Helena
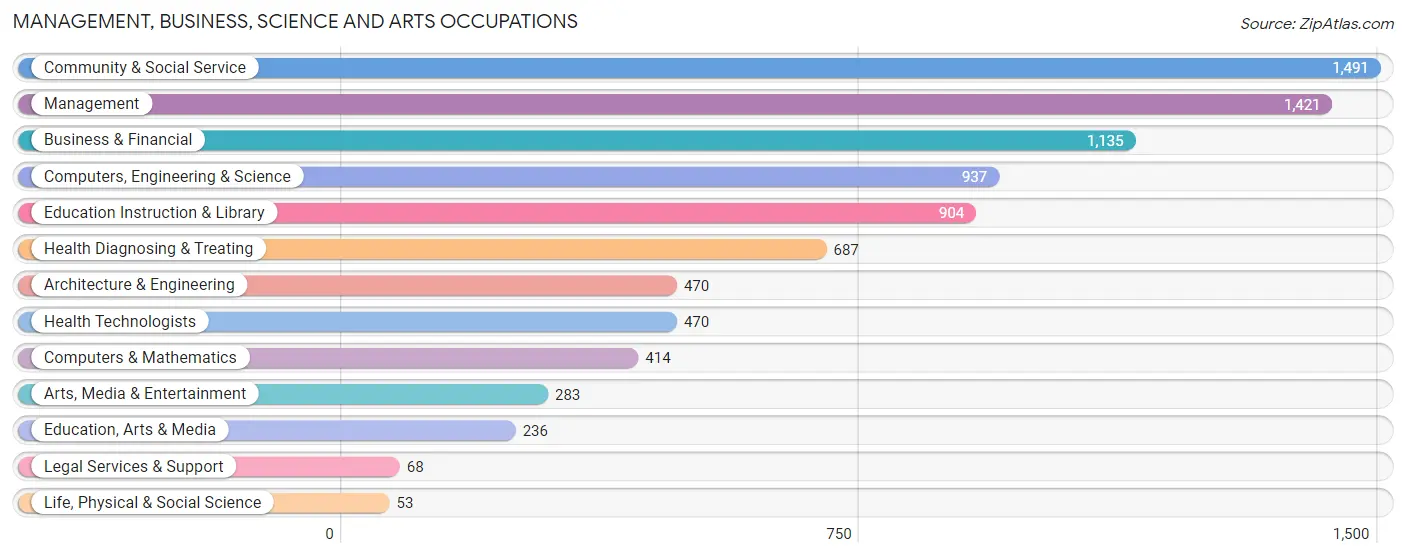
Management, Business, Science and Arts Occupations
The most common Management, Business, Science and Arts occupations in Helena are Community & Social Service (1,491 | 13.6%), Management (1,421 | 12.9%), Business & Financial (1,135 | 10.3%), Computers, Engineering & Science (937 | 8.5%), and Education Instruction & Library (904 | 8.2%).
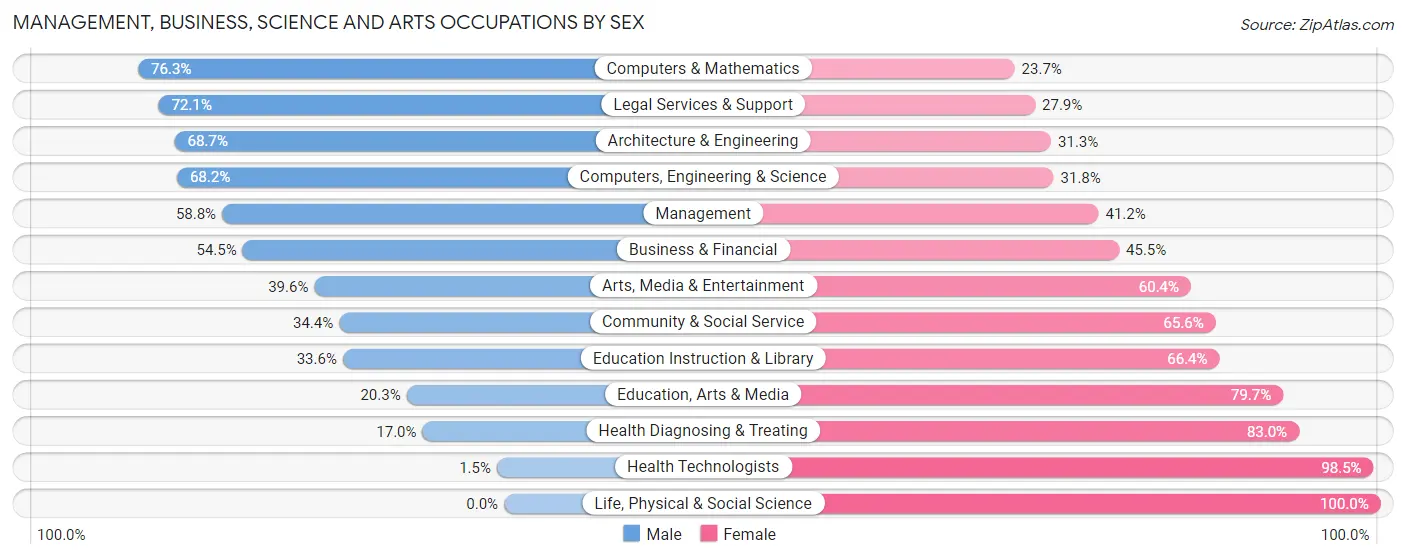
Management, Business, Science and Arts Occupations by Sex
Within the Management, Business, Science and Arts occupations in Helena, the most male-oriented occupations are Computers & Mathematics (76.3%), Legal Services & Support (72.1%), and Architecture & Engineering (68.7%), while the most female-oriented occupations are Life, Physical & Social Science (100.0%), Health Technologists (98.5%), and Health Diagnosing & Treating (83.0%).
| Occupation | Male | Female |
| Management | 836 (58.8%) | 585 (41.2%) |
| Business & Financial | 619 (54.5%) | 516 (45.5%) |
| Computers, Engineering & Science | 639 (68.2%) | 298 (31.8%) |
| Computers & Mathematics | 316 (76.3%) | 98 (23.7%) |
| Architecture & Engineering | 323 (68.7%) | 147 (31.3%) |
| Life, Physical & Social Science | 0 (0.0%) | 53 (100.0%) |
| Community & Social Service | 513 (34.4%) | 978 (65.6%) |
| Education, Arts & Media | 48 (20.3%) | 188 (79.7%) |
| Legal Services & Support | 49 (72.1%) | 19 (27.9%) |
| Education Instruction & Library | 304 (33.6%) | 600 (66.4%) |
| Arts, Media & Entertainment | 112 (39.6%) | 171 (60.4%) |
| Health Diagnosing & Treating | 117 (17.0%) | 570 (83.0%) |
| Health Technologists | 7 (1.5%) | 463 (98.5%) |
| Total (Category) | 2,724 (48.0%) | 2,947 (52.0%) |
| Total (Overall) | 6,031 (54.8%) | 4,966 (45.2%) |
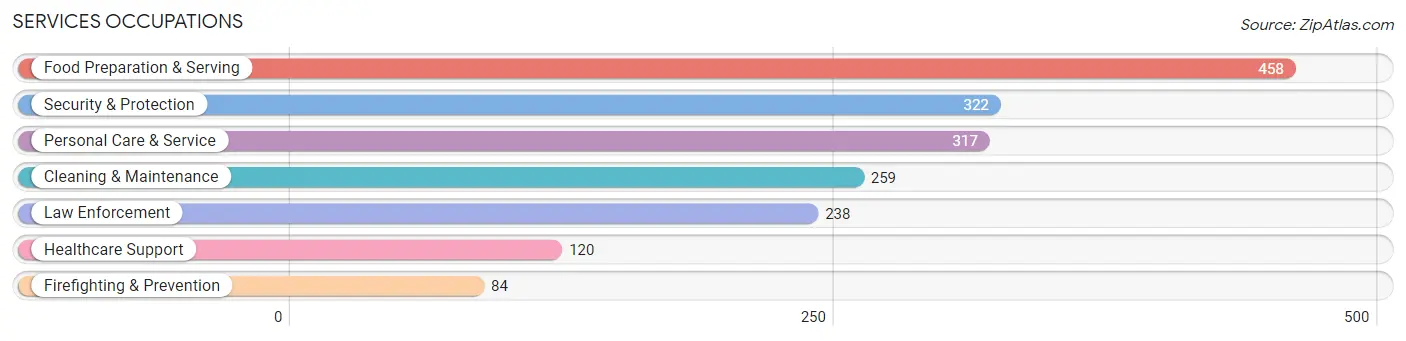
Services Occupations
The most common Services occupations in Helena are Food Preparation & Serving (458 | 4.2%), Security & Protection (322 | 2.9%), Personal Care & Service (317 | 2.9%), Cleaning & Maintenance (259 | 2.4%), and Law Enforcement (238 | 2.2%).
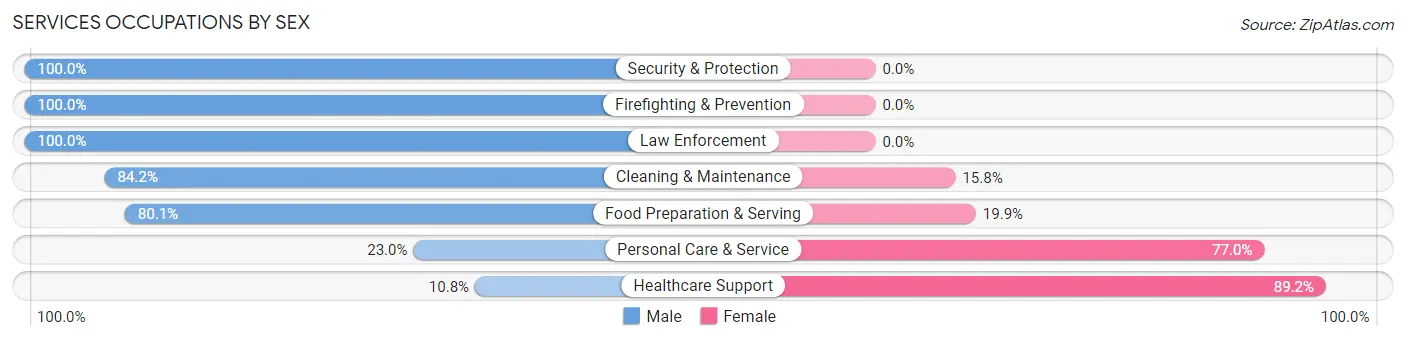
Services Occupations by Sex
Within the Services occupations in Helena, the most male-oriented occupations are Security & Protection (100.0%), Firefighting & Prevention (100.0%), and Law Enforcement (100.0%), while the most female-oriented occupations are Healthcare Support (89.2%), Personal Care & Service (77.0%), and Food Preparation & Serving (19.9%).
| Occupation | Male | Female |
| Healthcare Support | 13 (10.8%) | 107 (89.2%) |
| Security & Protection | 322 (100.0%) | 0 (0.0%) |
| Firefighting & Prevention | 84 (100.0%) | 0 (0.0%) |
| Law Enforcement | 238 (100.0%) | 0 (0.0%) |
| Food Preparation & Serving | 367 (80.1%) | 91 (19.9%) |
| Cleaning & Maintenance | 218 (84.2%) | 41 (15.8%) |
| Personal Care & Service | 73 (23.0%) | 244 (77.0%) |
| Total (Category) | 993 (67.3%) | 483 (32.7%) |
| Total (Overall) | 6,031 (54.8%) | 4,966 (45.2%) |
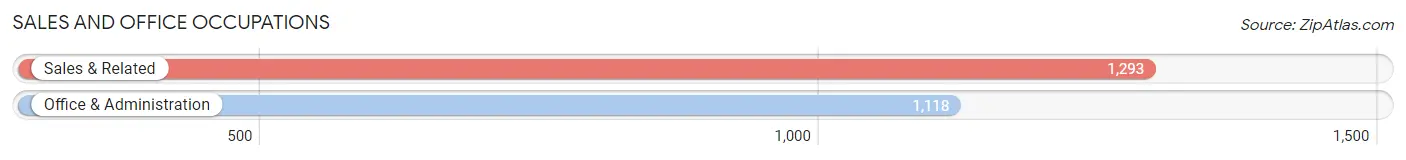
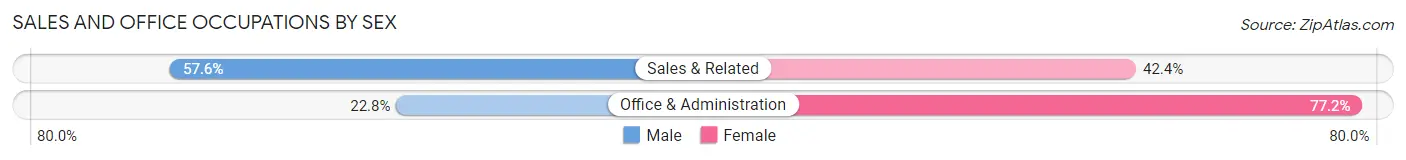
Sales and Office Occupations
The most common Sales and Office occupations in Helena are Sales & Related (1,293 | 11.8%), and Office & Administration (1,118 | 10.2%).
Sales and Office Occupations by Sex
| Occupation | Male | Female |
| Sales & Related | 745 (57.6%) | 548 (42.4%) |
| Office & Administration | 255 (22.8%) | 863 (77.2%) |
| Total (Category) | 1,000 (41.5%) | 1,411 (58.5%) |
| Total (Overall) | 6,031 (54.8%) | 4,966 (45.2%) |
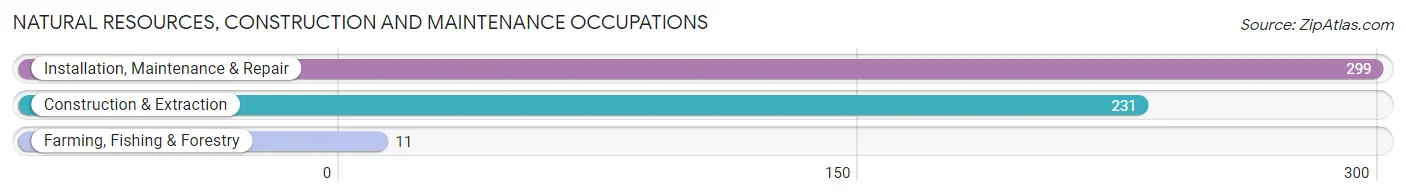
Natural Resources, Construction and Maintenance Occupations
The most common Natural Resources, Construction and Maintenance occupations in Helena are Installation, Maintenance & Repair (299 | 2.7%), Construction & Extraction (231 | 2.1%), and Farming, Fishing & Forestry (11 | 0.1%).
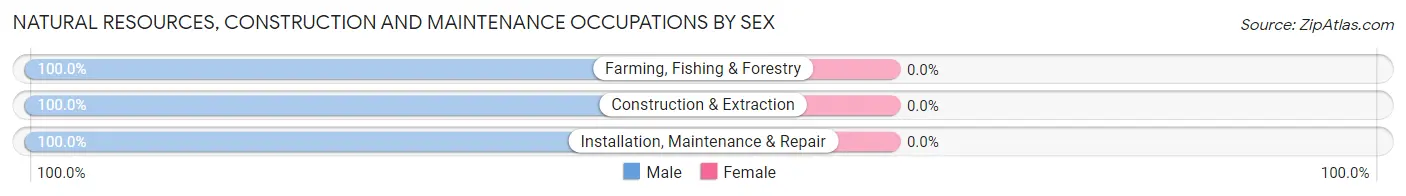
Natural Resources, Construction and Maintenance Occupations by Sex
| Occupation | Male | Female |
| Farming, Fishing & Forestry | 11 (100.0%) | 0 (0.0%) |
| Construction & Extraction | 231 (100.0%) | 0 (0.0%) |
| Installation, Maintenance & Repair | 299 (100.0%) | 0 (0.0%) |
| Total (Category) | 541 (100.0%) | 0 (0.0%) |
| Total (Overall) | 6,031 (54.8%) | 4,966 (45.2%) |
Production, Transportation and Moving Occupations
The most common Production, Transportation and Moving occupations in Helena are Production (336 | 3.1%), Material Moving (335 | 3.0%), and Transportation (227 | 2.1%).
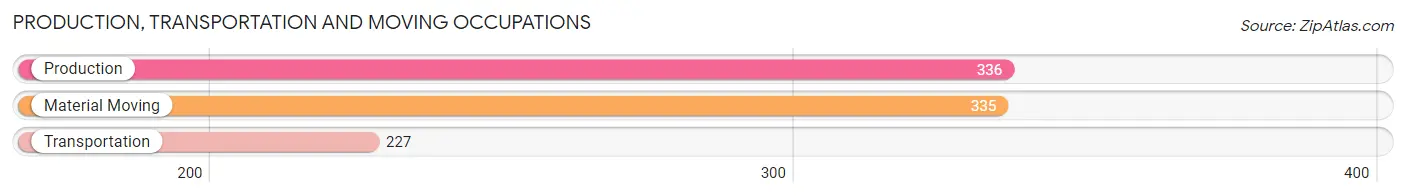
Production, Transportation and Moving Occupations by Sex
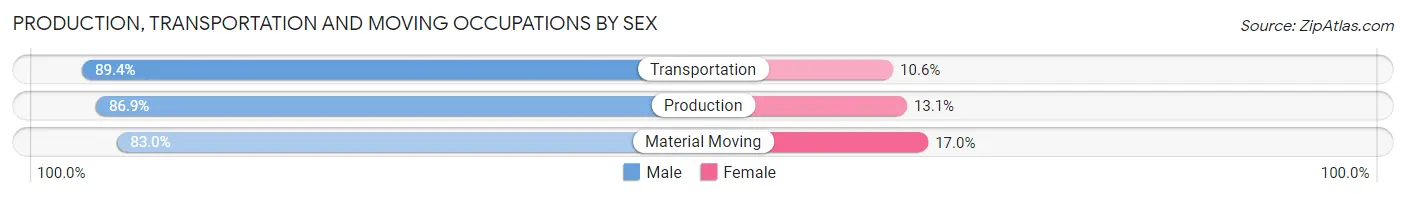
| Occupation | Male | Female |
| Production | 292 (86.9%) | 44 (13.1%) |
| Transportation | 203 (89.4%) | 24 (10.6%) |
| Material Moving | 278 (83.0%) | 57 (17.0%) |
| Total (Category) | 773 (86.1%) | 125 (13.9%) |
| Total (Overall) | 6,031 (54.8%) | 4,966 (45.2%) |
Employment Industries by Sex in Helena
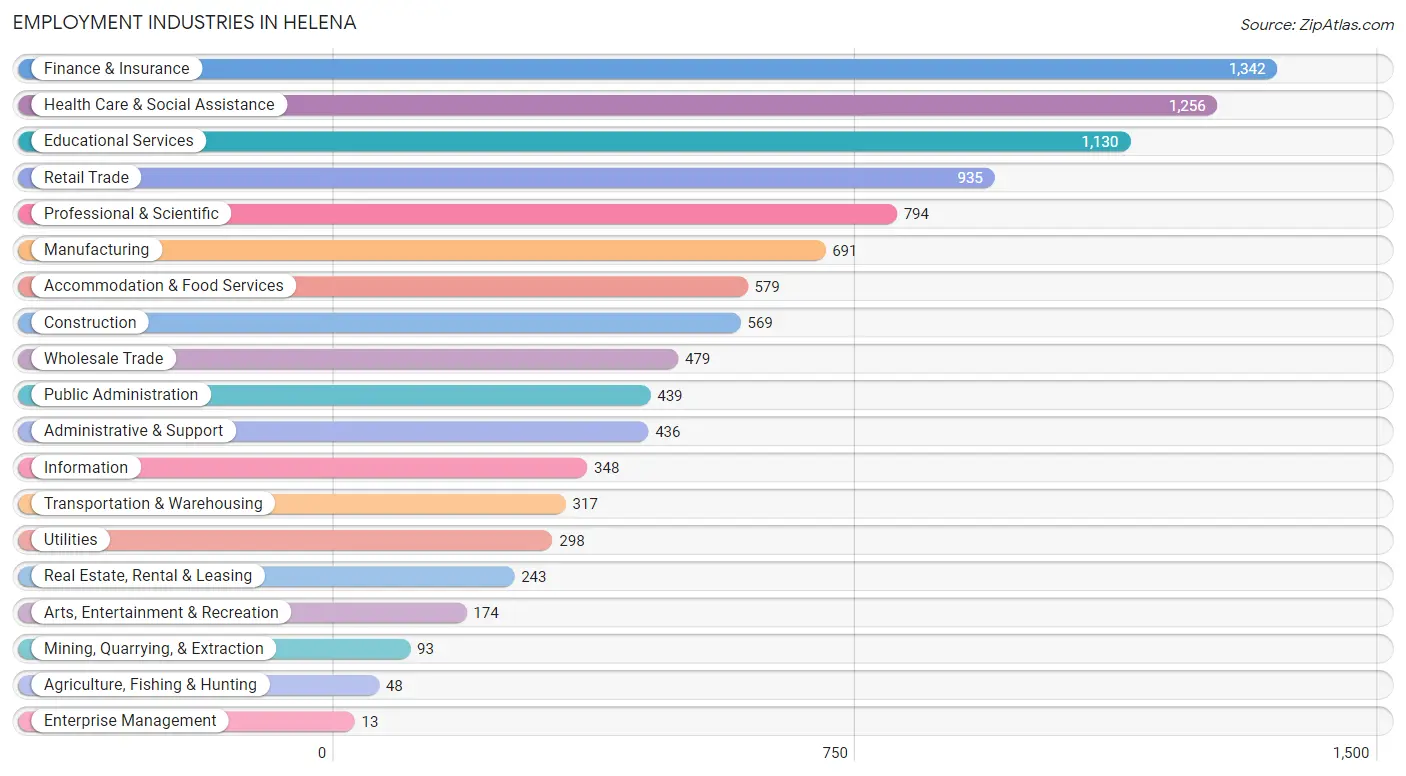
Employment Industries in Helena
The major employment industries in Helena include Finance & Insurance (1,342 | 12.2%), Health Care & Social Assistance (1,256 | 11.4%), Educational Services (1,130 | 10.3%), Retail Trade (935 | 8.5%), and Professional & Scientific (794 | 7.2%).
Employment Industries by Sex in Helena
The Helena industries that see more men than women are Agriculture, Fishing & Hunting (100.0%), Enterprise Management (100.0%), and Construction (96.5%), whereas the industries that tend to have a higher number of women are Health Care & Social Assistance (78.1%), Educational Services (60.6%), and Finance & Insurance (58.8%).
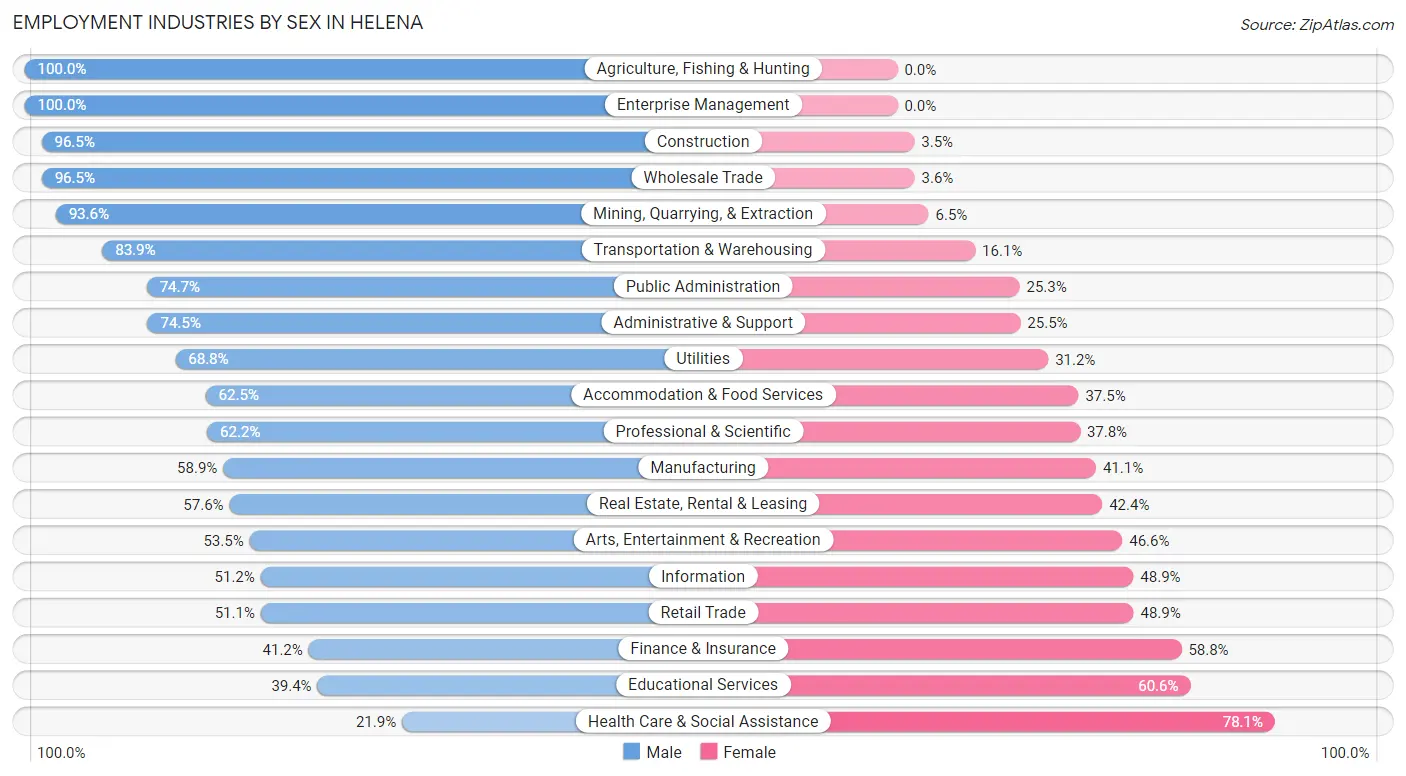
| Industry | Male | Female |
| Agriculture, Fishing & Hunting | 48 (100.0%) | 0 (0.0%) |
| Mining, Quarrying, & Extraction | 87 (93.5%) | 6 (6.5%) |
| Construction | 549 (96.5%) | 20 (3.5%) |
| Manufacturing | 407 (58.9%) | 284 (41.1%) |
| Wholesale Trade | 462 (96.5%) | 17 (3.5%) |
| Retail Trade | 478 (51.1%) | 457 (48.9%) |
| Transportation & Warehousing | 266 (83.9%) | 51 (16.1%) |
| Utilities | 205 (68.8%) | 93 (31.2%) |
| Information | 178 (51.1%) | 170 (48.8%) |
| Finance & Insurance | 553 (41.2%) | 789 (58.8%) |
| Real Estate, Rental & Leasing | 140 (57.6%) | 103 (42.4%) |
| Professional & Scientific | 494 (62.2%) | 300 (37.8%) |
| Enterprise Management | 13 (100.0%) | 0 (0.0%) |
| Administrative & Support | 325 (74.5%) | 111 (25.5%) |
| Educational Services | 445 (39.4%) | 685 (60.6%) |
| Health Care & Social Assistance | 275 (21.9%) | 981 (78.1%) |
| Arts, Entertainment & Recreation | 93 (53.4%) | 81 (46.6%) |
| Accommodation & Food Services | 362 (62.5%) | 217 (37.5%) |
| Public Administration | 328 (74.7%) | 111 (25.3%) |
| Total | 6,031 (54.8%) | 4,966 (45.2%) |
Education in Helena
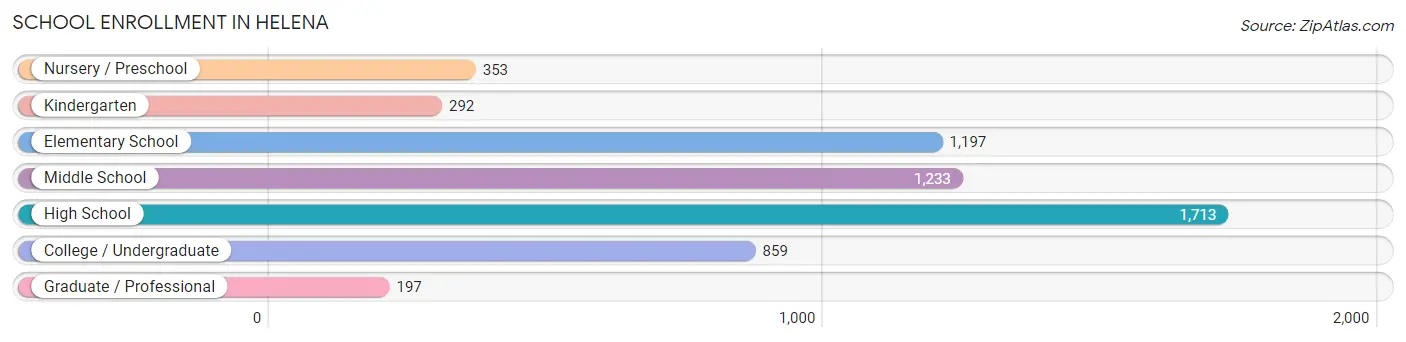
School Enrollment in Helena
The most common levels of schooling among the 5,844 students in Helena are high school (1,713 | 29.3%), middle school (1,233 | 21.1%), and elementary school (1,197 | 20.5%).
| School Level | # Students | % Students |
| Nursery / Preschool | 353 | 6.0% |
| Kindergarten | 292 | 5.0% |
| Elementary School | 1,197 | 20.5% |
| Middle School | 1,233 | 21.1% |
| High School | 1,713 | 29.3% |
| College / Undergraduate | 859 | 14.7% |
| Graduate / Professional | 197 | 3.4% |
| Total | 5,844 | 100.0% |
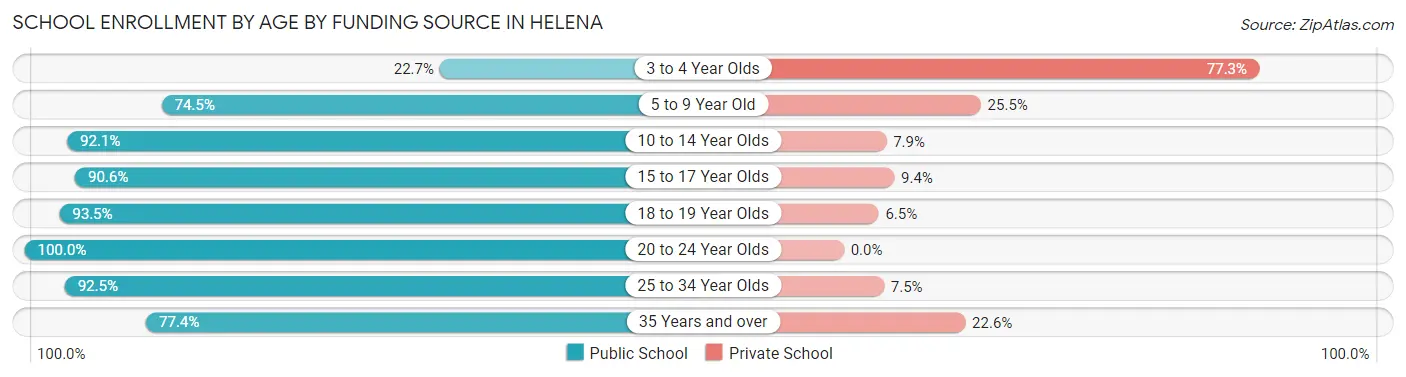
School Enrollment by Age by Funding Source in Helena
Out of a total of 5,844 students who are enrolled in schools in Helena, 871 (14.9%) attend a private institution, while the remaining 4,973 (85.1%) are enrolled in public schools. The age group of 3 to 4 year olds has the highest likelihood of being enrolled in private schools, with 116 (77.3% in the age bracket) enrolled. Conversely, the age group of 20 to 24 year olds has the lowest likelihood of being enrolled in a private school, with 325 (100.0% in the age bracket) attending a public institution.
| Age Bracket | Public School | Private School |
| 3 to 4 Year Olds | 34 (22.7%) | 116 (77.3%) |
| 5 to 9 Year Old | 1,147 (74.5%) | 393 (25.5%) |
| 10 to 14 Year Olds | 1,625 (92.1%) | 140 (7.9%) |
| 15 to 17 Year Olds | 944 (90.6%) | 98 (9.4%) |
| 18 to 19 Year Olds | 375 (93.5%) | 26 (6.5%) |
| 20 to 24 Year Olds | 325 (100.0%) | 0 (0.0%) |
| 25 to 34 Year Olds | 272 (92.5%) | 22 (7.5%) |
| 35 Years and over | 253 (77.4%) | 74 (22.6%) |
| Total | 4,973 (85.1%) | 871 (14.9%) |
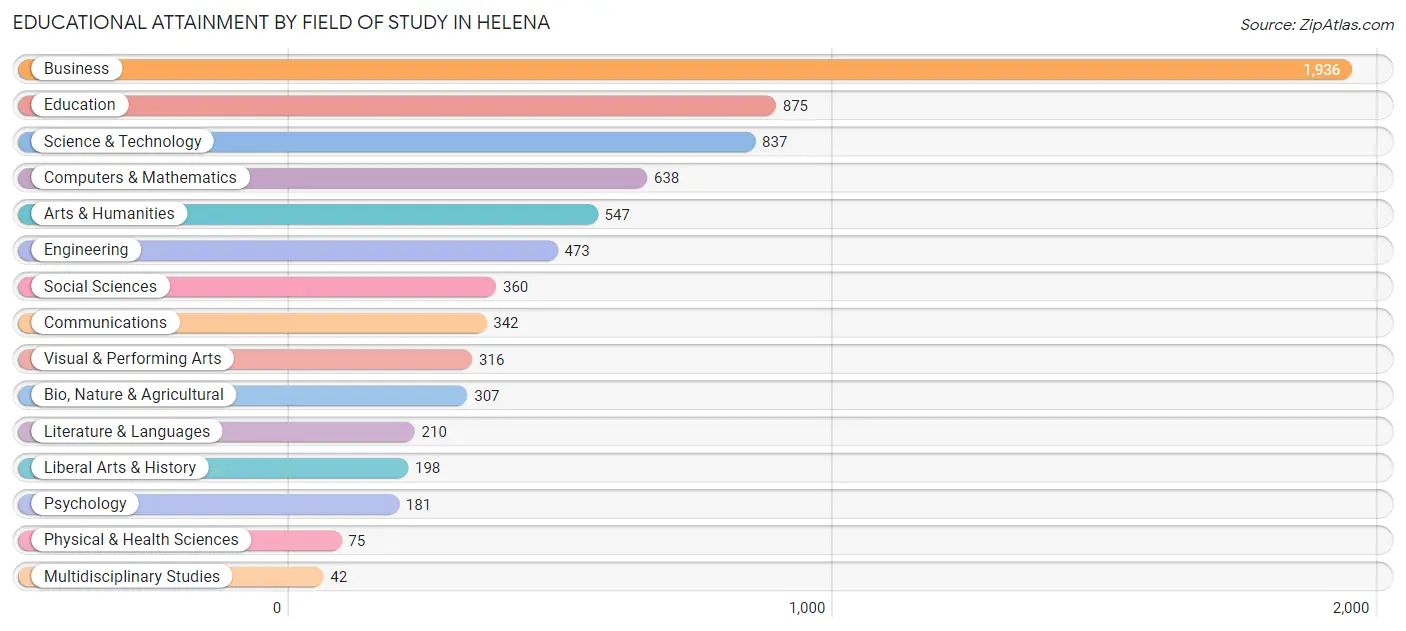
Educational Attainment by Field of Study in Helena
Business (1,936 | 26.4%), education (875 | 11.9%), science & technology (837 | 11.4%), computers & mathematics (638 | 8.7%), and arts & humanities (547 | 7.5%) are the most common fields of study among 7,337 individuals in Helena who have obtained a bachelor's degree or higher.
| Field of Study | # Graduates | % Graduates |
| Computers & Mathematics | 638 | 8.7% |
| Bio, Nature & Agricultural | 307 | 4.2% |
| Physical & Health Sciences | 75 | 1.0% |
| Psychology | 181 | 2.5% |
| Social Sciences | 360 | 4.9% |
| Engineering | 473 | 6.5% |
| Multidisciplinary Studies | 42 | 0.6% |
| Science & Technology | 837 | 11.4% |
| Business | 1,936 | 26.4% |
| Education | 875 | 11.9% |
| Literature & Languages | 210 | 2.9% |
| Liberal Arts & History | 198 | 2.7% |
| Visual & Performing Arts | 316 | 4.3% |
| Communications | 342 | 4.7% |
| Arts & Humanities | 547 | 7.5% |
| Total | 7,337 | 100.0% |
Transportation & Commute in Helena
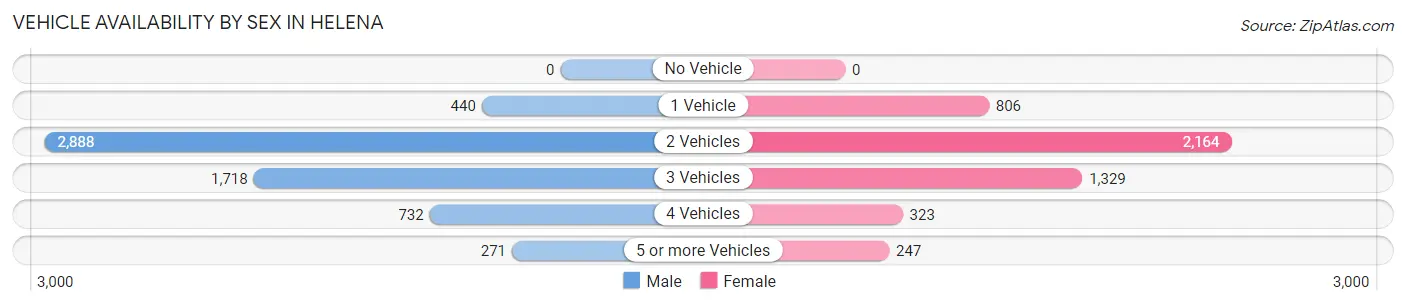
Vehicle Availability by Sex in Helena
The most prevalent vehicle ownership categories in Helena are males with 2 vehicles (2,888, accounting for 47.7%) and females with 2 vehicles (2,164, making up 59.3%).
| Vehicles Available | Male | Female |
| No Vehicle | 0 (0.0%) | 0 (0.0%) |
| 1 Vehicle | 440 (7.3%) | 806 (16.6%) |
| 2 Vehicles | 2,888 (47.7%) | 2,164 (44.4%) |
| 3 Vehicles | 1,718 (28.4%) | 1,329 (27.3%) |
| 4 Vehicles | 732 (12.1%) | 323 (6.6%) |
| 5 or more Vehicles | 271 (4.5%) | 247 (5.1%) |
| Total | 6,049 (100.0%) | 4,869 (100.0%) |
Commute Time in Helena
The most frequently occuring commute durations in Helena are 30 to 34 minutes (1,756 commuters, 18.9%), 45 to 59 minutes (1,636 commuters, 17.6%), and 25 to 29 minutes (1,158 commuters, 12.4%).
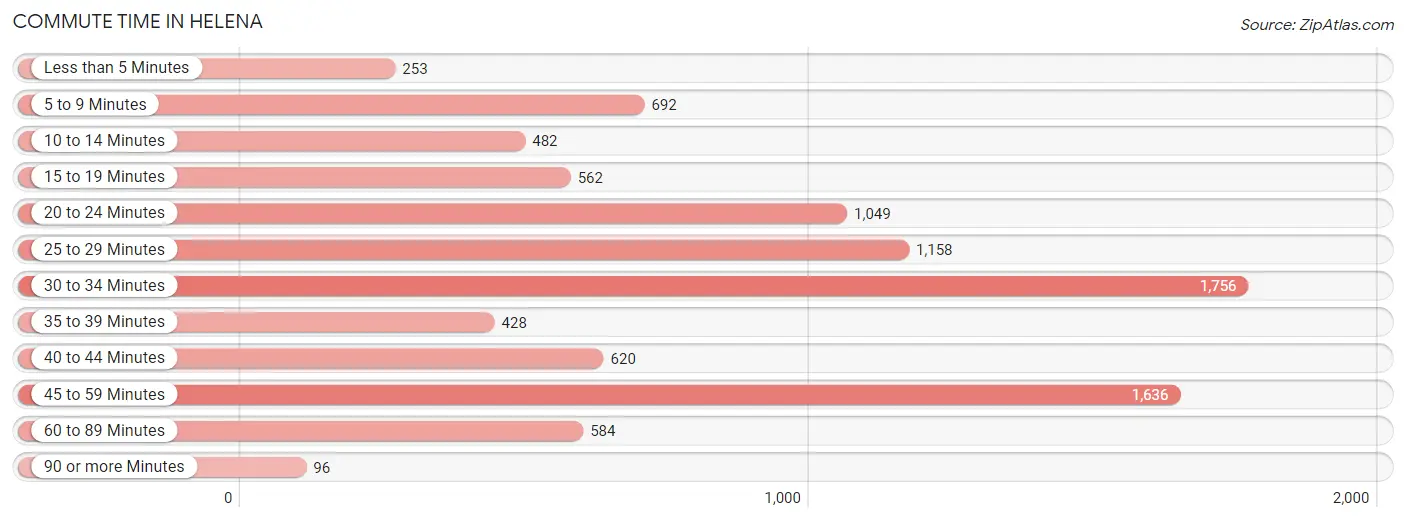
| Commute Time | # Commuters | % Commuters |
| Less than 5 Minutes | 253 | 2.7% |
| 5 to 9 Minutes | 692 | 7.4% |
| 10 to 14 Minutes | 482 | 5.2% |
| 15 to 19 Minutes | 562 | 6.0% |
| 20 to 24 Minutes | 1,049 | 11.3% |
| 25 to 29 Minutes | 1,158 | 12.4% |
| 30 to 34 Minutes | 1,756 | 18.9% |
| 35 to 39 Minutes | 428 | 4.6% |
| 40 to 44 Minutes | 620 | 6.7% |
| 45 to 59 Minutes | 1,636 | 17.6% |
| 60 to 89 Minutes | 584 | 6.3% |
| 90 or more Minutes | 96 | 1.0% |
Commute Time by Sex in Helena
The most common commute times in Helena are 30 to 34 minutes (1,059 commuters, 20.4%) for males and 45 to 59 minutes (712 commuters, 17.2%) for females.
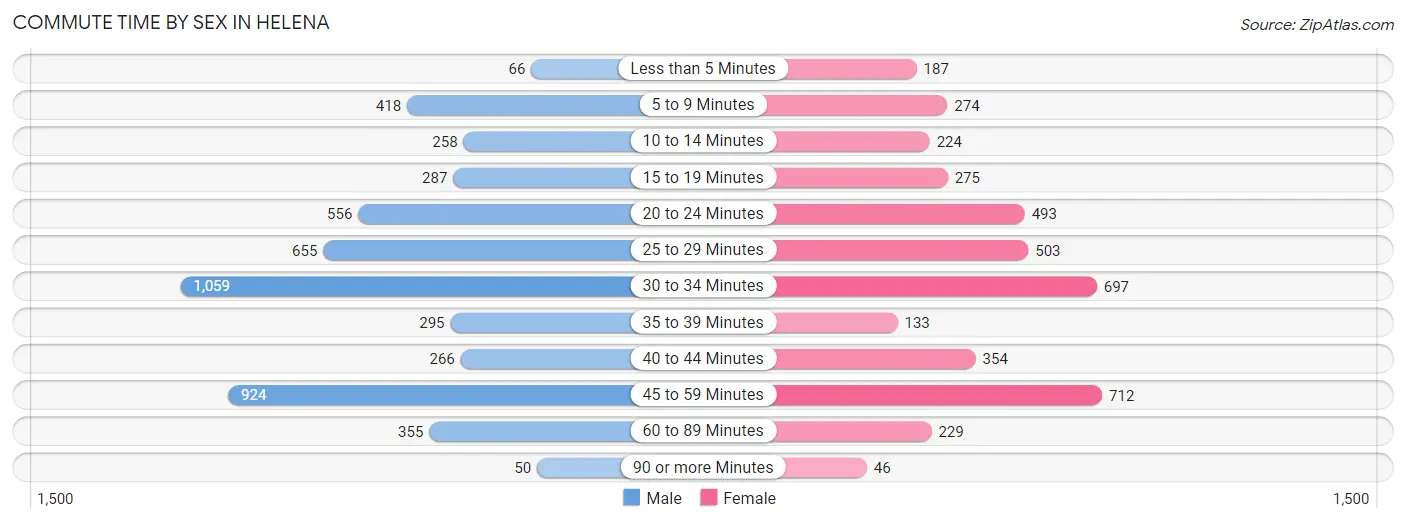
| Commute Time | Male | Female |
| Less than 5 Minutes | 66 (1.3%) | 187 (4.5%) |
| 5 to 9 Minutes | 418 (8.1%) | 274 (6.6%) |
| 10 to 14 Minutes | 258 (5.0%) | 224 (5.4%) |
| 15 to 19 Minutes | 287 (5.5%) | 275 (6.7%) |
| 20 to 24 Minutes | 556 (10.7%) | 493 (11.9%) |
| 25 to 29 Minutes | 655 (12.6%) | 503 (12.2%) |
| 30 to 34 Minutes | 1,059 (20.4%) | 697 (16.9%) |
| 35 to 39 Minutes | 295 (5.7%) | 133 (3.2%) |
| 40 to 44 Minutes | 266 (5.1%) | 354 (8.6%) |
| 45 to 59 Minutes | 924 (17.8%) | 712 (17.2%) |
| 60 to 89 Minutes | 355 (6.8%) | 229 (5.6%) |
| 90 or more Minutes | 50 (1.0%) | 46 (1.1%) |
Time of Departure to Work by Sex in Helena
The most frequent times of departure to work in Helena are 7:00 AM to 7:29 AM (839, 16.2%) for males and 7:00 AM to 7:29 AM (1,002, 24.3%) for females.
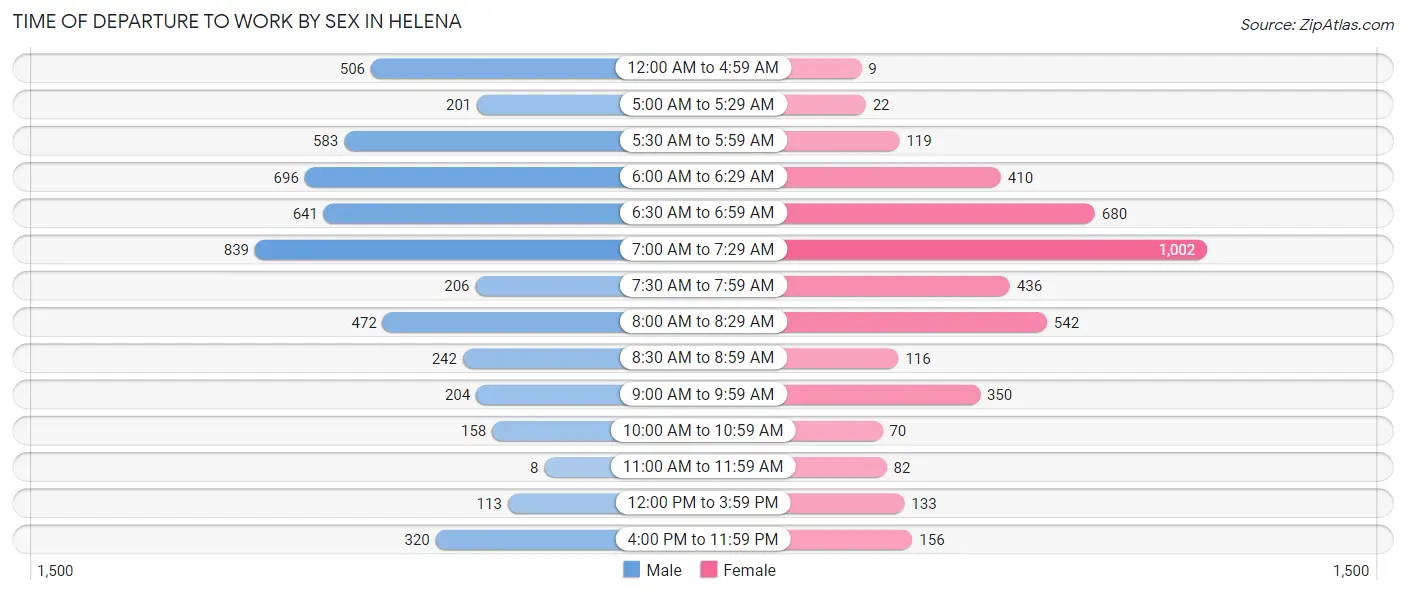
| Time of Departure | Male | Female |
| 12:00 AM to 4:59 AM | 506 (9.8%) | 9 (0.2%) |
| 5:00 AM to 5:29 AM | 201 (3.9%) | 22 (0.5%) |
| 5:30 AM to 5:59 AM | 583 (11.2%) | 119 (2.9%) |
| 6:00 AM to 6:29 AM | 696 (13.4%) | 410 (9.9%) |
| 6:30 AM to 6:59 AM | 641 (12.3%) | 680 (16.5%) |
| 7:00 AM to 7:29 AM | 839 (16.2%) | 1,002 (24.3%) |
| 7:30 AM to 7:59 AM | 206 (4.0%) | 436 (10.6%) |
| 8:00 AM to 8:29 AM | 472 (9.1%) | 542 (13.1%) |
| 8:30 AM to 8:59 AM | 242 (4.7%) | 116 (2.8%) |
| 9:00 AM to 9:59 AM | 204 (3.9%) | 350 (8.5%) |
| 10:00 AM to 10:59 AM | 158 (3.0%) | 70 (1.7%) |
| 11:00 AM to 11:59 AM | 8 (0.2%) | 82 (2.0%) |
| 12:00 PM to 3:59 PM | 113 (2.2%) | 133 (3.2%) |
| 4:00 PM to 11:59 PM | 320 (6.2%) | 156 (3.8%) |
| Total | 5,189 (100.0%) | 4,127 (100.0%) |
Housing Occupancy in Helena
Occupancy by Ownership in Helena
Of the total 7,480 dwellings in Helena, owner-occupied units account for 6,808 (91.0%), while renter-occupied units make up 672 (9.0%).
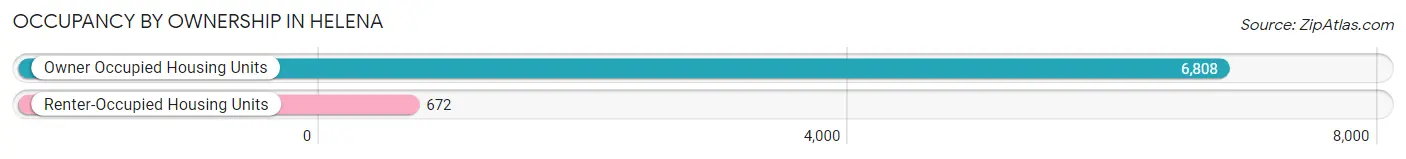
| Occupancy | # Housing Units | % Housing Units |
| Owner Occupied Housing Units | 6,808 | 91.0% |
| Renter-Occupied Housing Units | 672 | 9.0% |
| Total Occupied Housing Units | 7,480 | 100.0% |
Occupancy by Household Size in Helena
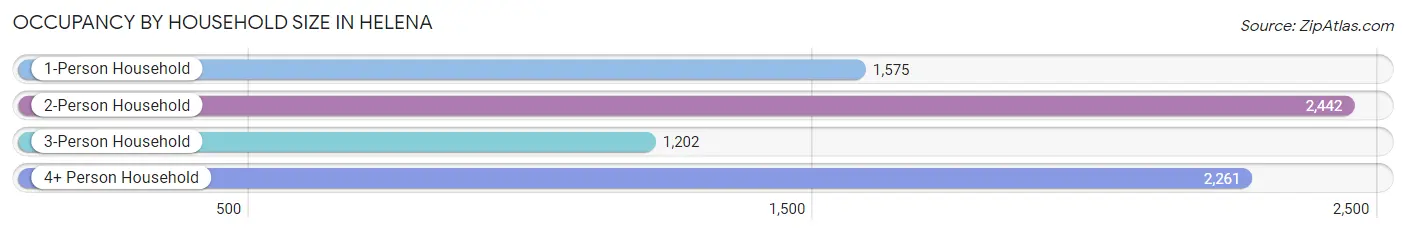
| Household Size | # Housing Units | % Housing Units |
| 1-Person Household | 1,575 | 21.1% |
| 2-Person Household | 2,442 | 32.7% |
| 3-Person Household | 1,202 | 16.1% |
| 4+ Person Household | 2,261 | 30.2% |
| Total Housing Units | 7,480 | 100.0% |
Occupancy by Ownership by Household Size in Helena
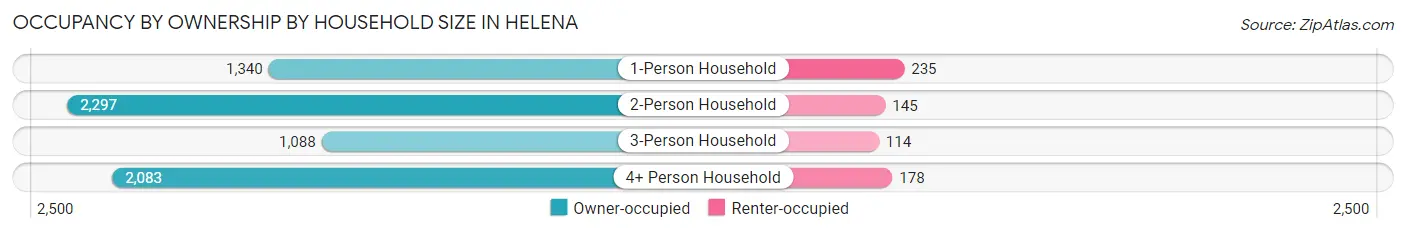
| Household Size | Owner-occupied | Renter-occupied |
| 1-Person Household | 1,340 (85.1%) | 235 (14.9%) |
| 2-Person Household | 2,297 (94.1%) | 145 (5.9%) |
| 3-Person Household | 1,088 (90.5%) | 114 (9.5%) |
| 4+ Person Household | 2,083 (92.1%) | 178 (7.9%) |
| Total Housing Units | 6,808 (91.0%) | 672 (9.0%) |
Occupancy by Educational Attainment in Helena
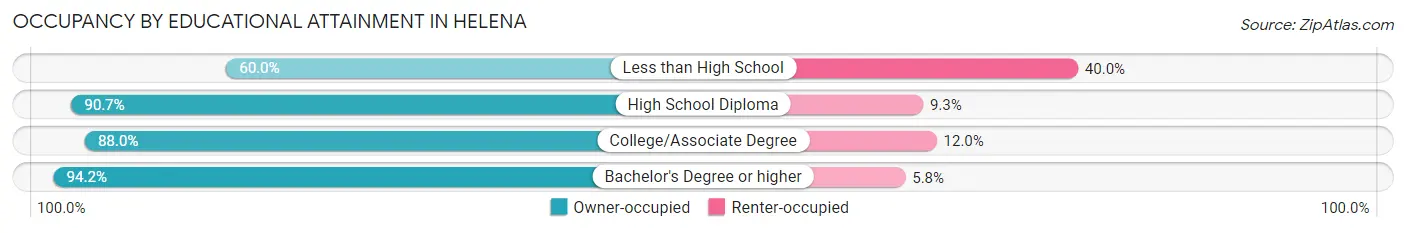
| Household Size | Owner-occupied | Renter-occupied |
| Less than High School | 123 (60.0%) | 82 (40.0%) |
| High School Diploma | 899 (90.7%) | 92 (9.3%) |
| College/Associate Degree | 1,917 (88.0%) | 261 (12.0%) |
| Bachelor's Degree or higher | 3,869 (94.2%) | 237 (5.8%) |
Occupancy by Age of Householder in Helena
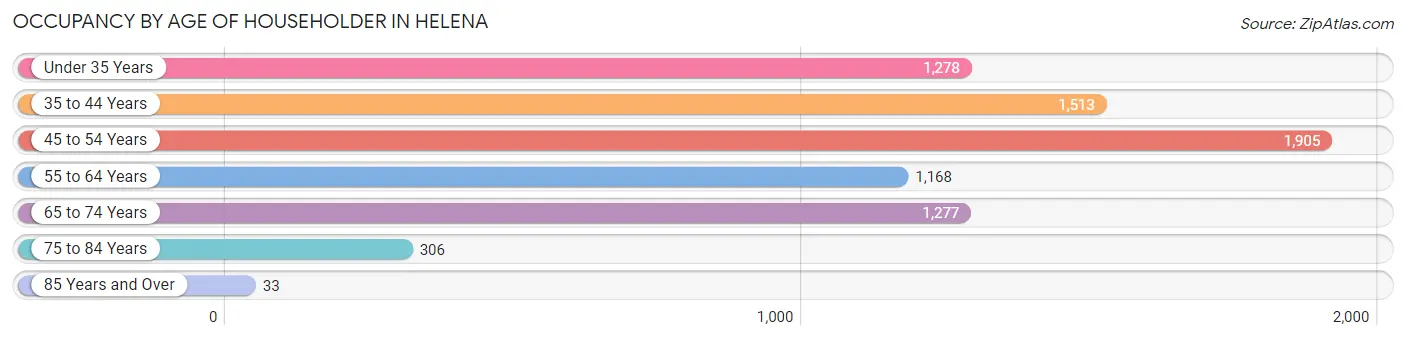
| Age Bracket | # Households | % Households |
| Under 35 Years | 1,278 | 17.1% |
| 35 to 44 Years | 1,513 | 20.2% |
| 45 to 54 Years | 1,905 | 25.5% |
| 55 to 64 Years | 1,168 | 15.6% |
| 65 to 74 Years | 1,277 | 17.1% |
| 75 to 84 Years | 306 | 4.1% |
| 85 Years and Over | 33 | 0.4% |
| Total | 7,480 | 100.0% |
Housing Finances in Helena
Median Income by Occupancy in Helena
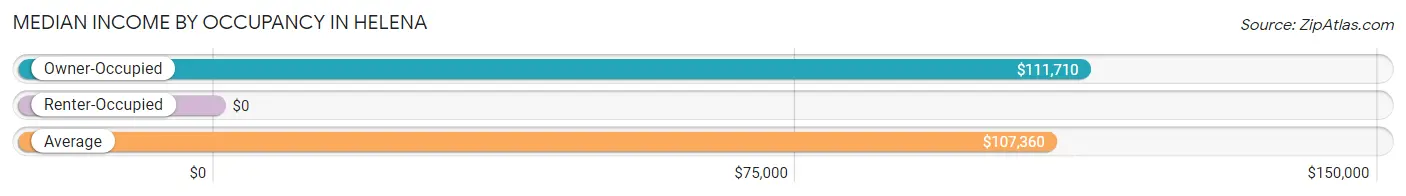
| Occupancy Type | # Households | Median Income |
| Owner-Occupied | 6,808 (91.0%) | $111,710 |
| Renter-Occupied | 672 (9.0%) | $0 |
| Average | 7,480 (100.0%) | $107,360 |
Occupancy by Householder Income Bracket in Helena
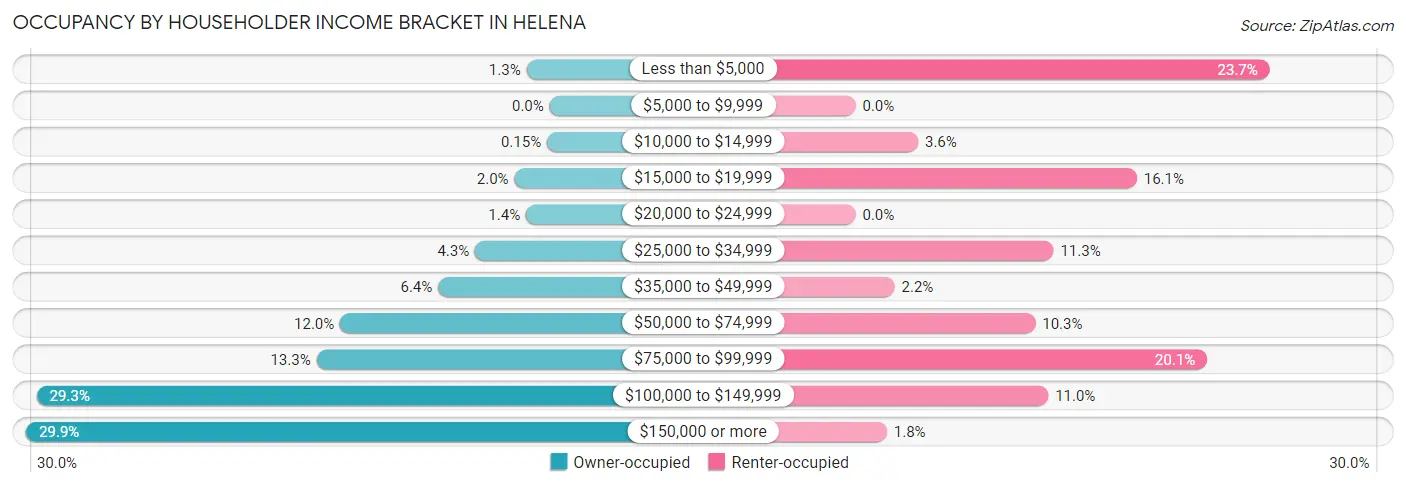
| Income Bracket | Owner-occupied | Renter-occupied |
| Less than $5,000 | 90 (1.3%) | 159 (23.7%) |
| $5,000 to $9,999 | 0 (0.0%) | 0 (0.0%) |
| $10,000 to $14,999 | 10 (0.2%) | 24 (3.6%) |
| $15,000 to $19,999 | 137 (2.0%) | 108 (16.1%) |
| $20,000 to $24,999 | 92 (1.3%) | 0 (0.0%) |
| $25,000 to $34,999 | 290 (4.3%) | 76 (11.3%) |
| $35,000 to $49,999 | 434 (6.4%) | 15 (2.2%) |
| $50,000 to $74,999 | 815 (12.0%) | 69 (10.3%) |
| $75,000 to $99,999 | 907 (13.3%) | 135 (20.1%) |
| $100,000 to $149,999 | 1,996 (29.3%) | 74 (11.0%) |
| $150,000 or more | 2,037 (29.9%) | 12 (1.8%) |
| Total | 6,808 (100.0%) | 672 (100.0%) |
Monthly Housing Cost Tiers in Helena
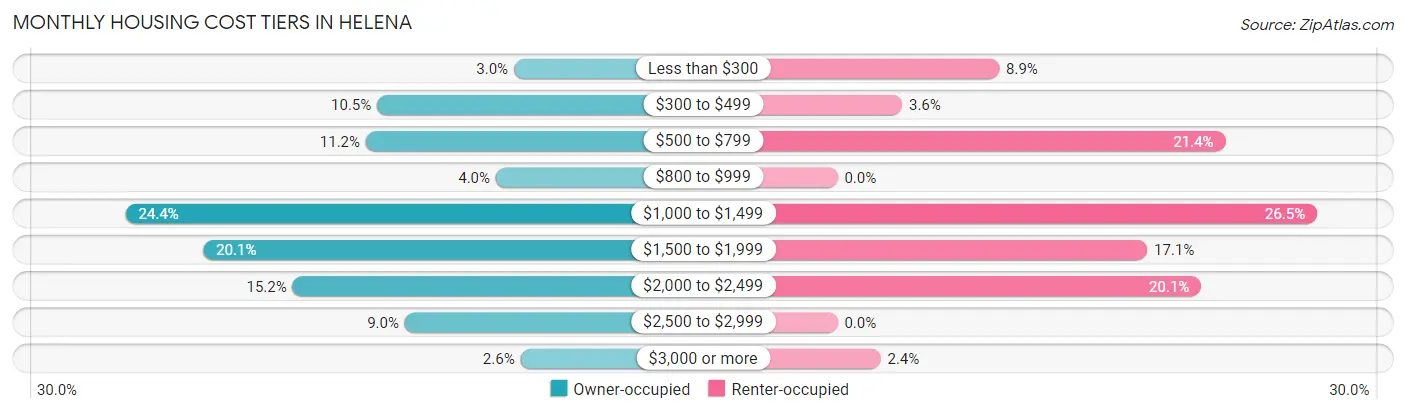
| Monthly Cost | Owner-occupied | Renter-occupied |
| Less than $300 | 202 (3.0%) | 60 (8.9%) |
| $300 to $499 | 717 (10.5%) | 24 (3.6%) |
| $500 to $799 | 759 (11.2%) | 144 (21.4%) |
| $800 to $999 | 270 (4.0%) | 0 (0.0%) |
| $1,000 to $1,499 | 1,663 (24.4%) | 178 (26.5%) |
| $1,500 to $1,999 | 1,371 (20.1%) | 115 (17.1%) |
| $2,000 to $2,499 | 1,035 (15.2%) | 135 (20.1%) |
| $2,500 to $2,999 | 613 (9.0%) | 0 (0.0%) |
| $3,000 or more | 178 (2.6%) | 16 (2.4%) |
| Total | 6,808 (100.0%) | 672 (100.0%) |
Physical Housing Characteristics in Helena
Housing Structures in Helena
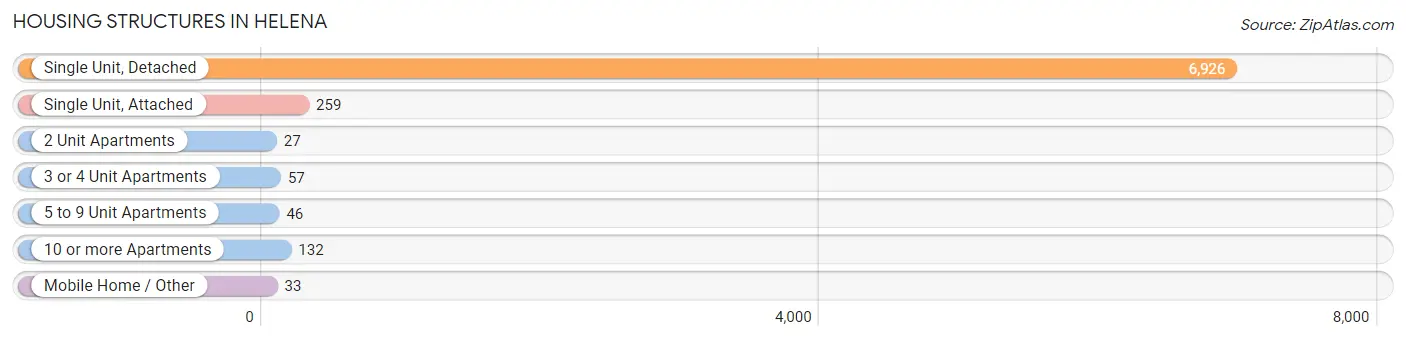
| Structure Type | # Housing Units | % Housing Units |
| Single Unit, Detached | 6,926 | 92.6% |
| Single Unit, Attached | 259 | 3.5% |
| 2 Unit Apartments | 27 | 0.4% |
| 3 or 4 Unit Apartments | 57 | 0.8% |
| 5 to 9 Unit Apartments | 46 | 0.6% |
| 10 or more Apartments | 132 | 1.8% |
| Mobile Home / Other | 33 | 0.4% |
| Total | 7,480 | 100.0% |
Housing Structures by Occupancy in Helena
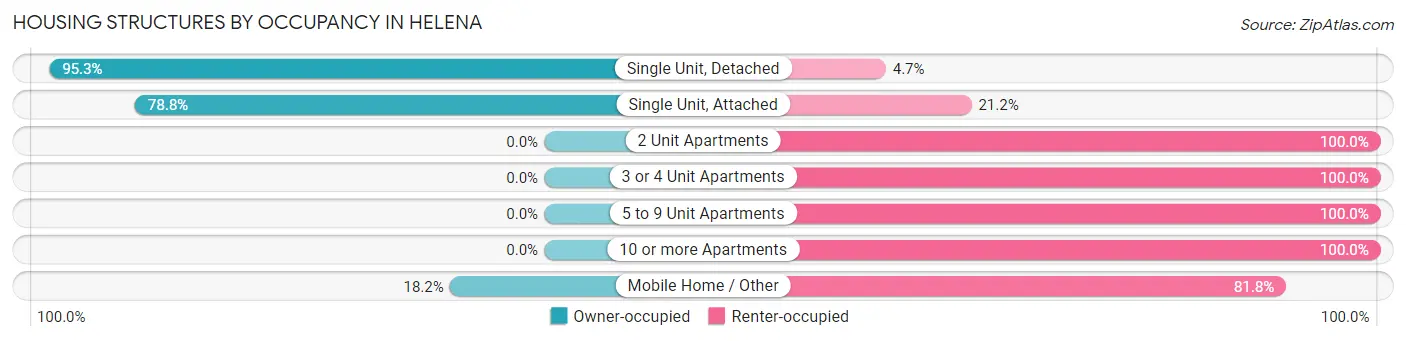
| Structure Type | Owner-occupied | Renter-occupied |
| Single Unit, Detached | 6,598 (95.3%) | 328 (4.7%) |
| Single Unit, Attached | 204 (78.8%) | 55 (21.2%) |
| 2 Unit Apartments | 0 (0.0%) | 27 (100.0%) |
| 3 or 4 Unit Apartments | 0 (0.0%) | 57 (100.0%) |
| 5 to 9 Unit Apartments | 0 (0.0%) | 46 (100.0%) |
| 10 or more Apartments | 0 (0.0%) | 132 (100.0%) |
| Mobile Home / Other | 6 (18.2%) | 27 (81.8%) |
| Total | 6,808 (91.0%) | 672 (9.0%) |
Housing Structures by Number of Rooms in Helena
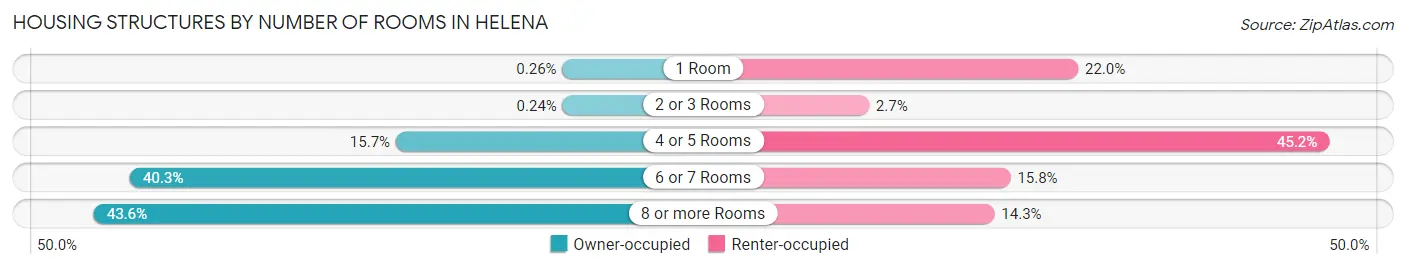
| Number of Rooms | Owner-occupied | Renter-occupied |
| 1 Room | 18 (0.3%) | 148 (22.0%) |
| 2 or 3 Rooms | 16 (0.2%) | 18 (2.7%) |
| 4 or 5 Rooms | 1,066 (15.7%) | 304 (45.2%) |
| 6 or 7 Rooms | 2,740 (40.3%) | 106 (15.8%) |
| 8 or more Rooms | 2,968 (43.6%) | 96 (14.3%) |
| Total | 6,808 (100.0%) | 672 (100.0%) |
Housing Structure by Heating Type in Helena
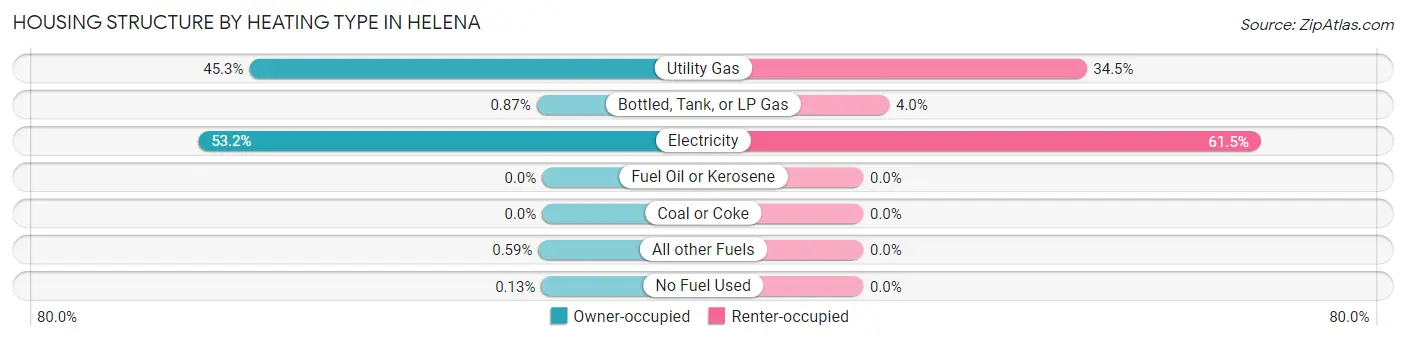
| Heating Type | Owner-occupied | Renter-occupied |
| Utility Gas | 3,081 (45.3%) | 232 (34.5%) |
| Bottled, Tank, or LP Gas | 59 (0.9%) | 27 (4.0%) |
| Electricity | 3,619 (53.2%) | 413 (61.5%) |
| Fuel Oil or Kerosene | 0 (0.0%) | 0 (0.0%) |
| Coal or Coke | 0 (0.0%) | 0 (0.0%) |
| All other Fuels | 40 (0.6%) | 0 (0.0%) |
| No Fuel Used | 9 (0.1%) | 0 (0.0%) |
| Total | 6,808 (100.0%) | 672 (100.0%) |
Household Vehicle Usage in Helena
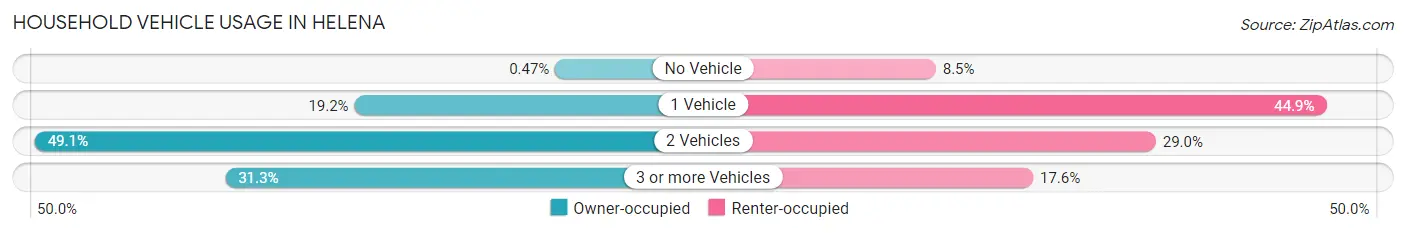
| Vehicles per Household | Owner-occupied | Renter-occupied |
| No Vehicle | 32 (0.5%) | 57 (8.5%) |
| 1 Vehicle | 1,308 (19.2%) | 302 (44.9%) |
| 2 Vehicles | 3,339 (49.0%) | 195 (29.0%) |
| 3 or more Vehicles | 2,129 (31.3%) | 118 (17.6%) |
| Total | 6,808 (100.0%) | 672 (100.0%) |
Real Estate & Mortgages in Helena
Real Estate and Mortgage Overview in Helena
| Characteristic | Without Mortgage | With Mortgage |
| Housing Units | 1,617 | 5,191 |
| Median Property Value | $258,600 | $288,600 |
| Median Household Income | $96,220 | $1,784 |
| Monthly Housing Costs | $471 | $178 |
| Real Estate Taxes | $933 | $327 |
Property Value by Mortgage Status in Helena
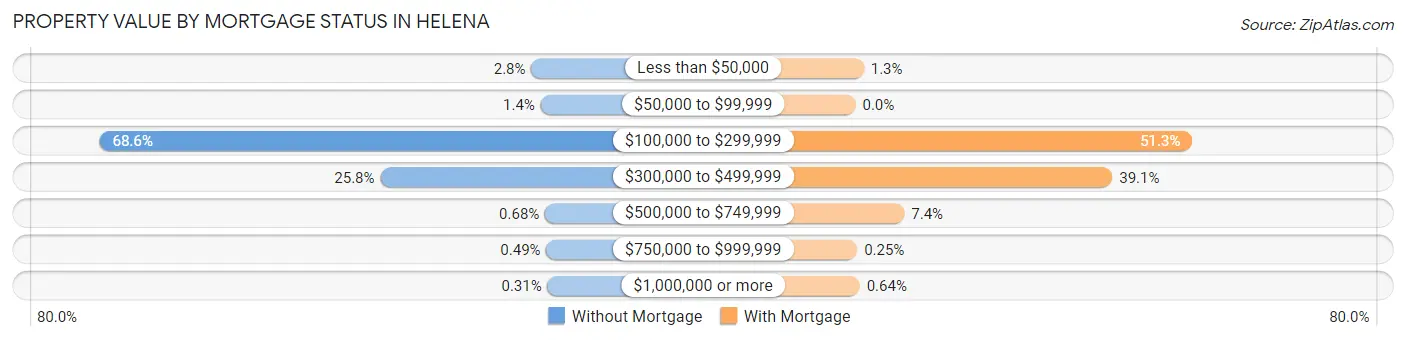
| Property Value | Without Mortgage | With Mortgage |
| Less than $50,000 | 45 (2.8%) | 65 (1.3%) |
| $50,000 to $99,999 | 22 (1.4%) | 0 (0.0%) |
| $100,000 to $299,999 | 1,109 (68.6%) | 2,663 (51.3%) |
| $300,000 to $499,999 | 417 (25.8%) | 2,031 (39.1%) |
| $500,000 to $749,999 | 11 (0.7%) | 386 (7.4%) |
| $750,000 to $999,999 | 8 (0.5%) | 13 (0.3%) |
| $1,000,000 or more | 5 (0.3%) | 33 (0.6%) |
| Total | 1,617 (100.0%) | 5,191 (100.0%) |
Household Income by Mortgage Status in Helena
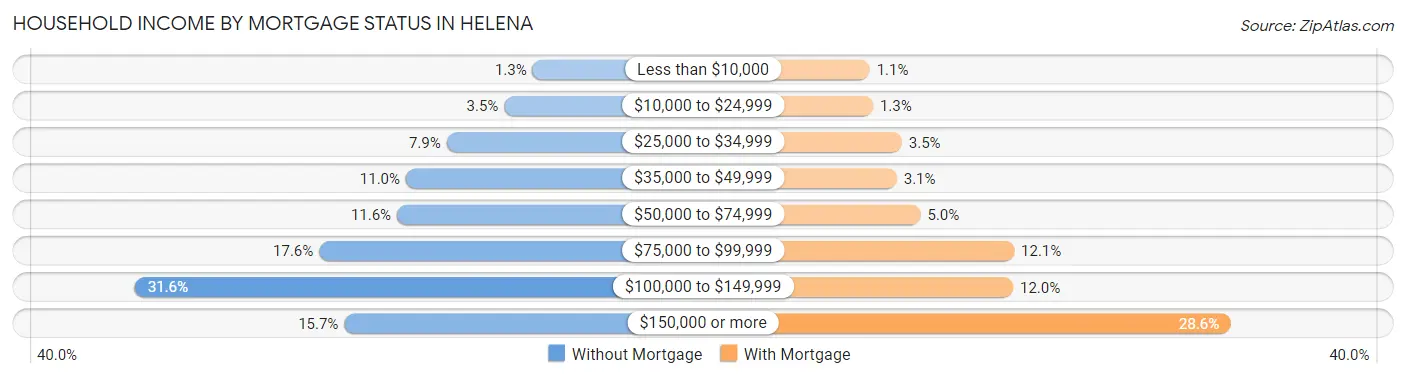
| Household Income | Without Mortgage | With Mortgage |
| Less than $10,000 | 21 (1.3%) | 56 (1.1%) |
| $10,000 to $24,999 | 56 (3.5%) | 69 (1.3%) |
| $25,000 to $34,999 | 127 (7.9%) | 183 (3.5%) |
| $35,000 to $49,999 | 177 (11.0%) | 163 (3.1%) |
| $50,000 to $74,999 | 188 (11.6%) | 257 (5.0%) |
| $75,000 to $99,999 | 284 (17.6%) | 627 (12.1%) |
| $100,000 to $149,999 | 511 (31.6%) | 623 (12.0%) |
| $150,000 or more | 253 (15.7%) | 1,485 (28.6%) |
| Total | 1,617 (100.0%) | 5,191 (100.0%) |
Property Value to Household Income Ratio in Helena
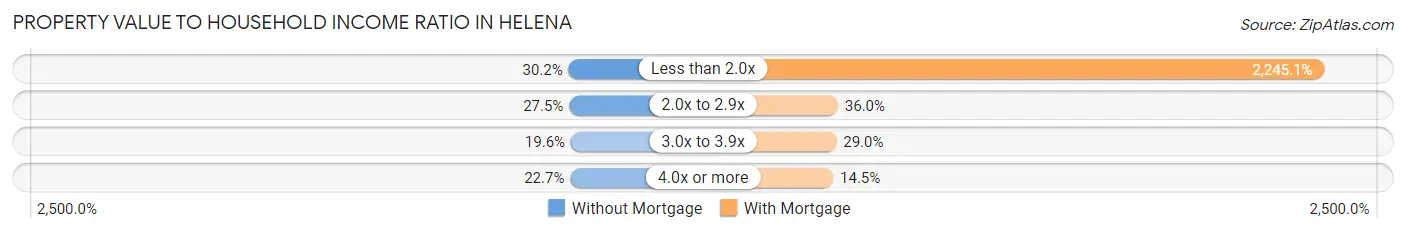
| Value-to-Income Ratio | Without Mortgage | With Mortgage |
| Less than 2.0x | 489 (30.2%) | 116,545 (2,245.1%) |
| 2.0x to 2.9x | 444 (27.5%) | 1,870 (36.0%) |
| 3.0x to 3.9x | 317 (19.6%) | 1,507 (29.0%) |
| 4.0x or more | 367 (22.7%) | 750 (14.4%) |
| Total | 1,617 (100.0%) | 5,191 (100.0%) |
Real Estate Taxes by Mortgage Status in Helena
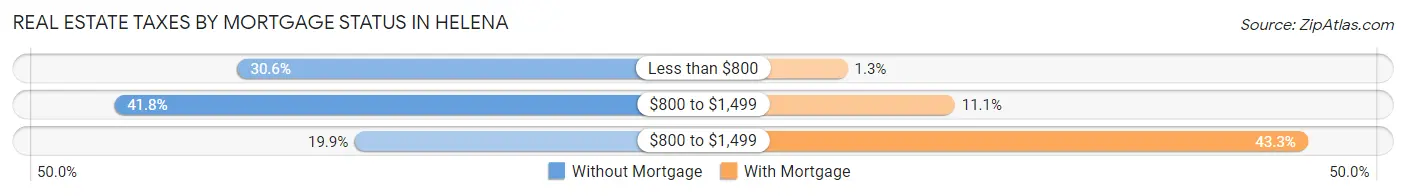
| Property Taxes | Without Mortgage | With Mortgage |
| Less than $800 | 494 (30.5%) | 69 (1.3%) |
| $800 to $1,499 | 676 (41.8%) | 577 (11.1%) |
| $800 to $1,499 | 322 (19.9%) | 2,250 (43.3%) |
| Total | 1,617 (100.0%) | 5,191 (100.0%) |
Health & Disability in Helena
Health Insurance Coverage by Age in Helena
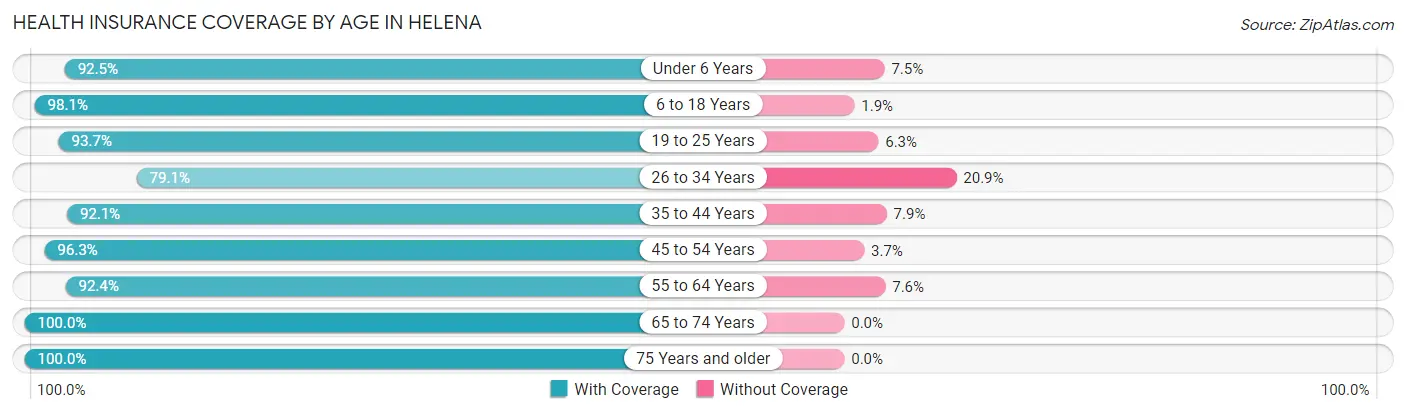
| Age Bracket | With Coverage | Without Coverage |
| Under 6 Years | 1,544 (92.5%) | 125 (7.5%) |
| 6 to 18 Years | 4,277 (98.1%) | 82 (1.9%) |
| 19 to 25 Years | 1,078 (93.7%) | 73 (6.3%) |
| 26 to 34 Years | 2,040 (79.1%) | 539 (20.9%) |
| 35 to 44 Years | 2,984 (92.1%) | 256 (7.9%) |
| 45 to 54 Years | 3,175 (96.3%) | 122 (3.7%) |
| 55 to 64 Years | 1,861 (92.4%) | 154 (7.6%) |
| 65 to 74 Years | 2,144 (100.0%) | 0 (0.0%) |
| 75 Years and older | 544 (100.0%) | 0 (0.0%) |
| Total | 19,647 (93.6%) | 1,351 (6.4%) |
Health Insurance Coverage by Citizenship Status in Helena
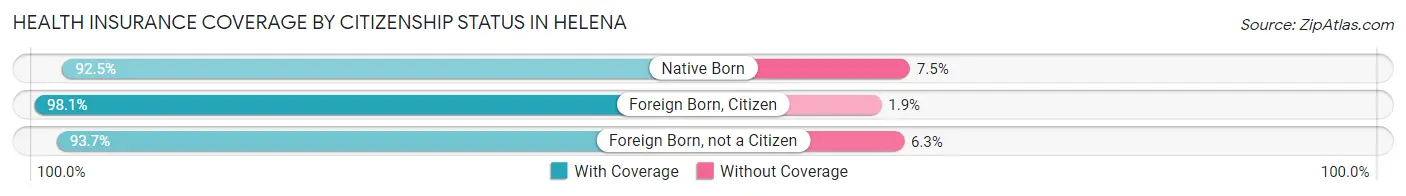
| Citizenship Status | With Coverage | Without Coverage |
| Native Born | 1,544 (92.5%) | 125 (7.5%) |
| Foreign Born, Citizen | 4,277 (98.1%) | 82 (1.9%) |
| Foreign Born, not a Citizen | 1,078 (93.7%) | 73 (6.3%) |
Health Insurance Coverage by Household Income in Helena
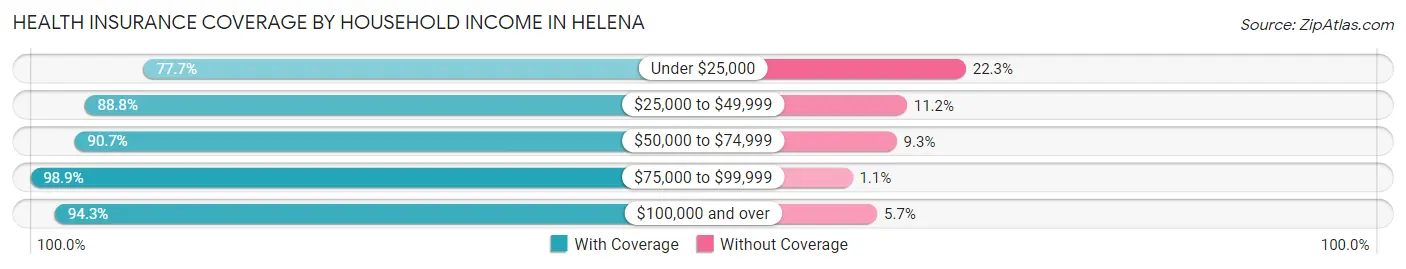
| Household Income | With Coverage | Without Coverage |
| Under $25,000 | 645 (77.7%) | 185 (22.3%) |
| $25,000 to $49,999 | 1,421 (88.8%) | 180 (11.2%) |
| $50,000 to $74,999 | 1,863 (90.7%) | 192 (9.3%) |
| $75,000 to $99,999 | 3,082 (98.9%) | 33 (1.1%) |
| $100,000 and over | 12,636 (94.3%) | 761 (5.7%) |
Public vs Private Health Insurance Coverage by Age in Helena
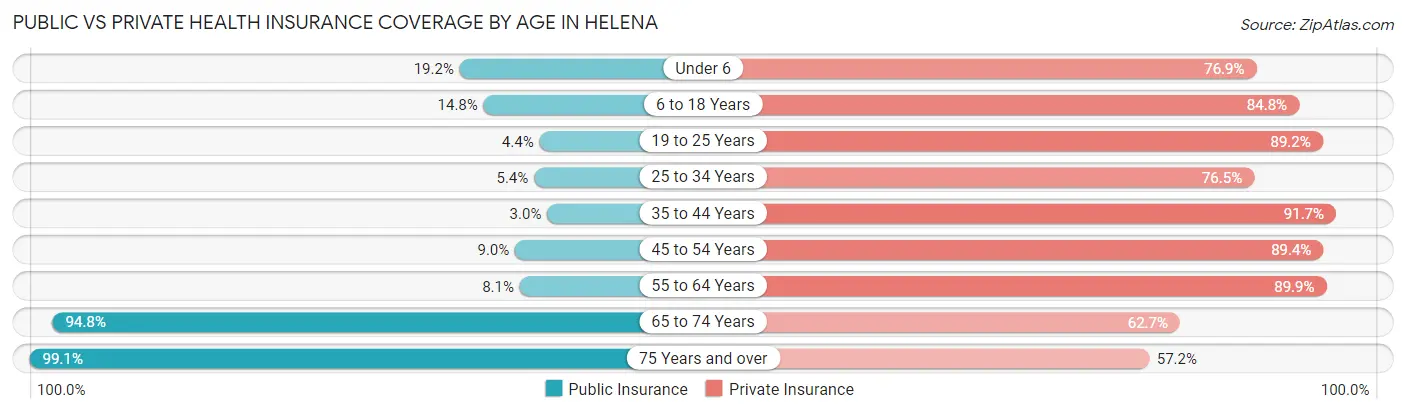
| Age Bracket | Public Insurance | Private Insurance |
| Under 6 | 321 (19.2%) | 1,284 (76.9%) |
| 6 to 18 Years | 645 (14.8%) | 3,698 (84.8%) |
| 19 to 25 Years | 51 (4.4%) | 1,027 (89.2%) |
| 25 to 34 Years | 140 (5.4%) | 1,973 (76.5%) |
| 35 to 44 Years | 97 (3.0%) | 2,971 (91.7%) |
| 45 to 54 Years | 295 (8.9%) | 2,946 (89.3%) |
| 55 to 64 Years | 163 (8.1%) | 1,812 (89.9%) |
| 65 to 74 Years | 2,033 (94.8%) | 1,345 (62.7%) |
| 75 Years and over | 539 (99.1%) | 311 (57.2%) |
| Total | 4,284 (20.4%) | 17,367 (82.7%) |
Disability Status by Sex by Age in Helena
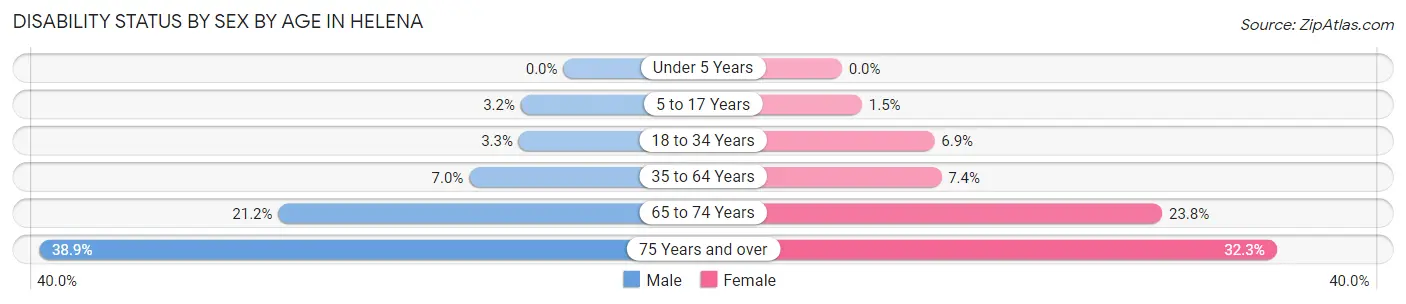
| Age Bracket | Male | Female |
| Under 5 Years | 0 (0.0%) | 0 (0.0%) |
| 5 to 17 Years | 60 (3.2%) | 38 (1.5%) |
| 18 to 34 Years | 74 (3.3%) | 123 (6.9%) |
| 35 to 64 Years | 284 (7.0%) | 331 (7.4%) |
| 65 to 74 Years | 193 (21.2%) | 293 (23.8%) |
| 75 Years and over | 102 (38.9%) | 91 (32.3%) |
Disability Class by Sex by Age in Helena
Disability Class: Hearing Difficulty
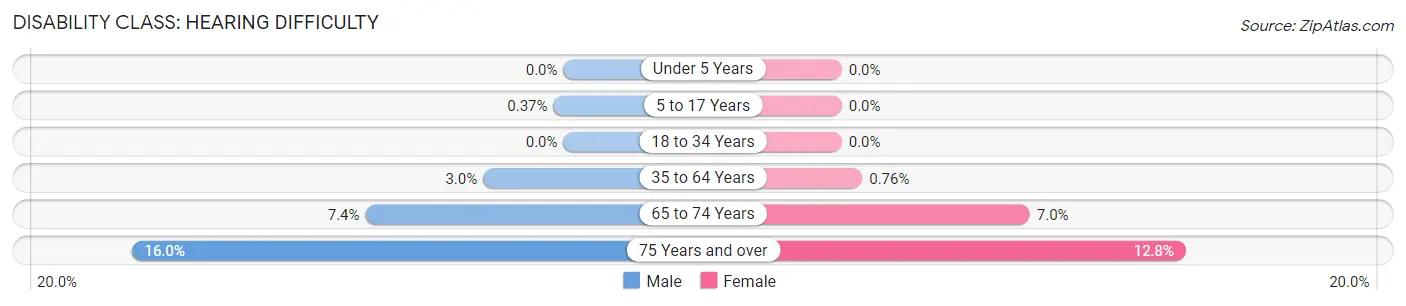
| Age Bracket | Male | Female |
| Under 5 Years | 0 (0.0%) | 0 (0.0%) |
| 5 to 17 Years | 7 (0.4%) | 0 (0.0%) |
| 18 to 34 Years | 0 (0.0%) | 0 (0.0%) |
| 35 to 64 Years | 121 (3.0%) | 34 (0.8%) |
| 65 to 74 Years | 67 (7.3%) | 86 (7.0%) |
| 75 Years and over | 42 (16.0%) | 36 (12.8%) |
Disability Class: Vision Difficulty
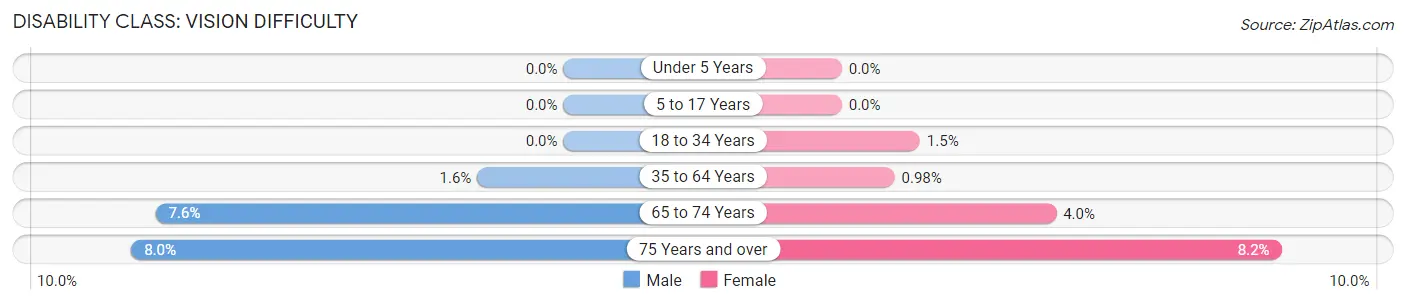
| Age Bracket | Male | Female |
| Under 5 Years | 0 (0.0%) | 0 (0.0%) |
| 5 to 17 Years | 0 (0.0%) | 0 (0.0%) |
| 18 to 34 Years | 0 (0.0%) | 26 (1.5%) |
| 35 to 64 Years | 65 (1.6%) | 44 (1.0%) |
| 65 to 74 Years | 69 (7.6%) | 49 (4.0%) |
| 75 Years and over | 21 (8.0%) | 23 (8.2%) |
Disability Class: Cognitive Difficulty
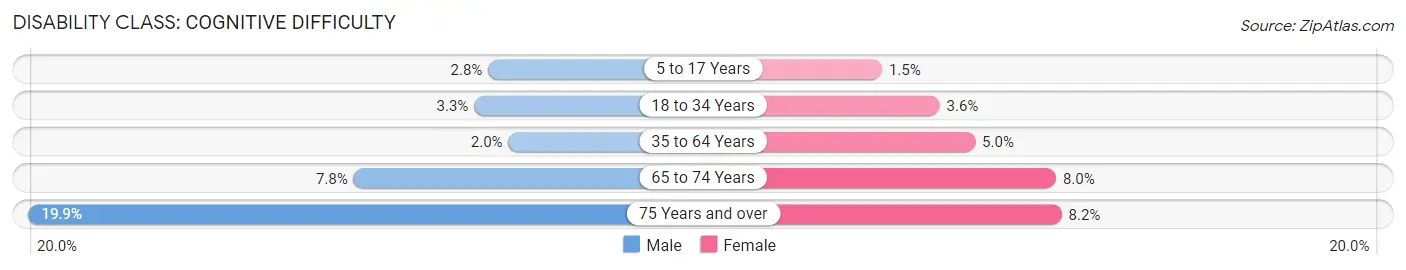
| Age Bracket | Male | Female |
| 5 to 17 Years | 53 (2.8%) | 38 (1.5%) |
| 18 to 34 Years | 74 (3.3%) | 65 (3.6%) |
| 35 to 64 Years | 83 (2.0%) | 222 (5.0%) |
| 65 to 74 Years | 71 (7.8%) | 98 (8.0%) |
| 75 Years and over | 52 (19.9%) | 23 (8.2%) |
Disability Class: Ambulatory Difficulty
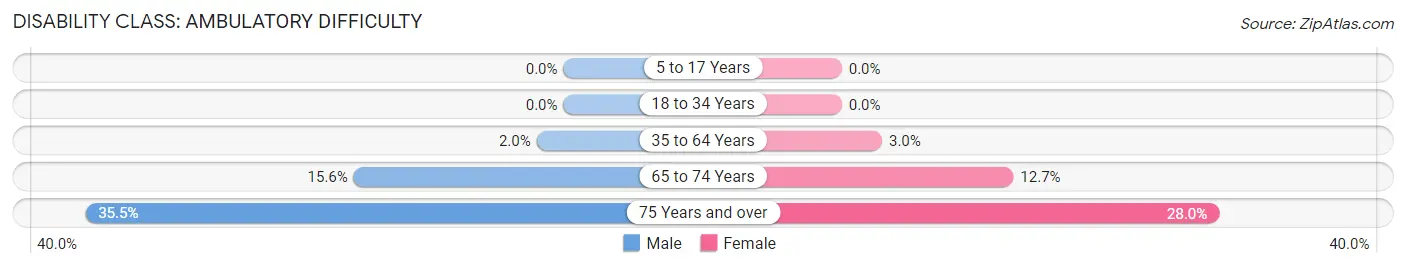
| Age Bracket | Male | Female |
| 5 to 17 Years | 0 (0.0%) | 0 (0.0%) |
| 18 to 34 Years | 0 (0.0%) | 0 (0.0%) |
| 35 to 64 Years | 81 (2.0%) | 134 (3.0%) |
| 65 to 74 Years | 142 (15.6%) | 157 (12.7%) |
| 75 Years and over | 93 (35.5%) | 79 (28.0%) |
Disability Class: Self-Care Difficulty
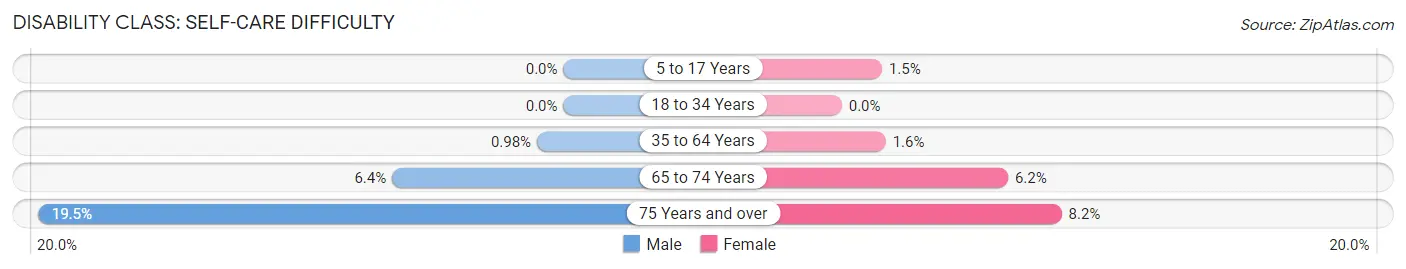
| Age Bracket | Male | Female |
| 5 to 17 Years | 0 (0.0%) | 38 (1.5%) |
| 18 to 34 Years | 0 (0.0%) | 0 (0.0%) |
| 35 to 64 Years | 40 (1.0%) | 73 (1.6%) |
| 65 to 74 Years | 58 (6.4%) | 76 (6.2%) |
| 75 Years and over | 51 (19.5%) | 23 (8.2%) |
Technology Access in Helena
Computing Device Access in Helena
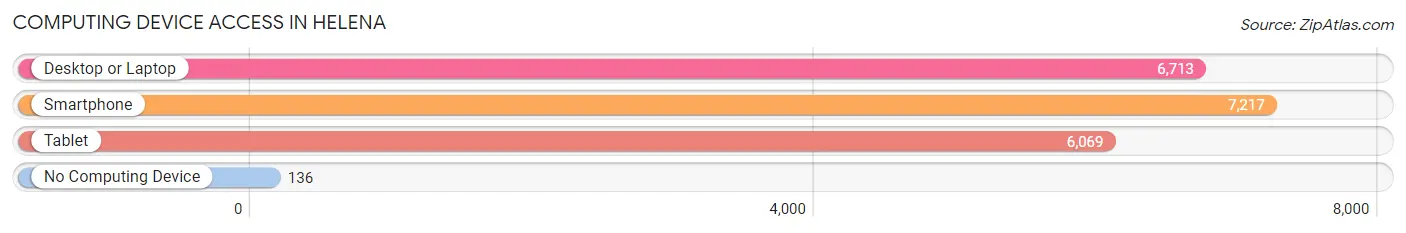
| Device Type | # Households | % Households |
| Desktop or Laptop | 6,713 | 89.7% |
| Smartphone | 7,217 | 96.5% |
| Tablet | 6,069 | 81.1% |
| No Computing Device | 136 | 1.8% |
| Total | 7,480 | 100.0% |
Internet Access in Helena
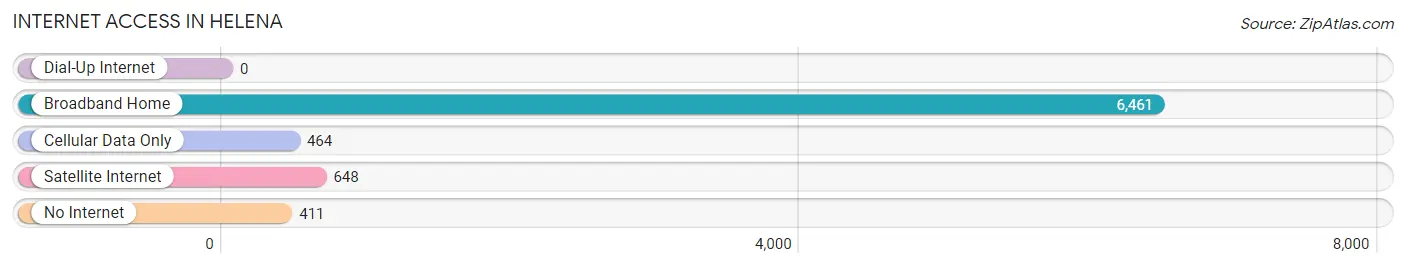
| Internet Type | # Households | % Households |
| Dial-Up Internet | 0 | 0.0% |
| Broadband Home | 6,461 | 86.4% |
| Cellular Data Only | 464 | 6.2% |
| Satellite Internet | 648 | 8.7% |
| No Internet | 411 | 5.5% |
| Total | 7,480 | 100.0% |
Helena Summary
Helena is a city located in the state of Alabama, in the United States. It is located in the central part of the state, in Shelby County, and is part of the Birmingham-Hoover Metropolitan Statistical Area. The city has a population of 16,898 as of the 2010 census, and is the county seat of Shelby County.
Geography
Helena is located at 33°17'45" North, 86°51'45" West (33.295833, -86.862500). According to the United States Census Bureau, the city has a total area of 11.2 square miles (29.0 km2), of which 11.1 square miles (28.7 km2) is land and 0.1 square miles (0.3 km2) is water.
The city is situated in the foothills of the Appalachian Mountains, and is located near the Cahaba River. The city is located in the central part of the state, and is approximately 20 miles south of Birmingham.
History
The area that is now Helena was first settled in the early 1800s, and was originally known as Stoutsville. The city was officially incorporated in 1877, and was named after the daughter of the first mayor, John H. Stouts.
The city grew rapidly in the late 19th century, and by the early 20th century, it had become a major industrial center. The city was home to several steel mills, and was also a major center for the production of coal and iron ore.
The city was also home to several major railroads, and was a major hub for the transportation of goods throughout the region.
Economy
Helena’s economy is largely based on manufacturing and retail. The city is home to several major manufacturing companies, including Vulcan Materials, which produces construction materials, and the Helena Chemical Company, which produces agricultural chemicals.
The city is also home to several major retail stores including Walmart Target and Lowe s
Demographics
As of the 2010 census, the population of Helena was 16,898. The racial makeup of the city was 79.2% White, 17.2% African American, 0.4% Native American, 0.7% Asian, 0.1% Pacific Islander, 1.2% from other races, and 1.2% from two or more races. Hispanic or Latino of any race were 3.2% of the population.
The median income for a household in the city was $41,945, and the median income for a family was $50,945. The per capita income for the city was $20,945. About 11.2% of families and 14.2% of the population were below the poverty line, including 19.2% of those under age 18 and 8.2% of those age 65 or over.
Common Questions
What is Per Capita Income in Helena?
Per Capita income in Helena is $48,087.
What is the Median Family Income in Helena?
Median Family Income in Helena is $120,279.
What is the Median Household income in Helena?
Median Household Income in Helena is $107,360.
What is Income or Wage Gap in Helena?
Income or Wage Gap in Helena is 33.5%.
Women in Helena earn 66.5 cents for every dollar earned by a man.
What is Inequality or Gini Index in Helena?
Inequality or Gini Index in Helena is 0.41.
What is the Total Population of Helena?
Total Population of Helena is 21,036.
What is the Total Male Population of Helena?
Total Male Population of Helena is 10,067.
What is the Total Female Population of Helena?
Total Female Population of Helena is 10,969.
What is the Ratio of Males per 100 Females in Helena?
There are 91.78 Males per 100 Females in Helena.
What is the Ratio of Females per 100 Males in Helena?
There are 108.96 Females per 100 Males in Helena.
What is the Median Population Age in Helena?
Median Population Age in Helena is 38.2 Years.
What is the Average Family Size in Helena
Average Family Size in Helena is 3.3 People.
What is the Average Household Size in Helena
Average Household Size in Helena is 2.8 People.
How Large is the Labor Force in Helena?
There are 11,252 People in the Labor Forcein in Helena.
What is the Percentage of People in the Labor Force in Helena?
70.3% of People are in the Labor Force in Helena.
What is the Unemployment Rate in Helena?
Unemployment Rate in Helena is 2.1%.