Spanish Fort, AL Map & Demographics
Spanish Fort Map
Spanish Fort Overview
$40,969
PER CAPITA INCOME
$133,120
AVG FAMILY INCOME
$98,350
AVG HOUSEHOLD INCOME
46.8%
WAGE / INCOME GAP [ % ]
53.2¢/ $1
WAGE / INCOME GAP [ $ ]
0.38
INEQUALITY / GINI INDEX
10,083
TOTAL POPULATION
5,112
MALE POPULATION
4,971
FEMALE POPULATION
102.84
MALES / 100 FEMALES
97.24
FEMALES / 100 MALES
37.1
MEDIAN AGE
3.5
AVG FAMILY SIZE
2.7
AVG HOUSEHOLD SIZE
4,748
LABOR FORCE [ PEOPLE ]
63.7%
PERCENT IN LABOR FORCE
1.9%
UNEMPLOYMENT RATE
Spanish Fort Area Codes
Income in Spanish Fort
Income Overview in Spanish Fort
Per Capita Income in Spanish Fort is $40,969, while median incomes of families and households are $133,120 and $98,350 respectively.
| Characteristic | Number | Measure |
| Per Capita Income | 10,083 | $40,969 |
| Median Family Income | 2,375 | $133,120 |
| Mean Family Income | 2,375 | $139,009 |
| Median Household Income | 3,709 | $98,350 |
| Mean Household Income | 3,709 | $110,323 |
| Income Deficit | 2,375 | $0 |
| Wage / Income Gap (%) | 10,083 | 46.83% |
| Wage / Income Gap ($) | 10,083 | 53.17¢ per $1 |
| Gini / Inequality Index | 10,083 | 0.38 |
Earnings by Sex in Spanish Fort
Average Earnings in Spanish Fort are $52,378, $72,389 for men and $38,488 for women, a difference of 46.8%.
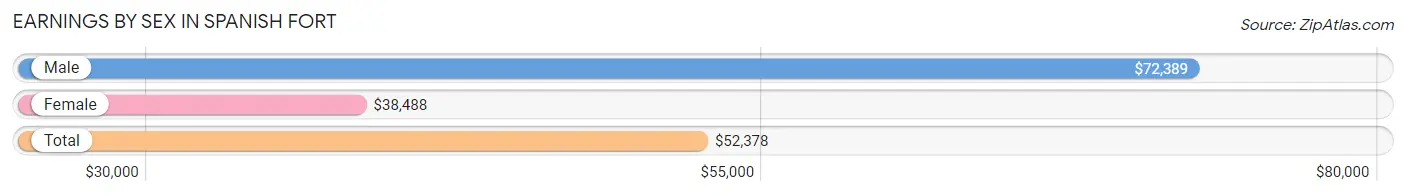
| Sex | Number | Average Earnings |
| Male | 2,874 (58.8%) | $72,389 |
| Female | 2,015 (41.2%) | $38,488 |
| Total | 4,889 (100.0%) | $52,378 |
Earnings by Sex by Income Bracket in Spanish Fort
The most common earnings brackets in Spanish Fort are $100,000+ for men (853 | 29.7%) and $50,000 to $54,999 for women (242 | 12.0%).
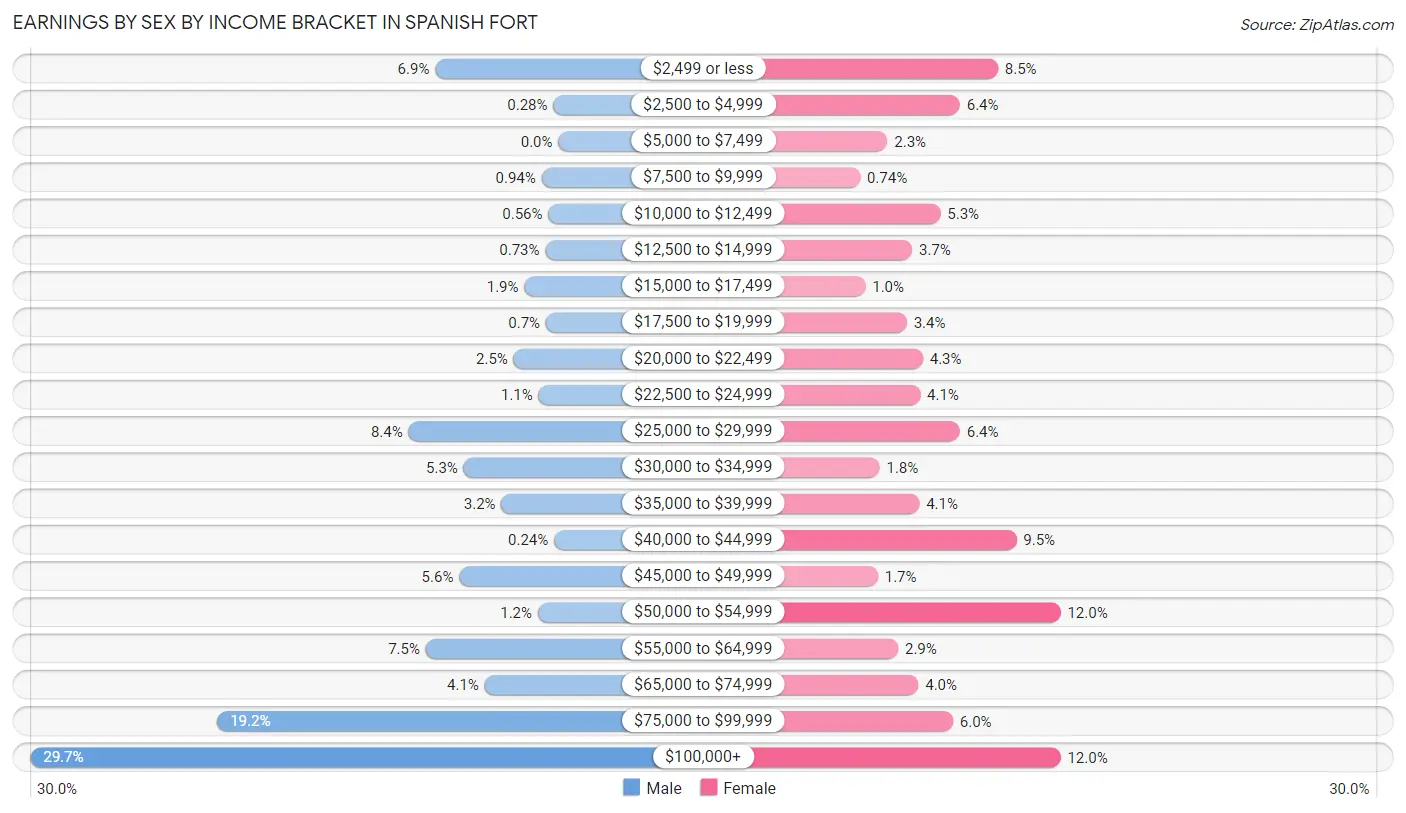
| Income | Male | Female |
| $2,499 or less | 199 (6.9%) | 171 (8.5%) |
| $2,500 to $4,999 | 8 (0.3%) | 128 (6.4%) |
| $5,000 to $7,499 | 0 (0.0%) | 46 (2.3%) |
| $7,500 to $9,999 | 27 (0.9%) | 15 (0.7%) |
| $10,000 to $12,499 | 16 (0.6%) | 106 (5.3%) |
| $12,500 to $14,999 | 21 (0.7%) | 74 (3.7%) |
| $15,000 to $17,499 | 55 (1.9%) | 21 (1.0%) |
| $17,500 to $19,999 | 20 (0.7%) | 68 (3.4%) |
| $20,000 to $22,499 | 72 (2.5%) | 86 (4.3%) |
| $22,500 to $24,999 | 32 (1.1%) | 83 (4.1%) |
| $25,000 to $29,999 | 242 (8.4%) | 128 (6.4%) |
| $30,000 to $34,999 | 153 (5.3%) | 37 (1.8%) |
| $35,000 to $39,999 | 92 (3.2%) | 82 (4.1%) |
| $40,000 to $44,999 | 7 (0.2%) | 192 (9.5%) |
| $45,000 to $49,999 | 160 (5.6%) | 35 (1.7%) |
| $50,000 to $54,999 | 33 (1.1%) | 242 (12.0%) |
| $55,000 to $64,999 | 214 (7.4%) | 58 (2.9%) |
| $65,000 to $74,999 | 119 (4.1%) | 81 (4.0%) |
| $75,000 to $99,999 | 551 (19.2%) | 120 (6.0%) |
| $100,000+ | 853 (29.7%) | 242 (12.0%) |
| Total | 2,874 (100.0%) | 2,015 (100.0%) |
Earnings by Sex by Educational Attainment in Spanish Fort
Average earnings in Spanish Fort are $81,719 for men and $40,717 for women, a difference of 50.2%. Men with an educational attainment of graduate degree enjoy the highest average annual earnings of $111,103, while those with high school diploma education earn the least with $60,270. Women with an educational attainment of graduate degree earn the most with the average annual earnings of $66,250, while those with college or associate's degree education have the smallest earnings of $24,236.
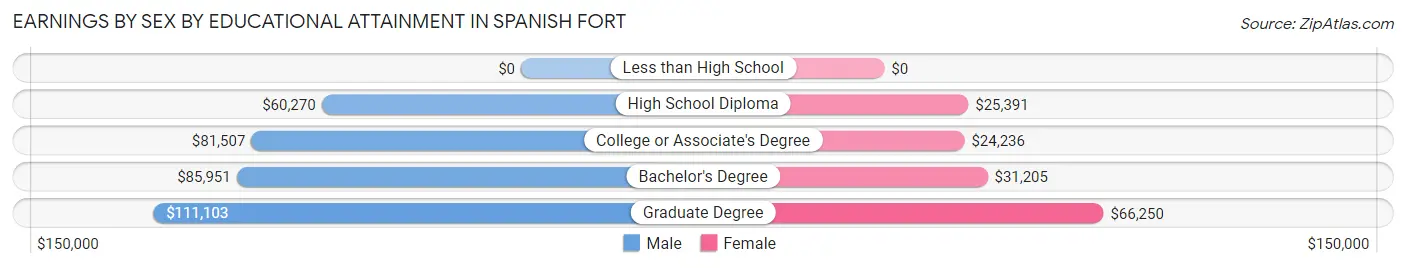
| Educational Attainment | Male Income | Female Income |
| Less than High School | - | - |
| High School Diploma | $60,270 | $25,391 |
| College or Associate's Degree | $81,507 | $24,236 |
| Bachelor's Degree | $85,951 | $31,205 |
| Graduate Degree | $111,103 | $66,250 |
| Total | $81,719 | $40,717 |
Family Income in Spanish Fort
Family Income Brackets in Spanish Fort
According to the Spanish Fort family income data, there are 686 families falling into the $100,000 to $149,999 income range, which is the most common income bracket and makes up 28.9% of all families.
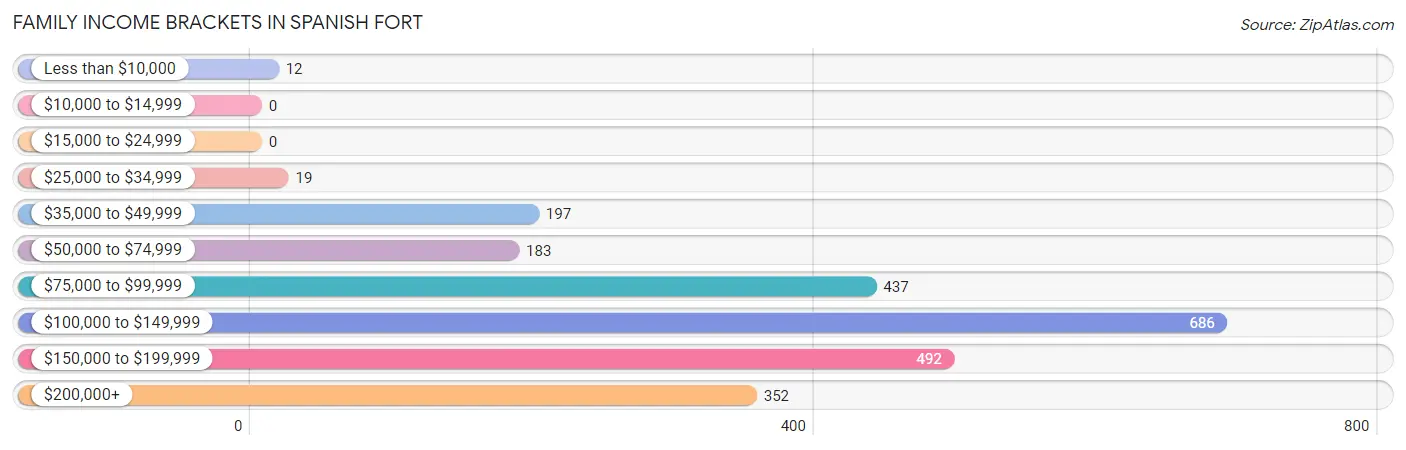
| Income Bracket | # Families | % Families |
| Less than $10,000 | 12 | 0.5% |
| $10,000 to $14,999 | 0 | 0.0% |
| $15,000 to $24,999 | 0 | 0.0% |
| $25,000 to $34,999 | 19 | 0.8% |
| $35,000 to $49,999 | 197 | 8.3% |
| $50,000 to $74,999 | 183 | 7.7% |
| $75,000 to $99,999 | 437 | 18.4% |
| $100,000 to $149,999 | 686 | 28.9% |
| $150,000 to $199,999 | 492 | 20.7% |
| $200,000+ | 352 | 14.8% |
Family Income by Famaliy Size in Spanish Fort
5-person families (315 | 13.3%) account for the highest median family income in Spanish Fort with $170,885 per family, while 2-person families (808 | 34.0%) have the highest median income of $55,510 per family member.
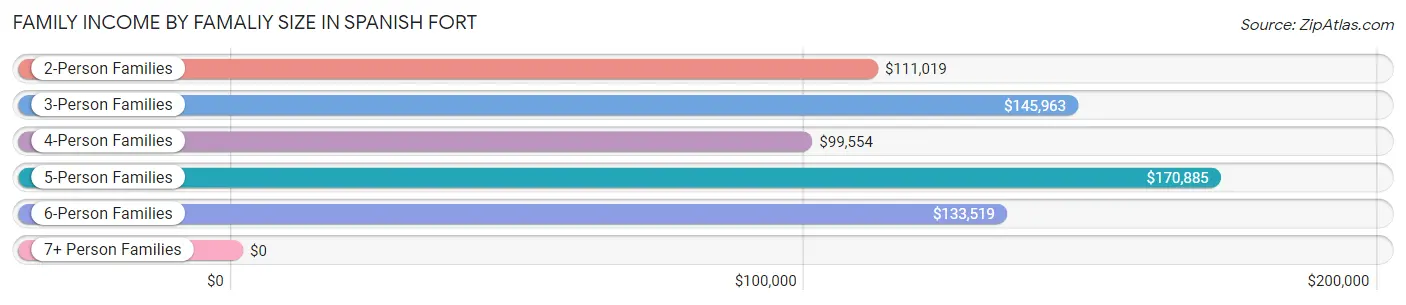
| Income Bracket | # Families | Median Income |
| 2-Person Families | 808 (34.0%) | $111,019 |
| 3-Person Families | 504 (21.2%) | $145,963 |
| 4-Person Families | 534 (22.5%) | $99,554 |
| 5-Person Families | 315 (13.3%) | $170,885 |
| 6-Person Families | 214 (9.0%) | $133,519 |
| 7+ Person Families | 0 (0.0%) | $0 |
| Total | 2,375 (100.0%) | $133,120 |
Family Income by Number of Earners in Spanish Fort
The median family income in Spanish Fort is $133,120, with families comprising 2 earners (1,240) having the highest median family income of $145,650, while families with 1 earner (669) have the lowest median family income of $86,370, accounting for 52.2% and 28.2% of families, respectively.
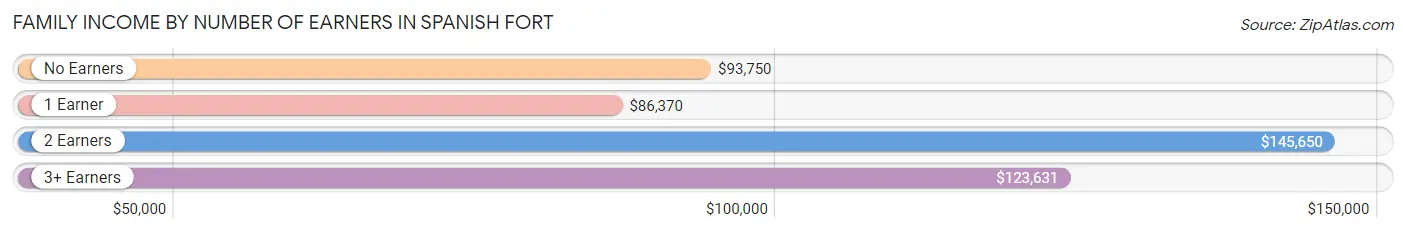
| Number of Earners | # Families | Median Income |
| No Earners | 241 (10.2%) | $93,750 |
| 1 Earner | 669 (28.2%) | $86,370 |
| 2 Earners | 1,240 (52.2%) | $145,650 |
| 3+ Earners | 225 (9.5%) | $123,631 |
| Total | 2,375 (100.0%) | $133,120 |
Household Income in Spanish Fort
Household Income Brackets in Spanish Fort
With 886 households falling in the category, the $100,000 to $149,999 income range is the most frequent in Spanish Fort, accounting for 23.9% of all households. In contrast, only 56 households (1.5%) fall into the $10,000 to $14,999 income bracket, making it the least populous group.
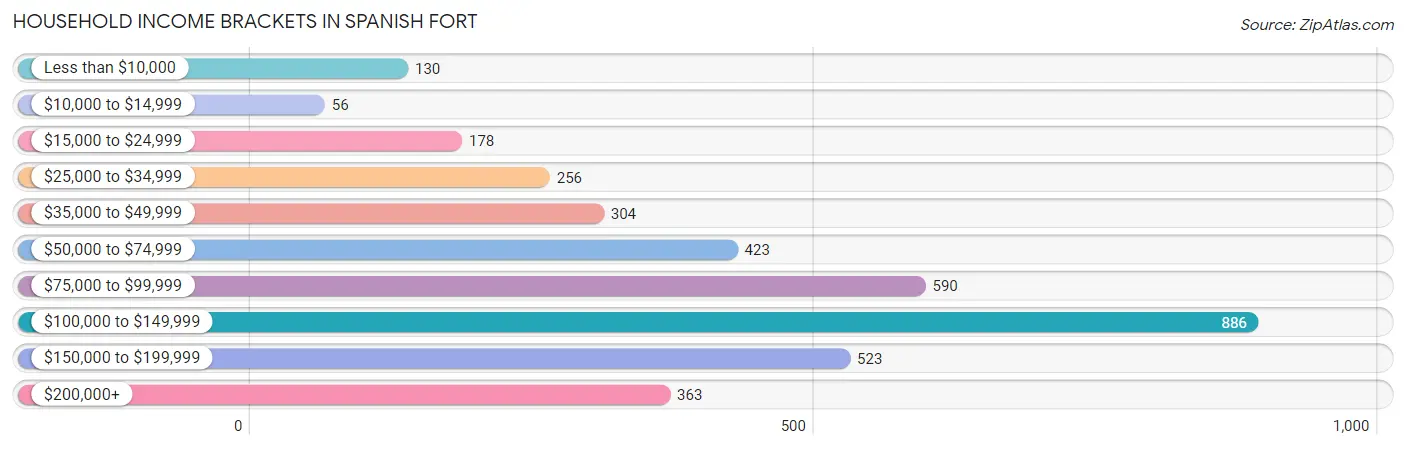
| Income Bracket | # Households | % Households |
| Less than $10,000 | 130 | 3.5% |
| $10,000 to $14,999 | 56 | 1.5% |
| $15,000 to $24,999 | 178 | 4.8% |
| $25,000 to $34,999 | 256 | 6.9% |
| $35,000 to $49,999 | 304 | 8.2% |
| $50,000 to $74,999 | 423 | 11.4% |
| $75,000 to $99,999 | 590 | 15.9% |
| $100,000 to $149,999 | 886 | 23.9% |
| $150,000 to $199,999 | 523 | 14.1% |
| $200,000+ | 363 | 9.8% |
Household Income by Householder Age in Spanish Fort
The median household income in Spanish Fort is $98,350, with the highest median household income of $134,213 found in the 45 to 64 years age bracket for the primary householder. A total of 1,513 households (40.8%) fall into this category. Meanwhile, the 15 to 24 years age bracket for the primary householder has the lowest median household income of $0, with 51 households (1.4%) in this group.
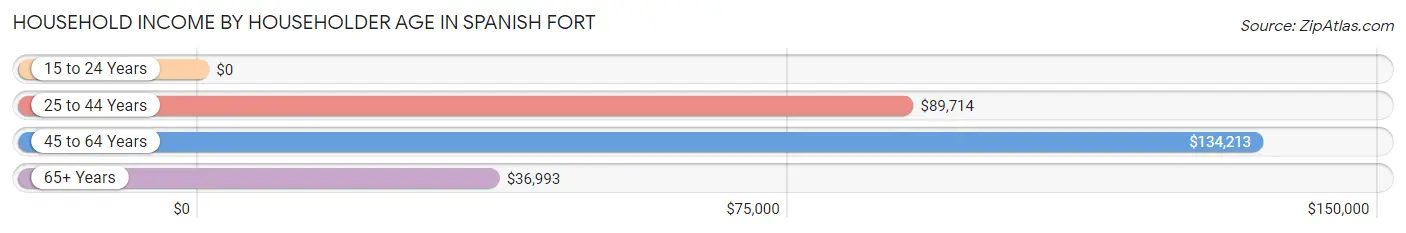
| Income Bracket | # Households | Median Income |
| 15 to 24 Years | 51 (1.4%) | $0 |
| 25 to 44 Years | 998 (26.9%) | $89,714 |
| 45 to 64 Years | 1,513 (40.8%) | $134,213 |
| 65+ Years | 1,147 (30.9%) | $36,993 |
| Total | 3,709 (100.0%) | $98,350 |
Poverty in Spanish Fort
Income Below Poverty by Sex and Age in Spanish Fort
With 1.1% poverty level for males and 6.1% for females among the residents of Spanish Fort, 75 year old and over males and 16 and 17 year old females are the most vulnerable to poverty, with 24 males (14.4%) and 21 females (52.5%) in their respective age groups living below the poverty level.
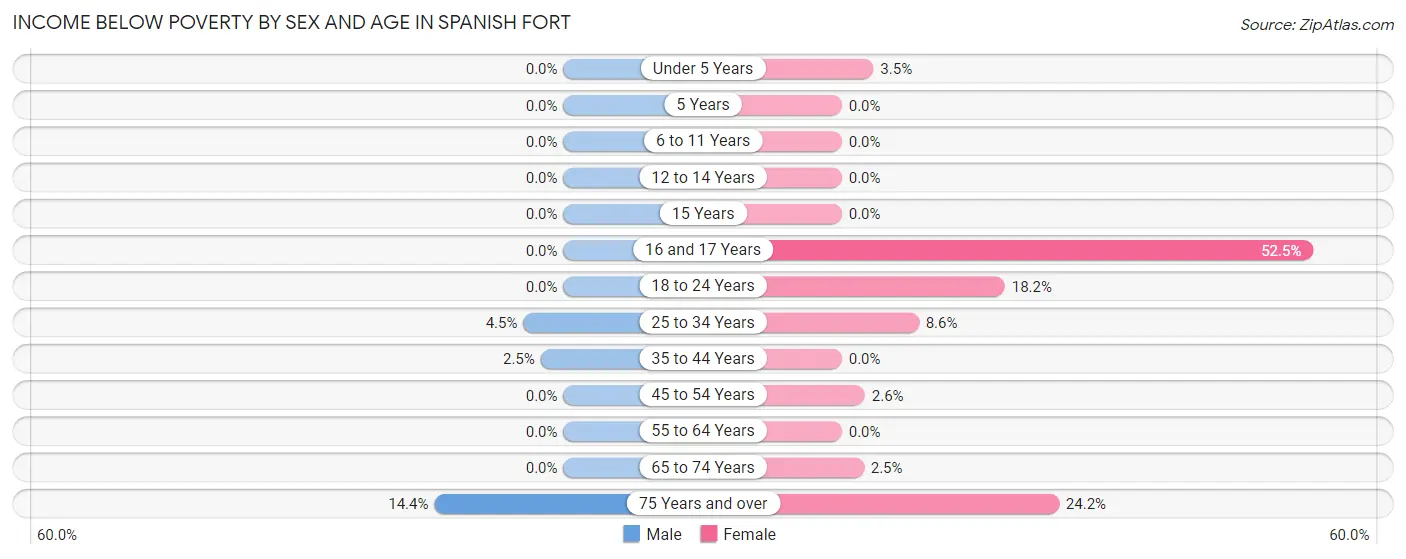
| Age Bracket | Male | Female |
| Under 5 Years | 0 (0.0%) | 12 (3.5%) |
| 5 Years | 0 (0.0%) | 0 (0.0%) |
| 6 to 11 Years | 0 (0.0%) | 0 (0.0%) |
| 12 to 14 Years | 0 (0.0%) | 0 (0.0%) |
| 15 Years | 0 (0.0%) | 0 (0.0%) |
| 16 and 17 Years | 0 (0.0%) | 21 (52.5%) |
| 18 to 24 Years | 0 (0.0%) | 61 (18.1%) |
| 25 to 34 Years | 21 (4.5%) | 45 (8.6%) |
| 35 to 44 Years | 13 (2.5%) | 0 (0.0%) |
| 45 to 54 Years | 0 (0.0%) | 9 (2.6%) |
| 55 to 64 Years | 0 (0.0%) | 0 (0.0%) |
| 65 to 74 Years | 0 (0.0%) | 15 (2.5%) |
| 75 Years and over | 24 (14.4%) | 140 (24.2%) |
| Total | 58 (1.1%) | 303 (6.1%) |
Income Above Poverty by Sex and Age in Spanish Fort
According to the poverty statistics in Spanish Fort, males aged under 5 years and females aged 5 years are the age groups that are most secure financially, with 100.0% of males and 100.0% of females in these age groups living above the poverty line.
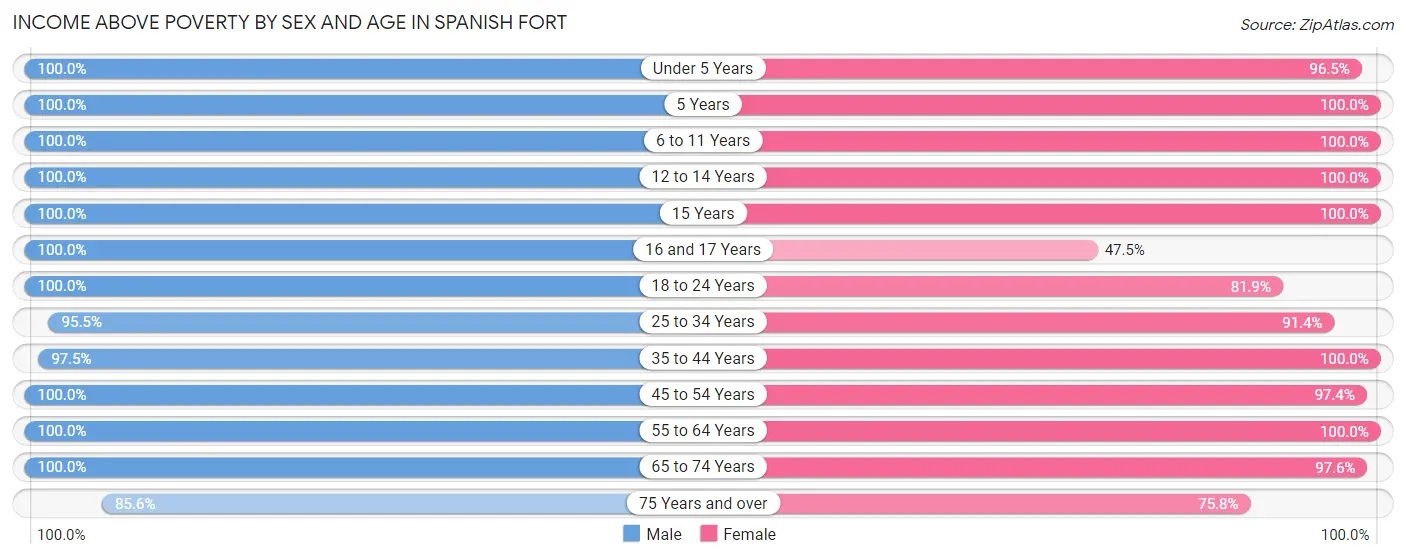
| Age Bracket | Male | Female |
| Under 5 Years | 420 (100.0%) | 329 (96.5%) |
| 5 Years | 71 (100.0%) | 64 (100.0%) |
| 6 to 11 Years | 635 (100.0%) | 426 (100.0%) |
| 12 to 14 Years | 167 (100.0%) | 235 (100.0%) |
| 15 Years | 87 (100.0%) | 167 (100.0%) |
| 16 and 17 Years | 92 (100.0%) | 19 (47.5%) |
| 18 to 24 Years | 631 (100.0%) | 275 (81.9%) |
| 25 to 34 Years | 450 (95.5%) | 480 (91.4%) |
| 35 to 44 Years | 501 (97.5%) | 477 (100.0%) |
| 45 to 54 Years | 794 (100.0%) | 341 (97.4%) |
| 55 to 64 Years | 638 (100.0%) | 776 (100.0%) |
| 65 to 74 Years | 401 (100.0%) | 598 (97.6%) |
| 75 Years and over | 143 (85.6%) | 439 (75.8%) |
| Total | 5,030 (98.9%) | 4,626 (93.9%) |
Income Below Poverty Among Married-Couple Families in Spanish Fort
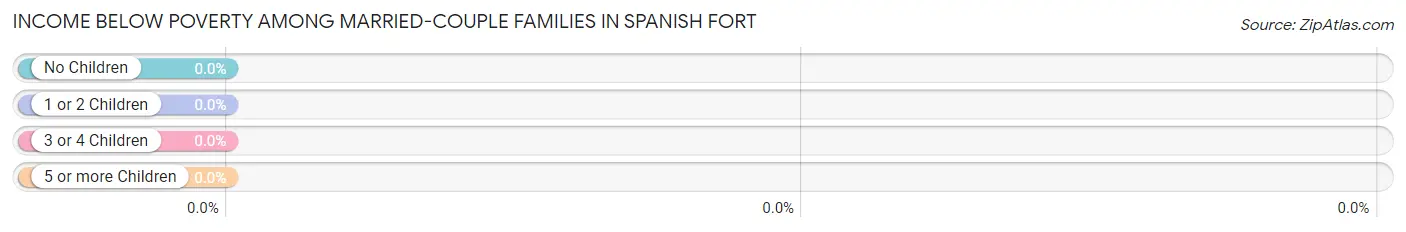
| Children | Above Poverty | Below Poverty |
| No Children | 846 (100.0%) | 0 (0.0%) |
| 1 or 2 Children | 871 (100.0%) | 0 (0.0%) |
| 3 or 4 Children | 324 (100.0%) | 0 (0.0%) |
| 5 or more Children | 0 (0.0%) | 0 (0.0%) |
| Total | 2,041 (100.0%) | 0 (0.0%) |
Income Below Poverty Among Single-Parent Households in Spanish Fort
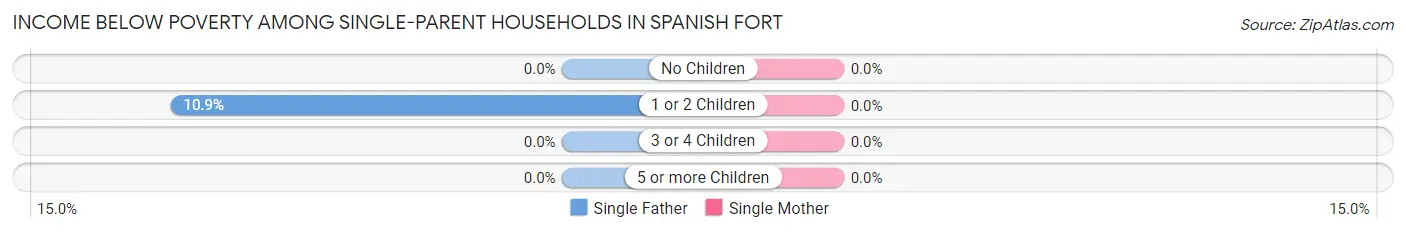
| Children | Single Father | Single Mother |
| No Children | 0 (0.0%) | 0 (0.0%) |
| 1 or 2 Children | 13 (10.9%) | 0 (0.0%) |
| 3 or 4 Children | 0 (0.0%) | 0 (0.0%) |
| 5 or more Children | 0 (0.0%) | 0 (0.0%) |
| Total | 13 (5.5%) | 0 (0.0%) |
Income Below Poverty Among Married-Couple vs Single-Parent Households in Spanish Fort
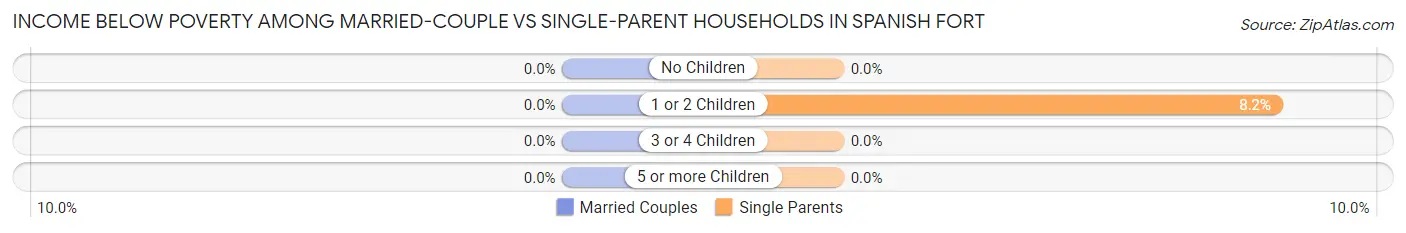
| Children | Married-Couple Families | Single-Parent Households |
| No Children | 0 (0.0%) | 0 (0.0%) |
| 1 or 2 Children | 0 (0.0%) | 13 (8.2%) |
| 3 or 4 Children | 0 (0.0%) | 0 (0.0%) |
| 5 or more Children | 0 (0.0%) | 0 (0.0%) |
| Total | 0 (0.0%) | 13 (3.9%) |
Race in Spanish Fort
The most populous races in Spanish Fort are White / Caucasian (8,362 | 82.9%), Black / African American (879 | 8.7%), and Two or more Races (774 | 7.7%).
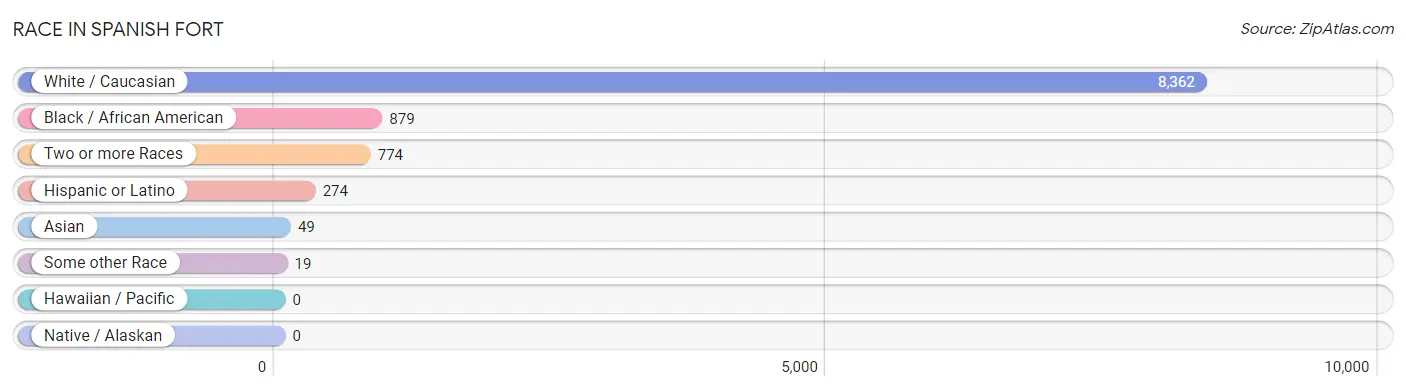
| Race | # Population | % Population |
| Asian | 49 | 0.5% |
| Black / African American | 879 | 8.7% |
| Hawaiian / Pacific | 0 | 0.0% |
| Hispanic or Latino | 274 | 2.7% |
| Native / Alaskan | 0 | 0.0% |
| White / Caucasian | 8,362 | 82.9% |
| Two or more Races | 774 | 7.7% |
| Some other Race | 19 | 0.2% |
| Total | 10,083 | 100.0% |
Ancestry in Spanish Fort
The most populous ancestries reported in Spanish Fort are American (2,358 | 23.4%), English (1,953 | 19.4%), German (746 | 7.4%), Irish (627 | 6.2%), and Native Hawaiian (502 | 5.0%), together accounting for 61.4% of all Spanish Fort residents.
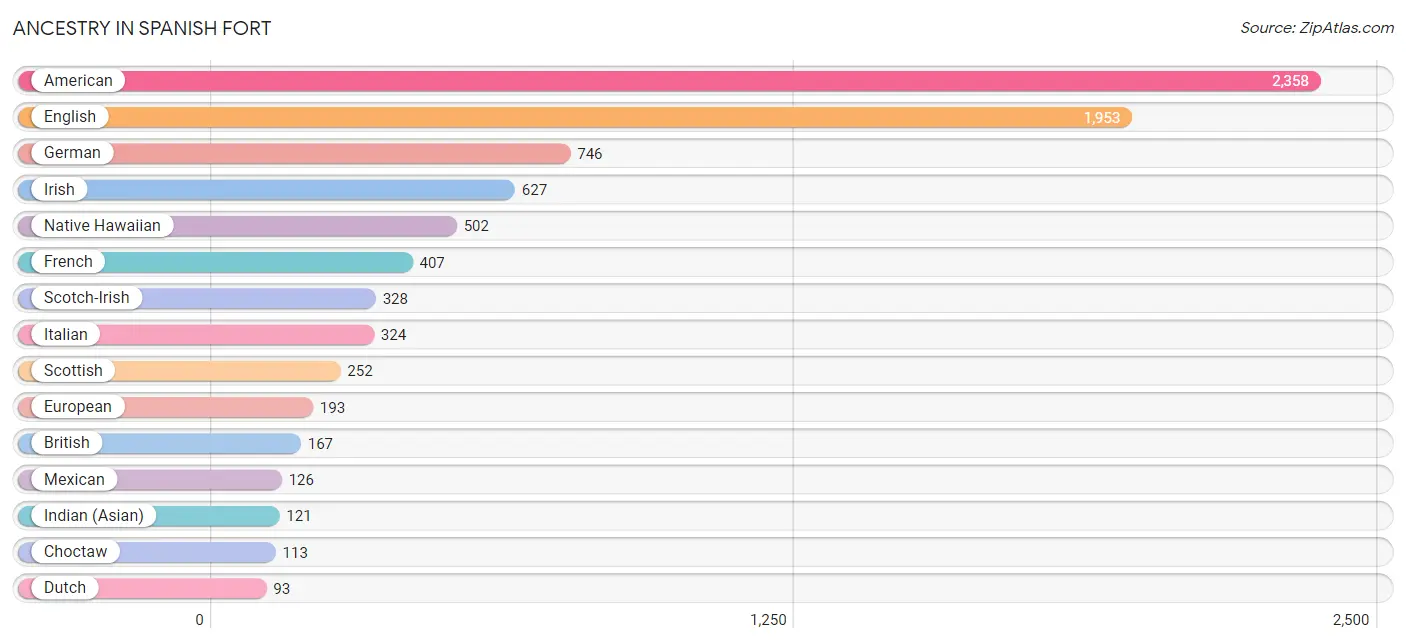
| Ancestry | # Population | % Population |
| African | 19 | 0.2% |
| American | 2,358 | 23.4% |
| Austrian | 15 | 0.2% |
| British | 167 | 1.7% |
| Burmese | 11 | 0.1% |
| Canadian | 25 | 0.3% |
| Central American | 62 | 0.6% |
| Cherokee | 7 | 0.1% |
| Choctaw | 113 | 1.1% |
| Colombian | 26 | 0.3% |
| Czech | 20 | 0.2% |
| Danish | 24 | 0.2% |
| Dutch | 93 | 0.9% |
| English | 1,953 | 19.4% |
| European | 193 | 1.9% |
| French | 407 | 4.0% |
| French Canadian | 20 | 0.2% |
| German | 746 | 7.4% |
| Greek | 9 | 0.1% |
| Honduran | 43 | 0.4% |
| Hungarian | 28 | 0.3% |
| Indian (Asian) | 121 | 1.2% |
| Irish | 627 | 6.2% |
| Italian | 324 | 3.2% |
| Korean | 42 | 0.4% |
| Mexican | 126 | 1.3% |
| Native Hawaiian | 502 | 5.0% |
| Norwegian | 60 | 0.6% |
| Panamanian | 19 | 0.2% |
| Polish | 12 | 0.1% |
| Portuguese | 39 | 0.4% |
| Romanian | 24 | 0.2% |
| Scotch-Irish | 328 | 3.3% |
| Scottish | 252 | 2.5% |
| South American | 26 | 0.3% |
| Spaniard | 20 | 0.2% |
| Subsaharan African | 19 | 0.2% |
| Swedish | 76 | 0.7% |
| Swiss | 25 | 0.3% |
| Ukrainian | 87 | 0.9% |
| Welsh | 15 | 0.2% | View All 41 Rows |
Immigrants in Spanish Fort
The most numerous immigrant groups reported in Spanish Fort came from Europe (253 | 2.5%), France (123 | 1.2%), Western Europe (123 | 1.2%), Latin America (118 | 1.2%), and Central America (92 | 0.9%), together accounting for 7.0% of all Spanish Fort residents.
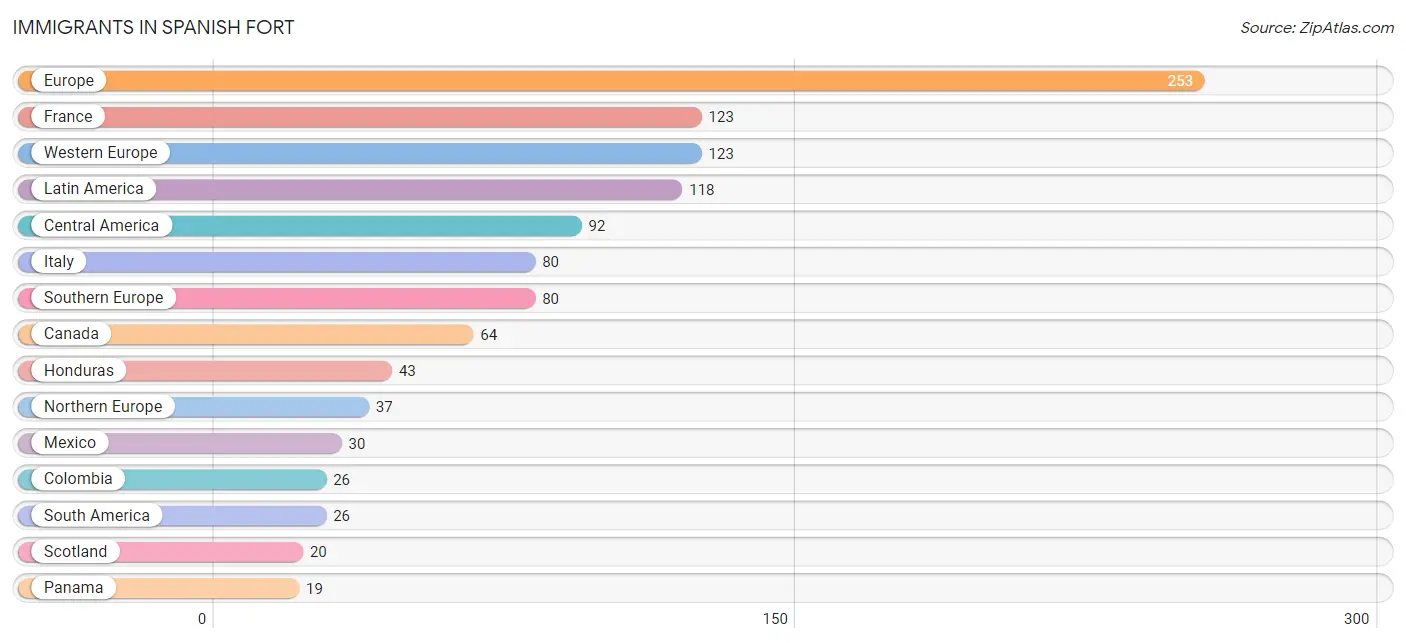
| Immigration Origin | # Population | % Population |
| Asia | 7 | 0.1% |
| Canada | 64 | 0.6% |
| Central America | 92 | 0.9% |
| China | 7 | 0.1% |
| Colombia | 26 | 0.3% |
| Eastern Asia | 7 | 0.1% |
| Eastern Europe | 13 | 0.1% |
| England | 3 | 0.0% |
| Europe | 253 | 2.5% |
| France | 123 | 1.2% |
| Honduras | 43 | 0.4% |
| Italy | 80 | 0.8% |
| Latin America | 118 | 1.2% |
| Mexico | 30 | 0.3% |
| Northern Europe | 37 | 0.4% |
| Panama | 19 | 0.2% |
| Poland | 2 | 0.0% |
| Romania | 11 | 0.1% |
| Scotland | 20 | 0.2% |
| South America | 26 | 0.3% |
| Southern Europe | 80 | 0.8% |
| Western Europe | 123 | 1.2% | View All 22 Rows |
Sex and Age in Spanish Fort
Sex and Age in Spanish Fort
The most populous age groups in Spanish Fort are 5 to 9 Years (549 | 10.7%) for men and 55 to 59 Years (534 | 10.7%) for women.
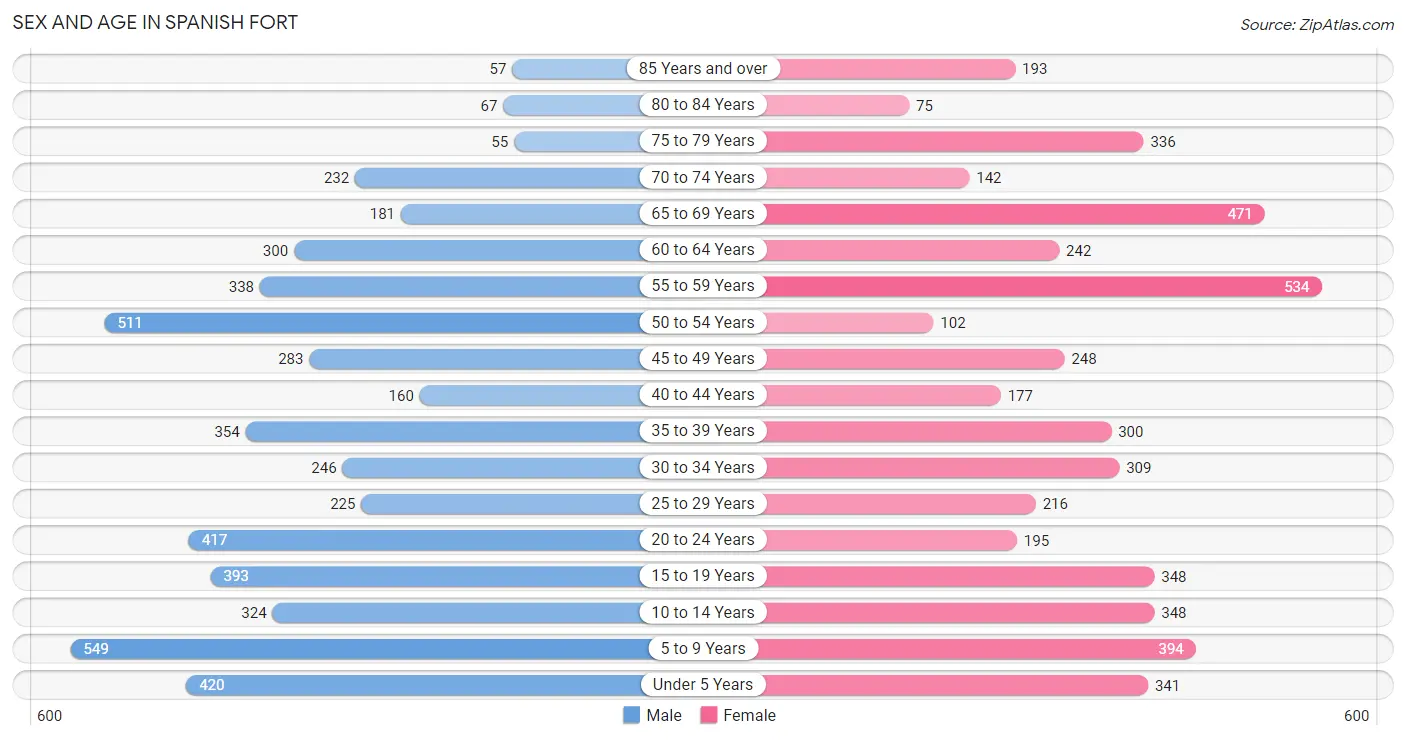
| Age Bracket | Male | Female |
| Under 5 Years | 420 (8.2%) | 341 (6.9%) |
| 5 to 9 Years | 549 (10.7%) | 394 (7.9%) |
| 10 to 14 Years | 324 (6.3%) | 348 (7.0%) |
| 15 to 19 Years | 393 (7.7%) | 348 (7.0%) |
| 20 to 24 Years | 417 (8.2%) | 195 (3.9%) |
| 25 to 29 Years | 225 (4.4%) | 216 (4.3%) |
| 30 to 34 Years | 246 (4.8%) | 309 (6.2%) |
| 35 to 39 Years | 354 (6.9%) | 300 (6.0%) |
| 40 to 44 Years | 160 (3.1%) | 177 (3.6%) |
| 45 to 49 Years | 283 (5.5%) | 248 (5.0%) |
| 50 to 54 Years | 511 (10.0%) | 102 (2.1%) |
| 55 to 59 Years | 338 (6.6%) | 534 (10.7%) |
| 60 to 64 Years | 300 (5.9%) | 242 (4.9%) |
| 65 to 69 Years | 181 (3.5%) | 471 (9.5%) |
| 70 to 74 Years | 232 (4.5%) | 142 (2.9%) |
| 75 to 79 Years | 55 (1.1%) | 336 (6.8%) |
| 80 to 84 Years | 67 (1.3%) | 75 (1.5%) |
| 85 Years and over | 57 (1.1%) | 193 (3.9%) |
| Total | 5,112 (100.0%) | 4,971 (100.0%) |
Families and Households in Spanish Fort
Median Family Size in Spanish Fort
The median family size in Spanish Fort is 3.48 persons per family, with married-couple families (2,041 | 85.9%) accounting for the largest median family size of 3.58 persons per family. On the other hand, single male/father families (235 | 9.9%) represent the smallest median family size with 2.80 persons per family.
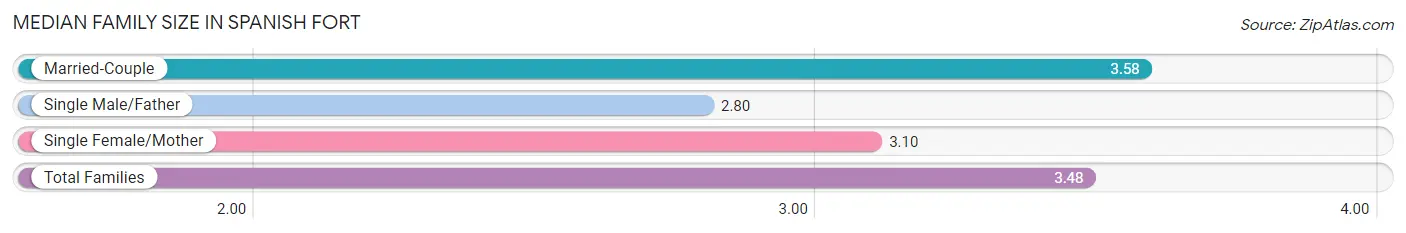
| Family Type | # Families | Family Size |
| Married-Couple | 2,041 (85.9%) | 3.58 |
| Single Male/Father | 235 (9.9%) | 2.80 |
| Single Female/Mother | 99 (4.2%) | 3.10 |
| Total Families | 2,375 (100.0%) | 3.48 |
Median Household Size in Spanish Fort
The median household size in Spanish Fort is 2.71 persons per household, with single female/mother households (99 | 2.7%) accounting for the largest median household size of 3.59 persons per household. non-family households (1,334 | 36.0%) represent the smallest median household size with 1.25 persons per household.
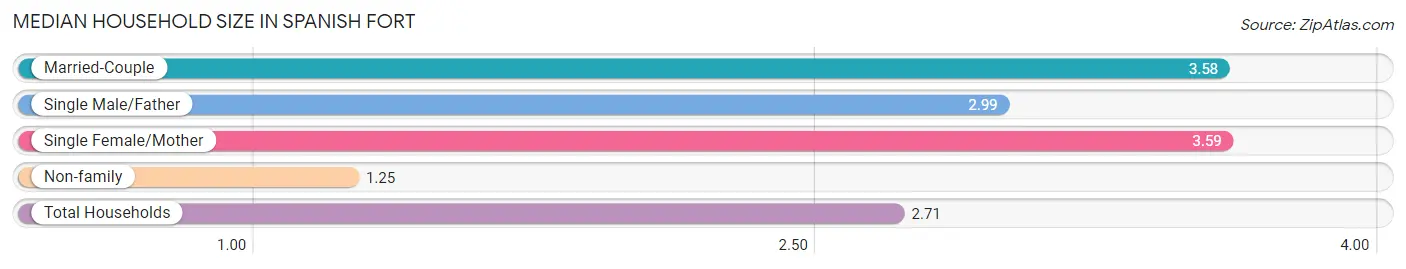
| Household Type | # Households | Household Size |
| Married-Couple | 2,041 (55.0%) | 3.58 |
| Single Male/Father | 235 (6.3%) | 2.99 |
| Single Female/Mother | 99 (2.7%) | 3.59 |
| Non-family | 1,334 (36.0%) | 1.25 |
| Total Households | 3,709 (100.0%) | 2.71 |
Household Size by Marriage Status in Spanish Fort
Out of a total of 3,709 households in Spanish Fort, 2,375 (64.0%) are family households, while 1,334 (36.0%) are nonfamily households. The most numerous type of family households are 2-person households, comprising 789, and the most common type of nonfamily households are 1-person households, comprising 1,083.
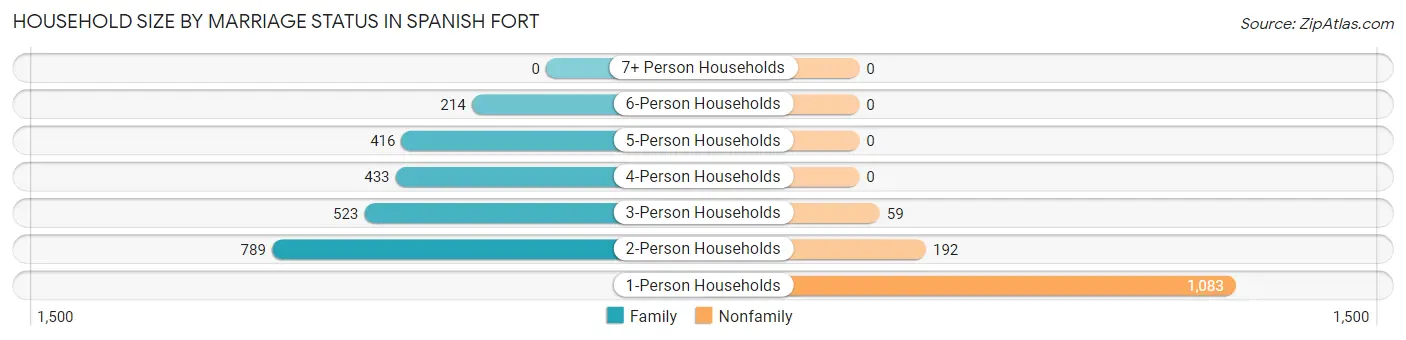
| Household Size | Family Households | Nonfamily Households |
| 1-Person Households | - | 1,083 (29.2%) |
| 2-Person Households | 789 (21.3%) | 192 (5.2%) |
| 3-Person Households | 523 (14.1%) | 59 (1.6%) |
| 4-Person Households | 433 (11.7%) | 0 (0.0%) |
| 5-Person Households | 416 (11.2%) | 0 (0.0%) |
| 6-Person Households | 214 (5.8%) | 0 (0.0%) |
| 7+ Person Households | 0 (0.0%) | 0 (0.0%) |
| Total | 2,375 (64.0%) | 1,334 (36.0%) |
Female Fertility in Spanish Fort
Fertility by Age in Spanish Fort
Average fertility rate in Spanish Fort is 64.0 births per 1,000 women. Women in the age bracket of 35 to 50 years have the highest fertility rate with 140.0 births per 1,000 women. Women in the age bracket of 35 to 50 years acount for 92.4% of all women with births.
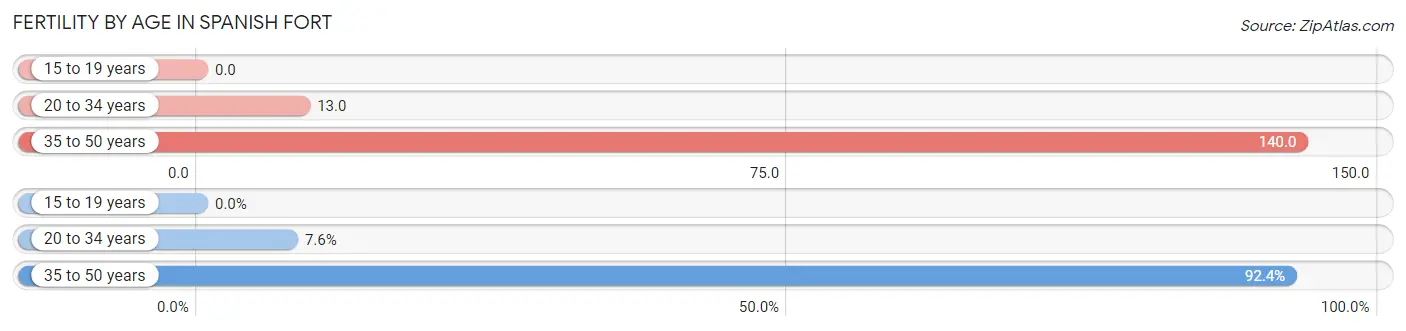
| Age Bracket | Women with Births | Births / 1,000 Women |
| 15 to 19 years | 0 (0.0%) | 0.0 |
| 20 to 34 years | 9 (7.6%) | 13.0 |
| 35 to 50 years | 109 (92.4%) | 140.0 |
| Total | 118 (100.0%) | 64.0 |
Fertility by Age by Marriage Status in Spanish Fort
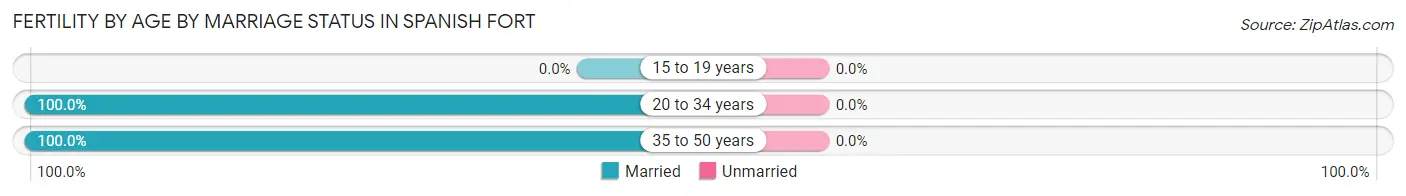
| Age Bracket | Married | Unmarried |
| 15 to 19 years | 0 (0.0%) | 0 (0.0%) |
| 20 to 34 years | 9 (100.0%) | 0 (0.0%) |
| 35 to 50 years | 109 (100.0%) | 0 (0.0%) |
| Total | 118 (100.0%) | 0 (0.0%) |
Fertility by Education in Spanish Fort
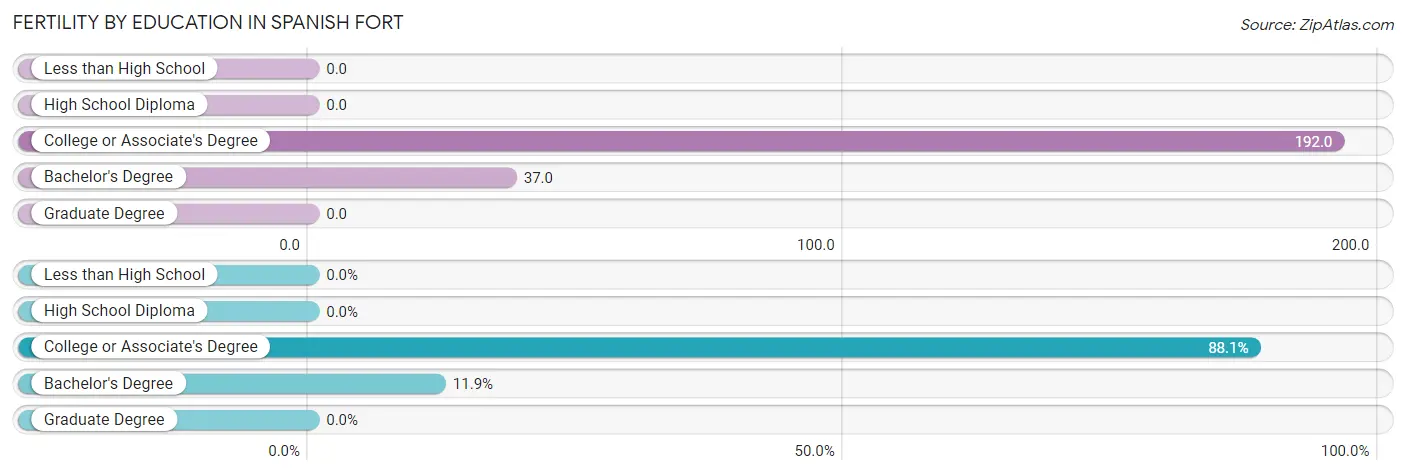
| Educational Attainment | Women with Births | Births / 1,000 Women |
| Less than High School | 0 (0.0%) | 0.0 |
| High School Diploma | 0 (0.0%) | 0.0 |
| College or Associate's Degree | 104 (88.1%) | 192.0 |
| Bachelor's Degree | 14 (11.9%) | 37.0 |
| Graduate Degree | 0 (0.0%) | 0.0 |
| Total | 118 (100.0%) | 64.0 |
Fertility by Education by Marriage Status in Spanish Fort
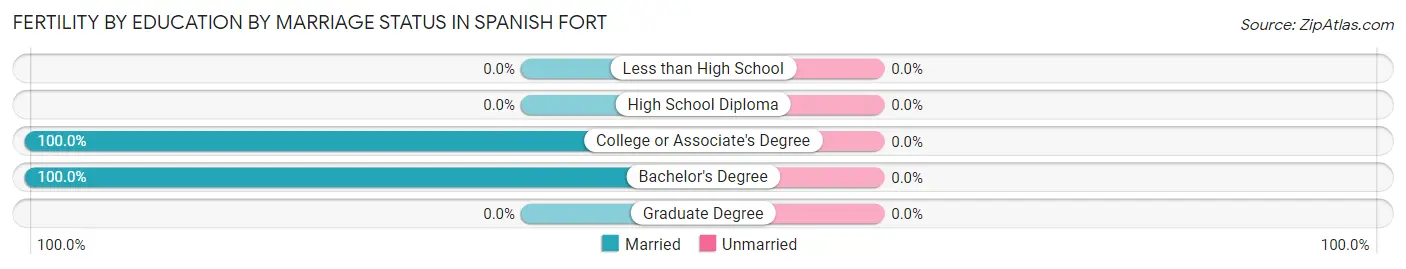
| Educational Attainment | Married | Unmarried |
| Less than High School | 0 (0.0%) | 0 (0.0%) |
| High School Diploma | 0 (0.0%) | 0 (0.0%) |
| College or Associate's Degree | 104 (100.0%) | 0 (0.0%) |
| Bachelor's Degree | 14 (100.0%) | 0 (0.0%) |
| Graduate Degree | 0 (0.0%) | 0 (0.0%) |
| Total | 118 (100.0%) | 0 (0.0%) |
Employment Characteristics in Spanish Fort
Employment by Class of Employer in Spanish Fort
Among the 4,580 employed individuals in Spanish Fort, private company employees (3,139 | 68.5%), local government employees (436 | 9.5%), and self-employed (not incorporated) (317 | 6.9%) make up the most common classes of employment.
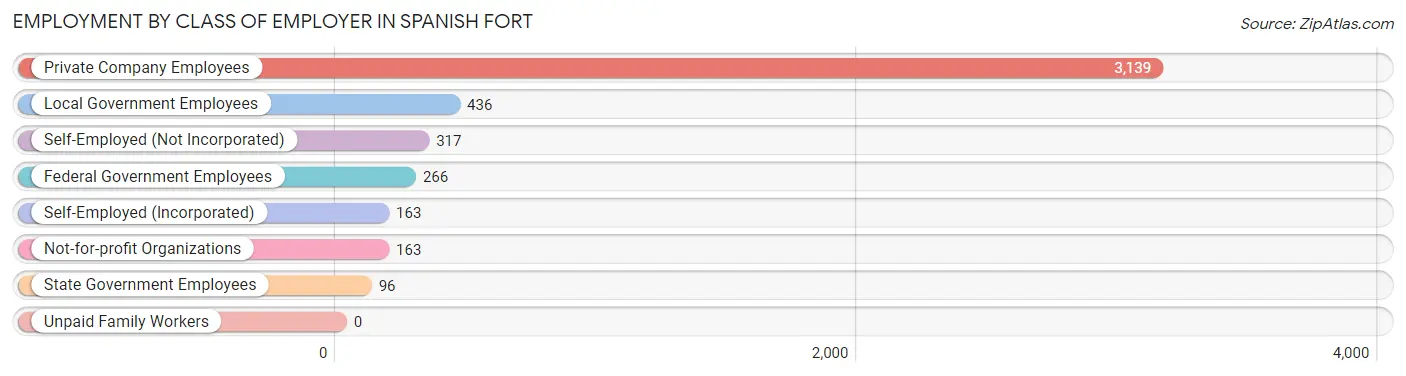
| Employer Class | # Employees | % Employees |
| Private Company Employees | 3,139 | 68.5% |
| Self-Employed (Incorporated) | 163 | 3.6% |
| Self-Employed (Not Incorporated) | 317 | 6.9% |
| Not-for-profit Organizations | 163 | 3.6% |
| Local Government Employees | 436 | 9.5% |
| State Government Employees | 96 | 2.1% |
| Federal Government Employees | 266 | 5.8% |
| Unpaid Family Workers | 0 | 0.0% |
| Total | 4,580 | 100.0% |
Employment Status by Age in Spanish Fort
According to the labor force statistics for Spanish Fort, out of the total population over 16 years of age (7,453), 63.7% or 4,748 individuals are in the labor force, with 1.9% or 90 of them unemployed. The age group with the highest labor force participation rate is 30 to 34 years, with 91.4% or 507 individuals in the labor force. Within the labor force, the 20 to 24 years age range has the highest percentage of unemployed individuals, with 15.0% or 46 of them being unemployed.
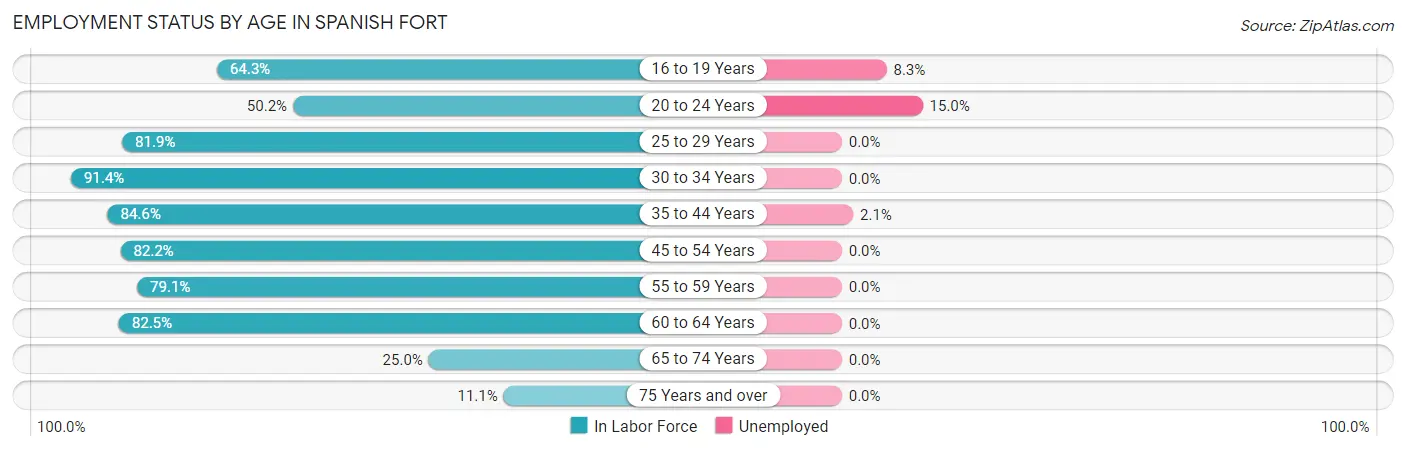
| Age Bracket | In Labor Force | Unemployed |
| 16 to 19 Years | 313 (64.3%) | 26 (8.3%) |
| 20 to 24 Years | 307 (50.2%) | 46 (15.0%) |
| 25 to 29 Years | 361 (81.9%) | 0 (0.0%) |
| 30 to 34 Years | 507 (91.4%) | 0 (0.0%) |
| 35 to 44 Years | 838 (84.6%) | 18 (2.1%) |
| 45 to 54 Years | 940 (82.2%) | 0 (0.0%) |
| 55 to 59 Years | 690 (79.1%) | 0 (0.0%) |
| 60 to 64 Years | 447 (82.5%) | 0 (0.0%) |
| 65 to 74 Years | 256 (25.0%) | 0 (0.0%) |
| 75 Years and over | 87 (11.1%) | 0 (0.0%) |
| Total | 4,748 (63.7%) | 90 (1.9%) |
Employment Status by Educational Attainment in Spanish Fort
According to labor force statistics for Spanish Fort, 83.2% of individuals (3,781) out of the total population between 25 and 64 years of age (4,545) are in the labor force, with 0.5% or 19 of them being unemployed. The group with the highest labor force participation rate are those with the educational attainment of less than high school, with 94.8% or 109 individuals in the labor force. Within the labor force, individuals with bachelor's degree or higher education have the highest percentage of unemployment, with 0.8% or 17 of them being unemployed.
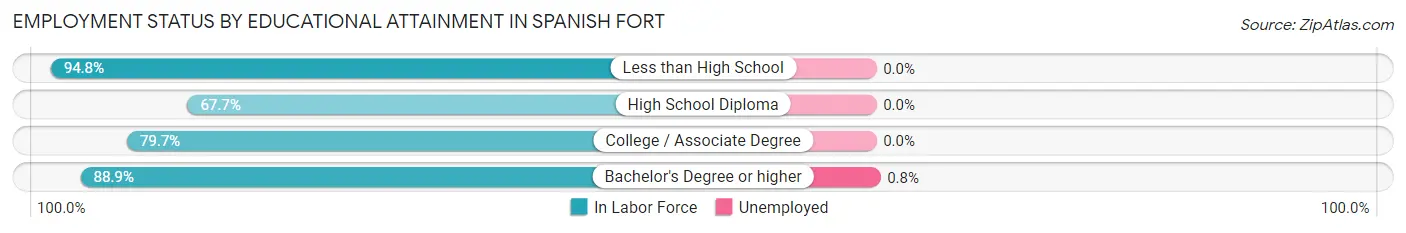
| Educational Attainment | In Labor Force | Unemployed |
| Less than High School | 109 (94.8%) | 0 (0.0%) |
| High School Diploma | 411 (67.7%) | 0 (0.0%) |
| College / Associate Degree | 1,176 (79.7%) | 0 (0.0%) |
| Bachelor's Degree or higher | 2,087 (88.9%) | 19 (0.8%) |
| Total | 3,781 (83.2%) | 23 (0.5%) |
Employment Occupations by Sex in Spanish Fort
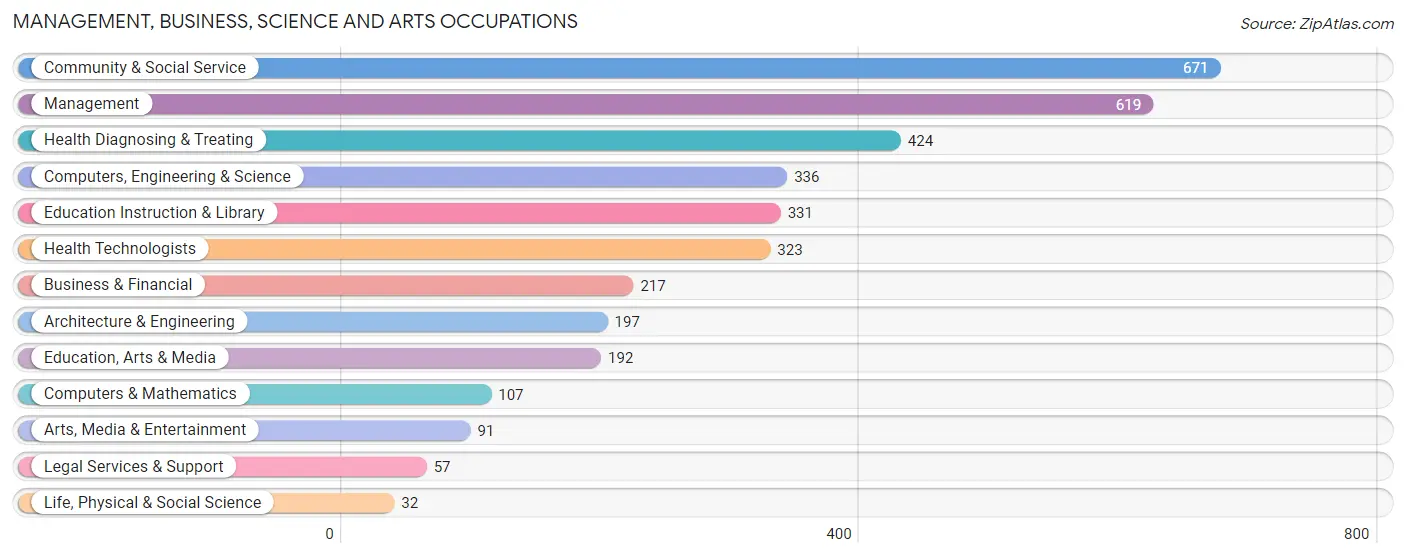
Management, Business, Science and Arts Occupations
The most common Management, Business, Science and Arts occupations in Spanish Fort are Community & Social Service (671 | 14.7%), Management (619 | 13.6%), Health Diagnosing & Treating (424 | 9.3%), Computers, Engineering & Science (336 | 7.4%), and Education Instruction & Library (331 | 7.3%).
Management, Business, Science and Arts Occupations by Sex
Within the Management, Business, Science and Arts occupations in Spanish Fort, the most male-oriented occupations are Life, Physical & Social Science (100.0%), Computers & Mathematics (93.5%), and Computers, Engineering & Science (84.2%), while the most female-oriented occupations are Education Instruction & Library (100.0%), Community & Social Service (84.5%), and Education, Arts & Media (80.2%).
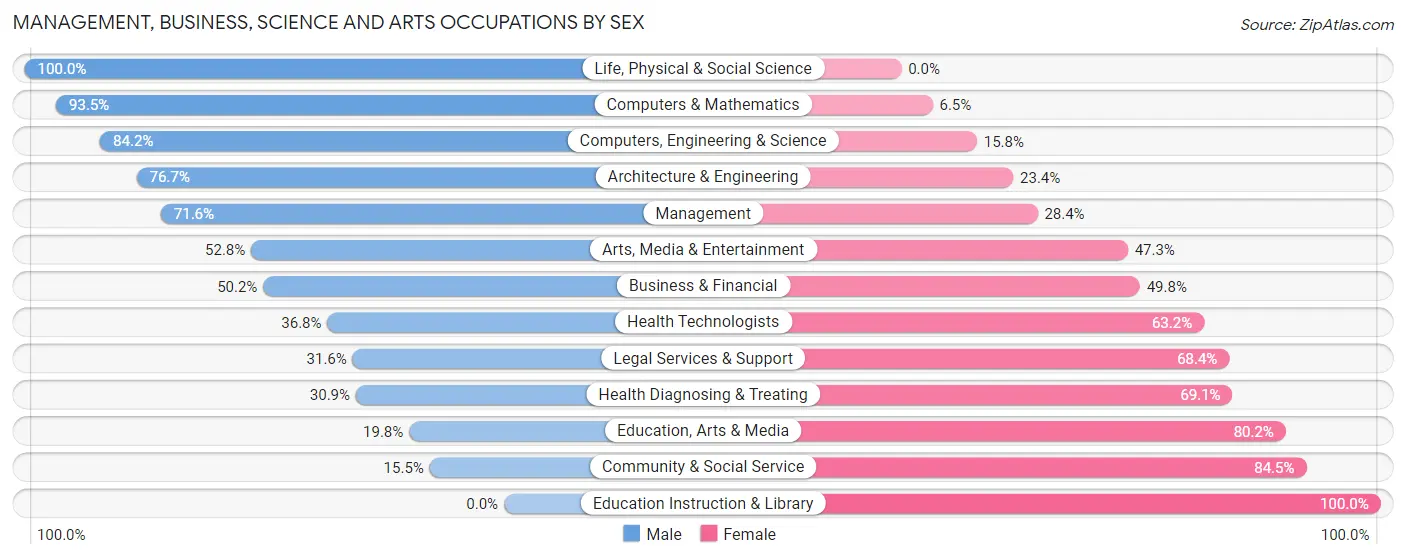
| Occupation | Male | Female |
| Management | 443 (71.6%) | 176 (28.4%) |
| Business & Financial | 109 (50.2%) | 108 (49.8%) |
| Computers, Engineering & Science | 283 (84.2%) | 53 (15.8%) |
| Computers & Mathematics | 100 (93.5%) | 7 (6.5%) |
| Architecture & Engineering | 151 (76.6%) | 46 (23.4%) |
| Life, Physical & Social Science | 32 (100.0%) | 0 (0.0%) |
| Community & Social Service | 104 (15.5%) | 567 (84.5%) |
| Education, Arts & Media | 38 (19.8%) | 154 (80.2%) |
| Legal Services & Support | 18 (31.6%) | 39 (68.4%) |
| Education Instruction & Library | 0 (0.0%) | 331 (100.0%) |
| Arts, Media & Entertainment | 48 (52.7%) | 43 (47.2%) |
| Health Diagnosing & Treating | 131 (30.9%) | 293 (69.1%) |
| Health Technologists | 119 (36.8%) | 204 (63.2%) |
| Total (Category) | 1,070 (47.2%) | 1,197 (52.8%) |
| Total (Overall) | 2,711 (59.4%) | 1,851 (40.6%) |
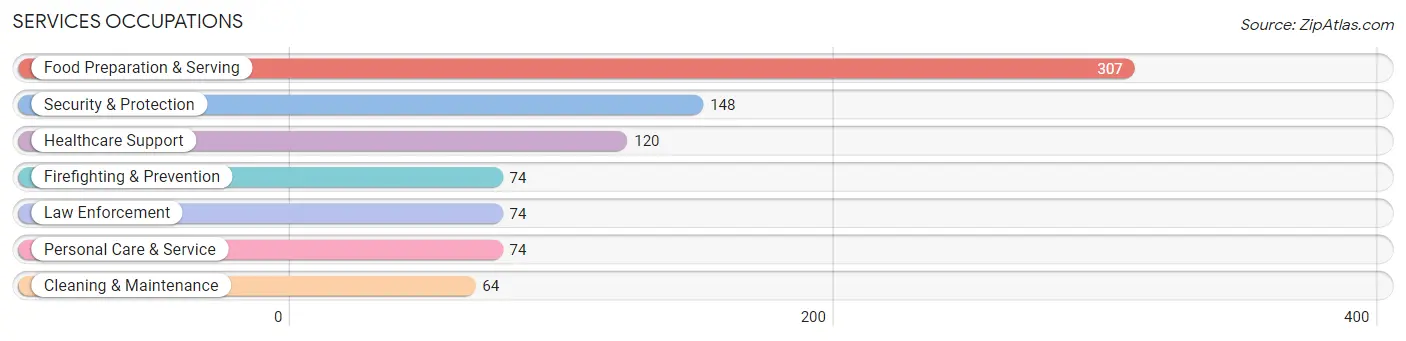
Services Occupations
The most common Services occupations in Spanish Fort are Food Preparation & Serving (307 | 6.7%), Security & Protection (148 | 3.2%), Healthcare Support (120 | 2.6%), Firefighting & Prevention (74 | 1.6%), and Law Enforcement (74 | 1.6%).
Services Occupations by Sex
Within the Services occupations in Spanish Fort, the most male-oriented occupations are Security & Protection (100.0%), Firefighting & Prevention (100.0%), and Law Enforcement (100.0%), while the most female-oriented occupations are Food Preparation & Serving (26.4%), Healthcare Support (25.8%), and Cleaning & Maintenance (20.3%).
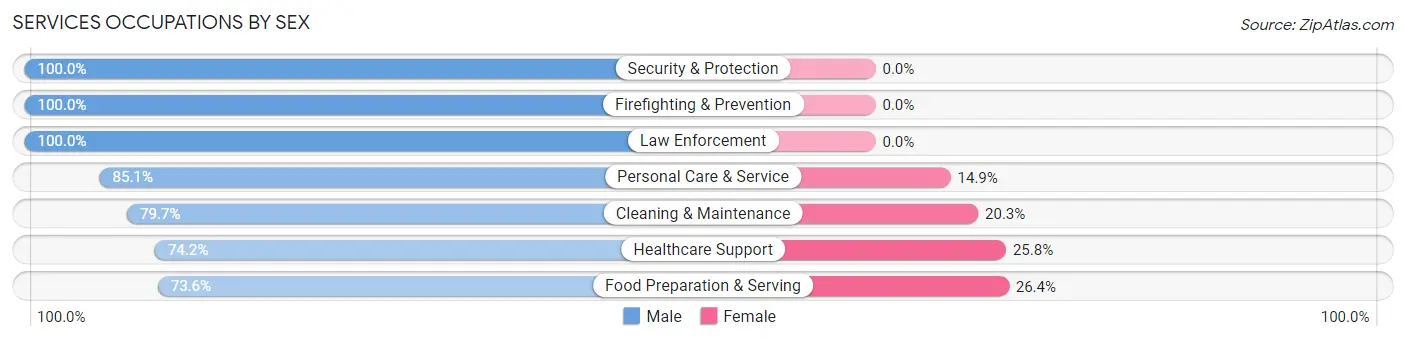
| Occupation | Male | Female |
| Healthcare Support | 89 (74.2%) | 31 (25.8%) |
| Security & Protection | 148 (100.0%) | 0 (0.0%) |
| Firefighting & Prevention | 74 (100.0%) | 0 (0.0%) |
| Law Enforcement | 74 (100.0%) | 0 (0.0%) |
| Food Preparation & Serving | 226 (73.6%) | 81 (26.4%) |
| Cleaning & Maintenance | 51 (79.7%) | 13 (20.3%) |
| Personal Care & Service | 63 (85.1%) | 11 (14.9%) |
| Total (Category) | 577 (80.9%) | 136 (19.1%) |
| Total (Overall) | 2,711 (59.4%) | 1,851 (40.6%) |
Sales and Office Occupations
The most common Sales and Office occupations in Spanish Fort are Sales & Related (605 | 13.3%), and Office & Administration (345 | 7.6%).

Sales and Office Occupations by Sex
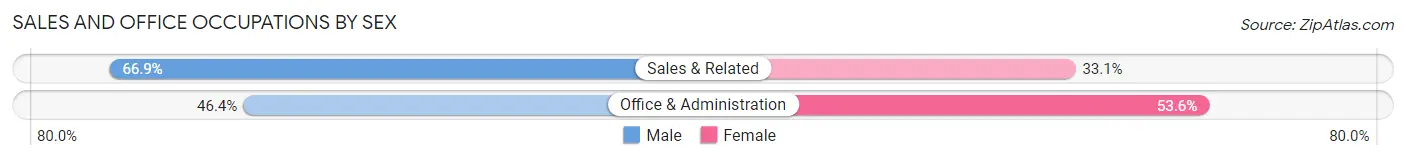
| Occupation | Male | Female |
| Sales & Related | 405 (66.9%) | 200 (33.1%) |
| Office & Administration | 160 (46.4%) | 185 (53.6%) |
| Total (Category) | 565 (59.5%) | 385 (40.5%) |
| Total (Overall) | 2,711 (59.4%) | 1,851 (40.6%) |
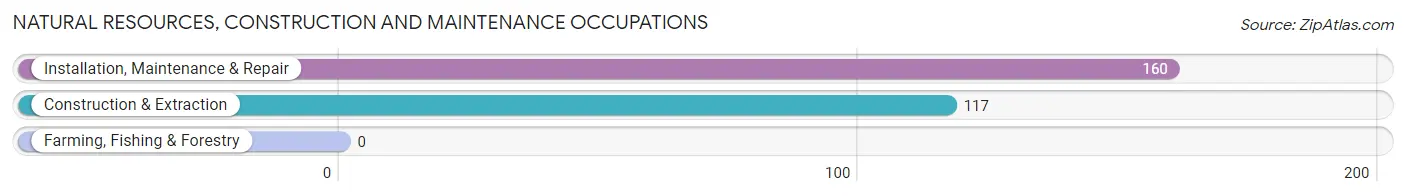
Natural Resources, Construction and Maintenance Occupations
The most common Natural Resources, Construction and Maintenance occupations in Spanish Fort are Installation, Maintenance & Repair (160 | 3.5%), and Construction & Extraction (117 | 2.6%).
Natural Resources, Construction and Maintenance Occupations by Sex
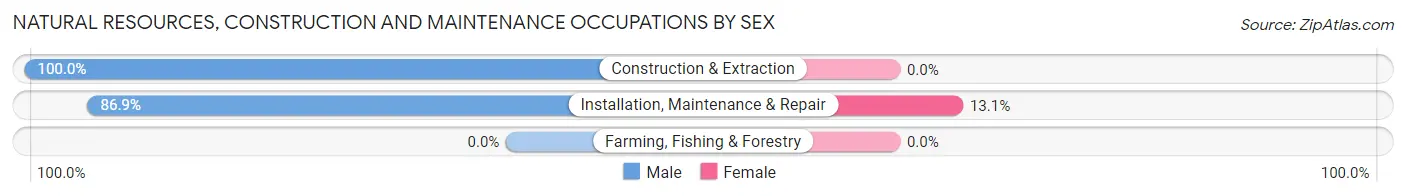
| Occupation | Male | Female |
| Farming, Fishing & Forestry | 0 (0.0%) | 0 (0.0%) |
| Construction & Extraction | 117 (100.0%) | 0 (0.0%) |
| Installation, Maintenance & Repair | 139 (86.9%) | 21 (13.1%) |
| Total (Category) | 256 (92.4%) | 21 (7.6%) |
| Total (Overall) | 2,711 (59.4%) | 1,851 (40.6%) |
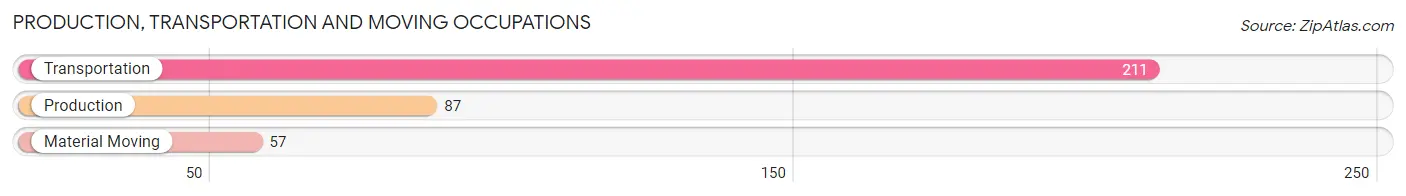
Production, Transportation and Moving Occupations
The most common Production, Transportation and Moving occupations in Spanish Fort are Transportation (211 | 4.6%), Production (87 | 1.9%), and Material Moving (57 | 1.3%).
Production, Transportation and Moving Occupations by Sex
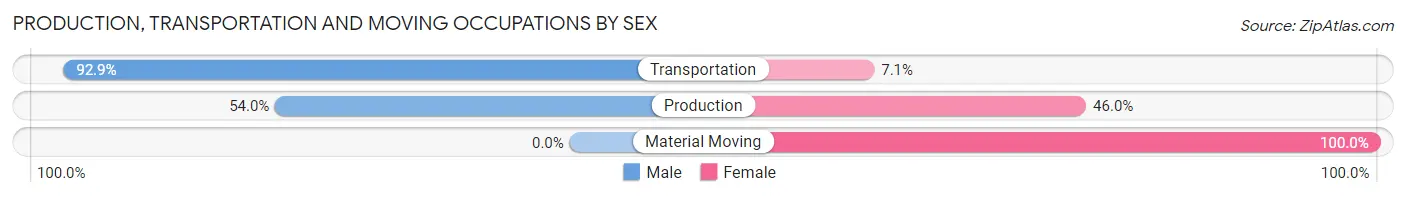
| Occupation | Male | Female |
| Production | 47 (54.0%) | 40 (46.0%) |
| Transportation | 196 (92.9%) | 15 (7.1%) |
| Material Moving | 0 (0.0%) | 57 (100.0%) |
| Total (Category) | 243 (68.4%) | 112 (31.6%) |
| Total (Overall) | 2,711 (59.4%) | 1,851 (40.6%) |
Employment Industries by Sex in Spanish Fort
Employment Industries in Spanish Fort
The major employment industries in Spanish Fort include Health Care & Social Assistance (834 | 18.3%), Retail Trade (666 | 14.6%), Manufacturing (543 | 11.9%), Accommodation & Food Services (409 | 9.0%), and Public Administration (389 | 8.5%).
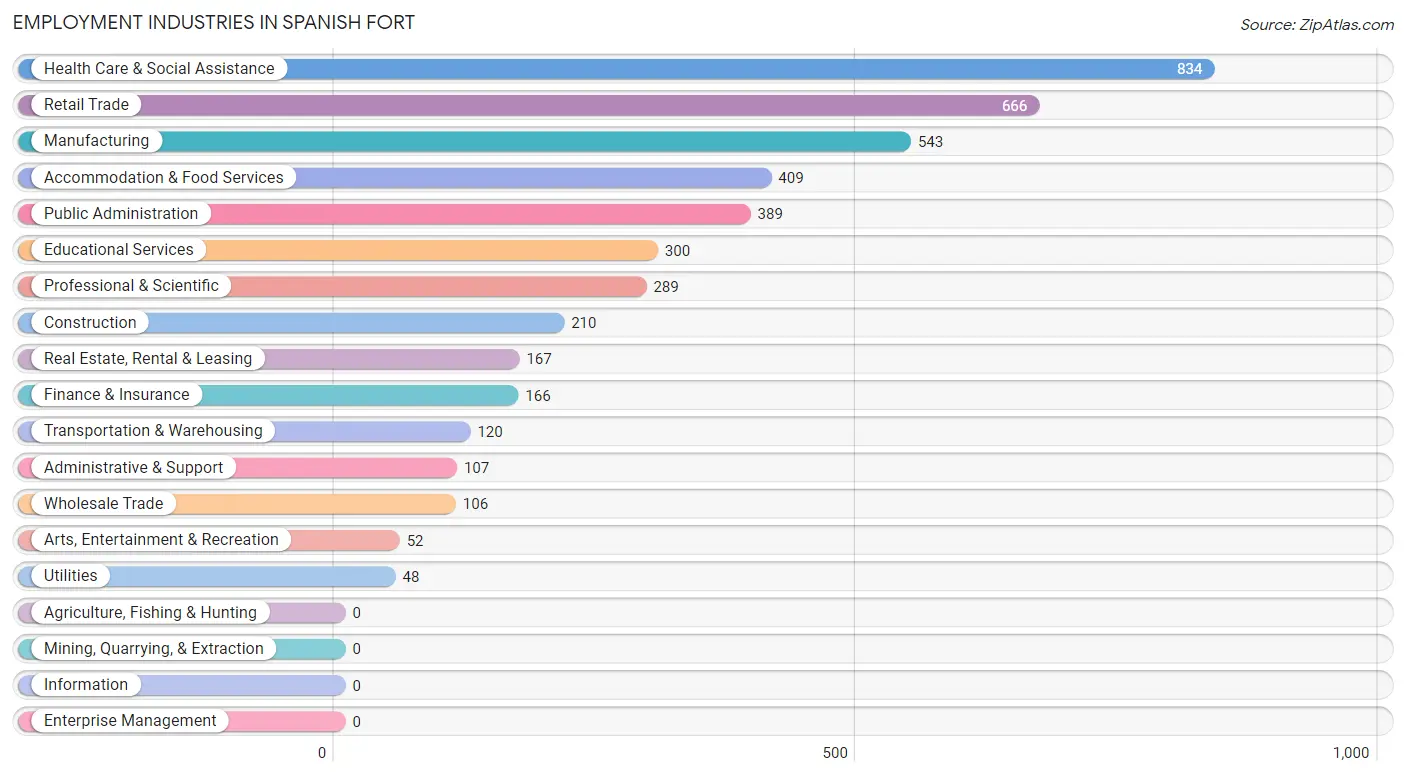
Employment Industries by Sex in Spanish Fort
The Spanish Fort industries that see more men than women are Utilities (100.0%), Public Administration (93.1%), and Transportation & Warehousing (87.5%), whereas the industries that tend to have a higher number of women are Educational Services (100.0%), Health Care & Social Assistance (68.8%), and Professional & Scientific (50.2%).
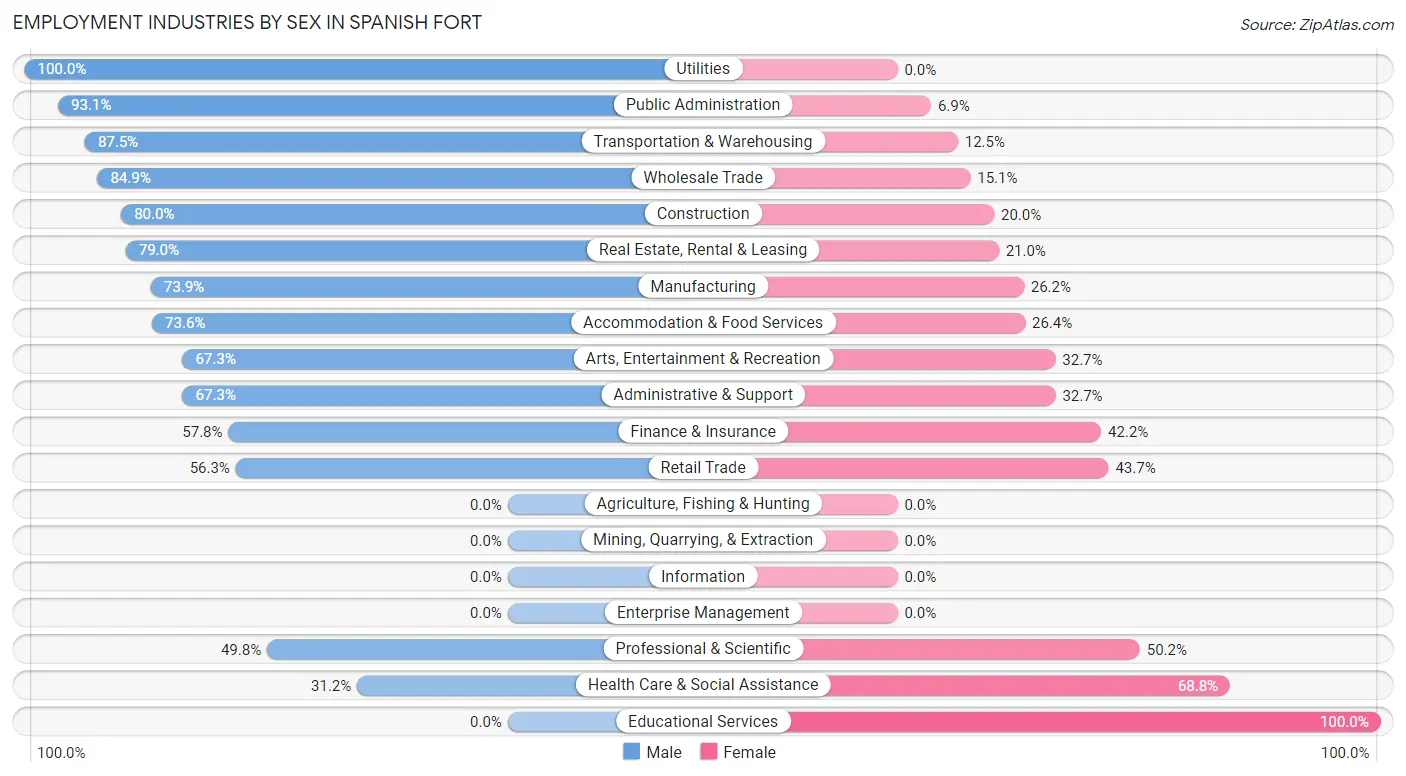
| Industry | Male | Female |
| Agriculture, Fishing & Hunting | 0 (0.0%) | 0 (0.0%) |
| Mining, Quarrying, & Extraction | 0 (0.0%) | 0 (0.0%) |
| Construction | 168 (80.0%) | 42 (20.0%) |
| Manufacturing | 401 (73.9%) | 142 (26.2%) |
| Wholesale Trade | 90 (84.9%) | 16 (15.1%) |
| Retail Trade | 375 (56.3%) | 291 (43.7%) |
| Transportation & Warehousing | 105 (87.5%) | 15 (12.5%) |
| Utilities | 48 (100.0%) | 0 (0.0%) |
| Information | 0 (0.0%) | 0 (0.0%) |
| Finance & Insurance | 96 (57.8%) | 70 (42.2%) |
| Real Estate, Rental & Leasing | 132 (79.0%) | 35 (21.0%) |
| Professional & Scientific | 144 (49.8%) | 145 (50.2%) |
| Enterprise Management | 0 (0.0%) | 0 (0.0%) |
| Administrative & Support | 72 (67.3%) | 35 (32.7%) |
| Educational Services | 0 (0.0%) | 300 (100.0%) |
| Health Care & Social Assistance | 260 (31.2%) | 574 (68.8%) |
| Arts, Entertainment & Recreation | 35 (67.3%) | 17 (32.7%) |
| Accommodation & Food Services | 301 (73.6%) | 108 (26.4%) |
| Public Administration | 362 (93.1%) | 27 (6.9%) |
| Total | 2,711 (59.4%) | 1,851 (40.6%) |
Education in Spanish Fort
School Enrollment in Spanish Fort
The most common levels of schooling among the 2,510 students in Spanish Fort are elementary school (681 | 27.1%), middle school (592 | 23.6%), and high school (501 | 20.0%).
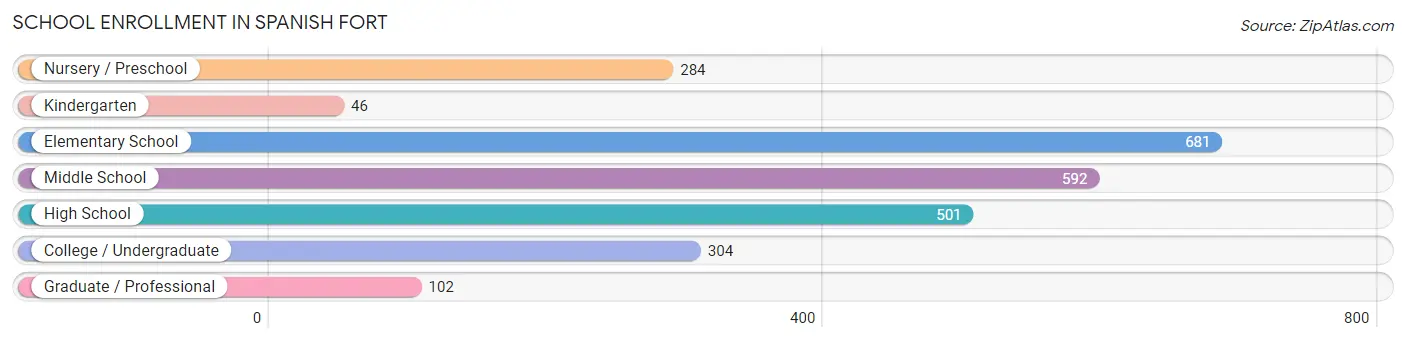
| School Level | # Students | % Students |
| Nursery / Preschool | 284 | 11.3% |
| Kindergarten | 46 | 1.8% |
| Elementary School | 681 | 27.1% |
| Middle School | 592 | 23.6% |
| High School | 501 | 20.0% |
| College / Undergraduate | 304 | 12.1% |
| Graduate / Professional | 102 | 4.1% |
| Total | 2,510 | 100.0% |
School Enrollment by Age by Funding Source in Spanish Fort
Out of a total of 2,510 students who are enrolled in schools in Spanish Fort, 389 (15.5%) attend a private institution, while the remaining 2,121 (84.5%) are enrolled in public schools. The age group of 3 to 4 year olds has the highest likelihood of being enrolled in private schools, with 127 (54.3% in the age bracket) enrolled. Conversely, the age group of 20 to 24 year olds has the lowest likelihood of being enrolled in a private school, with 109 (100.0% in the age bracket) attending a public institution.
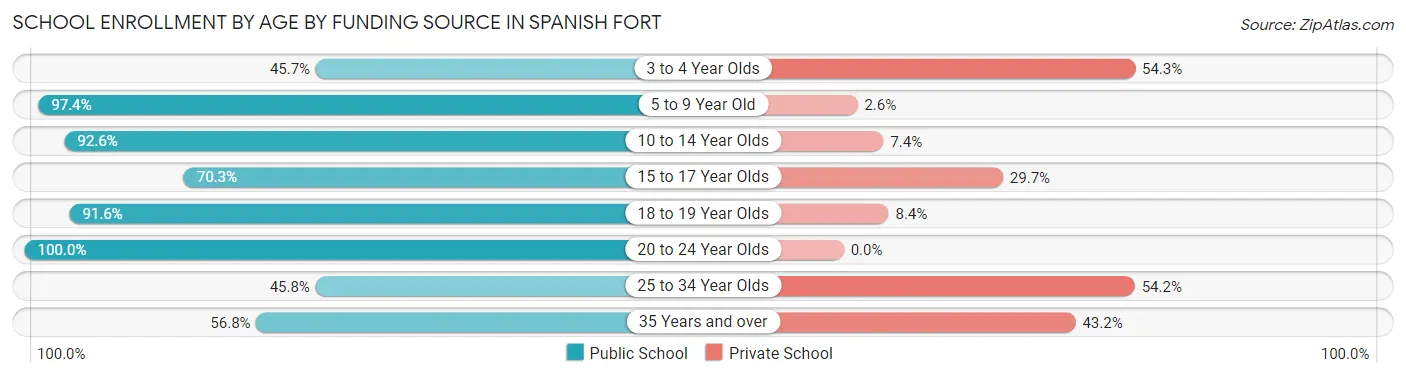
| Age Bracket | Public School | Private School |
| 3 to 4 Year Olds | 107 (45.7%) | 127 (54.3%) |
| 5 to 9 Year Old | 721 (97.4%) | 19 (2.6%) |
| 10 to 14 Year Olds | 599 (92.6%) | 48 (7.4%) |
| 15 to 17 Year Olds | 249 (70.3%) | 105 (29.7%) |
| 18 to 19 Year Olds | 274 (91.6%) | 25 (8.4%) |
| 20 to 24 Year Olds | 109 (100.0%) | 0 (0.0%) |
| 25 to 34 Year Olds | 38 (45.8%) | 45 (54.2%) |
| 35 Years and over | 25 (56.8%) | 19 (43.2%) |
| Total | 2,121 (84.5%) | 389 (15.5%) |
Educational Attainment by Field of Study in Spanish Fort
Business (605 | 20.1%), science & technology (467 | 15.5%), education (375 | 12.5%), engineering (327 | 10.9%), and bio, nature & agricultural (315 | 10.5%) are the most common fields of study among 3,009 individuals in Spanish Fort who have obtained a bachelor's degree or higher.
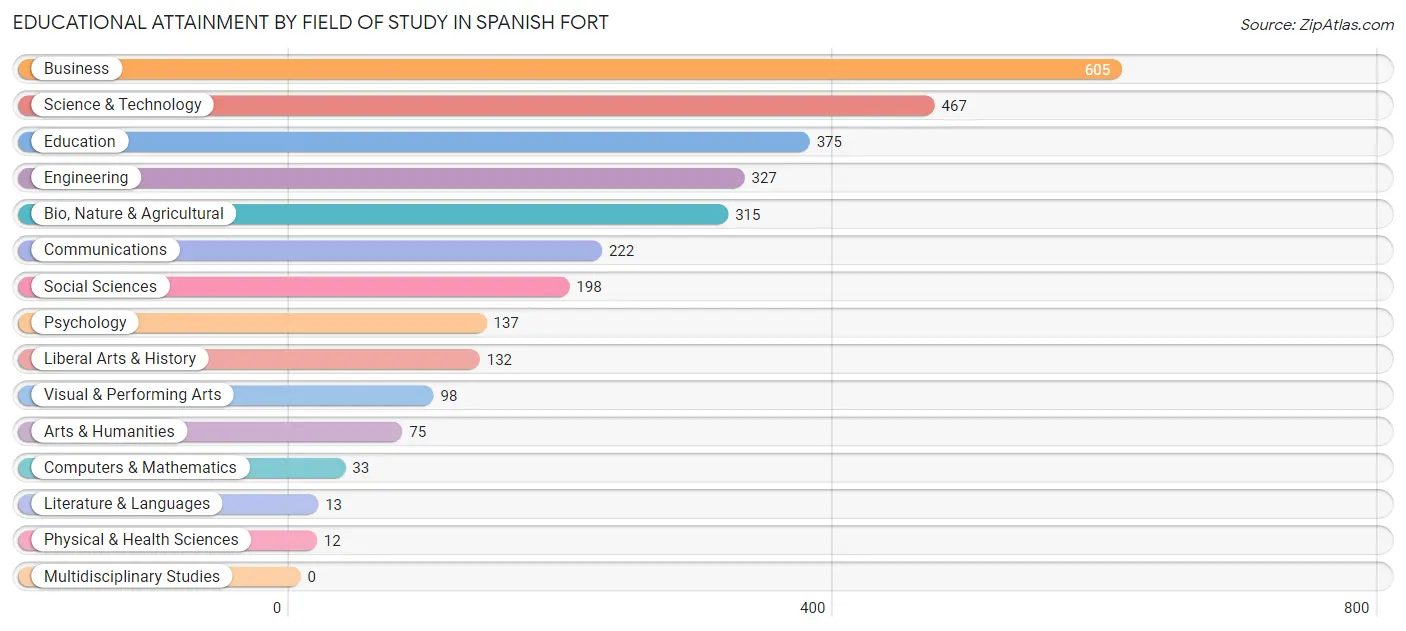
| Field of Study | # Graduates | % Graduates |
| Computers & Mathematics | 33 | 1.1% |
| Bio, Nature & Agricultural | 315 | 10.5% |
| Physical & Health Sciences | 12 | 0.4% |
| Psychology | 137 | 4.5% |
| Social Sciences | 198 | 6.6% |
| Engineering | 327 | 10.9% |
| Multidisciplinary Studies | 0 | 0.0% |
| Science & Technology | 467 | 15.5% |
| Business | 605 | 20.1% |
| Education | 375 | 12.5% |
| Literature & Languages | 13 | 0.4% |
| Liberal Arts & History | 132 | 4.4% |
| Visual & Performing Arts | 98 | 3.3% |
| Communications | 222 | 7.4% |
| Arts & Humanities | 75 | 2.5% |
| Total | 3,009 | 100.0% |
Transportation & Commute in Spanish Fort
Vehicle Availability by Sex in Spanish Fort
The most prevalent vehicle ownership categories in Spanish Fort are males with 2 vehicles (1,214, accounting for 43.5%) and females with 2 vehicles (782, making up 67.8%).
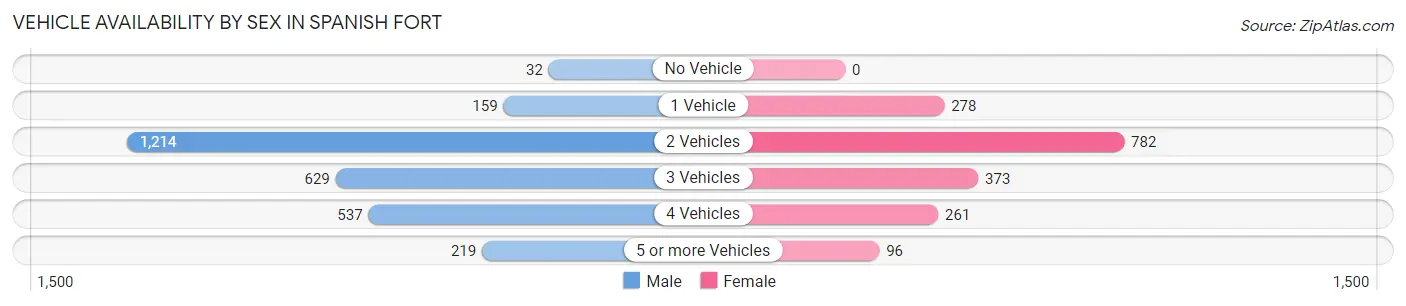
| Vehicles Available | Male | Female |
| No Vehicle | 32 (1.1%) | 0 (0.0%) |
| 1 Vehicle | 159 (5.7%) | 278 (15.5%) |
| 2 Vehicles | 1,214 (43.5%) | 782 (43.7%) |
| 3 Vehicles | 629 (22.5%) | 373 (20.8%) |
| 4 Vehicles | 537 (19.3%) | 261 (14.6%) |
| 5 or more Vehicles | 219 (7.9%) | 96 (5.4%) |
| Total | 2,790 (100.0%) | 1,790 (100.0%) |
Commute Time in Spanish Fort
The most frequently occuring commute durations in Spanish Fort are 15 to 19 minutes (1,011 commuters, 23.5%), 30 to 34 minutes (747 commuters, 17.3%), and 20 to 24 minutes (501 commuters, 11.6%).
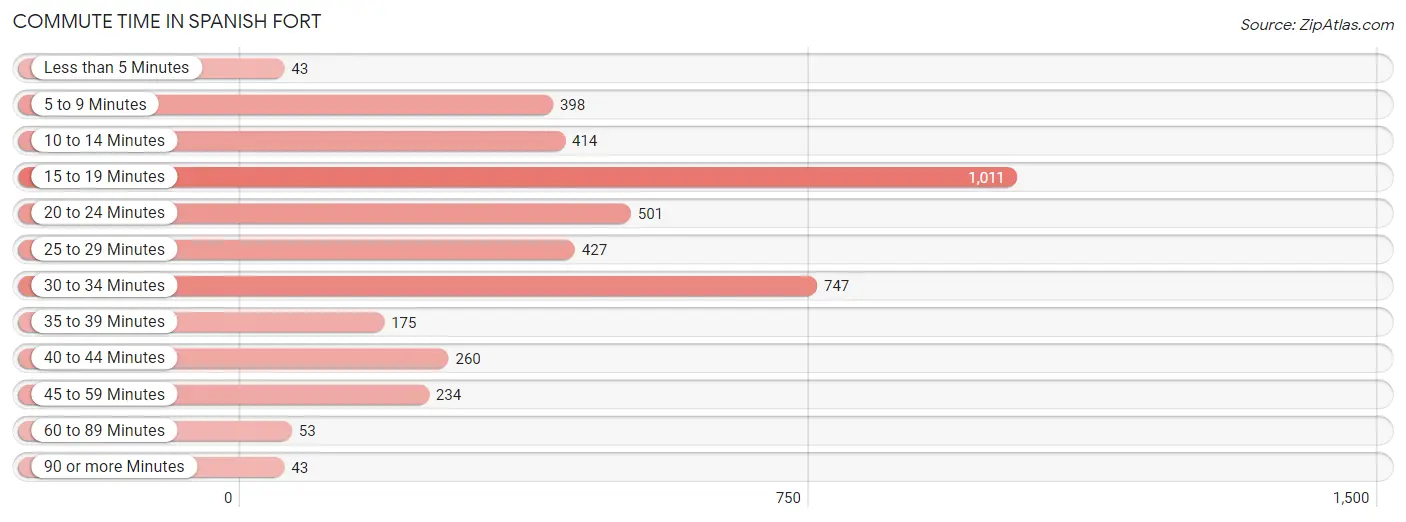
| Commute Time | # Commuters | % Commuters |
| Less than 5 Minutes | 43 | 1.0% |
| 5 to 9 Minutes | 398 | 9.2% |
| 10 to 14 Minutes | 414 | 9.6% |
| 15 to 19 Minutes | 1,011 | 23.5% |
| 20 to 24 Minutes | 501 | 11.6% |
| 25 to 29 Minutes | 427 | 9.9% |
| 30 to 34 Minutes | 747 | 17.3% |
| 35 to 39 Minutes | 175 | 4.1% |
| 40 to 44 Minutes | 260 | 6.0% |
| 45 to 59 Minutes | 234 | 5.4% |
| 60 to 89 Minutes | 53 | 1.2% |
| 90 or more Minutes | 43 | 1.0% |
Commute Time by Sex in Spanish Fort
The most common commute times in Spanish Fort are 15 to 19 minutes (673 commuters, 25.4%) for males and 15 to 19 minutes (338 commuters, 20.4%) for females.
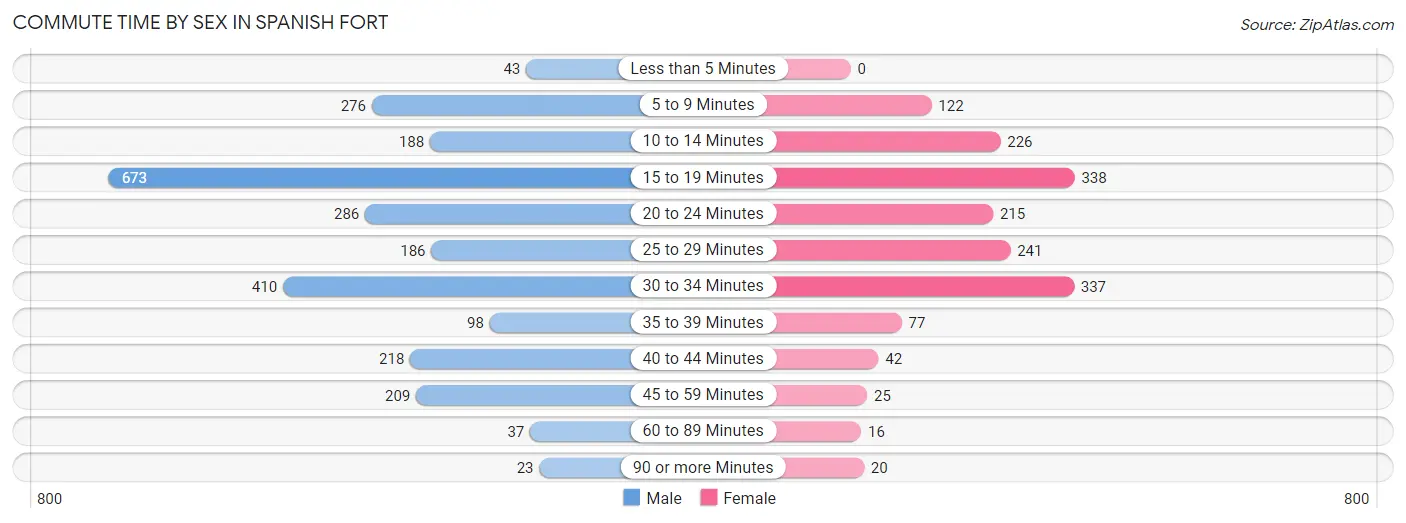
| Commute Time | Male | Female |
| Less than 5 Minutes | 43 (1.6%) | 0 (0.0%) |
| 5 to 9 Minutes | 276 (10.4%) | 122 (7.3%) |
| 10 to 14 Minutes | 188 (7.1%) | 226 (13.6%) |
| 15 to 19 Minutes | 673 (25.4%) | 338 (20.4%) |
| 20 to 24 Minutes | 286 (10.8%) | 215 (13.0%) |
| 25 to 29 Minutes | 186 (7.0%) | 241 (14.5%) |
| 30 to 34 Minutes | 410 (15.5%) | 337 (20.3%) |
| 35 to 39 Minutes | 98 (3.7%) | 77 (4.6%) |
| 40 to 44 Minutes | 218 (8.2%) | 42 (2.5%) |
| 45 to 59 Minutes | 209 (7.9%) | 25 (1.5%) |
| 60 to 89 Minutes | 37 (1.4%) | 16 (1.0%) |
| 90 or more Minutes | 23 (0.9%) | 20 (1.2%) |
Time of Departure to Work by Sex in Spanish Fort
The most frequent times of departure to work in Spanish Fort are 7:00 AM to 7:29 AM (610, 23.0%) for males and 7:00 AM to 7:29 AM (479, 28.9%) for females.
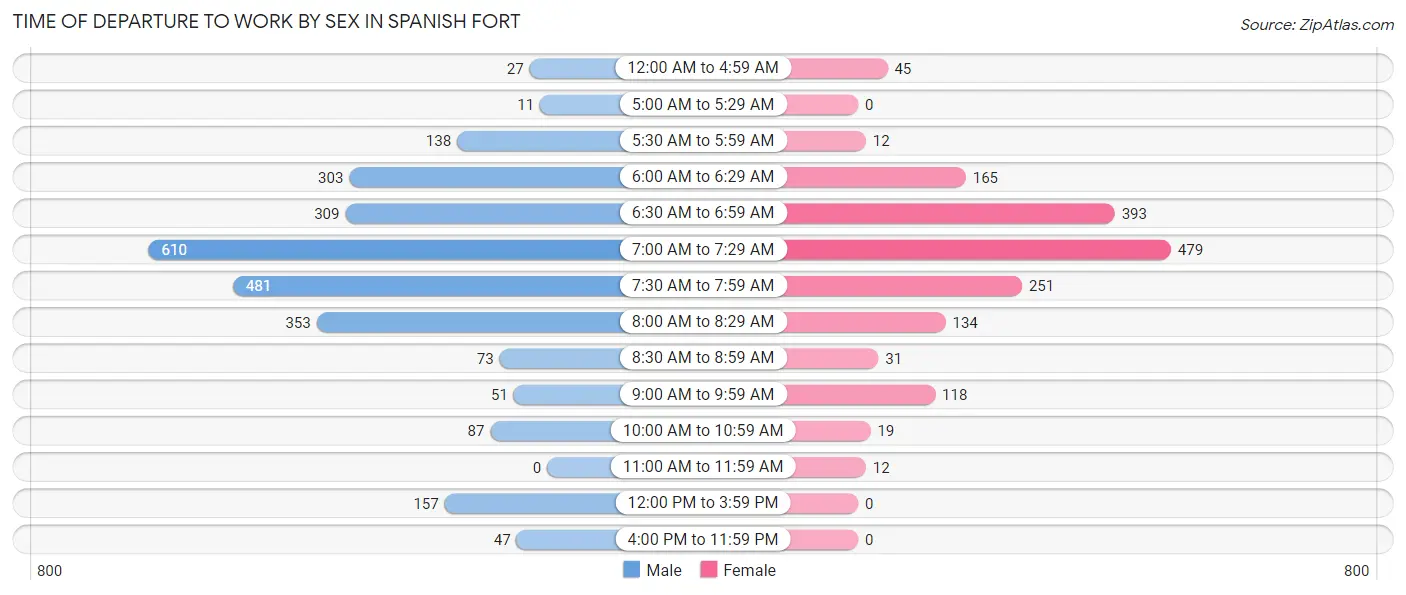
| Time of Departure | Male | Female |
| 12:00 AM to 4:59 AM | 27 (1.0%) | 45 (2.7%) |
| 5:00 AM to 5:29 AM | 11 (0.4%) | 0 (0.0%) |
| 5:30 AM to 5:59 AM | 138 (5.2%) | 12 (0.7%) |
| 6:00 AM to 6:29 AM | 303 (11.5%) | 165 (10.0%) |
| 6:30 AM to 6:59 AM | 309 (11.7%) | 393 (23.7%) |
| 7:00 AM to 7:29 AM | 610 (23.0%) | 479 (28.9%) |
| 7:30 AM to 7:59 AM | 481 (18.2%) | 251 (15.1%) |
| 8:00 AM to 8:29 AM | 353 (13.3%) | 134 (8.1%) |
| 8:30 AM to 8:59 AM | 73 (2.8%) | 31 (1.9%) |
| 9:00 AM to 9:59 AM | 51 (1.9%) | 118 (7.1%) |
| 10:00 AM to 10:59 AM | 87 (3.3%) | 19 (1.1%) |
| 11:00 AM to 11:59 AM | 0 (0.0%) | 12 (0.7%) |
| 12:00 PM to 3:59 PM | 157 (5.9%) | 0 (0.0%) |
| 4:00 PM to 11:59 PM | 47 (1.8%) | 0 (0.0%) |
| Total | 2,647 (100.0%) | 1,659 (100.0%) |
Housing Occupancy in Spanish Fort
Occupancy by Ownership in Spanish Fort
Of the total 3,709 dwellings in Spanish Fort, owner-occupied units account for 2,475 (66.7%), while renter-occupied units make up 1,234 (33.3%).
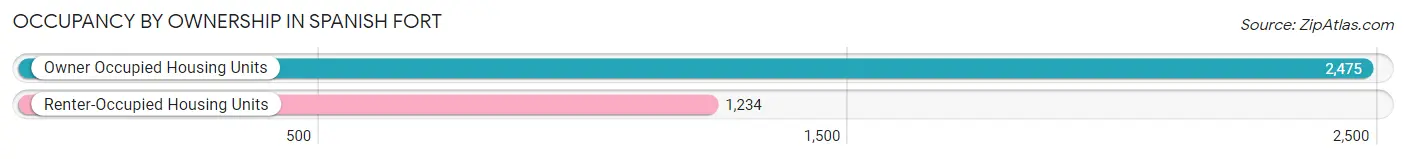
| Occupancy | # Housing Units | % Housing Units |
| Owner Occupied Housing Units | 2,475 | 66.7% |
| Renter-Occupied Housing Units | 1,234 | 33.3% |
| Total Occupied Housing Units | 3,709 | 100.0% |
Occupancy by Household Size in Spanish Fort
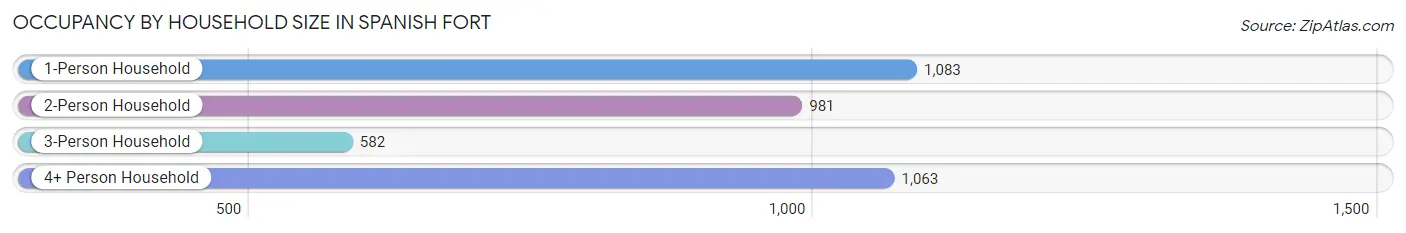
| Household Size | # Housing Units | % Housing Units |
| 1-Person Household | 1,083 | 29.2% |
| 2-Person Household | 981 | 26.5% |
| 3-Person Household | 582 | 15.7% |
| 4+ Person Household | 1,063 | 28.7% |
| Total Housing Units | 3,709 | 100.0% |
Occupancy by Ownership by Household Size in Spanish Fort
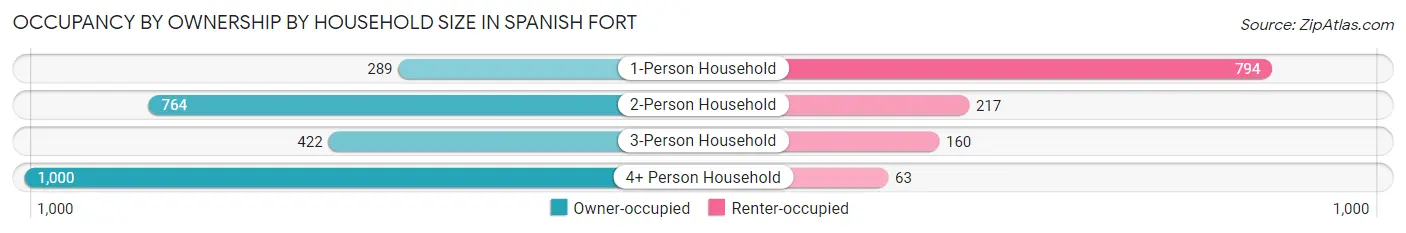
| Household Size | Owner-occupied | Renter-occupied |
| 1-Person Household | 289 (26.7%) | 794 (73.3%) |
| 2-Person Household | 764 (77.9%) | 217 (22.1%) |
| 3-Person Household | 422 (72.5%) | 160 (27.5%) |
| 4+ Person Household | 1,000 (94.1%) | 63 (5.9%) |
| Total Housing Units | 2,475 (66.7%) | 1,234 (33.3%) |
Occupancy by Educational Attainment in Spanish Fort
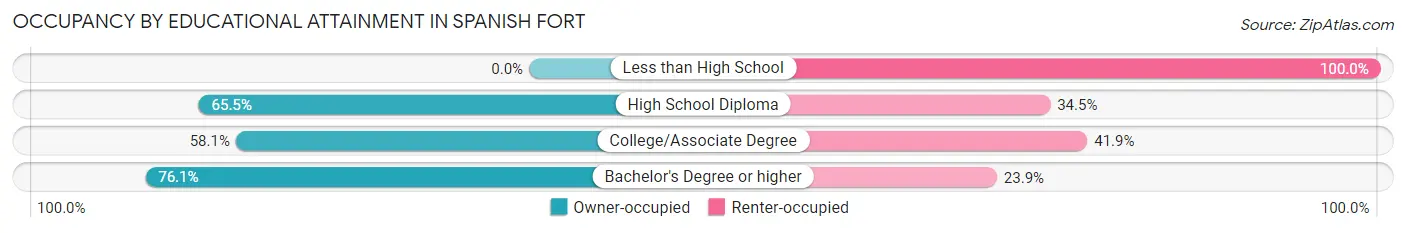
| Household Size | Owner-occupied | Renter-occupied |
| Less than High School | 0 (0.0%) | 116 (100.0%) |
| High School Diploma | 391 (65.5%) | 206 (34.5%) |
| College/Associate Degree | 632 (58.1%) | 455 (41.9%) |
| Bachelor's Degree or higher | 1,452 (76.1%) | 457 (23.9%) |
Occupancy by Age of Householder in Spanish Fort
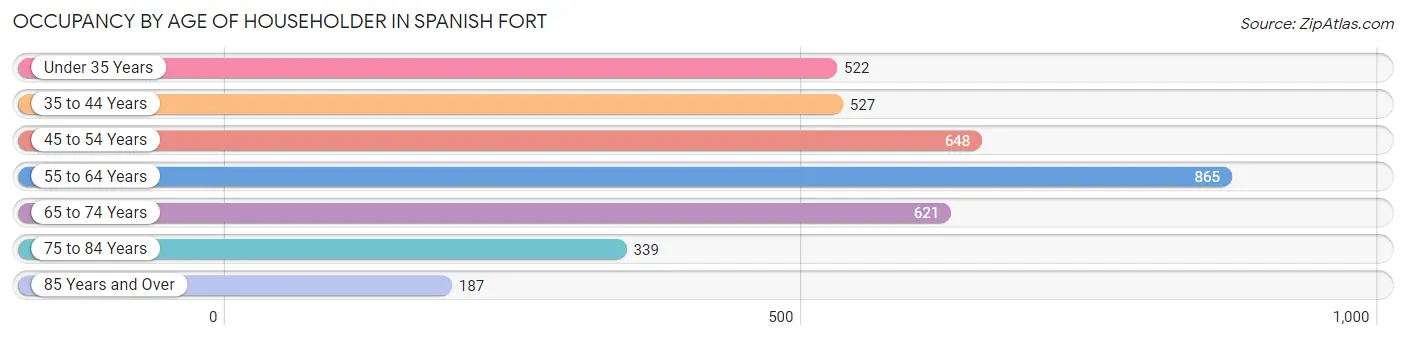
| Age Bracket | # Households | % Households |
| Under 35 Years | 522 | 14.1% |
| 35 to 44 Years | 527 | 14.2% |
| 45 to 54 Years | 648 | 17.5% |
| 55 to 64 Years | 865 | 23.3% |
| 65 to 74 Years | 621 | 16.7% |
| 75 to 84 Years | 339 | 9.1% |
| 85 Years and Over | 187 | 5.0% |
| Total | 3,709 | 100.0% |
Housing Finances in Spanish Fort
Median Income by Occupancy in Spanish Fort
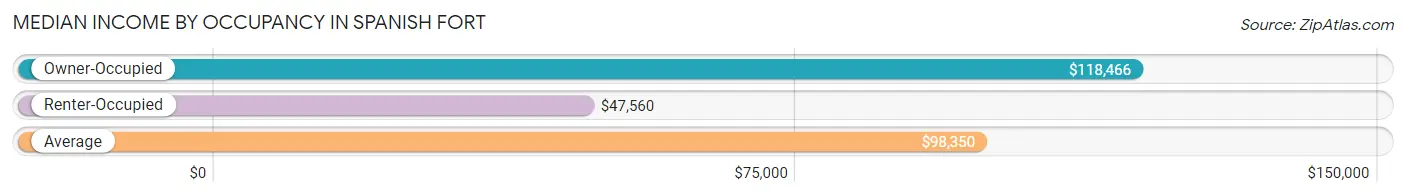
| Occupancy Type | # Households | Median Income |
| Owner-Occupied | 2,475 (66.7%) | $118,466 |
| Renter-Occupied | 1,234 (33.3%) | $47,560 |
| Average | 3,709 (100.0%) | $98,350 |
Occupancy by Householder Income Bracket in Spanish Fort
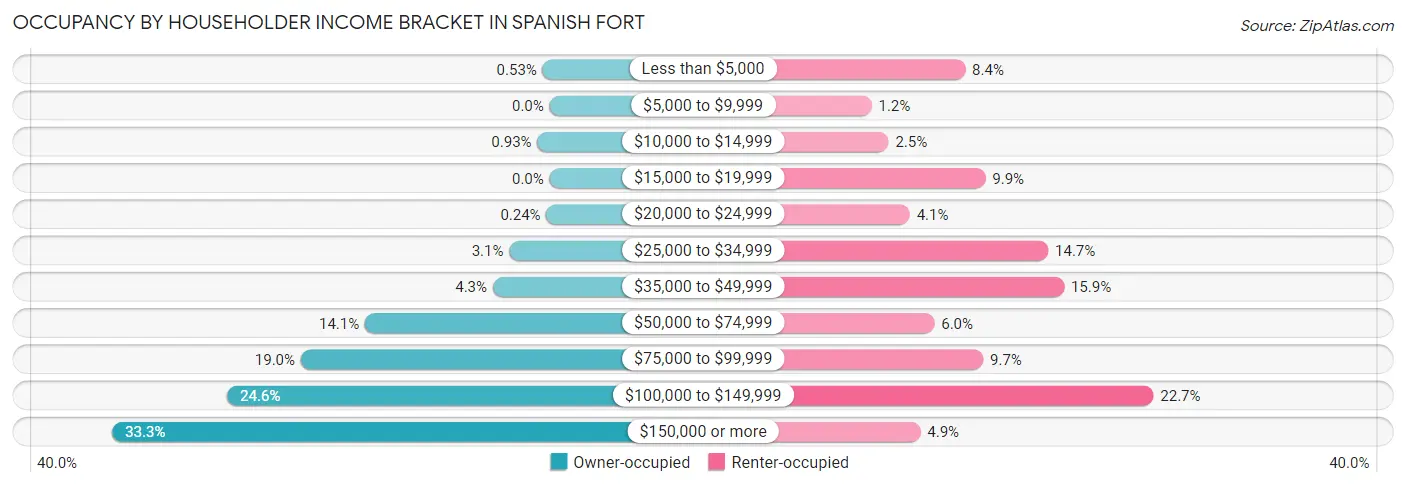
| Income Bracket | Owner-occupied | Renter-occupied |
| Less than $5,000 | 13 (0.5%) | 103 (8.4%) |
| $5,000 to $9,999 | 0 (0.0%) | 15 (1.2%) |
| $10,000 to $14,999 | 23 (0.9%) | 31 (2.5%) |
| $15,000 to $19,999 | 0 (0.0%) | 122 (9.9%) |
| $20,000 to $24,999 | 6 (0.2%) | 51 (4.1%) |
| $25,000 to $34,999 | 76 (3.1%) | 181 (14.7%) |
| $35,000 to $49,999 | 107 (4.3%) | 196 (15.9%) |
| $50,000 to $74,999 | 348 (14.1%) | 74 (6.0%) |
| $75,000 to $99,999 | 469 (19.0%) | 120 (9.7%) |
| $100,000 to $149,999 | 608 (24.6%) | 280 (22.7%) |
| $150,000 or more | 825 (33.3%) | 61 (4.9%) |
| Total | 2,475 (100.0%) | 1,234 (100.0%) |
Monthly Housing Cost Tiers in Spanish Fort
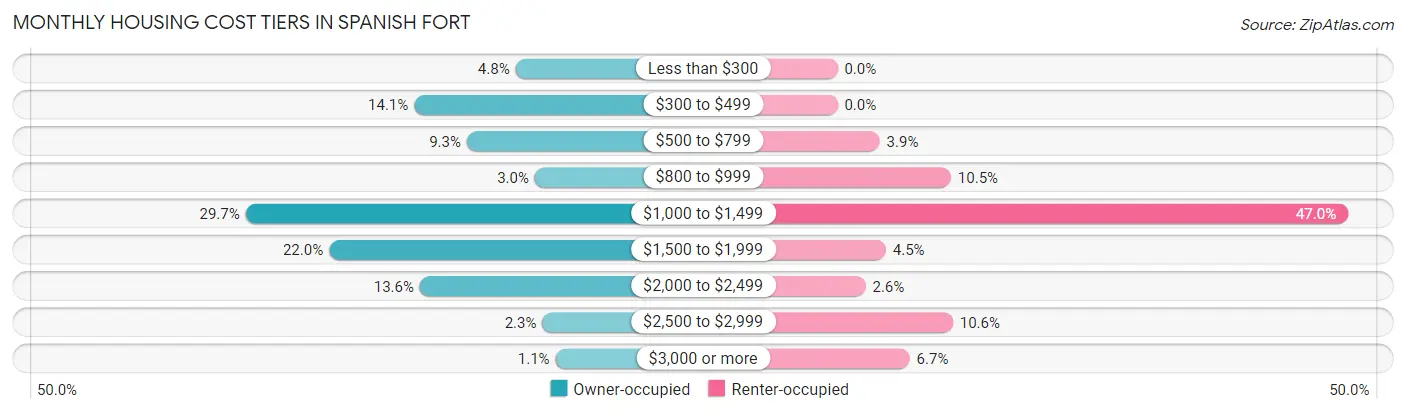
| Monthly Cost | Owner-occupied | Renter-occupied |
| Less than $300 | 119 (4.8%) | 0 (0.0%) |
| $300 to $499 | 350 (14.1%) | 0 (0.0%) |
| $500 to $799 | 230 (9.3%) | 48 (3.9%) |
| $800 to $999 | 75 (3.0%) | 129 (10.4%) |
| $1,000 to $1,499 | 734 (29.7%) | 580 (47.0%) |
| $1,500 to $1,999 | 544 (22.0%) | 55 (4.5%) |
| $2,000 to $2,499 | 337 (13.6%) | 32 (2.6%) |
| $2,500 to $2,999 | 58 (2.3%) | 131 (10.6%) |
| $3,000 or more | 28 (1.1%) | 82 (6.7%) |
| Total | 2,475 (100.0%) | 1,234 (100.0%) |
Physical Housing Characteristics in Spanish Fort
Housing Structures in Spanish Fort
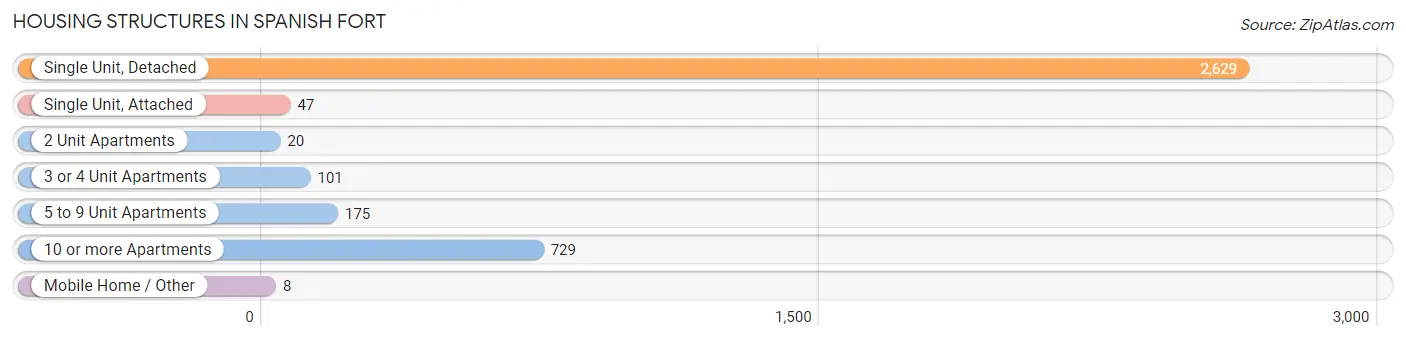
| Structure Type | # Housing Units | % Housing Units |
| Single Unit, Detached | 2,629 | 70.9% |
| Single Unit, Attached | 47 | 1.3% |
| 2 Unit Apartments | 20 | 0.5% |
| 3 or 4 Unit Apartments | 101 | 2.7% |
| 5 to 9 Unit Apartments | 175 | 4.7% |
| 10 or more Apartments | 729 | 19.7% |
| Mobile Home / Other | 8 | 0.2% |
| Total | 3,709 | 100.0% |
Housing Structures by Occupancy in Spanish Fort
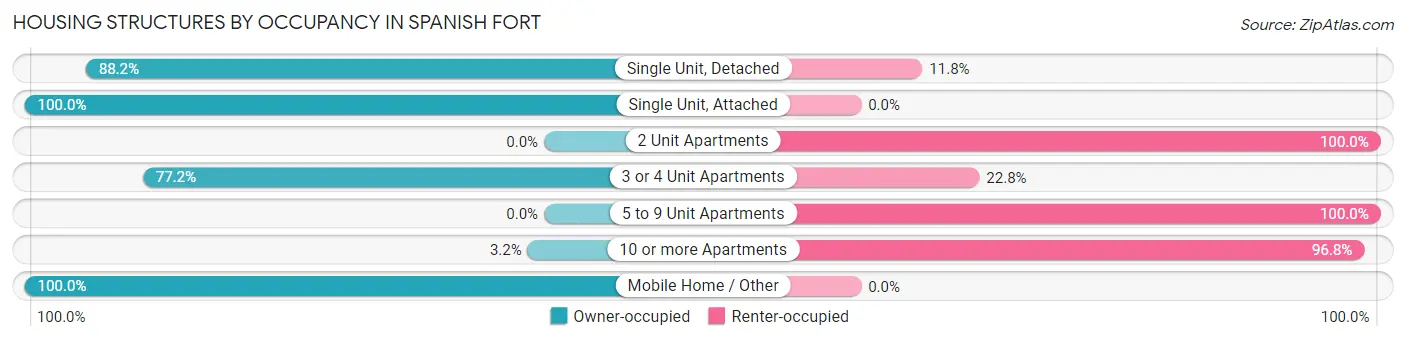
| Structure Type | Owner-occupied | Renter-occupied |
| Single Unit, Detached | 2,319 (88.2%) | 310 (11.8%) |
| Single Unit, Attached | 47 (100.0%) | 0 (0.0%) |
| 2 Unit Apartments | 0 (0.0%) | 20 (100.0%) |
| 3 or 4 Unit Apartments | 78 (77.2%) | 23 (22.8%) |
| 5 to 9 Unit Apartments | 0 (0.0%) | 175 (100.0%) |
| 10 or more Apartments | 23 (3.2%) | 706 (96.8%) |
| Mobile Home / Other | 8 (100.0%) | 0 (0.0%) |
| Total | 2,475 (66.7%) | 1,234 (33.3%) |
Housing Structures by Number of Rooms in Spanish Fort
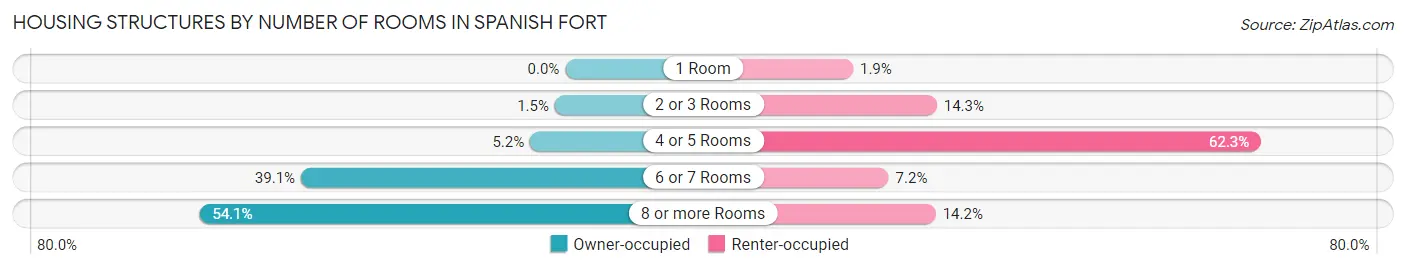
| Number of Rooms | Owner-occupied | Renter-occupied |
| 1 Room | 0 (0.0%) | 24 (1.9%) |
| 2 or 3 Rooms | 38 (1.5%) | 177 (14.3%) |
| 4 or 5 Rooms | 129 (5.2%) | 769 (62.3%) |
| 6 or 7 Rooms | 968 (39.1%) | 89 (7.2%) |
| 8 or more Rooms | 1,340 (54.1%) | 175 (14.2%) |
| Total | 2,475 (100.0%) | 1,234 (100.0%) |
Housing Structure by Heating Type in Spanish Fort
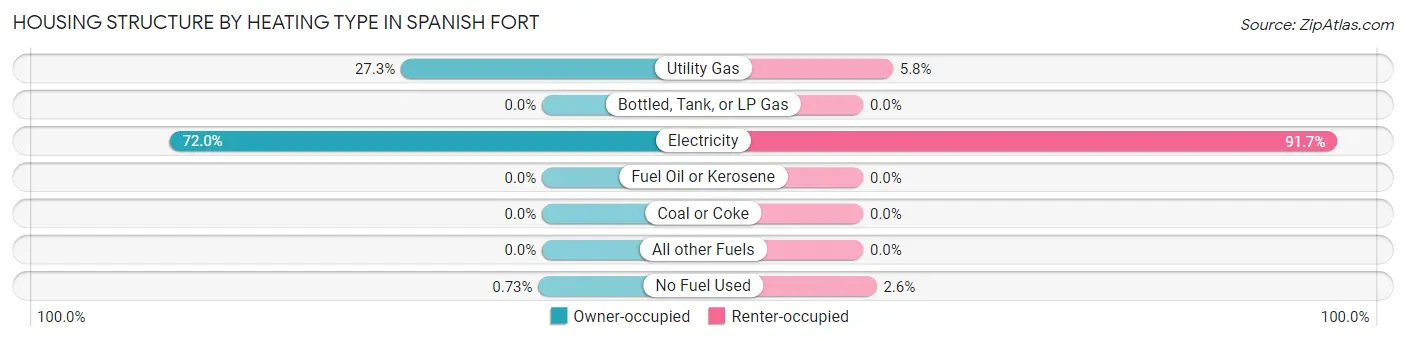
| Heating Type | Owner-occupied | Renter-occupied |
| Utility Gas | 675 (27.3%) | 71 (5.8%) |
| Bottled, Tank, or LP Gas | 0 (0.0%) | 0 (0.0%) |
| Electricity | 1,782 (72.0%) | 1,131 (91.6%) |
| Fuel Oil or Kerosene | 0 (0.0%) | 0 (0.0%) |
| Coal or Coke | 0 (0.0%) | 0 (0.0%) |
| All other Fuels | 0 (0.0%) | 0 (0.0%) |
| No Fuel Used | 18 (0.7%) | 32 (2.6%) |
| Total | 2,475 (100.0%) | 1,234 (100.0%) |
Household Vehicle Usage in Spanish Fort
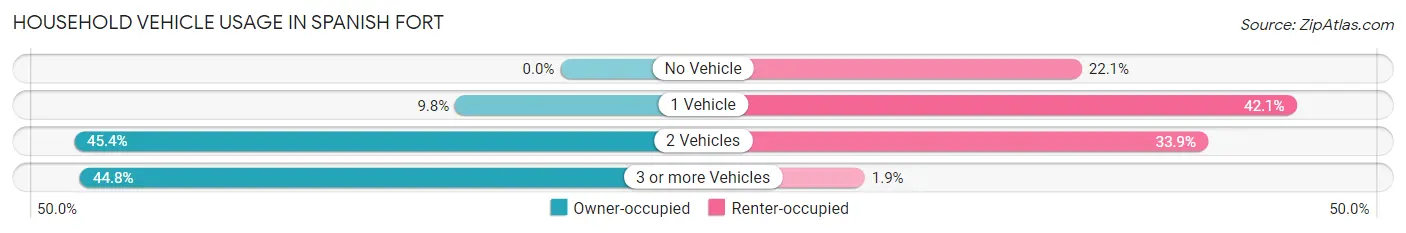
| Vehicles per Household | Owner-occupied | Renter-occupied |
| No Vehicle | 0 (0.0%) | 273 (22.1%) |
| 1 Vehicle | 243 (9.8%) | 520 (42.1%) |
| 2 Vehicles | 1,123 (45.4%) | 418 (33.9%) |
| 3 or more Vehicles | 1,109 (44.8%) | 23 (1.9%) |
| Total | 2,475 (100.0%) | 1,234 (100.0%) |
Real Estate & Mortgages in Spanish Fort
Real Estate and Mortgage Overview in Spanish Fort
| Characteristic | Without Mortgage | With Mortgage |
| Housing Units | 712 | 1,763 |
| Median Property Value | $311,000 | $284,000 |
| Median Household Income | $94,741 | $542 |
| Monthly Housing Costs | $478 | $28 |
| Real Estate Taxes | $916 | $160 |
Property Value by Mortgage Status in Spanish Fort
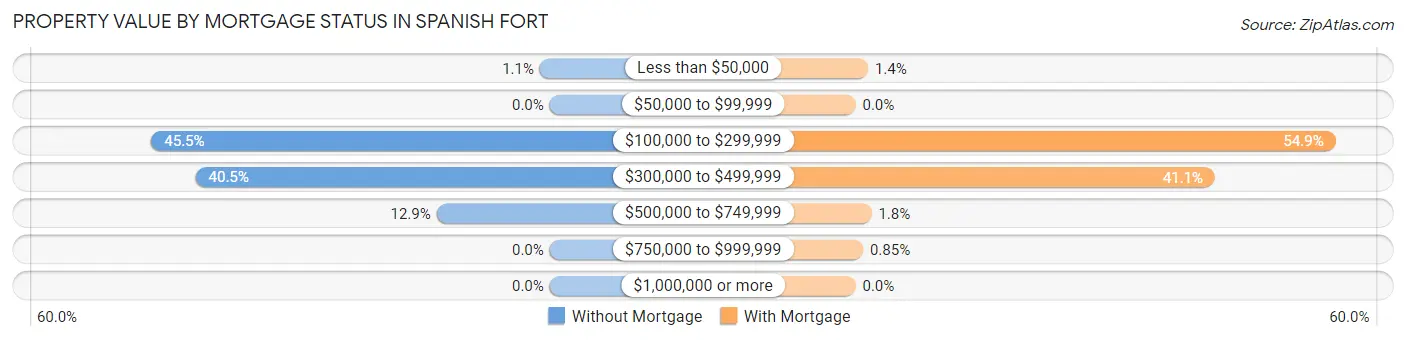
| Property Value | Without Mortgage | With Mortgage |
| Less than $50,000 | 8 (1.1%) | 25 (1.4%) |
| $50,000 to $99,999 | 0 (0.0%) | 0 (0.0%) |
| $100,000 to $299,999 | 324 (45.5%) | 967 (54.8%) |
| $300,000 to $499,999 | 288 (40.5%) | 724 (41.1%) |
| $500,000 to $749,999 | 92 (12.9%) | 32 (1.8%) |
| $750,000 to $999,999 | 0 (0.0%) | 15 (0.9%) |
| $1,000,000 or more | 0 (0.0%) | 0 (0.0%) |
| Total | 712 (100.0%) | 1,763 (100.0%) |
Household Income by Mortgage Status in Spanish Fort
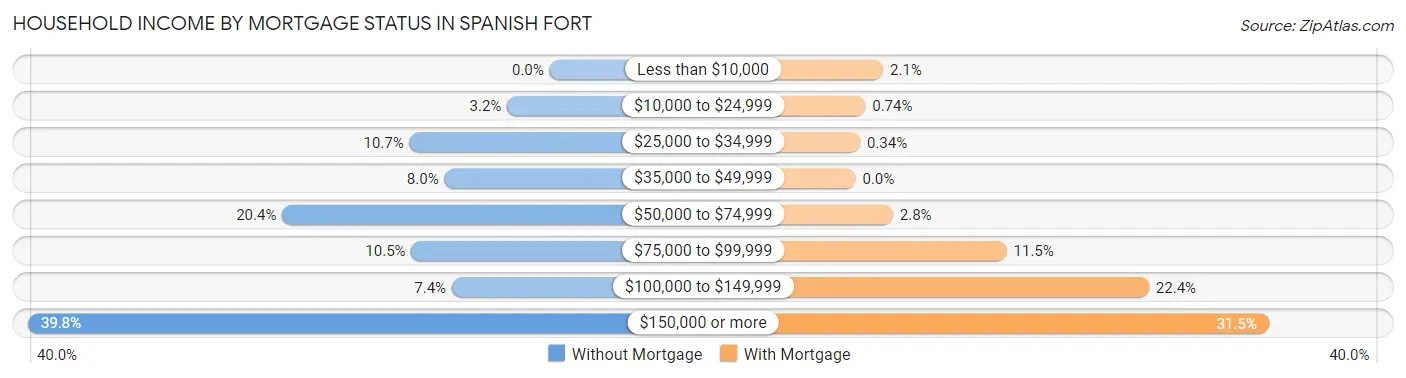
| Household Income | Without Mortgage | With Mortgage |
| Less than $10,000 | 0 (0.0%) | 37 (2.1%) |
| $10,000 to $24,999 | 23 (3.2%) | 13 (0.7%) |
| $25,000 to $34,999 | 76 (10.7%) | 6 (0.3%) |
| $35,000 to $49,999 | 57 (8.0%) | 0 (0.0%) |
| $50,000 to $74,999 | 145 (20.4%) | 50 (2.8%) |
| $75,000 to $99,999 | 75 (10.5%) | 203 (11.5%) |
| $100,000 to $149,999 | 53 (7.4%) | 394 (22.4%) |
| $150,000 or more | 283 (39.8%) | 555 (31.5%) |
| Total | 712 (100.0%) | 1,763 (100.0%) |
Property Value to Household Income Ratio in Spanish Fort
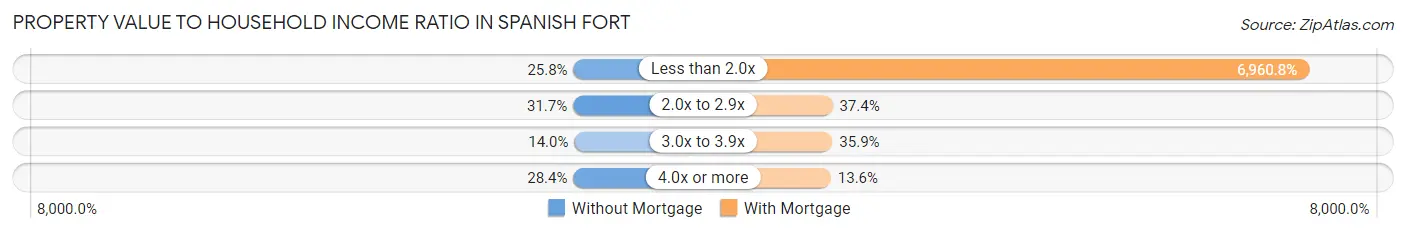
| Value-to-Income Ratio | Without Mortgage | With Mortgage |
| Less than 2.0x | 184 (25.8%) | 122,719 (6,960.8%) |
| 2.0x to 2.9x | 226 (31.7%) | 659 (37.4%) |
| 3.0x to 3.9x | 100 (14.0%) | 633 (35.9%) |
| 4.0x or more | 202 (28.4%) | 239 (13.6%) |
| Total | 712 (100.0%) | 1,763 (100.0%) |
Real Estate Taxes by Mortgage Status in Spanish Fort
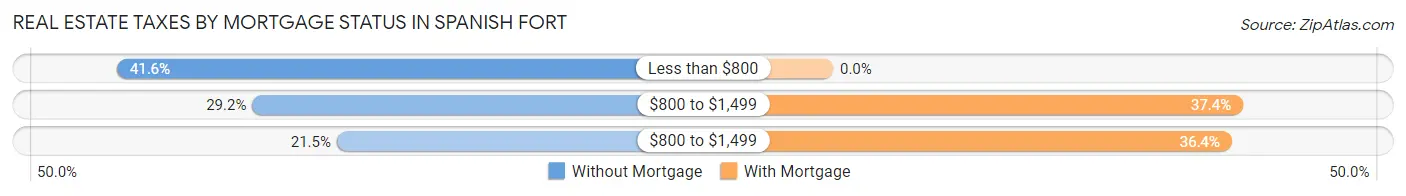
| Property Taxes | Without Mortgage | With Mortgage |
| Less than $800 | 296 (41.6%) | 0 (0.0%) |
| $800 to $1,499 | 208 (29.2%) | 660 (37.4%) |
| $800 to $1,499 | 153 (21.5%) | 642 (36.4%) |
| Total | 712 (100.0%) | 1,763 (100.0%) |
Health & Disability in Spanish Fort
Health Insurance Coverage by Age in Spanish Fort
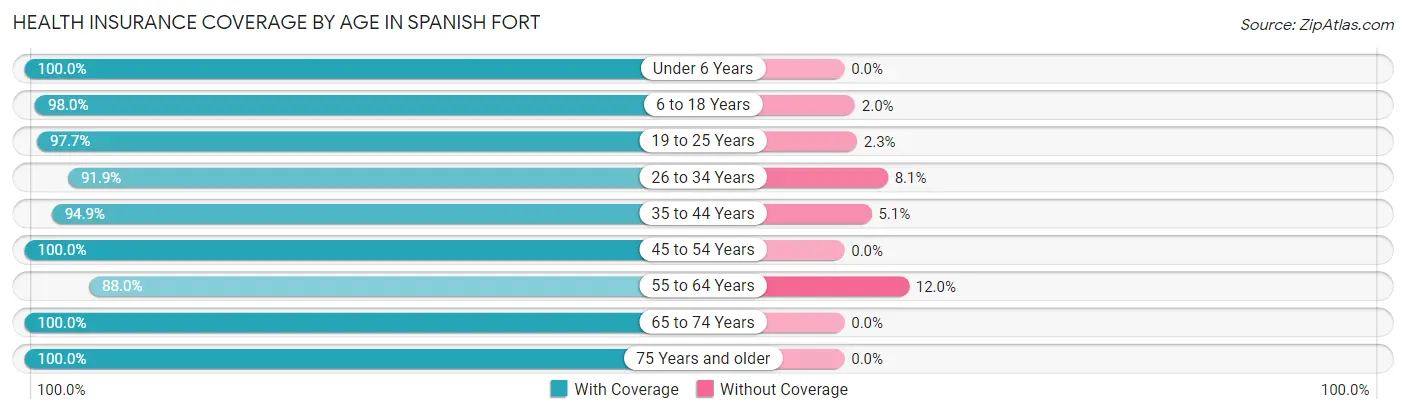
| Age Bracket | With Coverage | Without Coverage |
| Under 6 Years | 896 (100.0%) | 0 (0.0%) |
| 6 to 18 Years | 2,085 (98.0%) | 42 (2.0%) |
| 19 to 25 Years | 793 (97.7%) | 19 (2.3%) |
| 26 to 34 Years | 750 (91.9%) | 66 (8.1%) |
| 35 to 44 Years | 920 (94.9%) | 49 (5.1%) |
| 45 to 54 Years | 1,144 (100.0%) | 0 (0.0%) |
| 55 to 64 Years | 1,244 (88.0%) | 170 (12.0%) |
| 65 to 74 Years | 1,014 (100.0%) | 0 (0.0%) |
| 75 Years and older | 746 (100.0%) | 0 (0.0%) |
| Total | 9,592 (96.5%) | 346 (3.5%) |
Health Insurance Coverage by Citizenship Status in Spanish Fort
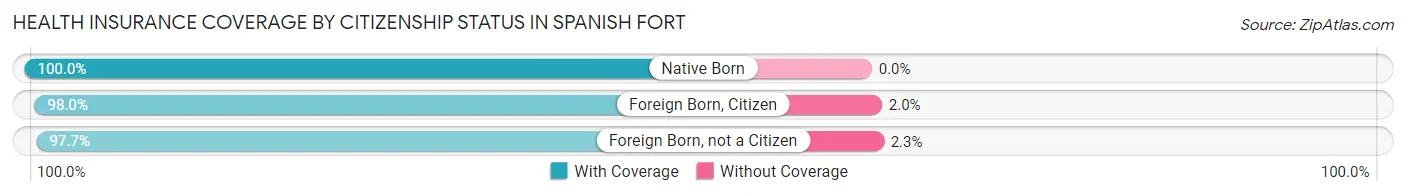
| Citizenship Status | With Coverage | Without Coverage |
| Native Born | 896 (100.0%) | 0 (0.0%) |
| Foreign Born, Citizen | 2,085 (98.0%) | 42 (2.0%) |
| Foreign Born, not a Citizen | 793 (97.7%) | 19 (2.3%) |
Health Insurance Coverage by Household Income in Spanish Fort
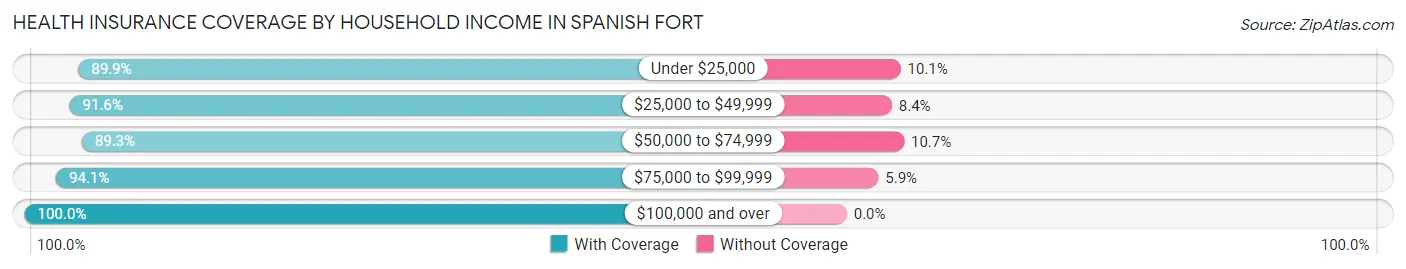
| Household Income | With Coverage | Without Coverage |
| Under $25,000 | 357 (89.9%) | 40 (10.1%) |
| $25,000 to $49,999 | 716 (91.6%) | 66 (8.4%) |
| $50,000 to $74,999 | 998 (89.3%) | 120 (10.7%) |
| $75,000 to $99,999 | 1,911 (94.1%) | 120 (5.9%) |
| $100,000 and over | 5,610 (100.0%) | 0 (0.0%) |
Public vs Private Health Insurance Coverage by Age in Spanish Fort
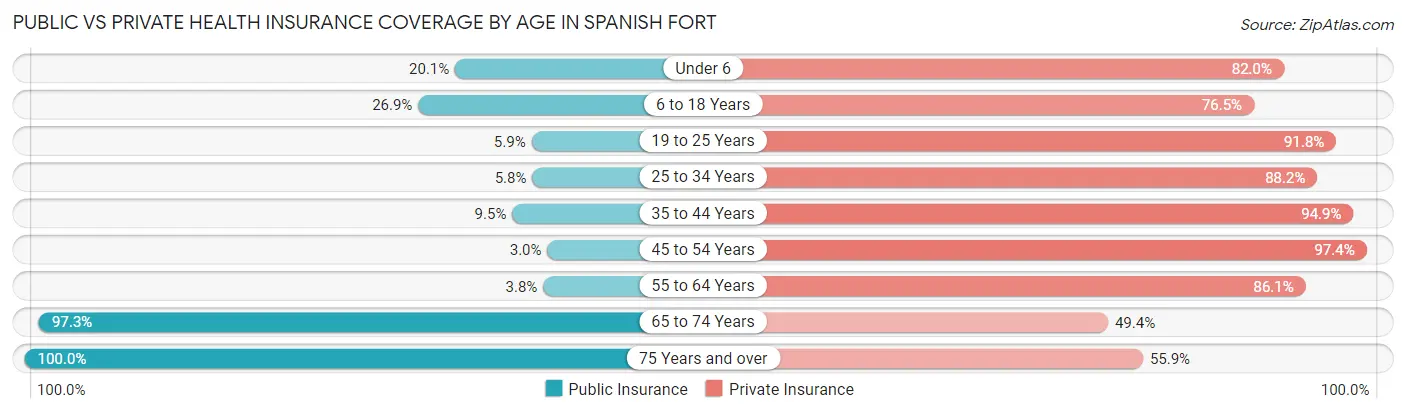
| Age Bracket | Public Insurance | Private Insurance |
| Under 6 | 180 (20.1%) | 735 (82.0%) |
| 6 to 18 Years | 573 (26.9%) | 1,627 (76.5%) |
| 19 to 25 Years | 48 (5.9%) | 745 (91.7%) |
| 25 to 34 Years | 47 (5.8%) | 720 (88.2%) |
| 35 to 44 Years | 92 (9.5%) | 920 (94.9%) |
| 45 to 54 Years | 34 (3.0%) | 1,114 (97.4%) |
| 55 to 64 Years | 53 (3.7%) | 1,217 (86.1%) |
| 65 to 74 Years | 987 (97.3%) | 501 (49.4%) |
| 75 Years and over | 746 (100.0%) | 417 (55.9%) |
| Total | 2,760 (27.8%) | 7,996 (80.5%) |
Disability Status by Sex by Age in Spanish Fort
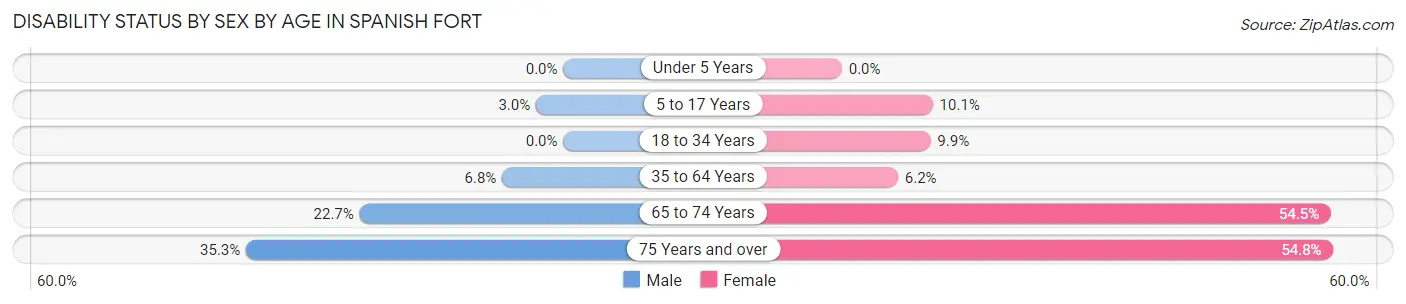
| Age Bracket | Male | Female |
| Under 5 Years | 0 (0.0%) | 0 (0.0%) |
| 5 to 17 Years | 32 (3.0%) | 96 (10.1%) |
| 18 to 34 Years | 0 (0.0%) | 85 (9.9%) |
| 35 to 64 Years | 131 (6.8%) | 100 (6.2%) |
| 65 to 74 Years | 91 (22.7%) | 334 (54.5%) |
| 75 Years and over | 59 (35.3%) | 317 (54.7%) |
Disability Class by Sex by Age in Spanish Fort
Disability Class: Hearing Difficulty
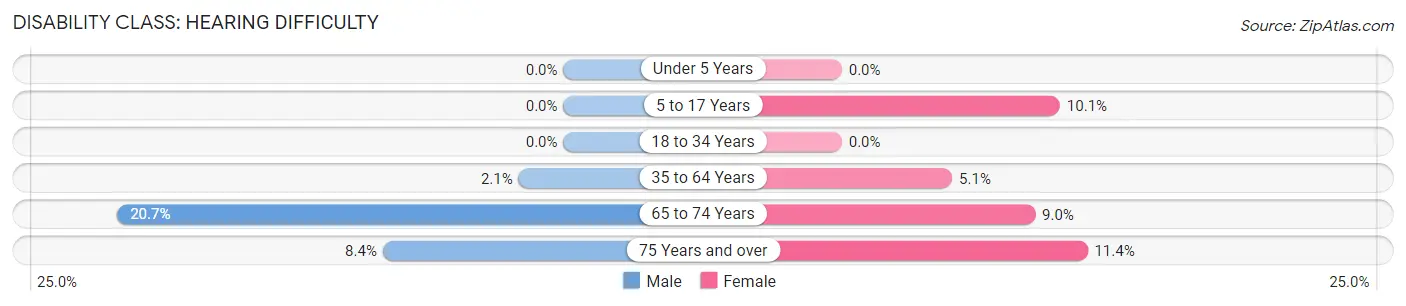
| Age Bracket | Male | Female |
| Under 5 Years | 0 (0.0%) | 0 (0.0%) |
| 5 to 17 Years | 0 (0.0%) | 96 (10.1%) |
| 18 to 34 Years | 0 (0.0%) | 0 (0.0%) |
| 35 to 64 Years | 40 (2.1%) | 82 (5.1%) |
| 65 to 74 Years | 83 (20.7%) | 55 (9.0%) |
| 75 Years and over | 14 (8.4%) | 66 (11.4%) |
Disability Class: Vision Difficulty
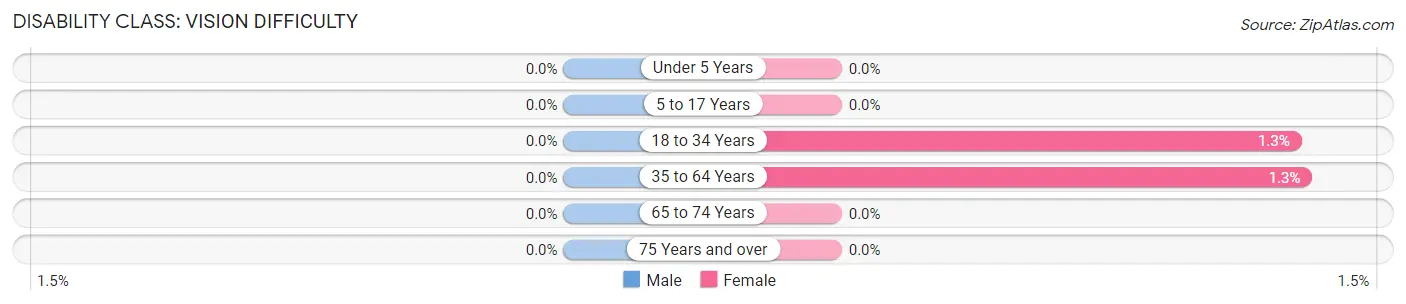
| Age Bracket | Male | Female |
| Under 5 Years | 0 (0.0%) | 0 (0.0%) |
| 5 to 17 Years | 0 (0.0%) | 0 (0.0%) |
| 18 to 34 Years | 0 (0.0%) | 11 (1.3%) |
| 35 to 64 Years | 0 (0.0%) | 21 (1.3%) |
| 65 to 74 Years | 0 (0.0%) | 0 (0.0%) |
| 75 Years and over | 0 (0.0%) | 0 (0.0%) |
Disability Class: Cognitive Difficulty
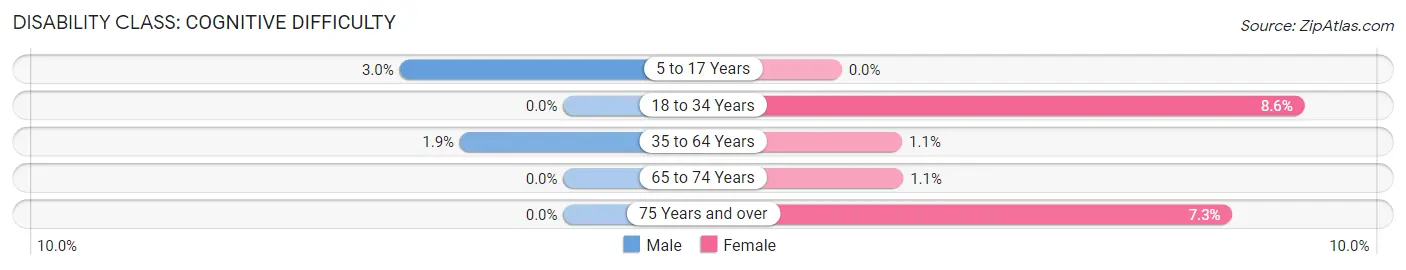
| Age Bracket | Male | Female |
| 5 to 17 Years | 32 (3.0%) | 0 (0.0%) |
| 18 to 34 Years | 0 (0.0%) | 74 (8.6%) |
| 35 to 64 Years | 37 (1.9%) | 18 (1.1%) |
| 65 to 74 Years | 0 (0.0%) | 7 (1.1%) |
| 75 Years and over | 0 (0.0%) | 42 (7.2%) |
Disability Class: Ambulatory Difficulty
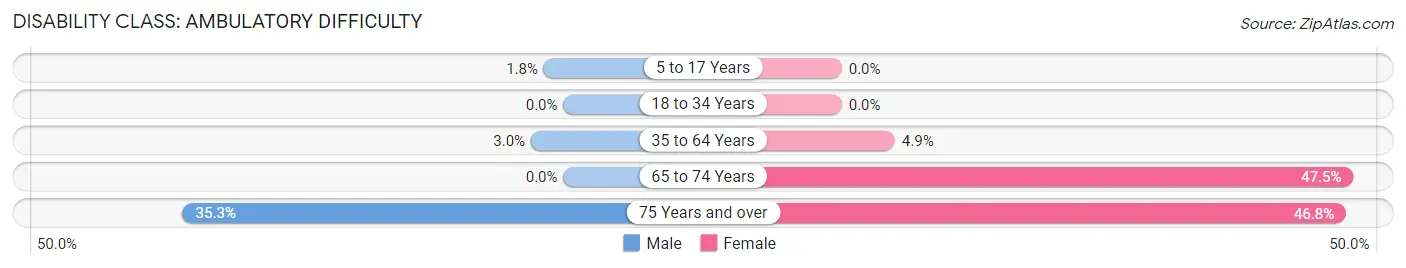
| Age Bracket | Male | Female |
| 5 to 17 Years | 19 (1.8%) | 0 (0.0%) |
| 18 to 34 Years | 0 (0.0%) | 0 (0.0%) |
| 35 to 64 Years | 58 (3.0%) | 79 (4.9%) |
| 65 to 74 Years | 0 (0.0%) | 291 (47.5%) |
| 75 Years and over | 59 (35.3%) | 271 (46.8%) |
Disability Class: Self-Care Difficulty
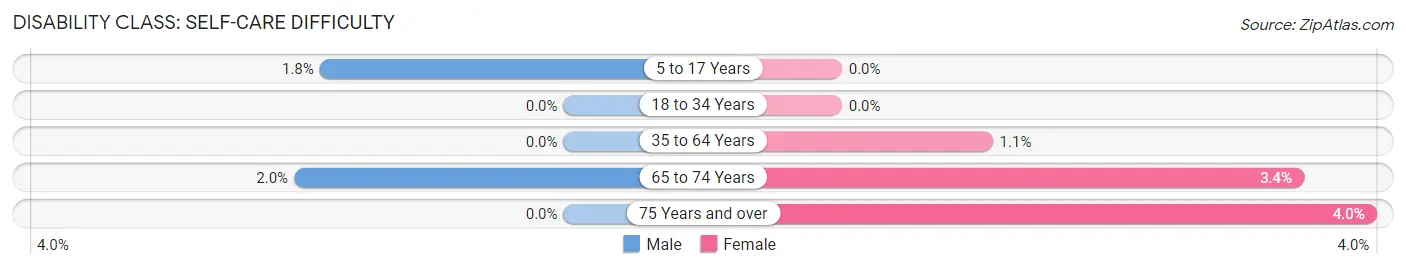
| Age Bracket | Male | Female |
| 5 to 17 Years | 19 (1.8%) | 0 (0.0%) |
| 18 to 34 Years | 0 (0.0%) | 0 (0.0%) |
| 35 to 64 Years | 0 (0.0%) | 18 (1.1%) |
| 65 to 74 Years | 8 (2.0%) | 21 (3.4%) |
| 75 Years and over | 0 (0.0%) | 23 (4.0%) |
Technology Access in Spanish Fort
Computing Device Access in Spanish Fort
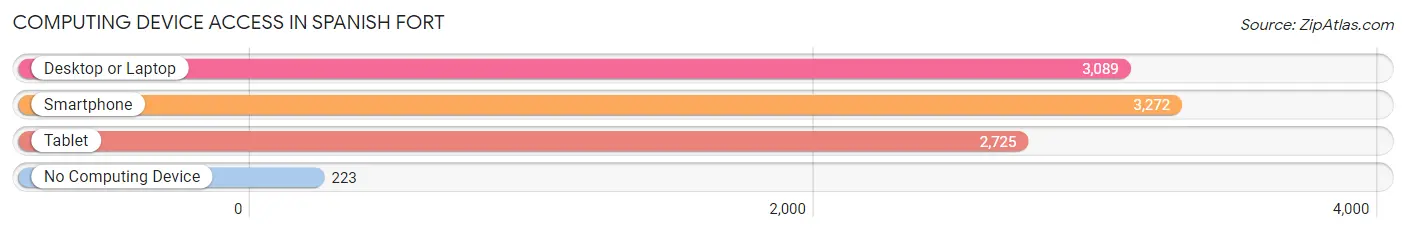
| Device Type | # Households | % Households |
| Desktop or Laptop | 3,089 | 83.3% |
| Smartphone | 3,272 | 88.2% |
| Tablet | 2,725 | 73.5% |
| No Computing Device | 223 | 6.0% |
| Total | 3,709 | 100.0% |
Internet Access in Spanish Fort
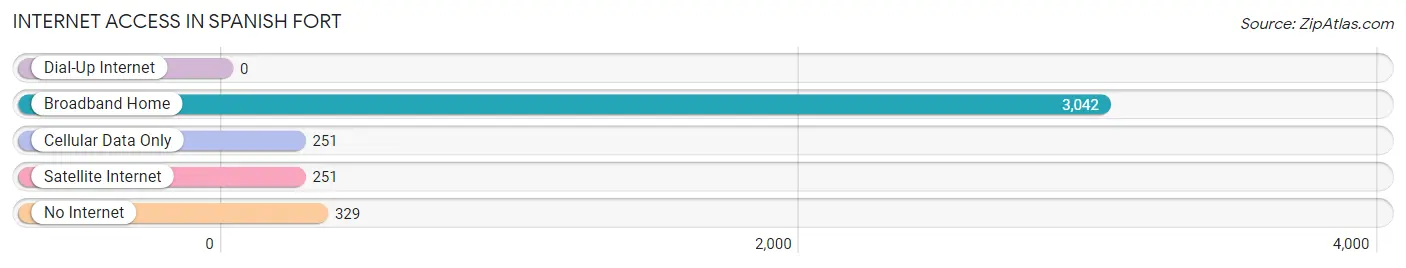
| Internet Type | # Households | % Households |
| Dial-Up Internet | 0 | 0.0% |
| Broadband Home | 3,042 | 82.0% |
| Cellular Data Only | 251 | 6.8% |
| Satellite Internet | 251 | 6.8% |
| No Internet | 329 | 8.9% |
| Total | 3,709 | 100.0% |
Spanish Fort Summary
Fortress of San Esteban de la Mobile, or the Spanish Fort, is a small town located in Baldwin County, Alabama. It is situated on the eastern shore of Mobile Bay, approximately 20 miles east of Mobile. The town was founded in 1712 by the Spanish, and was the first permanent European settlement in what is now Alabama. The town was named after the Spanish fort that was built to protect the settlement from Native American attacks.
Geography
Spanish Fort is located at 30°41'N 88°2'W (30.6833, -88.0333). It is situated on the eastern shore of Mobile Bay, approximately 20 miles east of Mobile. The town has a total area of 4.2 square miles, all of which is land. The town is bordered by the cities of Daphne and Fairhope to the north, and the city of Bay Minette to the south.
Climate
Spanish Fort has a humid subtropical climate, with hot, humid summers and mild winters. The average annual temperature is 64°F, with an average high of 81°F in July and an average low of 46°F in January. The average annual precipitation is 62 inches, with the wettest month being July, when an average of 8.5 inches of rain falls.
Demographics
As of the 2010 census, Spanish Fort had a population of 6,798. The racial makeup of the town was 92.3% White, 4.2% African American, 0.7% Native American, 0.7% Asian, 0.2% Pacific Islander, 0.9% from other races, and 1.2% from two or more races. Hispanic or Latino of any race were 2.7% of the population.
Economy
Spanish Fort is a small town with a largely agricultural economy. The town is home to several farms, as well as a few small businesses. The town is also home to a number of restaurants, shops, and other businesses. The town is also home to a number of industrial parks, which provide employment opportunities for local residents.
Education
Spanish Fort is served by the Baldwin County Public Schools system. The town is home to two elementary schools, one middle school, and one high school. The town is also home to a number of private schools, including a Catholic school and a Montessori school.
Transportation
Spanish Fort is served by the Baldwin County Public Transportation system, which provides bus service to the town. The town is also served by the Mobile Regional Airport, which is located approximately 20 miles away.
Conclusion
Spanish Fort is a small town located on the eastern shore of Mobile Bay in Baldwin County, Alabama. The town was founded in 1712 by the Spanish, and was the first permanent European settlement in what is now Alabama. The town has a humid subtropical climate, with hot, humid summers and mild winters. As of the 2010 census, Spanish Fort had a population of 6,798. The town has a largely agricultural economy, and is served by the Baldwin County Public Schools system. The town is also served by the Baldwin County Public Transportation system, and the Mobile Regional Airport.
Common Questions
What is Per Capita Income in Spanish Fort?
Per Capita income in Spanish Fort is $40,969.
What is the Median Family Income in Spanish Fort?
Median Family Income in Spanish Fort is $133,120.
What is the Median Household income in Spanish Fort?
Median Household Income in Spanish Fort is $98,350.
What is Income or Wage Gap in Spanish Fort?
Income or Wage Gap in Spanish Fort is 46.8%.
Women in Spanish Fort earn 53.2 cents for every dollar earned by a man.
What is Inequality or Gini Index in Spanish Fort?
Inequality or Gini Index in Spanish Fort is 0.38.
What is the Total Population of Spanish Fort?
Total Population of Spanish Fort is 10,083.
What is the Total Male Population of Spanish Fort?
Total Male Population of Spanish Fort is 5,112.
What is the Total Female Population of Spanish Fort?
Total Female Population of Spanish Fort is 4,971.
What is the Ratio of Males per 100 Females in Spanish Fort?
There are 102.84 Males per 100 Females in Spanish Fort.
What is the Ratio of Females per 100 Males in Spanish Fort?
There are 97.24 Females per 100 Males in Spanish Fort.
What is the Median Population Age in Spanish Fort?
Median Population Age in Spanish Fort is 37.1 Years.
What is the Average Family Size in Spanish Fort
Average Family Size in Spanish Fort is 3.5 People.
What is the Average Household Size in Spanish Fort
Average Household Size in Spanish Fort is 2.7 People.
How Large is the Labor Force in Spanish Fort?
There are 4,748 People in the Labor Forcein in Spanish Fort.
What is the Percentage of People in the Labor Force in Spanish Fort?
63.7% of People are in the Labor Force in Spanish Fort.
What is the Unemployment Rate in Spanish Fort?
Unemployment Rate in Spanish Fort is 1.9%.