Belle Fontaine, AL Map & Demographics
Belle Fontaine Map
Belle Fontaine Overview
$25,730
PER CAPITA INCOME
$46,944
AVG HOUSEHOLD INCOME
78.8%
WAGE / INCOME GAP [ % ]
21.2¢/ $1
WAGE / INCOME GAP [ $ ]
0.49
INEQUALITY / GINI INDEX
699
TOTAL POPULATION
387
MALE POPULATION
312
FEMALE POPULATION
124.04
MALES / 100 FEMALES
80.62
FEMALES / 100 MALES
44.0
MEDIAN AGE
3.3
AVG FAMILY SIZE
2.9
AVG HOUSEHOLD SIZE
310
LABOR FORCE [ PEOPLE ]
52.9%
PERCENT IN LABOR FORCE
22.6%
UNEMPLOYMENT RATE
Income in Belle Fontaine
Income Overview in Belle Fontaine
| Characteristic | Number | Measure |
| Per Capita Income | 699 | $25,730 |
| Median Family Income | 182 | $0 |
| Mean Family Income | 182 | $81,366 |
| Median Household Income | 238 | $46,944 |
| Mean Household Income | 238 | $70,926 |
| Income Deficit | 182 | $0 |
| Wage / Income Gap (%) | 699 | 78.79% |
| Wage / Income Gap ($) | 699 | 21.21¢ per $1 |
| Gini / Inequality Index | 699 | 0.49 |
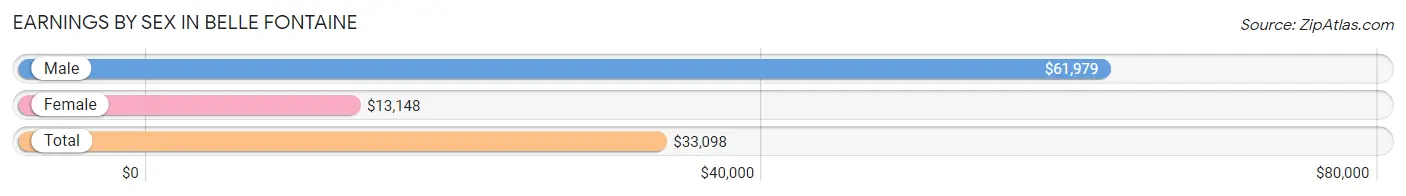
Earnings by Sex in Belle Fontaine
Average Earnings in Belle Fontaine are $33,098, $61,979 for men and $13,148 for women, a difference of 78.8%.
| Sex | Number | Average Earnings |
| Male | 145 (51.2%) | $61,979 |
| Female | 138 (48.8%) | $13,148 |
| Total | 283 (100.0%) | $33,098 |
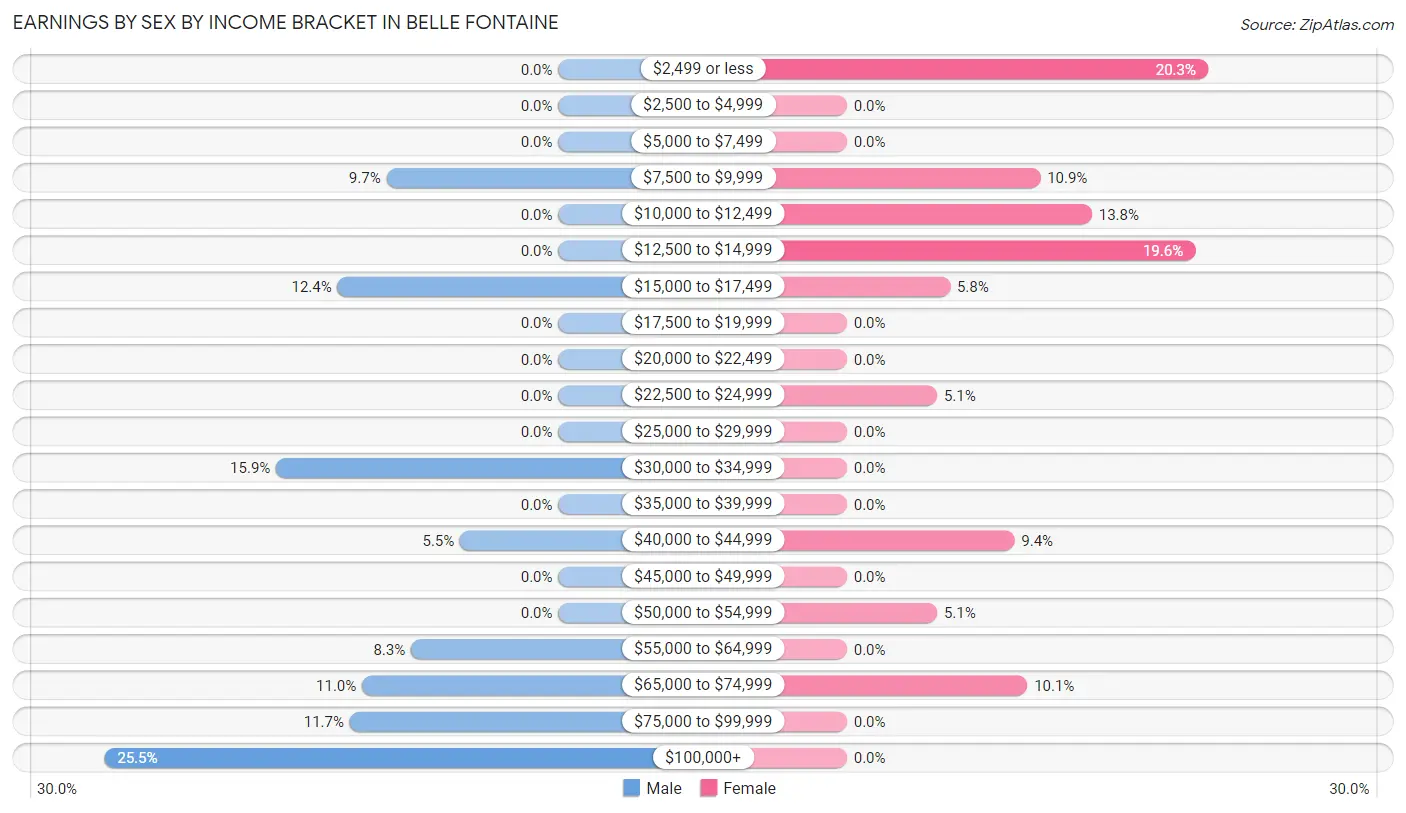
Earnings by Sex by Income Bracket in Belle Fontaine
The most common earnings brackets in Belle Fontaine are $100,000+ for men (37 | 25.5%) and $2,499 or less for women (28 | 20.3%).
| Income | Male | Female |
| $2,499 or less | 0 (0.0%) | 28 (20.3%) |
| $2,500 to $4,999 | 0 (0.0%) | 0 (0.0%) |
| $5,000 to $7,499 | 0 (0.0%) | 0 (0.0%) |
| $7,500 to $9,999 | 14 (9.7%) | 15 (10.9%) |
| $10,000 to $12,499 | 0 (0.0%) | 19 (13.8%) |
| $12,500 to $14,999 | 0 (0.0%) | 27 (19.6%) |
| $15,000 to $17,499 | 18 (12.4%) | 8 (5.8%) |
| $17,500 to $19,999 | 0 (0.0%) | 0 (0.0%) |
| $20,000 to $22,499 | 0 (0.0%) | 0 (0.0%) |
| $22,500 to $24,999 | 0 (0.0%) | 7 (5.1%) |
| $25,000 to $29,999 | 0 (0.0%) | 0 (0.0%) |
| $30,000 to $34,999 | 23 (15.9%) | 0 (0.0%) |
| $35,000 to $39,999 | 0 (0.0%) | 0 (0.0%) |
| $40,000 to $44,999 | 8 (5.5%) | 13 (9.4%) |
| $45,000 to $49,999 | 0 (0.0%) | 0 (0.0%) |
| $50,000 to $54,999 | 0 (0.0%) | 7 (5.1%) |
| $55,000 to $64,999 | 12 (8.3%) | 0 (0.0%) |
| $65,000 to $74,999 | 16 (11.0%) | 14 (10.1%) |
| $75,000 to $99,999 | 17 (11.7%) | 0 (0.0%) |
| $100,000+ | 37 (25.5%) | 0 (0.0%) |
| Total | 145 (100.0%) | 138 (100.0%) |
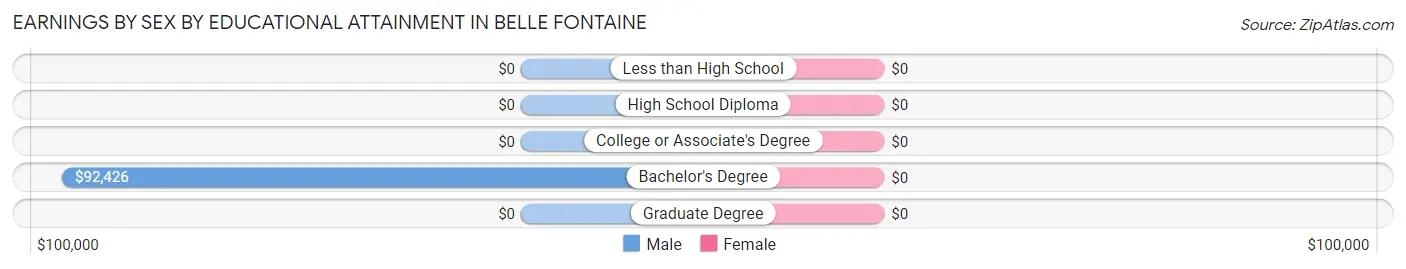
Earnings by Sex by Educational Attainment in Belle Fontaine
| Educational Attainment | Male Income | Female Income |
| Less than High School | - | - |
| High School Diploma | - | - |
| College or Associate's Degree | - | - |
| Bachelor's Degree | $92,426 | $0 |
| Graduate Degree | - | - |
| Total | $70,556 | $14,444 |
Family Income in Belle Fontaine
Family Income Brackets in Belle Fontaine
According to the Belle Fontaine family income data, there are 32 families falling into the $75,000 to $99,999 income range, which is the most common income bracket and makes up 17.6% of all families.
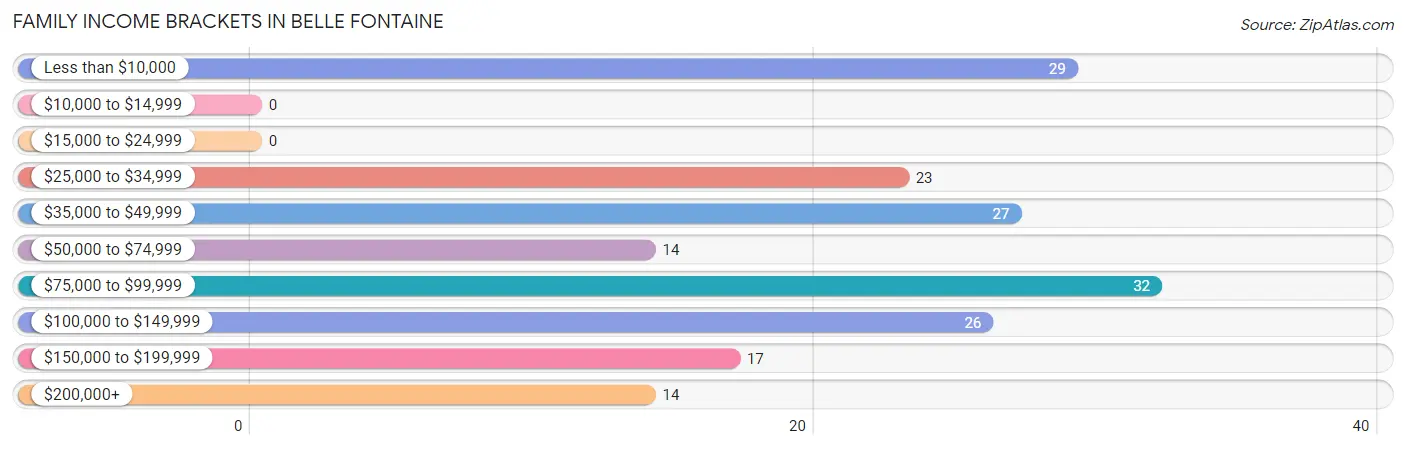
| Income Bracket | # Families | % Families |
| Less than $10,000 | 29 | 15.9% |
| $10,000 to $14,999 | 0 | 0.0% |
| $15,000 to $24,999 | 0 | 0.0% |
| $25,000 to $34,999 | 23 | 12.6% |
| $35,000 to $49,999 | 27 | 14.8% |
| $50,000 to $74,999 | 14 | 7.7% |
| $75,000 to $99,999 | 32 | 17.6% |
| $100,000 to $149,999 | 26 | 14.3% |
| $150,000 to $199,999 | 17 | 9.3% |
| $200,000+ | 14 | 7.7% |
Family Income by Famaliy Size in Belle Fontaine
4-person families (34 | 18.7%) account for the highest median family income in Belle Fontaine with $101,029 per family, while 2-person families (109 | 59.9%) have the highest median income of $27,902 per family member.
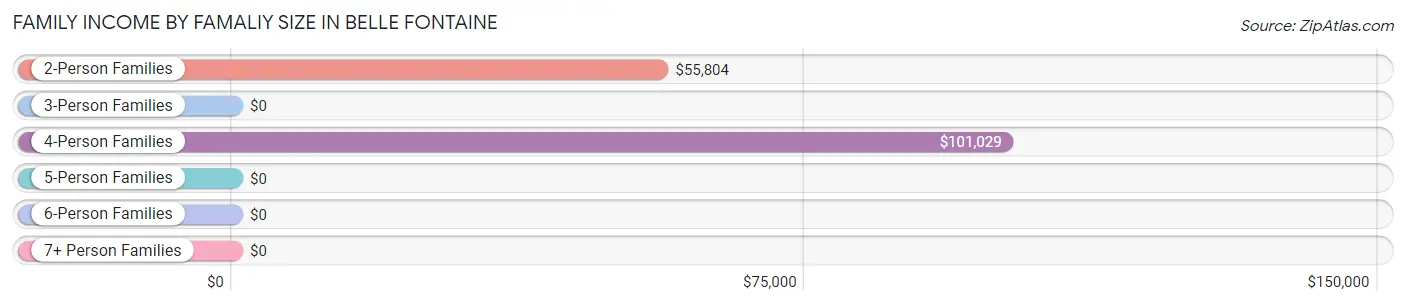
| Income Bracket | # Families | Median Income |
| 2-Person Families | 109 (59.9%) | $55,804 |
| 3-Person Families | 10 (5.5%) | $0 |
| 4-Person Families | 34 (18.7%) | $101,029 |
| 5-Person Families | 0 (0.0%) | $0 |
| 6-Person Families | 29 (15.9%) | $0 |
| 7+ Person Families | 0 (0.0%) | $0 |
| Total | 182 (100.0%) | $0 |
Family Income by Number of Earners in Belle Fontaine
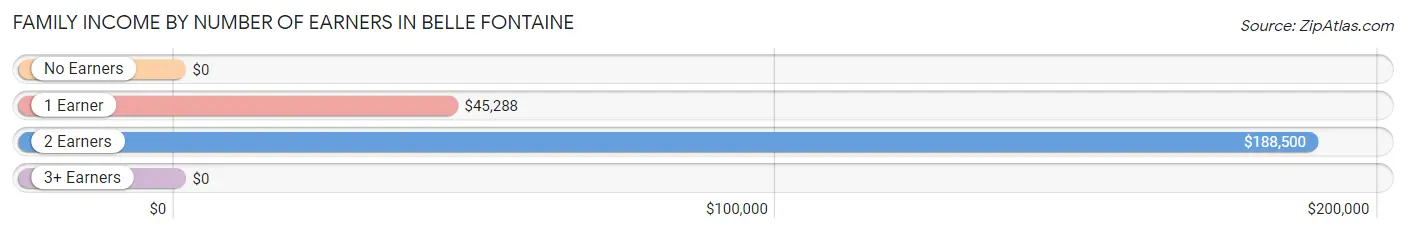
| Number of Earners | # Families | Median Income |
| No Earners | 25 (13.7%) | $0 |
| 1 Earner | 107 (58.8%) | $45,288 |
| 2 Earners | 40 (22.0%) | $188,500 |
| 3+ Earners | 10 (5.5%) | $0 |
| Total | 182 (100.0%) | $0 |
Household Income in Belle Fontaine
Household Income Brackets in Belle Fontaine
With 50 households falling in the category, the less than $10,000 income range is the most frequent in Belle Fontaine, accounting for 21.0% of all households.
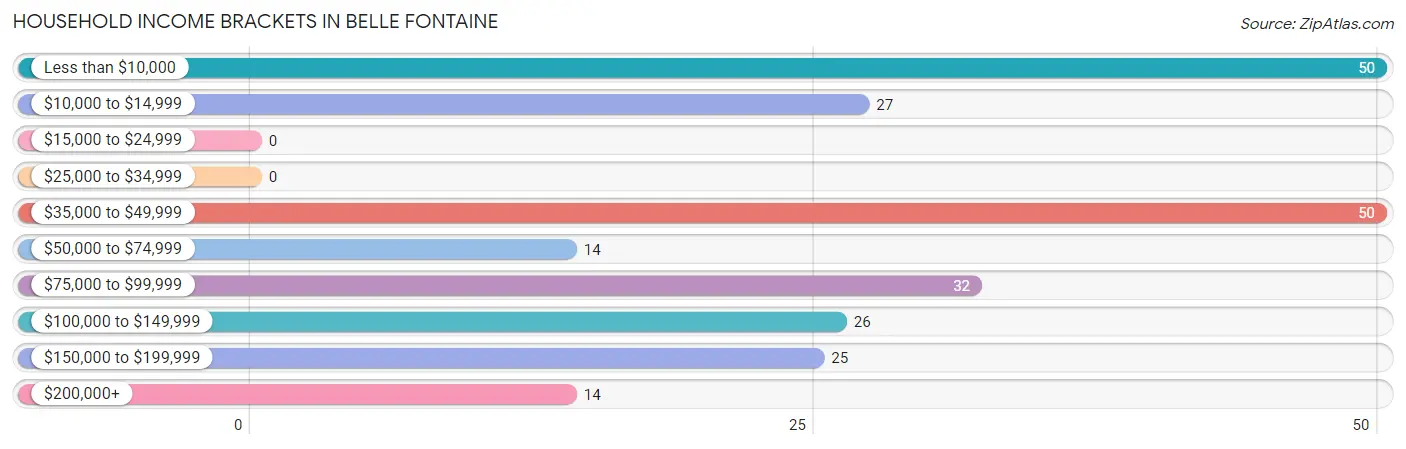
| Income Bracket | # Households | % Households |
| Less than $10,000 | 50 | 21.0% |
| $10,000 to $14,999 | 27 | 11.3% |
| $15,000 to $24,999 | 0 | 0.0% |
| $25,000 to $34,999 | 0 | 0.0% |
| $35,000 to $49,999 | 50 | 21.0% |
| $50,000 to $74,999 | 14 | 5.9% |
| $75,000 to $99,999 | 32 | 13.4% |
| $100,000 to $149,999 | 26 | 10.9% |
| $150,000 to $199,999 | 25 | 10.5% |
| $200,000+ | 14 | 5.9% |
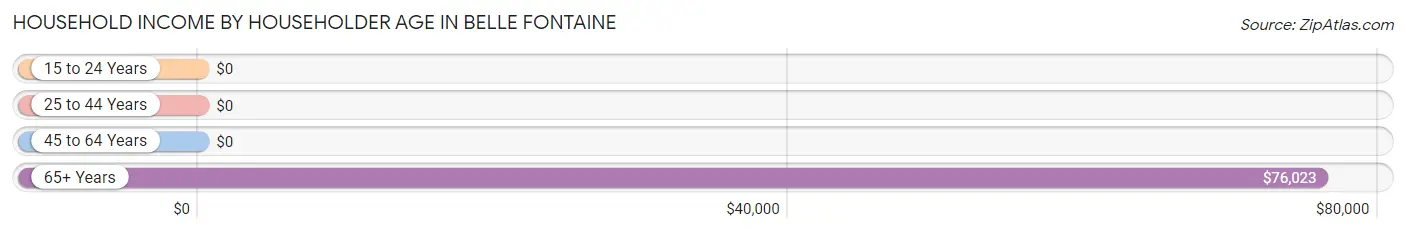
Household Income by Householder Age in Belle Fontaine
The median household income in Belle Fontaine is $46,944, with the highest median household income of $76,023 found in the 65+ years age bracket for the primary householder. A total of 89 households (37.4%) fall into this category. Meanwhile, the 15 to 24 years age bracket for the primary householder has the lowest median household income of $0, with 23 households (9.7%) in this group.
| Income Bracket | # Households | Median Income |
| 15 to 24 Years | 23 (9.7%) | $0 |
| 25 to 44 Years | 59 (24.8%) | $0 |
| 45 to 64 Years | 67 (28.1%) | $0 |
| 65+ Years | 89 (37.4%) | $76,023 |
| Total | 238 (100.0%) | $46,944 |
Poverty in Belle Fontaine
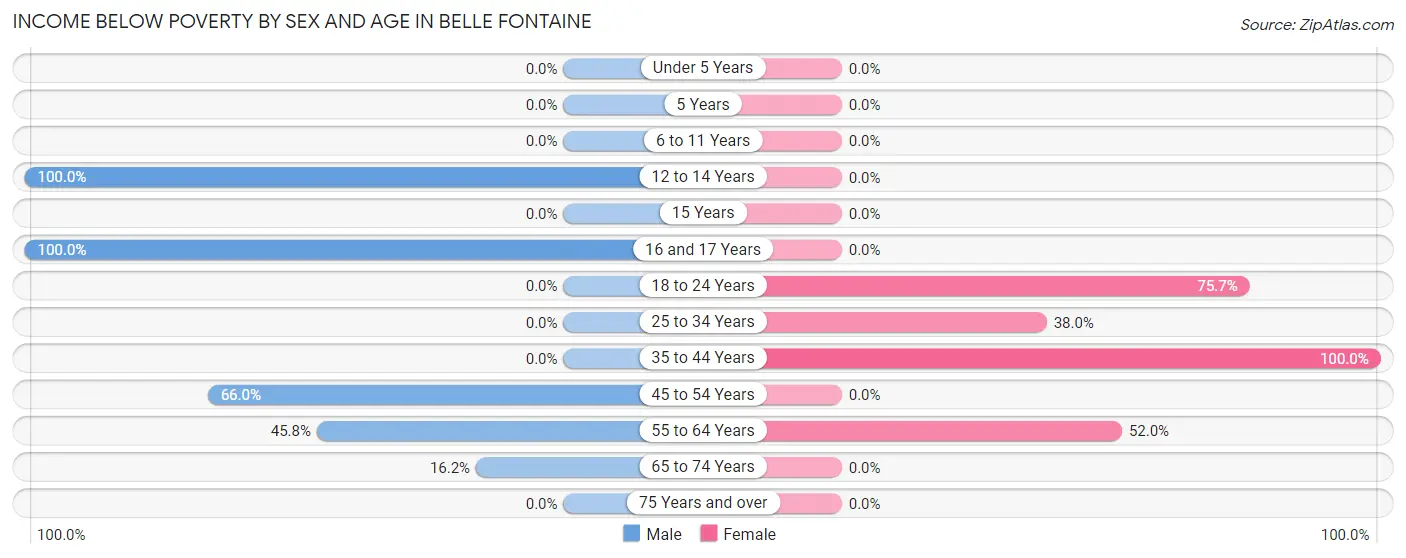
Income Below Poverty by Sex and Age in Belle Fontaine
With 42.9% poverty level for males and 35.3% for females among the residents of Belle Fontaine, 12 to 14 year old males and 35 to 44 year old females are the most vulnerable to poverty, with 63 males (100.0%) and 29 females (100.0%) in their respective age groups living below the poverty level.
| Age Bracket | Male | Female |
| Under 5 Years | 0 (0.0%) | 0 (0.0%) |
| 5 Years | 0 (0.0%) | 0 (0.0%) |
| 6 to 11 Years | 0 (0.0%) | 0 (0.0%) |
| 12 to 14 Years | 63 (100.0%) | 0 (0.0%) |
| 15 Years | 0 (0.0%) | 0 (0.0%) |
| 16 and 17 Years | 31 (100.0%) | 0 (0.0%) |
| 18 to 24 Years | 0 (0.0%) | 28 (75.7%) |
| 25 to 34 Years | 0 (0.0%) | 27 (38.0%) |
| 35 to 44 Years | 0 (0.0%) | 29 (100.0%) |
| 45 to 54 Years | 33 (66.0%) | 0 (0.0%) |
| 55 to 64 Years | 27 (45.8%) | 26 (52.0%) |
| 65 to 74 Years | 12 (16.2%) | 0 (0.0%) |
| 75 Years and over | 0 (0.0%) | 0 (0.0%) |
| Total | 166 (42.9%) | 110 (35.3%) |
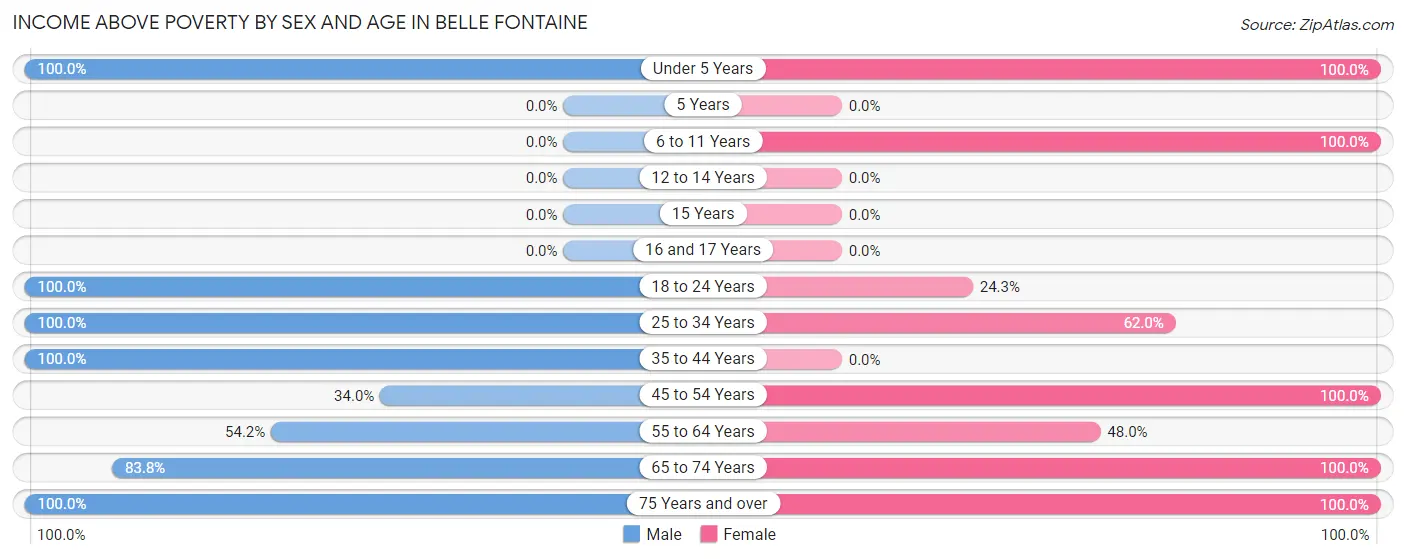
Income Above Poverty by Sex and Age in Belle Fontaine
According to the poverty statistics in Belle Fontaine, males aged under 5 years and females aged under 5 years are the age groups that are most secure financially, with 100.0% of males and 100.0% of females in these age groups living above the poverty line.
| Age Bracket | Male | Female |
| Under 5 Years | 18 (100.0%) | 8 (100.0%) |
| 5 Years | 0 (0.0%) | 0 (0.0%) |
| 6 to 11 Years | 0 (0.0%) | 24 (100.0%) |
| 12 to 14 Years | 0 (0.0%) | 0 (0.0%) |
| 15 Years | 0 (0.0%) | 0 (0.0%) |
| 16 and 17 Years | 0 (0.0%) | 0 (0.0%) |
| 18 to 24 Years | 33 (100.0%) | 9 (24.3%) |
| 25 to 34 Years | 35 (100.0%) | 44 (62.0%) |
| 35 to 44 Years | 15 (100.0%) | 0 (0.0%) |
| 45 to 54 Years | 17 (34.0%) | 35 (100.0%) |
| 55 to 64 Years | 32 (54.2%) | 24 (48.0%) |
| 65 to 74 Years | 62 (83.8%) | 52 (100.0%) |
| 75 Years and over | 9 (100.0%) | 6 (100.0%) |
| Total | 221 (57.1%) | 202 (64.7%) |
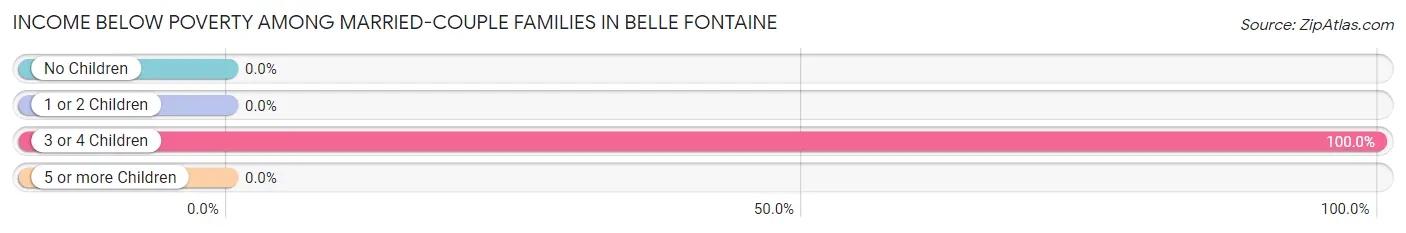
Income Below Poverty Among Married-Couple Families in Belle Fontaine
The poverty statistics for married-couple families in Belle Fontaine show that 24.0% or 29 of the total 121 families live below the poverty line. Families with 3 or 4 children have the highest poverty rate of 100.0%, comprising of 29 families. On the other hand, families with no children have the lowest poverty rate of 0.0%, which includes 0 families.
| Children | Above Poverty | Below Poverty |
| No Children | 75 (100.0%) | 0 (0.0%) |
| 1 or 2 Children | 17 (100.0%) | 0 (0.0%) |
| 3 or 4 Children | 0 (0.0%) | 29 (100.0%) |
| 5 or more Children | 0 (0.0%) | 0 (0.0%) |
| Total | 92 (76.0%) | 29 (24.0%) |
Income Below Poverty Among Single-Parent Households in Belle Fontaine
| Children | Single Father | Single Mother |
| No Children | 0 (0.0%) | 0 (0.0%) |
| 1 or 2 Children | 0 (0.0%) | 0 (0.0%) |
| 3 or 4 Children | 0 (0.0%) | 0 (0.0%) |
| 5 or more Children | 0 (0.0%) | 0 (0.0%) |
| Total | 0 (0.0%) | 0 (0.0%) |
Income Below Poverty Among Married-Couple vs Single-Parent Households in Belle Fontaine
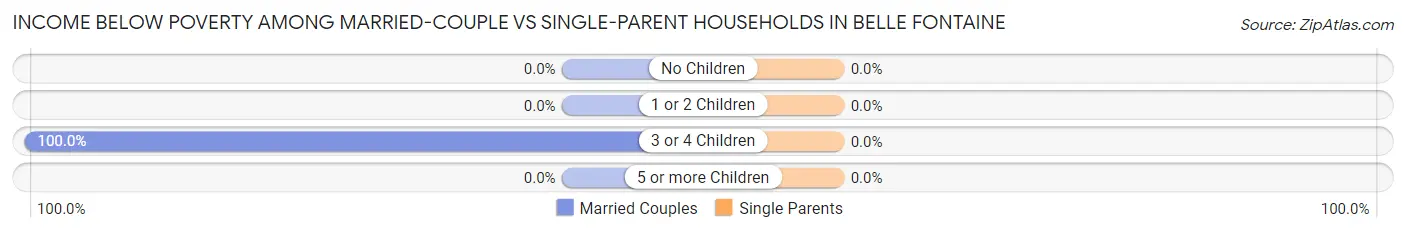
| Children | Married-Couple Families | Single-Parent Households |
| No Children | 0 (0.0%) | 0 (0.0%) |
| 1 or 2 Children | 0 (0.0%) | 0 (0.0%) |
| 3 or 4 Children | 29 (100.0%) | 0 (0.0%) |
| 5 or more Children | 0 (0.0%) | 0 (0.0%) |
| Total | 29 (24.0%) | 0 (0.0%) |
Race in Belle Fontaine
The most populous races in Belle Fontaine are , and White / Caucasian (699 | 100.0%).
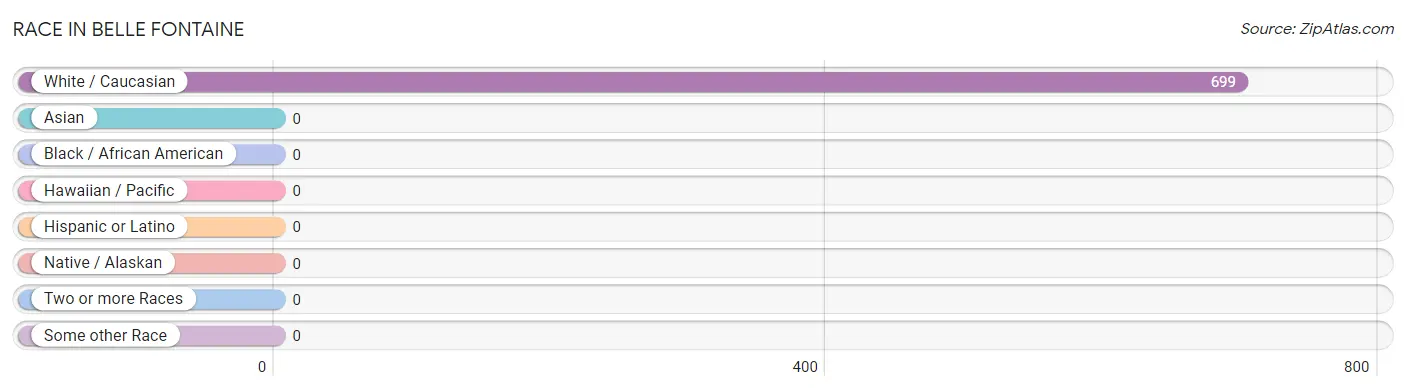
| Race | # Population | % Population |
| Asian | 0 | 0.0% |
| Black / African American | 0 | 0.0% |
| Hawaiian / Pacific | 0 | 0.0% |
| Hispanic or Latino | 0 | 0.0% |
| Native / Alaskan | 0 | 0.0% |
| White / Caucasian | 699 | 100.0% |
| Two or more Races | 0 | 0.0% |
| Some other Race | 0 | 0.0% |
| Total | 699 | 100.0% |
Ancestry in Belle Fontaine
The most populous ancestries reported in Belle Fontaine are German (106 | 15.2%), Irish (73 | 10.4%), English (63 | 9.0%), French (41 | 5.9%), and Danish (27 | 3.9%), together accounting for 44.3% of all Belle Fontaine residents.
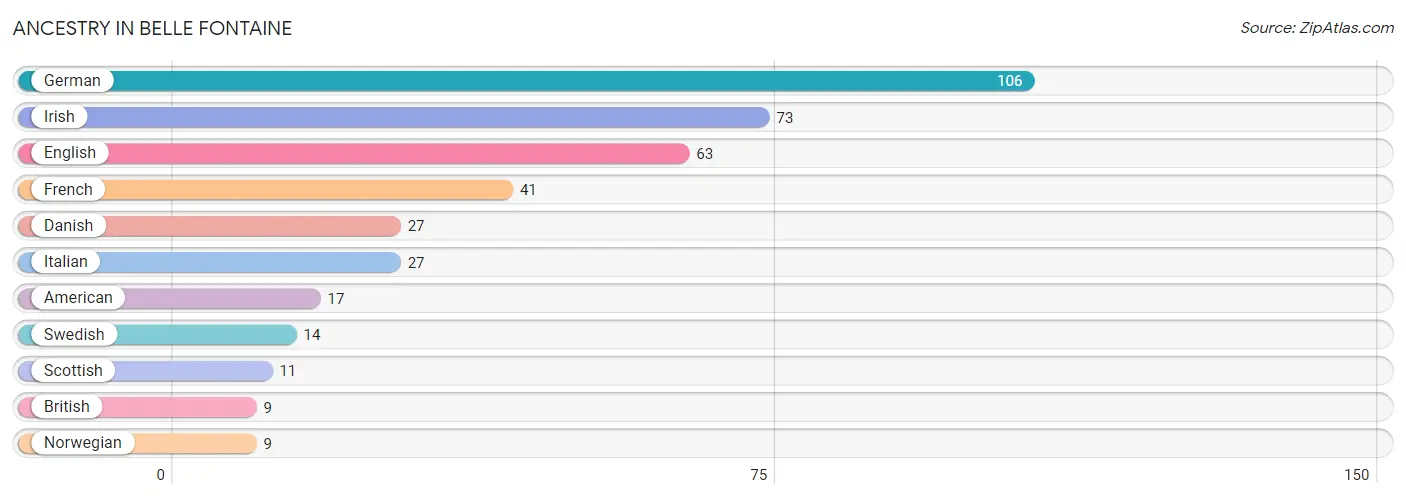
| Ancestry | # Population | % Population |
| American | 17 | 2.4% |
| British | 9 | 1.3% |
| Danish | 27 | 3.9% |
| English | 63 | 9.0% |
| French | 41 | 5.9% |
| German | 106 | 15.2% |
| Irish | 73 | 10.4% |
| Italian | 27 | 3.9% |
| Norwegian | 9 | 1.3% |
| Scottish | 11 | 1.6% |
| Swedish | 14 | 2.0% | View All 11 Rows |
Immigrants in Belle Fontaine

| Immigration Origin | # Population | % Population | View All 0 Rows |
Sex and Age in Belle Fontaine
Sex and Age in Belle Fontaine
The most populous age groups in Belle Fontaine are 10 to 14 Years (63 | 16.3%) for men and 30 to 34 Years (44 | 14.1%) for women.
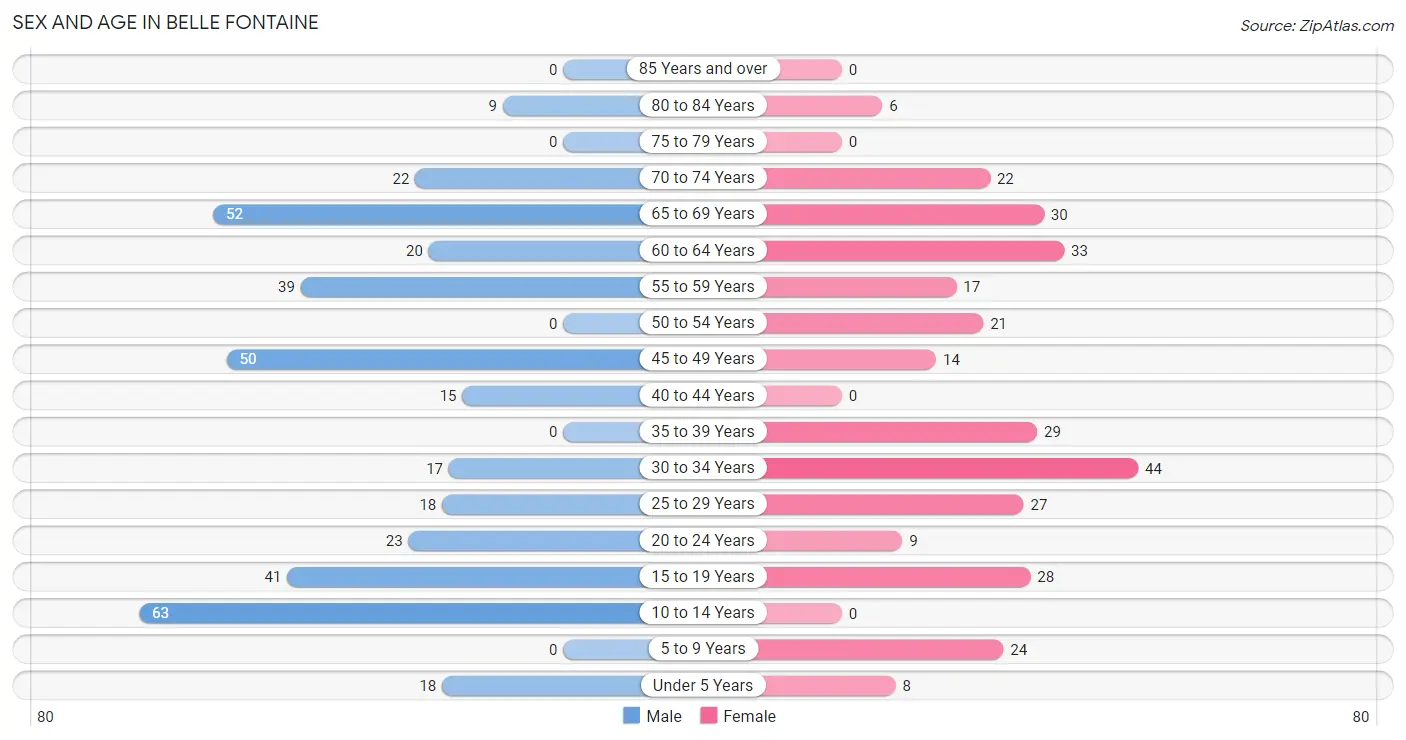
| Age Bracket | Male | Female |
| Under 5 Years | 18 (4.6%) | 8 (2.6%) |
| 5 to 9 Years | 0 (0.0%) | 24 (7.7%) |
| 10 to 14 Years | 63 (16.3%) | 0 (0.0%) |
| 15 to 19 Years | 41 (10.6%) | 28 (9.0%) |
| 20 to 24 Years | 23 (5.9%) | 9 (2.9%) |
| 25 to 29 Years | 18 (4.6%) | 27 (8.6%) |
| 30 to 34 Years | 17 (4.4%) | 44 (14.1%) |
| 35 to 39 Years | 0 (0.0%) | 29 (9.3%) |
| 40 to 44 Years | 15 (3.9%) | 0 (0.0%) |
| 45 to 49 Years | 50 (12.9%) | 14 (4.5%) |
| 50 to 54 Years | 0 (0.0%) | 21 (6.7%) |
| 55 to 59 Years | 39 (10.1%) | 17 (5.4%) |
| 60 to 64 Years | 20 (5.2%) | 33 (10.6%) |
| 65 to 69 Years | 52 (13.4%) | 30 (9.6%) |
| 70 to 74 Years | 22 (5.7%) | 22 (7.0%) |
| 75 to 79 Years | 0 (0.0%) | 0 (0.0%) |
| 80 to 84 Years | 9 (2.3%) | 6 (1.9%) |
| 85 Years and over | 0 (0.0%) | 0 (0.0%) |
| Total | 387 (100.0%) | 312 (100.0%) |
Families and Households in Belle Fontaine
Median Family Size in Belle Fontaine
The median family size in Belle Fontaine is 3.29 persons per family, with married-couple families (121 | 66.5%) accounting for the largest median family size of 3.91 persons per family. On the other hand, single female/mother families (29 | 15.9%) represent the smallest median family size with 2.03 persons per family.
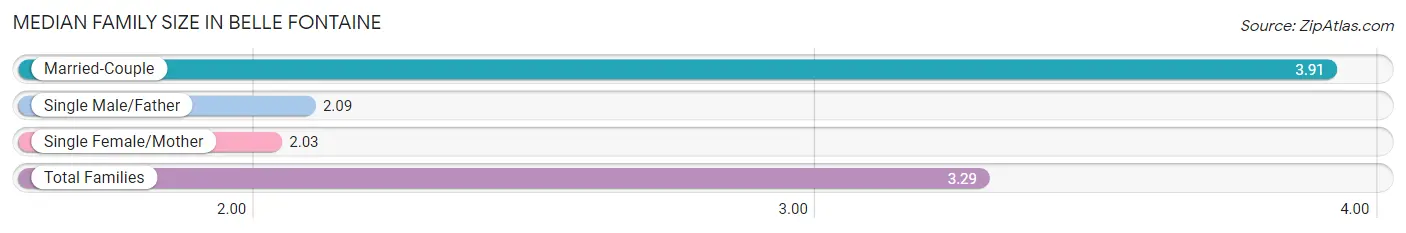
| Family Type | # Families | Family Size |
| Married-Couple | 121 (66.5%) | 3.91 |
| Single Male/Father | 32 (17.6%) | 2.09 |
| Single Female/Mother | 29 (15.9%) | 2.03 |
| Total Families | 182 (100.0%) | 3.29 |
Median Household Size in Belle Fontaine
The median household size in Belle Fontaine is 2.94 persons per household, with married-couple households (121 | 50.8%) accounting for the largest median household size of 3.91 persons per household. non-family households (56 | 23.5%) represent the smallest median household size with 1.30 persons per household.
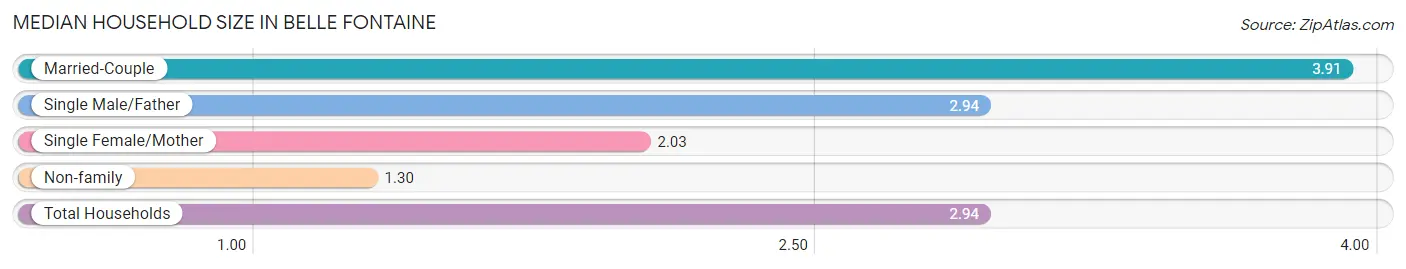
| Household Type | # Households | Household Size |
| Married-Couple | 121 (50.8%) | 3.91 |
| Single Male/Father | 32 (13.5%) | 2.94 |
| Single Female/Mother | 29 (12.2%) | 2.03 |
| Non-family | 56 (23.5%) | 1.30 |
| Total Households | 238 (100.0%) | 2.94 |
Household Size by Marriage Status in Belle Fontaine
Out of a total of 238 households in Belle Fontaine, 182 (76.5%) are family households, while 56 (23.5%) are nonfamily households. The most numerous type of family households are 2-person households, comprising 86, and the most common type of nonfamily households are 1-person households, comprising 44.
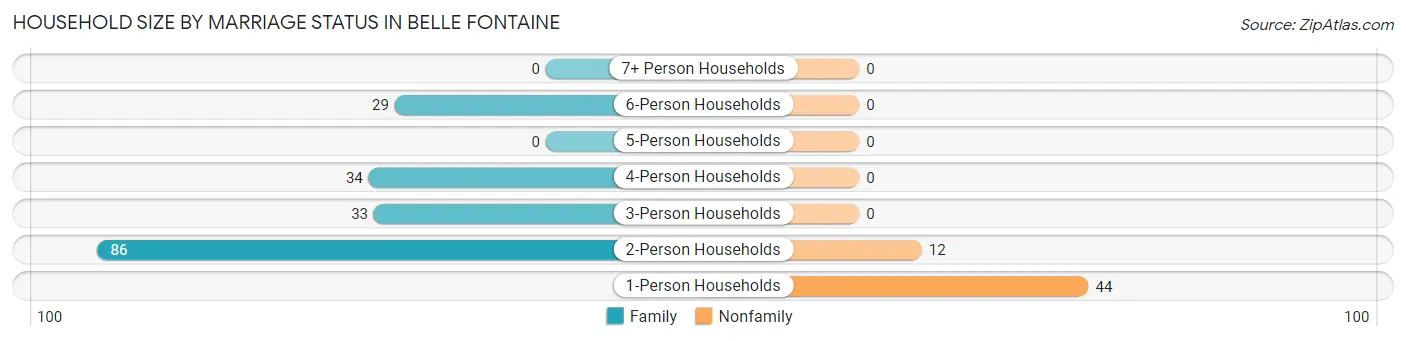
| Household Size | Family Households | Nonfamily Households |
| 1-Person Households | - | 44 (18.5%) |
| 2-Person Households | 86 (36.1%) | 12 (5.0%) |
| 3-Person Households | 33 (13.9%) | 0 (0.0%) |
| 4-Person Households | 34 (14.3%) | 0 (0.0%) |
| 5-Person Households | 0 (0.0%) | 0 (0.0%) |
| 6-Person Households | 29 (12.2%) | 0 (0.0%) |
| 7+ Person Households | 0 (0.0%) | 0 (0.0%) |
| Total | 182 (76.5%) | 56 (23.5%) |
Female Fertility in Belle Fontaine
Fertility by Age in Belle Fontaine
| Age Bracket | Women with Births | Births / 1,000 Women |
| 15 to 19 years | 0 (0.0%) | 0.0 |
| 20 to 34 years | 0 (0.0%) | 0.0 |
| 35 to 50 years | 0 (0.0%) | 0.0 |
| Total | 0 (0.0%) | 0.0 |
Fertility by Age by Marriage Status in Belle Fontaine
| Age Bracket | Married | Unmarried |
| 15 to 19 years | 0 (0.0%) | 0 (0.0%) |
| 20 to 34 years | 0 (0.0%) | 0 (0.0%) |
| 35 to 50 years | 0 (0.0%) | 0 (0.0%) |
| Total | 0 (0.0%) | 0 (0.0%) |
Fertility by Education in Belle Fontaine
| Educational Attainment | Women with Births | Births / 1,000 Women |
| Less than High School | 0 (0.0%) | 0.0 |
| High School Diploma | 0 (0.0%) | 0.0 |
| College or Associate's Degree | 0 (0.0%) | 0.0 |
| Bachelor's Degree | 0 (0.0%) | 0.0 |
| Graduate Degree | 0 (0.0%) | 0.0 |
| Total | 0 (0.0%) | 0.0 |
Fertility by Education by Marriage Status in Belle Fontaine
| Educational Attainment | Married | Unmarried |
| Less than High School | 0 (0.0%) | 0 (0.0%) |
| High School Diploma | 0 (0.0%) | 0 (0.0%) |
| College or Associate's Degree | 0 (0.0%) | 0 (0.0%) |
| Bachelor's Degree | 0 (0.0%) | 0 (0.0%) |
| Graduate Degree | 0 (0.0%) | 0 (0.0%) |
| Total | 0 (0.0%) | 0 (0.0%) |
Employment Characteristics in Belle Fontaine
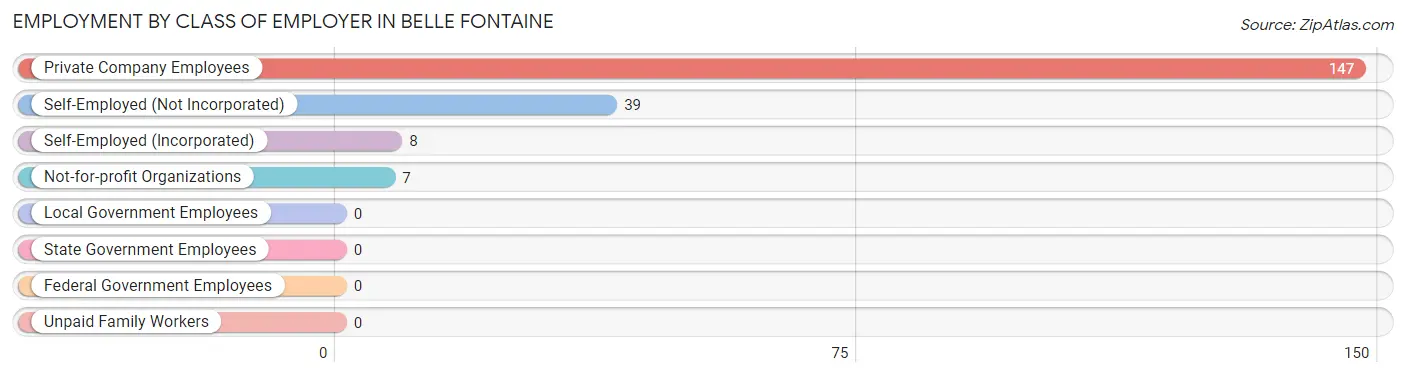
Employment by Class of Employer in Belle Fontaine
Among the 201 employed individuals in Belle Fontaine, private company employees (147 | 73.1%), self-employed (not incorporated) (39 | 19.4%), and self-employed (incorporated) (8 | 4.0%) make up the most common classes of employment.
| Employer Class | # Employees | % Employees |
| Private Company Employees | 147 | 73.1% |
| Self-Employed (Incorporated) | 8 | 4.0% |
| Self-Employed (Not Incorporated) | 39 | 19.4% |
| Not-for-profit Organizations | 7 | 3.5% |
| Local Government Employees | 0 | 0.0% |
| State Government Employees | 0 | 0.0% |
| Federal Government Employees | 0 | 0.0% |
| Unpaid Family Workers | 0 | 0.0% |
| Total | 201 | 100.0% |
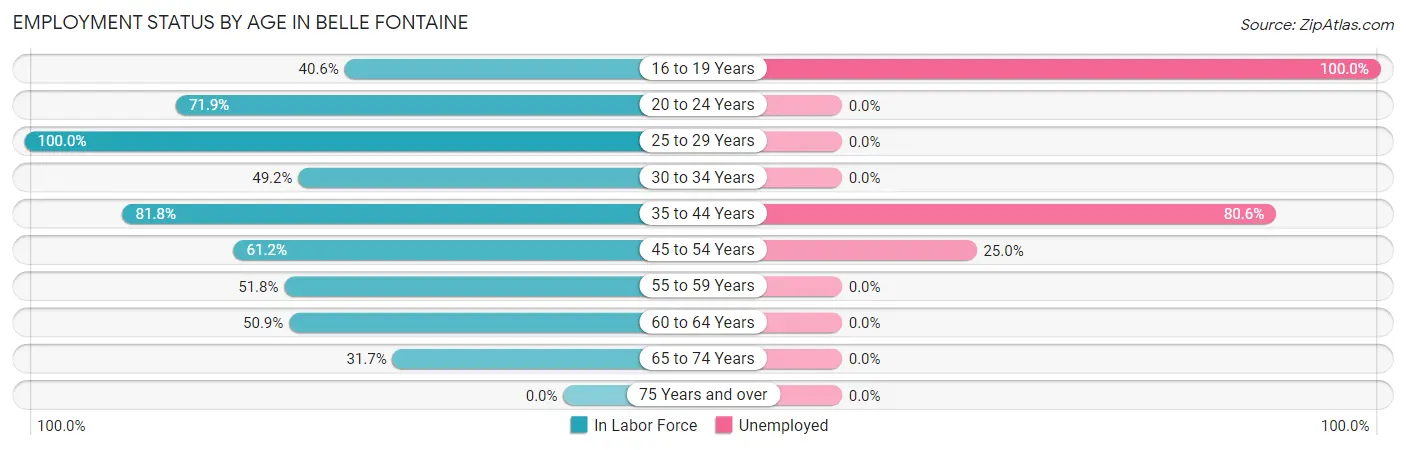
Employment Status by Age in Belle Fontaine
According to the labor force statistics for Belle Fontaine, out of the total population over 16 years of age (586), 52.9% or 310 individuals are in the labor force, with 22.6% or 70 of them unemployed. The age group with the highest labor force participation rate is 25 to 29 years, with 100.0% or 45 individuals in the labor force. Within the labor force, the 16 to 19 years age range has the highest percentage of unemployed individuals, with 100.0% or 28 of them being unemployed.
| Age Bracket | In Labor Force | Unemployed |
| 16 to 19 Years | 28 (40.6%) | 28 (100.0%) |
| 20 to 24 Years | 23 (71.9%) | 0 (0.0%) |
| 25 to 29 Years | 45 (100.0%) | 0 (0.0%) |
| 30 to 34 Years | 30 (49.2%) | 0 (0.0%) |
| 35 to 44 Years | 36 (81.8%) | 29 (80.6%) |
| 45 to 54 Years | 52 (61.2%) | 13 (25.0%) |
| 55 to 59 Years | 29 (51.8%) | 0 (0.0%) |
| 60 to 64 Years | 27 (50.9%) | 0 (0.0%) |
| 65 to 74 Years | 40 (31.7%) | 0 (0.0%) |
| 75 Years and over | 0 (0.0%) | 0 (0.0%) |
| Total | 310 (52.9%) | 70 (22.6%) |
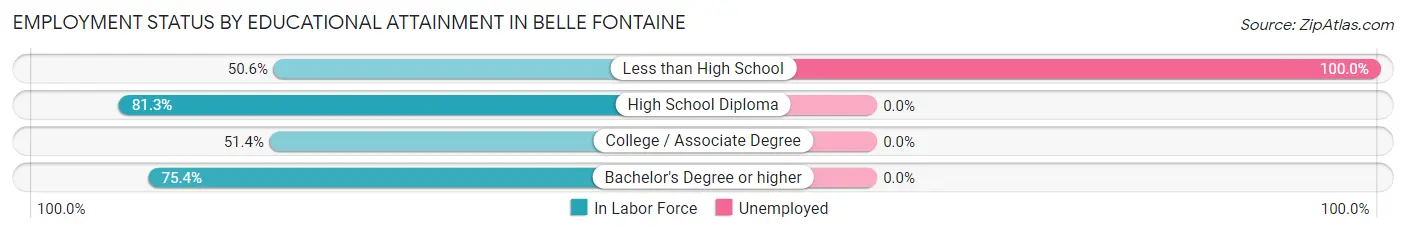
Employment Status by Educational Attainment in Belle Fontaine
According to labor force statistics for Belle Fontaine, 63.7% of individuals (219) out of the total population between 25 and 64 years of age (344) are in the labor force, with 19.2% or 42 of them being unemployed. The group with the highest labor force participation rate are those with the educational attainment of high school diploma, with 81.3% or 74 individuals in the labor force. Within the labor force, individuals with less than high school education have the highest percentage of unemployment, with 100.0% or 42 of them being unemployed.
| Educational Attainment | In Labor Force | Unemployed |
| Less than High School | 42 (50.6%) | 83 (100.0%) |
| High School Diploma | 74 (81.3%) | 0 (0.0%) |
| College / Associate Degree | 54 (51.4%) | 0 (0.0%) |
| Bachelor's Degree or higher | 49 (75.4%) | 0 (0.0%) |
| Total | 219 (63.7%) | 66 (19.2%) |
Employment Occupations by Sex in Belle Fontaine
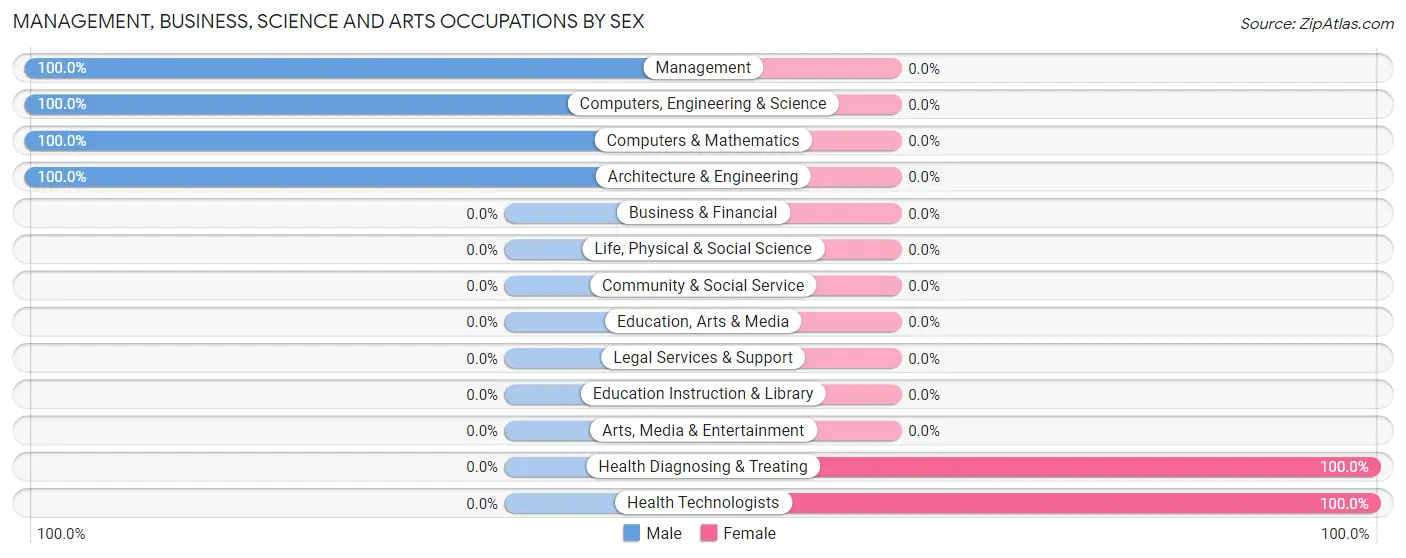
Management, Business, Science and Arts Occupations
The most common Management, Business, Science and Arts occupations in Belle Fontaine are Computers, Engineering & Science (42 | 17.5%), Management (29 | 12.1%), Architecture & Engineering (25 | 10.4%), Computers & Mathematics (17 | 7.1%), and Health Diagnosing & Treating (7 | 2.9%).
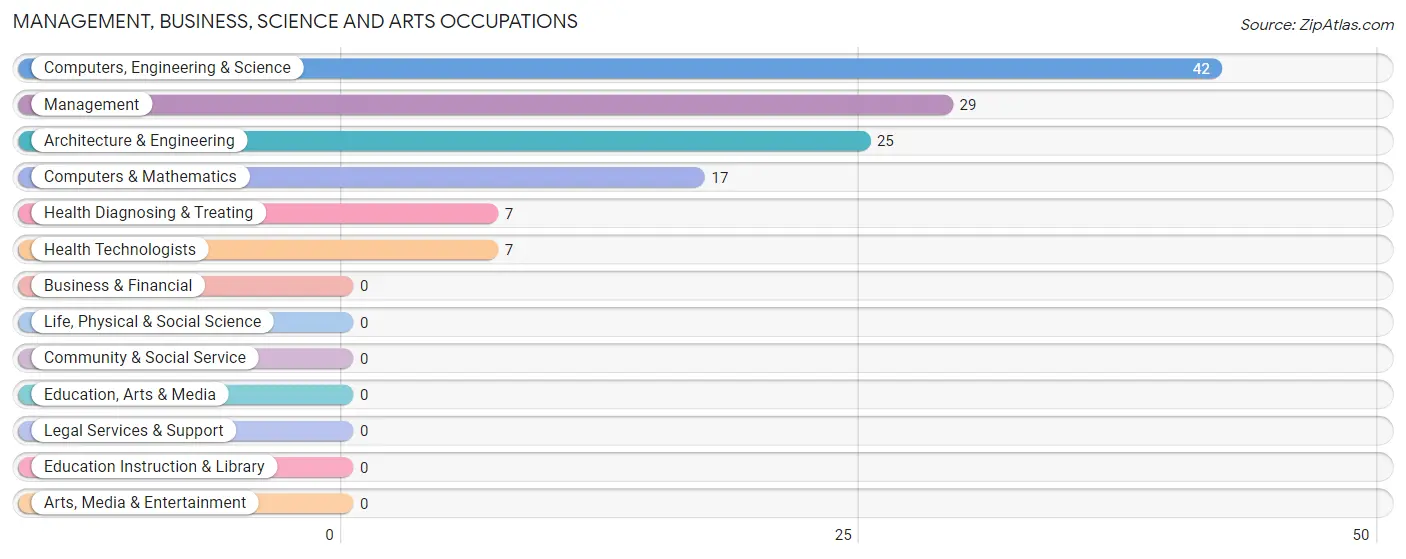
Management, Business, Science and Arts Occupations by Sex
Within the Management, Business, Science and Arts occupations in Belle Fontaine, the most male-oriented occupations are Management (100.0%), Computers, Engineering & Science (100.0%), and Computers & Mathematics (100.0%), while the most female-oriented occupations are Health Diagnosing & Treating (100.0%), and Health Technologists (100.0%).
| Occupation | Male | Female |
| Management | 29 (100.0%) | 0 (0.0%) |
| Business & Financial | 0 (0.0%) | 0 (0.0%) |
| Computers, Engineering & Science | 42 (100.0%) | 0 (0.0%) |
| Computers & Mathematics | 17 (100.0%) | 0 (0.0%) |
| Architecture & Engineering | 25 (100.0%) | 0 (0.0%) |
| Life, Physical & Social Science | 0 (0.0%) | 0 (0.0%) |
| Community & Social Service | 0 (0.0%) | 0 (0.0%) |
| Education, Arts & Media | 0 (0.0%) | 0 (0.0%) |
| Legal Services & Support | 0 (0.0%) | 0 (0.0%) |
| Education Instruction & Library | 0 (0.0%) | 0 (0.0%) |
| Arts, Media & Entertainment | 0 (0.0%) | 0 (0.0%) |
| Health Diagnosing & Treating | 0 (0.0%) | 7 (100.0%) |
| Health Technologists | 0 (0.0%) | 7 (100.0%) |
| Total (Category) | 71 (91.0%) | 7 (9.0%) |
| Total (Overall) | 145 (60.4%) | 95 (39.6%) |
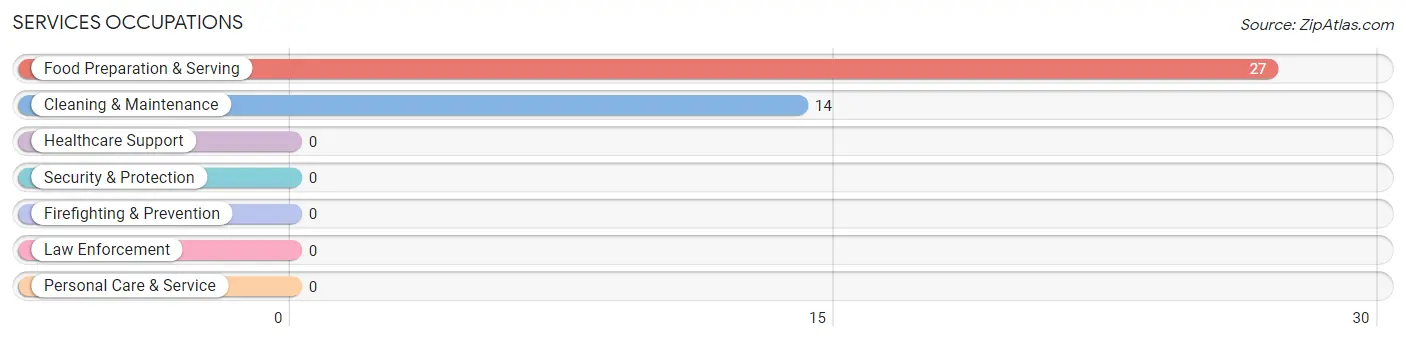
Services Occupations
The most common Services occupations in Belle Fontaine are Food Preparation & Serving (27 | 11.3%), and Cleaning & Maintenance (14 | 5.8%).
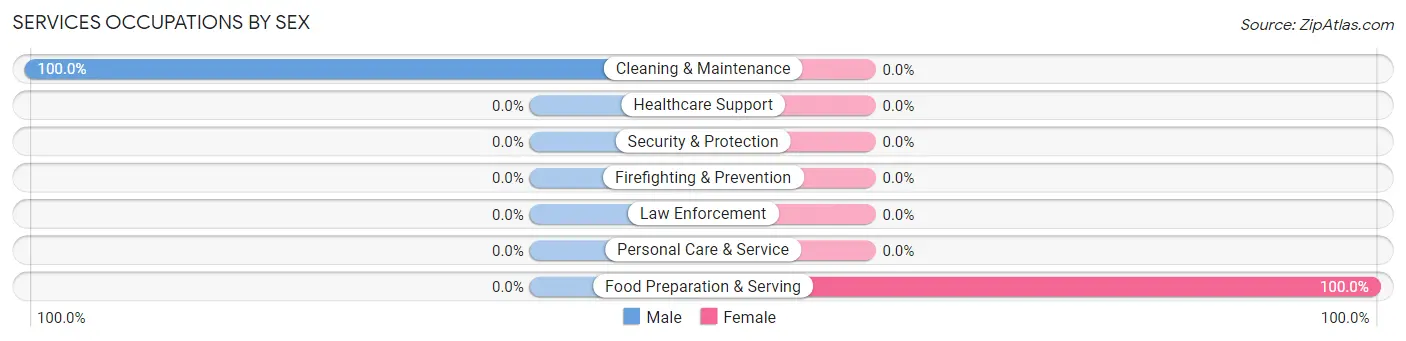
Services Occupations by Sex
| Occupation | Male | Female |
| Healthcare Support | 0 (0.0%) | 0 (0.0%) |
| Security & Protection | 0 (0.0%) | 0 (0.0%) |
| Firefighting & Prevention | 0 (0.0%) | 0 (0.0%) |
| Law Enforcement | 0 (0.0%) | 0 (0.0%) |
| Food Preparation & Serving | 0 (0.0%) | 27 (100.0%) |
| Cleaning & Maintenance | 14 (100.0%) | 0 (0.0%) |
| Personal Care & Service | 0 (0.0%) | 0 (0.0%) |
| Total (Category) | 14 (34.2%) | 27 (65.8%) |
| Total (Overall) | 145 (60.4%) | 95 (39.6%) |
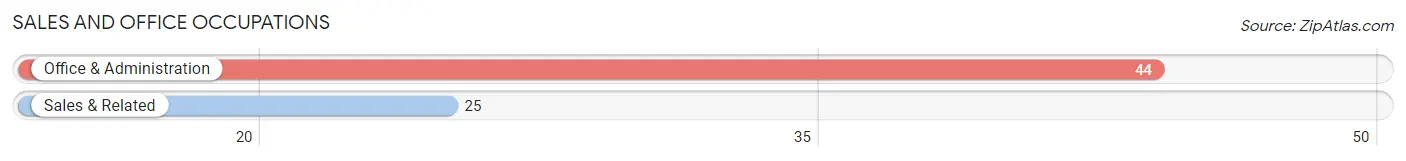
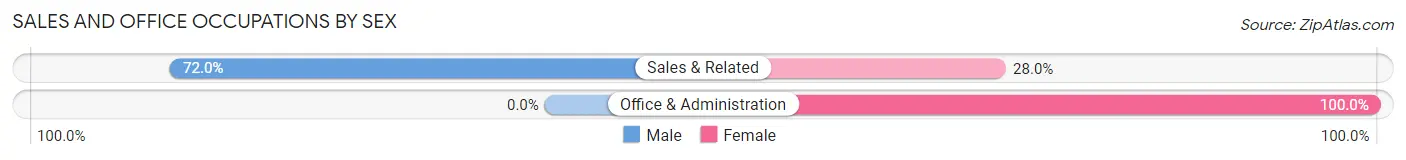
Sales and Office Occupations
The most common Sales and Office occupations in Belle Fontaine are Office & Administration (44 | 18.3%), and Sales & Related (25 | 10.4%).
Sales and Office Occupations by Sex
| Occupation | Male | Female |
| Sales & Related | 18 (72.0%) | 7 (28.0%) |
| Office & Administration | 0 (0.0%) | 44 (100.0%) |
| Total (Category) | 18 (26.1%) | 51 (73.9%) |
| Total (Overall) | 145 (60.4%) | 95 (39.6%) |
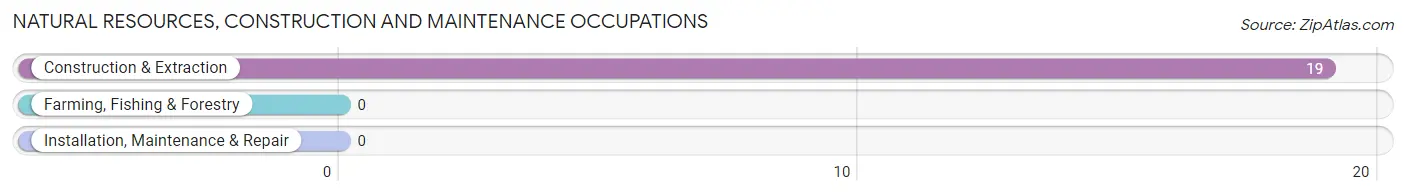
Natural Resources, Construction and Maintenance Occupations
The most common Natural Resources, Construction and Maintenance occupations in Belle Fontaine are , and Construction & Extraction (19 | 7.9%).
Natural Resources, Construction and Maintenance Occupations by Sex
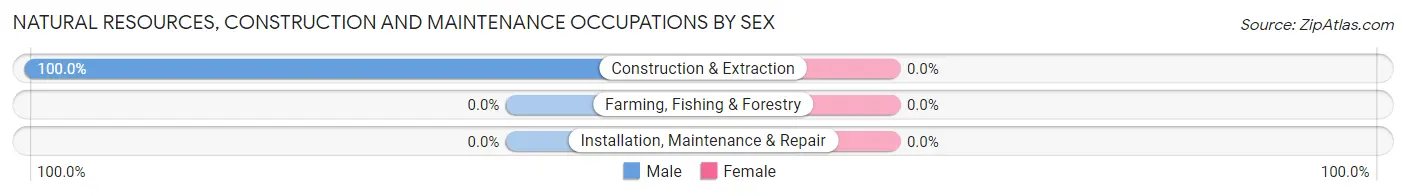
| Occupation | Male | Female |
| Farming, Fishing & Forestry | 0 (0.0%) | 0 (0.0%) |
| Construction & Extraction | 19 (100.0%) | 0 (0.0%) |
| Installation, Maintenance & Repair | 0 (0.0%) | 0 (0.0%) |
| Total (Category) | 19 (100.0%) | 0 (0.0%) |
| Total (Overall) | 145 (60.4%) | 95 (39.6%) |
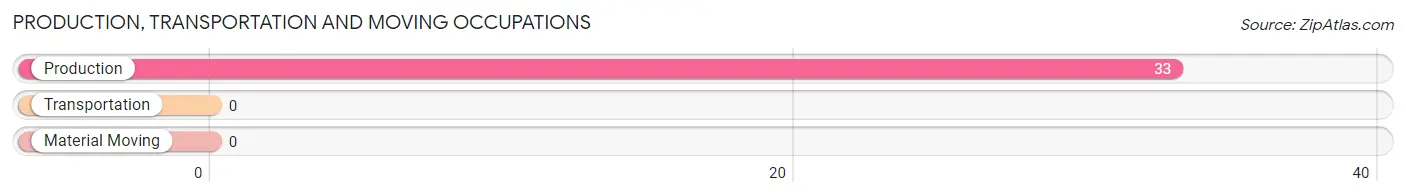
Production, Transportation and Moving Occupations
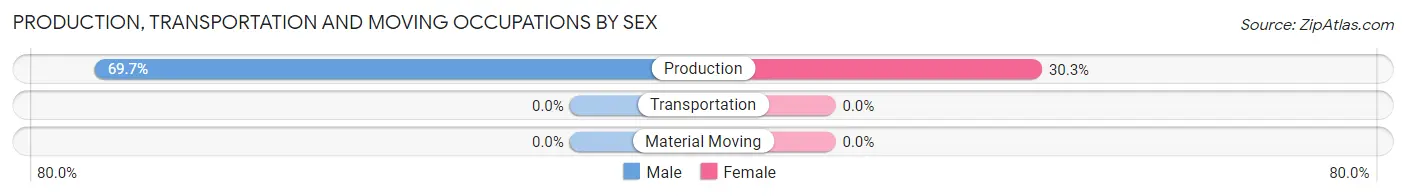
The most common Production, Transportation and Moving occupations in Belle Fontaine are , and Production (33 | 13.8%).
Production, Transportation and Moving Occupations by Sex
| Occupation | Male | Female |
| Production | 23 (69.7%) | 10 (30.3%) |
| Transportation | 0 (0.0%) | 0 (0.0%) |
| Material Moving | 0 (0.0%) | 0 (0.0%) |
| Total (Category) | 23 (69.7%) | 10 (30.3%) |
| Total (Overall) | 145 (60.4%) | 95 (39.6%) |
Employment Industries by Sex in Belle Fontaine
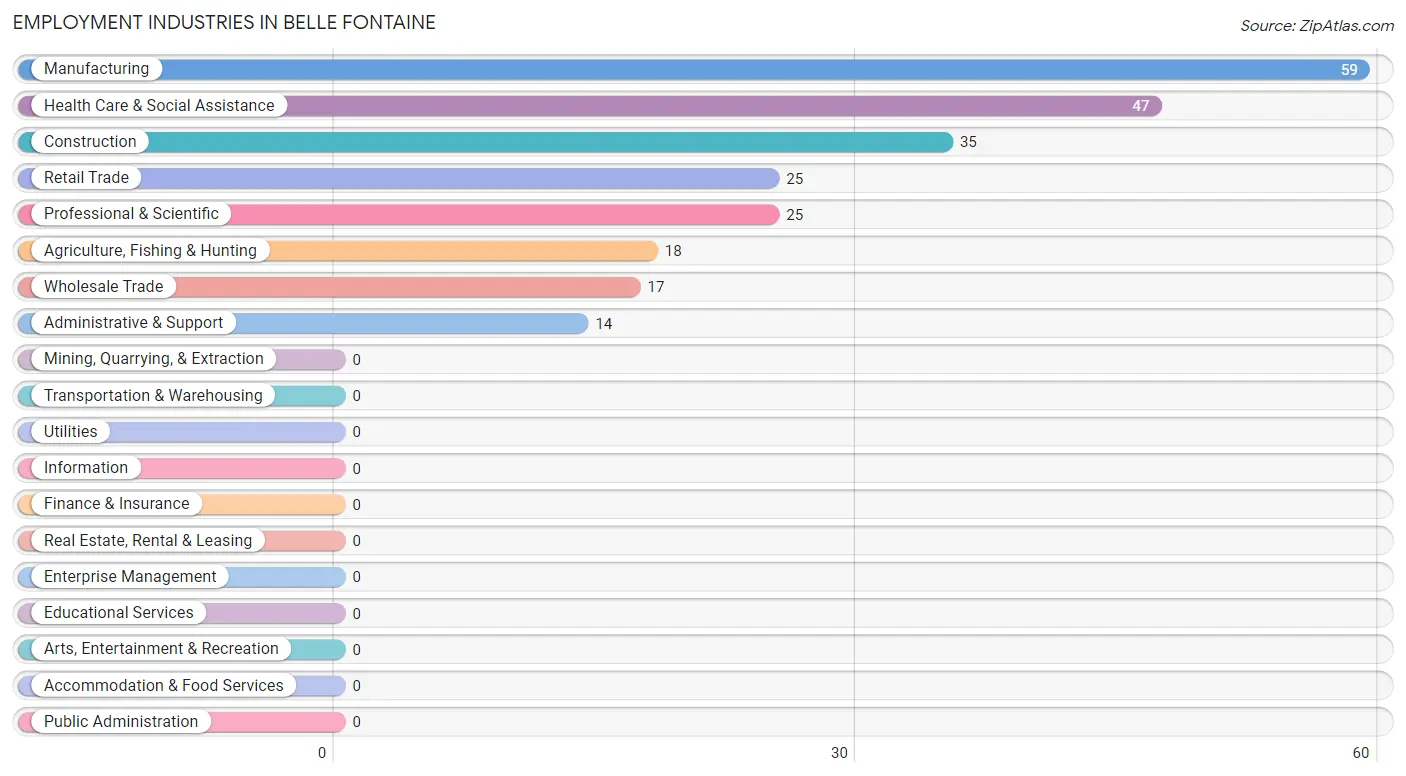
Employment Industries in Belle Fontaine
The major employment industries in Belle Fontaine include Manufacturing (59 | 24.6%), Health Care & Social Assistance (47 | 19.6%), Construction (35 | 14.6%), Retail Trade (25 | 10.4%), and Professional & Scientific (25 | 10.4%).
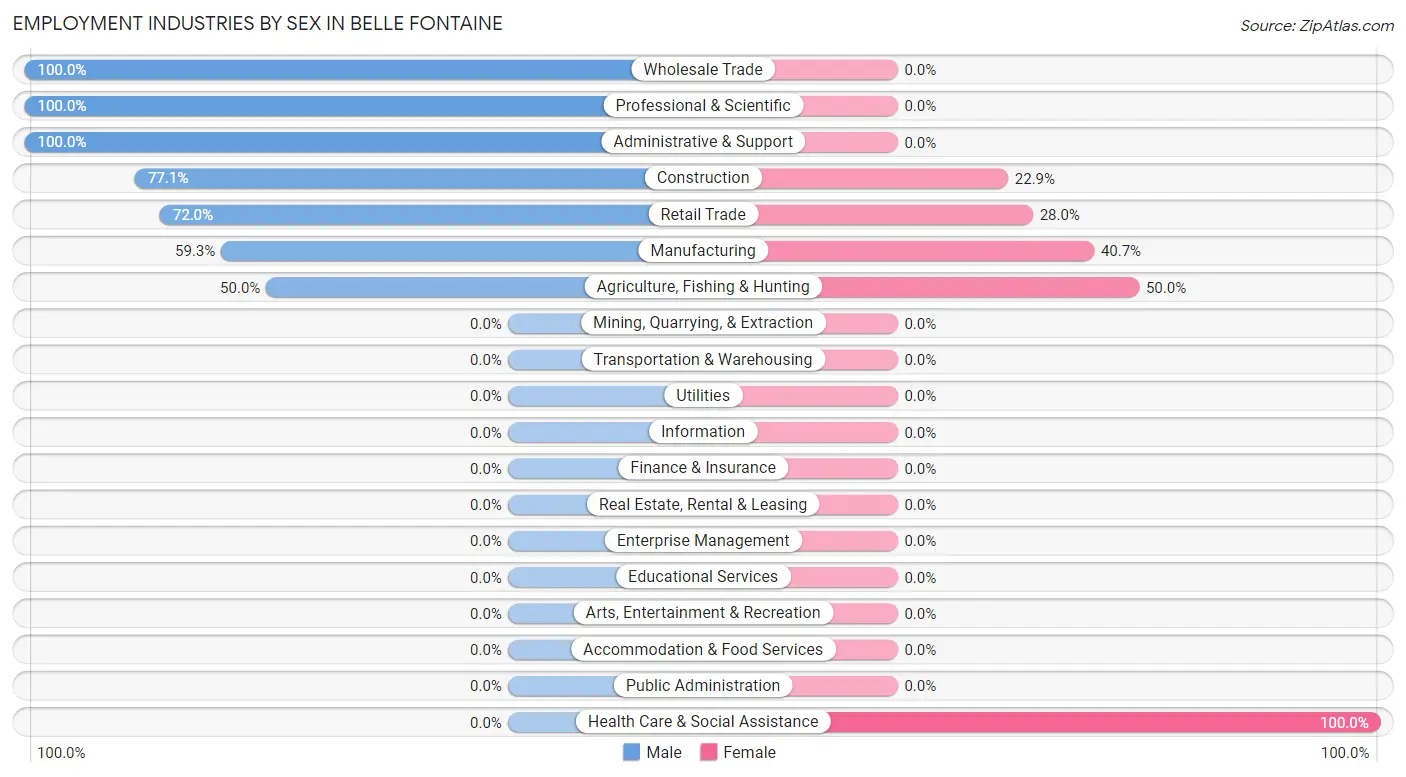
Employment Industries by Sex in Belle Fontaine
The Belle Fontaine industries that see more men than women are Wholesale Trade (100.0%), Professional & Scientific (100.0%), and Administrative & Support (100.0%), whereas the industries that tend to have a higher number of women are Health Care & Social Assistance (100.0%), Agriculture, Fishing & Hunting (50.0%), and Manufacturing (40.7%).
| Industry | Male | Female |
| Agriculture, Fishing & Hunting | 9 (50.0%) | 9 (50.0%) |
| Mining, Quarrying, & Extraction | 0 (0.0%) | 0 (0.0%) |
| Construction | 27 (77.1%) | 8 (22.9%) |
| Manufacturing | 35 (59.3%) | 24 (40.7%) |
| Wholesale Trade | 17 (100.0%) | 0 (0.0%) |
| Retail Trade | 18 (72.0%) | 7 (28.0%) |
| Transportation & Warehousing | 0 (0.0%) | 0 (0.0%) |
| Utilities | 0 (0.0%) | 0 (0.0%) |
| Information | 0 (0.0%) | 0 (0.0%) |
| Finance & Insurance | 0 (0.0%) | 0 (0.0%) |
| Real Estate, Rental & Leasing | 0 (0.0%) | 0 (0.0%) |
| Professional & Scientific | 25 (100.0%) | 0 (0.0%) |
| Enterprise Management | 0 (0.0%) | 0 (0.0%) |
| Administrative & Support | 14 (100.0%) | 0 (0.0%) |
| Educational Services | 0 (0.0%) | 0 (0.0%) |
| Health Care & Social Assistance | 0 (0.0%) | 47 (100.0%) |
| Arts, Entertainment & Recreation | 0 (0.0%) | 0 (0.0%) |
| Accommodation & Food Services | 0 (0.0%) | 0 (0.0%) |
| Public Administration | 0 (0.0%) | 0 (0.0%) |
| Total | 145 (60.4%) | 95 (39.6%) |
Education in Belle Fontaine
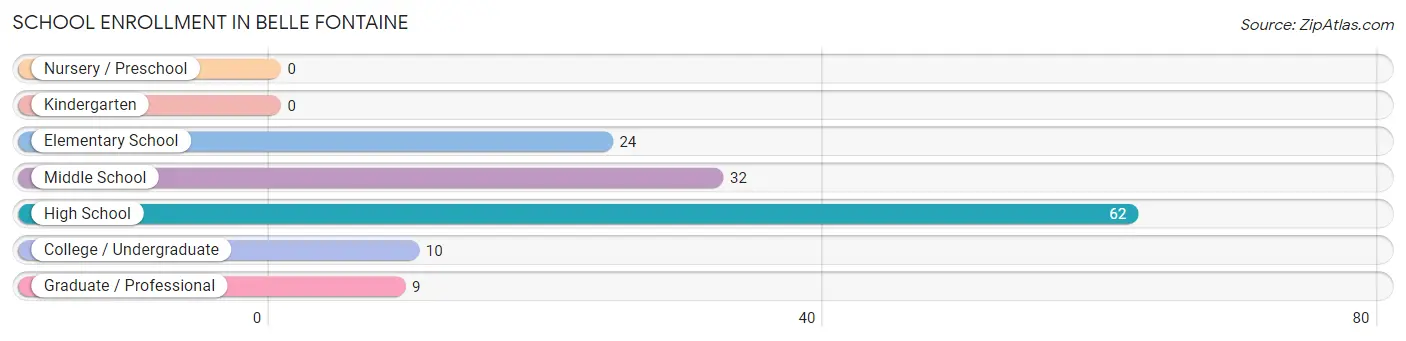
School Enrollment in Belle Fontaine
The most common levels of schooling among the 137 students in Belle Fontaine are high school (62 | 45.3%), middle school (32 | 23.4%), and elementary school (24 | 17.5%).
| School Level | # Students | % Students |
| Nursery / Preschool | 0 | 0.0% |
| Kindergarten | 0 | 0.0% |
| Elementary School | 24 | 17.5% |
| Middle School | 32 | 23.4% |
| High School | 62 | 45.3% |
| College / Undergraduate | 10 | 7.3% |
| Graduate / Professional | 9 | 6.6% |
| Total | 137 | 100.0% |
School Enrollment by Age by Funding Source in Belle Fontaine
Out of a total of 137 students who are enrolled in schools in Belle Fontaine, 19 (13.9%) attend a private institution, while the remaining 118 (86.1%) are enrolled in public schools. The age group of 18 to 19 year olds has the highest likelihood of being enrolled in private schools, with 10 (100.0% in the age bracket) enrolled. Conversely, the age group of 5 to 9 year old has the lowest likelihood of being enrolled in a private school, with 24 (100.0% in the age bracket) attending a public institution.
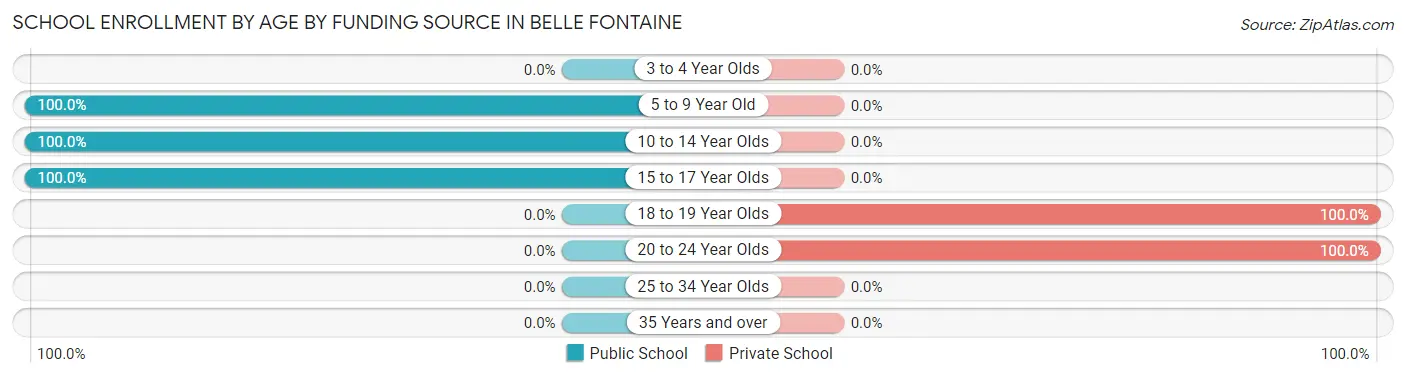
| Age Bracket | Public School | Private School |
| 3 to 4 Year Olds | 0 (0.0%) | 0 (0.0%) |
| 5 to 9 Year Old | 24 (100.0%) | 0 (0.0%) |
| 10 to 14 Year Olds | 63 (100.0%) | 0 (0.0%) |
| 15 to 17 Year Olds | 31 (100.0%) | 0 (0.0%) |
| 18 to 19 Year Olds | 0 (0.0%) | 10 (100.0%) |
| 20 to 24 Year Olds | 0 (0.0%) | 9 (100.0%) |
| 25 to 34 Year Olds | 0 (0.0%) | 0 (0.0%) |
| 35 Years and over | 0 (0.0%) | 0 (0.0%) |
| Total | 118 (86.1%) | 19 (13.9%) |
Educational Attainment by Field of Study in Belle Fontaine
Business (26 | 31.3%), computers & mathematics (17 | 20.5%), engineering (17 | 20.5%), liberal arts & history (16 | 19.3%), and science & technology (7 | 8.4%) are the most common fields of study among 83 individuals in Belle Fontaine who have obtained a bachelor's degree or higher.
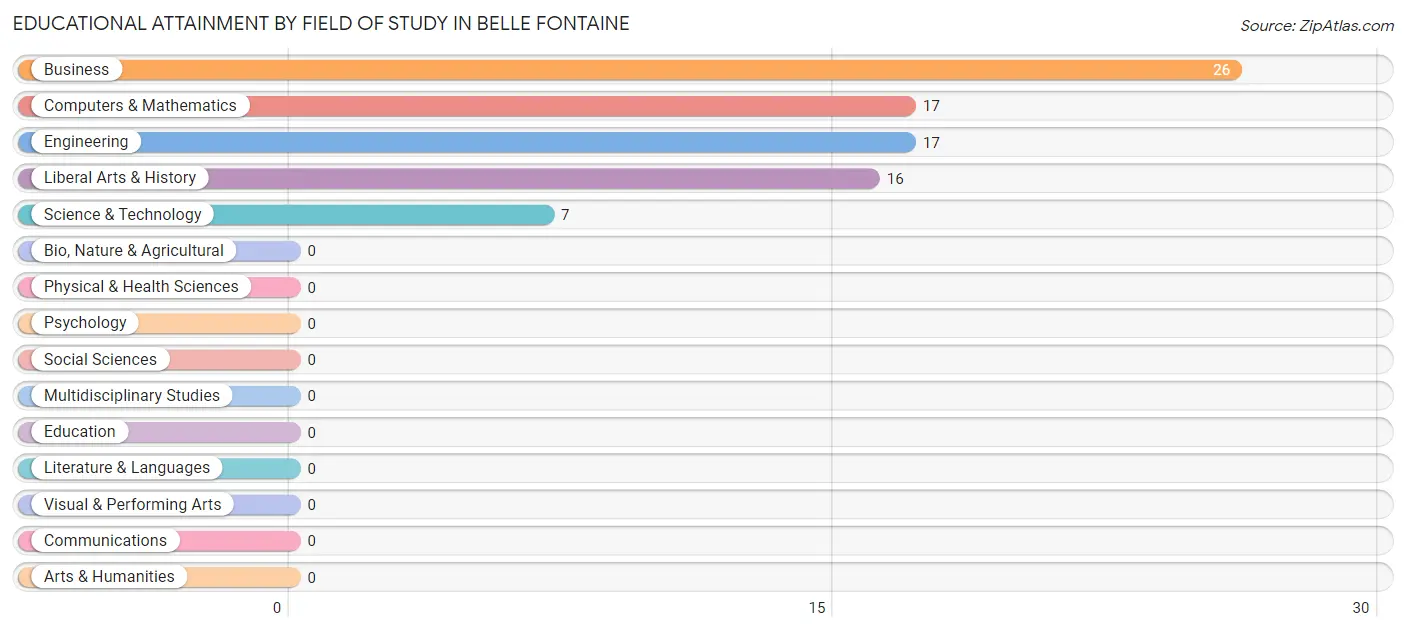
| Field of Study | # Graduates | % Graduates |
| Computers & Mathematics | 17 | 20.5% |
| Bio, Nature & Agricultural | 0 | 0.0% |
| Physical & Health Sciences | 0 | 0.0% |
| Psychology | 0 | 0.0% |
| Social Sciences | 0 | 0.0% |
| Engineering | 17 | 20.5% |
| Multidisciplinary Studies | 0 | 0.0% |
| Science & Technology | 7 | 8.4% |
| Business | 26 | 31.3% |
| Education | 0 | 0.0% |
| Literature & Languages | 0 | 0.0% |
| Liberal Arts & History | 16 | 19.3% |
| Visual & Performing Arts | 0 | 0.0% |
| Communications | 0 | 0.0% |
| Arts & Humanities | 0 | 0.0% |
| Total | 83 | 100.0% |
Transportation & Commute in Belle Fontaine
Vehicle Availability by Sex in Belle Fontaine
The most prevalent vehicle ownership categories in Belle Fontaine are males with 2 vehicles (73, accounting for 54.9%) and females with 2 vehicles (19, making up 107.3%).
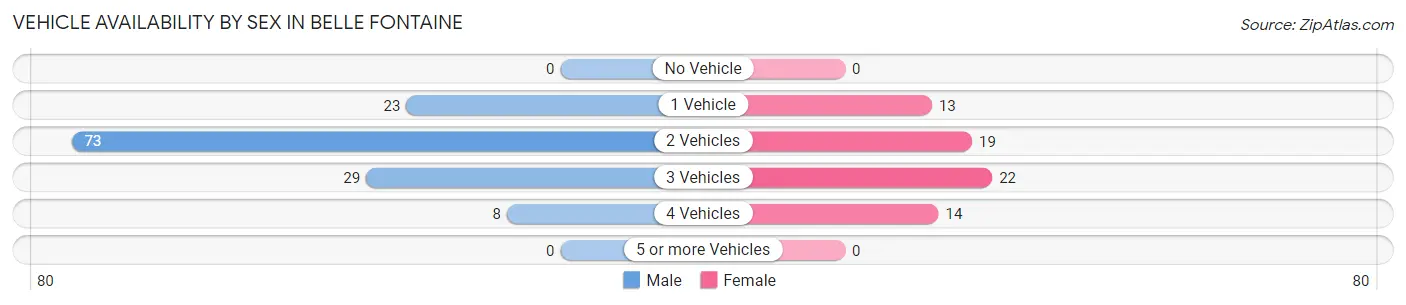
| Vehicles Available | Male | Female |
| No Vehicle | 0 (0.0%) | 0 (0.0%) |
| 1 Vehicle | 23 (17.3%) | 13 (19.1%) |
| 2 Vehicles | 73 (54.9%) | 19 (27.9%) |
| 3 Vehicles | 29 (21.8%) | 22 (32.4%) |
| 4 Vehicles | 8 (6.0%) | 14 (20.6%) |
| 5 or more Vehicles | 0 (0.0%) | 0 (0.0%) |
| Total | 133 (100.0%) | 68 (100.0%) |
Commute Time in Belle Fontaine
The most frequently occuring commute durations in Belle Fontaine are 5 to 9 minutes (51 commuters, 32.7%), 20 to 24 minutes (33 commuters, 21.1%), and 25 to 29 minutes (29 commuters, 18.6%).
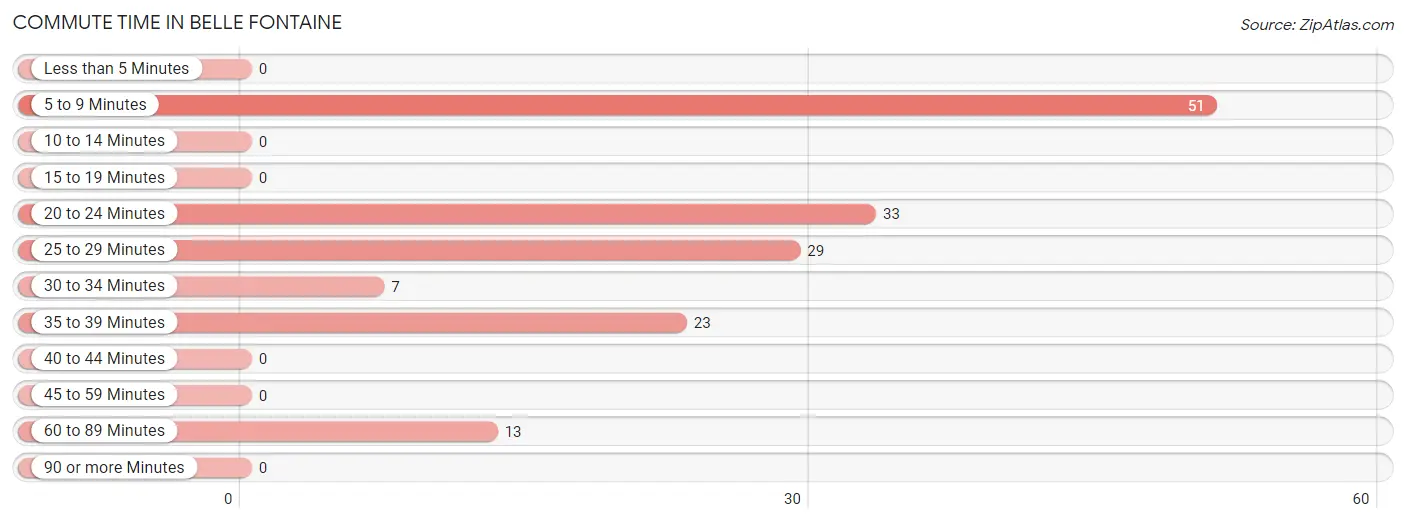
| Commute Time | # Commuters | % Commuters |
| Less than 5 Minutes | 0 | 0.0% |
| 5 to 9 Minutes | 51 | 32.7% |
| 10 to 14 Minutes | 0 | 0.0% |
| 15 to 19 Minutes | 0 | 0.0% |
| 20 to 24 Minutes | 33 | 21.1% |
| 25 to 29 Minutes | 29 | 18.6% |
| 30 to 34 Minutes | 7 | 4.5% |
| 35 to 39 Minutes | 23 | 14.7% |
| 40 to 44 Minutes | 0 | 0.0% |
| 45 to 59 Minutes | 0 | 0.0% |
| 60 to 89 Minutes | 13 | 8.3% |
| 90 or more Minutes | 0 | 0.0% |
Commute Time by Sex in Belle Fontaine
The most common commute times in Belle Fontaine are 5 to 9 minutes (51 commuters, 47.7%) for males and 20 to 24 minutes (15 commuters, 30.6%) for females.
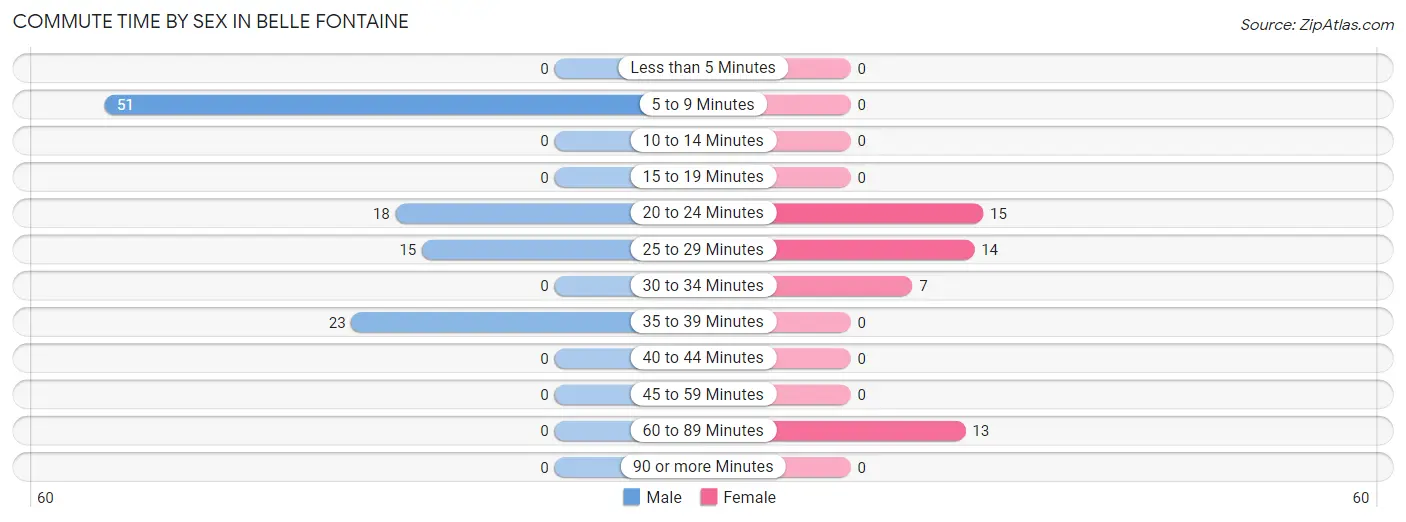
| Commute Time | Male | Female |
| Less than 5 Minutes | 0 (0.0%) | 0 (0.0%) |
| 5 to 9 Minutes | 51 (47.7%) | 0 (0.0%) |
| 10 to 14 Minutes | 0 (0.0%) | 0 (0.0%) |
| 15 to 19 Minutes | 0 (0.0%) | 0 (0.0%) |
| 20 to 24 Minutes | 18 (16.8%) | 15 (30.6%) |
| 25 to 29 Minutes | 15 (14.0%) | 14 (28.6%) |
| 30 to 34 Minutes | 0 (0.0%) | 7 (14.3%) |
| 35 to 39 Minutes | 23 (21.5%) | 0 (0.0%) |
| 40 to 44 Minutes | 0 (0.0%) | 0 (0.0%) |
| 45 to 59 Minutes | 0 (0.0%) | 0 (0.0%) |
| 60 to 89 Minutes | 0 (0.0%) | 13 (26.5%) |
| 90 or more Minutes | 0 (0.0%) | 0 (0.0%) |
Time of Departure to Work by Sex in Belle Fontaine
The most frequent times of departure to work in Belle Fontaine are 8:00 AM to 8:29 AM (70, 65.4%) for males and 6:00 AM to 6:29 AM (14, 28.6%) for females.
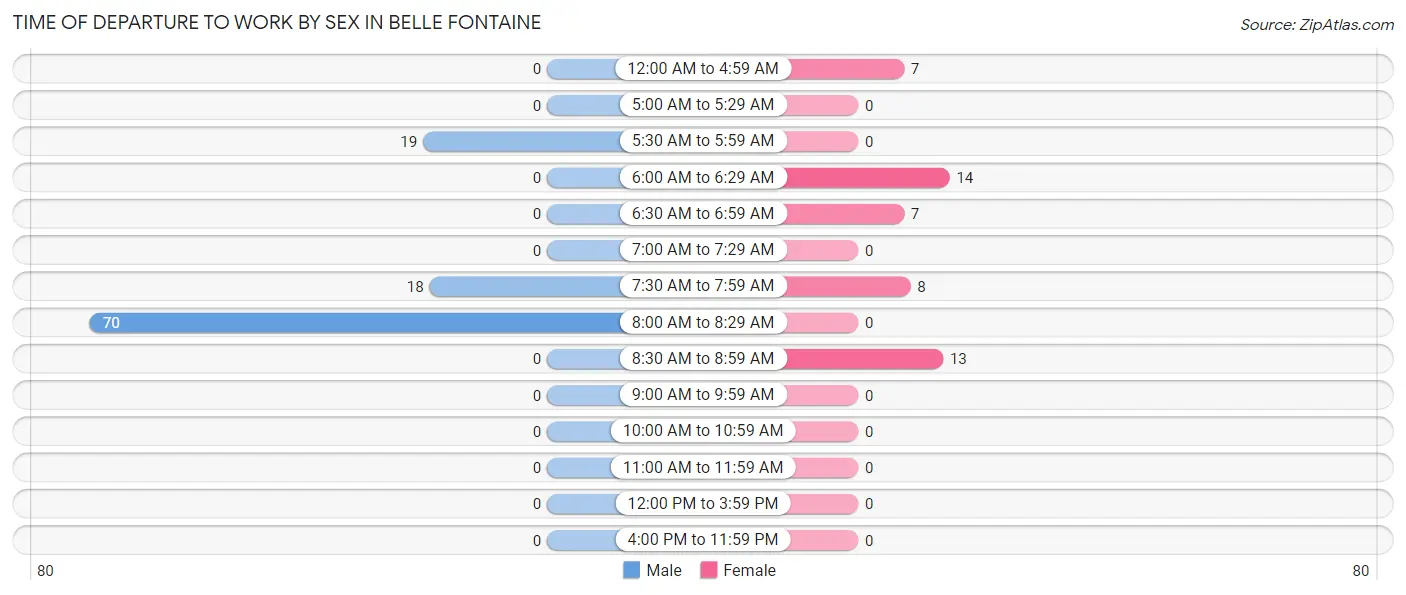
| Time of Departure | Male | Female |
| 12:00 AM to 4:59 AM | 0 (0.0%) | 7 (14.3%) |
| 5:00 AM to 5:29 AM | 0 (0.0%) | 0 (0.0%) |
| 5:30 AM to 5:59 AM | 19 (17.8%) | 0 (0.0%) |
| 6:00 AM to 6:29 AM | 0 (0.0%) | 14 (28.6%) |
| 6:30 AM to 6:59 AM | 0 (0.0%) | 7 (14.3%) |
| 7:00 AM to 7:29 AM | 0 (0.0%) | 0 (0.0%) |
| 7:30 AM to 7:59 AM | 18 (16.8%) | 8 (16.3%) |
| 8:00 AM to 8:29 AM | 70 (65.4%) | 0 (0.0%) |
| 8:30 AM to 8:59 AM | 0 (0.0%) | 13 (26.5%) |
| 9:00 AM to 9:59 AM | 0 (0.0%) | 0 (0.0%) |
| 10:00 AM to 10:59 AM | 0 (0.0%) | 0 (0.0%) |
| 11:00 AM to 11:59 AM | 0 (0.0%) | 0 (0.0%) |
| 12:00 PM to 3:59 PM | 0 (0.0%) | 0 (0.0%) |
| 4:00 PM to 11:59 PM | 0 (0.0%) | 0 (0.0%) |
| Total | 107 (100.0%) | 49 (100.0%) |
Housing Occupancy in Belle Fontaine
Occupancy by Ownership in Belle Fontaine
Of the total 238 dwellings in Belle Fontaine, owner-occupied units account for 161 (67.6%), while renter-occupied units make up 77 (32.4%).
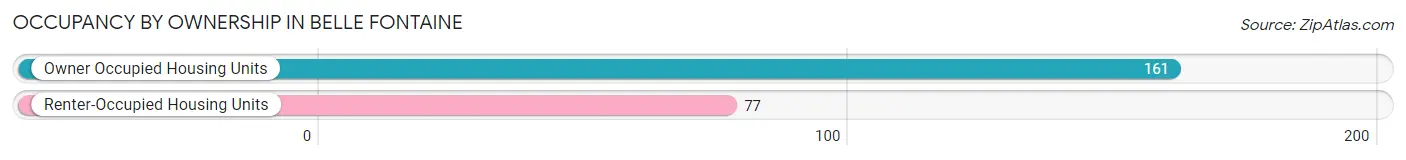
| Occupancy | # Housing Units | % Housing Units |
| Owner Occupied Housing Units | 161 | 67.6% |
| Renter-Occupied Housing Units | 77 | 32.4% |
| Total Occupied Housing Units | 238 | 100.0% |
Occupancy by Household Size in Belle Fontaine
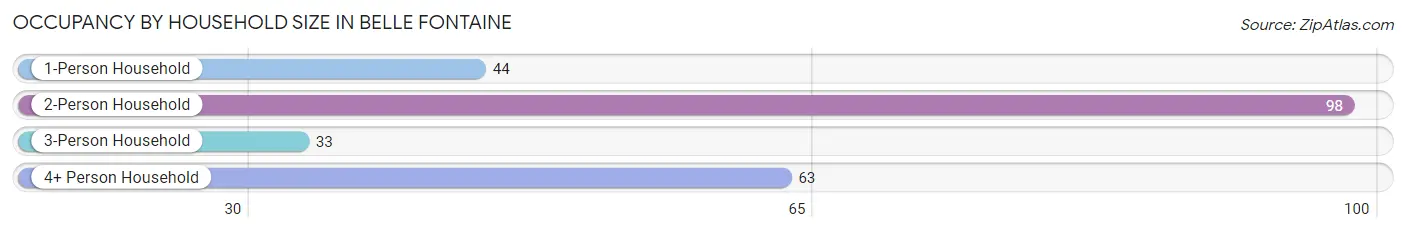
| Household Size | # Housing Units | % Housing Units |
| 1-Person Household | 44 | 18.5% |
| 2-Person Household | 98 | 41.2% |
| 3-Person Household | 33 | 13.9% |
| 4+ Person Household | 63 | 26.5% |
| Total Housing Units | 238 | 100.0% |
Occupancy by Ownership by Household Size in Belle Fontaine
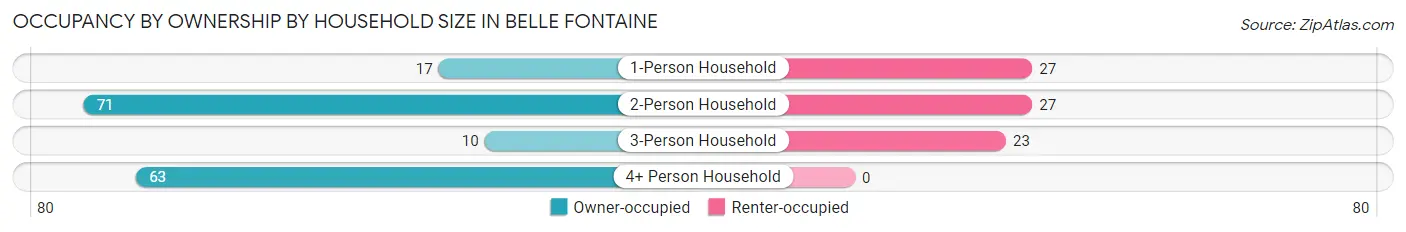
| Household Size | Owner-occupied | Renter-occupied |
| 1-Person Household | 17 (38.6%) | 27 (61.4%) |
| 2-Person Household | 71 (72.5%) | 27 (27.6%) |
| 3-Person Household | 10 (30.3%) | 23 (69.7%) |
| 4+ Person Household | 63 (100.0%) | 0 (0.0%) |
| Total Housing Units | 161 (67.6%) | 77 (32.4%) |
Occupancy by Educational Attainment in Belle Fontaine
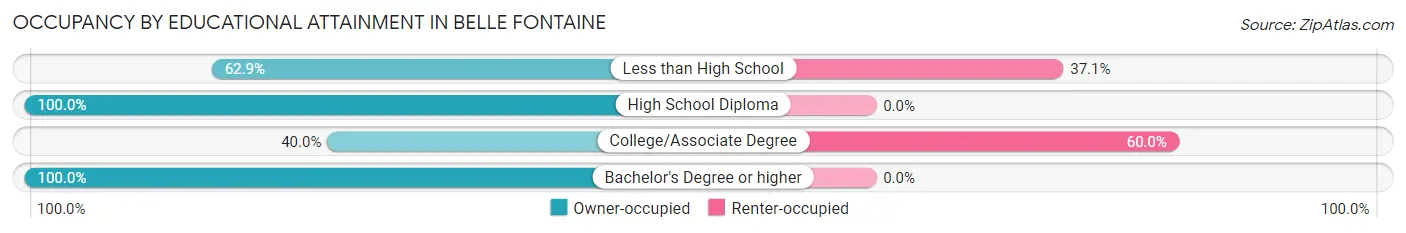
| Household Size | Owner-occupied | Renter-occupied |
| Less than High School | 39 (62.9%) | 23 (37.1%) |
| High School Diploma | 53 (100.0%) | 0 (0.0%) |
| College/Associate Degree | 36 (40.0%) | 54 (60.0%) |
| Bachelor's Degree or higher | 33 (100.0%) | 0 (0.0%) |
Occupancy by Age of Householder in Belle Fontaine
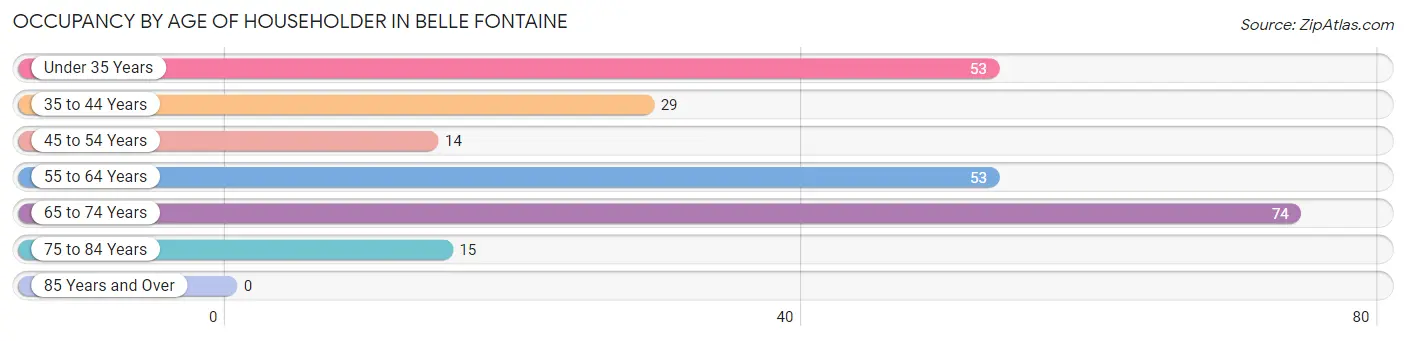
| Age Bracket | # Households | % Households |
| Under 35 Years | 53 | 22.3% |
| 35 to 44 Years | 29 | 12.2% |
| 45 to 54 Years | 14 | 5.9% |
| 55 to 64 Years | 53 | 22.3% |
| 65 to 74 Years | 74 | 31.1% |
| 75 to 84 Years | 15 | 6.3% |
| 85 Years and Over | 0 | 0.0% |
| Total | 238 | 100.0% |
Housing Finances in Belle Fontaine
Median Income by Occupancy in Belle Fontaine
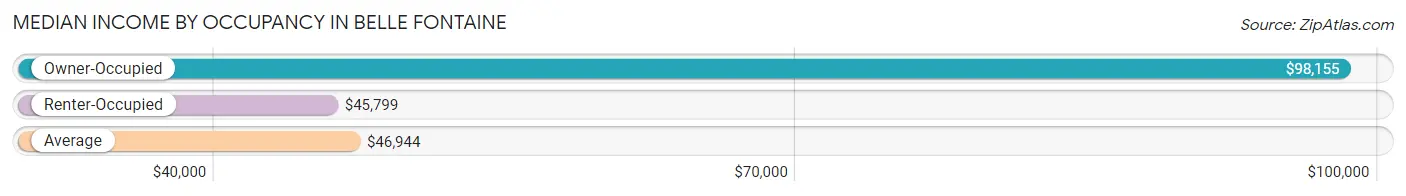
| Occupancy Type | # Households | Median Income |
| Owner-Occupied | 161 (67.6%) | $98,155 |
| Renter-Occupied | 77 (32.4%) | $45,799 |
| Average | 238 (100.0%) | $46,944 |
Occupancy by Householder Income Bracket in Belle Fontaine
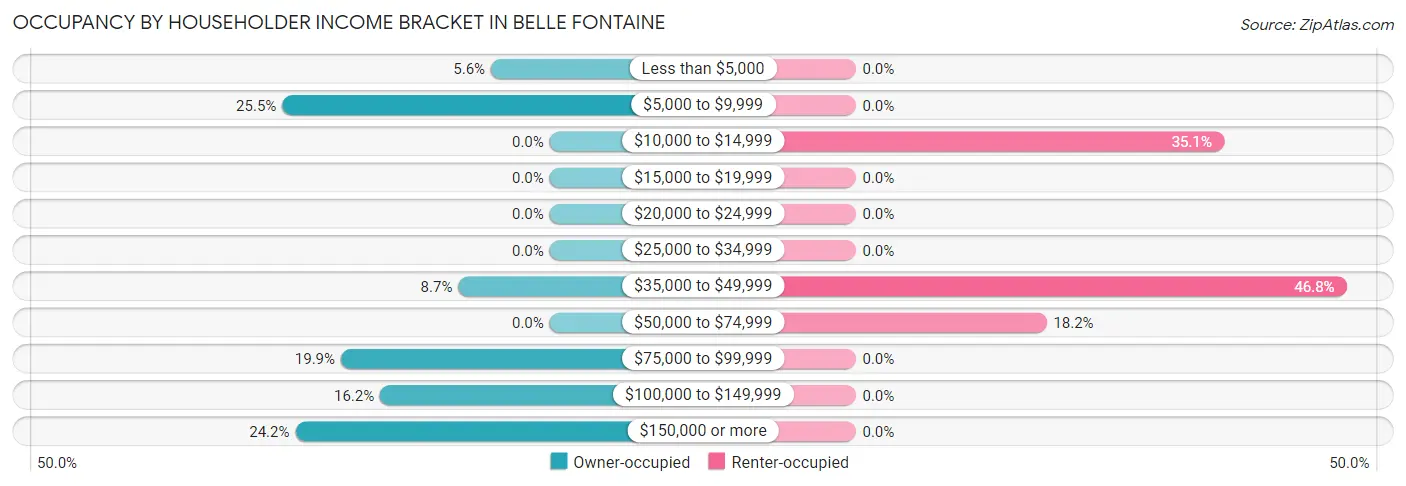
| Income Bracket | Owner-occupied | Renter-occupied |
| Less than $5,000 | 9 (5.6%) | 0 (0.0%) |
| $5,000 to $9,999 | 41 (25.5%) | 0 (0.0%) |
| $10,000 to $14,999 | 0 (0.0%) | 27 (35.1%) |
| $15,000 to $19,999 | 0 (0.0%) | 0 (0.0%) |
| $20,000 to $24,999 | 0 (0.0%) | 0 (0.0%) |
| $25,000 to $34,999 | 0 (0.0%) | 0 (0.0%) |
| $35,000 to $49,999 | 14 (8.7%) | 36 (46.8%) |
| $50,000 to $74,999 | 0 (0.0%) | 14 (18.2%) |
| $75,000 to $99,999 | 32 (19.9%) | 0 (0.0%) |
| $100,000 to $149,999 | 26 (16.2%) | 0 (0.0%) |
| $150,000 or more | 39 (24.2%) | 0 (0.0%) |
| Total | 161 (100.0%) | 77 (100.0%) |
Monthly Housing Cost Tiers in Belle Fontaine
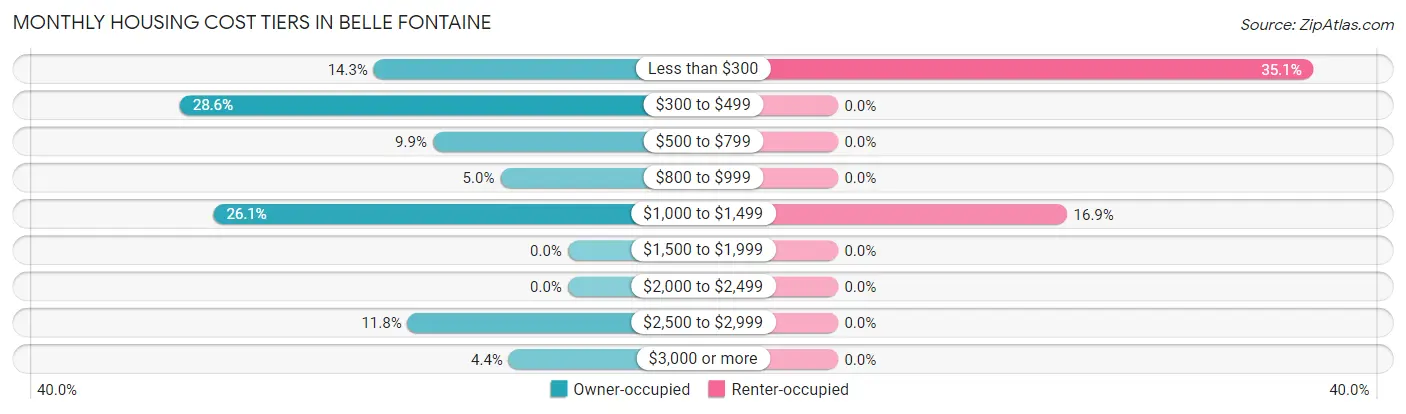
| Monthly Cost | Owner-occupied | Renter-occupied |
| Less than $300 | 23 (14.3%) | 27 (35.1%) |
| $300 to $499 | 46 (28.6%) | 0 (0.0%) |
| $500 to $799 | 16 (9.9%) | 0 (0.0%) |
| $800 to $999 | 8 (5.0%) | 0 (0.0%) |
| $1,000 to $1,499 | 42 (26.1%) | 13 (16.9%) |
| $1,500 to $1,999 | 0 (0.0%) | 0 (0.0%) |
| $2,000 to $2,499 | 0 (0.0%) | 0 (0.0%) |
| $2,500 to $2,999 | 19 (11.8%) | 0 (0.0%) |
| $3,000 or more | 7 (4.3%) | 0 (0.0%) |
| Total | 161 (100.0%) | 77 (100.0%) |
Physical Housing Characteristics in Belle Fontaine
Housing Structures in Belle Fontaine
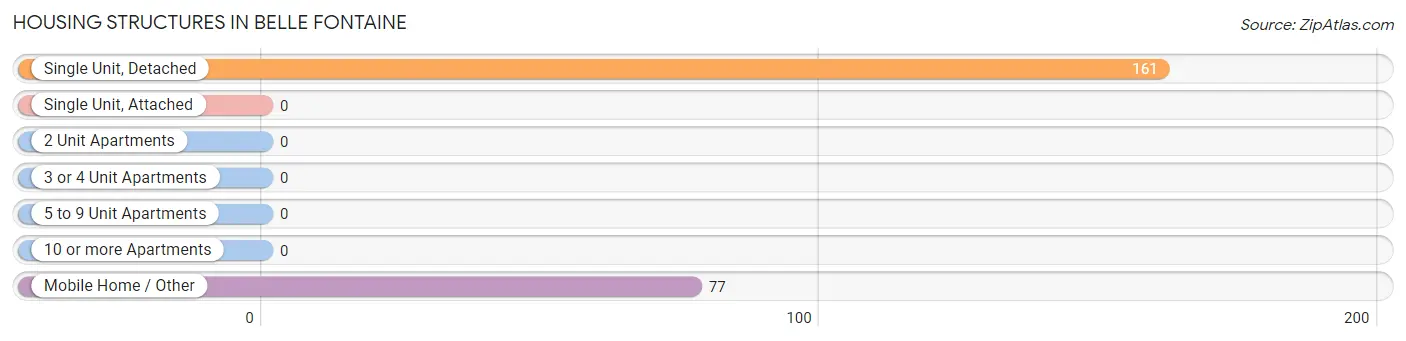
| Structure Type | # Housing Units | % Housing Units |
| Single Unit, Detached | 161 | 67.6% |
| Single Unit, Attached | 0 | 0.0% |
| 2 Unit Apartments | 0 | 0.0% |
| 3 or 4 Unit Apartments | 0 | 0.0% |
| 5 to 9 Unit Apartments | 0 | 0.0% |
| 10 or more Apartments | 0 | 0.0% |
| Mobile Home / Other | 77 | 32.4% |
| Total | 238 | 100.0% |
Housing Structures by Occupancy in Belle Fontaine
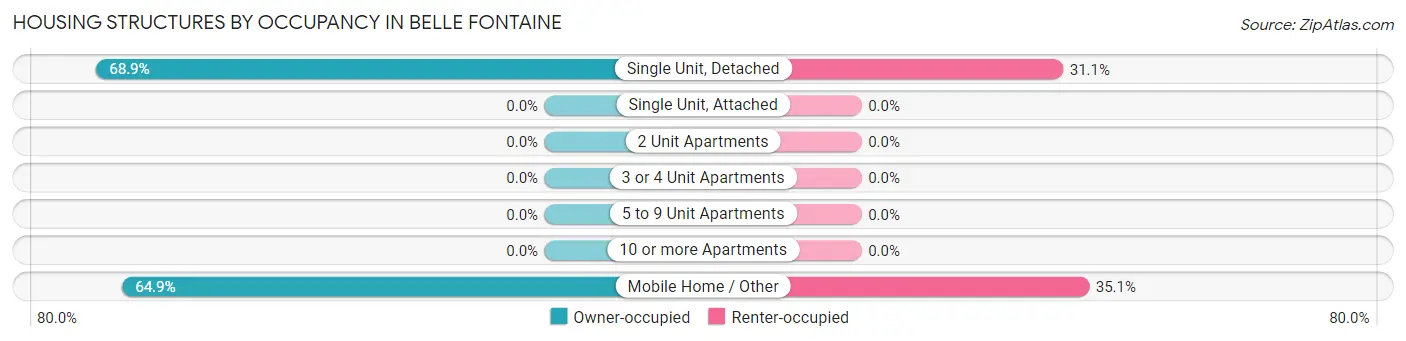
| Structure Type | Owner-occupied | Renter-occupied |
| Single Unit, Detached | 111 (68.9%) | 50 (31.1%) |
| Single Unit, Attached | 0 (0.0%) | 0 (0.0%) |
| 2 Unit Apartments | 0 (0.0%) | 0 (0.0%) |
| 3 or 4 Unit Apartments | 0 (0.0%) | 0 (0.0%) |
| 5 to 9 Unit Apartments | 0 (0.0%) | 0 (0.0%) |
| 10 or more Apartments | 0 (0.0%) | 0 (0.0%) |
| Mobile Home / Other | 50 (64.9%) | 27 (35.1%) |
| Total | 161 (67.6%) | 77 (32.4%) |
Housing Structures by Number of Rooms in Belle Fontaine
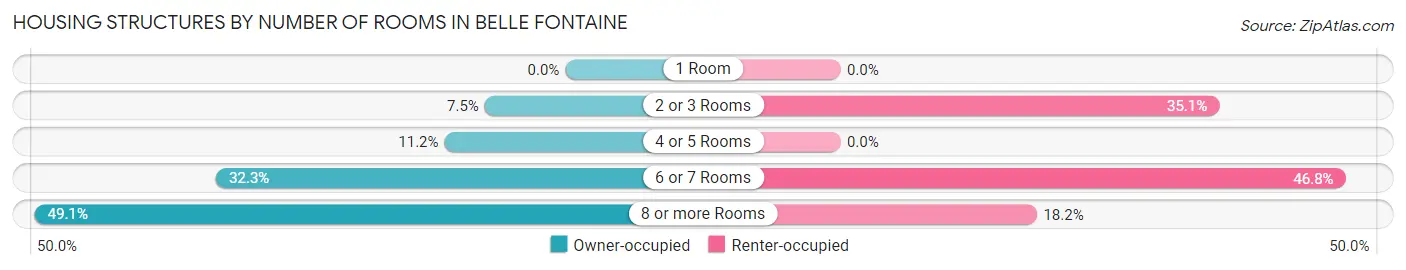
| Number of Rooms | Owner-occupied | Renter-occupied |
| 1 Room | 0 (0.0%) | 0 (0.0%) |
| 2 or 3 Rooms | 12 (7.4%) | 27 (35.1%) |
| 4 or 5 Rooms | 18 (11.2%) | 0 (0.0%) |
| 6 or 7 Rooms | 52 (32.3%) | 36 (46.8%) |
| 8 or more Rooms | 79 (49.1%) | 14 (18.2%) |
| Total | 161 (100.0%) | 77 (100.0%) |
Housing Structure by Heating Type in Belle Fontaine
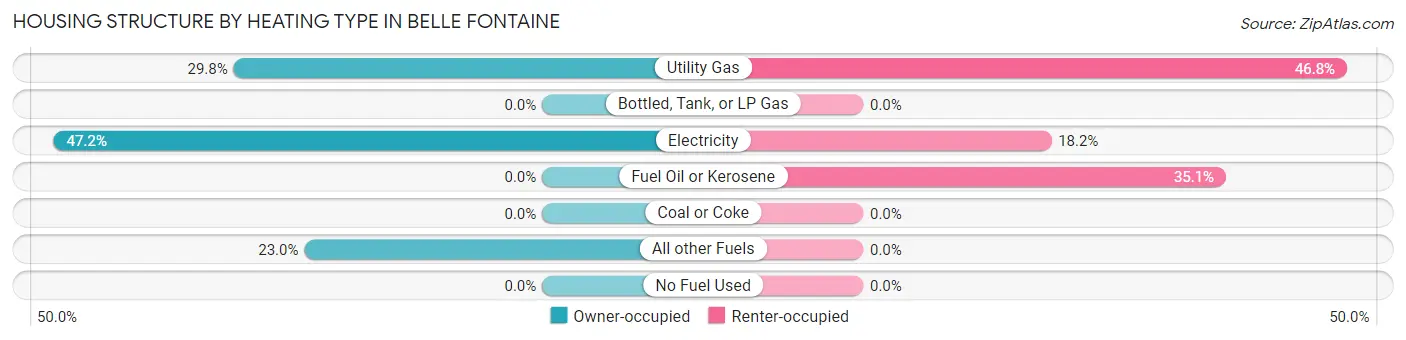
| Heating Type | Owner-occupied | Renter-occupied |
| Utility Gas | 48 (29.8%) | 36 (46.8%) |
| Bottled, Tank, or LP Gas | 0 (0.0%) | 0 (0.0%) |
| Electricity | 76 (47.2%) | 14 (18.2%) |
| Fuel Oil or Kerosene | 0 (0.0%) | 27 (35.1%) |
| Coal or Coke | 0 (0.0%) | 0 (0.0%) |
| All other Fuels | 37 (23.0%) | 0 (0.0%) |
| No Fuel Used | 0 (0.0%) | 0 (0.0%) |
| Total | 161 (100.0%) | 77 (100.0%) |
Household Vehicle Usage in Belle Fontaine
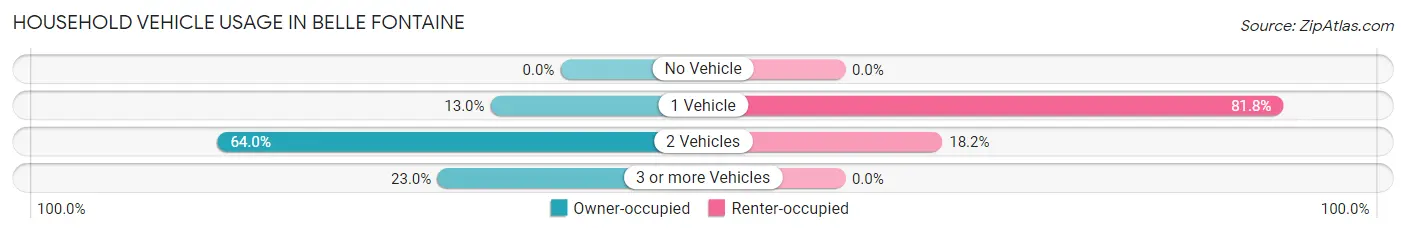
| Vehicles per Household | Owner-occupied | Renter-occupied |
| No Vehicle | 0 (0.0%) | 0 (0.0%) |
| 1 Vehicle | 21 (13.0%) | 63 (81.8%) |
| 2 Vehicles | 103 (64.0%) | 14 (18.2%) |
| 3 or more Vehicles | 37 (23.0%) | 0 (0.0%) |
| Total | 161 (100.0%) | 77 (100.0%) |
Real Estate & Mortgages in Belle Fontaine
Real Estate and Mortgage Overview in Belle Fontaine
| Characteristic | Without Mortgage | With Mortgage |
| Housing Units | 98 | 63 |
| Median Property Value | - | - |
| Median Household Income | - | - |
| Monthly Housing Costs | $431 | $7 |
| Real Estate Taxes | - | - |
Property Value by Mortgage Status in Belle Fontaine
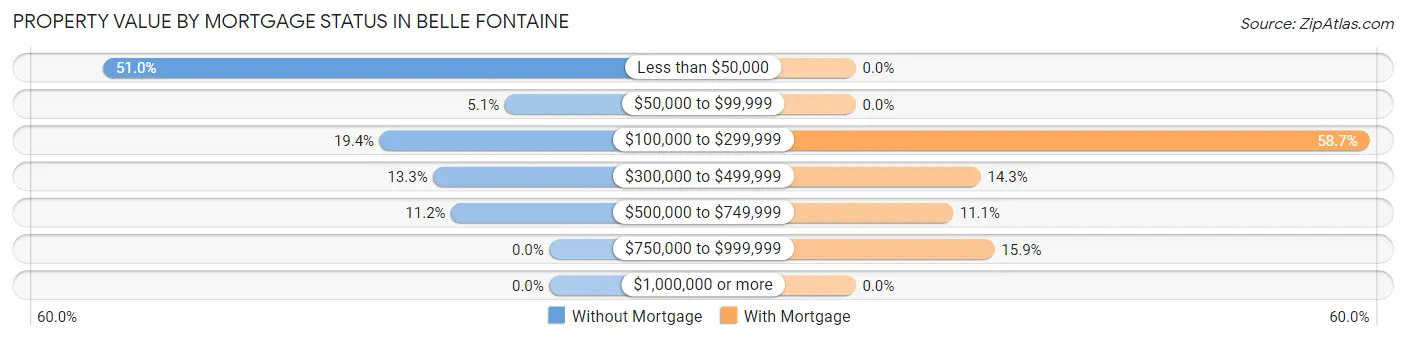
| Property Value | Without Mortgage | With Mortgage |
| Less than $50,000 | 50 (51.0%) | 0 (0.0%) |
| $50,000 to $99,999 | 5 (5.1%) | 0 (0.0%) |
| $100,000 to $299,999 | 19 (19.4%) | 37 (58.7%) |
| $300,000 to $499,999 | 13 (13.3%) | 9 (14.3%) |
| $500,000 to $749,999 | 11 (11.2%) | 7 (11.1%) |
| $750,000 to $999,999 | 0 (0.0%) | 10 (15.9%) |
| $1,000,000 or more | 0 (0.0%) | 0 (0.0%) |
| Total | 98 (100.0%) | 63 (100.0%) |
Household Income by Mortgage Status in Belle Fontaine
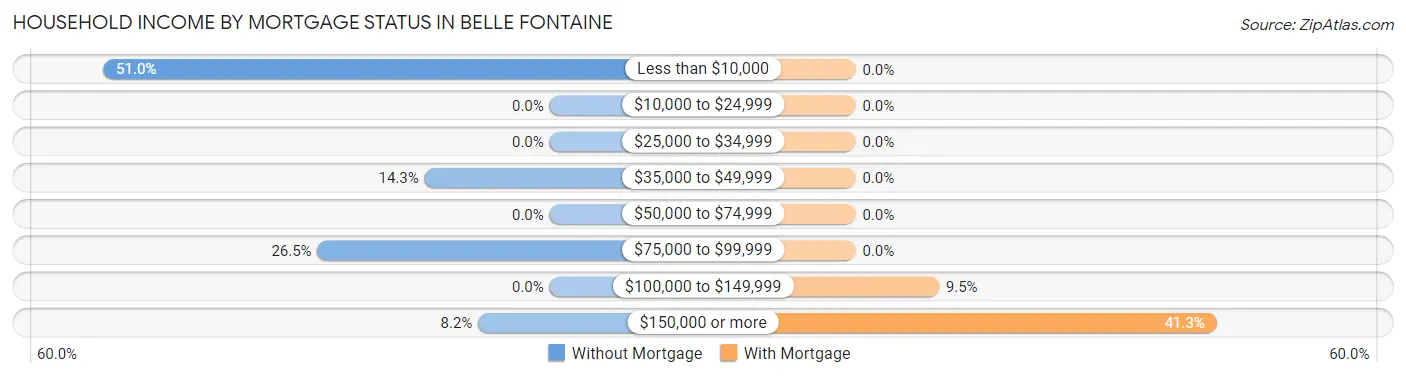
| Household Income | Without Mortgage | With Mortgage |
| Less than $10,000 | 50 (51.0%) | 0 (0.0%) |
| $10,000 to $24,999 | 0 (0.0%) | 0 (0.0%) |
| $25,000 to $34,999 | 0 (0.0%) | 0 (0.0%) |
| $35,000 to $49,999 | 14 (14.3%) | 0 (0.0%) |
| $50,000 to $74,999 | 0 (0.0%) | 0 (0.0%) |
| $75,000 to $99,999 | 26 (26.5%) | 0 (0.0%) |
| $100,000 to $149,999 | 0 (0.0%) | 6 (9.5%) |
| $150,000 or more | 8 (8.2%) | 26 (41.3%) |
| Total | 98 (100.0%) | 63 (100.0%) |
Property Value to Household Income Ratio in Belle Fontaine
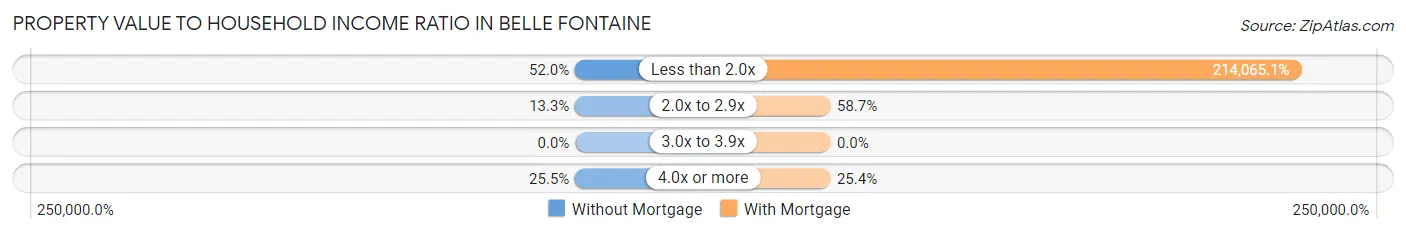
| Value-to-Income Ratio | Without Mortgage | With Mortgage |
| Less than 2.0x | 51 (52.0%) | 134,861 (214,065.1%) |
| 2.0x to 2.9x | 13 (13.3%) | 37 (58.7%) |
| 3.0x to 3.9x | 0 (0.0%) | 0 (0.0%) |
| 4.0x or more | 25 (25.5%) | 16 (25.4%) |
| Total | 98 (100.0%) | 63 (100.0%) |
Real Estate Taxes by Mortgage Status in Belle Fontaine
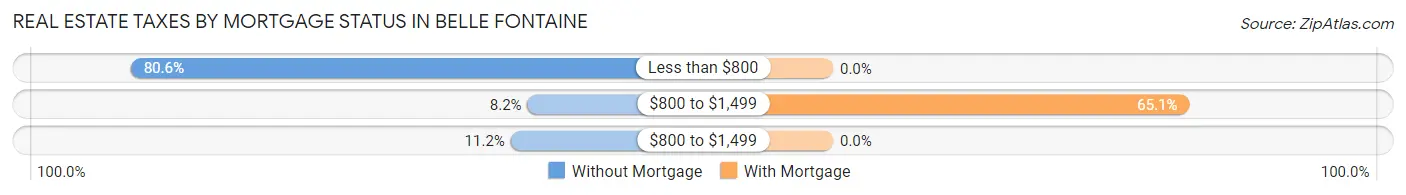
| Property Taxes | Without Mortgage | With Mortgage |
| Less than $800 | 79 (80.6%) | 0 (0.0%) |
| $800 to $1,499 | 8 (8.2%) | 41 (65.1%) |
| $800 to $1,499 | 11 (11.2%) | 0 (0.0%) |
| Total | 98 (100.0%) | 63 (100.0%) |
Health & Disability in Belle Fontaine
Health Insurance Coverage by Age in Belle Fontaine
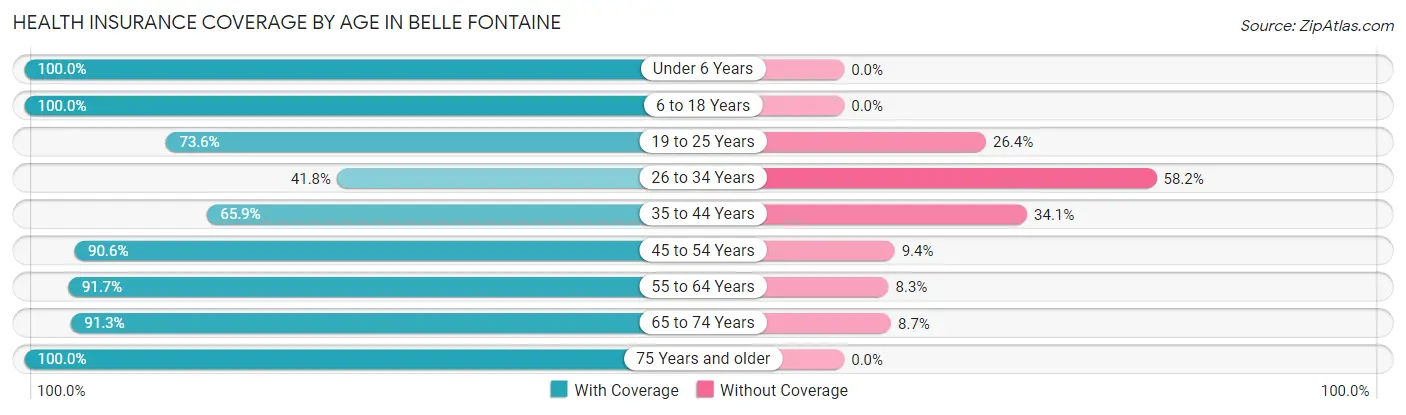
| Age Bracket | With Coverage | Without Coverage |
| Under 6 Years | 26 (100.0%) | 0 (0.0%) |
| 6 to 18 Years | 128 (100.0%) | 0 (0.0%) |
| 19 to 25 Years | 64 (73.6%) | 23 (26.4%) |
| 26 to 34 Years | 33 (41.8%) | 46 (58.2%) |
| 35 to 44 Years | 29 (65.9%) | 15 (34.1%) |
| 45 to 54 Years | 77 (90.6%) | 8 (9.4%) |
| 55 to 64 Years | 100 (91.7%) | 9 (8.3%) |
| 65 to 74 Years | 115 (91.3%) | 11 (8.7%) |
| 75 Years and older | 15 (100.0%) | 0 (0.0%) |
| Total | 587 (84.0%) | 112 (16.0%) |
Health Insurance Coverage by Citizenship Status in Belle Fontaine
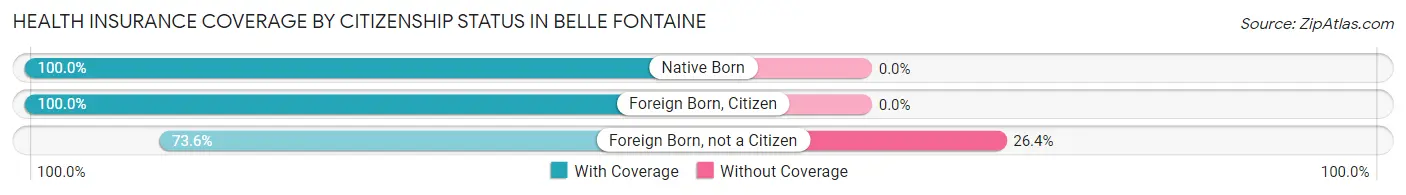
| Citizenship Status | With Coverage | Without Coverage |
| Native Born | 26 (100.0%) | 0 (0.0%) |
| Foreign Born, Citizen | 128 (100.0%) | 0 (0.0%) |
| Foreign Born, not a Citizen | 64 (73.6%) | 23 (26.4%) |
Health Insurance Coverage by Household Income in Belle Fontaine
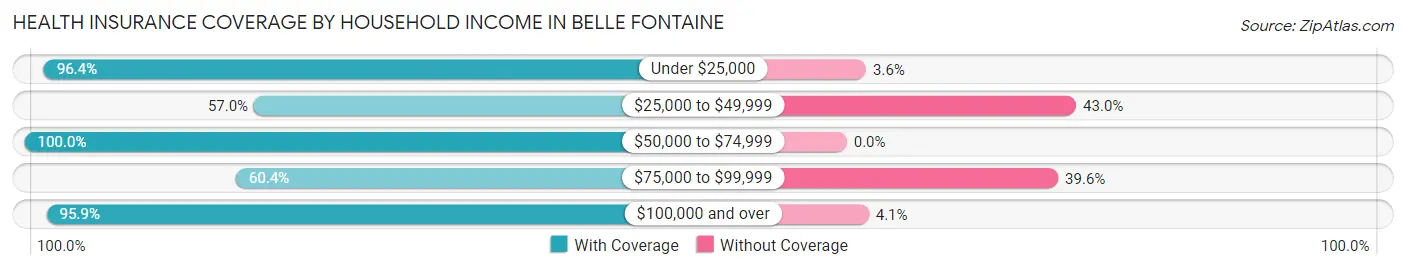
| Household Income | With Coverage | Without Coverage |
| Under $25,000 | 240 (96.4%) | 9 (3.6%) |
| $25,000 to $49,999 | 73 (57.0%) | 55 (43.0%) |
| $50,000 to $74,999 | 27 (100.0%) | 0 (0.0%) |
| $75,000 to $99,999 | 61 (60.4%) | 40 (39.6%) |
| $100,000 and over | 186 (95.9%) | 8 (4.1%) |
Public vs Private Health Insurance Coverage by Age in Belle Fontaine
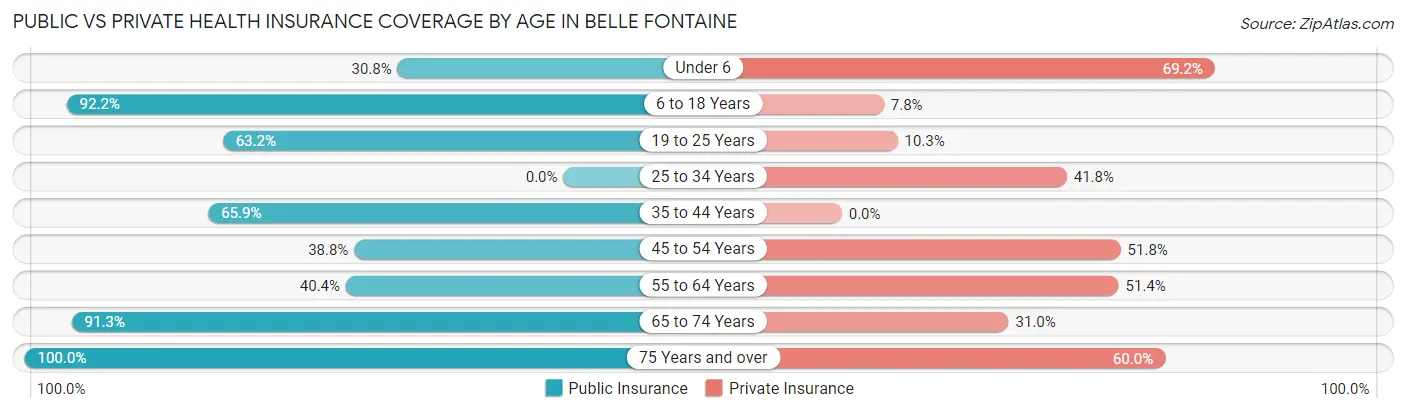
| Age Bracket | Public Insurance | Private Insurance |
| Under 6 | 8 (30.8%) | 18 (69.2%) |
| 6 to 18 Years | 118 (92.2%) | 10 (7.8%) |
| 19 to 25 Years | 55 (63.2%) | 9 (10.3%) |
| 25 to 34 Years | 0 (0.0%) | 33 (41.8%) |
| 35 to 44 Years | 29 (65.9%) | 0 (0.0%) |
| 45 to 54 Years | 33 (38.8%) | 44 (51.8%) |
| 55 to 64 Years | 44 (40.4%) | 56 (51.4%) |
| 65 to 74 Years | 115 (91.3%) | 39 (30.9%) |
| 75 Years and over | 15 (100.0%) | 9 (60.0%) |
| Total | 417 (59.7%) | 218 (31.2%) |
Disability Status by Sex by Age in Belle Fontaine
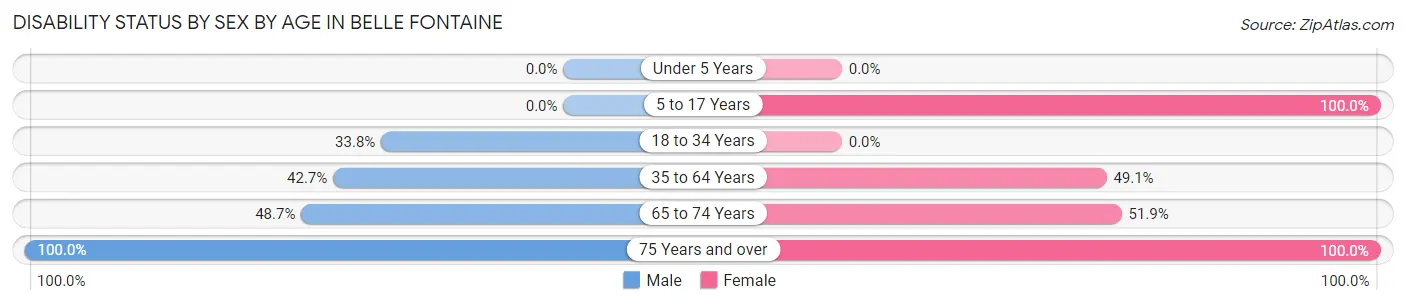
| Age Bracket | Male | Female |
| Under 5 Years | 0 (0.0%) | 0 (0.0%) |
| 5 to 17 Years | 0 (0.0%) | 24 (100.0%) |
| 18 to 34 Years | 23 (33.8%) | 0 (0.0%) |
| 35 to 64 Years | 53 (42.7%) | 56 (49.1%) |
| 65 to 74 Years | 36 (48.6%) | 27 (51.9%) |
| 75 Years and over | 9 (100.0%) | 6 (100.0%) |
Disability Class by Sex by Age in Belle Fontaine
Disability Class: Hearing Difficulty
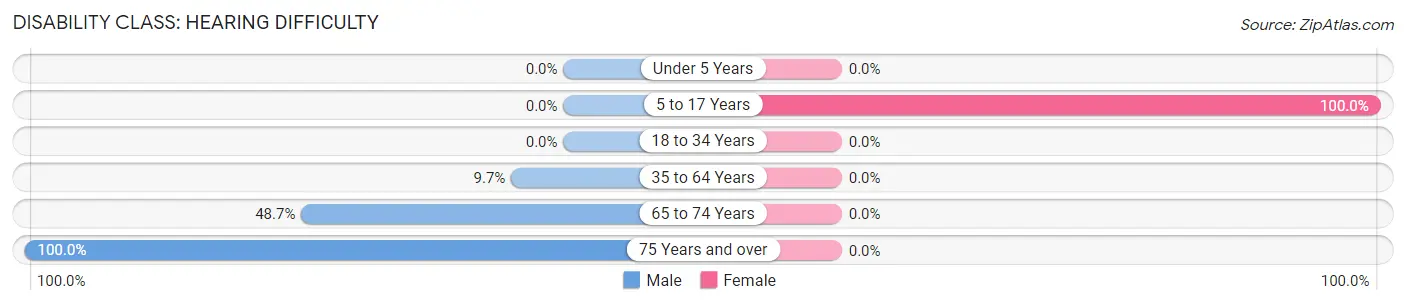
| Age Bracket | Male | Female |
| Under 5 Years | 0 (0.0%) | 0 (0.0%) |
| 5 to 17 Years | 0 (0.0%) | 24 (100.0%) |
| 18 to 34 Years | 0 (0.0%) | 0 (0.0%) |
| 35 to 64 Years | 12 (9.7%) | 0 (0.0%) |
| 65 to 74 Years | 36 (48.6%) | 0 (0.0%) |
| 75 Years and over | 9 (100.0%) | 0 (0.0%) |
Disability Class: Vision Difficulty
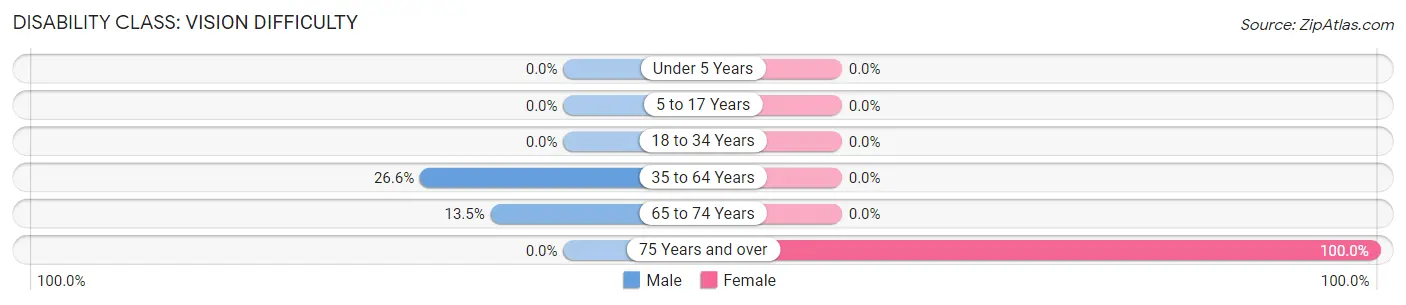
| Age Bracket | Male | Female |
| Under 5 Years | 0 (0.0%) | 0 (0.0%) |
| 5 to 17 Years | 0 (0.0%) | 0 (0.0%) |
| 18 to 34 Years | 0 (0.0%) | 0 (0.0%) |
| 35 to 64 Years | 33 (26.6%) | 0 (0.0%) |
| 65 to 74 Years | 10 (13.5%) | 0 (0.0%) |
| 75 Years and over | 0 (0.0%) | 6 (100.0%) |
Disability Class: Cognitive Difficulty
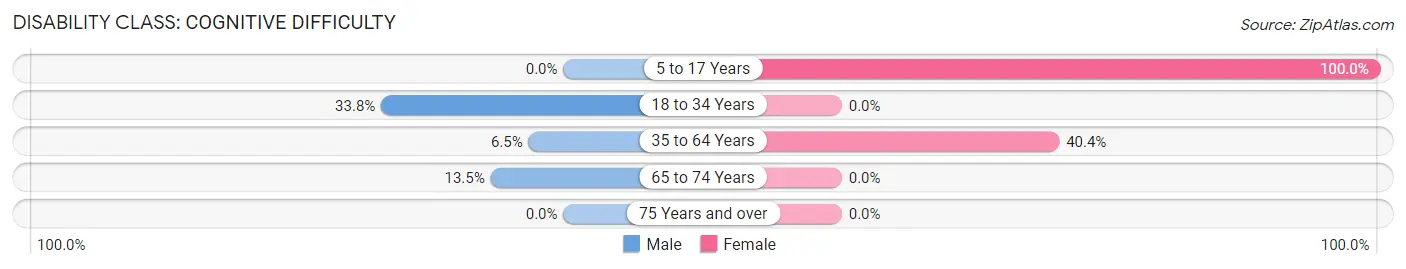
| Age Bracket | Male | Female |
| 5 to 17 Years | 0 (0.0%) | 24 (100.0%) |
| 18 to 34 Years | 23 (33.8%) | 0 (0.0%) |
| 35 to 64 Years | 8 (6.5%) | 46 (40.4%) |
| 65 to 74 Years | 10 (13.5%) | 0 (0.0%) |
| 75 Years and over | 0 (0.0%) | 0 (0.0%) |
Disability Class: Ambulatory Difficulty
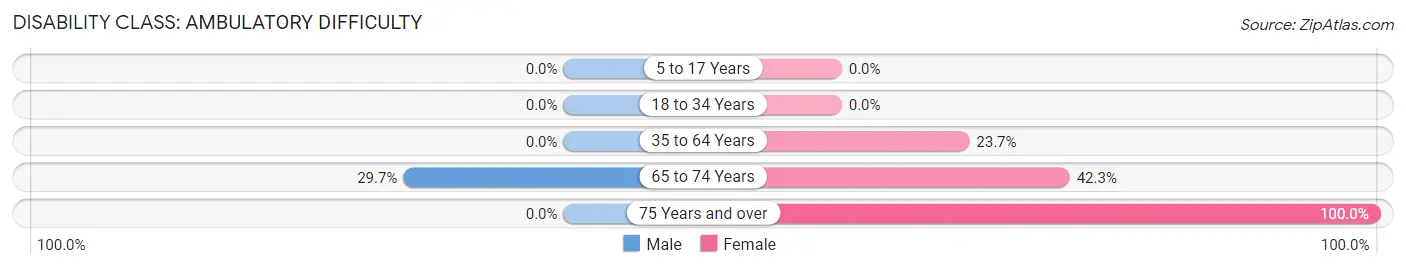
| Age Bracket | Male | Female |
| 5 to 17 Years | 0 (0.0%) | 0 (0.0%) |
| 18 to 34 Years | 0 (0.0%) | 0 (0.0%) |
| 35 to 64 Years | 0 (0.0%) | 27 (23.7%) |
| 65 to 74 Years | 22 (29.7%) | 22 (42.3%) |
| 75 Years and over | 0 (0.0%) | 6 (100.0%) |
Disability Class: Self-Care Difficulty
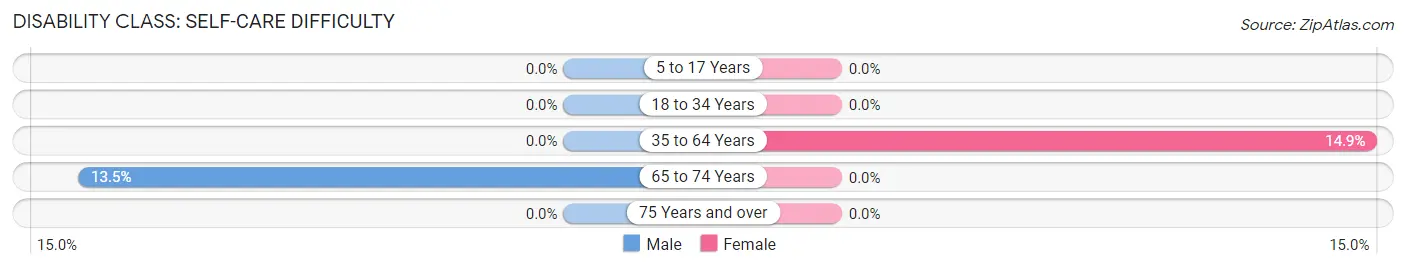
| Age Bracket | Male | Female |
| 5 to 17 Years | 0 (0.0%) | 0 (0.0%) |
| 18 to 34 Years | 0 (0.0%) | 0 (0.0%) |
| 35 to 64 Years | 0 (0.0%) | 17 (14.9%) |
| 65 to 74 Years | 10 (13.5%) | 0 (0.0%) |
| 75 Years and over | 0 (0.0%) | 0 (0.0%) |
Technology Access in Belle Fontaine
Computing Device Access in Belle Fontaine
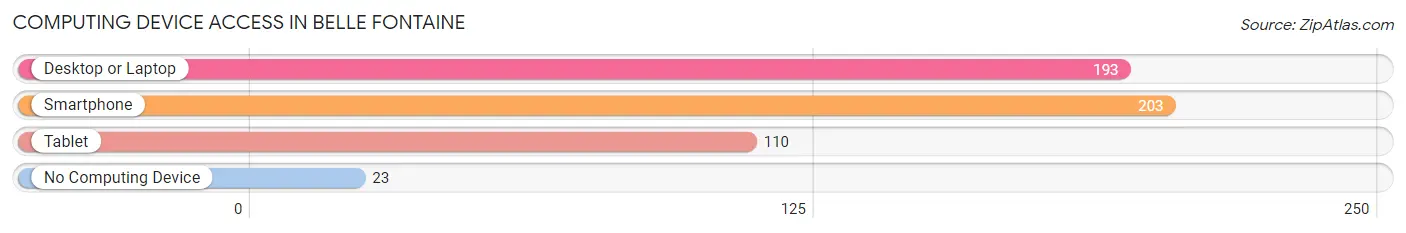
| Device Type | # Households | % Households |
| Desktop or Laptop | 193 | 81.1% |
| Smartphone | 203 | 85.3% |
| Tablet | 110 | 46.2% |
| No Computing Device | 23 | 9.7% |
| Total | 238 | 100.0% |
Internet Access in Belle Fontaine
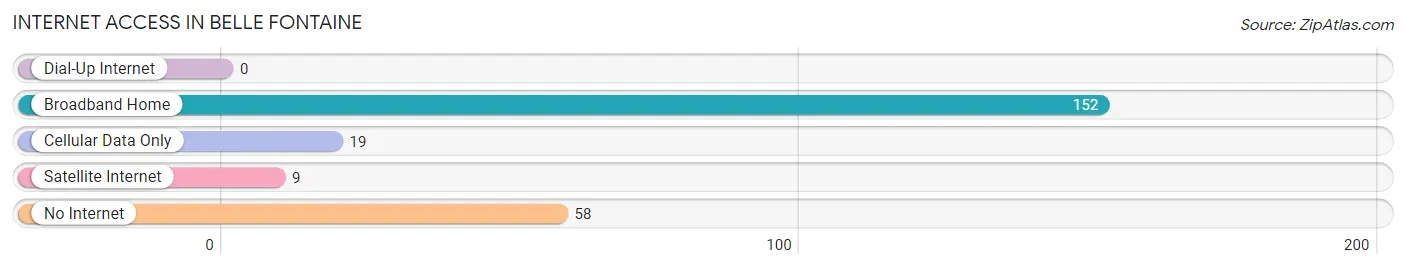
| Internet Type | # Households | % Households |
| Dial-Up Internet | 0 | 0.0% |
| Broadband Home | 152 | 63.9% |
| Cellular Data Only | 19 | 8.0% |
| Satellite Internet | 9 | 3.8% |
| No Internet | 58 | 24.4% |
| Total | 238 | 100.0% |
Belle Fontaine Summary
Belle Fontaine is a small town located in Baldwin County, Alabama. It is situated on the eastern shore of Mobile Bay, approximately 25 miles south of Mobile. The town was founded in 1820 and is named after the nearby Belle Fontaine Creek. As of the 2010 census, the population of Belle Fontaine was 1,845.
Geography
Belle Fontaine is located at 30°45'25" North, 88°2'25" West (30.756944, -88.040278). It has an elevation of 10 feet above sea level. The town is located in the southern part of Baldwin County, near the Gulf of Mexico. It is bordered by the cities of Bay Minette to the north, Daphne to the east, and Fairhope to the south.
The town is situated on the eastern shore of Mobile Bay, and is part of the Mobile-Tensaw Delta. The delta is a large wetland area that is home to a variety of wildlife, including alligators, bald eagles, and ospreys. The town is also located near the Bon Secour National Wildlife Refuge, which is a protected area for migratory birds and other wildlife.
Climate
Belle Fontaine has a humid subtropical climate, with hot, humid summers and mild winters. The average annual temperature is 68°F, with an average high of 87°F in July and an average low of 48°F in January. The average annual precipitation is 62 inches, with an average of 5.5 inches of snow per year.
Demographics
As of the 2010 census, there were 1,845 people, 745 households, and 498 families residing in Belle Fontaine. The population density was 545.3 people per square mile. The racial makeup of the town was 92.2% White, 4.2% African American, 0.7% Native American, 0.5% Asian, 0.1% Pacific Islander, 0.9% from other races, and 1.4% from two or more races. Hispanic or Latino of any race were 2.2% of the population.
The median age in Belle Fontaine was 43.2 years. 22.2% of residents were under the age of 18; 7.2% were between the ages of 18 and 24; 22.7% were from 25 to 44; 28.3% were from 45 to 64; and 19.6% were 65 years of age or older. The gender makeup of the town was 48.2% male and 51.8% female.
Economy
Belle Fontaine is a small, rural town with a primarily agricultural economy. The town is home to several farms, which produce a variety of crops, including corn, soybeans, and cotton. The town is also home to several seafood processing plants, which process and package seafood for local restaurants and markets.
The town is also home to several small businesses, including restaurants, retail stores, and service providers. The town is also home to a few small manufacturing companies, which produce a variety of products, including furniture, clothing, and electronics.
The town is served by the Baldwin County School District, which operates several elementary, middle, and high schools in the area. The town is also home to a branch of the University of South Alabama, which offers a variety of degree programs.
Conclusion
Belle Fontaine is a small town located in Baldwin County, Alabama. It is situated on the eastern shore of Mobile Bay, approximately 25 miles south of Mobile. The town was founded in 1820 and is named after the nearby Belle Fontaine Creek. As of the 2010 census, the population of Belle Fontaine was 1,845. The town has a humid subtropical climate, with hot, humid summers and mild winters. The town has a primarily agricultural economy, with several farms and seafood processing plants. The town is also home to several small businesses, including restaurants, retail stores, and service providers. The town is served by the Baldwin County School District, and is home to a branch of the University of South Alabama.
Common Questions
What is Per Capita Income in Belle Fontaine?
Per Capita income in Belle Fontaine is $25,730.
What is the Median Household income in Belle Fontaine?
Median Household Income in Belle Fontaine is $46,944.
What is Income or Wage Gap in Belle Fontaine?
Income or Wage Gap in Belle Fontaine is 78.8%.
Women in Belle Fontaine earn 21.2 cents for every dollar earned by a man.
What is Inequality or Gini Index in Belle Fontaine?
Inequality or Gini Index in Belle Fontaine is 0.49.
What is the Total Population of Belle Fontaine?
Total Population of Belle Fontaine is 699.
What is the Total Male Population of Belle Fontaine?
Total Male Population of Belle Fontaine is 387.
What is the Total Female Population of Belle Fontaine?
Total Female Population of Belle Fontaine is 312.
What is the Ratio of Males per 100 Females in Belle Fontaine?
There are 124.04 Males per 100 Females in Belle Fontaine.
What is the Ratio of Females per 100 Males in Belle Fontaine?
There are 80.62 Females per 100 Males in Belle Fontaine.
What is the Median Population Age in Belle Fontaine?
Median Population Age in Belle Fontaine is 44.0 Years.
What is the Average Family Size in Belle Fontaine
Average Family Size in Belle Fontaine is 3.3 People.
What is the Average Household Size in Belle Fontaine
Average Household Size in Belle Fontaine is 2.9 People.
How Large is the Labor Force in Belle Fontaine?
There are 310 People in the Labor Forcein in Belle Fontaine.
What is the Percentage of People in the Labor Force in Belle Fontaine?
52.9% of People are in the Labor Force in Belle Fontaine.
What is the Unemployment Rate in Belle Fontaine?
Unemployment Rate in Belle Fontaine is 22.6%.