Holly Pond, AL Map & Demographics
Holly Pond Map
Holly Pond Overview
$21,714
PER CAPITA INCOME
$56,397
AVG FAMILY INCOME
$46,250
AVG HOUSEHOLD INCOME
24.9%
WAGE / INCOME GAP [ % ]
75.1¢/ $1
WAGE / INCOME GAP [ $ ]
$8,903
FAMILY INCOME DEFICIT
0.39
INEQUALITY / GINI INDEX
761
TOTAL POPULATION
410
MALE POPULATION
351
FEMALE POPULATION
116.81
MALES / 100 FEMALES
85.61
FEMALES / 100 MALES
36.9
MEDIAN AGE
3.1
AVG FAMILY SIZE
2.8
AVG HOUSEHOLD SIZE
319
LABOR FORCE [ PEOPLE ]
53.7%
PERCENT IN LABOR FORCE
1.9%
UNEMPLOYMENT RATE
Holly Pond Zip Codes
Holly Pond Area Codes
Income in Holly Pond
Income Overview in Holly Pond
Per Capita Income in Holly Pond is $21,714, while median incomes of families and households are $56,397 and $46,250 respectively.
| Characteristic | Number | Measure |
| Per Capita Income | 761 | $21,714 |
| Median Family Income | 199 | $56,397 |
| Mean Family Income | 199 | $62,916 |
| Median Household Income | 274 | $46,250 |
| Mean Household Income | 274 | $56,741 |
| Income Deficit | 199 | $8,903 |
| Wage / Income Gap (%) | 761 | 24.85% |
| Wage / Income Gap ($) | 761 | 75.15¢ per $1 |
| Gini / Inequality Index | 761 | 0.39 |
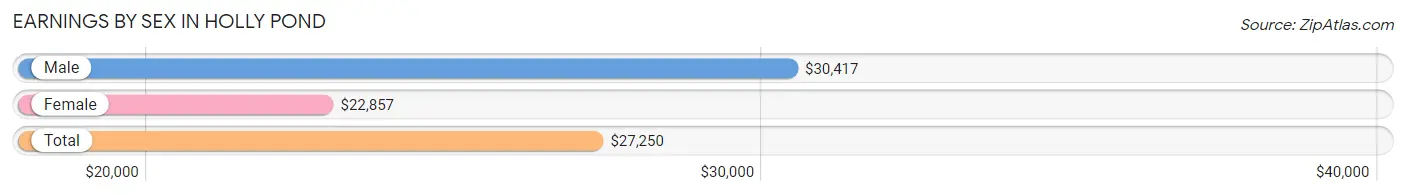
Earnings by Sex in Holly Pond
Average Earnings in Holly Pond are $27,250, $30,417 for men and $22,857 for women, a difference of 24.8%.
| Sex | Number | Average Earnings |
| Male | 193 (55.3%) | $30,417 |
| Female | 156 (44.7%) | $22,857 |
| Total | 349 (100.0%) | $27,250 |
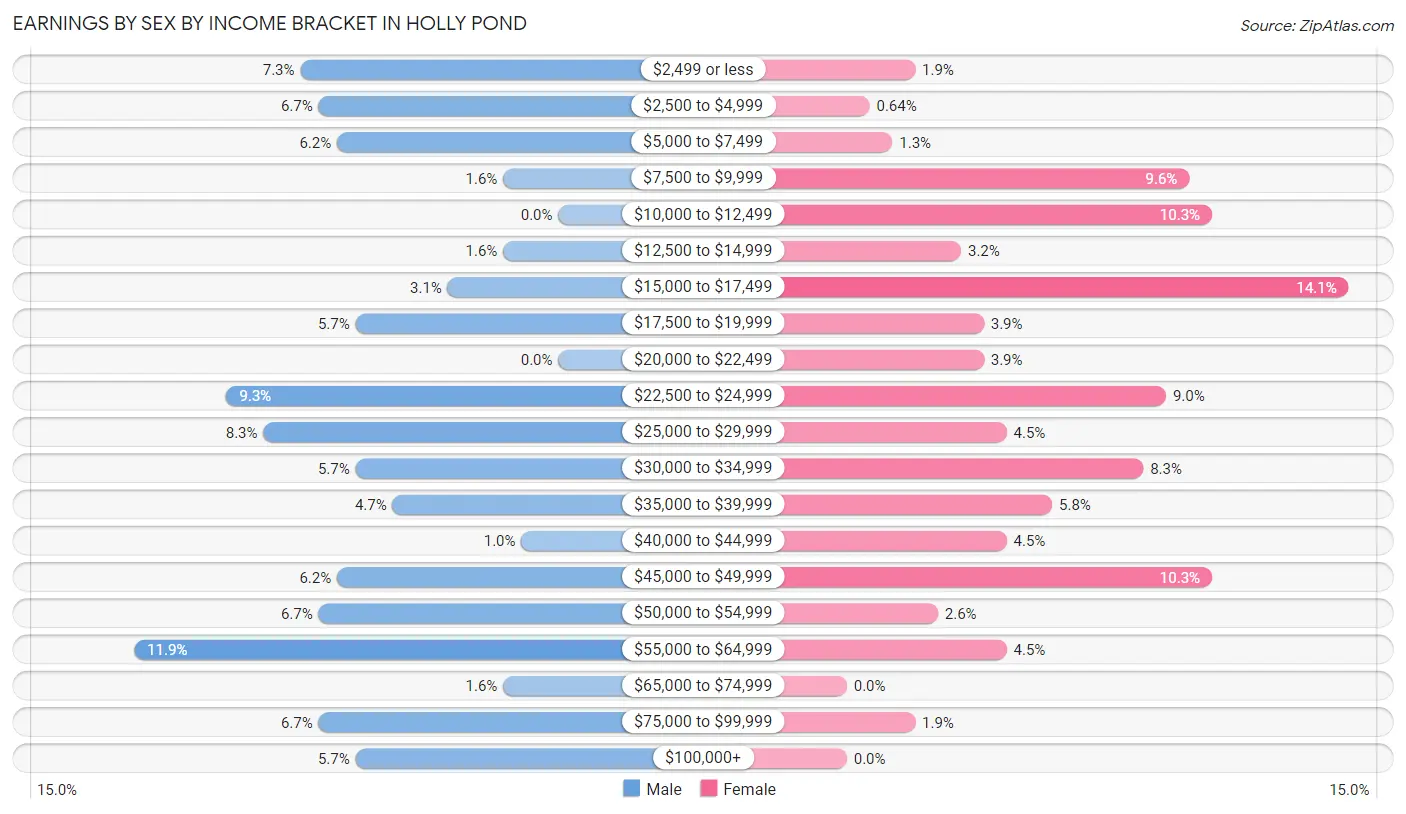
Earnings by Sex by Income Bracket in Holly Pond
The most common earnings brackets in Holly Pond are $55,000 to $64,999 for men (23 | 11.9%) and $15,000 to $17,499 for women (22 | 14.1%).
| Income | Male | Female |
| $2,499 or less | 14 (7.2%) | 3 (1.9%) |
| $2,500 to $4,999 | 13 (6.7%) | 1 (0.6%) |
| $5,000 to $7,499 | 12 (6.2%) | 2 (1.3%) |
| $7,500 to $9,999 | 3 (1.5%) | 15 (9.6%) |
| $10,000 to $12,499 | 0 (0.0%) | 16 (10.3%) |
| $12,500 to $14,999 | 3 (1.5%) | 5 (3.2%) |
| $15,000 to $17,499 | 6 (3.1%) | 22 (14.1%) |
| $17,500 to $19,999 | 11 (5.7%) | 6 (3.8%) |
| $20,000 to $22,499 | 0 (0.0%) | 6 (3.8%) |
| $22,500 to $24,999 | 18 (9.3%) | 14 (9.0%) |
| $25,000 to $29,999 | 16 (8.3%) | 7 (4.5%) |
| $30,000 to $34,999 | 11 (5.7%) | 13 (8.3%) |
| $35,000 to $39,999 | 9 (4.7%) | 9 (5.8%) |
| $40,000 to $44,999 | 2 (1.0%) | 7 (4.5%) |
| $45,000 to $49,999 | 12 (6.2%) | 16 (10.3%) |
| $50,000 to $54,999 | 13 (6.7%) | 4 (2.6%) |
| $55,000 to $64,999 | 23 (11.9%) | 7 (4.5%) |
| $65,000 to $74,999 | 3 (1.5%) | 0 (0.0%) |
| $75,000 to $99,999 | 13 (6.7%) | 3 (1.9%) |
| $100,000+ | 11 (5.7%) | 0 (0.0%) |
| Total | 193 (100.0%) | 156 (100.0%) |
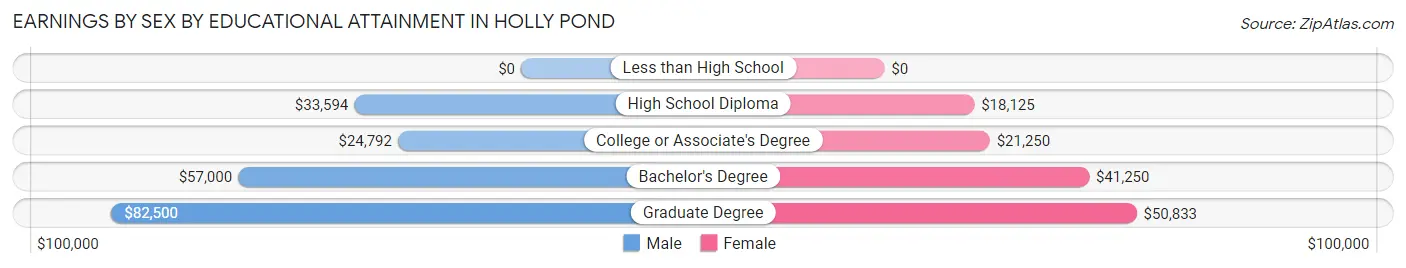
Earnings by Sex by Educational Attainment in Holly Pond
Average earnings in Holly Pond are $35,893 for men and $23,750 for women, a difference of 33.8%. Men with an educational attainment of graduate degree enjoy the highest average annual earnings of $82,500, while those with college or associate's degree education earn the least with $24,792. Women with an educational attainment of graduate degree earn the most with the average annual earnings of $50,833, while those with high school diploma education have the smallest earnings of $18,125.
| Educational Attainment | Male Income | Female Income |
| Less than High School | - | - |
| High School Diploma | $33,594 | $18,125 |
| College or Associate's Degree | $24,792 | $21,250 |
| Bachelor's Degree | $57,000 | $41,250 |
| Graduate Degree | $82,500 | $50,833 |
| Total | $35,893 | $23,750 |
Family Income in Holly Pond
Family Income Brackets in Holly Pond
According to the Holly Pond family income data, there are 55 families falling into the $50,000 to $74,999 income range, which is the most common income bracket and makes up 27.6% of all families.
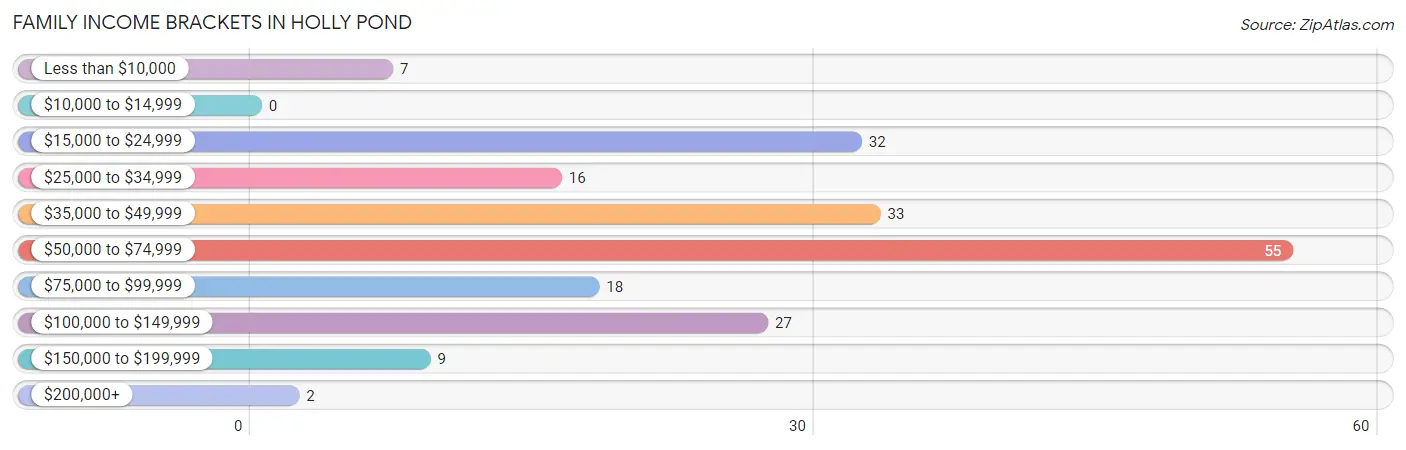
| Income Bracket | # Families | % Families |
| Less than $10,000 | 7 | 3.5% |
| $10,000 to $14,999 | 0 | 0.0% |
| $15,000 to $24,999 | 32 | 16.1% |
| $25,000 to $34,999 | 16 | 8.0% |
| $35,000 to $49,999 | 33 | 16.6% |
| $50,000 to $74,999 | 55 | 27.6% |
| $75,000 to $99,999 | 18 | 9.0% |
| $100,000 to $149,999 | 27 | 13.6% |
| $150,000 to $199,999 | 9 | 4.5% |
| $200,000+ | 2 | 1.0% |
Family Income by Famaliy Size in Holly Pond
6-person families (4 | 2.0%) account for the highest median family income in Holly Pond with $151,250 per family, while 4-person families (28 | 14.1%) have the highest median income of $26,250 per family member.
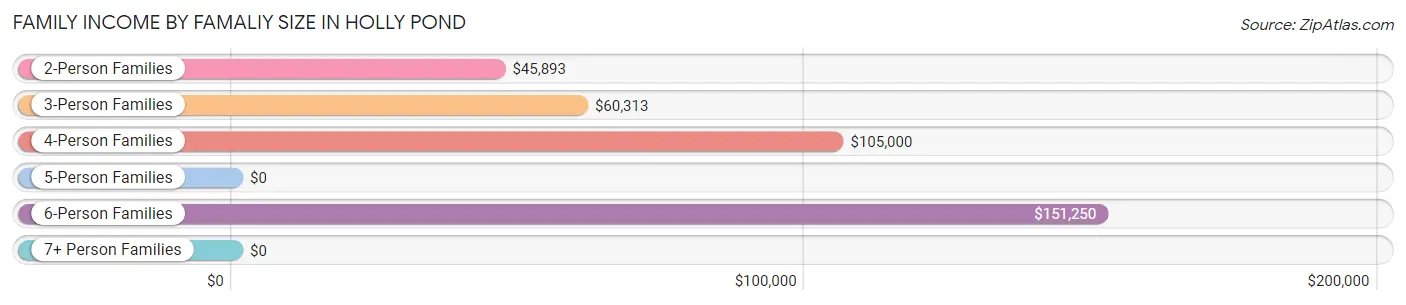
| Income Bracket | # Families | Median Income |
| 2-Person Families | 92 (46.2%) | $45,893 |
| 3-Person Families | 49 (24.6%) | $60,313 |
| 4-Person Families | 28 (14.1%) | $105,000 |
| 5-Person Families | 26 (13.1%) | $0 |
| 6-Person Families | 4 (2.0%) | $151,250 |
| 7+ Person Families | 0 (0.0%) | $0 |
| Total | 199 (100.0%) | $56,397 |
Family Income by Number of Earners in Holly Pond
The median family income in Holly Pond is $56,397, with families comprising 3+ earners (21) having the highest median family income of $104,375, while families with 1 earner (80) have the lowest median family income of $31,250, accounting for 10.5% and 40.2% of families, respectively.
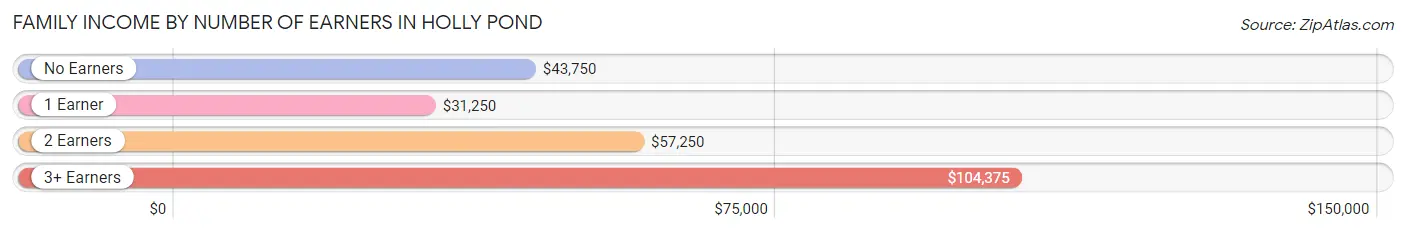
| Number of Earners | # Families | Median Income |
| No Earners | 39 (19.6%) | $43,750 |
| 1 Earner | 80 (40.2%) | $31,250 |
| 2 Earners | 59 (29.6%) | $57,250 |
| 3+ Earners | 21 (10.5%) | $104,375 |
| Total | 199 (100.0%) | $56,397 |
Household Income in Holly Pond
Household Income Brackets in Holly Pond
With 57 households falling in the category, the $35,000 to $49,999 income range is the most frequent in Holly Pond, accounting for 20.8% of all households. In contrast, only 2 households (0.7%) fall into the $200,000+ income bracket, making it the least populous group.
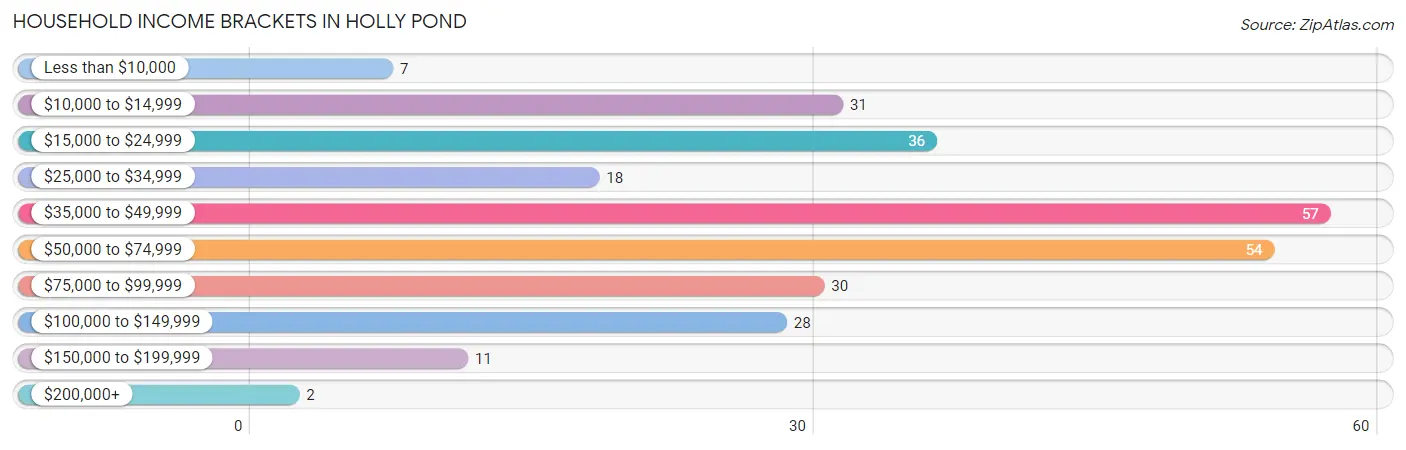
| Income Bracket | # Households | % Households |
| Less than $10,000 | 7 | 2.6% |
| $10,000 to $14,999 | 31 | 11.3% |
| $15,000 to $24,999 | 36 | 13.1% |
| $25,000 to $34,999 | 18 | 6.6% |
| $35,000 to $49,999 | 57 | 20.8% |
| $50,000 to $74,999 | 54 | 19.7% |
| $75,000 to $99,999 | 30 | 10.9% |
| $100,000 to $149,999 | 28 | 10.2% |
| $150,000 to $199,999 | 11 | 4.0% |
| $200,000+ | 2 | 0.7% |
Household Income by Householder Age in Holly Pond
The median household income in Holly Pond is $46,250, with the highest median household income of $62,917 found in the 15 to 24 years age bracket for the primary householder. A total of 9 households (3.3%) fall into this category. Meanwhile, the 45 to 64 years age bracket for the primary householder has the lowest median household income of $44,167, with 70 households (25.6%) in this group.
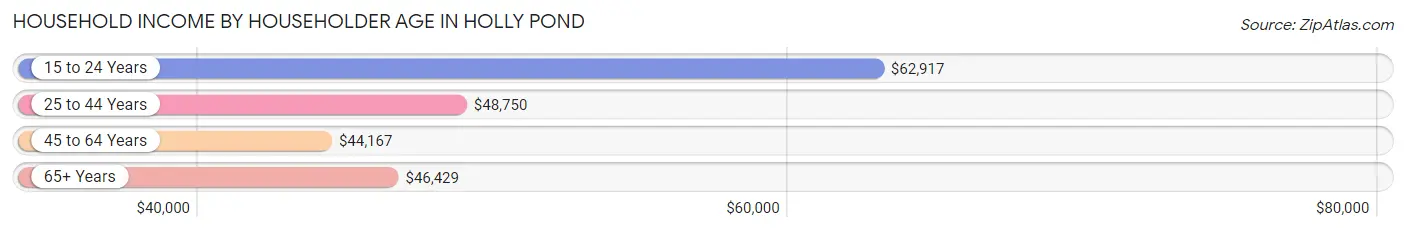
| Income Bracket | # Households | Median Income |
| 15 to 24 Years | 9 (3.3%) | $62,917 |
| 25 to 44 Years | 105 (38.3%) | $48,750 |
| 45 to 64 Years | 70 (25.6%) | $44,167 |
| 65+ Years | 90 (32.9%) | $46,429 |
| Total | 274 (100.0%) | $46,250 |
Poverty in Holly Pond
Income Below Poverty by Sex and Age in Holly Pond
With 22.0% poverty level for males and 21.4% for females among the residents of Holly Pond, 6 to 11 year old males and 6 to 11 year old females are the most vulnerable to poverty, with 27 males (69.2%) and 12 females (44.4%) in their respective age groups living below the poverty level.
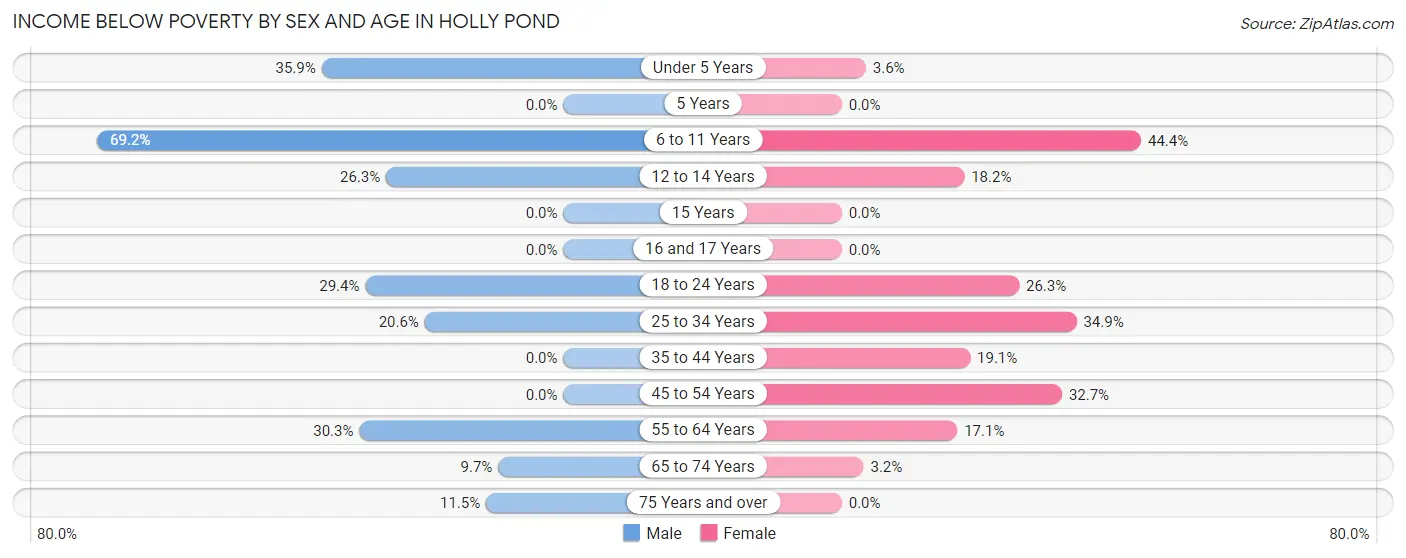
| Age Bracket | Male | Female |
| Under 5 Years | 14 (35.9%) | 1 (3.6%) |
| 5 Years | 0 (0.0%) | 0 (0.0%) |
| 6 to 11 Years | 27 (69.2%) | 12 (44.4%) |
| 12 to 14 Years | 5 (26.3%) | 2 (18.2%) |
| 15 Years | 0 (0.0%) | 0 (0.0%) |
| 16 and 17 Years | 0 (0.0%) | 0 (0.0%) |
| 18 to 24 Years | 10 (29.4%) | 5 (26.3%) |
| 25 to 34 Years | 14 (20.6%) | 23 (34.8%) |
| 35 to 44 Years | 0 (0.0%) | 8 (19.1%) |
| 45 to 54 Years | 0 (0.0%) | 17 (32.7%) |
| 55 to 64 Years | 10 (30.3%) | 6 (17.1%) |
| 65 to 74 Years | 3 (9.7%) | 1 (3.2%) |
| 75 Years and over | 7 (11.5%) | 0 (0.0%) |
| Total | 90 (22.0%) | 75 (21.4%) |
Income Above Poverty by Sex and Age in Holly Pond
According to the poverty statistics in Holly Pond, males aged 15 years and females aged 5 years are the age groups that are most secure financially, with 100.0% of males and 100.0% of females in these age groups living above the poverty line.
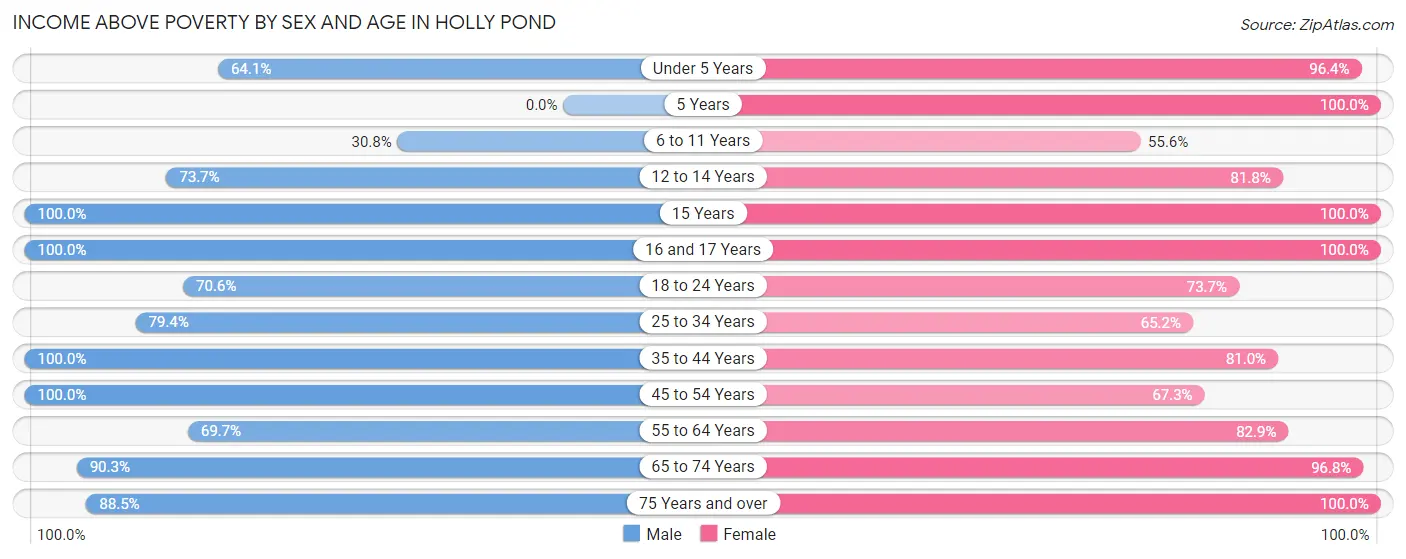
| Age Bracket | Male | Female |
| Under 5 Years | 25 (64.1%) | 27 (96.4%) |
| 5 Years | 0 (0.0%) | 2 (100.0%) |
| 6 to 11 Years | 12 (30.8%) | 15 (55.6%) |
| 12 to 14 Years | 14 (73.7%) | 9 (81.8%) |
| 15 Years | 1 (100.0%) | 1 (100.0%) |
| 16 and 17 Years | 12 (100.0%) | 3 (100.0%) |
| 18 to 24 Years | 24 (70.6%) | 14 (73.7%) |
| 25 to 34 Years | 54 (79.4%) | 43 (65.1%) |
| 35 to 44 Years | 35 (100.0%) | 34 (80.9%) |
| 45 to 54 Years | 38 (100.0%) | 35 (67.3%) |
| 55 to 64 Years | 23 (69.7%) | 29 (82.9%) |
| 65 to 74 Years | 28 (90.3%) | 30 (96.8%) |
| 75 Years and over | 54 (88.5%) | 34 (100.0%) |
| Total | 320 (78.0%) | 276 (78.6%) |
Income Below Poverty Among Married-Couple Families in Holly Pond
The poverty statistics for married-couple families in Holly Pond show that 6.4% or 9 of the total 140 families live below the poverty line. Families with 3 or 4 children have the highest poverty rate of 41.7%, comprising of 5 families. On the other hand, families with 1 or 2 children have the lowest poverty rate of 2.4%, which includes 1 families.
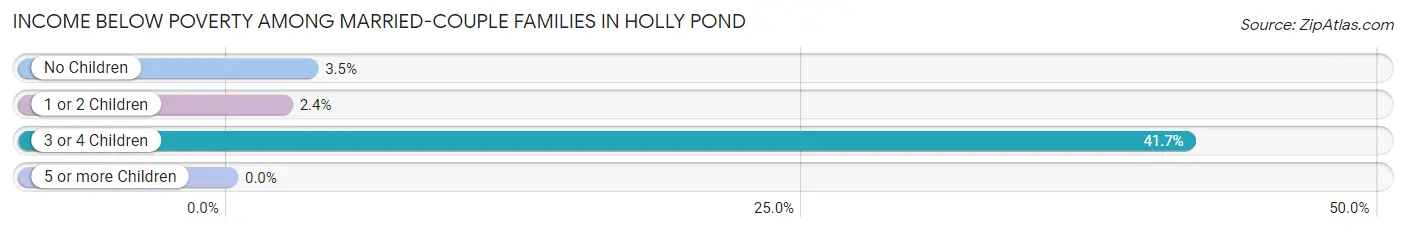
| Children | Above Poverty | Below Poverty |
| No Children | 83 (96.5%) | 3 (3.5%) |
| 1 or 2 Children | 41 (97.6%) | 1 (2.4%) |
| 3 or 4 Children | 7 (58.3%) | 5 (41.7%) |
| 5 or more Children | 0 (0.0%) | 0 (0.0%) |
| Total | 131 (93.6%) | 9 (6.4%) |
Income Below Poverty Among Single-Parent Households in Holly Pond
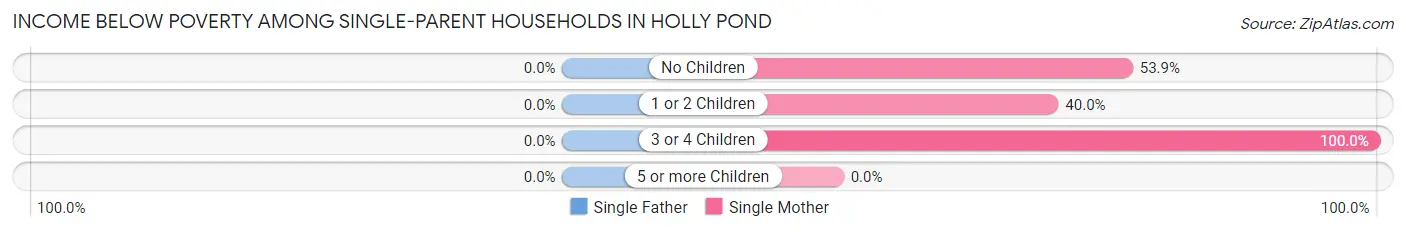
| Children | Single Father | Single Mother |
| No Children | 0 (0.0%) | 7 (53.8%) |
| 1 or 2 Children | 0 (0.0%) | 8 (40.0%) |
| 3 or 4 Children | 0 (0.0%) | 12 (100.0%) |
| 5 or more Children | 0 (0.0%) | 0 (0.0%) |
| Total | 0 (0.0%) | 27 (60.0%) |
Income Below Poverty Among Married-Couple vs Single-Parent Households in Holly Pond
The poverty data for Holly Pond shows that 9 of the married-couple family households (6.4%) and 27 of the single-parent households (45.8%) are living below the poverty level. Within the married-couple family households, those with 3 or 4 children have the highest poverty rate, with 5 households (41.7%) falling below the poverty line. Among the single-parent households, those with 3 or 4 children have the highest poverty rate, with 12 household (100.0%) living below poverty.
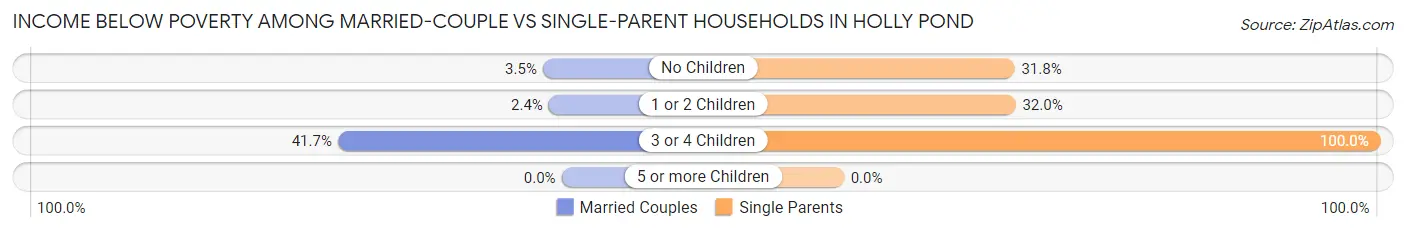
| Children | Married-Couple Families | Single-Parent Households |
| No Children | 3 (3.5%) | 7 (31.8%) |
| 1 or 2 Children | 1 (2.4%) | 8 (32.0%) |
| 3 or 4 Children | 5 (41.7%) | 12 (100.0%) |
| 5 or more Children | 0 (0.0%) | 0 (0.0%) |
| Total | 9 (6.4%) | 27 (45.8%) |
Race in Holly Pond
The most populous races in Holly Pond are White / Caucasian (719 | 94.5%), Two or more Races (31 | 4.1%), and Hispanic or Latino (20 | 2.6%).
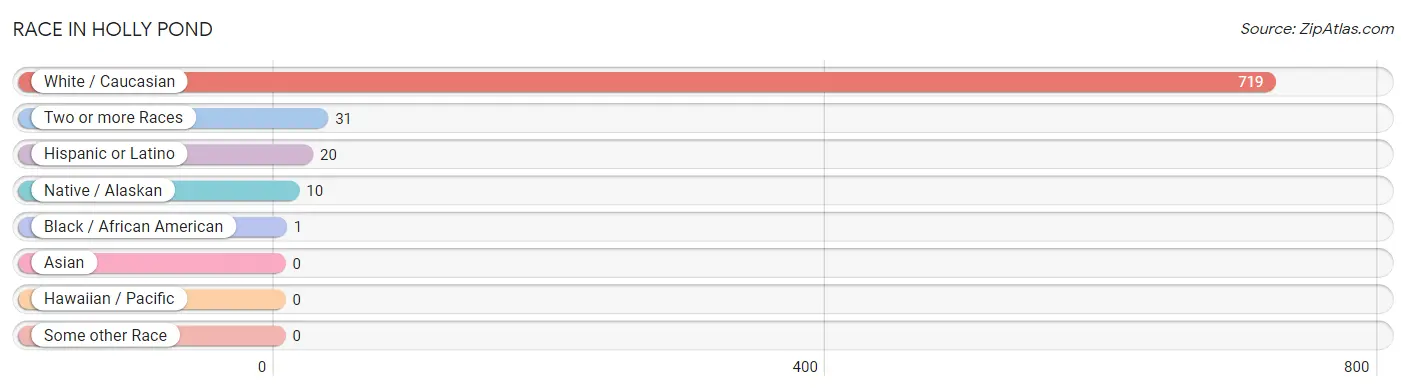
| Race | # Population | % Population |
| Asian | 0 | 0.0% |
| Black / African American | 1 | 0.1% |
| Hawaiian / Pacific | 0 | 0.0% |
| Hispanic or Latino | 20 | 2.6% |
| Native / Alaskan | 10 | 1.3% |
| White / Caucasian | 719 | 94.5% |
| Two or more Races | 31 | 4.1% |
| Some other Race | 0 | 0.0% |
| Total | 761 | 100.0% |
Ancestry in Holly Pond
The most populous ancestries reported in Holly Pond are American (197 | 25.9%), Irish (84 | 11.0%), English (77 | 10.1%), German (62 | 8.2%), and European (29 | 3.8%), together accounting for 59.0% of all Holly Pond residents.
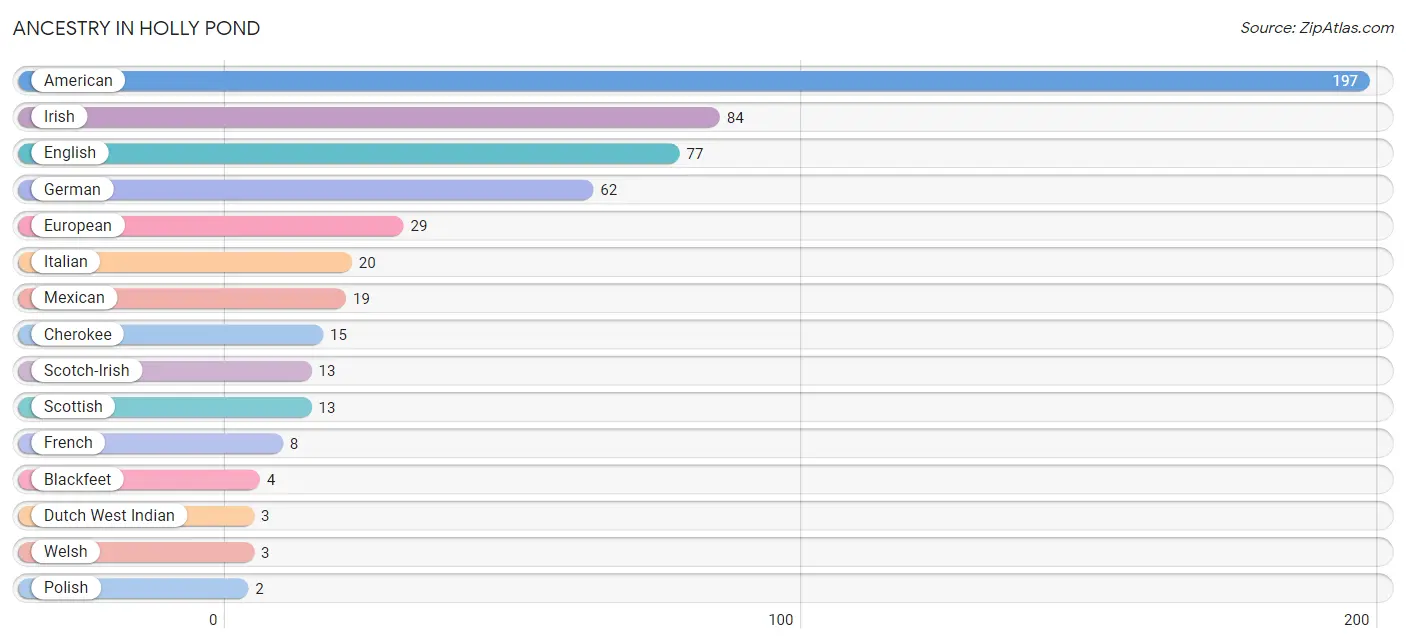
| Ancestry | # Population | % Population |
| American | 197 | 25.9% |
| Blackfeet | 4 | 0.5% |
| Cherokee | 15 | 2.0% |
| Dutch West Indian | 3 | 0.4% |
| English | 77 | 10.1% |
| European | 29 | 3.8% |
| French | 8 | 1.1% |
| German | 62 | 8.2% |
| Hungarian | 1 | 0.1% |
| Irish | 84 | 11.0% |
| Italian | 20 | 2.6% |
| Mexican | 19 | 2.5% |
| Polish | 2 | 0.3% |
| Puerto Rican | 1 | 0.1% |
| Scotch-Irish | 13 | 1.7% |
| Scottish | 13 | 1.7% |
| Swedish | 1 | 0.1% |
| Welsh | 3 | 0.4% | View All 18 Rows |
Immigrants in Holly Pond
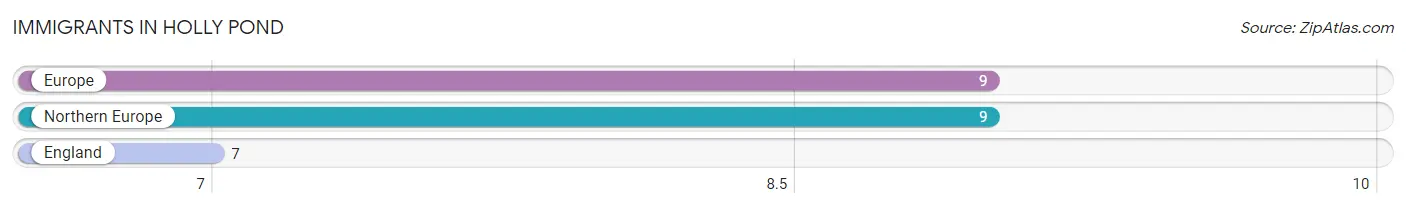
The most numerous immigrant groups reported in Holly Pond came from Europe (9 | 1.2%), Northern Europe (9 | 1.2%), and England (7 | 0.9%), together accounting for 3.3% of all Holly Pond residents.
| Immigration Origin | # Population | % Population |
| England | 7 | 0.9% |
| Europe | 9 | 1.2% |
| Northern Europe | 9 | 1.2% | View All 3 Rows |
Sex and Age in Holly Pond
Sex and Age in Holly Pond
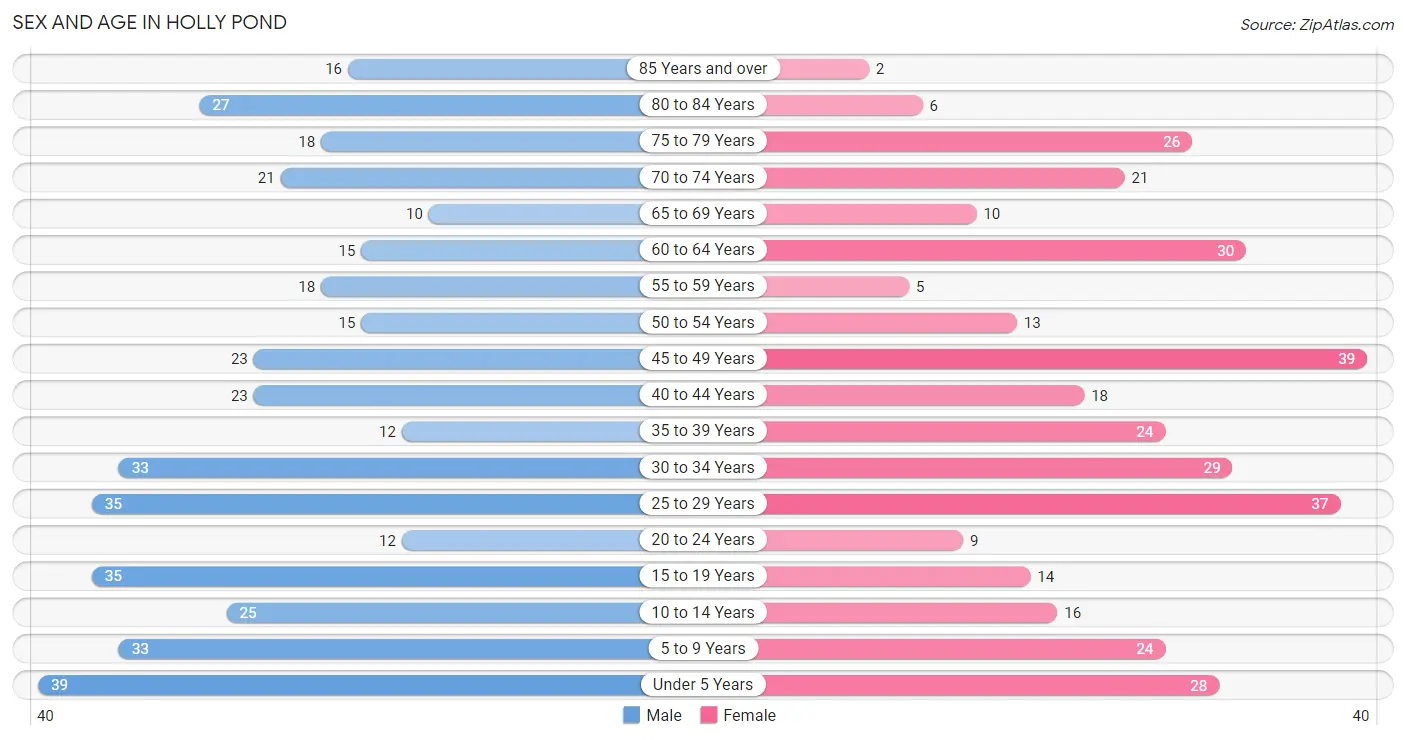
The most populous age groups in Holly Pond are Under 5 Years (39 | 9.5%) for men and 45 to 49 Years (39 | 11.1%) for women.
| Age Bracket | Male | Female |
| Under 5 Years | 39 (9.5%) | 28 (8.0%) |
| 5 to 9 Years | 33 (8.1%) | 24 (6.8%) |
| 10 to 14 Years | 25 (6.1%) | 16 (4.6%) |
| 15 to 19 Years | 35 (8.5%) | 14 (4.0%) |
| 20 to 24 Years | 12 (2.9%) | 9 (2.6%) |
| 25 to 29 Years | 35 (8.5%) | 37 (10.5%) |
| 30 to 34 Years | 33 (8.1%) | 29 (8.3%) |
| 35 to 39 Years | 12 (2.9%) | 24 (6.8%) |
| 40 to 44 Years | 23 (5.6%) | 18 (5.1%) |
| 45 to 49 Years | 23 (5.6%) | 39 (11.1%) |
| 50 to 54 Years | 15 (3.7%) | 13 (3.7%) |
| 55 to 59 Years | 18 (4.4%) | 5 (1.4%) |
| 60 to 64 Years | 15 (3.7%) | 30 (8.6%) |
| 65 to 69 Years | 10 (2.4%) | 10 (2.9%) |
| 70 to 74 Years | 21 (5.1%) | 21 (6.0%) |
| 75 to 79 Years | 18 (4.4%) | 26 (7.4%) |
| 80 to 84 Years | 27 (6.6%) | 6 (1.7%) |
| 85 Years and over | 16 (3.9%) | 2 (0.6%) |
| Total | 410 (100.0%) | 351 (100.0%) |
Families and Households in Holly Pond
Median Family Size in Holly Pond
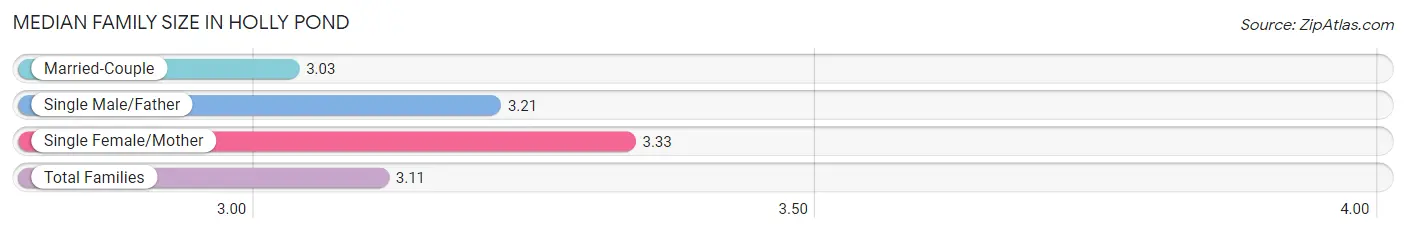
The median family size in Holly Pond is 3.11 persons per family, with single female/mother families (45 | 22.6%) accounting for the largest median family size of 3.33 persons per family. On the other hand, married-couple families (140 | 70.4%) represent the smallest median family size with 3.03 persons per family.
| Family Type | # Families | Family Size |
| Married-Couple | 140 (70.4%) | 3.03 |
| Single Male/Father | 14 (7.0%) | 3.21 |
| Single Female/Mother | 45 (22.6%) | 3.33 |
| Total Families | 199 (100.0%) | 3.11 |
Median Household Size in Holly Pond
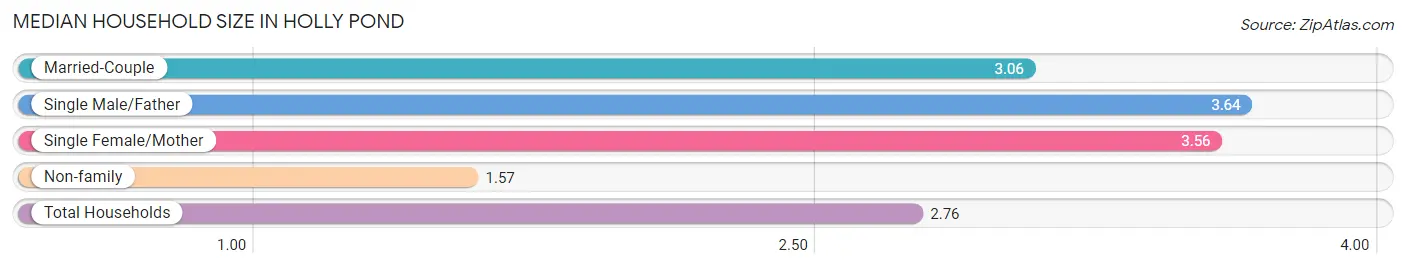
The median household size in Holly Pond is 2.76 persons per household, with single male/father households (14 | 5.1%) accounting for the largest median household size of 3.64 persons per household. non-family households (75 | 27.4%) represent the smallest median household size with 1.57 persons per household.
| Household Type | # Households | Household Size |
| Married-Couple | 140 (51.1%) | 3.06 |
| Single Male/Father | 14 (5.1%) | 3.64 |
| Single Female/Mother | 45 (16.4%) | 3.56 |
| Non-family | 75 (27.4%) | 1.57 |
| Total Households | 274 (100.0%) | 2.76 |
Household Size by Marriage Status in Holly Pond
Out of a total of 274 households in Holly Pond, 199 (72.6%) are family households, while 75 (27.4%) are nonfamily households. The most numerous type of family households are 2-person households, comprising 90, and the most common type of nonfamily households are 1-person households, comprising 50.
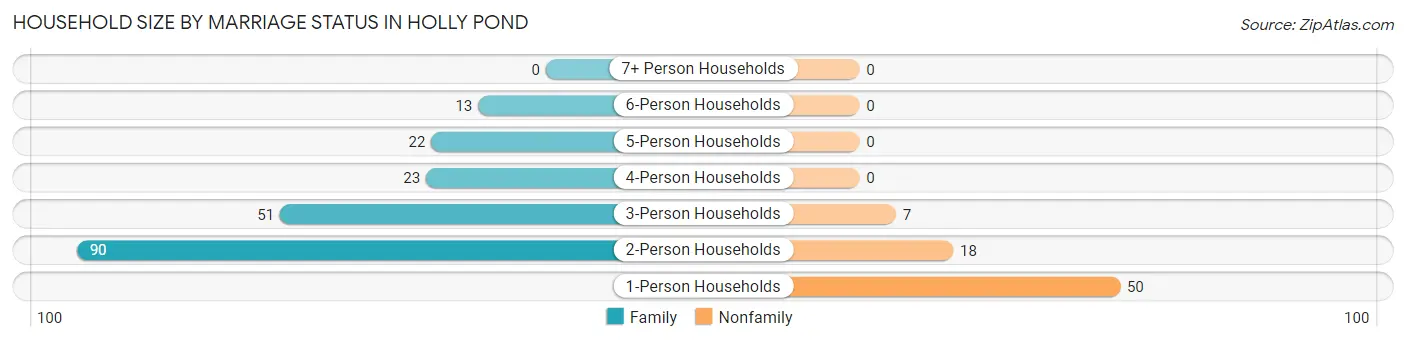
| Household Size | Family Households | Nonfamily Households |
| 1-Person Households | - | 50 (18.2%) |
| 2-Person Households | 90 (32.9%) | 18 (6.6%) |
| 3-Person Households | 51 (18.6%) | 7 (2.5%) |
| 4-Person Households | 23 (8.4%) | 0 (0.0%) |
| 5-Person Households | 22 (8.0%) | 0 (0.0%) |
| 6-Person Households | 13 (4.7%) | 0 (0.0%) |
| 7+ Person Households | 0 (0.0%) | 0 (0.0%) |
| Total | 199 (72.6%) | 75 (27.4%) |
Female Fertility in Holly Pond
Fertility by Age in Holly Pond
Average fertility rate in Holly Pond is 73.0 births per 1,000 women. Women in the age bracket of 20 to 34 years have the highest fertility rate with 173.0 births per 1,000 women. Women in the age bracket of 20 to 34 years acount for 100.0% of all women with births.
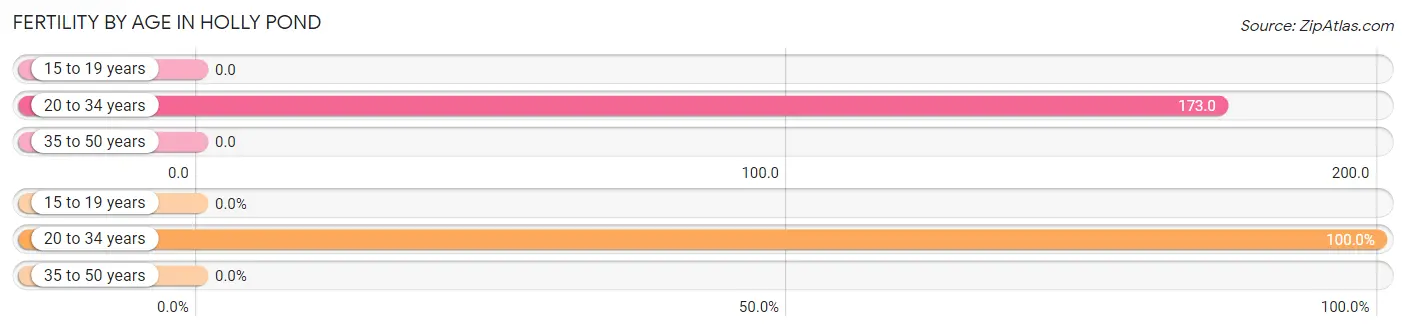
| Age Bracket | Women with Births | Births / 1,000 Women |
| 15 to 19 years | 0 (0.0%) | 0.0 |
| 20 to 34 years | 13 (100.0%) | 173.0 |
| 35 to 50 years | 0 (0.0%) | 0.0 |
| Total | 13 (100.0%) | 73.0 |
Fertility by Age by Marriage Status in Holly Pond
38.5% of women with births (13) in Holly Pond are married. The highest percentage of unmarried women with births falls into 20 to 34 years age bracket with 61.5% of them unmarried at the time of birth, while the lowest percentage of unmarried women with births belong to 20 to 34 years age bracket with 61.5% of them unmarried.
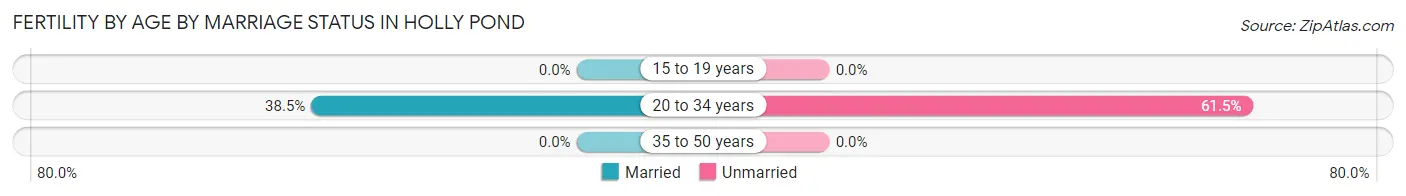
| Age Bracket | Married | Unmarried |
| 15 to 19 years | 0 (0.0%) | 0 (0.0%) |
| 20 to 34 years | 5 (38.5%) | 8 (61.5%) |
| 35 to 50 years | 0 (0.0%) | 0 (0.0%) |
| Total | 5 (38.5%) | 8 (61.5%) |
Fertility by Education in Holly Pond
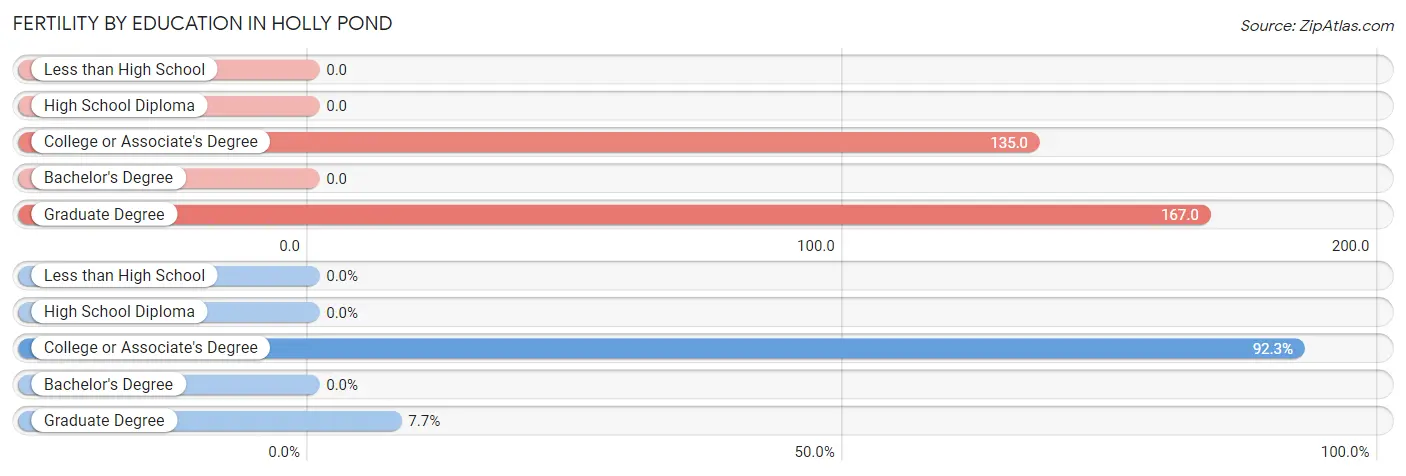
| Educational Attainment | Women with Births | Births / 1,000 Women |
| Less than High School | 0 (0.0%) | 0.0 |
| High School Diploma | 0 (0.0%) | 0.0 |
| College or Associate's Degree | 12 (92.3%) | 135.0 |
| Bachelor's Degree | 0 (0.0%) | 0.0 |
| Graduate Degree | 1 (7.7%) | 167.0 |
| Total | 13 (100.0%) | 73.0 |
Fertility by Education by Marriage Status in Holly Pond
61.5% of women with births in Holly Pond are unmarried. Women with the educational attainment of graduate degree are most likely to be married with 100.0% of them married at childbirth, while women with the educational attainment of college or associate's degree are least likely to be married with 66.7% of them unmarried at childbirth.
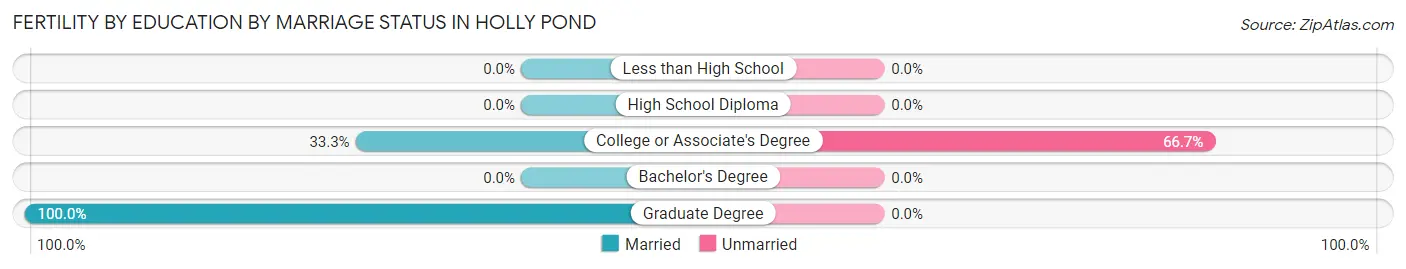
| Educational Attainment | Married | Unmarried |
| Less than High School | 0 (0.0%) | 0 (0.0%) |
| High School Diploma | 0 (0.0%) | 0 (0.0%) |
| College or Associate's Degree | 4 (33.3%) | 8 (66.7%) |
| Bachelor's Degree | 0 (0.0%) | 0 (0.0%) |
| Graduate Degree | 1 (100.0%) | 0 (0.0%) |
| Total | 5 (38.5%) | 8 (61.5%) |
Employment Characteristics in Holly Pond
Employment by Class of Employer in Holly Pond
Among the 309 employed individuals in Holly Pond, private company employees (203 | 65.7%), local government employees (46 | 14.9%), and self-employed (not incorporated) (21 | 6.8%) make up the most common classes of employment.
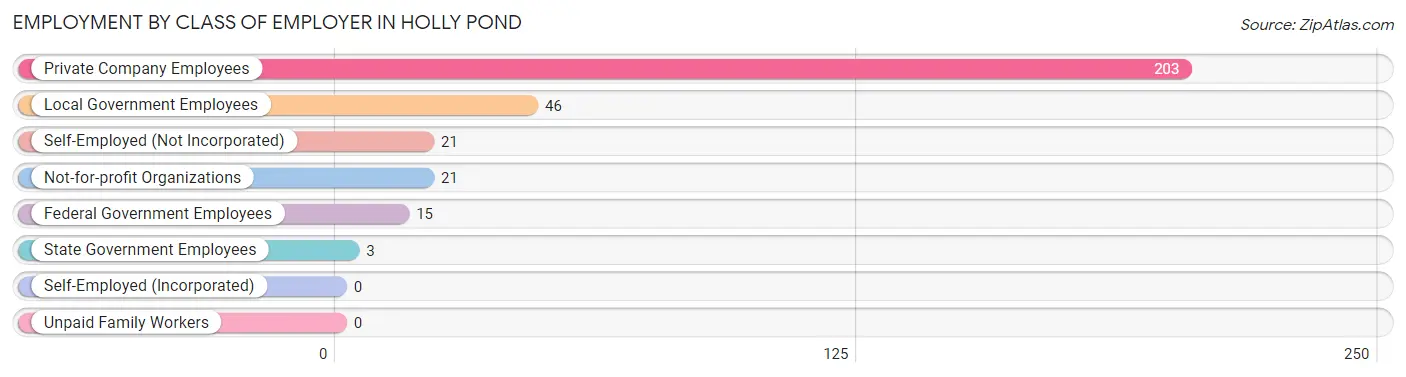
| Employer Class | # Employees | % Employees |
| Private Company Employees | 203 | 65.7% |
| Self-Employed (Incorporated) | 0 | 0.0% |
| Self-Employed (Not Incorporated) | 21 | 6.8% |
| Not-for-profit Organizations | 21 | 6.8% |
| Local Government Employees | 46 | 14.9% |
| State Government Employees | 3 | 1.0% |
| Federal Government Employees | 15 | 4.9% |
| Unpaid Family Workers | 0 | 0.0% |
| Total | 309 | 100.0% |
Employment Status by Age in Holly Pond
According to the labor force statistics for Holly Pond, out of the total population over 16 years of age (594), 53.7% or 319 individuals are in the labor force, with 1.9% or 6 of them unemployed. The age group with the highest labor force participation rate is 25 to 29 years, with 94.4% or 68 individuals in the labor force. Within the labor force, the 30 to 34 years age range has the highest percentage of unemployed individuals, with 9.8% or 5 of them being unemployed.
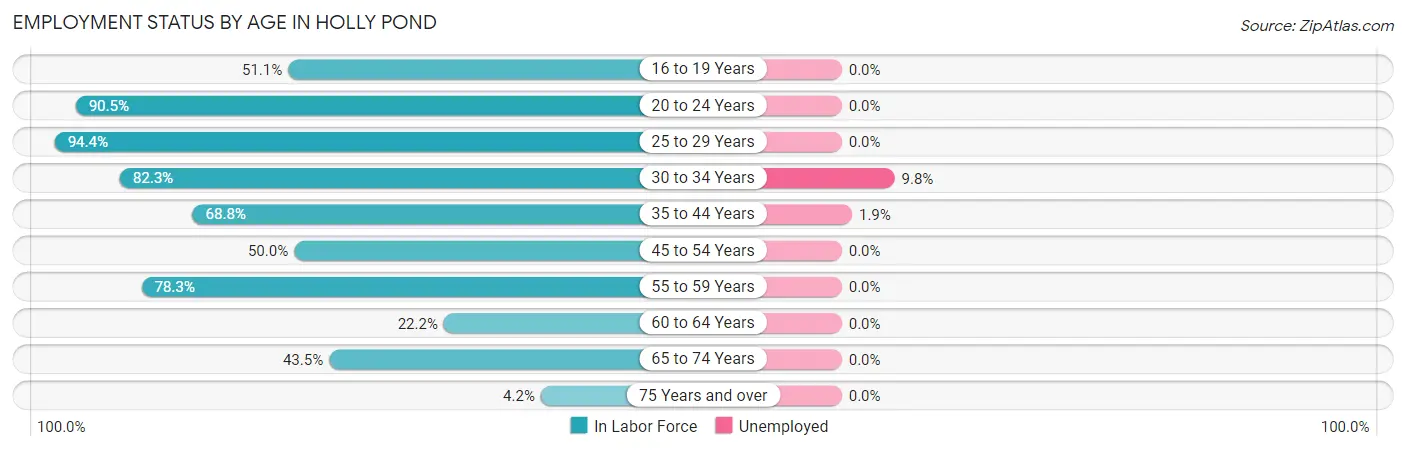
| Age Bracket | In Labor Force | Unemployed |
| 16 to 19 Years | 24 (51.1%) | 0 (0.0%) |
| 20 to 24 Years | 19 (90.5%) | 0 (0.0%) |
| 25 to 29 Years | 68 (94.4%) | 0 (0.0%) |
| 30 to 34 Years | 51 (82.3%) | 5 (9.8%) |
| 35 to 44 Years | 53 (68.8%) | 1 (1.9%) |
| 45 to 54 Years | 45 (50.0%) | 0 (0.0%) |
| 55 to 59 Years | 18 (78.3%) | 0 (0.0%) |
| 60 to 64 Years | 10 (22.2%) | 0 (0.0%) |
| 65 to 74 Years | 27 (43.5%) | 0 (0.0%) |
| 75 Years and over | 4 (4.2%) | 0 (0.0%) |
| Total | 319 (53.7%) | 6 (1.9%) |
Employment Status by Educational Attainment in Holly Pond
According to labor force statistics for Holly Pond, 66.4% of individuals (245) out of the total population between 25 and 64 years of age (369) are in the labor force, with 2.4% or 6 of them being unemployed. The group with the highest labor force participation rate are those with the educational attainment of bachelor's degree or higher, with 93.0% or 53 individuals in the labor force. Within the labor force, individuals with high school diploma education have the highest percentage of unemployment, with 10.0% or 5 of them being unemployed.
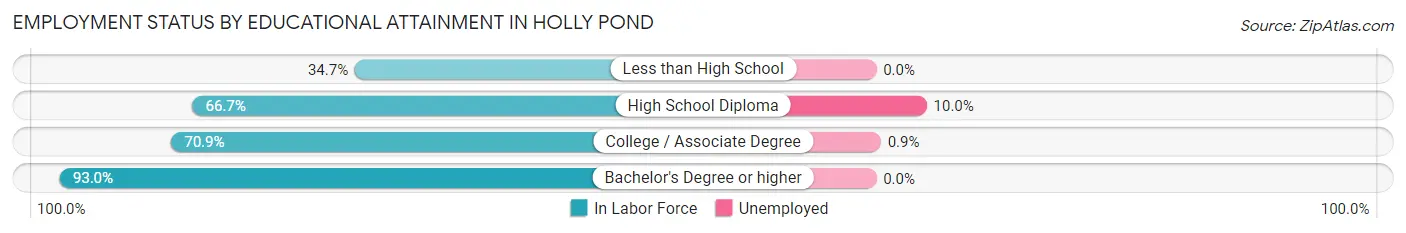
| Educational Attainment | In Labor Force | Unemployed |
| Less than High School | 25 (34.7%) | 0 (0.0%) |
| High School Diploma | 50 (66.7%) | 8 (10.0%) |
| College / Associate Degree | 117 (70.9%) | 1 (0.9%) |
| Bachelor's Degree or higher | 53 (93.0%) | 0 (0.0%) |
| Total | 245 (66.4%) | 9 (2.4%) |
Employment Occupations by Sex in Holly Pond
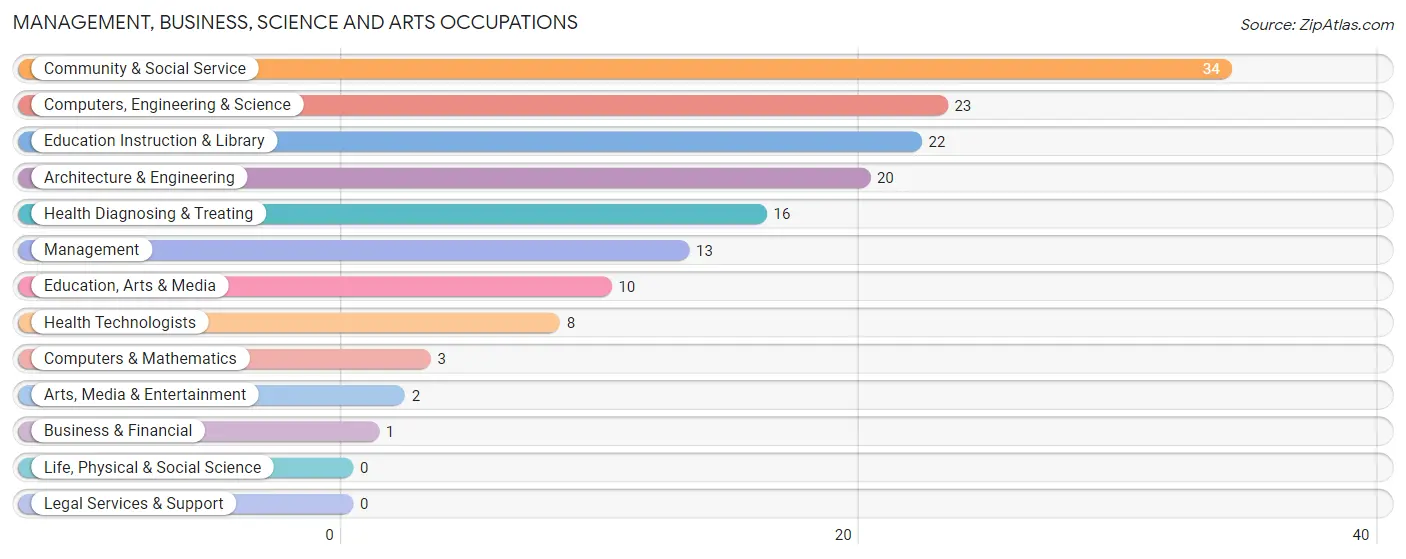
Management, Business, Science and Arts Occupations
The most common Management, Business, Science and Arts occupations in Holly Pond are Community & Social Service (34 | 10.9%), Computers, Engineering & Science (23 | 7.3%), Education Instruction & Library (22 | 7.0%), Architecture & Engineering (20 | 6.4%), and Health Diagnosing & Treating (16 | 5.1%).
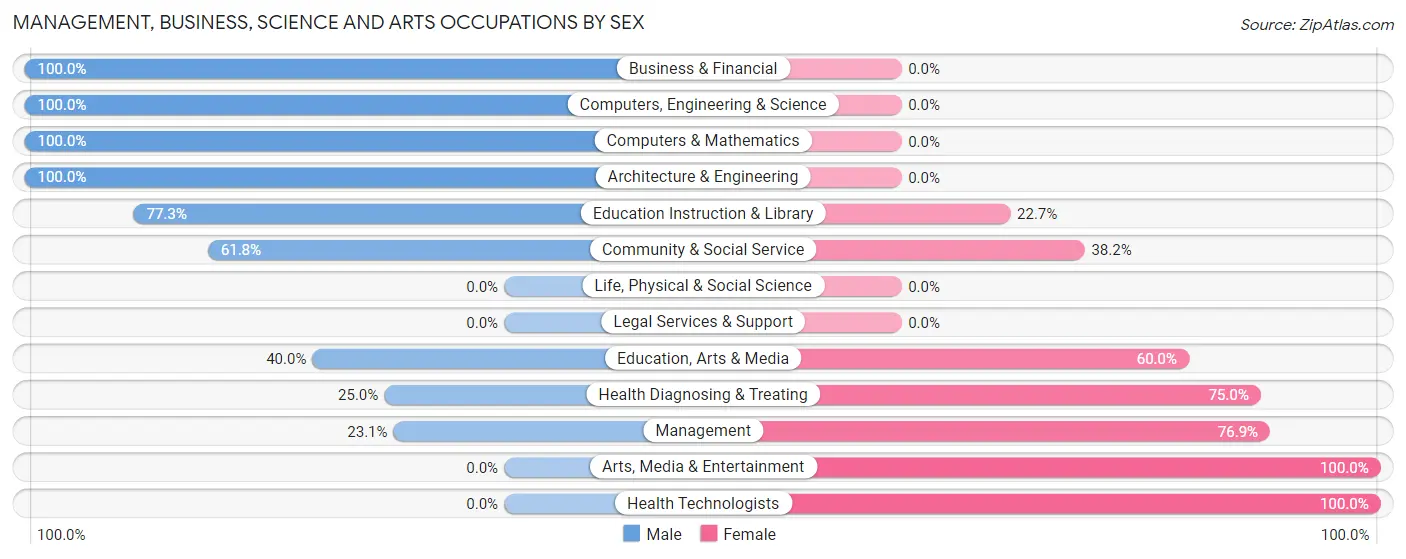
Management, Business, Science and Arts Occupations by Sex
Within the Management, Business, Science and Arts occupations in Holly Pond, the most male-oriented occupations are Business & Financial (100.0%), Computers, Engineering & Science (100.0%), and Computers & Mathematics (100.0%), while the most female-oriented occupations are Arts, Media & Entertainment (100.0%), Health Technologists (100.0%), and Management (76.9%).
| Occupation | Male | Female |
| Management | 3 (23.1%) | 10 (76.9%) |
| Business & Financial | 1 (100.0%) | 0 (0.0%) |
| Computers, Engineering & Science | 23 (100.0%) | 0 (0.0%) |
| Computers & Mathematics | 3 (100.0%) | 0 (0.0%) |
| Architecture & Engineering | 20 (100.0%) | 0 (0.0%) |
| Life, Physical & Social Science | 0 (0.0%) | 0 (0.0%) |
| Community & Social Service | 21 (61.8%) | 13 (38.2%) |
| Education, Arts & Media | 4 (40.0%) | 6 (60.0%) |
| Legal Services & Support | 0 (0.0%) | 0 (0.0%) |
| Education Instruction & Library | 17 (77.3%) | 5 (22.7%) |
| Arts, Media & Entertainment | 0 (0.0%) | 2 (100.0%) |
| Health Diagnosing & Treating | 4 (25.0%) | 12 (75.0%) |
| Health Technologists | 0 (0.0%) | 8 (100.0%) |
| Total (Category) | 52 (59.8%) | 35 (40.2%) |
| Total (Overall) | 177 (56.6%) | 136 (43.4%) |
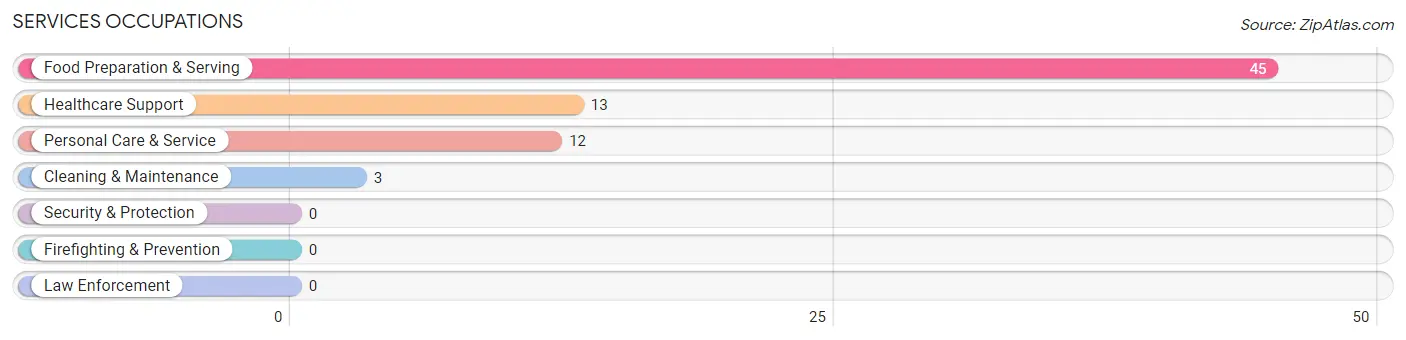
Services Occupations
The most common Services occupations in Holly Pond are Food Preparation & Serving (45 | 14.4%), Healthcare Support (13 | 4.2%), Personal Care & Service (12 | 3.8%), and Cleaning & Maintenance (3 | 1.0%).
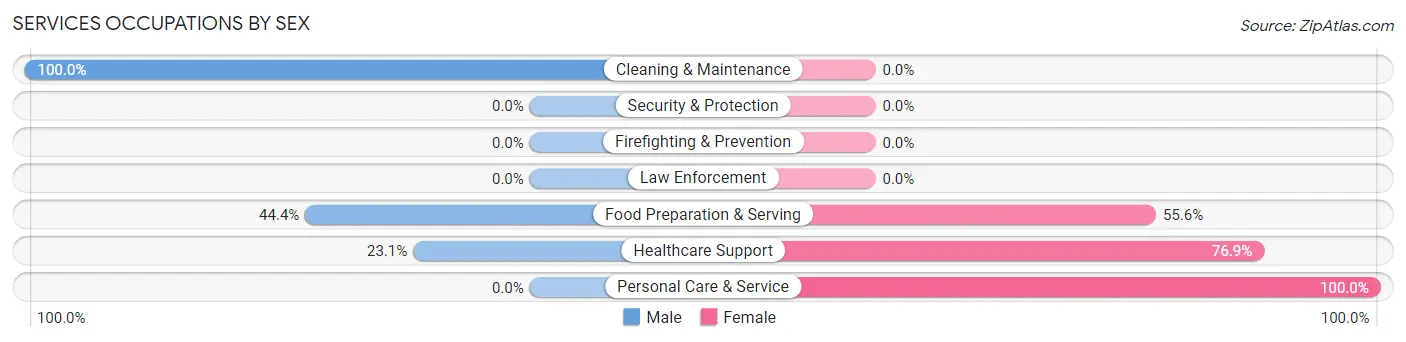
Services Occupations by Sex
Within the Services occupations in Holly Pond, the most male-oriented occupations are Cleaning & Maintenance (100.0%), Food Preparation & Serving (44.4%), and Healthcare Support (23.1%), while the most female-oriented occupations are Personal Care & Service (100.0%), Healthcare Support (76.9%), and Food Preparation & Serving (55.6%).
| Occupation | Male | Female |
| Healthcare Support | 3 (23.1%) | 10 (76.9%) |
| Security & Protection | 0 (0.0%) | 0 (0.0%) |
| Firefighting & Prevention | 0 (0.0%) | 0 (0.0%) |
| Law Enforcement | 0 (0.0%) | 0 (0.0%) |
| Food Preparation & Serving | 20 (44.4%) | 25 (55.6%) |
| Cleaning & Maintenance | 3 (100.0%) | 0 (0.0%) |
| Personal Care & Service | 0 (0.0%) | 12 (100.0%) |
| Total (Category) | 26 (35.6%) | 47 (64.4%) |
| Total (Overall) | 177 (56.6%) | 136 (43.4%) |
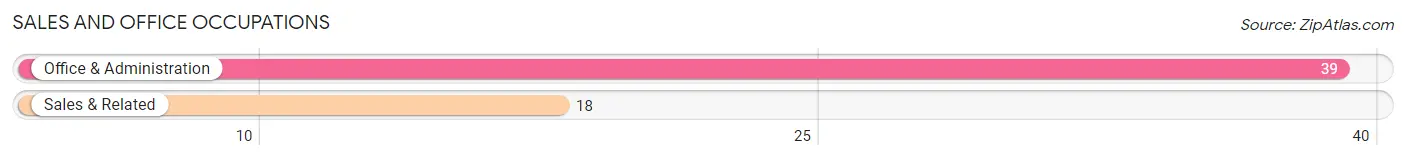
Sales and Office Occupations
The most common Sales and Office occupations in Holly Pond are Office & Administration (39 | 12.5%), and Sales & Related (18 | 5.8%).
Sales and Office Occupations by Sex
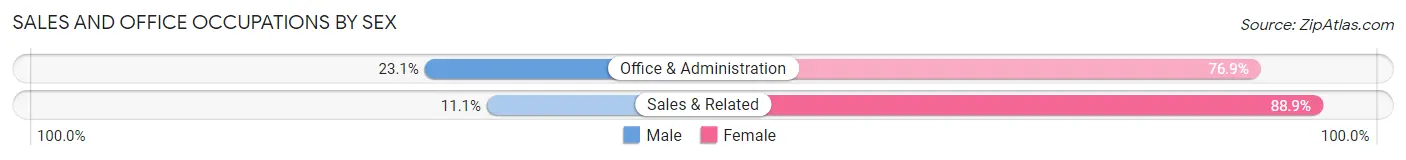
| Occupation | Male | Female |
| Sales & Related | 2 (11.1%) | 16 (88.9%) |
| Office & Administration | 9 (23.1%) | 30 (76.9%) |
| Total (Category) | 11 (19.3%) | 46 (80.7%) |
| Total (Overall) | 177 (56.6%) | 136 (43.4%) |
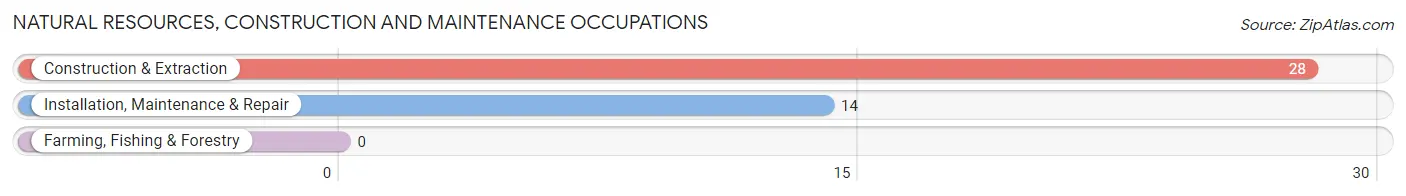
Natural Resources, Construction and Maintenance Occupations
The most common Natural Resources, Construction and Maintenance occupations in Holly Pond are Construction & Extraction (28 | 8.9%), and Installation, Maintenance & Repair (14 | 4.5%).
Natural Resources, Construction and Maintenance Occupations by Sex
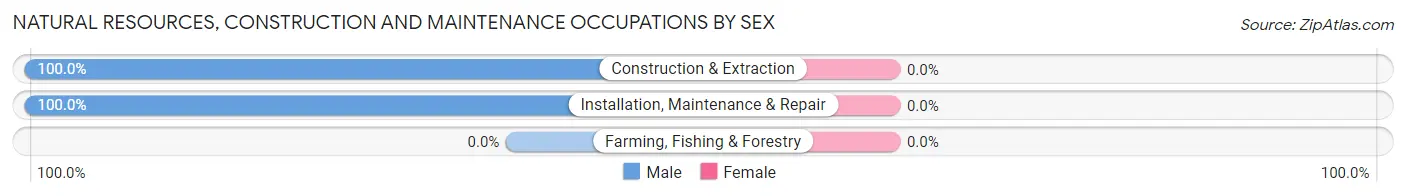
| Occupation | Male | Female |
| Farming, Fishing & Forestry | 0 (0.0%) | 0 (0.0%) |
| Construction & Extraction | 28 (100.0%) | 0 (0.0%) |
| Installation, Maintenance & Repair | 14 (100.0%) | 0 (0.0%) |
| Total (Category) | 42 (100.0%) | 0 (0.0%) |
| Total (Overall) | 177 (56.6%) | 136 (43.4%) |
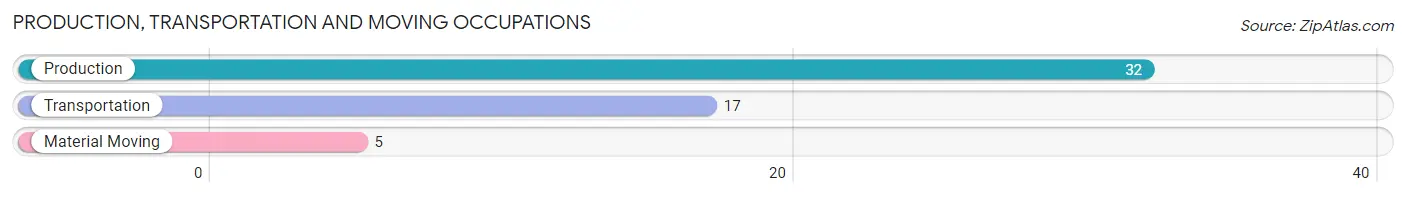
Production, Transportation and Moving Occupations
The most common Production, Transportation and Moving occupations in Holly Pond are Production (32 | 10.2%), Transportation (17 | 5.4%), and Material Moving (5 | 1.6%).
Production, Transportation and Moving Occupations by Sex
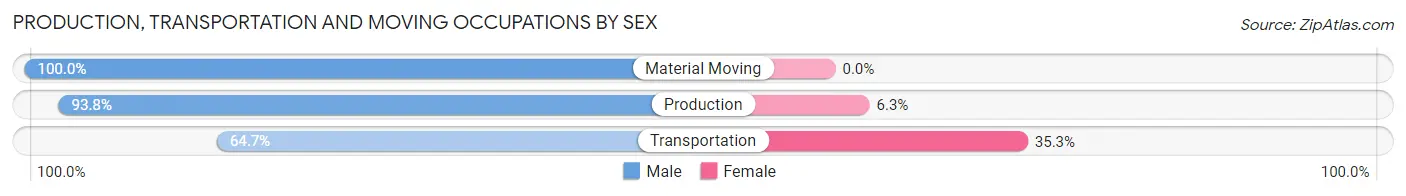
| Occupation | Male | Female |
| Production | 30 (93.8%) | 2 (6.2%) |
| Transportation | 11 (64.7%) | 6 (35.3%) |
| Material Moving | 5 (100.0%) | 0 (0.0%) |
| Total (Category) | 46 (85.2%) | 8 (14.8%) |
| Total (Overall) | 177 (56.6%) | 136 (43.4%) |
Employment Industries by Sex in Holly Pond
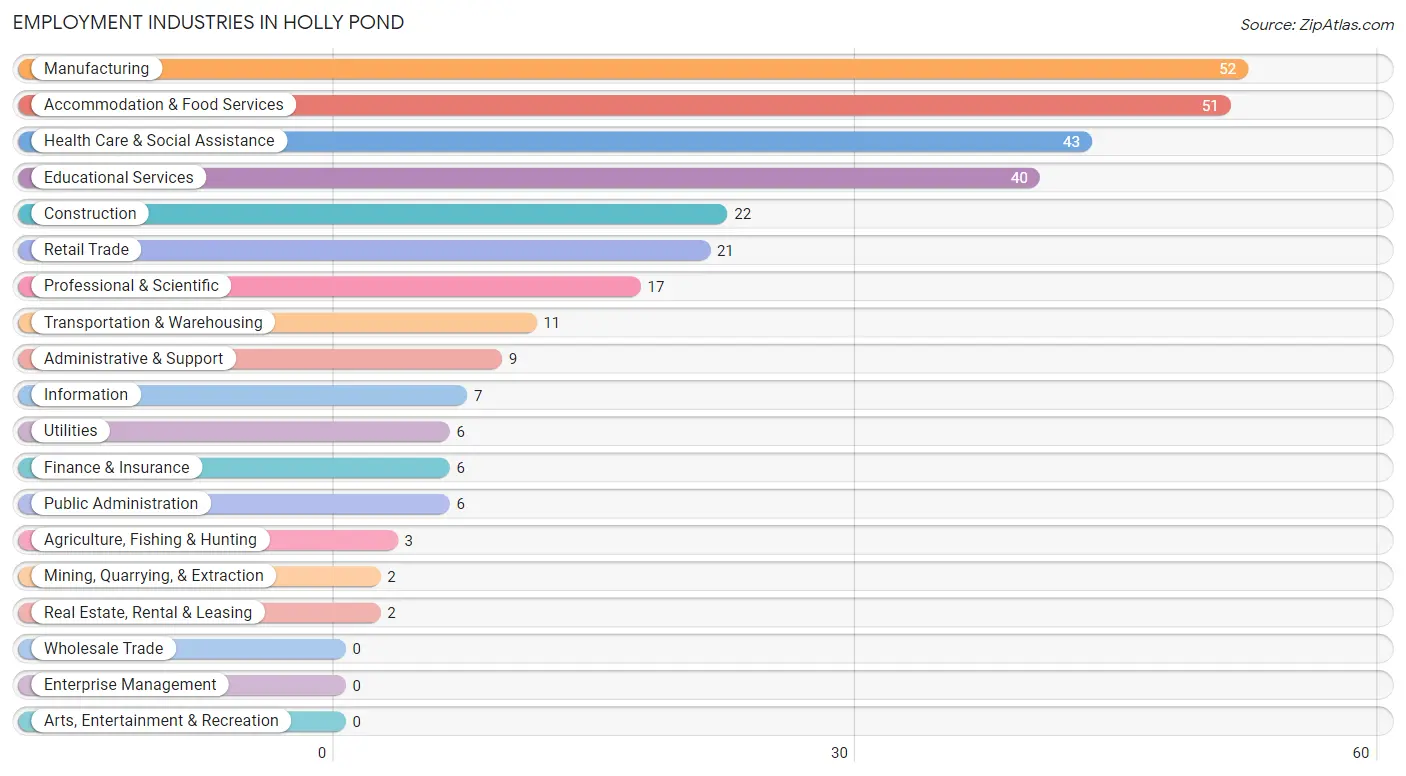
Employment Industries in Holly Pond
The major employment industries in Holly Pond include Manufacturing (52 | 16.6%), Accommodation & Food Services (51 | 16.3%), Health Care & Social Assistance (43 | 13.7%), Educational Services (40 | 12.8%), and Construction (22 | 7.0%).
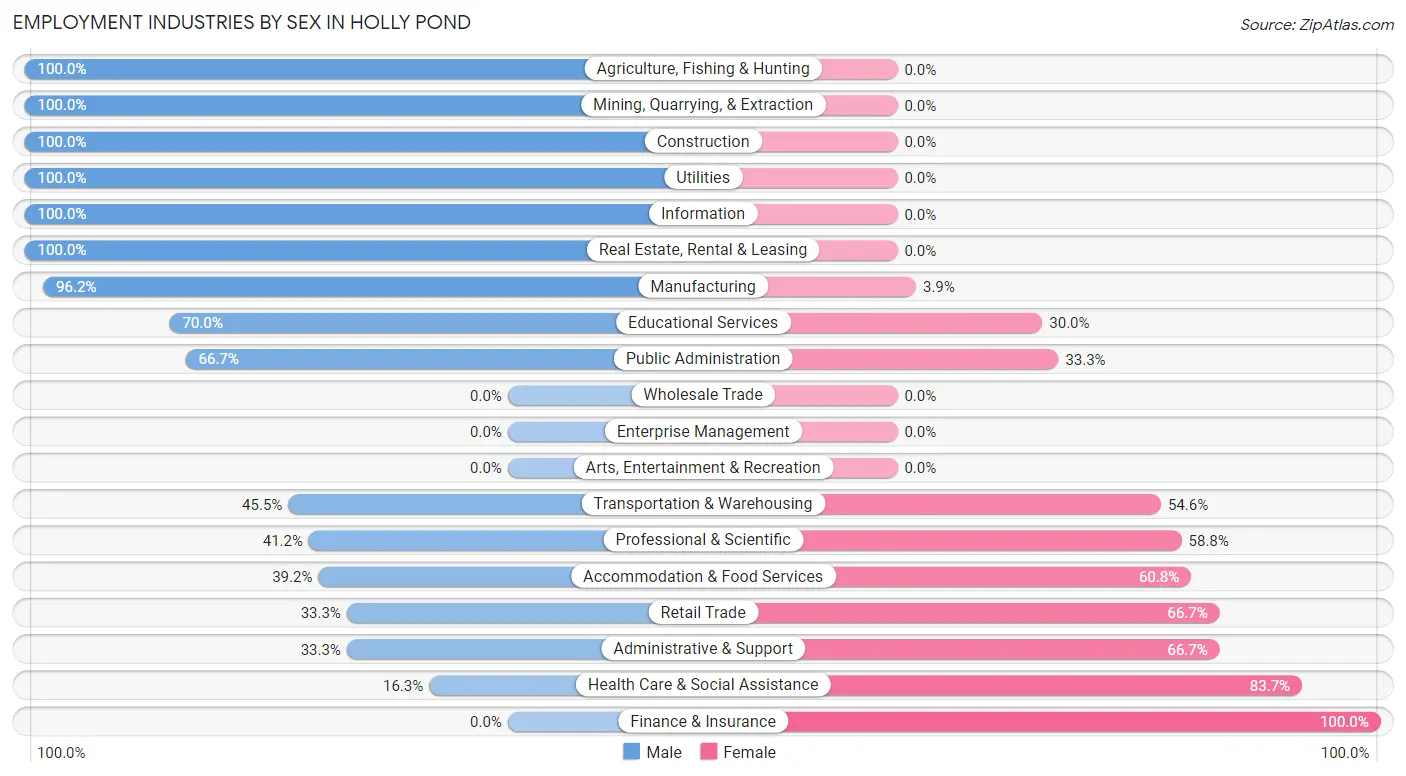
Employment Industries by Sex in Holly Pond
The Holly Pond industries that see more men than women are Agriculture, Fishing & Hunting (100.0%), Mining, Quarrying, & Extraction (100.0%), and Construction (100.0%), whereas the industries that tend to have a higher number of women are Finance & Insurance (100.0%), Health Care & Social Assistance (83.7%), and Retail Trade (66.7%).
| Industry | Male | Female |
| Agriculture, Fishing & Hunting | 3 (100.0%) | 0 (0.0%) |
| Mining, Quarrying, & Extraction | 2 (100.0%) | 0 (0.0%) |
| Construction | 22 (100.0%) | 0 (0.0%) |
| Manufacturing | 50 (96.2%) | 2 (3.8%) |
| Wholesale Trade | 0 (0.0%) | 0 (0.0%) |
| Retail Trade | 7 (33.3%) | 14 (66.7%) |
| Transportation & Warehousing | 5 (45.5%) | 6 (54.5%) |
| Utilities | 6 (100.0%) | 0 (0.0%) |
| Information | 7 (100.0%) | 0 (0.0%) |
| Finance & Insurance | 0 (0.0%) | 6 (100.0%) |
| Real Estate, Rental & Leasing | 2 (100.0%) | 0 (0.0%) |
| Professional & Scientific | 7 (41.2%) | 10 (58.8%) |
| Enterprise Management | 0 (0.0%) | 0 (0.0%) |
| Administrative & Support | 3 (33.3%) | 6 (66.7%) |
| Educational Services | 28 (70.0%) | 12 (30.0%) |
| Health Care & Social Assistance | 7 (16.3%) | 36 (83.7%) |
| Arts, Entertainment & Recreation | 0 (0.0%) | 0 (0.0%) |
| Accommodation & Food Services | 20 (39.2%) | 31 (60.8%) |
| Public Administration | 4 (66.7%) | 2 (33.3%) |
| Total | 177 (56.6%) | 136 (43.4%) |
Education in Holly Pond
School Enrollment in Holly Pond
The most common levels of schooling among the 157 students in Holly Pond are elementary school (48 | 30.6%), high school (32 | 20.4%), and middle school (30 | 19.1%).
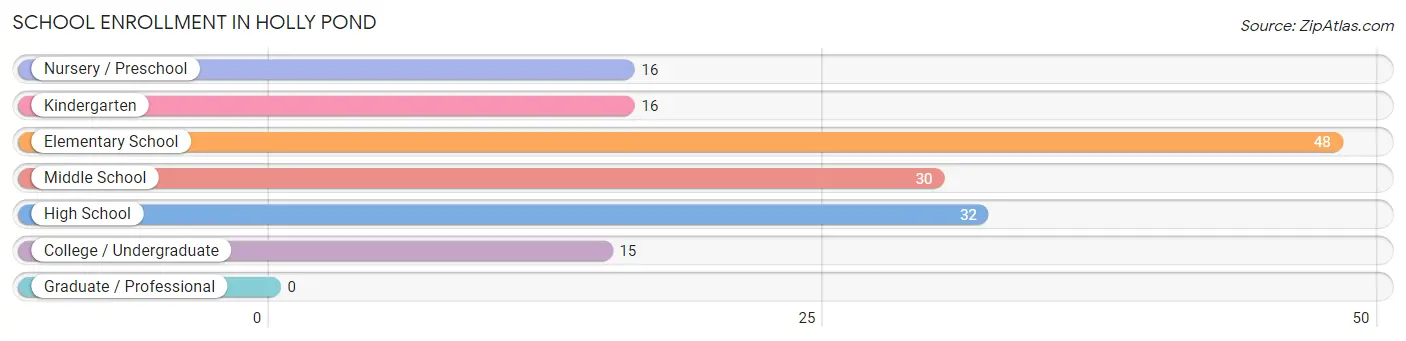
| School Level | # Students | % Students |
| Nursery / Preschool | 16 | 10.2% |
| Kindergarten | 16 | 10.2% |
| Elementary School | 48 | 30.6% |
| Middle School | 30 | 19.1% |
| High School | 32 | 20.4% |
| College / Undergraduate | 15 | 9.6% |
| Graduate / Professional | 0 | 0.0% |
| Total | 157 | 100.0% |
School Enrollment by Age by Funding Source in Holly Pond
Out of a total of 157 students who are enrolled in schools in Holly Pond, 30 (19.1%) attend a private institution, while the remaining 127 (80.9%) are enrolled in public schools. The age group of 5 to 9 year old has the highest likelihood of being enrolled in private schools, with 23 (40.4% in the age bracket) enrolled. Conversely, the age group of 10 to 14 year olds has the lowest likelihood of being enrolled in a private school, with 41 (100.0% in the age bracket) attending a public institution.
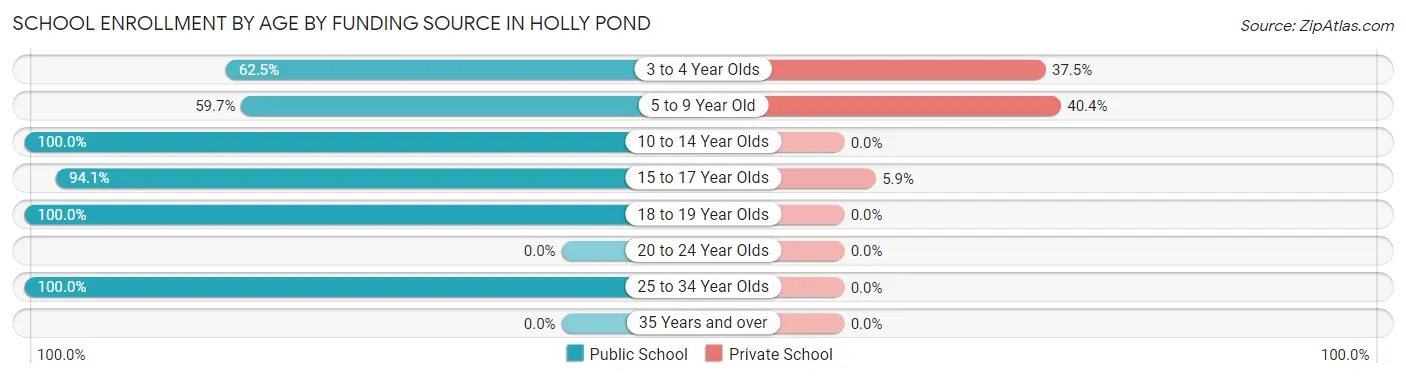
| Age Bracket | Public School | Private School |
| 3 to 4 Year Olds | 10 (62.5%) | 6 (37.5%) |
| 5 to 9 Year Old | 34 (59.7%) | 23 (40.4%) |
| 10 to 14 Year Olds | 41 (100.0%) | 0 (0.0%) |
| 15 to 17 Year Olds | 16 (94.1%) | 1 (5.9%) |
| 18 to 19 Year Olds | 23 (100.0%) | 0 (0.0%) |
| 20 to 24 Year Olds | 0 (0.0%) | 0 (0.0%) |
| 25 to 34 Year Olds | 3 (100.0%) | 0 (0.0%) |
| 35 Years and over | 0 (0.0%) | 0 (0.0%) |
| Total | 127 (80.9%) | 30 (19.1%) |
Educational Attainment by Field of Study in Holly Pond
Engineering (17 | 25.0%), education (12 | 17.6%), psychology (8 | 11.8%), business (8 | 11.8%), and science & technology (6 | 8.8%) are the most common fields of study among 68 individuals in Holly Pond who have obtained a bachelor's degree or higher.
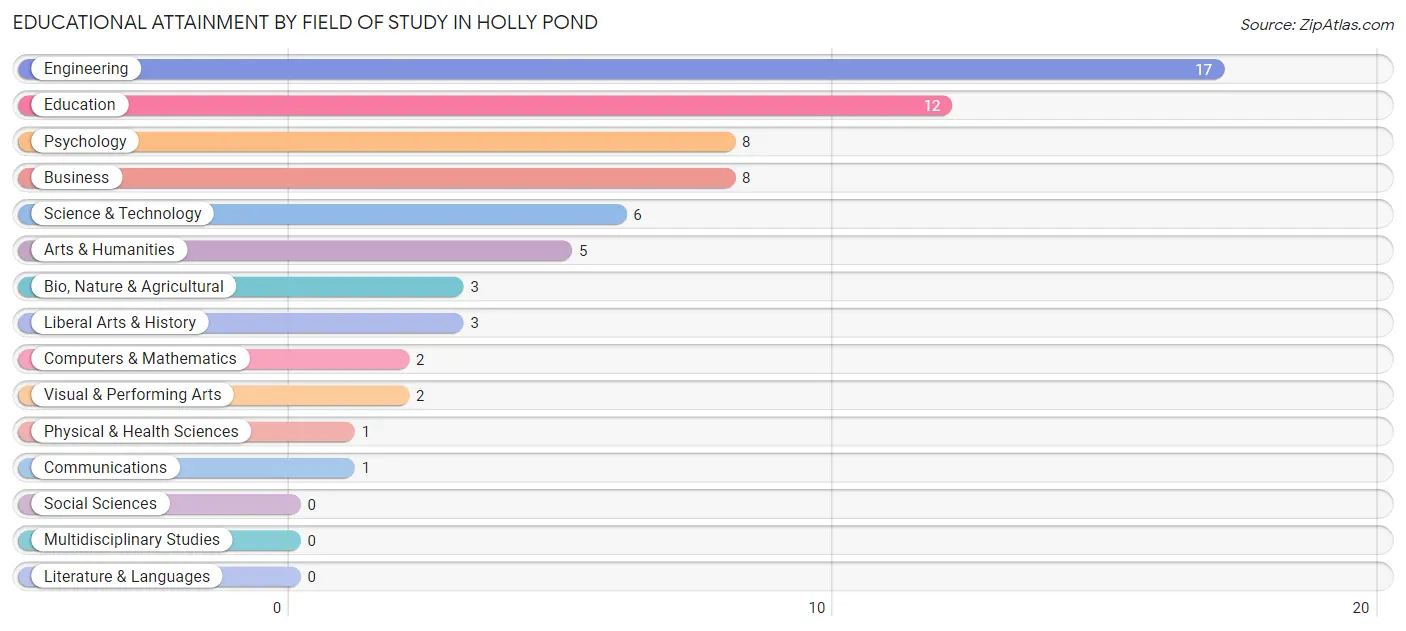
| Field of Study | # Graduates | % Graduates |
| Computers & Mathematics | 2 | 2.9% |
| Bio, Nature & Agricultural | 3 | 4.4% |
| Physical & Health Sciences | 1 | 1.5% |
| Psychology | 8 | 11.8% |
| Social Sciences | 0 | 0.0% |
| Engineering | 17 | 25.0% |
| Multidisciplinary Studies | 0 | 0.0% |
| Science & Technology | 6 | 8.8% |
| Business | 8 | 11.8% |
| Education | 12 | 17.6% |
| Literature & Languages | 0 | 0.0% |
| Liberal Arts & History | 3 | 4.4% |
| Visual & Performing Arts | 2 | 2.9% |
| Communications | 1 | 1.5% |
| Arts & Humanities | 5 | 7.3% |
| Total | 68 | 100.0% |
Transportation & Commute in Holly Pond
Vehicle Availability by Sex in Holly Pond
The most prevalent vehicle ownership categories in Holly Pond are males with 3 vehicles (56, accounting for 31.6%) and females with 3 vehicles (44, making up 42.7%).
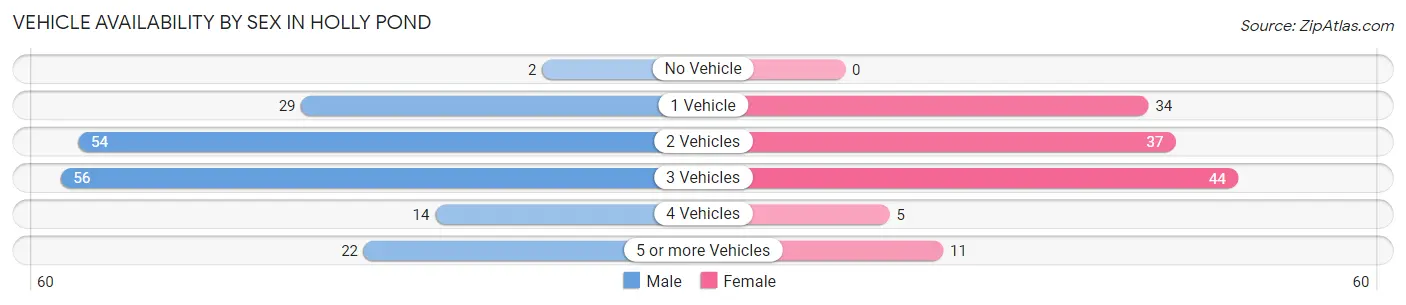
| Vehicles Available | Male | Female |
| No Vehicle | 2 (1.1%) | 0 (0.0%) |
| 1 Vehicle | 29 (16.4%) | 34 (26.0%) |
| 2 Vehicles | 54 (30.5%) | 37 (28.2%) |
| 3 Vehicles | 56 (31.6%) | 44 (33.6%) |
| 4 Vehicles | 14 (7.9%) | 5 (3.8%) |
| 5 or more Vehicles | 22 (12.4%) | 11 (8.4%) |
| Total | 177 (100.0%) | 131 (100.0%) |
Commute Time in Holly Pond
The most frequently occuring commute durations in Holly Pond are 30 to 34 minutes (64 commuters, 22.5%), 20 to 24 minutes (59 commuters, 20.7%), and 15 to 19 minutes (52 commuters, 18.2%).
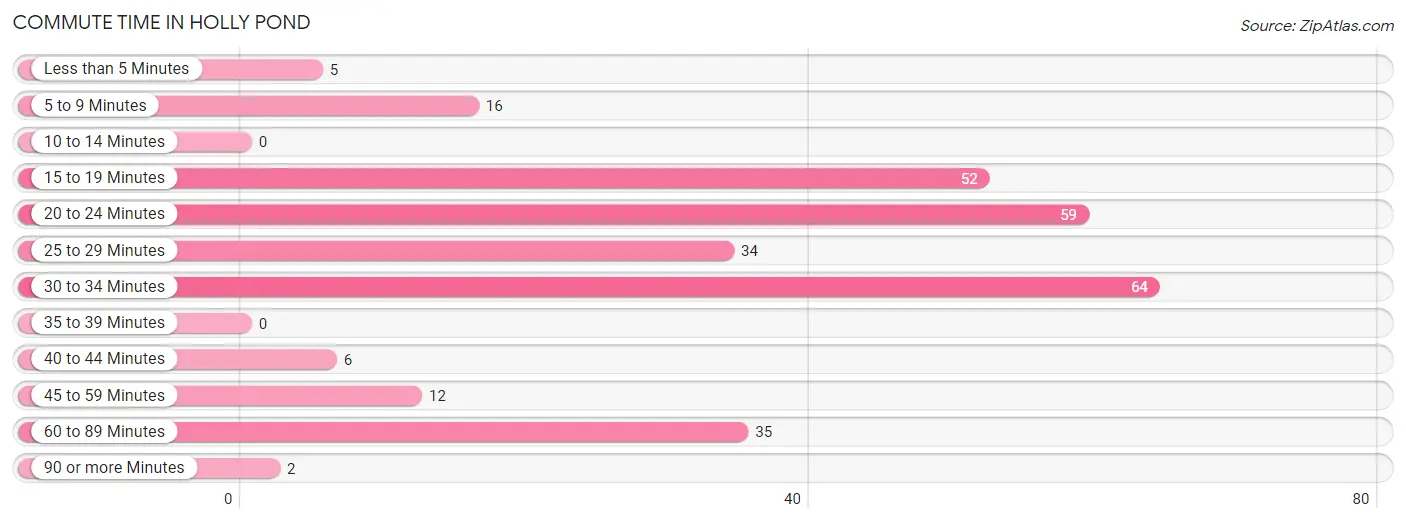
| Commute Time | # Commuters | % Commuters |
| Less than 5 Minutes | 5 | 1.8% |
| 5 to 9 Minutes | 16 | 5.6% |
| 10 to 14 Minutes | 0 | 0.0% |
| 15 to 19 Minutes | 52 | 18.2% |
| 20 to 24 Minutes | 59 | 20.7% |
| 25 to 29 Minutes | 34 | 11.9% |
| 30 to 34 Minutes | 64 | 22.5% |
| 35 to 39 Minutes | 0 | 0.0% |
| 40 to 44 Minutes | 6 | 2.1% |
| 45 to 59 Minutes | 12 | 4.2% |
| 60 to 89 Minutes | 35 | 12.3% |
| 90 or more Minutes | 2 | 0.7% |
Commute Time by Sex in Holly Pond
The most common commute times in Holly Pond are 15 to 19 minutes (37 commuters, 23.9%) for males and 30 to 34 minutes (40 commuters, 30.8%) for females.
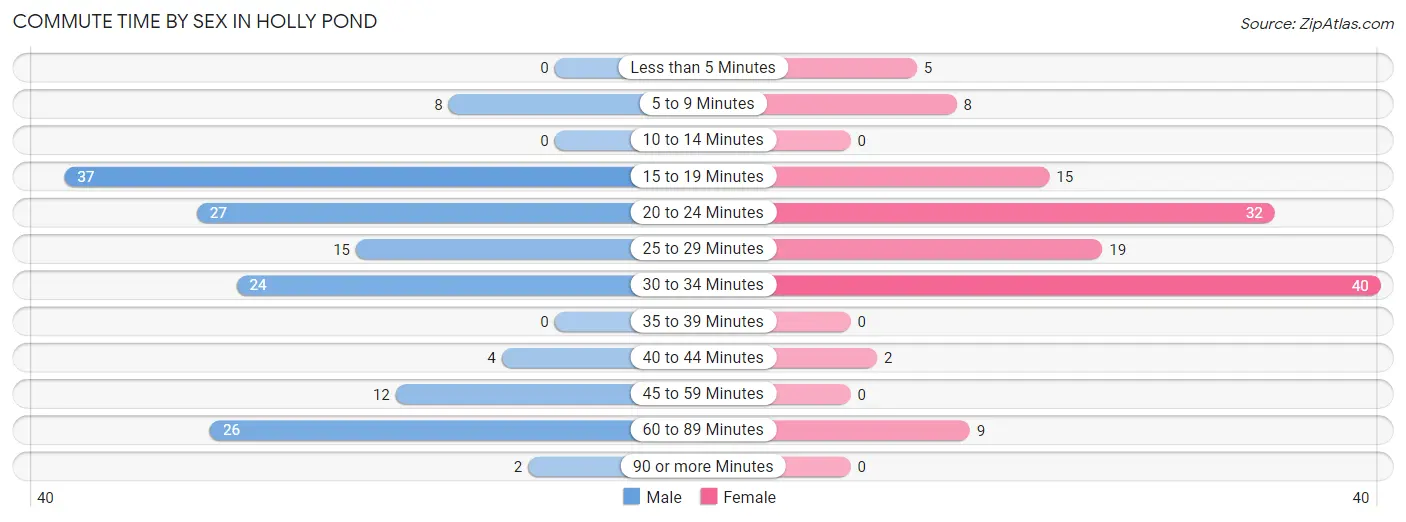
| Commute Time | Male | Female |
| Less than 5 Minutes | 0 (0.0%) | 5 (3.8%) |
| 5 to 9 Minutes | 8 (5.2%) | 8 (6.1%) |
| 10 to 14 Minutes | 0 (0.0%) | 0 (0.0%) |
| 15 to 19 Minutes | 37 (23.9%) | 15 (11.5%) |
| 20 to 24 Minutes | 27 (17.4%) | 32 (24.6%) |
| 25 to 29 Minutes | 15 (9.7%) | 19 (14.6%) |
| 30 to 34 Minutes | 24 (15.5%) | 40 (30.8%) |
| 35 to 39 Minutes | 0 (0.0%) | 0 (0.0%) |
| 40 to 44 Minutes | 4 (2.6%) | 2 (1.5%) |
| 45 to 59 Minutes | 12 (7.7%) | 0 (0.0%) |
| 60 to 89 Minutes | 26 (16.8%) | 9 (6.9%) |
| 90 or more Minutes | 2 (1.3%) | 0 (0.0%) |
Time of Departure to Work by Sex in Holly Pond
The most frequent times of departure to work in Holly Pond are 5:30 AM to 5:59 AM (36, 23.2%) for males and 7:30 AM to 7:59 AM (29, 22.3%) for females.
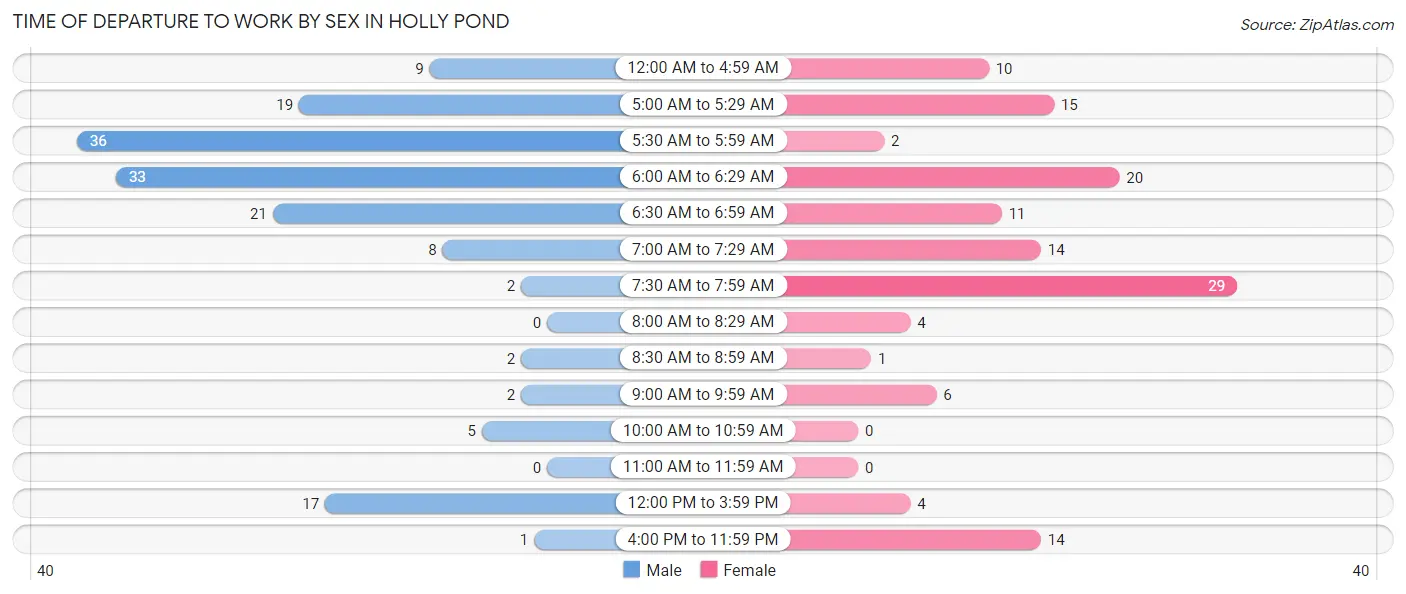
| Time of Departure | Male | Female |
| 12:00 AM to 4:59 AM | 9 (5.8%) | 10 (7.7%) |
| 5:00 AM to 5:29 AM | 19 (12.3%) | 15 (11.5%) |
| 5:30 AM to 5:59 AM | 36 (23.2%) | 2 (1.5%) |
| 6:00 AM to 6:29 AM | 33 (21.3%) | 20 (15.4%) |
| 6:30 AM to 6:59 AM | 21 (13.6%) | 11 (8.5%) |
| 7:00 AM to 7:29 AM | 8 (5.2%) | 14 (10.8%) |
| 7:30 AM to 7:59 AM | 2 (1.3%) | 29 (22.3%) |
| 8:00 AM to 8:29 AM | 0 (0.0%) | 4 (3.1%) |
| 8:30 AM to 8:59 AM | 2 (1.3%) | 1 (0.8%) |
| 9:00 AM to 9:59 AM | 2 (1.3%) | 6 (4.6%) |
| 10:00 AM to 10:59 AM | 5 (3.2%) | 0 (0.0%) |
| 11:00 AM to 11:59 AM | 0 (0.0%) | 0 (0.0%) |
| 12:00 PM to 3:59 PM | 17 (11.0%) | 4 (3.1%) |
| 4:00 PM to 11:59 PM | 1 (0.6%) | 14 (10.8%) |
| Total | 155 (100.0%) | 130 (100.0%) |
Housing Occupancy in Holly Pond
Occupancy by Ownership in Holly Pond
Of the total 274 dwellings in Holly Pond, owner-occupied units account for 162 (59.1%), while renter-occupied units make up 112 (40.9%).
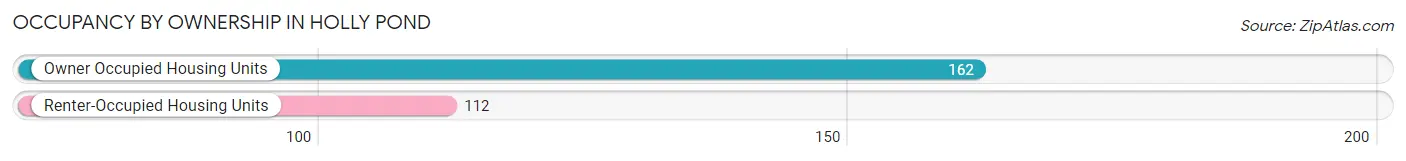
| Occupancy | # Housing Units | % Housing Units |
| Owner Occupied Housing Units | 162 | 59.1% |
| Renter-Occupied Housing Units | 112 | 40.9% |
| Total Occupied Housing Units | 274 | 100.0% |
Occupancy by Household Size in Holly Pond
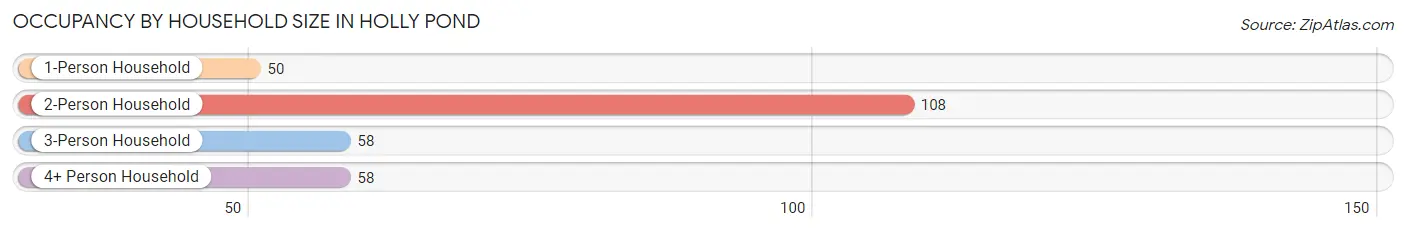
| Household Size | # Housing Units | % Housing Units |
| 1-Person Household | 50 | 18.2% |
| 2-Person Household | 108 | 39.4% |
| 3-Person Household | 58 | 21.2% |
| 4+ Person Household | 58 | 21.2% |
| Total Housing Units | 274 | 100.0% |
Occupancy by Ownership by Household Size in Holly Pond
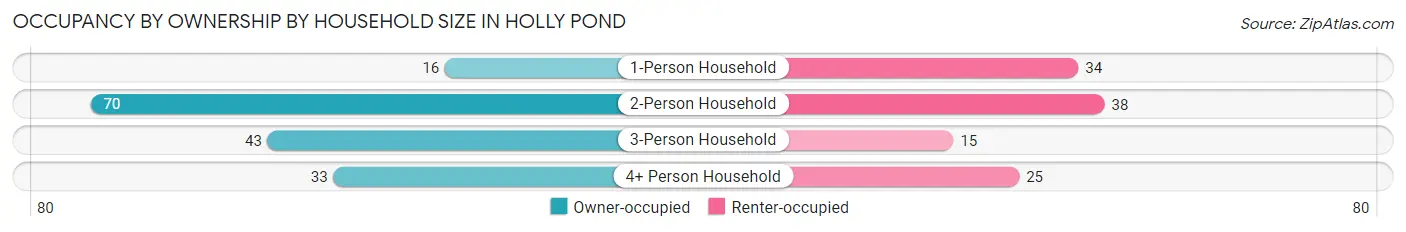
| Household Size | Owner-occupied | Renter-occupied |
| 1-Person Household | 16 (32.0%) | 34 (68.0%) |
| 2-Person Household | 70 (64.8%) | 38 (35.2%) |
| 3-Person Household | 43 (74.1%) | 15 (25.9%) |
| 4+ Person Household | 33 (56.9%) | 25 (43.1%) |
| Total Housing Units | 162 (59.1%) | 112 (40.9%) |
Occupancy by Educational Attainment in Holly Pond
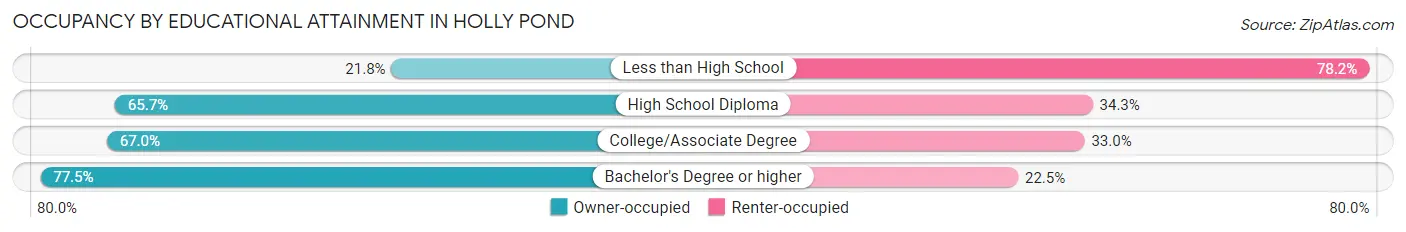
| Household Size | Owner-occupied | Renter-occupied |
| Less than High School | 12 (21.8%) | 43 (78.2%) |
| High School Diploma | 44 (65.7%) | 23 (34.3%) |
| College/Associate Degree | 75 (67.0%) | 37 (33.0%) |
| Bachelor's Degree or higher | 31 (77.5%) | 9 (22.5%) |
Occupancy by Age of Householder in Holly Pond
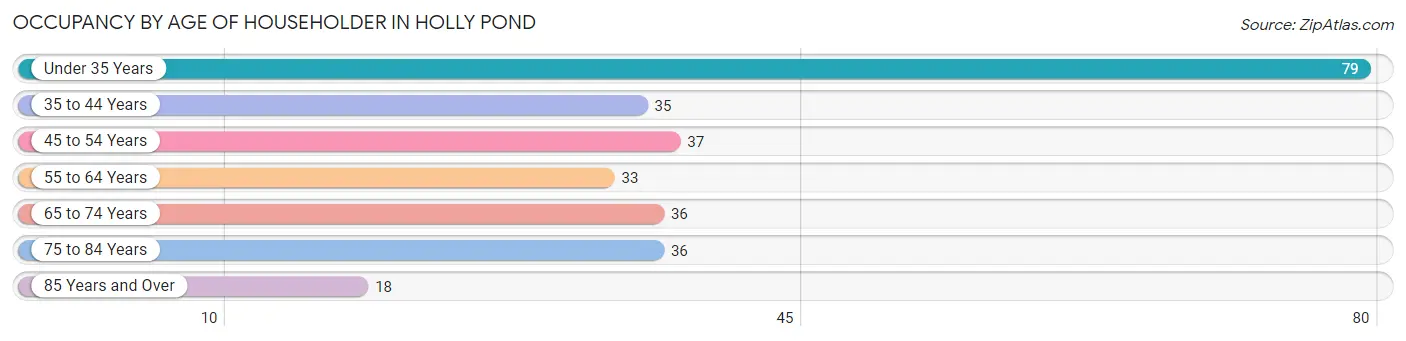
| Age Bracket | # Households | % Households |
| Under 35 Years | 79 | 28.8% |
| 35 to 44 Years | 35 | 12.8% |
| 45 to 54 Years | 37 | 13.5% |
| 55 to 64 Years | 33 | 12.0% |
| 65 to 74 Years | 36 | 13.1% |
| 75 to 84 Years | 36 | 13.1% |
| 85 Years and Over | 18 | 6.6% |
| Total | 274 | 100.0% |
Housing Finances in Holly Pond
Median Income by Occupancy in Holly Pond
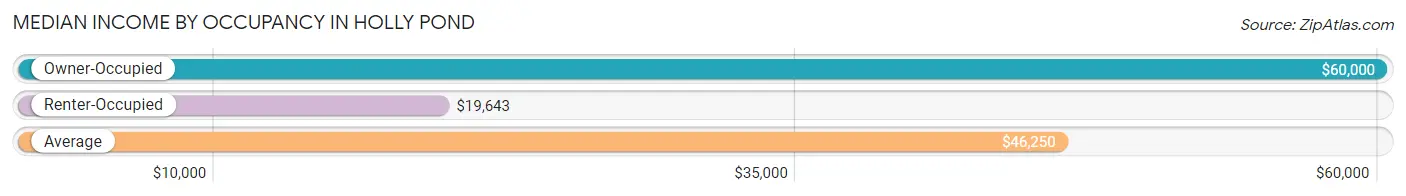
| Occupancy Type | # Households | Median Income |
| Owner-Occupied | 162 (59.1%) | $60,000 |
| Renter-Occupied | 112 (40.9%) | $19,643 |
| Average | 274 (100.0%) | $46,250 |
Occupancy by Householder Income Bracket in Holly Pond
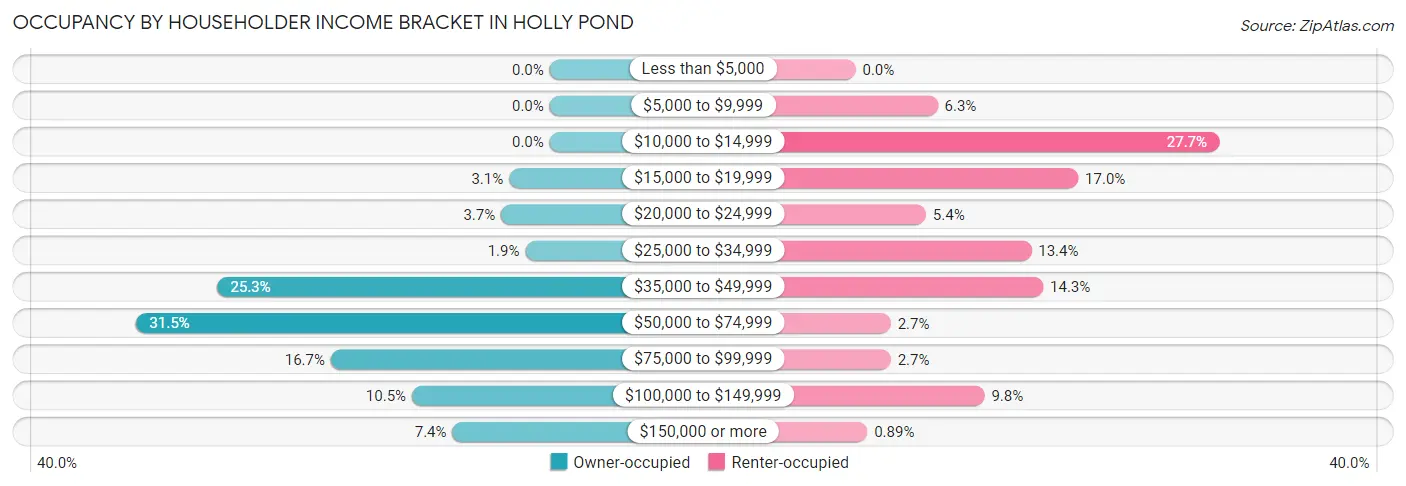
| Income Bracket | Owner-occupied | Renter-occupied |
| Less than $5,000 | 0 (0.0%) | 0 (0.0%) |
| $5,000 to $9,999 | 0 (0.0%) | 7 (6.2%) |
| $10,000 to $14,999 | 0 (0.0%) | 31 (27.7%) |
| $15,000 to $19,999 | 5 (3.1%) | 19 (17.0%) |
| $20,000 to $24,999 | 6 (3.7%) | 6 (5.4%) |
| $25,000 to $34,999 | 3 (1.8%) | 15 (13.4%) |
| $35,000 to $49,999 | 41 (25.3%) | 16 (14.3%) |
| $50,000 to $74,999 | 51 (31.5%) | 3 (2.7%) |
| $75,000 to $99,999 | 27 (16.7%) | 3 (2.7%) |
| $100,000 to $149,999 | 17 (10.5%) | 11 (9.8%) |
| $150,000 or more | 12 (7.4%) | 1 (0.9%) |
| Total | 162 (100.0%) | 112 (100.0%) |
Monthly Housing Cost Tiers in Holly Pond
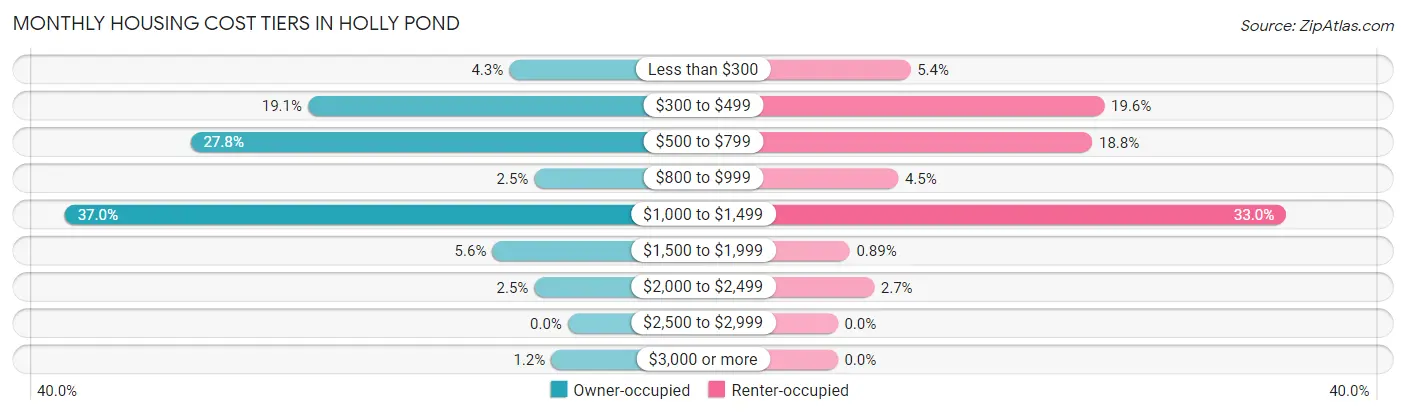
| Monthly Cost | Owner-occupied | Renter-occupied |
| Less than $300 | 7 (4.3%) | 6 (5.4%) |
| $300 to $499 | 31 (19.1%) | 22 (19.6%) |
| $500 to $799 | 45 (27.8%) | 21 (18.8%) |
| $800 to $999 | 4 (2.5%) | 5 (4.5%) |
| $1,000 to $1,499 | 60 (37.0%) | 37 (33.0%) |
| $1,500 to $1,999 | 9 (5.6%) | 1 (0.9%) |
| $2,000 to $2,499 | 4 (2.5%) | 3 (2.7%) |
| $2,500 to $2,999 | 0 (0.0%) | 0 (0.0%) |
| $3,000 or more | 2 (1.2%) | 0 (0.0%) |
| Total | 162 (100.0%) | 112 (100.0%) |
Physical Housing Characteristics in Holly Pond
Housing Structures in Holly Pond
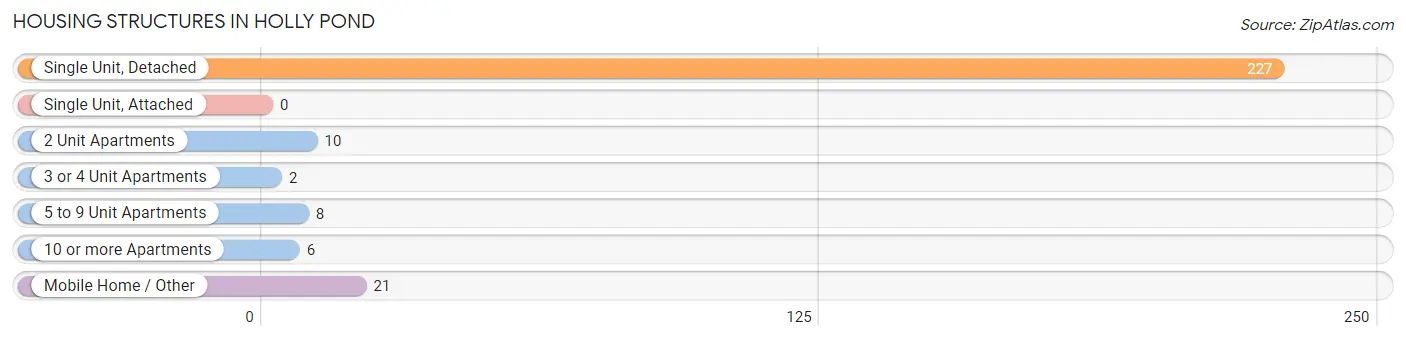
| Structure Type | # Housing Units | % Housing Units |
| Single Unit, Detached | 227 | 82.9% |
| Single Unit, Attached | 0 | 0.0% |
| 2 Unit Apartments | 10 | 3.6% |
| 3 or 4 Unit Apartments | 2 | 0.7% |
| 5 to 9 Unit Apartments | 8 | 2.9% |
| 10 or more Apartments | 6 | 2.2% |
| Mobile Home / Other | 21 | 7.7% |
| Total | 274 | 100.0% |
Housing Structures by Occupancy in Holly Pond
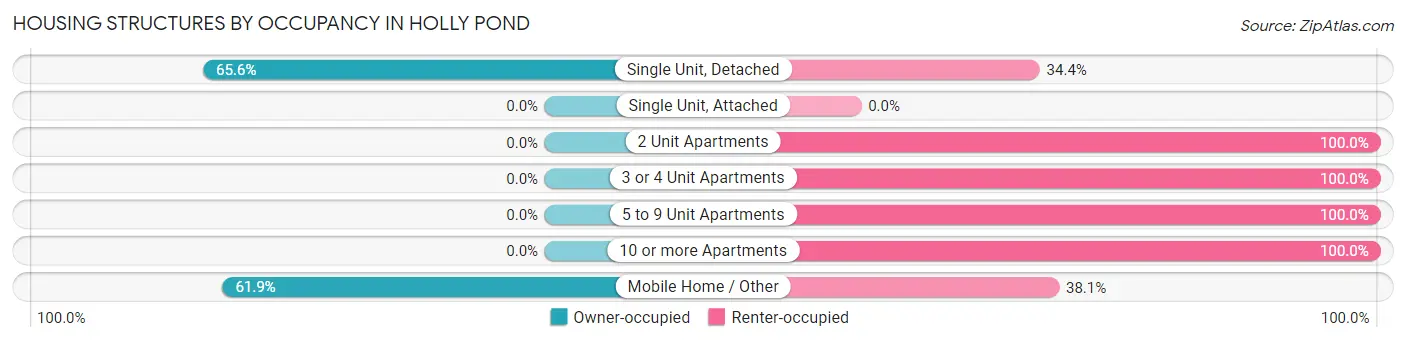
| Structure Type | Owner-occupied | Renter-occupied |
| Single Unit, Detached | 149 (65.6%) | 78 (34.4%) |
| Single Unit, Attached | 0 (0.0%) | 0 (0.0%) |
| 2 Unit Apartments | 0 (0.0%) | 10 (100.0%) |
| 3 or 4 Unit Apartments | 0 (0.0%) | 2 (100.0%) |
| 5 to 9 Unit Apartments | 0 (0.0%) | 8 (100.0%) |
| 10 or more Apartments | 0 (0.0%) | 6 (100.0%) |
| Mobile Home / Other | 13 (61.9%) | 8 (38.1%) |
| Total | 162 (59.1%) | 112 (40.9%) |
Housing Structures by Number of Rooms in Holly Pond
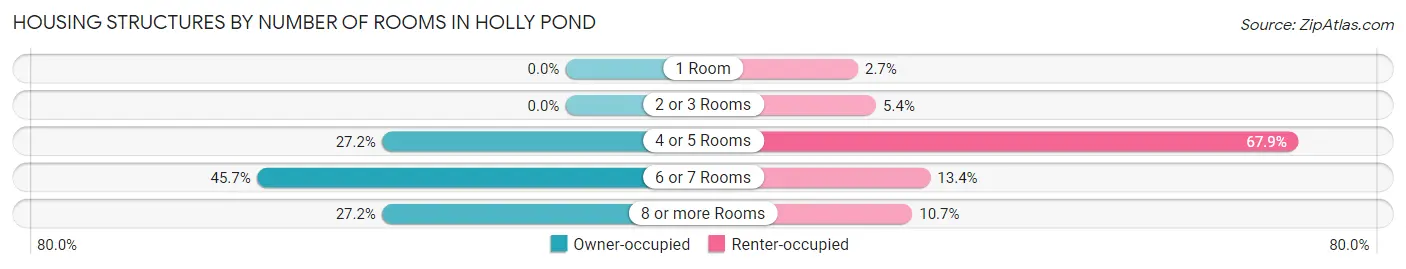
| Number of Rooms | Owner-occupied | Renter-occupied |
| 1 Room | 0 (0.0%) | 3 (2.7%) |
| 2 or 3 Rooms | 0 (0.0%) | 6 (5.4%) |
| 4 or 5 Rooms | 44 (27.2%) | 76 (67.9%) |
| 6 or 7 Rooms | 74 (45.7%) | 15 (13.4%) |
| 8 or more Rooms | 44 (27.2%) | 12 (10.7%) |
| Total | 162 (100.0%) | 112 (100.0%) |
Housing Structure by Heating Type in Holly Pond
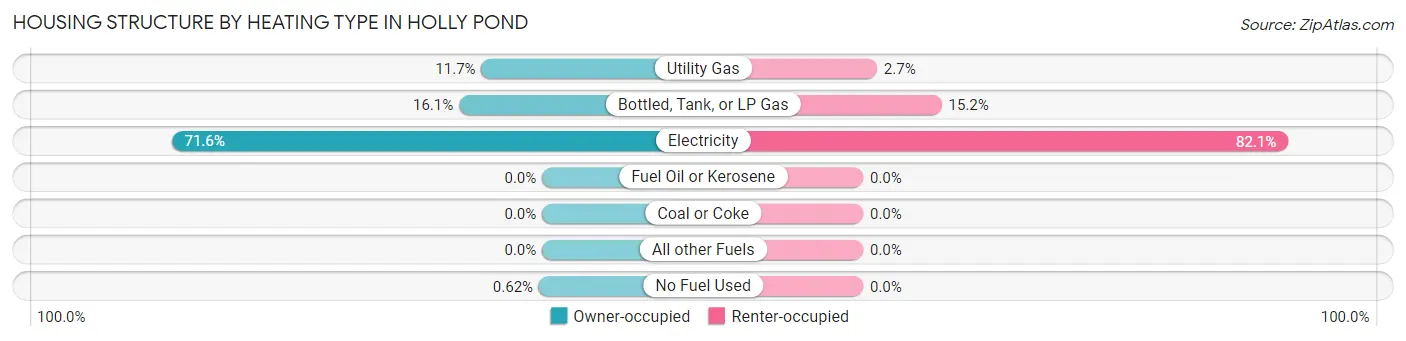
| Heating Type | Owner-occupied | Renter-occupied |
| Utility Gas | 19 (11.7%) | 3 (2.7%) |
| Bottled, Tank, or LP Gas | 26 (16.1%) | 17 (15.2%) |
| Electricity | 116 (71.6%) | 92 (82.1%) |
| Fuel Oil or Kerosene | 0 (0.0%) | 0 (0.0%) |
| Coal or Coke | 0 (0.0%) | 0 (0.0%) |
| All other Fuels | 0 (0.0%) | 0 (0.0%) |
| No Fuel Used | 1 (0.6%) | 0 (0.0%) |
| Total | 162 (100.0%) | 112 (100.0%) |
Household Vehicle Usage in Holly Pond
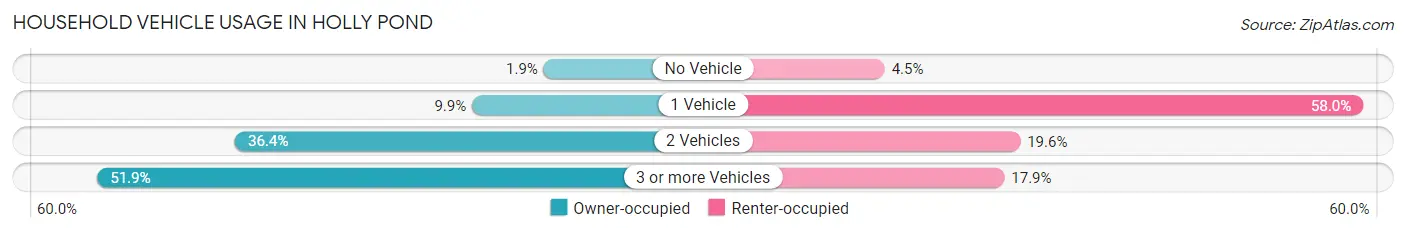
| Vehicles per Household | Owner-occupied | Renter-occupied |
| No Vehicle | 3 (1.8%) | 5 (4.5%) |
| 1 Vehicle | 16 (9.9%) | 65 (58.0%) |
| 2 Vehicles | 59 (36.4%) | 22 (19.6%) |
| 3 or more Vehicles | 84 (51.8%) | 20 (17.9%) |
| Total | 162 (100.0%) | 112 (100.0%) |
Real Estate & Mortgages in Holly Pond
Real Estate and Mortgage Overview in Holly Pond
| Characteristic | Without Mortgage | With Mortgage |
| Housing Units | 82 | 80 |
| Median Property Value | $172,100 | $162,500 |
| Median Household Income | $58,000 | $9 |
| Monthly Housing Costs | $518 | $2 |
| Real Estate Taxes | $375 | $12 |
Property Value by Mortgage Status in Holly Pond
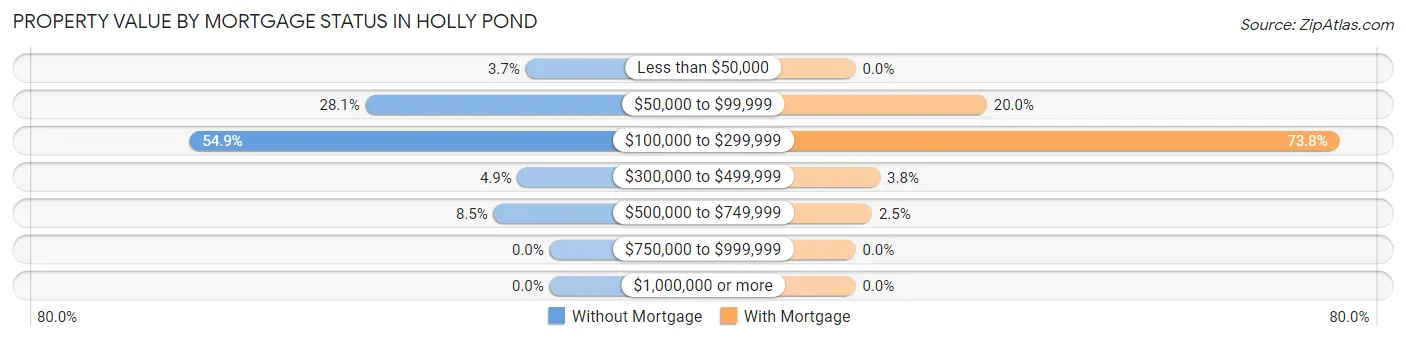
| Property Value | Without Mortgage | With Mortgage |
| Less than $50,000 | 3 (3.7%) | 0 (0.0%) |
| $50,000 to $99,999 | 23 (28.1%) | 16 (20.0%) |
| $100,000 to $299,999 | 45 (54.9%) | 59 (73.8%) |
| $300,000 to $499,999 | 4 (4.9%) | 3 (3.7%) |
| $500,000 to $749,999 | 7 (8.5%) | 2 (2.5%) |
| $750,000 to $999,999 | 0 (0.0%) | 0 (0.0%) |
| $1,000,000 or more | 0 (0.0%) | 0 (0.0%) |
| Total | 82 (100.0%) | 80 (100.0%) |
Household Income by Mortgage Status in Holly Pond
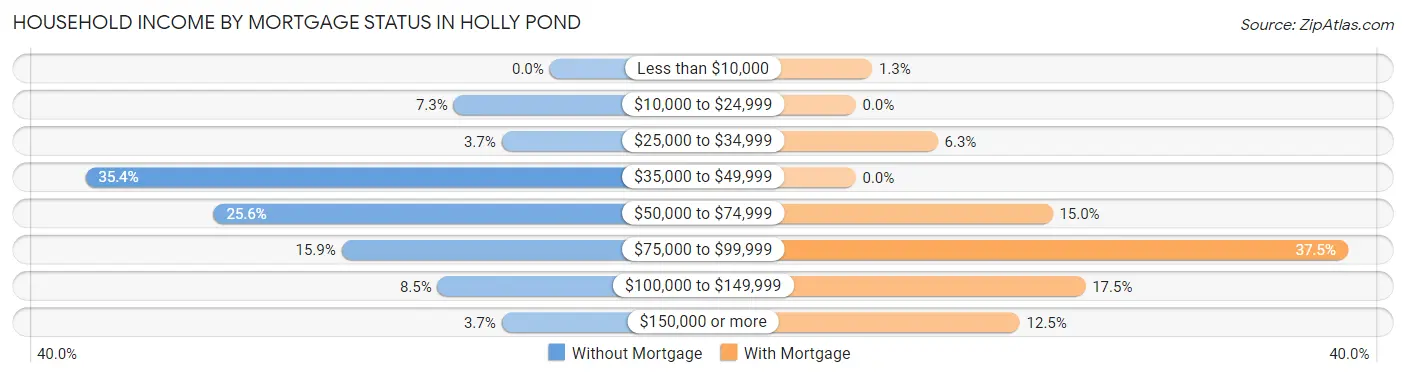
| Household Income | Without Mortgage | With Mortgage |
| Less than $10,000 | 0 (0.0%) | 1 (1.3%) |
| $10,000 to $24,999 | 6 (7.3%) | 0 (0.0%) |
| $25,000 to $34,999 | 3 (3.7%) | 5 (6.2%) |
| $35,000 to $49,999 | 29 (35.4%) | 0 (0.0%) |
| $50,000 to $74,999 | 21 (25.6%) | 12 (15.0%) |
| $75,000 to $99,999 | 13 (15.9%) | 30 (37.5%) |
| $100,000 to $149,999 | 7 (8.5%) | 14 (17.5%) |
| $150,000 or more | 3 (3.7%) | 10 (12.5%) |
| Total | 82 (100.0%) | 80 (100.0%) |
Property Value to Household Income Ratio in Holly Pond
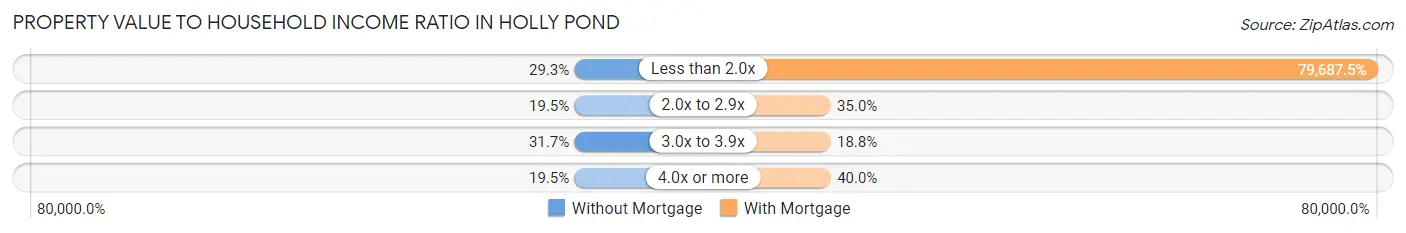
| Value-to-Income Ratio | Without Mortgage | With Mortgage |
| Less than 2.0x | 24 (29.3%) | 63,750 (79,687.5%) |
| 2.0x to 2.9x | 16 (19.5%) | 28 (35.0%) |
| 3.0x to 3.9x | 26 (31.7%) | 15 (18.8%) |
| 4.0x or more | 16 (19.5%) | 32 (40.0%) |
| Total | 82 (100.0%) | 80 (100.0%) |
Real Estate Taxes by Mortgage Status in Holly Pond
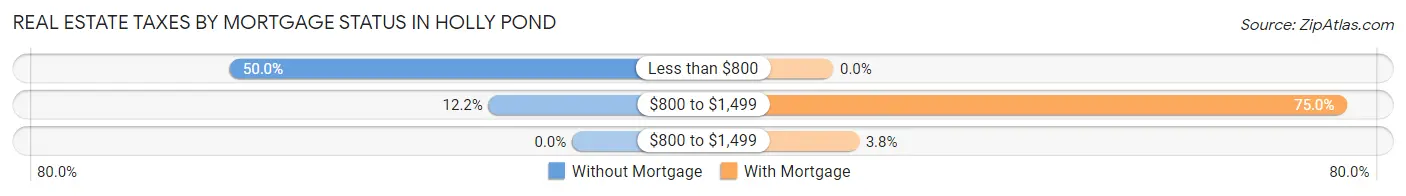
| Property Taxes | Without Mortgage | With Mortgage |
| Less than $800 | 41 (50.0%) | 0 (0.0%) |
| $800 to $1,499 | 10 (12.2%) | 60 (75.0%) |
| $800 to $1,499 | 0 (0.0%) | 3 (3.7%) |
| Total | 82 (100.0%) | 80 (100.0%) |
Health & Disability in Holly Pond
Health Insurance Coverage by Age in Holly Pond
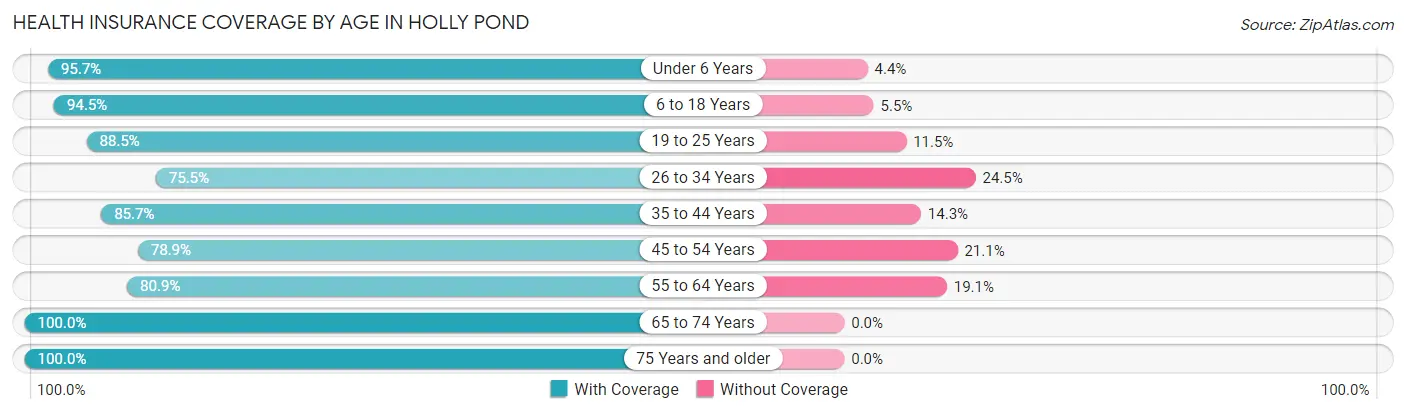
| Age Bracket | With Coverage | Without Coverage |
| Under 6 Years | 66 (95.7%) | 3 (4.3%) |
| 6 to 18 Years | 121 (94.5%) | 7 (5.5%) |
| 19 to 25 Years | 69 (88.5%) | 9 (11.5%) |
| 26 to 34 Years | 71 (75.5%) | 23 (24.5%) |
| 35 to 44 Years | 66 (85.7%) | 11 (14.3%) |
| 45 to 54 Years | 71 (78.9%) | 19 (21.1%) |
| 55 to 64 Years | 55 (80.9%) | 13 (19.1%) |
| 65 to 74 Years | 62 (100.0%) | 0 (0.0%) |
| 75 Years and older | 95 (100.0%) | 0 (0.0%) |
| Total | 676 (88.8%) | 85 (11.2%) |
Health Insurance Coverage by Citizenship Status in Holly Pond
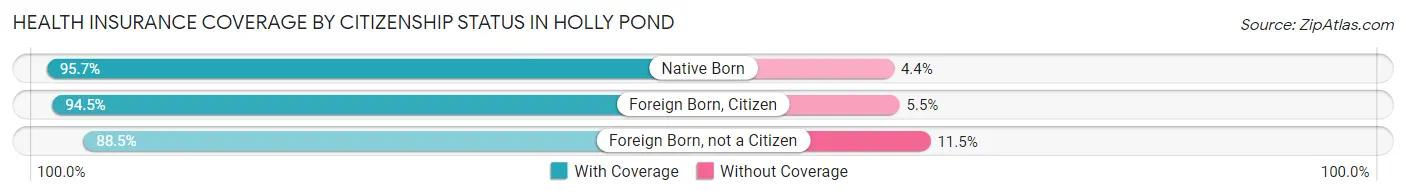
| Citizenship Status | With Coverage | Without Coverage |
| Native Born | 66 (95.7%) | 3 (4.3%) |
| Foreign Born, Citizen | 121 (94.5%) | 7 (5.5%) |
| Foreign Born, not a Citizen | 69 (88.5%) | 9 (11.5%) |
Health Insurance Coverage by Household Income in Holly Pond
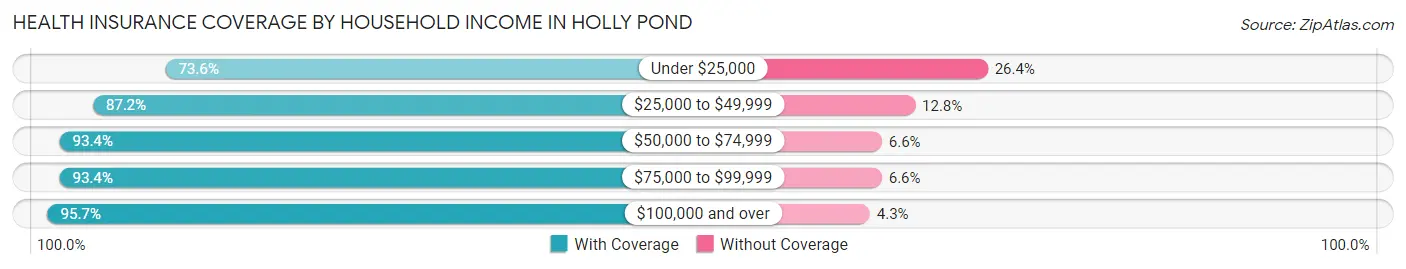
| Household Income | With Coverage | Without Coverage |
| Under $25,000 | 92 (73.6%) | 33 (26.4%) |
| $25,000 to $49,999 | 184 (87.2%) | 27 (12.8%) |
| $50,000 to $74,999 | 128 (93.4%) | 9 (6.6%) |
| $75,000 to $99,999 | 114 (93.4%) | 8 (6.6%) |
| $100,000 and over | 155 (95.7%) | 7 (4.3%) |
Public vs Private Health Insurance Coverage by Age in Holly Pond
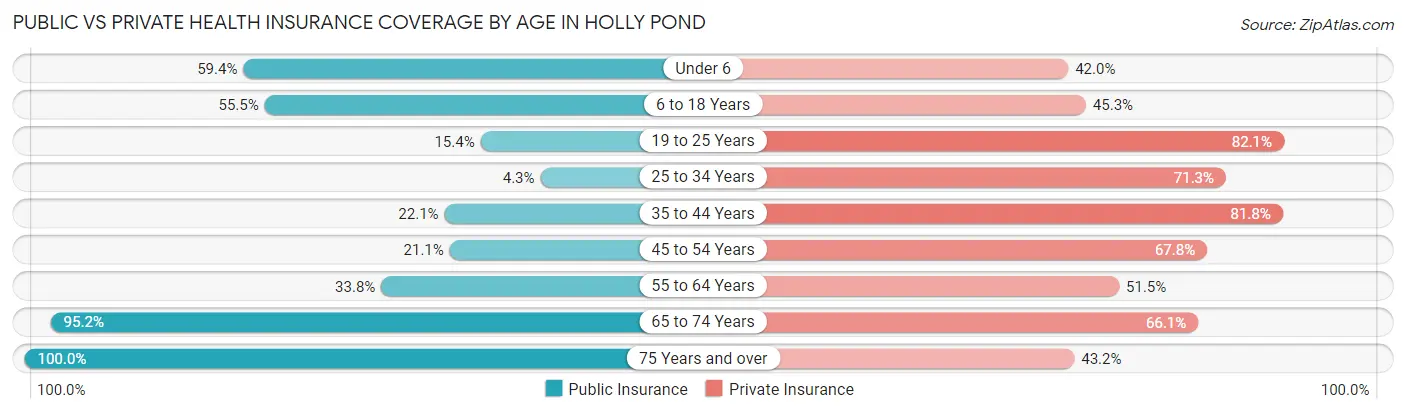
| Age Bracket | Public Insurance | Private Insurance |
| Under 6 | 41 (59.4%) | 29 (42.0%) |
| 6 to 18 Years | 71 (55.5%) | 58 (45.3%) |
| 19 to 25 Years | 12 (15.4%) | 64 (82.1%) |
| 25 to 34 Years | 4 (4.3%) | 67 (71.3%) |
| 35 to 44 Years | 17 (22.1%) | 63 (81.8%) |
| 45 to 54 Years | 19 (21.1%) | 61 (67.8%) |
| 55 to 64 Years | 23 (33.8%) | 35 (51.5%) |
| 65 to 74 Years | 59 (95.2%) | 41 (66.1%) |
| 75 Years and over | 95 (100.0%) | 41 (43.2%) |
| Total | 341 (44.8%) | 459 (60.3%) |
Disability Status by Sex by Age in Holly Pond
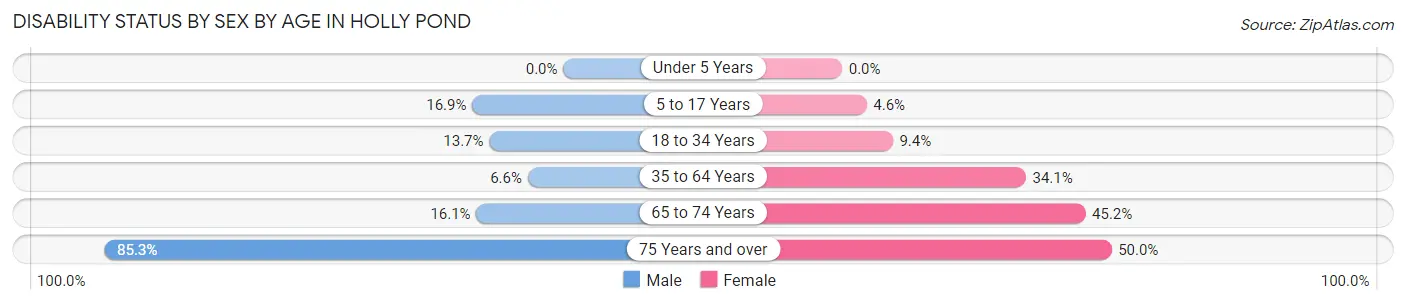
| Age Bracket | Male | Female |
| Under 5 Years | 0 (0.0%) | 0 (0.0%) |
| 5 to 17 Years | 12 (16.9%) | 2 (4.5%) |
| 18 to 34 Years | 14 (13.7%) | 8 (9.4%) |
| 35 to 64 Years | 7 (6.6%) | 44 (34.1%) |
| 65 to 74 Years | 5 (16.1%) | 14 (45.2%) |
| 75 Years and over | 52 (85.3%) | 17 (50.0%) |
Disability Class by Sex by Age in Holly Pond
Disability Class: Hearing Difficulty
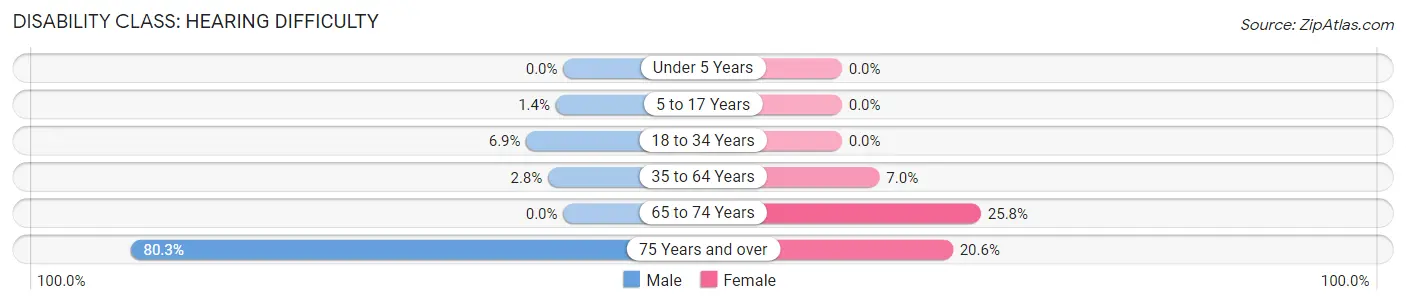
| Age Bracket | Male | Female |
| Under 5 Years | 0 (0.0%) | 0 (0.0%) |
| 5 to 17 Years | 1 (1.4%) | 0 (0.0%) |
| 18 to 34 Years | 7 (6.9%) | 0 (0.0%) |
| 35 to 64 Years | 3 (2.8%) | 9 (7.0%) |
| 65 to 74 Years | 0 (0.0%) | 8 (25.8%) |
| 75 Years and over | 49 (80.3%) | 7 (20.6%) |
Disability Class: Vision Difficulty
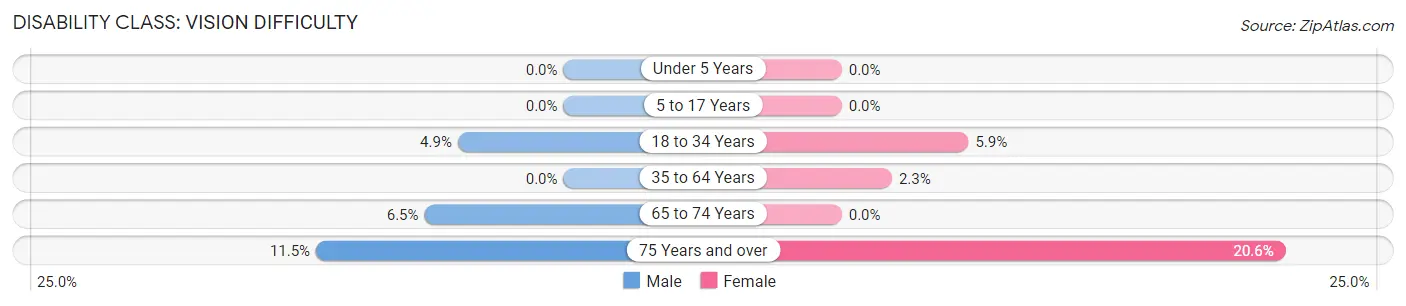
| Age Bracket | Male | Female |
| Under 5 Years | 0 (0.0%) | 0 (0.0%) |
| 5 to 17 Years | 0 (0.0%) | 0 (0.0%) |
| 18 to 34 Years | 5 (4.9%) | 5 (5.9%) |
| 35 to 64 Years | 0 (0.0%) | 3 (2.3%) |
| 65 to 74 Years | 2 (6.5%) | 0 (0.0%) |
| 75 Years and over | 7 (11.5%) | 7 (20.6%) |
Disability Class: Cognitive Difficulty
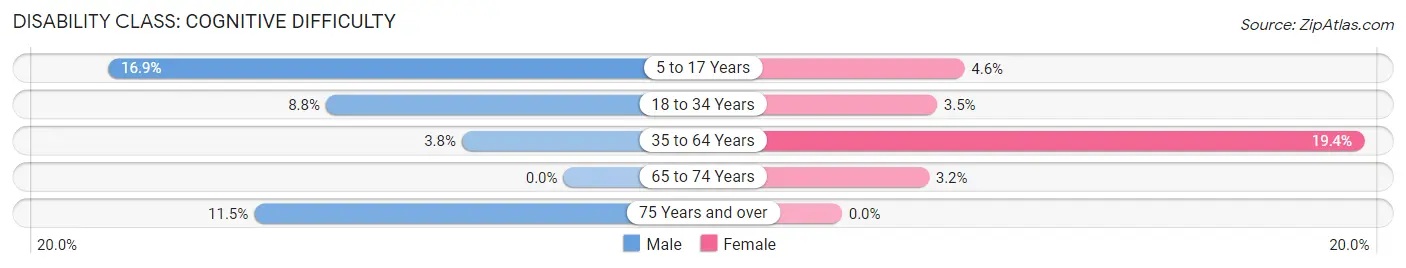
| Age Bracket | Male | Female |
| 5 to 17 Years | 12 (16.9%) | 2 (4.5%) |
| 18 to 34 Years | 9 (8.8%) | 3 (3.5%) |
| 35 to 64 Years | 4 (3.8%) | 25 (19.4%) |
| 65 to 74 Years | 0 (0.0%) | 1 (3.2%) |
| 75 Years and over | 7 (11.5%) | 0 (0.0%) |
Disability Class: Ambulatory Difficulty
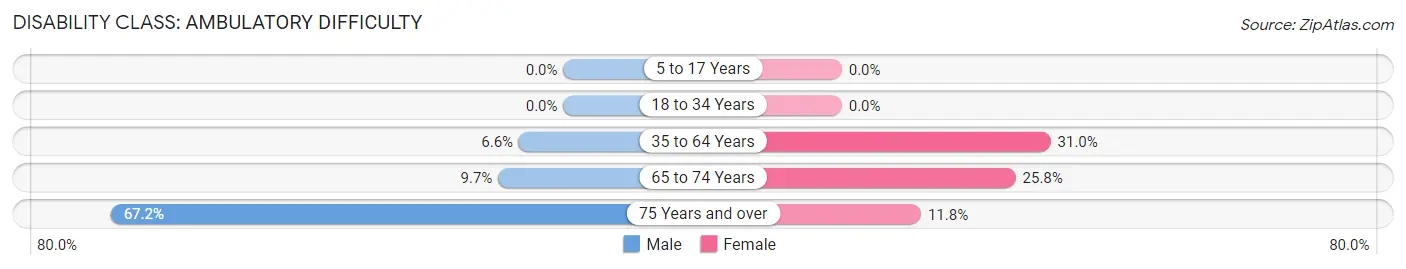
| Age Bracket | Male | Female |
| 5 to 17 Years | 0 (0.0%) | 0 (0.0%) |
| 18 to 34 Years | 0 (0.0%) | 0 (0.0%) |
| 35 to 64 Years | 7 (6.6%) | 40 (31.0%) |
| 65 to 74 Years | 3 (9.7%) | 8 (25.8%) |
| 75 Years and over | 41 (67.2%) | 4 (11.8%) |
Disability Class: Self-Care Difficulty
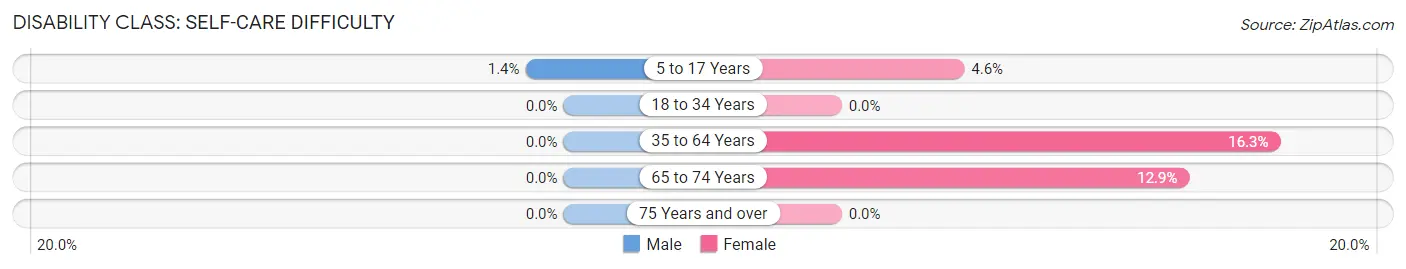
| Age Bracket | Male | Female |
| 5 to 17 Years | 1 (1.4%) | 2 (4.5%) |
| 18 to 34 Years | 0 (0.0%) | 0 (0.0%) |
| 35 to 64 Years | 0 (0.0%) | 21 (16.3%) |
| 65 to 74 Years | 0 (0.0%) | 4 (12.9%) |
| 75 Years and over | 0 (0.0%) | 0 (0.0%) |
Technology Access in Holly Pond
Computing Device Access in Holly Pond
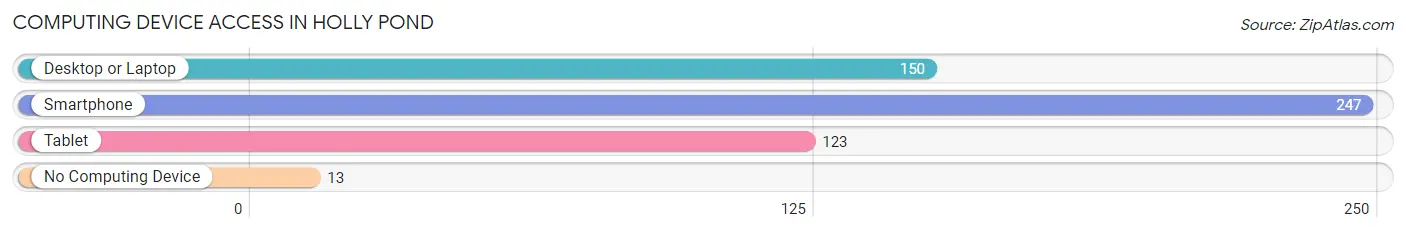
| Device Type | # Households | % Households |
| Desktop or Laptop | 150 | 54.7% |
| Smartphone | 247 | 90.1% |
| Tablet | 123 | 44.9% |
| No Computing Device | 13 | 4.7% |
| Total | 274 | 100.0% |
Internet Access in Holly Pond
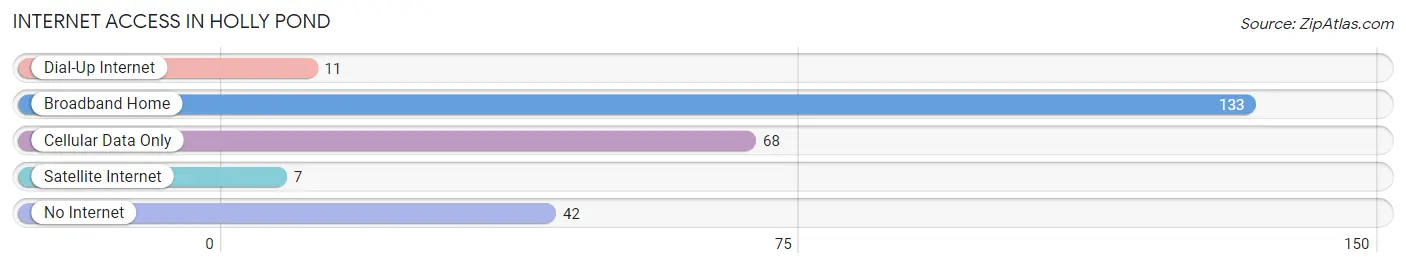
| Internet Type | # Households | % Households |
| Dial-Up Internet | 11 | 4.0% |
| Broadband Home | 133 | 48.5% |
| Cellular Data Only | 68 | 24.8% |
| Satellite Internet | 7 | 2.5% |
| No Internet | 42 | 15.3% |
| Total | 274 | 100.0% |
Holly Pond Summary
Holly Pond is a small town located in Cullman County, Alabama. It is situated in the foothills of the Appalachian Mountains and is part of the Birmingham-Hoover Metropolitan Statistical Area. The town has a population of 1,717 people, according to the 2010 census.
History
Holly Pond was founded in 1883 by a group of settlers from Georgia. The town was named after a nearby pond, which was filled with holly trees. The town was incorporated in 1887 and was the first town in Cullman County to be incorporated.
The town was originally a farming community, but in the early 1900s, the town began to grow and develop. The first bank was established in 1908, and the first post office was established in 1909. The town also had a cotton gin, a sawmill, and a gristmill.
In the 1920s, the town began to experience a period of growth and development. The first school was built in 1921, and the first telephone service was established in 1923. The town also had a movie theater, a hotel, and a variety of stores.
Geography
Holly Pond is located in the foothills of the Appalachian Mountains in northern Alabama. The town is situated at the intersection of U.S. Highway 278 and Alabama State Route 91. The town is located approximately 30 miles north of Birmingham and approximately 40 miles south of Huntsville.
The town is located in a hilly area, with elevations ranging from 600 to 900 feet above sea level. The town is located in a humid subtropical climate zone, with hot summers and mild winters. The average annual temperature is around 68 degrees Fahrenheit.
Economy
Holly Pond is a small, rural town with a primarily agricultural economy. The town is home to several farms, which produce a variety of crops, including corn, soybeans, cotton, and hay. The town also has several small businesses, including a grocery store, a hardware store, and a few restaurants.
The town is also home to a few manufacturing companies, including a furniture manufacturer and a plastics manufacturer. The town is also home to a few small technology companies, which provide software and web development services.
Demographics
According to the 2010 census, the population of Holly Pond was 1,717 people. The town has a population that is predominantly white (94.3%), with a small percentage of African Americans (3.3%) and Hispanics (1.2%). The median household income in the town is $37,917, and the median age is 41.
The town has a low unemployment rate (3.7%), and the majority of the population is employed in either the agricultural or manufacturing sectors. The town also has a high rate of homeownership (77.3%), and the majority of the population is married (60.2%).
Conclusion
Holly Pond is a small, rural town located in the foothills of the Appalachian Mountains in northern Alabama. The town has a population of 1,717 people, and the majority of the population is white. The town has a primarily agricultural economy, with a few small businesses and manufacturing companies. The town has a low unemployment rate and a high rate of homeownership.
Common Questions
What is Per Capita Income in Holly Pond?
Per Capita income in Holly Pond is $21,714.
What is the Median Family Income in Holly Pond?
Median Family Income in Holly Pond is $56,397.
What is the Median Household income in Holly Pond?
Median Household Income in Holly Pond is $46,250.
What is Income or Wage Gap in Holly Pond?
Income or Wage Gap in Holly Pond is 24.9%.
Women in Holly Pond earn 75.1 cents for every dollar earned by a man.
What is Family Income Deficit in Holly Pond?
Family Income Deficit in Holly Pond is $8,903.
Families that are below poverty line in Holly Pond earn $8,903 less on average than the poverty threshold level.
What is Inequality or Gini Index in Holly Pond?
Inequality or Gini Index in Holly Pond is 0.39.
What is the Total Population of Holly Pond?
Total Population of Holly Pond is 761.
What is the Total Male Population of Holly Pond?
Total Male Population of Holly Pond is 410.
What is the Total Female Population of Holly Pond?
Total Female Population of Holly Pond is 351.
What is the Ratio of Males per 100 Females in Holly Pond?
There are 116.81 Males per 100 Females in Holly Pond.
What is the Ratio of Females per 100 Males in Holly Pond?
There are 85.61 Females per 100 Males in Holly Pond.
What is the Median Population Age in Holly Pond?
Median Population Age in Holly Pond is 36.9 Years.
What is the Average Family Size in Holly Pond
Average Family Size in Holly Pond is 3.1 People.
What is the Average Household Size in Holly Pond
Average Household Size in Holly Pond is 2.8 People.
How Large is the Labor Force in Holly Pond?
There are 319 People in the Labor Forcein in Holly Pond.
What is the Percentage of People in the Labor Force in Holly Pond?
53.7% of People are in the Labor Force in Holly Pond.
What is the Unemployment Rate in Holly Pond?
Unemployment Rate in Holly Pond is 1.9%.