Moores Mill, AL Map & Demographics
Moores Mill Map
Moores Mill Overview
$46,270
PER CAPITA INCOME
$100,582
AVG FAMILY INCOME
$88,694
AVG HOUSEHOLD INCOME
37.5%
WAGE / INCOME GAP [ % ]
62.5¢/ $1
WAGE / INCOME GAP [ $ ]
0.43
INEQUALITY / GINI INDEX
6,007
TOTAL POPULATION
2,884
MALE POPULATION
3,123
FEMALE POPULATION
92.35
MALES / 100 FEMALES
108.29
FEMALES / 100 MALES
44.6
MEDIAN AGE
2.9
AVG FAMILY SIZE
2.5
AVG HOUSEHOLD SIZE
3,230
LABOR FORCE [ PEOPLE ]
65.5%
PERCENT IN LABOR FORCE
2.8%
UNEMPLOYMENT RATE
Income in Moores Mill
Income Overview in Moores Mill
Per Capita Income in Moores Mill is $46,270, while median incomes of families and households are $100,582 and $88,694 respectively.
| Characteristic | Number | Measure |
| Per Capita Income | 6,007 | $46,270 |
| Median Family Income | 1,822 | $100,582 |
| Mean Family Income | 1,822 | $127,957 |
| Median Household Income | 2,407 | $88,694 |
| Mean Household Income | 2,407 | $112,360 |
| Income Deficit | 1,822 | $0 |
| Wage / Income Gap (%) | 6,007 | 37.50% |
| Wage / Income Gap ($) | 6,007 | 62.50¢ per $1 |
| Gini / Inequality Index | 6,007 | 0.43 |
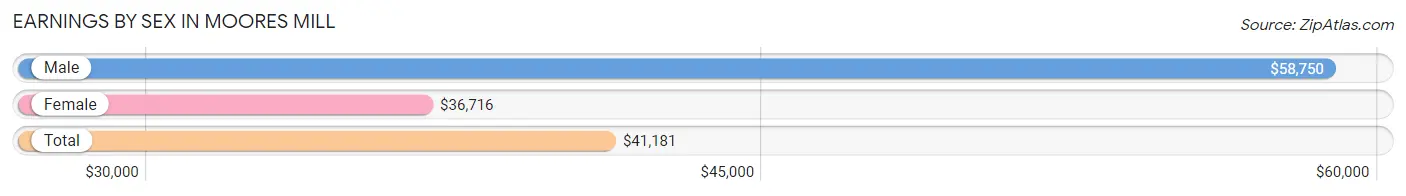
Earnings by Sex in Moores Mill
Average Earnings in Moores Mill are $41,181, $58,750 for men and $36,716 for women, a difference of 37.5%.
| Sex | Number | Average Earnings |
| Male | 1,753 (51.3%) | $58,750 |
| Female | 1,663 (48.7%) | $36,716 |
| Total | 3,416 (100.0%) | $41,181 |
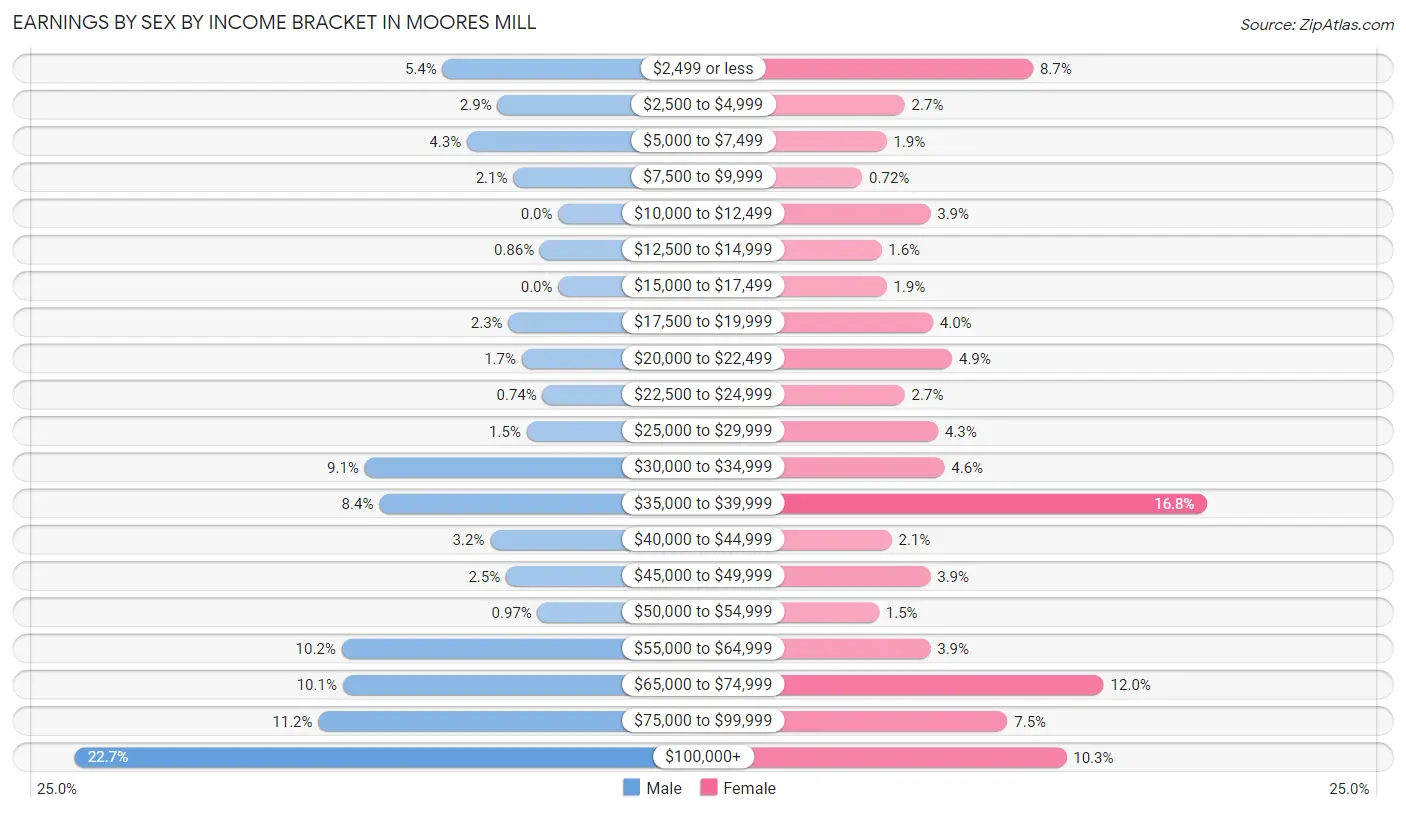
Earnings by Sex by Income Bracket in Moores Mill
The most common earnings brackets in Moores Mill are $100,000+ for men (397 | 22.7%) and $35,000 to $39,999 for women (280 | 16.8%).
| Income | Male | Female |
| $2,499 or less | 95 (5.4%) | 145 (8.7%) |
| $2,500 to $4,999 | 50 (2.9%) | 45 (2.7%) |
| $5,000 to $7,499 | 75 (4.3%) | 31 (1.9%) |
| $7,500 to $9,999 | 37 (2.1%) | 12 (0.7%) |
| $10,000 to $12,499 | 0 (0.0%) | 65 (3.9%) |
| $12,500 to $14,999 | 15 (0.9%) | 27 (1.6%) |
| $15,000 to $17,499 | 0 (0.0%) | 31 (1.9%) |
| $17,500 to $19,999 | 41 (2.3%) | 67 (4.0%) |
| $20,000 to $22,499 | 30 (1.7%) | 82 (4.9%) |
| $22,500 to $24,999 | 13 (0.7%) | 45 (2.7%) |
| $25,000 to $29,999 | 26 (1.5%) | 71 (4.3%) |
| $30,000 to $34,999 | 159 (9.1%) | 76 (4.6%) |
| $35,000 to $39,999 | 147 (8.4%) | 280 (16.8%) |
| $40,000 to $44,999 | 56 (3.2%) | 35 (2.1%) |
| $45,000 to $49,999 | 43 (2.5%) | 65 (3.9%) |
| $50,000 to $54,999 | 17 (1.0%) | 25 (1.5%) |
| $55,000 to $64,999 | 178 (10.2%) | 65 (3.9%) |
| $65,000 to $74,999 | 177 (10.1%) | 200 (12.0%) |
| $75,000 to $99,999 | 197 (11.2%) | 125 (7.5%) |
| $100,000+ | 397 (22.7%) | 171 (10.3%) |
| Total | 1,753 (100.0%) | 1,663 (100.0%) |
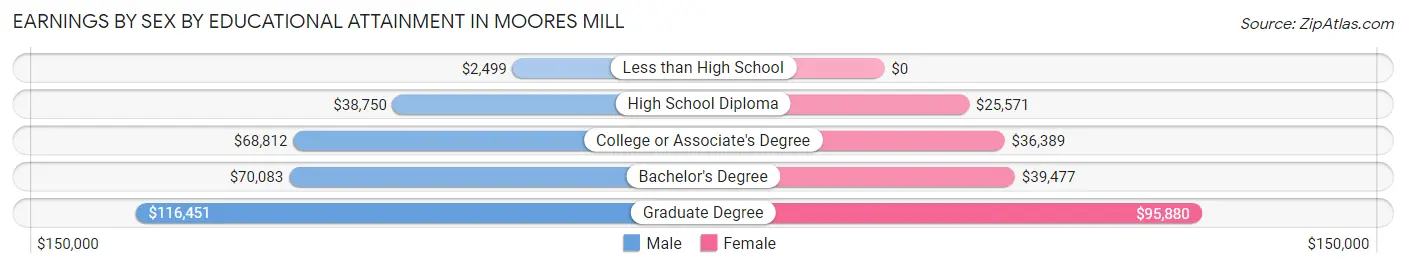
Earnings by Sex by Educational Attainment in Moores Mill
Average earnings in Moores Mill are $67,525 for men and $38,006 for women, a difference of 43.7%. Men with an educational attainment of graduate degree enjoy the highest average annual earnings of $116,451, while those with less than high school education earn the least with $2,499. Women with an educational attainment of graduate degree earn the most with the average annual earnings of $95,880, while those with high school diploma education have the smallest earnings of $25,571.
| Educational Attainment | Male Income | Female Income |
| Less than High School | $2,499 | $0 |
| High School Diploma | $38,750 | $25,571 |
| College or Associate's Degree | $68,812 | $36,389 |
| Bachelor's Degree | $70,083 | $39,477 |
| Graduate Degree | $116,451 | $95,880 |
| Total | $67,525 | $38,006 |
Family Income in Moores Mill
Family Income Brackets in Moores Mill
According to the Moores Mill family income data, there are 435 families falling into the $100,000 to $149,999 income range, which is the most common income bracket and makes up 23.9% of all families.
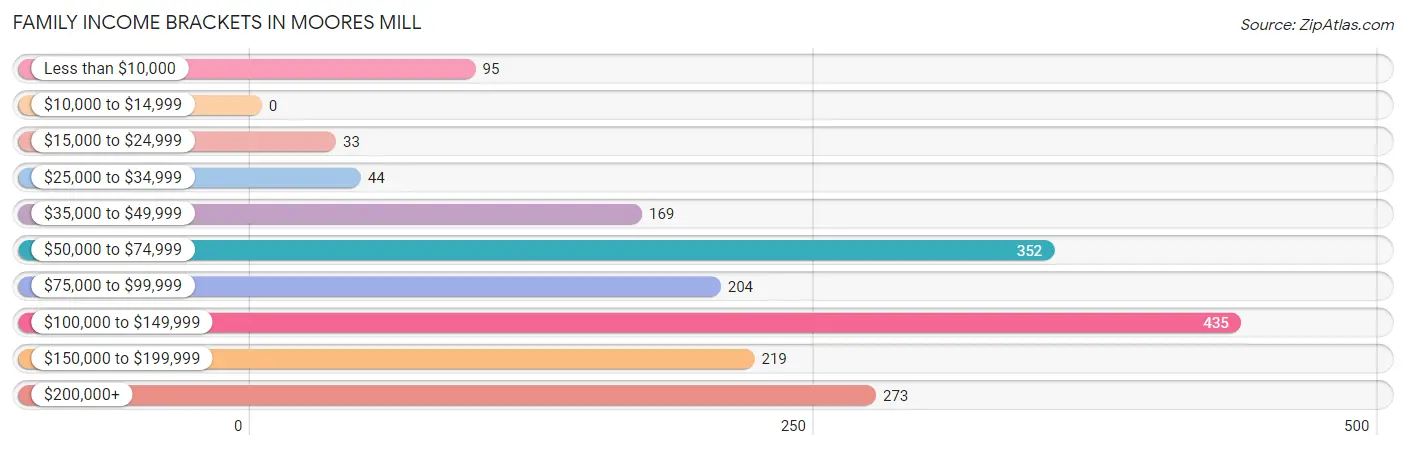
| Income Bracket | # Families | % Families |
| Less than $10,000 | 95 | 5.2% |
| $10,000 to $14,999 | 0 | 0.0% |
| $15,000 to $24,999 | 33 | 1.8% |
| $25,000 to $34,999 | 44 | 2.4% |
| $35,000 to $49,999 | 169 | 9.3% |
| $50,000 to $74,999 | 352 | 19.3% |
| $75,000 to $99,999 | 204 | 11.2% |
| $100,000 to $149,999 | 435 | 23.9% |
| $150,000 to $199,999 | 219 | 12.0% |
| $200,000+ | 273 | 15.0% |
Family Income by Famaliy Size in Moores Mill
4-person families (481 | 26.4%) account for the highest median family income in Moores Mill with $129,576 per family, while 2-person families (888 | 48.7%) have the highest median income of $41,518 per family member.
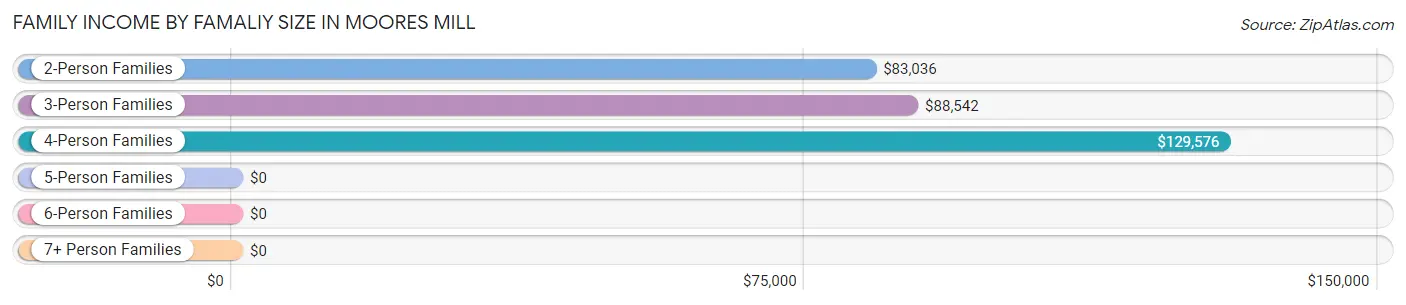
| Income Bracket | # Families | Median Income |
| 2-Person Families | 888 (48.7%) | $83,036 |
| 3-Person Families | 416 (22.8%) | $88,542 |
| 4-Person Families | 481 (26.4%) | $129,576 |
| 5-Person Families | 28 (1.5%) | $0 |
| 6-Person Families | 9 (0.5%) | $0 |
| 7+ Person Families | 0 (0.0%) | $0 |
| Total | 1,822 (100.0%) | $100,582 |
Family Income by Number of Earners in Moores Mill
The median family income in Moores Mill is $100,582, with families comprising 3+ earners (168) having the highest median family income of $179,375, while families with 1 earner (536) have the lowest median family income of $64,625, accounting for 9.2% and 29.4% of families, respectively.
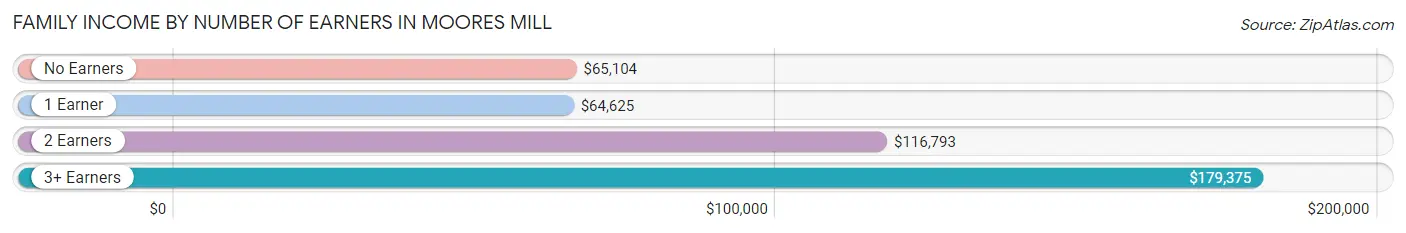
| Number of Earners | # Families | Median Income |
| No Earners | 195 (10.7%) | $65,104 |
| 1 Earner | 536 (29.4%) | $64,625 |
| 2 Earners | 923 (50.7%) | $116,793 |
| 3+ Earners | 168 (9.2%) | $179,375 |
| Total | 1,822 (100.0%) | $100,582 |
Household Income in Moores Mill
Household Income Brackets in Moores Mill
With 496 households falling in the category, the $100,000 to $149,999 income range is the most frequent in Moores Mill, accounting for 20.6% of all households. In contrast, only 7 households (0.3%) fall into the $10,000 to $14,999 income bracket, making it the least populous group.
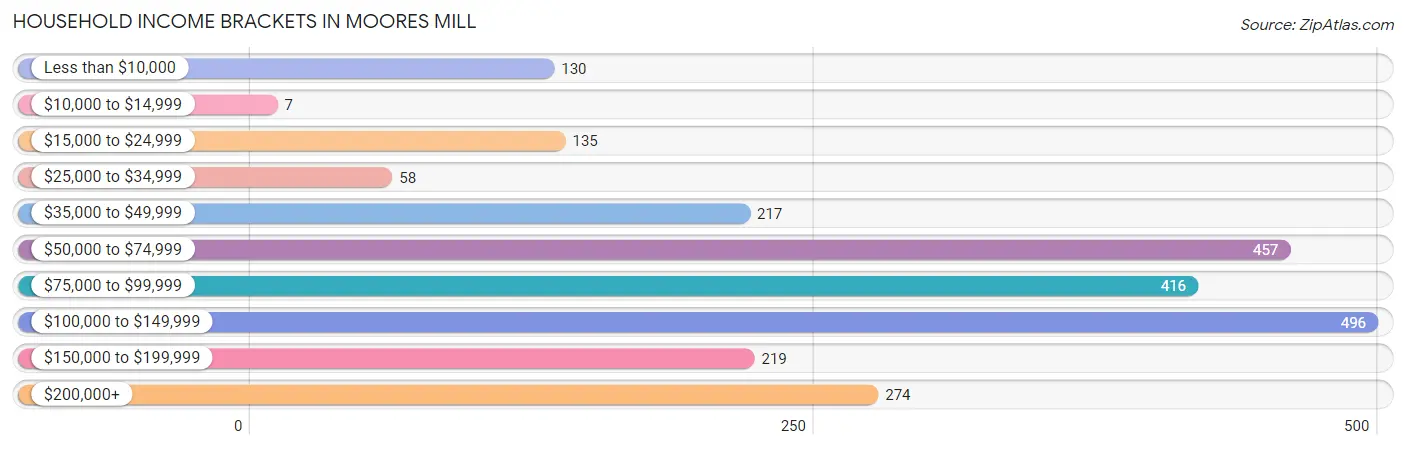
| Income Bracket | # Households | % Households |
| Less than $10,000 | 130 | 5.4% |
| $10,000 to $14,999 | 7 | 0.3% |
| $15,000 to $24,999 | 135 | 5.6% |
| $25,000 to $34,999 | 58 | 2.4% |
| $35,000 to $49,999 | 217 | 9.0% |
| $50,000 to $74,999 | 457 | 19.0% |
| $75,000 to $99,999 | 416 | 17.3% |
| $100,000 to $149,999 | 496 | 20.6% |
| $150,000 to $199,999 | 219 | 9.1% |
| $200,000+ | 274 | 11.4% |
Household Income by Householder Age in Moores Mill
The median household income in Moores Mill is $88,694, with the highest median household income of $102,697 found in the 25 to 44 years age bracket for the primary householder. A total of 655 households (27.2%) fall into this category. Meanwhile, the 15 to 24 years age bracket for the primary householder has the lowest median household income of $0, with 26 households (1.1%) in this group.
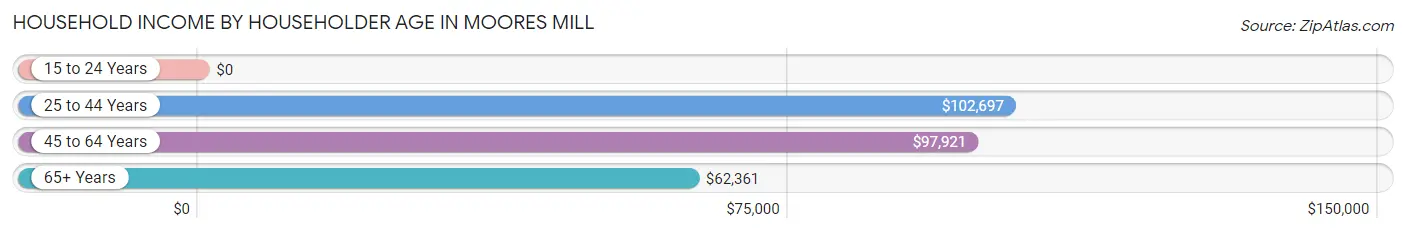
| Income Bracket | # Households | Median Income |
| 15 to 24 Years | 26 (1.1%) | $0 |
| 25 to 44 Years | 655 (27.2%) | $102,697 |
| 45 to 64 Years | 1,052 (43.7%) | $97,921 |
| 65+ Years | 674 (28.0%) | $62,361 |
| Total | 2,407 (100.0%) | $88,694 |
Poverty in Moores Mill
Income Below Poverty by Sex and Age in Moores Mill
With 6.9% poverty level for males and 12.2% for females among the residents of Moores Mill, under 5 year old males and 5 year old females are the most vulnerable to poverty, with 52 males (24.4%) and 45 females (52.9%) in their respective age groups living below the poverty level.
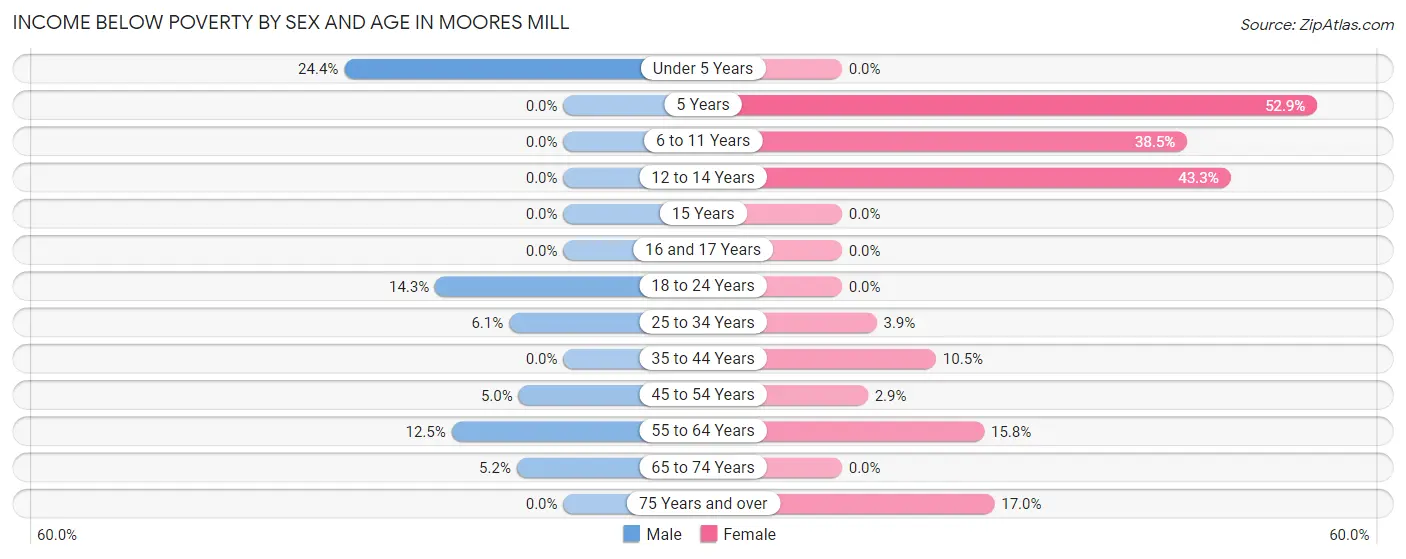
| Age Bracket | Male | Female |
| Under 5 Years | 52 (24.4%) | 0 (0.0%) |
| 5 Years | 0 (0.0%) | 45 (52.9%) |
| 6 to 11 Years | 0 (0.0%) | 50 (38.5%) |
| 12 to 14 Years | 0 (0.0%) | 100 (43.3%) |
| 15 Years | 0 (0.0%) | 0 (0.0%) |
| 16 and 17 Years | 0 (0.0%) | 0 (0.0%) |
| 18 to 24 Years | 34 (14.3%) | 0 (0.0%) |
| 25 to 34 Years | 15 (6.0%) | 13 (3.9%) |
| 35 to 44 Years | 0 (0.0%) | 44 (10.5%) |
| 45 to 54 Years | 18 (5.0%) | 14 (2.9%) |
| 55 to 64 Years | 61 (12.4%) | 80 (15.8%) |
| 65 to 74 Years | 18 (5.2%) | 0 (0.0%) |
| 75 Years and over | 0 (0.0%) | 36 (17.0%) |
| Total | 198 (6.9%) | 382 (12.2%) |
Income Above Poverty by Sex and Age in Moores Mill
According to the poverty statistics in Moores Mill, males aged 5 years and females aged under 5 years are the age groups that are most secure financially, with 100.0% of males and 100.0% of females in these age groups living above the poverty line.
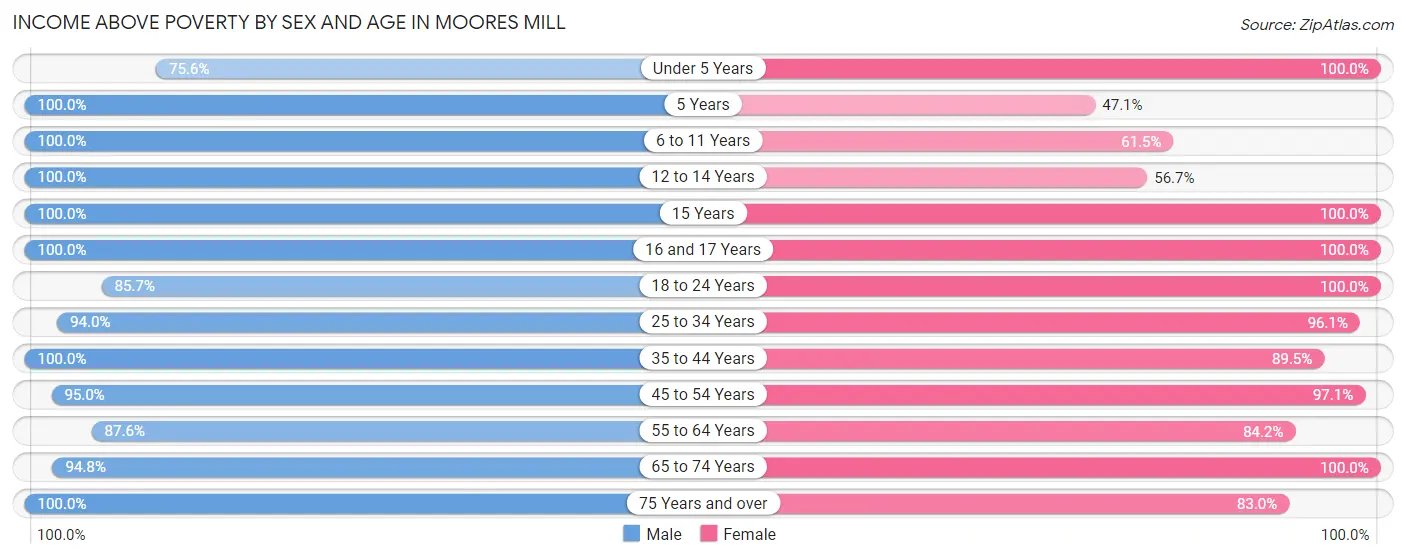
| Age Bracket | Male | Female |
| Under 5 Years | 161 (75.6%) | 63 (100.0%) |
| 5 Years | 17 (100.0%) | 40 (47.1%) |
| 6 to 11 Years | 163 (100.0%) | 80 (61.5%) |
| 12 to 14 Years | 81 (100.0%) | 131 (56.7%) |
| 15 Years | 65 (100.0%) | 27 (100.0%) |
| 16 and 17 Years | 60 (100.0%) | 40 (100.0%) |
| 18 to 24 Years | 204 (85.7%) | 220 (100.0%) |
| 25 to 34 Years | 233 (94.0%) | 323 (96.1%) |
| 35 to 44 Years | 488 (100.0%) | 376 (89.5%) |
| 45 to 54 Years | 343 (95.0%) | 471 (97.1%) |
| 55 to 64 Years | 429 (87.5%) | 425 (84.2%) |
| 65 to 74 Years | 329 (94.8%) | 369 (100.0%) |
| 75 Years and over | 113 (100.0%) | 176 (83.0%) |
| Total | 2,686 (93.1%) | 2,741 (87.8%) |
Income Below Poverty Among Married-Couple Families in Moores Mill
The poverty statistics for married-couple families in Moores Mill show that 4.4% or 61 of the total 1,392 families live below the poverty line. Families with 1 or 2 children have the highest poverty rate of 8.9%, comprising of 46 families. On the other hand, families with 3 or 4 children have the lowest poverty rate of 0.0%, which includes 0 families.
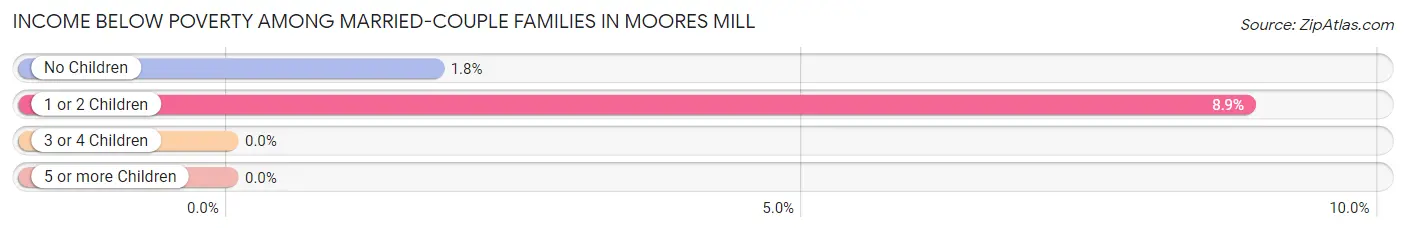
| Children | Above Poverty | Below Poverty |
| No Children | 821 (98.2%) | 15 (1.8%) |
| 1 or 2 Children | 473 (91.1%) | 46 (8.9%) |
| 3 or 4 Children | 37 (100.0%) | 0 (0.0%) |
| 5 or more Children | 0 (0.0%) | 0 (0.0%) |
| Total | 1,331 (95.6%) | 61 (4.4%) |
Income Below Poverty Among Single-Parent Households in Moores Mill
According to the poverty data in Moores Mill, 16.7% or 11 single-father households and 21.1% or 77 single-mother households are living below the poverty line. Among single-father households, those with no children have the highest poverty rate, with 11 households (33.3%) experiencing poverty. Likewise, among single-mother households, those with 3 or 4 children have the highest poverty rate, with 44 households (100.0%) falling below the poverty line.
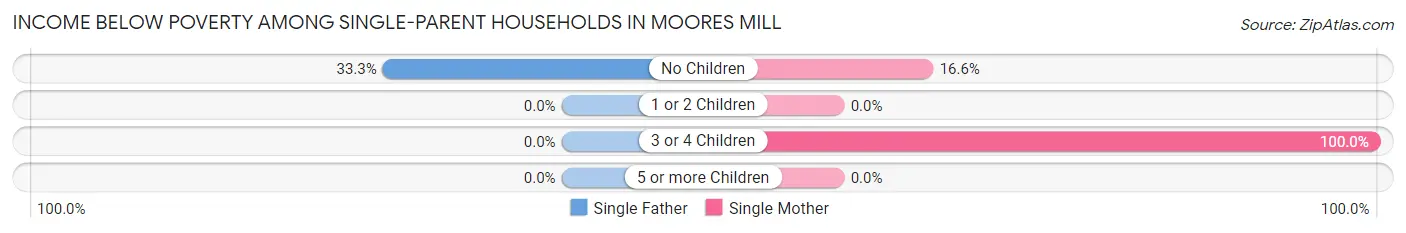
| Children | Single Father | Single Mother |
| No Children | 11 (33.3%) | 33 (16.6%) |
| 1 or 2 Children | 0 (0.0%) | 0 (0.0%) |
| 3 or 4 Children | 0 (0.0%) | 44 (100.0%) |
| 5 or more Children | 0 (0.0%) | 0 (0.0%) |
| Total | 11 (16.7%) | 77 (21.1%) |
Income Below Poverty Among Married-Couple vs Single-Parent Households in Moores Mill
The poverty data for Moores Mill shows that 61 of the married-couple family households (4.4%) and 88 of the single-parent households (20.5%) are living below the poverty level. Within the married-couple family households, those with 1 or 2 children have the highest poverty rate, with 46 households (8.9%) falling below the poverty line. Among the single-parent households, those with 3 or 4 children have the highest poverty rate, with 44 household (100.0%) living below poverty.
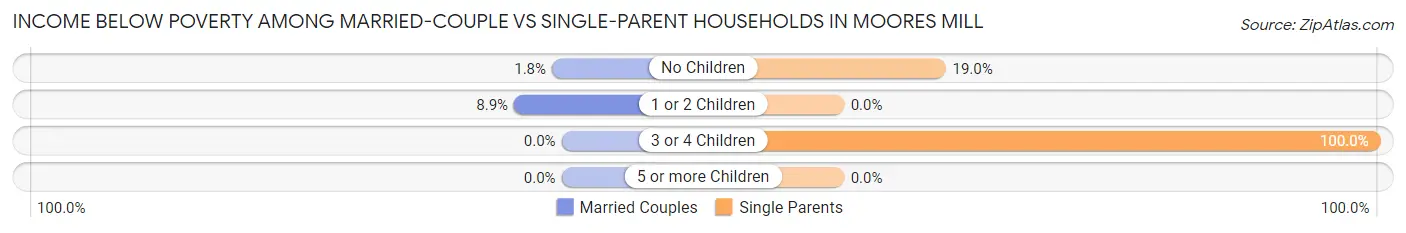
| Children | Married-Couple Families | Single-Parent Households |
| No Children | 15 (1.8%) | 44 (19.0%) |
| 1 or 2 Children | 46 (8.9%) | 0 (0.0%) |
| 3 or 4 Children | 0 (0.0%) | 44 (100.0%) |
| 5 or more Children | 0 (0.0%) | 0 (0.0%) |
| Total | 61 (4.4%) | 88 (20.5%) |
Race in Moores Mill
The most populous races in Moores Mill are White / Caucasian (4,244 | 70.7%), Black / African American (1,172 | 19.5%), and Two or more Races (349 | 5.8%).
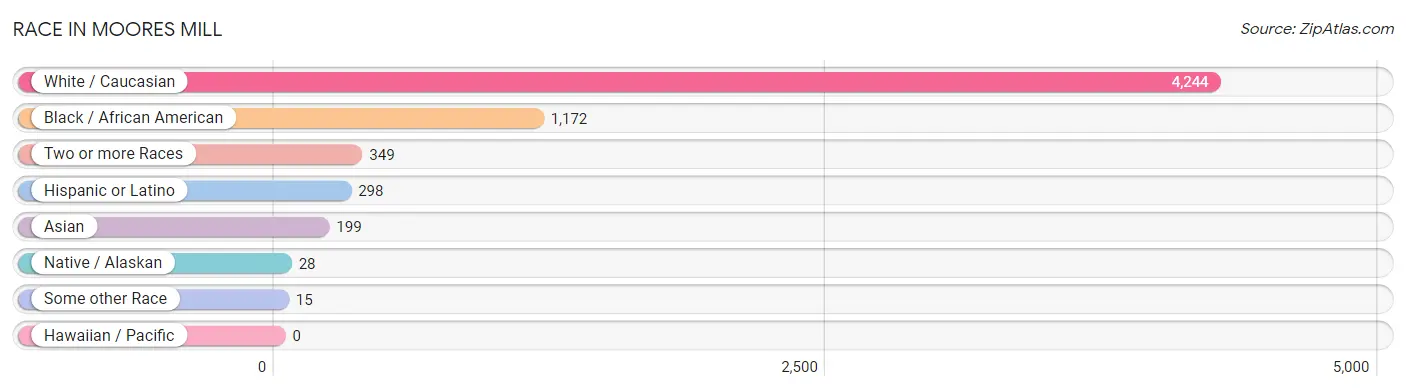
| Race | # Population | % Population |
| Asian | 199 | 3.3% |
| Black / African American | 1,172 | 19.5% |
| Hawaiian / Pacific | 0 | 0.0% |
| Hispanic or Latino | 298 | 5.0% |
| Native / Alaskan | 28 | 0.5% |
| White / Caucasian | 4,244 | 70.7% |
| Two or more Races | 349 | 5.8% |
| Some other Race | 15 | 0.3% |
| Total | 6,007 | 100.0% |
Ancestry in Moores Mill
The most populous ancestries reported in Moores Mill are Irish (728 | 12.1%), German (707 | 11.8%), American (543 | 9.0%), English (535 | 8.9%), and Scottish (251 | 4.2%), together accounting for 46.0% of all Moores Mill residents.
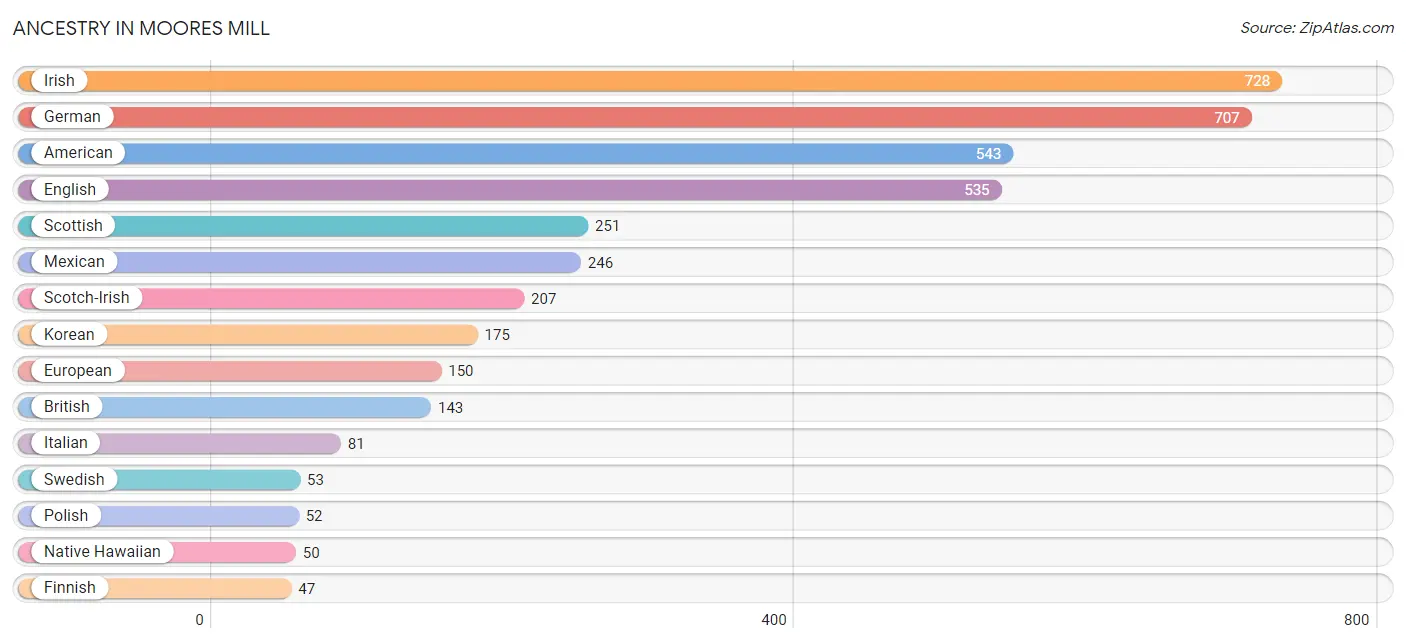
| Ancestry | # Population | % Population |
| American | 543 | 9.0% |
| British | 143 | 2.4% |
| Central American | 13 | 0.2% |
| Cherokee | 10 | 0.2% |
| Croatian | 13 | 0.2% |
| Cuban | 17 | 0.3% |
| Dutch | 19 | 0.3% |
| English | 535 | 8.9% |
| European | 150 | 2.5% |
| Finnish | 47 | 0.8% |
| French | 33 | 0.5% |
| French Canadian | 8 | 0.1% |
| German | 707 | 11.8% |
| Iranian | 8 | 0.1% |
| Irish | 728 | 12.1% |
| Italian | 81 | 1.3% |
| Korean | 175 | 2.9% |
| Mexican | 246 | 4.1% |
| Native Hawaiian | 50 | 0.8% |
| Norwegian | 10 | 0.2% |
| Panamanian | 13 | 0.2% |
| Pennsylvania German | 16 | 0.3% |
| Polish | 52 | 0.9% |
| Puerto Rican | 22 | 0.4% |
| Russian | 30 | 0.5% |
| Scotch-Irish | 207 | 3.5% |
| Scottish | 251 | 4.2% |
| Swedish | 53 | 0.9% |
| Welsh | 17 | 0.3% | View All 29 Rows |
Immigrants in Moores Mill
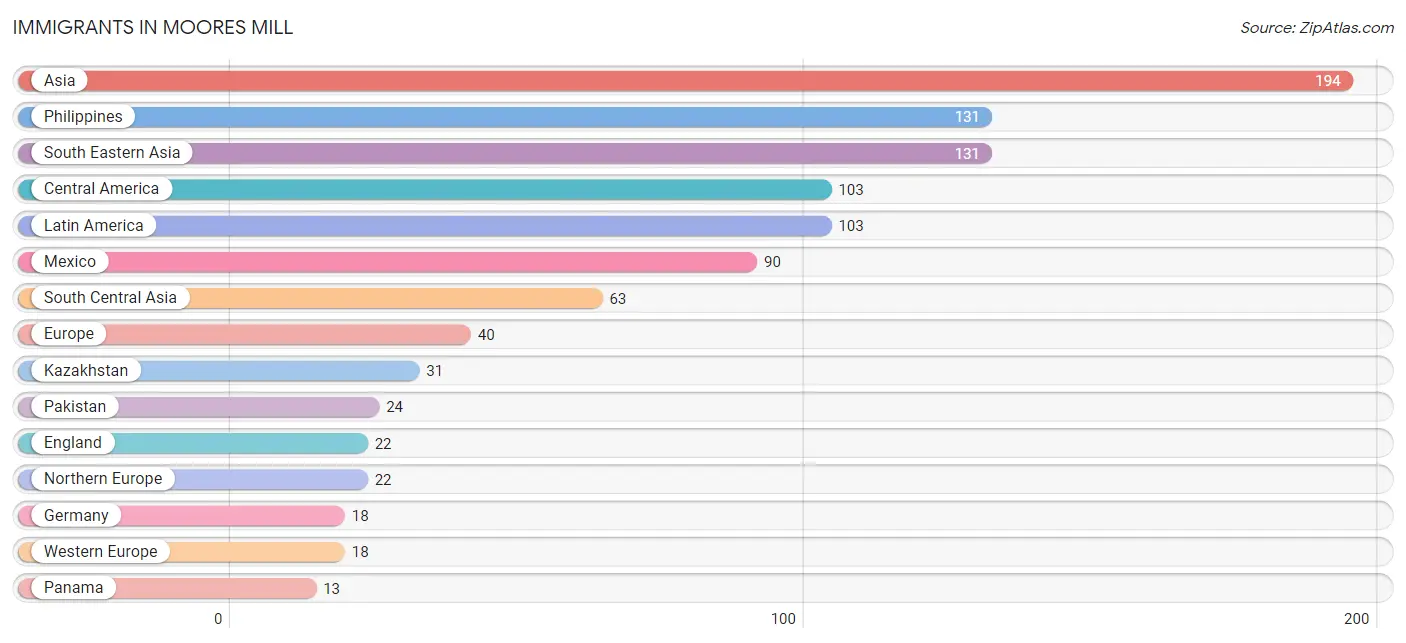
The most numerous immigrant groups reported in Moores Mill came from Asia (194 | 3.2%), Philippines (131 | 2.2%), South Eastern Asia (131 | 2.2%), Central America (103 | 1.7%), and Latin America (103 | 1.7%), together accounting for 11.0% of all Moores Mill residents.
| Immigration Origin | # Population | % Population |
| Asia | 194 | 3.2% |
| Central America | 103 | 1.7% |
| England | 22 | 0.4% |
| Europe | 40 | 0.7% |
| Germany | 18 | 0.3% |
| Iran | 8 | 0.1% |
| Kazakhstan | 31 | 0.5% |
| Latin America | 103 | 1.7% |
| Mexico | 90 | 1.5% |
| Northern Europe | 22 | 0.4% |
| Pakistan | 24 | 0.4% |
| Panama | 13 | 0.2% |
| Philippines | 131 | 2.2% |
| South Central Asia | 63 | 1.1% |
| South Eastern Asia | 131 | 2.2% |
| Western Europe | 18 | 0.3% | View All 16 Rows |
Sex and Age in Moores Mill
Sex and Age in Moores Mill
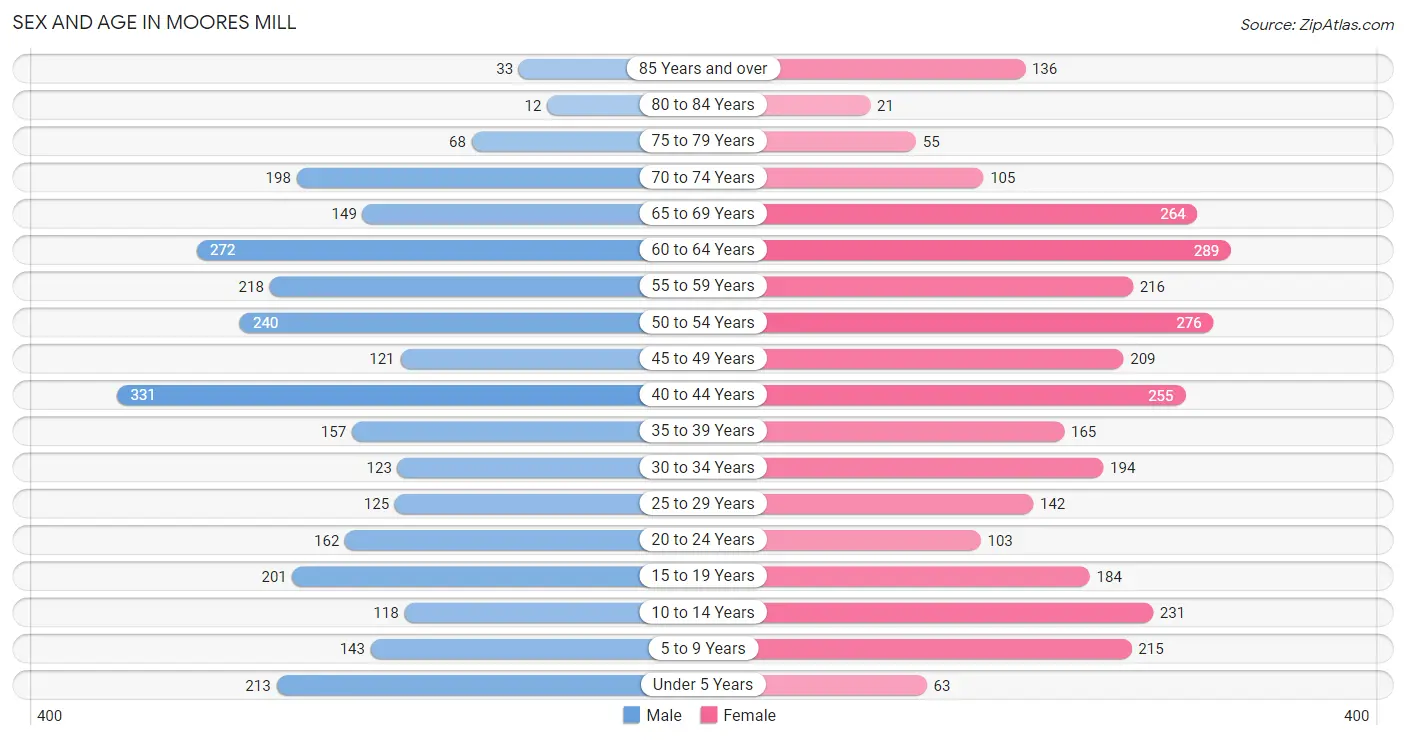
The most populous age groups in Moores Mill are 40 to 44 Years (331 | 11.5%) for men and 60 to 64 Years (289 | 9.2%) for women.
| Age Bracket | Male | Female |
| Under 5 Years | 213 (7.4%) | 63 (2.0%) |
| 5 to 9 Years | 143 (5.0%) | 215 (6.9%) |
| 10 to 14 Years | 118 (4.1%) | 231 (7.4%) |
| 15 to 19 Years | 201 (7.0%) | 184 (5.9%) |
| 20 to 24 Years | 162 (5.6%) | 103 (3.3%) |
| 25 to 29 Years | 125 (4.3%) | 142 (4.5%) |
| 30 to 34 Years | 123 (4.3%) | 194 (6.2%) |
| 35 to 39 Years | 157 (5.4%) | 165 (5.3%) |
| 40 to 44 Years | 331 (11.5%) | 255 (8.2%) |
| 45 to 49 Years | 121 (4.2%) | 209 (6.7%) |
| 50 to 54 Years | 240 (8.3%) | 276 (8.8%) |
| 55 to 59 Years | 218 (7.6%) | 216 (6.9%) |
| 60 to 64 Years | 272 (9.4%) | 289 (9.2%) |
| 65 to 69 Years | 149 (5.2%) | 264 (8.5%) |
| 70 to 74 Years | 198 (6.9%) | 105 (3.4%) |
| 75 to 79 Years | 68 (2.4%) | 55 (1.8%) |
| 80 to 84 Years | 12 (0.4%) | 21 (0.7%) |
| 85 Years and over | 33 (1.1%) | 136 (4.3%) |
| Total | 2,884 (100.0%) | 3,123 (100.0%) |
Families and Households in Moores Mill
Median Family Size in Moores Mill
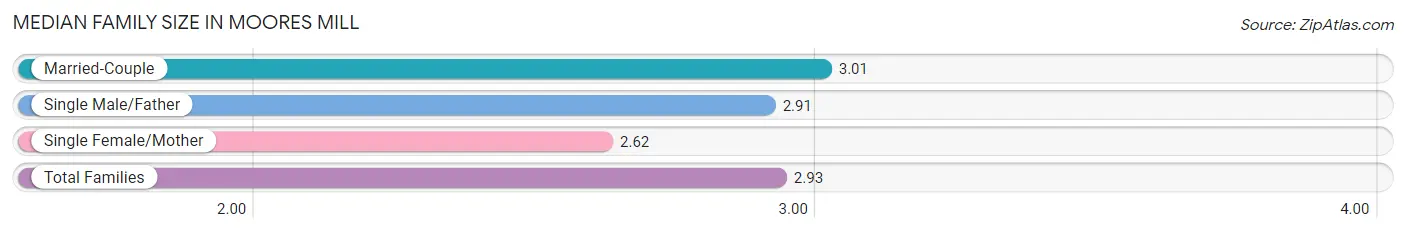
The median family size in Moores Mill is 2.93 persons per family, with married-couple families (1,392 | 76.4%) accounting for the largest median family size of 3.01 persons per family. On the other hand, single female/mother families (364 | 20.0%) represent the smallest median family size with 2.62 persons per family.
| Family Type | # Families | Family Size |
| Married-Couple | 1,392 (76.4%) | 3.01 |
| Single Male/Father | 66 (3.6%) | 2.91 |
| Single Female/Mother | 364 (20.0%) | 2.62 |
| Total Families | 1,822 (100.0%) | 2.93 |
Median Household Size in Moores Mill
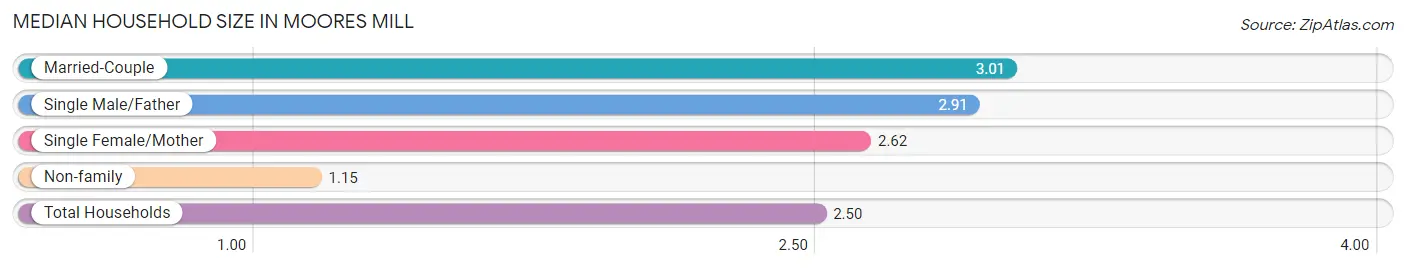
The median household size in Moores Mill is 2.50 persons per household, with married-couple households (1,392 | 57.8%) accounting for the largest median household size of 3.01 persons per household. non-family households (585 | 24.3%) represent the smallest median household size with 1.15 persons per household.
| Household Type | # Households | Household Size |
| Married-Couple | 1,392 (57.8%) | 3.01 |
| Single Male/Father | 66 (2.7%) | 2.91 |
| Single Female/Mother | 364 (15.1%) | 2.62 |
| Non-family | 585 (24.3%) | 1.15 |
| Total Households | 2,407 (100.0%) | 2.50 |
Household Size by Marriage Status in Moores Mill
Out of a total of 2,407 households in Moores Mill, 1,822 (75.7%) are family households, while 585 (24.3%) are nonfamily households. The most numerous type of family households are 2-person households, comprising 888, and the most common type of nonfamily households are 1-person households, comprising 538.
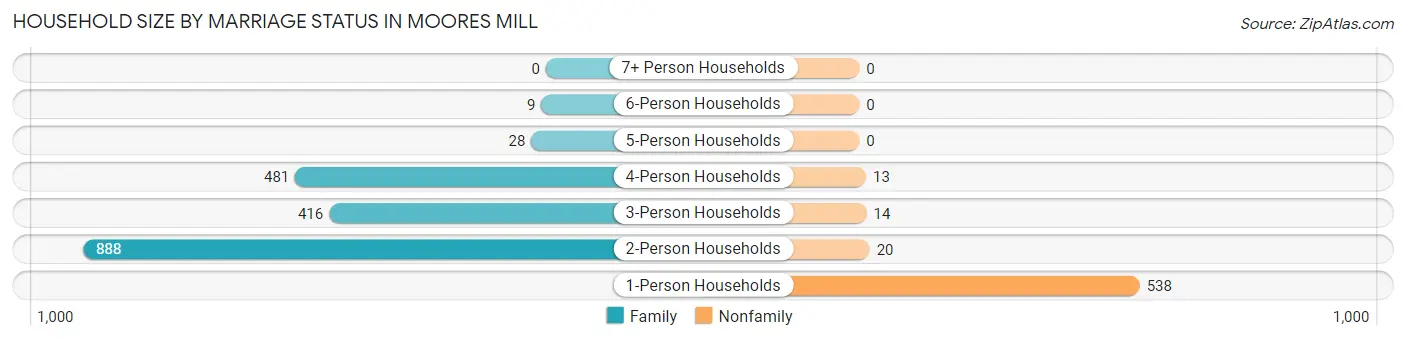
| Household Size | Family Households | Nonfamily Households |
| 1-Person Households | - | 538 (22.4%) |
| 2-Person Households | 888 (36.9%) | 20 (0.8%) |
| 3-Person Households | 416 (17.3%) | 14 (0.6%) |
| 4-Person Households | 481 (20.0%) | 13 (0.5%) |
| 5-Person Households | 28 (1.2%) | 0 (0.0%) |
| 6-Person Households | 9 (0.4%) | 0 (0.0%) |
| 7+ Person Households | 0 (0.0%) | 0 (0.0%) |
| Total | 1,822 (75.7%) | 585 (24.3%) |
Female Fertility in Moores Mill
Fertility by Age in Moores Mill
Average fertility rate in Moores Mill is 40.0 births per 1,000 women. Women in the age bracket of 20 to 34 years have the highest fertility rate with 125.0 births per 1,000 women. Women in the age bracket of 20 to 34 years acount for 100.0% of all women with births.
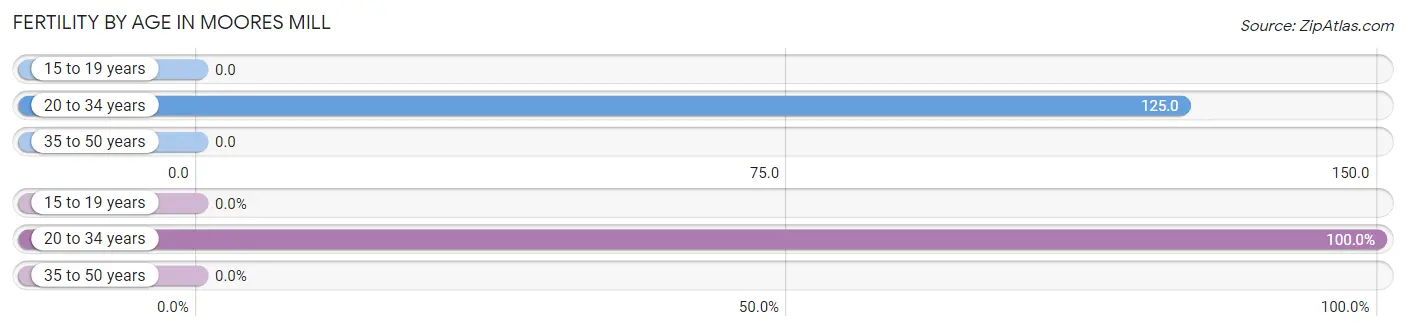
| Age Bracket | Women with Births | Births / 1,000 Women |
| 15 to 19 years | 0 (0.0%) | 0.0 |
| 20 to 34 years | 55 (100.0%) | 125.0 |
| 35 to 50 years | 0 (0.0%) | 0.0 |
| Total | 55 (100.0%) | 40.0 |
Fertility by Age by Marriage Status in Moores Mill
76.4% of women with births (55) in Moores Mill are married. The highest percentage of unmarried women with births falls into 20 to 34 years age bracket with 23.6% of them unmarried at the time of birth, while the lowest percentage of unmarried women with births belong to 20 to 34 years age bracket with 23.6% of them unmarried.
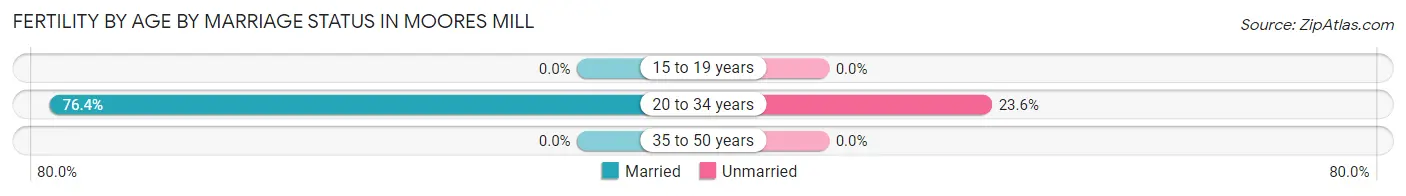
| Age Bracket | Married | Unmarried |
| 15 to 19 years | 0 (0.0%) | 0 (0.0%) |
| 20 to 34 years | 42 (76.4%) | 13 (23.6%) |
| 35 to 50 years | 0 (0.0%) | 0 (0.0%) |
| Total | 42 (76.4%) | 13 (23.6%) |
Fertility by Education in Moores Mill
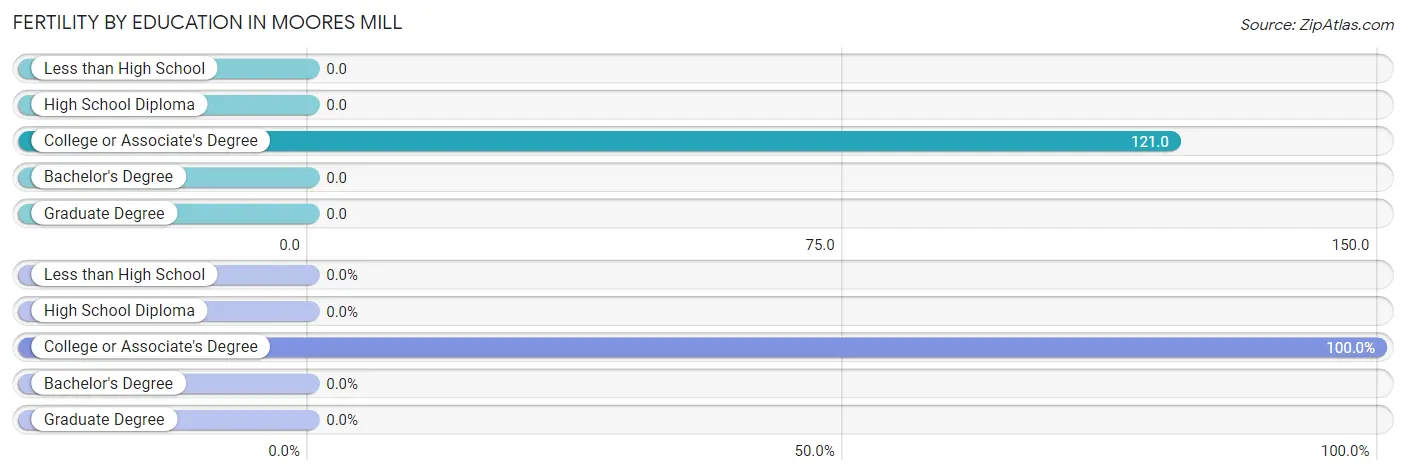
| Educational Attainment | Women with Births | Births / 1,000 Women |
| Less than High School | 0 (0.0%) | 0.0 |
| High School Diploma | 0 (0.0%) | 0.0 |
| College or Associate's Degree | 55 (100.0%) | 121.0 |
| Bachelor's Degree | 0 (0.0%) | 0.0 |
| Graduate Degree | 0 (0.0%) | 0.0 |
| Total | 55 (100.0%) | 40.0 |
Fertility by Education by Marriage Status in Moores Mill
23.6% of women with births in Moores Mill are unmarried. Women with the educational attainment of college or associate's degree are most likely to be married with 76.4% of them married at childbirth, while women with the educational attainment of college or associate's degree are least likely to be married with 23.6% of them unmarried at childbirth.
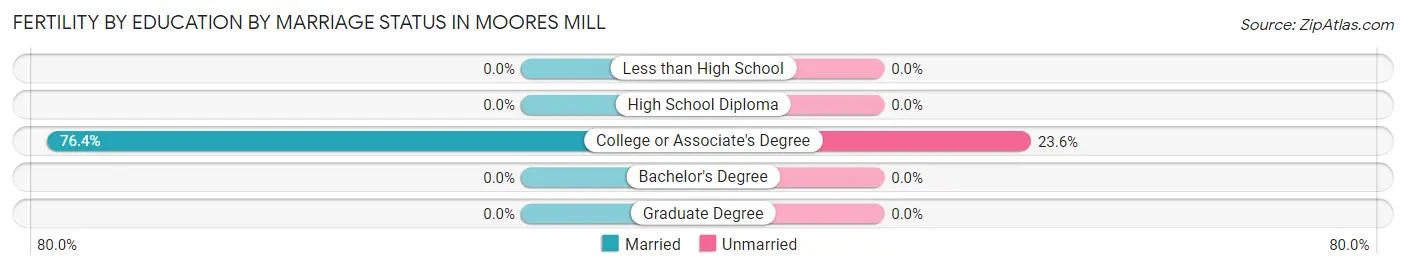
| Educational Attainment | Married | Unmarried |
| Less than High School | 0 (0.0%) | 0 (0.0%) |
| High School Diploma | 0 (0.0%) | 0 (0.0%) |
| College or Associate's Degree | 42 (76.4%) | 13 (23.6%) |
| Bachelor's Degree | 0 (0.0%) | 0 (0.0%) |
| Graduate Degree | 0 (0.0%) | 0 (0.0%) |
| Total | 42 (76.4%) | 13 (23.6%) |
Employment Characteristics in Moores Mill
Employment by Class of Employer in Moores Mill
Among the 3,110 employed individuals in Moores Mill, private company employees (1,852 | 59.6%), federal government employees (324 | 10.4%), and state government employees (311 | 10.0%) make up the most common classes of employment.
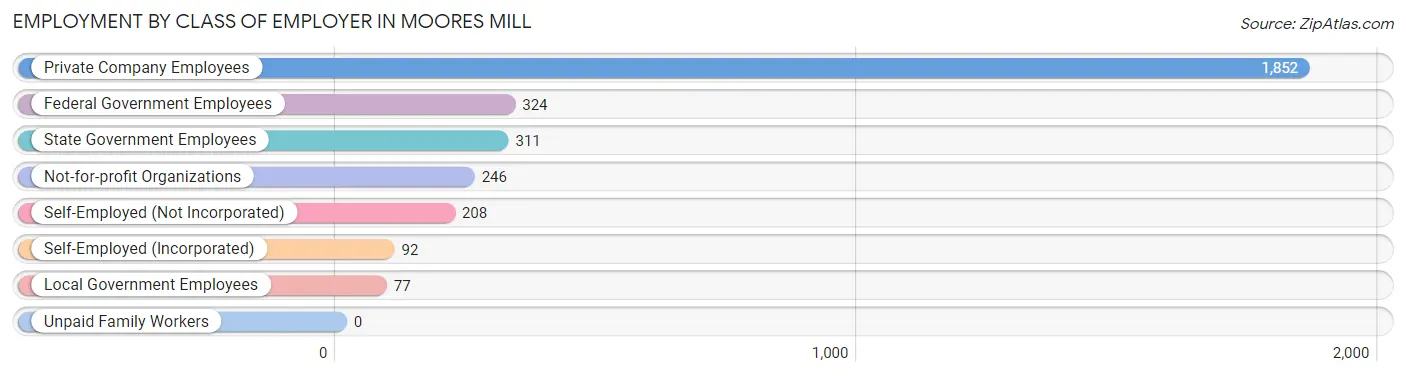
| Employer Class | # Employees | % Employees |
| Private Company Employees | 1,852 | 59.6% |
| Self-Employed (Incorporated) | 92 | 3.0% |
| Self-Employed (Not Incorporated) | 208 | 6.7% |
| Not-for-profit Organizations | 246 | 7.9% |
| Local Government Employees | 77 | 2.5% |
| State Government Employees | 311 | 10.0% |
| Federal Government Employees | 324 | 10.4% |
| Unpaid Family Workers | 0 | 0.0% |
| Total | 3,110 | 100.0% |
Employment Status by Age in Moores Mill
According to the labor force statistics for Moores Mill, out of the total population over 16 years of age (4,932), 65.5% or 3,230 individuals are in the labor force, with 2.8% or 90 of them unemployed. The age group with the highest labor force participation rate is 35 to 44 years, with 92.2% or 837 individuals in the labor force. Within the labor force, the 25 to 29 years age range has the highest percentage of unemployed individuals, with 26.6% or 59 of them being unemployed.
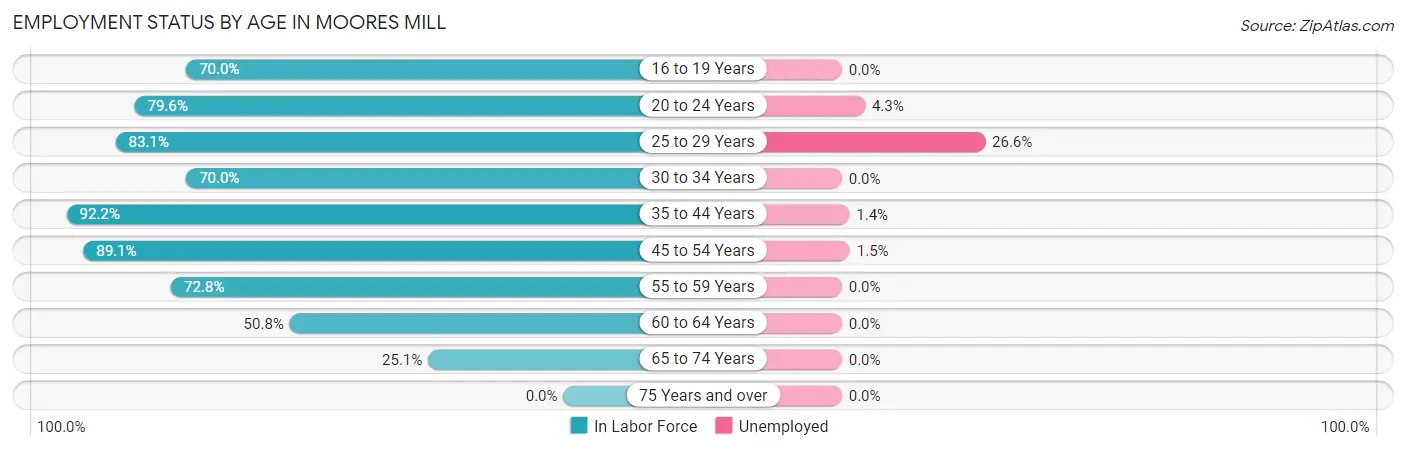
| Age Bracket | In Labor Force | Unemployed |
| 16 to 19 Years | 205 (70.0%) | 0 (0.0%) |
| 20 to 24 Years | 211 (79.6%) | 9 (4.3%) |
| 25 to 29 Years | 222 (83.1%) | 59 (26.6%) |
| 30 to 34 Years | 222 (70.0%) | 0 (0.0%) |
| 35 to 44 Years | 837 (92.2%) | 12 (1.4%) |
| 45 to 54 Years | 754 (89.1%) | 11 (1.5%) |
| 55 to 59 Years | 316 (72.8%) | 0 (0.0%) |
| 60 to 64 Years | 285 (50.8%) | 0 (0.0%) |
| 65 to 74 Years | 180 (25.1%) | 0 (0.0%) |
| 75 Years and over | 0 (0.0%) | 0 (0.0%) |
| Total | 3,230 (65.5%) | 90 (2.8%) |
Employment Status by Educational Attainment in Moores Mill
According to labor force statistics for Moores Mill, 79.1% of individuals (2,636) out of the total population between 25 and 64 years of age (3,333) are in the labor force, with 3.1% or 82 of them being unemployed. The group with the highest labor force participation rate are those with the educational attainment of college / associate degree, with 84.0% or 838 individuals in the labor force. Within the labor force, individuals with college / associate degree education have the highest percentage of unemployment, with 5.6% or 47 of them being unemployed.
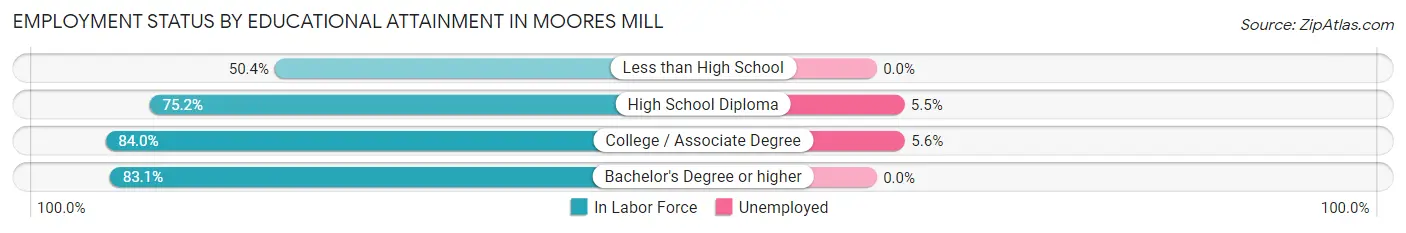
| Educational Attainment | In Labor Force | Unemployed |
| Less than High School | 117 (50.4%) | 0 (0.0%) |
| High School Diploma | 631 (75.2%) | 46 (5.5%) |
| College / Associate Degree | 838 (84.0%) | 56 (5.6%) |
| Bachelor's Degree or higher | 1,050 (83.1%) | 0 (0.0%) |
| Total | 2,636 (79.1%) | 103 (3.1%) |
Employment Occupations by Sex in Moores Mill
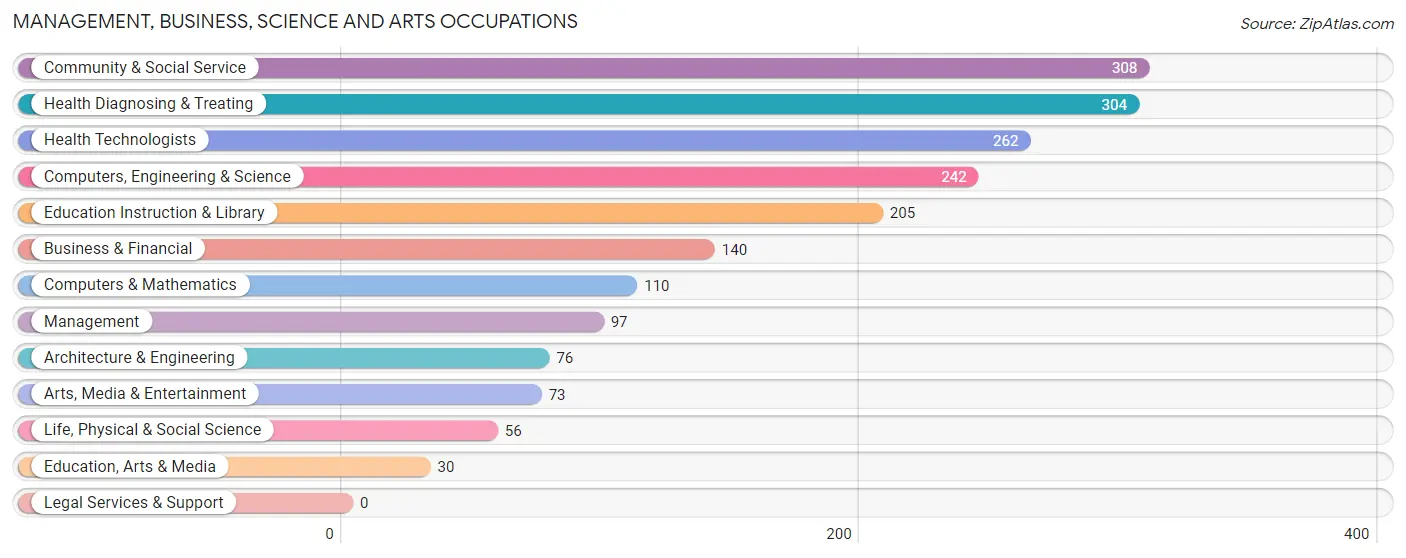
Management, Business, Science and Arts Occupations
The most common Management, Business, Science and Arts occupations in Moores Mill are Community & Social Service (308 | 9.8%), Health Diagnosing & Treating (304 | 9.7%), Health Technologists (262 | 8.4%), Computers, Engineering & Science (242 | 7.7%), and Education Instruction & Library (205 | 6.6%).
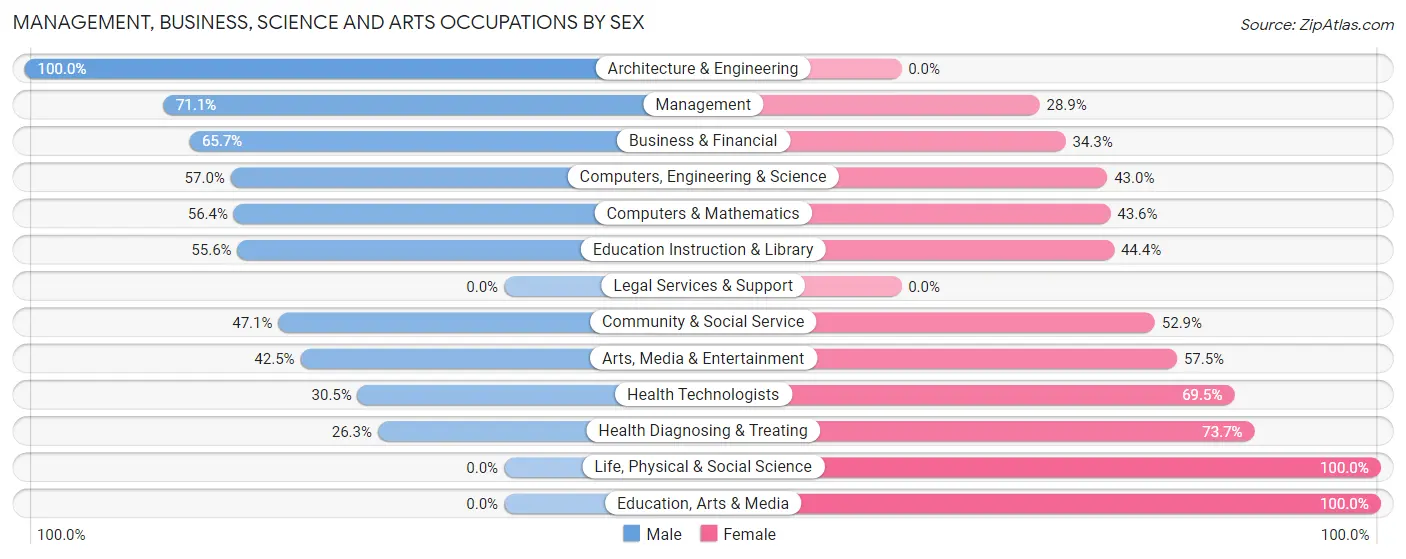
Management, Business, Science and Arts Occupations by Sex
Within the Management, Business, Science and Arts occupations in Moores Mill, the most male-oriented occupations are Architecture & Engineering (100.0%), Management (71.1%), and Business & Financial (65.7%), while the most female-oriented occupations are Life, Physical & Social Science (100.0%), Education, Arts & Media (100.0%), and Health Diagnosing & Treating (73.7%).
| Occupation | Male | Female |
| Management | 69 (71.1%) | 28 (28.9%) |
| Business & Financial | 92 (65.7%) | 48 (34.3%) |
| Computers, Engineering & Science | 138 (57.0%) | 104 (43.0%) |
| Computers & Mathematics | 62 (56.4%) | 48 (43.6%) |
| Architecture & Engineering | 76 (100.0%) | 0 (0.0%) |
| Life, Physical & Social Science | 0 (0.0%) | 56 (100.0%) |
| Community & Social Service | 145 (47.1%) | 163 (52.9%) |
| Education, Arts & Media | 0 (0.0%) | 30 (100.0%) |
| Legal Services & Support | 0 (0.0%) | 0 (0.0%) |
| Education Instruction & Library | 114 (55.6%) | 91 (44.4%) |
| Arts, Media & Entertainment | 31 (42.5%) | 42 (57.5%) |
| Health Diagnosing & Treating | 80 (26.3%) | 224 (73.7%) |
| Health Technologists | 80 (30.5%) | 182 (69.5%) |
| Total (Category) | 524 (48.0%) | 567 (52.0%) |
| Total (Overall) | 1,656 (52.9%) | 1,476 (47.1%) |
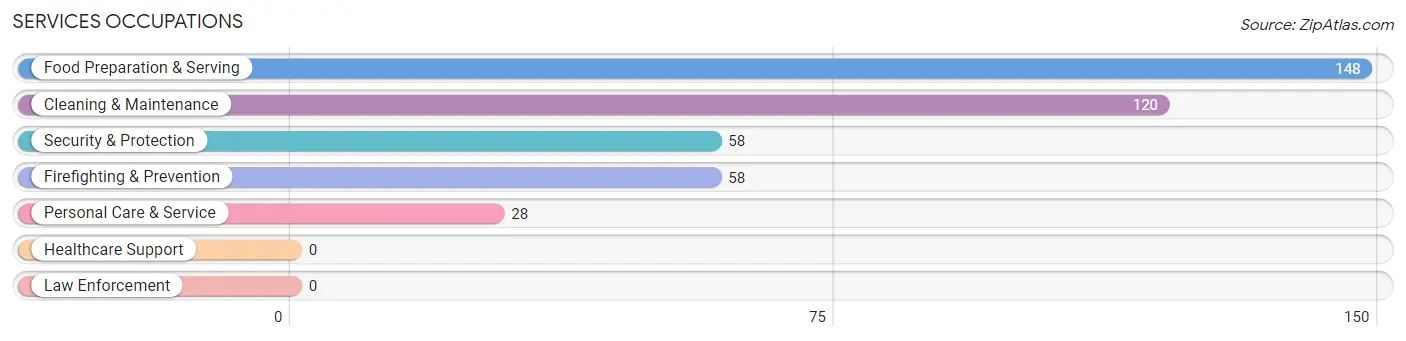
Services Occupations
The most common Services occupations in Moores Mill are Food Preparation & Serving (148 | 4.7%), Cleaning & Maintenance (120 | 3.8%), Security & Protection (58 | 1.8%), Firefighting & Prevention (58 | 1.8%), and Personal Care & Service (28 | 0.9%).
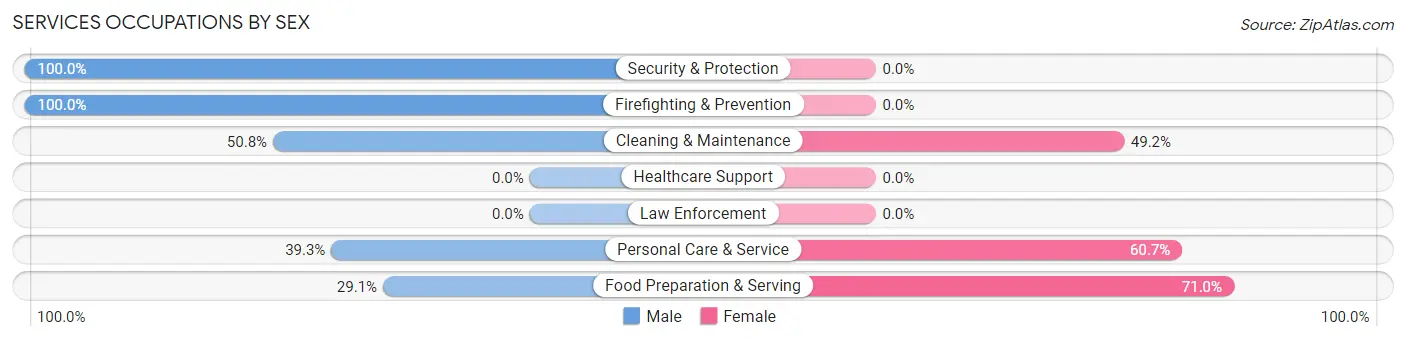
Services Occupations by Sex
Within the Services occupations in Moores Mill, the most male-oriented occupations are Security & Protection (100.0%), Firefighting & Prevention (100.0%), and Cleaning & Maintenance (50.8%), while the most female-oriented occupations are Food Preparation & Serving (71.0%), Personal Care & Service (60.7%), and Cleaning & Maintenance (49.2%).
| Occupation | Male | Female |
| Healthcare Support | 0 (0.0%) | 0 (0.0%) |
| Security & Protection | 58 (100.0%) | 0 (0.0%) |
| Firefighting & Prevention | 58 (100.0%) | 0 (0.0%) |
| Law Enforcement | 0 (0.0%) | 0 (0.0%) |
| Food Preparation & Serving | 43 (29.0%) | 105 (71.0%) |
| Cleaning & Maintenance | 61 (50.8%) | 59 (49.2%) |
| Personal Care & Service | 11 (39.3%) | 17 (60.7%) |
| Total (Category) | 173 (48.9%) | 181 (51.1%) |
| Total (Overall) | 1,656 (52.9%) | 1,476 (47.1%) |
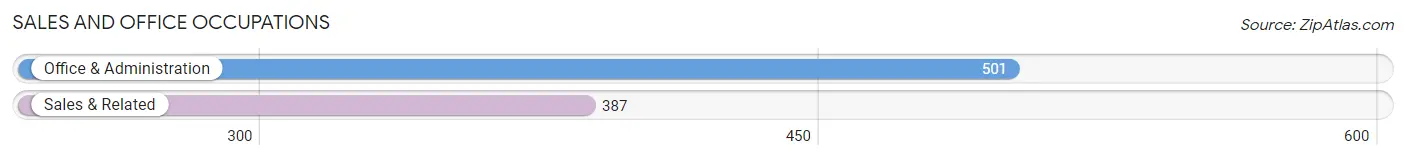
Sales and Office Occupations
The most common Sales and Office occupations in Moores Mill are Office & Administration (501 | 16.0%), and Sales & Related (387 | 12.4%).
Sales and Office Occupations by Sex
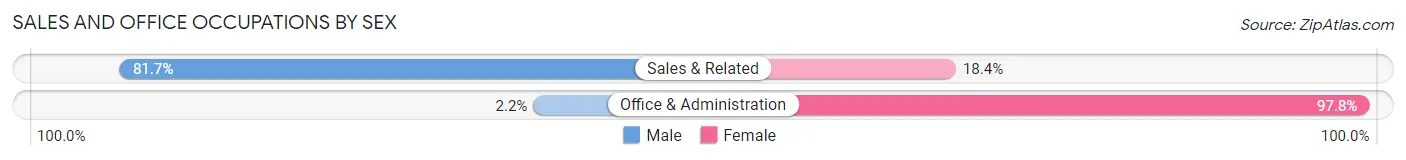
| Occupation | Male | Female |
| Sales & Related | 316 (81.7%) | 71 (18.3%) |
| Office & Administration | 11 (2.2%) | 490 (97.8%) |
| Total (Category) | 327 (36.8%) | 561 (63.2%) |
| Total (Overall) | 1,656 (52.9%) | 1,476 (47.1%) |
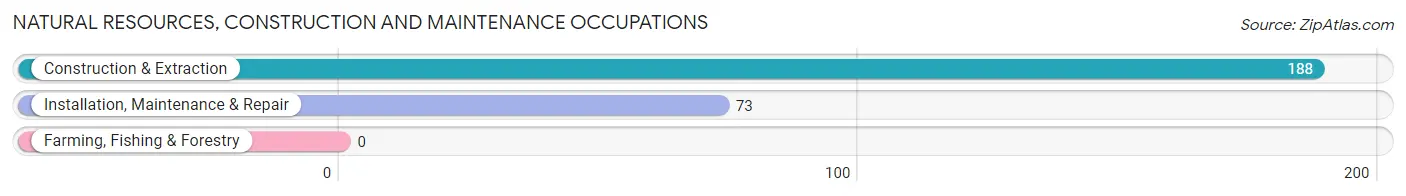
Natural Resources, Construction and Maintenance Occupations
The most common Natural Resources, Construction and Maintenance occupations in Moores Mill are Construction & Extraction (188 | 6.0%), and Installation, Maintenance & Repair (73 | 2.3%).
Natural Resources, Construction and Maintenance Occupations by Sex
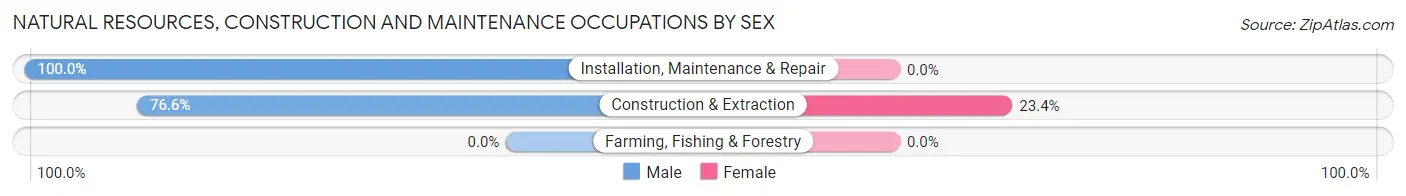
| Occupation | Male | Female |
| Farming, Fishing & Forestry | 0 (0.0%) | 0 (0.0%) |
| Construction & Extraction | 144 (76.6%) | 44 (23.4%) |
| Installation, Maintenance & Repair | 73 (100.0%) | 0 (0.0%) |
| Total (Category) | 217 (83.1%) | 44 (16.9%) |
| Total (Overall) | 1,656 (52.9%) | 1,476 (47.1%) |
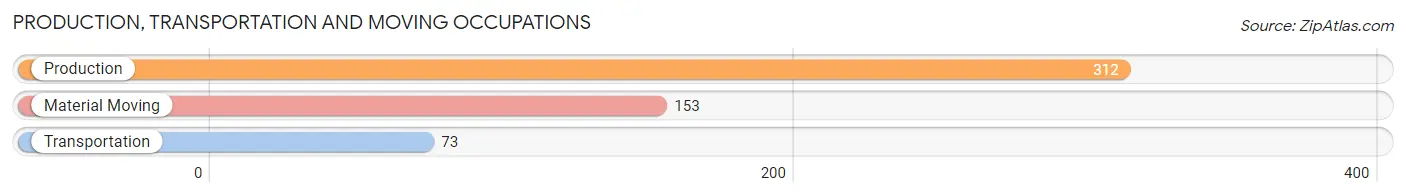
Production, Transportation and Moving Occupations
The most common Production, Transportation and Moving occupations in Moores Mill are Production (312 | 10.0%), Material Moving (153 | 4.9%), and Transportation (73 | 2.3%).
Production, Transportation and Moving Occupations by Sex
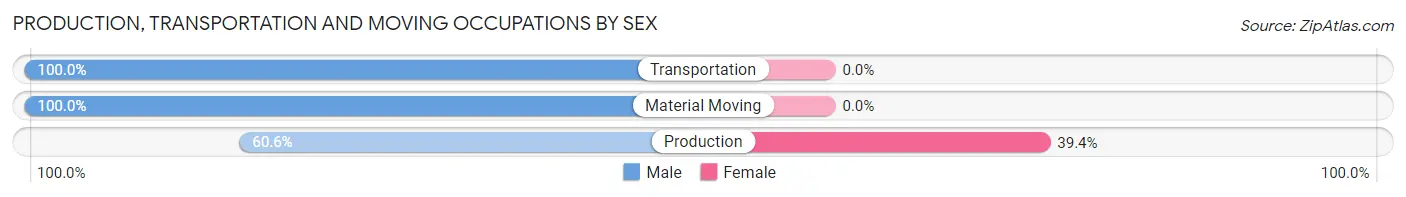
| Occupation | Male | Female |
| Production | 189 (60.6%) | 123 (39.4%) |
| Transportation | 73 (100.0%) | 0 (0.0%) |
| Material Moving | 153 (100.0%) | 0 (0.0%) |
| Total (Category) | 415 (77.1%) | 123 (22.9%) |
| Total (Overall) | 1,656 (52.9%) | 1,476 (47.1%) |
Employment Industries by Sex in Moores Mill
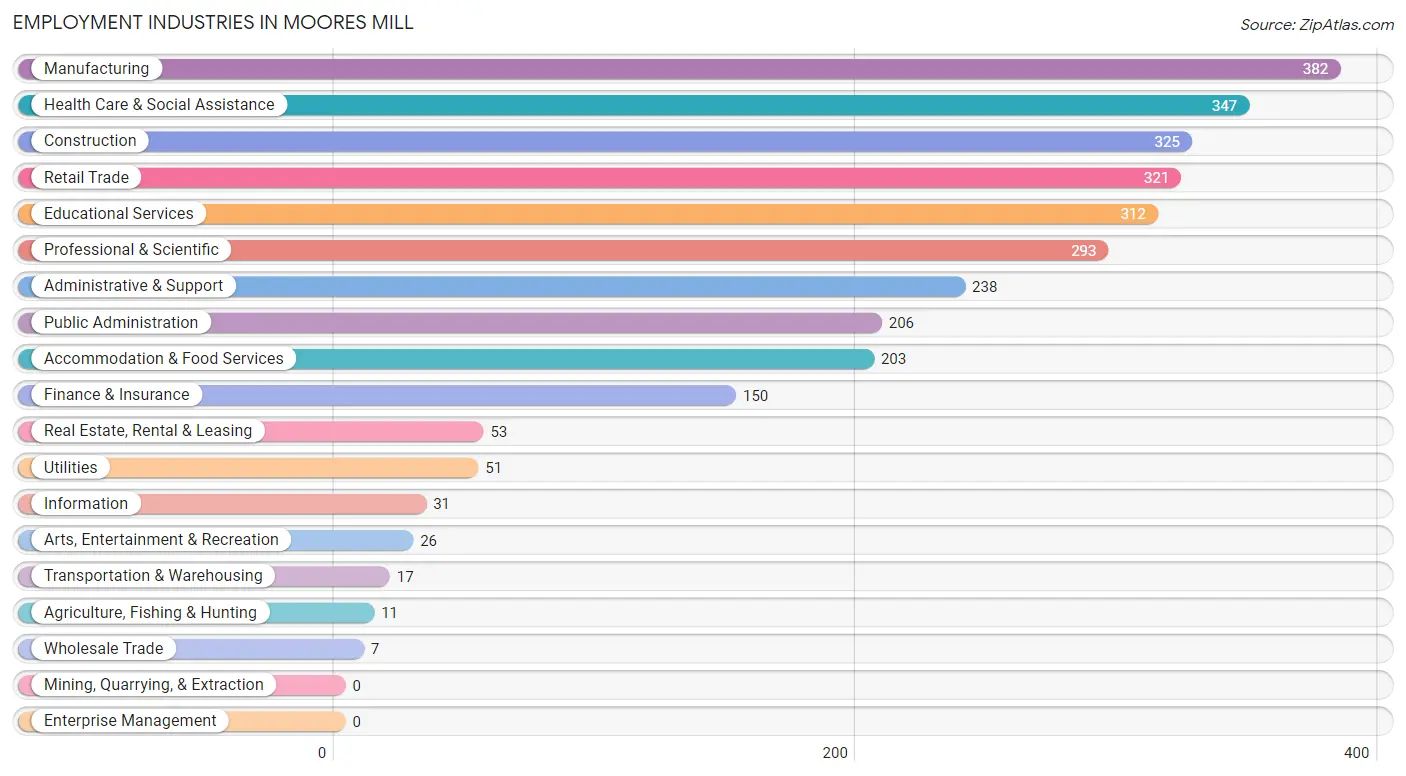
Employment Industries in Moores Mill
The major employment industries in Moores Mill include Manufacturing (382 | 12.2%), Health Care & Social Assistance (347 | 11.1%), Construction (325 | 10.4%), Retail Trade (321 | 10.2%), and Educational Services (312 | 10.0%).
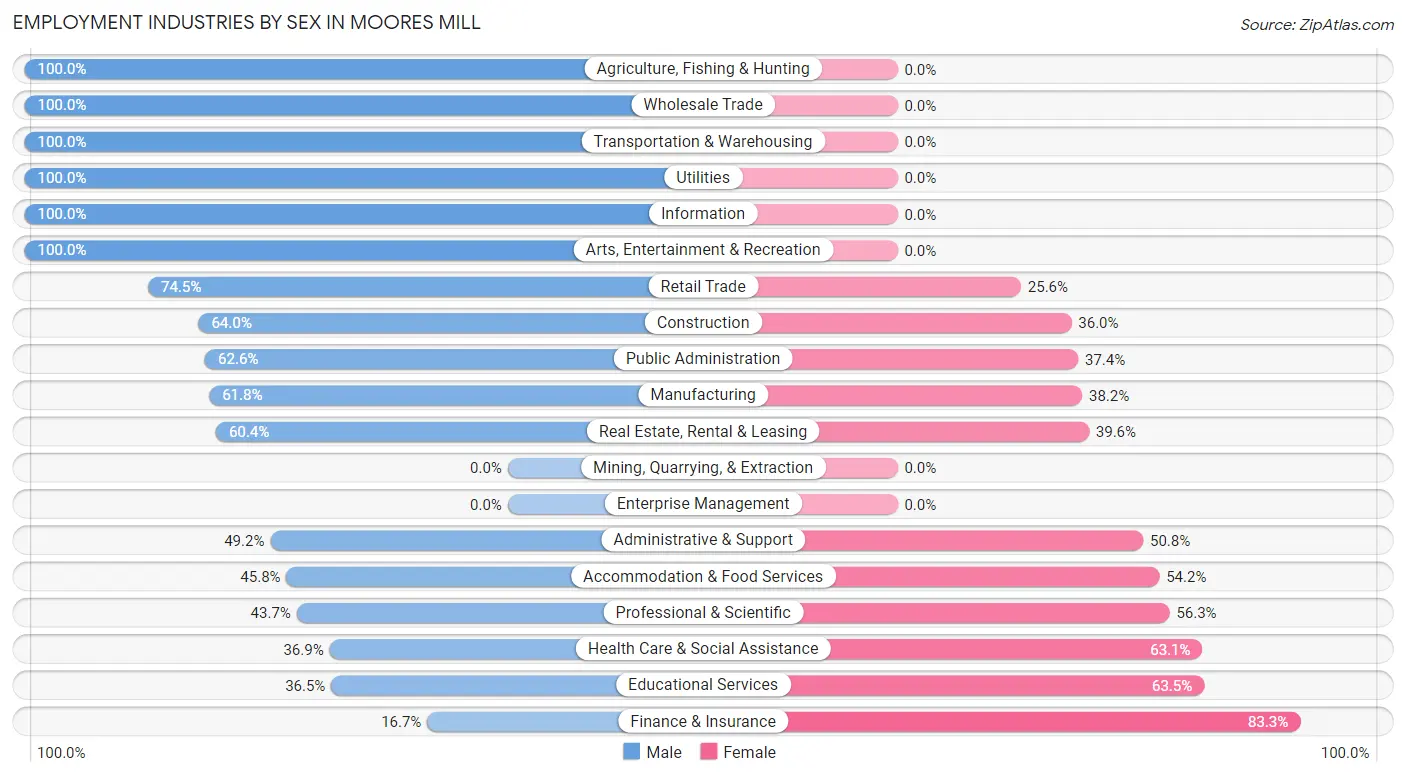
Employment Industries by Sex in Moores Mill
The Moores Mill industries that see more men than women are Agriculture, Fishing & Hunting (100.0%), Wholesale Trade (100.0%), and Transportation & Warehousing (100.0%), whereas the industries that tend to have a higher number of women are Finance & Insurance (83.3%), Educational Services (63.5%), and Health Care & Social Assistance (63.1%).
| Industry | Male | Female |
| Agriculture, Fishing & Hunting | 11 (100.0%) | 0 (0.0%) |
| Mining, Quarrying, & Extraction | 0 (0.0%) | 0 (0.0%) |
| Construction | 208 (64.0%) | 117 (36.0%) |
| Manufacturing | 236 (61.8%) | 146 (38.2%) |
| Wholesale Trade | 7 (100.0%) | 0 (0.0%) |
| Retail Trade | 239 (74.5%) | 82 (25.6%) |
| Transportation & Warehousing | 17 (100.0%) | 0 (0.0%) |
| Utilities | 51 (100.0%) | 0 (0.0%) |
| Information | 31 (100.0%) | 0 (0.0%) |
| Finance & Insurance | 25 (16.7%) | 125 (83.3%) |
| Real Estate, Rental & Leasing | 32 (60.4%) | 21 (39.6%) |
| Professional & Scientific | 128 (43.7%) | 165 (56.3%) |
| Enterprise Management | 0 (0.0%) | 0 (0.0%) |
| Administrative & Support | 117 (49.2%) | 121 (50.8%) |
| Educational Services | 114 (36.5%) | 198 (63.5%) |
| Health Care & Social Assistance | 128 (36.9%) | 219 (63.1%) |
| Arts, Entertainment & Recreation | 26 (100.0%) | 0 (0.0%) |
| Accommodation & Food Services | 93 (45.8%) | 110 (54.2%) |
| Public Administration | 129 (62.6%) | 77 (37.4%) |
| Total | 1,656 (52.9%) | 1,476 (47.1%) |
Education in Moores Mill
School Enrollment in Moores Mill
The most common levels of schooling among the 1,272 students in Moores Mill are college / undergraduate (425 | 33.4%), elementary school (242 | 19.0%), and middle school (241 | 19.0%).
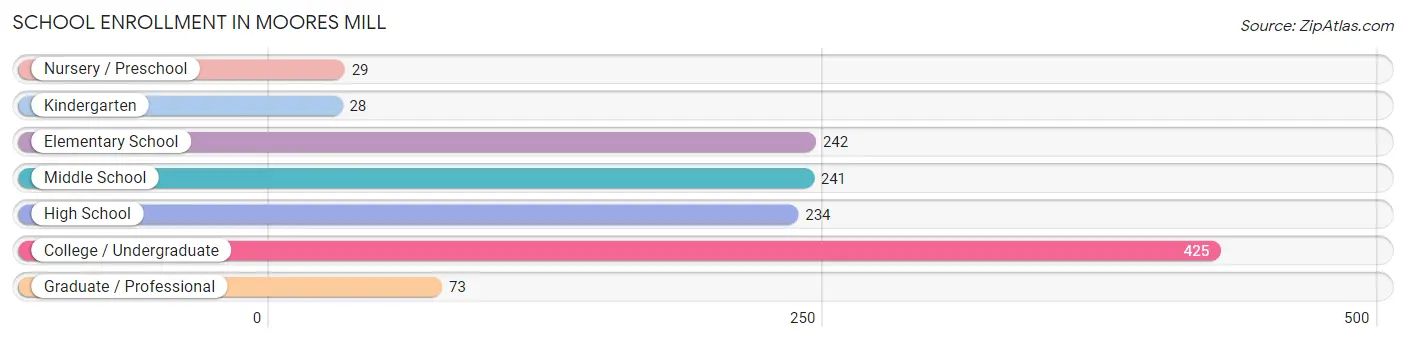
| School Level | # Students | % Students |
| Nursery / Preschool | 29 | 2.3% |
| Kindergarten | 28 | 2.2% |
| Elementary School | 242 | 19.0% |
| Middle School | 241 | 19.0% |
| High School | 234 | 18.4% |
| College / Undergraduate | 425 | 33.4% |
| Graduate / Professional | 73 | 5.7% |
| Total | 1,272 | 100.0% |
School Enrollment by Age by Funding Source in Moores Mill
Out of a total of 1,272 students who are enrolled in schools in Moores Mill, 232 (18.2%) attend a private institution, while the remaining 1,040 (81.8%) are enrolled in public schools. The age group of 35 years and over has the highest likelihood of being enrolled in private schools, with 56 (76.7% in the age bracket) enrolled. Conversely, the age group of 10 to 14 year olds has the lowest likelihood of being enrolled in a private school, with 264 (100.0% in the age bracket) attending a public institution.
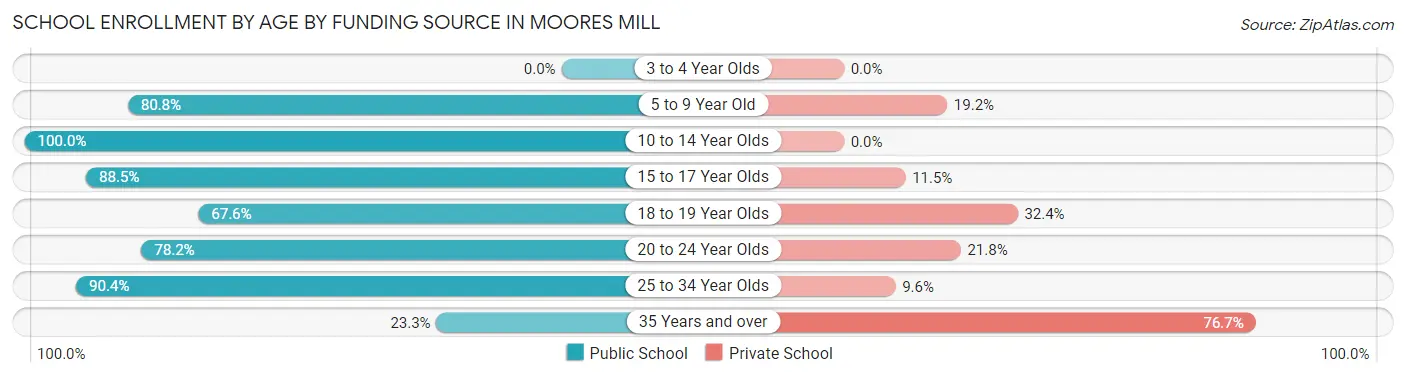
| Age Bracket | Public School | Private School |
| 3 to 4 Year Olds | 0 (0.0%) | 0 (0.0%) |
| 5 to 9 Year Old | 231 (80.8%) | 55 (19.2%) |
| 10 to 14 Year Olds | 264 (100.0%) | 0 (0.0%) |
| 15 to 17 Year Olds | 170 (88.5%) | 22 (11.5%) |
| 18 to 19 Year Olds | 94 (67.6%) | 45 (32.4%) |
| 20 to 24 Year Olds | 151 (78.2%) | 42 (21.8%) |
| 25 to 34 Year Olds | 113 (90.4%) | 12 (9.6%) |
| 35 Years and over | 17 (23.3%) | 56 (76.7%) |
| Total | 1,040 (81.8%) | 232 (18.2%) |
Educational Attainment by Field of Study in Moores Mill
Business (556 | 33.4%), engineering (253 | 15.2%), science & technology (214 | 12.9%), computers & mathematics (147 | 8.8%), and psychology (72 | 4.3%) are the most common fields of study among 1,665 individuals in Moores Mill who have obtained a bachelor's degree or higher.
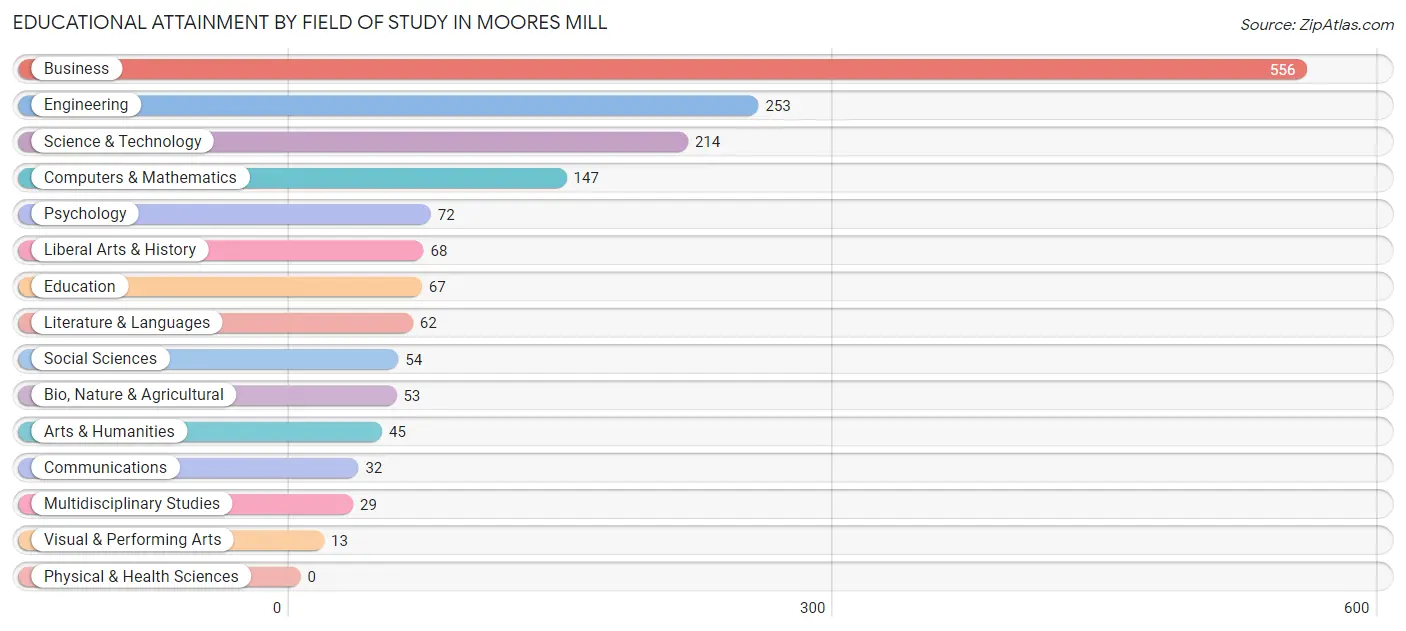
| Field of Study | # Graduates | % Graduates |
| Computers & Mathematics | 147 | 8.8% |
| Bio, Nature & Agricultural | 53 | 3.2% |
| Physical & Health Sciences | 0 | 0.0% |
| Psychology | 72 | 4.3% |
| Social Sciences | 54 | 3.2% |
| Engineering | 253 | 15.2% |
| Multidisciplinary Studies | 29 | 1.7% |
| Science & Technology | 214 | 12.9% |
| Business | 556 | 33.4% |
| Education | 67 | 4.0% |
| Literature & Languages | 62 | 3.7% |
| Liberal Arts & History | 68 | 4.1% |
| Visual & Performing Arts | 13 | 0.8% |
| Communications | 32 | 1.9% |
| Arts & Humanities | 45 | 2.7% |
| Total | 1,665 | 100.0% |
Transportation & Commute in Moores Mill
Vehicle Availability by Sex in Moores Mill
The most prevalent vehicle ownership categories in Moores Mill are males with 2 vehicles (662, accounting for 40.2%) and females with 2 vehicles (669, making up 45.3%).
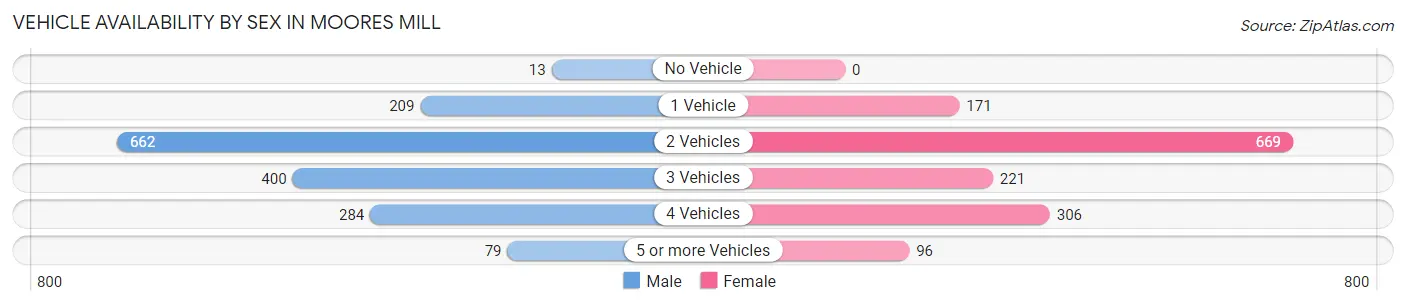
| Vehicles Available | Male | Female |
| No Vehicle | 13 (0.8%) | 0 (0.0%) |
| 1 Vehicle | 209 (12.7%) | 171 (11.7%) |
| 2 Vehicles | 662 (40.2%) | 669 (45.7%) |
| 3 Vehicles | 400 (24.3%) | 221 (15.1%) |
| 4 Vehicles | 284 (17.2%) | 306 (20.9%) |
| 5 or more Vehicles | 79 (4.8%) | 96 (6.6%) |
| Total | 1,647 (100.0%) | 1,463 (100.0%) |
Commute Time in Moores Mill
The most frequently occuring commute durations in Moores Mill are 20 to 24 minutes (866 commuters, 29.1%), 30 to 34 minutes (601 commuters, 20.2%), and 15 to 19 minutes (585 commuters, 19.7%).
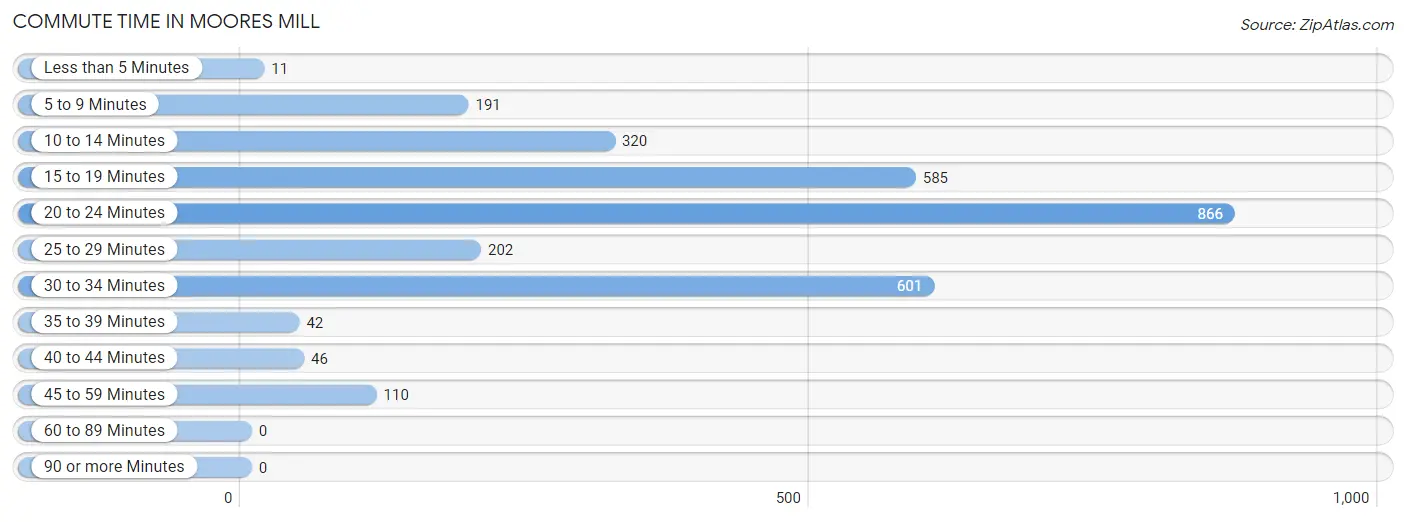
| Commute Time | # Commuters | % Commuters |
| Less than 5 Minutes | 11 | 0.4% |
| 5 to 9 Minutes | 191 | 6.4% |
| 10 to 14 Minutes | 320 | 10.8% |
| 15 to 19 Minutes | 585 | 19.7% |
| 20 to 24 Minutes | 866 | 29.1% |
| 25 to 29 Minutes | 202 | 6.8% |
| 30 to 34 Minutes | 601 | 20.2% |
| 35 to 39 Minutes | 42 | 1.4% |
| 40 to 44 Minutes | 46 | 1.5% |
| 45 to 59 Minutes | 110 | 3.7% |
| 60 to 89 Minutes | 0 | 0.0% |
| 90 or more Minutes | 0 | 0.0% |
Commute Time by Sex in Moores Mill
The most common commute times in Moores Mill are 20 to 24 minutes (556 commuters, 34.6%) for males and 30 to 34 minutes (438 commuters, 32.0%) for females.
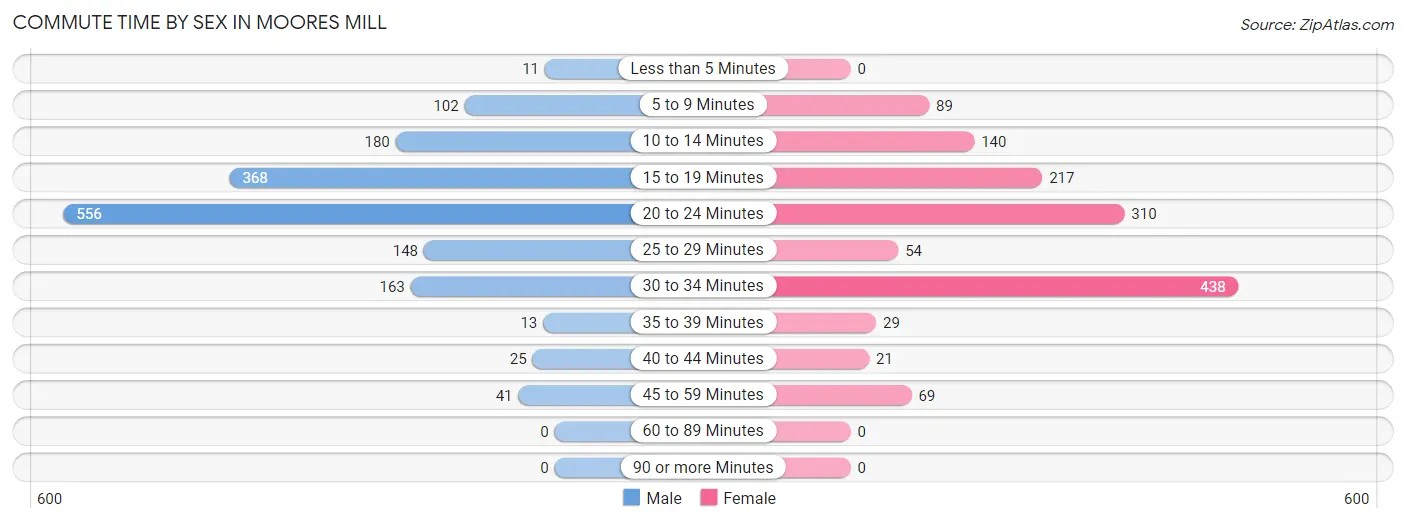
| Commute Time | Male | Female |
| Less than 5 Minutes | 11 (0.7%) | 0 (0.0%) |
| 5 to 9 Minutes | 102 (6.4%) | 89 (6.5%) |
| 10 to 14 Minutes | 180 (11.2%) | 140 (10.2%) |
| 15 to 19 Minutes | 368 (22.9%) | 217 (15.9%) |
| 20 to 24 Minutes | 556 (34.6%) | 310 (22.7%) |
| 25 to 29 Minutes | 148 (9.2%) | 54 (4.0%) |
| 30 to 34 Minutes | 163 (10.1%) | 438 (32.0%) |
| 35 to 39 Minutes | 13 (0.8%) | 29 (2.1%) |
| 40 to 44 Minutes | 25 (1.6%) | 21 (1.5%) |
| 45 to 59 Minutes | 41 (2.5%) | 69 (5.1%) |
| 60 to 89 Minutes | 0 (0.0%) | 0 (0.0%) |
| 90 or more Minutes | 0 (0.0%) | 0 (0.0%) |
Time of Departure to Work by Sex in Moores Mill
The most frequent times of departure to work in Moores Mill are 8:00 AM to 8:29 AM (229, 14.2%) for males and 6:30 AM to 6:59 AM (315, 23.0%) for females.
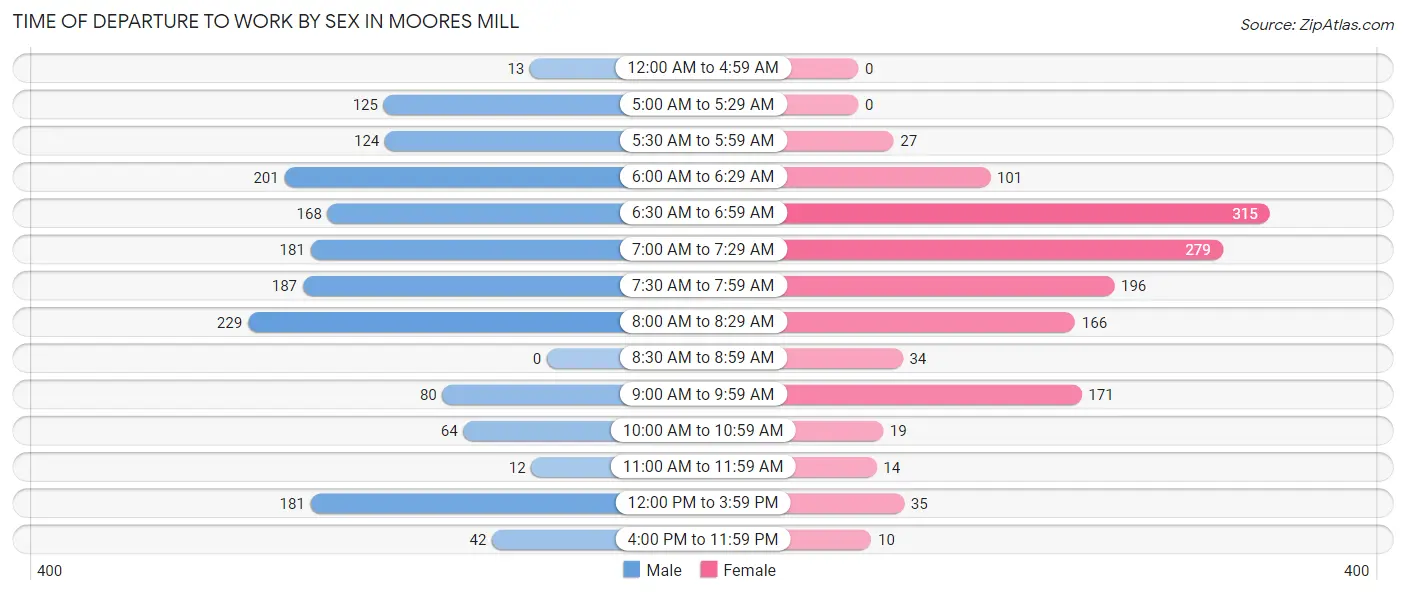
| Time of Departure | Male | Female |
| 12:00 AM to 4:59 AM | 13 (0.8%) | 0 (0.0%) |
| 5:00 AM to 5:29 AM | 125 (7.8%) | 0 (0.0%) |
| 5:30 AM to 5:59 AM | 124 (7.7%) | 27 (2.0%) |
| 6:00 AM to 6:29 AM | 201 (12.5%) | 101 (7.4%) |
| 6:30 AM to 6:59 AM | 168 (10.4%) | 315 (23.0%) |
| 7:00 AM to 7:29 AM | 181 (11.3%) | 279 (20.4%) |
| 7:30 AM to 7:59 AM | 187 (11.6%) | 196 (14.3%) |
| 8:00 AM to 8:29 AM | 229 (14.2%) | 166 (12.1%) |
| 8:30 AM to 8:59 AM | 0 (0.0%) | 34 (2.5%) |
| 9:00 AM to 9:59 AM | 80 (5.0%) | 171 (12.5%) |
| 10:00 AM to 10:59 AM | 64 (4.0%) | 19 (1.4%) |
| 11:00 AM to 11:59 AM | 12 (0.7%) | 14 (1.0%) |
| 12:00 PM to 3:59 PM | 181 (11.3%) | 35 (2.6%) |
| 4:00 PM to 11:59 PM | 42 (2.6%) | 10 (0.7%) |
| Total | 1,607 (100.0%) | 1,367 (100.0%) |
Housing Occupancy in Moores Mill
Occupancy by Ownership in Moores Mill
Of the total 2,407 dwellings in Moores Mill, owner-occupied units account for 1,965 (81.6%), while renter-occupied units make up 442 (18.4%).
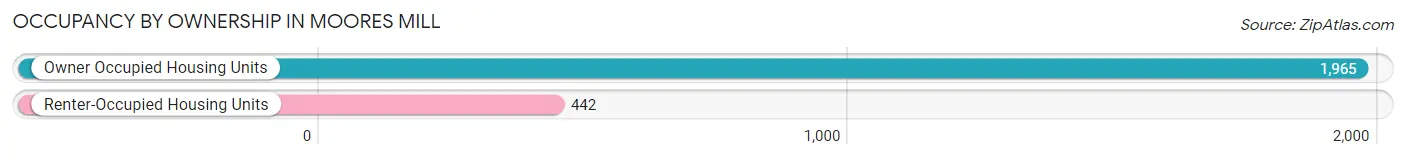
| Occupancy | # Housing Units | % Housing Units |
| Owner Occupied Housing Units | 1,965 | 81.6% |
| Renter-Occupied Housing Units | 442 | 18.4% |
| Total Occupied Housing Units | 2,407 | 100.0% |
Occupancy by Household Size in Moores Mill
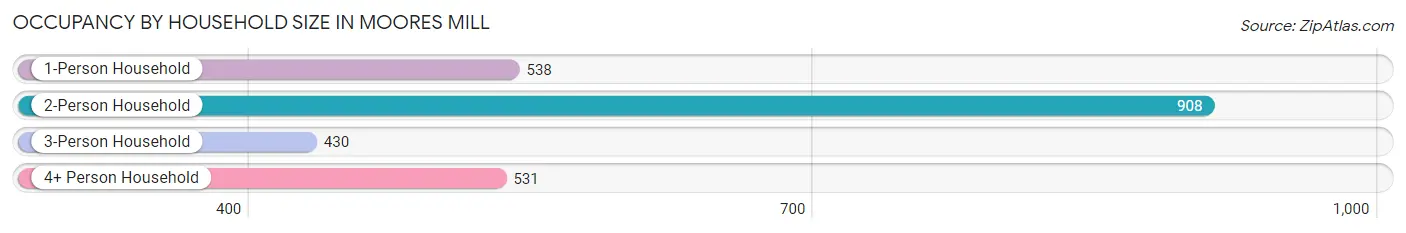
| Household Size | # Housing Units | % Housing Units |
| 1-Person Household | 538 | 22.4% |
| 2-Person Household | 908 | 37.7% |
| 3-Person Household | 430 | 17.9% |
| 4+ Person Household | 531 | 22.1% |
| Total Housing Units | 2,407 | 100.0% |
Occupancy by Ownership by Household Size in Moores Mill
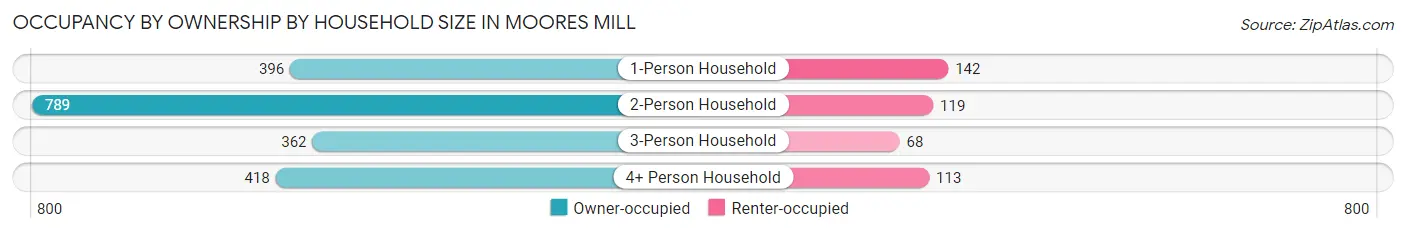
| Household Size | Owner-occupied | Renter-occupied |
| 1-Person Household | 396 (73.6%) | 142 (26.4%) |
| 2-Person Household | 789 (86.9%) | 119 (13.1%) |
| 3-Person Household | 362 (84.2%) | 68 (15.8%) |
| 4+ Person Household | 418 (78.7%) | 113 (21.3%) |
| Total Housing Units | 1,965 (81.6%) | 442 (18.4%) |
Occupancy by Educational Attainment in Moores Mill
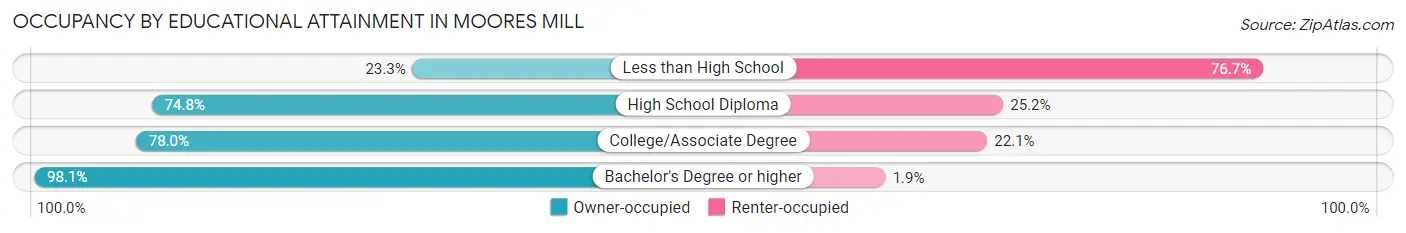
| Household Size | Owner-occupied | Renter-occupied |
| Less than High School | 41 (23.3%) | 135 (76.7%) |
| High School Diploma | 383 (74.8%) | 129 (25.2%) |
| College/Associate Degree | 562 (77.9%) | 159 (22.1%) |
| Bachelor's Degree or higher | 979 (98.1%) | 19 (1.9%) |
Occupancy by Age of Householder in Moores Mill
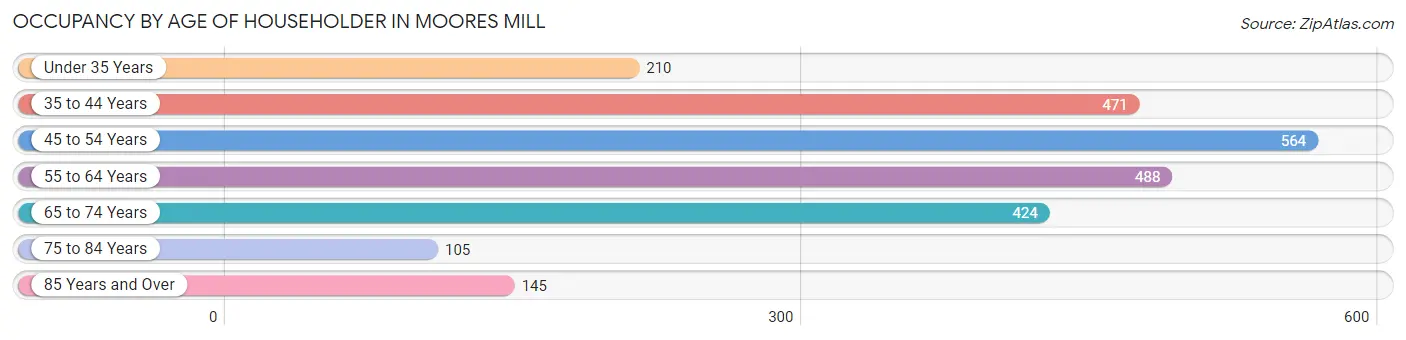
| Age Bracket | # Households | % Households |
| Under 35 Years | 210 | 8.7% |
| 35 to 44 Years | 471 | 19.6% |
| 45 to 54 Years | 564 | 23.4% |
| 55 to 64 Years | 488 | 20.3% |
| 65 to 74 Years | 424 | 17.6% |
| 75 to 84 Years | 105 | 4.4% |
| 85 Years and Over | 145 | 6.0% |
| Total | 2,407 | 100.0% |
Housing Finances in Moores Mill
Median Income by Occupancy in Moores Mill
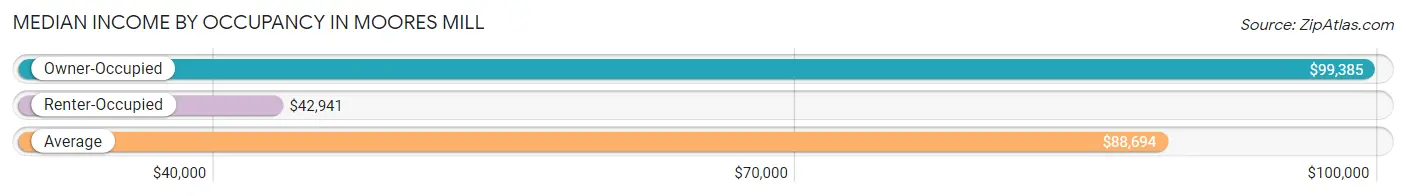
| Occupancy Type | # Households | Median Income |
| Owner-Occupied | 1,965 (81.6%) | $99,385 |
| Renter-Occupied | 442 (18.4%) | $42,941 |
| Average | 2,407 (100.0%) | $88,694 |
Occupancy by Householder Income Bracket in Moores Mill
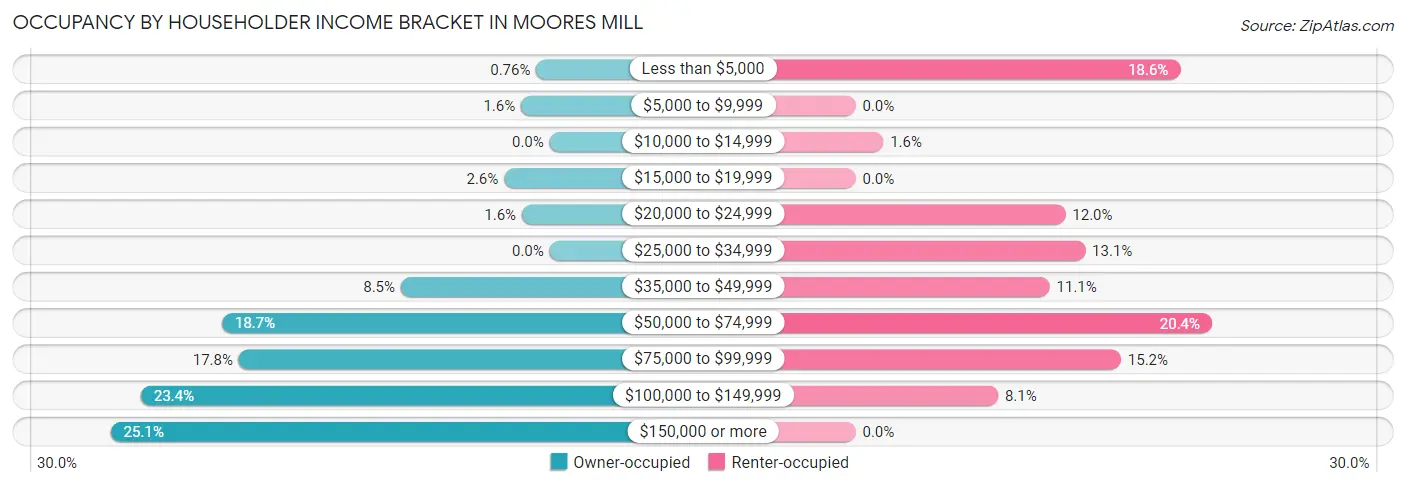
| Income Bracket | Owner-occupied | Renter-occupied |
| Less than $5,000 | 15 (0.8%) | 82 (18.5%) |
| $5,000 to $9,999 | 32 (1.6%) | 0 (0.0%) |
| $10,000 to $14,999 | 0 (0.0%) | 7 (1.6%) |
| $15,000 to $19,999 | 51 (2.6%) | 0 (0.0%) |
| $20,000 to $24,999 | 31 (1.6%) | 53 (12.0%) |
| $25,000 to $34,999 | 0 (0.0%) | 58 (13.1%) |
| $35,000 to $49,999 | 167 (8.5%) | 49 (11.1%) |
| $50,000 to $74,999 | 368 (18.7%) | 90 (20.4%) |
| $75,000 to $99,999 | 349 (17.8%) | 67 (15.2%) |
| $100,000 to $149,999 | 459 (23.4%) | 36 (8.1%) |
| $150,000 or more | 493 (25.1%) | 0 (0.0%) |
| Total | 1,965 (100.0%) | 442 (100.0%) |
Monthly Housing Cost Tiers in Moores Mill
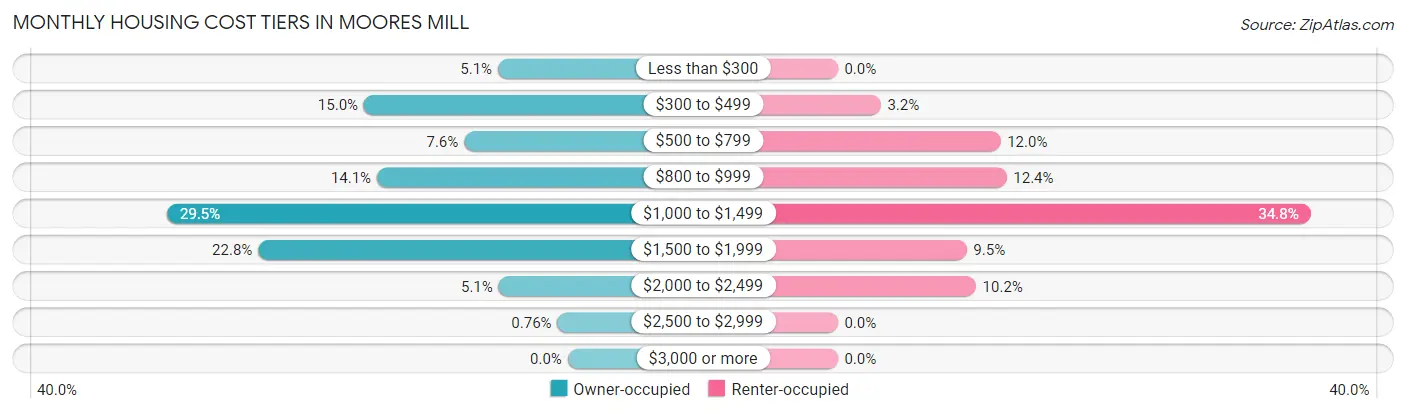
| Monthly Cost | Owner-occupied | Renter-occupied |
| Less than $300 | 101 (5.1%) | 0 (0.0%) |
| $300 to $499 | 295 (15.0%) | 14 (3.2%) |
| $500 to $799 | 150 (7.6%) | 53 (12.0%) |
| $800 to $999 | 276 (14.1%) | 55 (12.4%) |
| $1,000 to $1,499 | 580 (29.5%) | 154 (34.8%) |
| $1,500 to $1,999 | 448 (22.8%) | 42 (9.5%) |
| $2,000 to $2,499 | 100 (5.1%) | 45 (10.2%) |
| $2,500 to $2,999 | 15 (0.8%) | 0 (0.0%) |
| $3,000 or more | 0 (0.0%) | 0 (0.0%) |
| Total | 1,965 (100.0%) | 442 (100.0%) |
Physical Housing Characteristics in Moores Mill
Housing Structures in Moores Mill
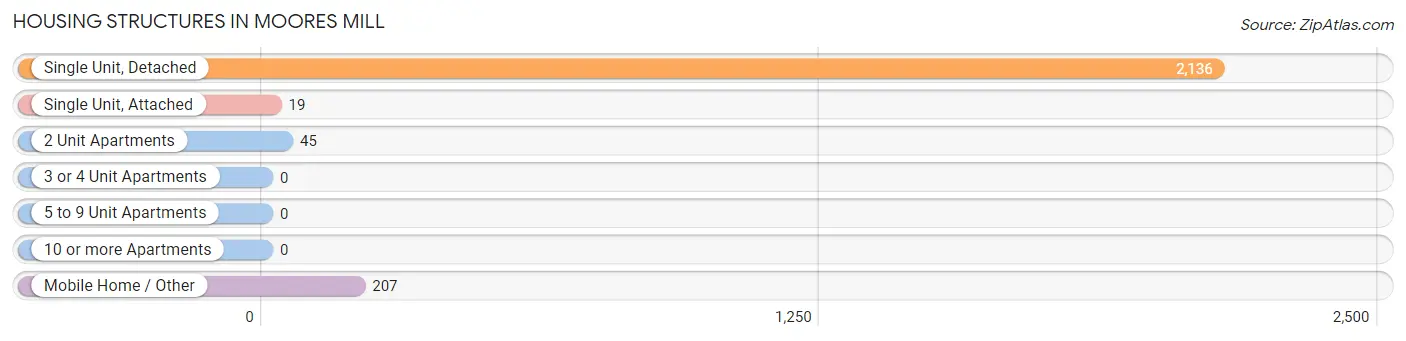
| Structure Type | # Housing Units | % Housing Units |
| Single Unit, Detached | 2,136 | 88.7% |
| Single Unit, Attached | 19 | 0.8% |
| 2 Unit Apartments | 45 | 1.9% |
| 3 or 4 Unit Apartments | 0 | 0.0% |
| 5 to 9 Unit Apartments | 0 | 0.0% |
| 10 or more Apartments | 0 | 0.0% |
| Mobile Home / Other | 207 | 8.6% |
| Total | 2,407 | 100.0% |
Housing Structures by Occupancy in Moores Mill
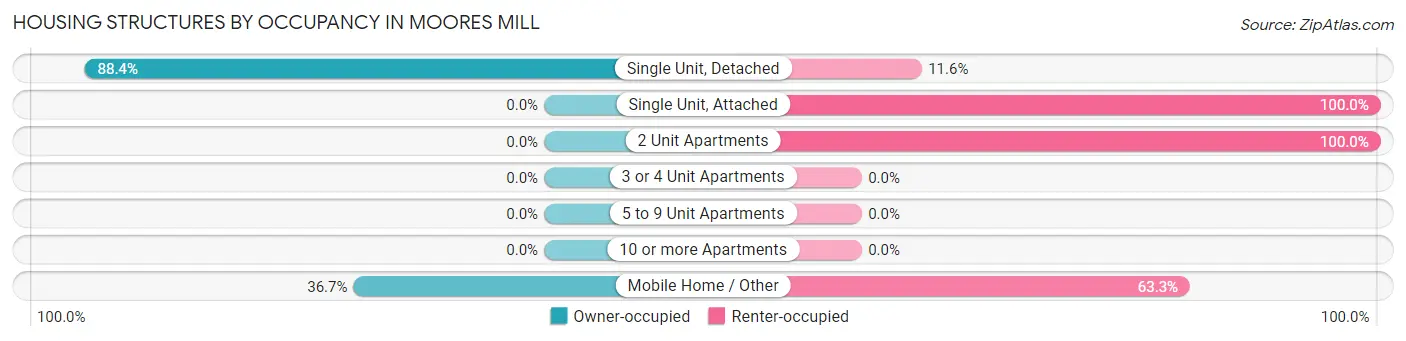
| Structure Type | Owner-occupied | Renter-occupied |
| Single Unit, Detached | 1,889 (88.4%) | 247 (11.6%) |
| Single Unit, Attached | 0 (0.0%) | 19 (100.0%) |
| 2 Unit Apartments | 0 (0.0%) | 45 (100.0%) |
| 3 or 4 Unit Apartments | 0 (0.0%) | 0 (0.0%) |
| 5 to 9 Unit Apartments | 0 (0.0%) | 0 (0.0%) |
| 10 or more Apartments | 0 (0.0%) | 0 (0.0%) |
| Mobile Home / Other | 76 (36.7%) | 131 (63.3%) |
| Total | 1,965 (81.6%) | 442 (18.4%) |
Housing Structures by Number of Rooms in Moores Mill
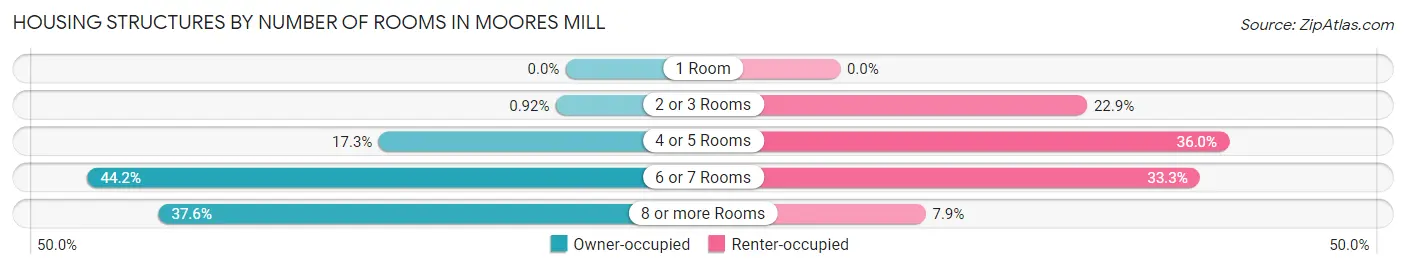
| Number of Rooms | Owner-occupied | Renter-occupied |
| 1 Room | 0 (0.0%) | 0 (0.0%) |
| 2 or 3 Rooms | 18 (0.9%) | 101 (22.9%) |
| 4 or 5 Rooms | 340 (17.3%) | 159 (36.0%) |
| 6 or 7 Rooms | 868 (44.2%) | 147 (33.3%) |
| 8 or more Rooms | 739 (37.6%) | 35 (7.9%) |
| Total | 1,965 (100.0%) | 442 (100.0%) |
Housing Structure by Heating Type in Moores Mill
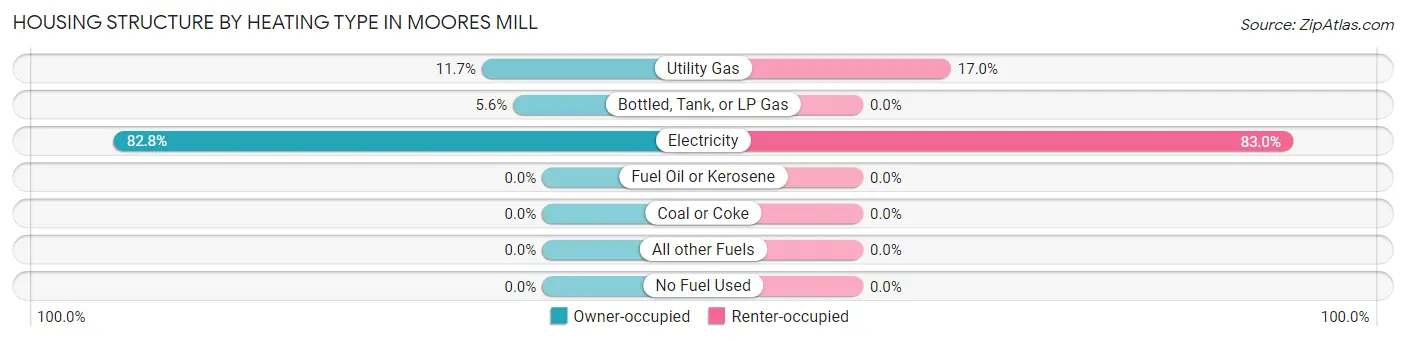
| Heating Type | Owner-occupied | Renter-occupied |
| Utility Gas | 229 (11.7%) | 75 (17.0%) |
| Bottled, Tank, or LP Gas | 110 (5.6%) | 0 (0.0%) |
| Electricity | 1,626 (82.8%) | 367 (83.0%) |
| Fuel Oil or Kerosene | 0 (0.0%) | 0 (0.0%) |
| Coal or Coke | 0 (0.0%) | 0 (0.0%) |
| All other Fuels | 0 (0.0%) | 0 (0.0%) |
| No Fuel Used | 0 (0.0%) | 0 (0.0%) |
| Total | 1,965 (100.0%) | 442 (100.0%) |
Household Vehicle Usage in Moores Mill
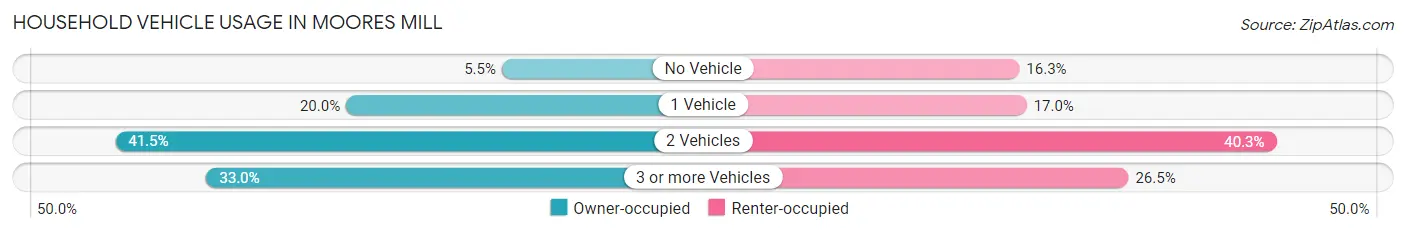
| Vehicles per Household | Owner-occupied | Renter-occupied |
| No Vehicle | 107 (5.4%) | 72 (16.3%) |
| 1 Vehicle | 393 (20.0%) | 75 (17.0%) |
| 2 Vehicles | 816 (41.5%) | 178 (40.3%) |
| 3 or more Vehicles | 649 (33.0%) | 117 (26.5%) |
| Total | 1,965 (100.0%) | 442 (100.0%) |
Real Estate & Mortgages in Moores Mill
Real Estate and Mortgage Overview in Moores Mill
| Characteristic | Without Mortgage | With Mortgage |
| Housing Units | 500 | 1,465 |
| Median Property Value | $220,300 | $234,700 |
| Median Household Income | $77,258 | $409 |
| Monthly Housing Costs | $416 | $0 |
| Real Estate Taxes | $694 | $69 |
Property Value by Mortgage Status in Moores Mill
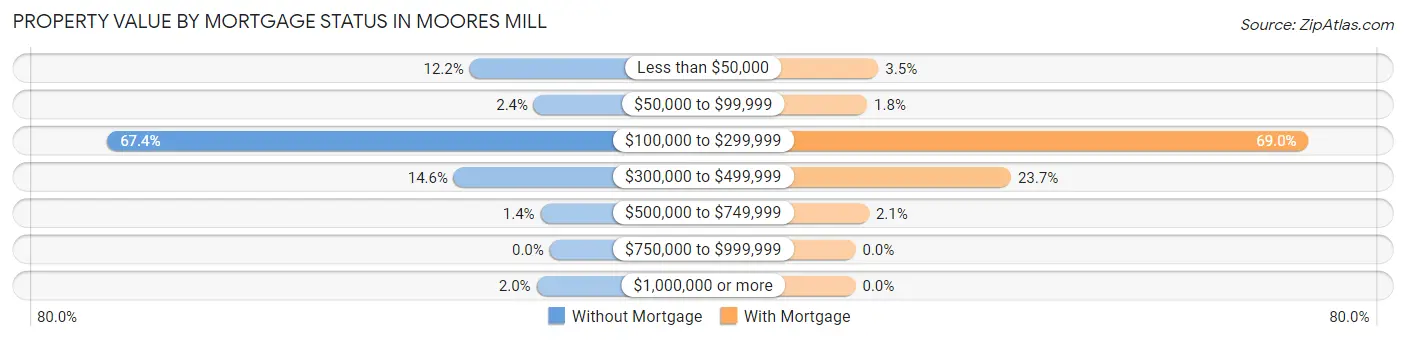
| Property Value | Without Mortgage | With Mortgage |
| Less than $50,000 | 61 (12.2%) | 51 (3.5%) |
| $50,000 to $99,999 | 12 (2.4%) | 26 (1.8%) |
| $100,000 to $299,999 | 337 (67.4%) | 1,011 (69.0%) |
| $300,000 to $499,999 | 73 (14.6%) | 347 (23.7%) |
| $500,000 to $749,999 | 7 (1.4%) | 30 (2.1%) |
| $750,000 to $999,999 | 0 (0.0%) | 0 (0.0%) |
| $1,000,000 or more | 10 (2.0%) | 0 (0.0%) |
| Total | 500 (100.0%) | 1,465 (100.0%) |
Household Income by Mortgage Status in Moores Mill
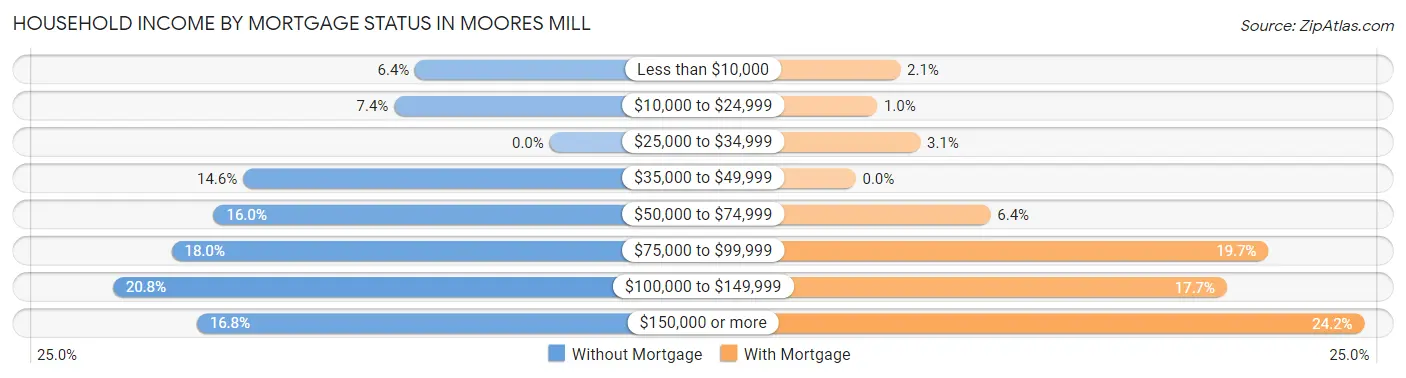
| Household Income | Without Mortgage | With Mortgage |
| Less than $10,000 | 32 (6.4%) | 31 (2.1%) |
| $10,000 to $24,999 | 37 (7.4%) | 15 (1.0%) |
| $25,000 to $34,999 | 0 (0.0%) | 45 (3.1%) |
| $35,000 to $49,999 | 73 (14.6%) | 0 (0.0%) |
| $50,000 to $74,999 | 80 (16.0%) | 94 (6.4%) |
| $75,000 to $99,999 | 90 (18.0%) | 288 (19.7%) |
| $100,000 to $149,999 | 104 (20.8%) | 259 (17.7%) |
| $150,000 or more | 84 (16.8%) | 355 (24.2%) |
| Total | 500 (100.0%) | 1,465 (100.0%) |
Property Value to Household Income Ratio in Moores Mill
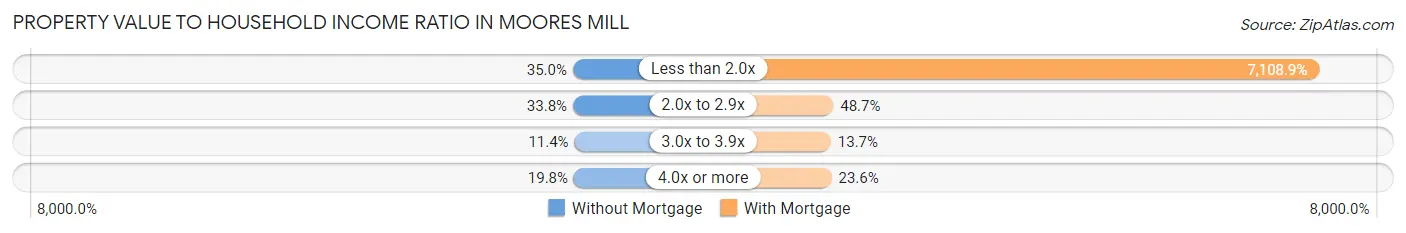
| Value-to-Income Ratio | Without Mortgage | With Mortgage |
| Less than 2.0x | 175 (35.0%) | 104,145 (7,108.9%) |
| 2.0x to 2.9x | 169 (33.8%) | 713 (48.7%) |
| 3.0x to 3.9x | 57 (11.4%) | 200 (13.7%) |
| 4.0x or more | 99 (19.8%) | 346 (23.6%) |
| Total | 500 (100.0%) | 1,465 (100.0%) |
Real Estate Taxes by Mortgage Status in Moores Mill
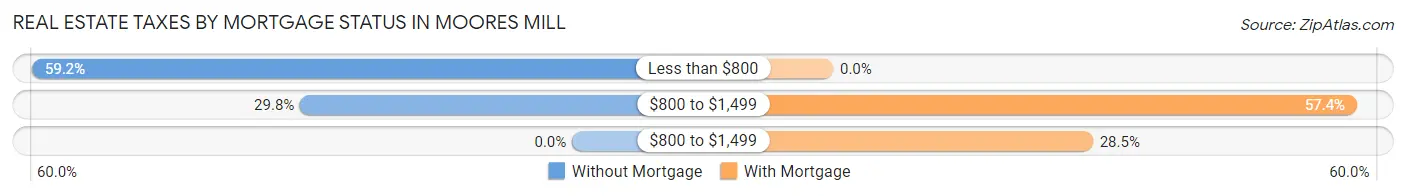
| Property Taxes | Without Mortgage | With Mortgage |
| Less than $800 | 296 (59.2%) | 0 (0.0%) |
| $800 to $1,499 | 149 (29.8%) | 841 (57.4%) |
| $800 to $1,499 | 0 (0.0%) | 417 (28.5%) |
| Total | 500 (100.0%) | 1,465 (100.0%) |
Health & Disability in Moores Mill
Health Insurance Coverage by Age in Moores Mill
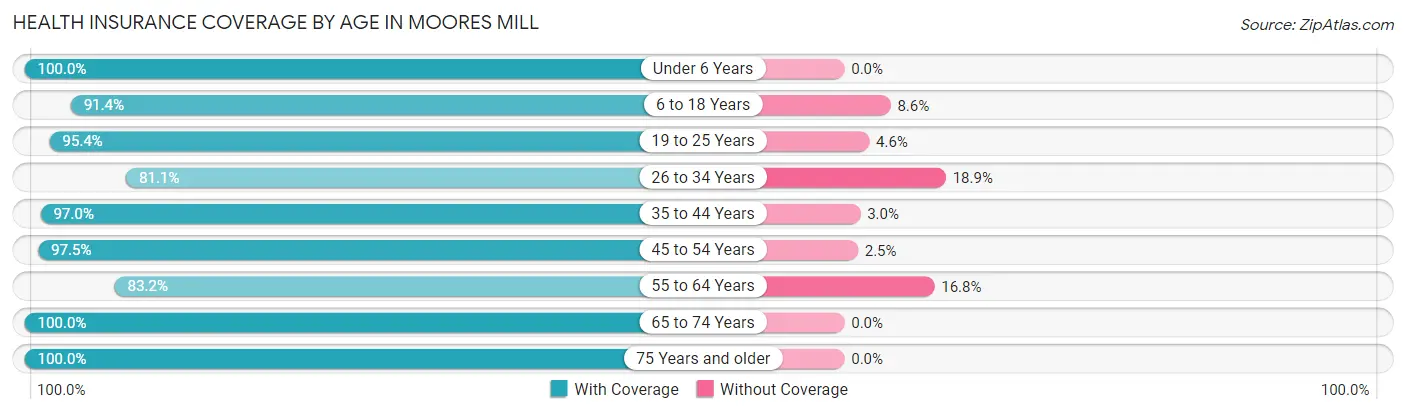
| Age Bracket | With Coverage | Without Coverage |
| Under 6 Years | 378 (100.0%) | 0 (0.0%) |
| 6 to 18 Years | 807 (91.4%) | 76 (8.6%) |
| 19 to 25 Years | 453 (95.4%) | 22 (4.6%) |
| 26 to 34 Years | 390 (81.1%) | 91 (18.9%) |
| 35 to 44 Years | 881 (97.0%) | 27 (3.0%) |
| 45 to 54 Years | 816 (97.5%) | 21 (2.5%) |
| 55 to 64 Years | 828 (83.2%) | 167 (16.8%) |
| 65 to 74 Years | 716 (100.0%) | 0 (0.0%) |
| 75 Years and older | 325 (100.0%) | 0 (0.0%) |
| Total | 5,594 (93.3%) | 404 (6.7%) |
Health Insurance Coverage by Citizenship Status in Moores Mill
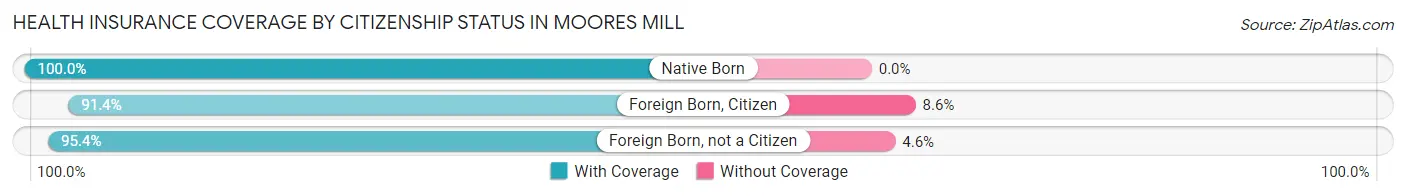
| Citizenship Status | With Coverage | Without Coverage |
| Native Born | 378 (100.0%) | 0 (0.0%) |
| Foreign Born, Citizen | 807 (91.4%) | 76 (8.6%) |
| Foreign Born, not a Citizen | 453 (95.4%) | 22 (4.6%) |
Health Insurance Coverage by Household Income in Moores Mill
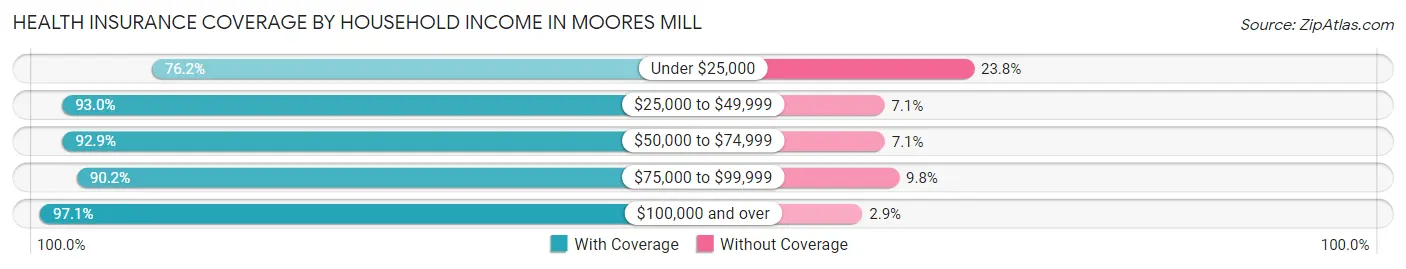
| Household Income | With Coverage | Without Coverage |
| Under $25,000 | 393 (76.2%) | 123 (23.8%) |
| $25,000 to $49,999 | 620 (92.9%) | 47 (7.0%) |
| $50,000 to $74,999 | 952 (92.9%) | 73 (7.1%) |
| $75,000 to $99,999 | 663 (90.2%) | 72 (9.8%) |
| $100,000 and over | 2,966 (97.1%) | 89 (2.9%) |
Public vs Private Health Insurance Coverage by Age in Moores Mill
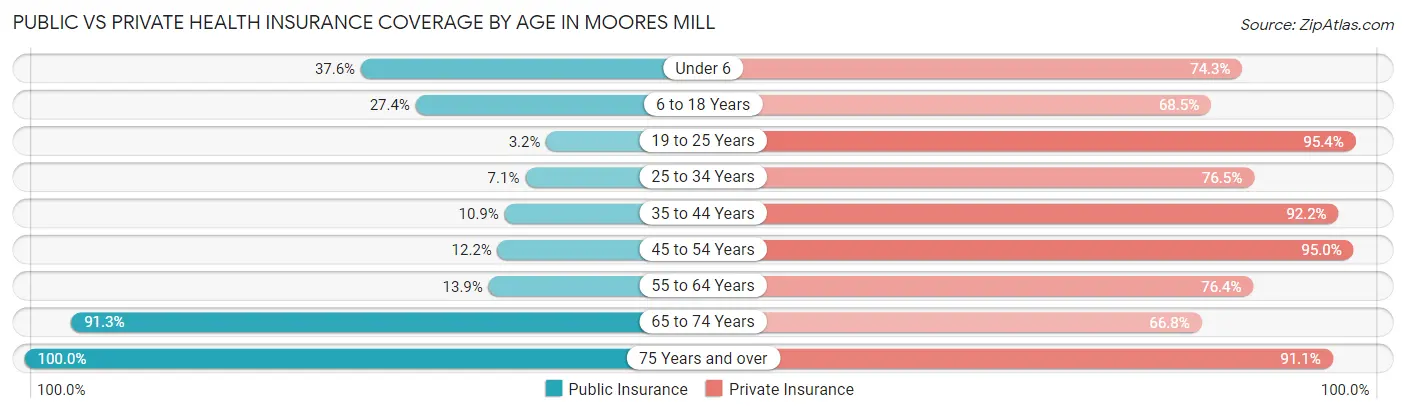
| Age Bracket | Public Insurance | Private Insurance |
| Under 6 | 142 (37.6%) | 281 (74.3%) |
| 6 to 18 Years | 242 (27.4%) | 605 (68.5%) |
| 19 to 25 Years | 15 (3.2%) | 453 (95.4%) |
| 25 to 34 Years | 34 (7.1%) | 368 (76.5%) |
| 35 to 44 Years | 99 (10.9%) | 837 (92.2%) |
| 45 to 54 Years | 102 (12.2%) | 795 (95.0%) |
| 55 to 64 Years | 138 (13.9%) | 760 (76.4%) |
| 65 to 74 Years | 654 (91.3%) | 478 (66.8%) |
| 75 Years and over | 325 (100.0%) | 296 (91.1%) |
| Total | 1,751 (29.2%) | 4,873 (81.2%) |
Disability Status by Sex by Age in Moores Mill
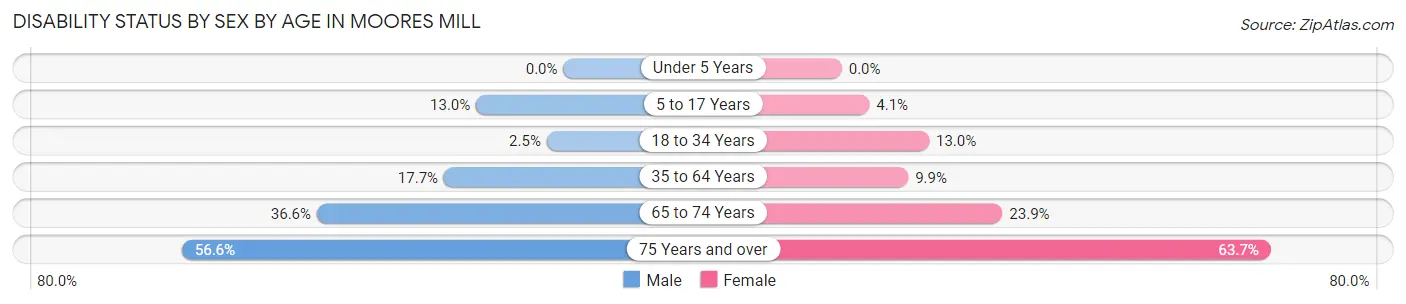
| Age Bracket | Male | Female |
| Under 5 Years | 0 (0.0%) | 0 (0.0%) |
| 5 to 17 Years | 50 (13.0%) | 21 (4.1%) |
| 18 to 34 Years | 12 (2.5%) | 72 (13.0%) |
| 35 to 64 Years | 236 (17.7%) | 139 (9.9%) |
| 65 to 74 Years | 127 (36.6%) | 88 (23.8%) |
| 75 Years and over | 64 (56.6%) | 135 (63.7%) |
Disability Class by Sex by Age in Moores Mill
Disability Class: Hearing Difficulty
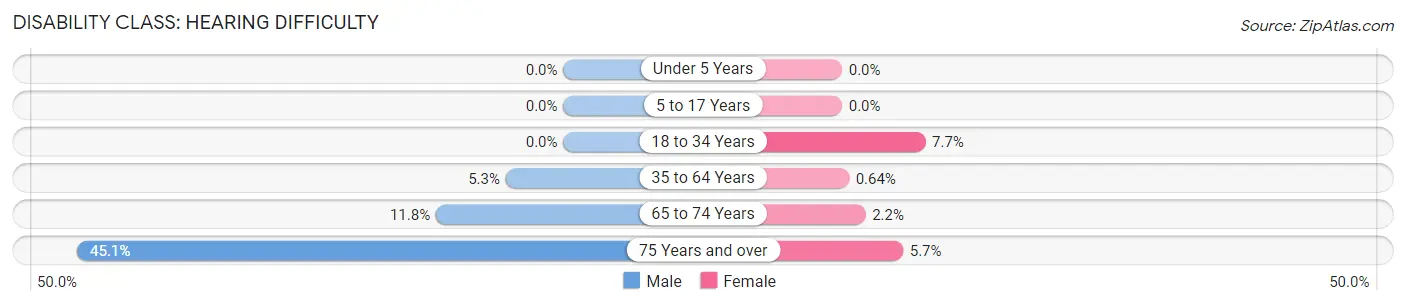
| Age Bracket | Male | Female |
| Under 5 Years | 0 (0.0%) | 0 (0.0%) |
| 5 to 17 Years | 0 (0.0%) | 0 (0.0%) |
| 18 to 34 Years | 0 (0.0%) | 43 (7.7%) |
| 35 to 64 Years | 71 (5.3%) | 9 (0.6%) |
| 65 to 74 Years | 41 (11.8%) | 8 (2.2%) |
| 75 Years and over | 51 (45.1%) | 12 (5.7%) |
Disability Class: Vision Difficulty
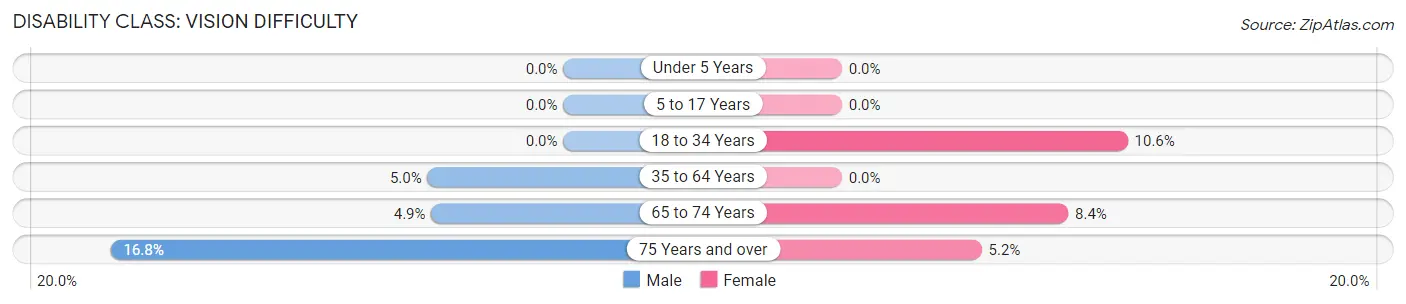
| Age Bracket | Male | Female |
| Under 5 Years | 0 (0.0%) | 0 (0.0%) |
| 5 to 17 Years | 0 (0.0%) | 0 (0.0%) |
| 18 to 34 Years | 0 (0.0%) | 59 (10.6%) |
| 35 to 64 Years | 67 (5.0%) | 0 (0.0%) |
| 65 to 74 Years | 17 (4.9%) | 31 (8.4%) |
| 75 Years and over | 19 (16.8%) | 11 (5.2%) |
Disability Class: Cognitive Difficulty
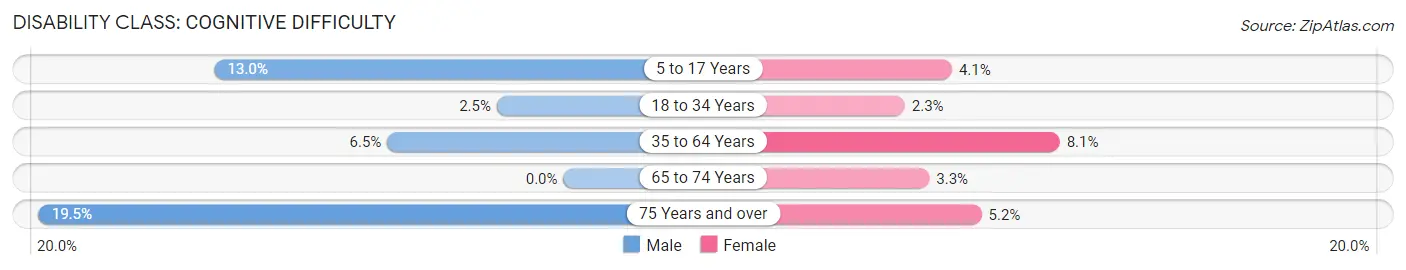
| Age Bracket | Male | Female |
| 5 to 17 Years | 50 (13.0%) | 21 (4.1%) |
| 18 to 34 Years | 12 (2.5%) | 13 (2.3%) |
| 35 to 64 Years | 87 (6.5%) | 114 (8.1%) |
| 65 to 74 Years | 0 (0.0%) | 12 (3.3%) |
| 75 Years and over | 22 (19.5%) | 11 (5.2%) |
Disability Class: Ambulatory Difficulty
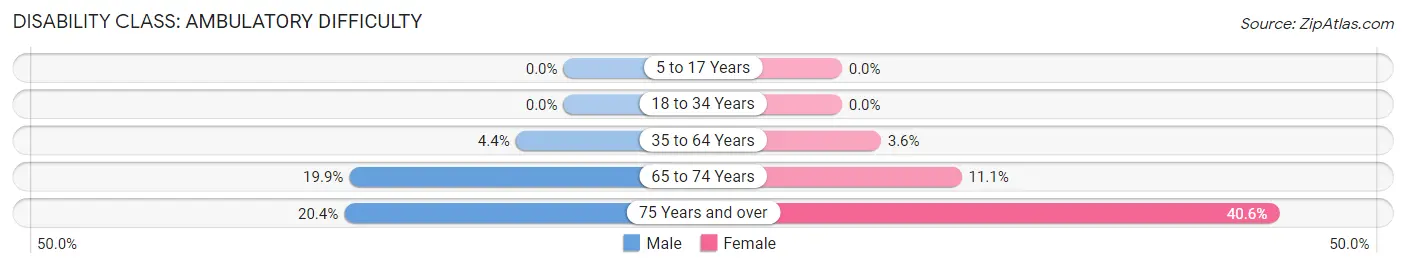
| Age Bracket | Male | Female |
| 5 to 17 Years | 0 (0.0%) | 0 (0.0%) |
| 18 to 34 Years | 0 (0.0%) | 0 (0.0%) |
| 35 to 64 Years | 59 (4.4%) | 51 (3.6%) |
| 65 to 74 Years | 69 (19.9%) | 41 (11.1%) |
| 75 Years and over | 23 (20.3%) | 86 (40.6%) |
Disability Class: Self-Care Difficulty
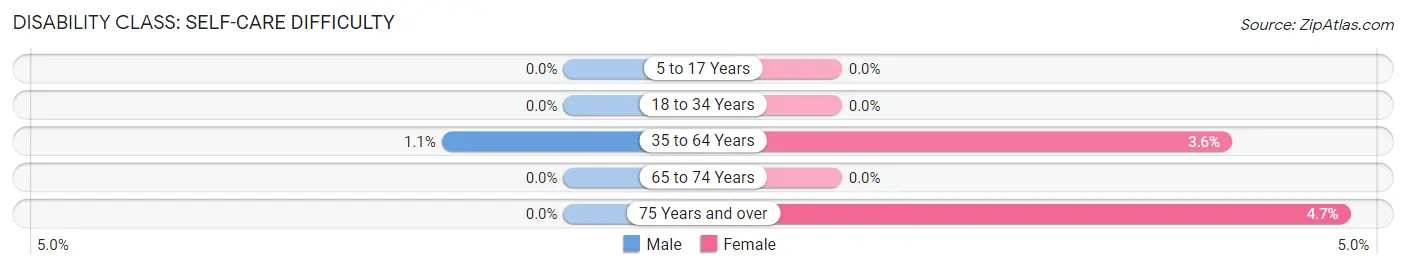
| Age Bracket | Male | Female |
| 5 to 17 Years | 0 (0.0%) | 0 (0.0%) |
| 18 to 34 Years | 0 (0.0%) | 0 (0.0%) |
| 35 to 64 Years | 15 (1.1%) | 51 (3.6%) |
| 65 to 74 Years | 0 (0.0%) | 0 (0.0%) |
| 75 Years and over | 0 (0.0%) | 10 (4.7%) |
Technology Access in Moores Mill
Computing Device Access in Moores Mill
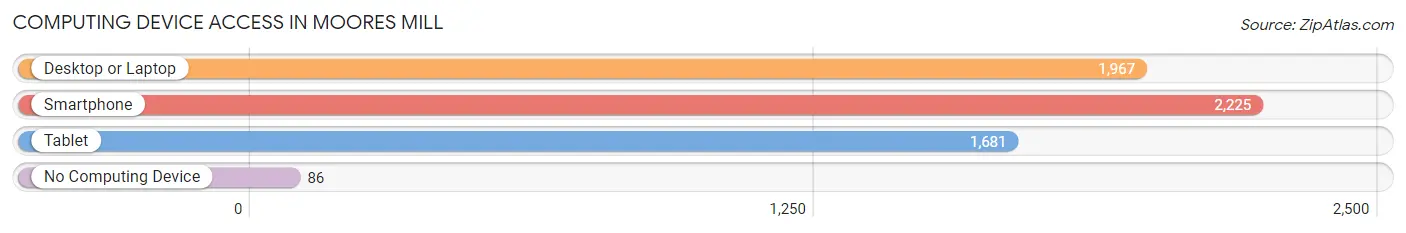
| Device Type | # Households | % Households |
| Desktop or Laptop | 1,967 | 81.7% |
| Smartphone | 2,225 | 92.4% |
| Tablet | 1,681 | 69.8% |
| No Computing Device | 86 | 3.6% |
| Total | 2,407 | 100.0% |
Internet Access in Moores Mill
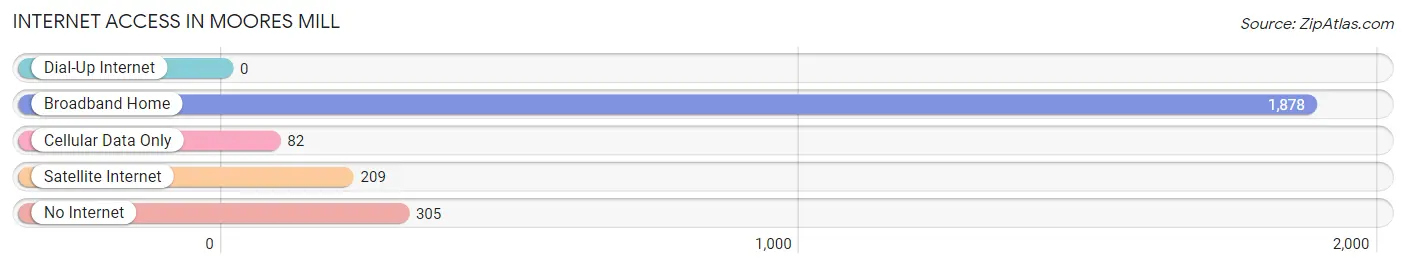
| Internet Type | # Households | % Households |
| Dial-Up Internet | 0 | 0.0% |
| Broadband Home | 1,878 | 78.0% |
| Cellular Data Only | 82 | 3.4% |
| Satellite Internet | 209 | 8.7% |
| No Internet | 305 | 12.7% |
| Total | 2,407 | 100.0% |
Moores Mill Summary
Moores Mill is a small unincorporated community located in the northeastern corner of Madison County, Alabama. It is situated approximately 10 miles north of Huntsville and is part of the Huntsville-Decatur Combined Statistical Area. The population of Moores Mill was estimated to be 1,845 in 2019.
History
Moores Mill was founded in 1818 by William Moore, a Revolutionary War veteran. Moore purchased the land from the federal government and established a mill on the site. The mill was used to grind corn and wheat, and it was the first mill in the area. The community was named after Moore and the mill.
In the early 1900s, Moores Mill was a thriving community with a post office, a general store, a blacksmith shop, and several churches. The town also had a school, which was attended by both white and black students.
Geography
Moores Mill is located in the northeastern corner of Madison County, Alabama. It is situated approximately 10 miles north of Huntsville and is part of the Huntsville-Decatur Combined Statistical Area. The community is located in the foothills of the Appalachian Mountains and is surrounded by rolling hills and forests. The climate is humid subtropical, with hot summers and mild winters.
Economy
The economy of Moores Mill is largely based on agriculture. The area is known for its production of corn, soybeans, and cotton. The community also has a few small businesses, including a gas station, a convenience store, and a restaurant.
Demographics
As of 2019, the population of Moores Mill was estimated to be 1,845. The racial makeup of the community was 94.3% White, 2.7% African American, 0.7% Native American, 0.3% Asian, and 1.9% from other races. The median household income was $45,938, and the median age was 37.7 years.
Conclusion
Moores Mill is a small unincorporated community located in the northeastern corner of Madison County, Alabama. It was founded in 1818 by William Moore and is known for its production of corn, soybeans, and cotton. The population of Moores Mill was estimated to be 1,845 in 2019, and the median household income was $45,938. The community is surrounded by rolling hills and forests and has a humid subtropical climate.
Common Questions
What is Per Capita Income in Moores Mill?
Per Capita income in Moores Mill is $46,270.
What is the Median Family Income in Moores Mill?
Median Family Income in Moores Mill is $100,582.
What is the Median Household income in Moores Mill?
Median Household Income in Moores Mill is $88,694.
What is Income or Wage Gap in Moores Mill?
Income or Wage Gap in Moores Mill is 37.5%.
Women in Moores Mill earn 62.5 cents for every dollar earned by a man.
What is Inequality or Gini Index in Moores Mill?
Inequality or Gini Index in Moores Mill is 0.43.
What is the Total Population of Moores Mill?
Total Population of Moores Mill is 6,007.
What is the Total Male Population of Moores Mill?
Total Male Population of Moores Mill is 2,884.
What is the Total Female Population of Moores Mill?
Total Female Population of Moores Mill is 3,123.
What is the Ratio of Males per 100 Females in Moores Mill?
There are 92.35 Males per 100 Females in Moores Mill.
What is the Ratio of Females per 100 Males in Moores Mill?
There are 108.29 Females per 100 Males in Moores Mill.
What is the Median Population Age in Moores Mill?
Median Population Age in Moores Mill is 44.6 Years.
What is the Average Family Size in Moores Mill
Average Family Size in Moores Mill is 2.9 People.
What is the Average Household Size in Moores Mill
Average Household Size in Moores Mill is 2.5 People.
How Large is the Labor Force in Moores Mill?
There are 3,230 People in the Labor Forcein in Moores Mill.
What is the Percentage of People in the Labor Force in Moores Mill?
65.5% of People are in the Labor Force in Moores Mill.
What is the Unemployment Rate in Moores Mill?
Unemployment Rate in Moores Mill is 2.8%.