Indian Springs Village, AL Map & Demographics
Indian Springs Village Map
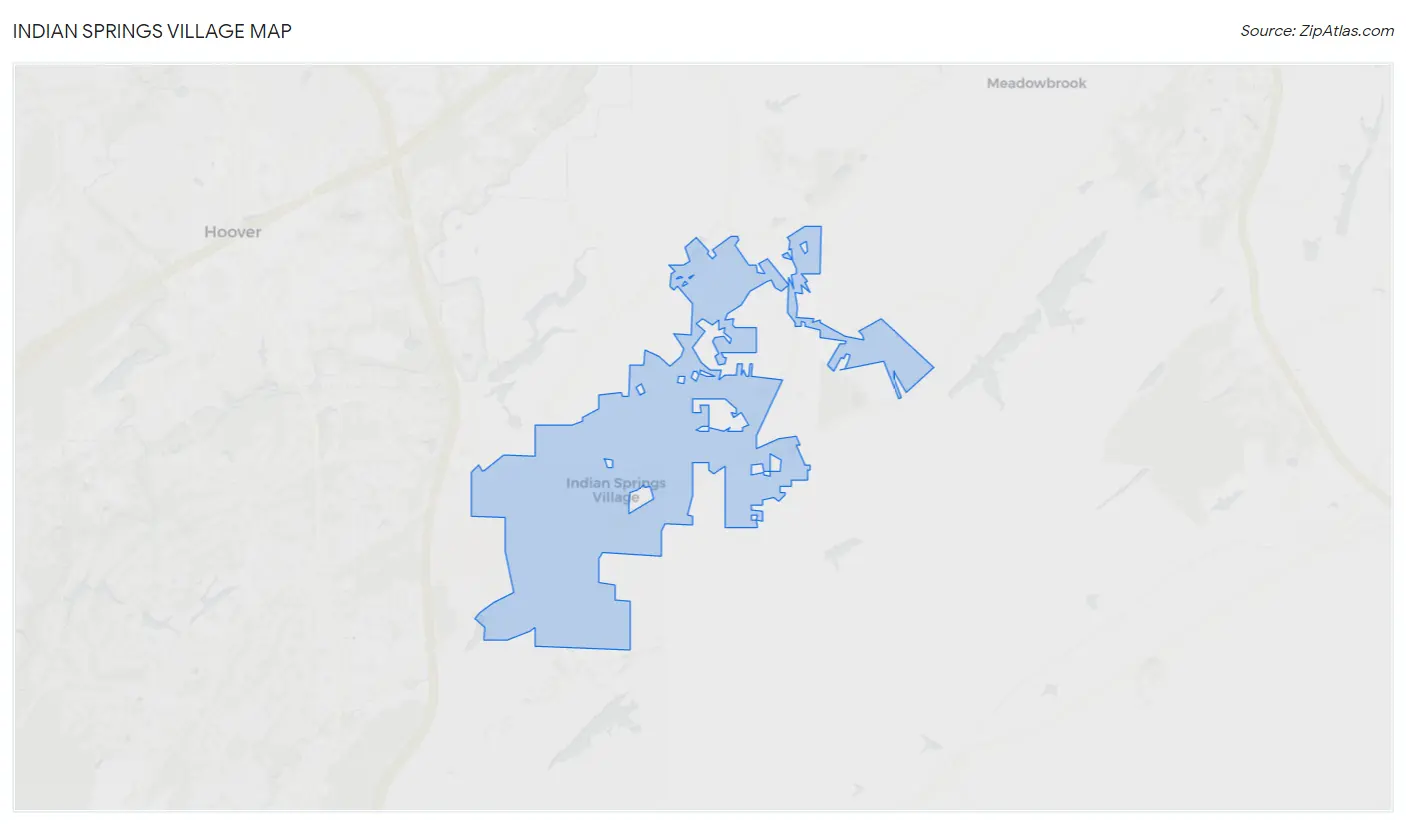
Indian Springs Village Overview
$65,351
PER CAPITA INCOME
$146,792
AVG FAMILY INCOME
$135,114
AVG HOUSEHOLD INCOME
63.4%
WAGE / INCOME GAP [ % ]
36.6¢/ $1
WAGE / INCOME GAP [ $ ]
0.45
INEQUALITY / GINI INDEX
2,341
TOTAL POPULATION
1,110
MALE POPULATION
1,231
FEMALE POPULATION
90.17
MALES / 100 FEMALES
110.90
FEMALES / 100 MALES
48.0
MEDIAN AGE
3.2
AVG FAMILY SIZE
3.0
AVG HOUSEHOLD SIZE
1,126
LABOR FORCE [ PEOPLE ]
58.0%
PERCENT IN LABOR FORCE
2.5%
UNEMPLOYMENT RATE
Indian Springs Village Area Codes
Income in Indian Springs Village
Income Overview in Indian Springs Village
Per Capita Income in Indian Springs Village is $65,351, while median incomes of families and households are $146,792 and $135,114 respectively.
| Characteristic | Number | Measure |
| Per Capita Income | 2,341 | $65,351 |
| Median Family Income | 641 | $146,792 |
| Mean Family Income | 641 | $207,020 |
| Median Household Income | 757 | $135,114 |
| Mean Household Income | 757 | $198,523 |
| Income Deficit | 641 | $0 |
| Wage / Income Gap (%) | 2,341 | 63.40% |
| Wage / Income Gap ($) | 2,341 | 36.60¢ per $1 |
| Gini / Inequality Index | 2,341 | 0.45 |
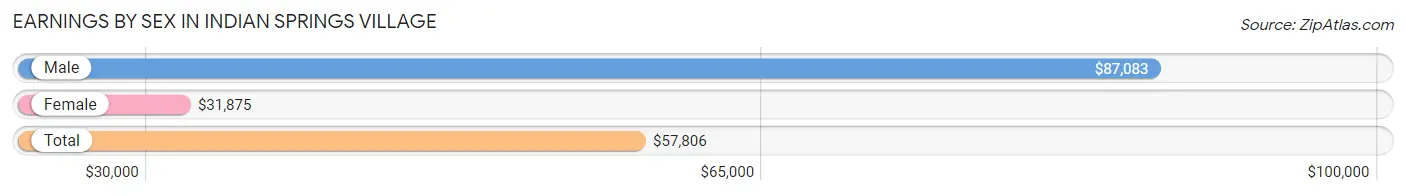
Earnings by Sex in Indian Springs Village
Average Earnings in Indian Springs Village are $57,806, $87,083 for men and $31,875 for women, a difference of 63.4%.
| Sex | Number | Average Earnings |
| Male | 625 (52.5%) | $87,083 |
| Female | 566 (47.5%) | $31,875 |
| Total | 1,191 (100.0%) | $57,806 |
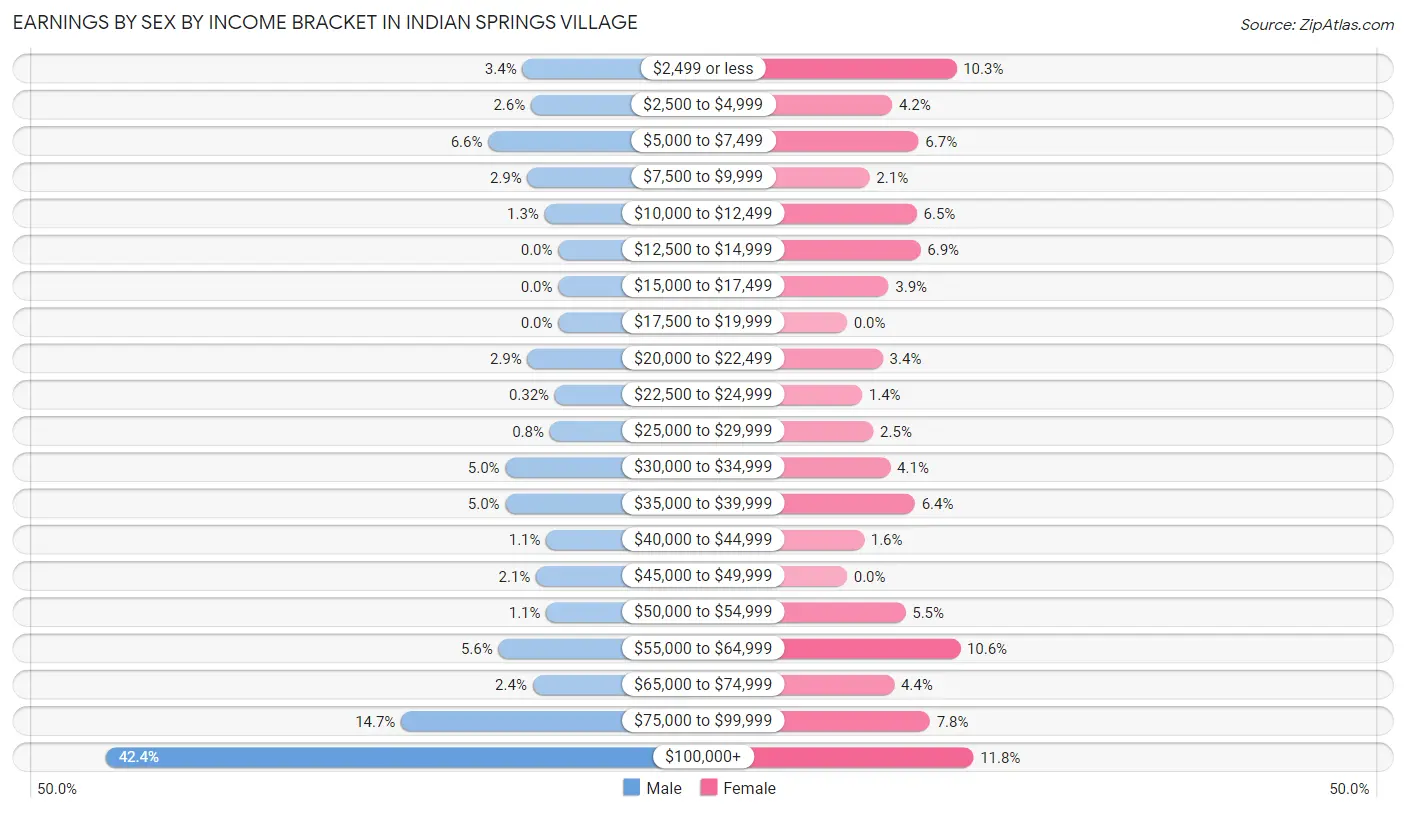
Earnings by Sex by Income Bracket in Indian Springs Village
The most common earnings brackets in Indian Springs Village are $100,000+ for men (265 | 42.4%) and $100,000+ for women (67 | 11.8%).
| Income | Male | Female |
| $2,499 or less | 21 (3.4%) | 58 (10.2%) |
| $2,500 to $4,999 | 16 (2.6%) | 24 (4.2%) |
| $5,000 to $7,499 | 41 (6.6%) | 38 (6.7%) |
| $7,500 to $9,999 | 18 (2.9%) | 12 (2.1%) |
| $10,000 to $12,499 | 8 (1.3%) | 37 (6.5%) |
| $12,500 to $14,999 | 0 (0.0%) | 39 (6.9%) |
| $15,000 to $17,499 | 0 (0.0%) | 22 (3.9%) |
| $17,500 to $19,999 | 0 (0.0%) | 0 (0.0%) |
| $20,000 to $22,499 | 18 (2.9%) | 19 (3.4%) |
| $22,500 to $24,999 | 2 (0.3%) | 8 (1.4%) |
| $25,000 to $29,999 | 5 (0.8%) | 14 (2.5%) |
| $30,000 to $34,999 | 31 (5.0%) | 23 (4.1%) |
| $35,000 to $39,999 | 31 (5.0%) | 36 (6.4%) |
| $40,000 to $44,999 | 7 (1.1%) | 9 (1.6%) |
| $45,000 to $49,999 | 13 (2.1%) | 0 (0.0%) |
| $50,000 to $54,999 | 7 (1.1%) | 31 (5.5%) |
| $55,000 to $64,999 | 35 (5.6%) | 60 (10.6%) |
| $65,000 to $74,999 | 15 (2.4%) | 25 (4.4%) |
| $75,000 to $99,999 | 92 (14.7%) | 44 (7.8%) |
| $100,000+ | 265 (42.4%) | 67 (11.8%) |
| Total | 625 (100.0%) | 566 (100.0%) |
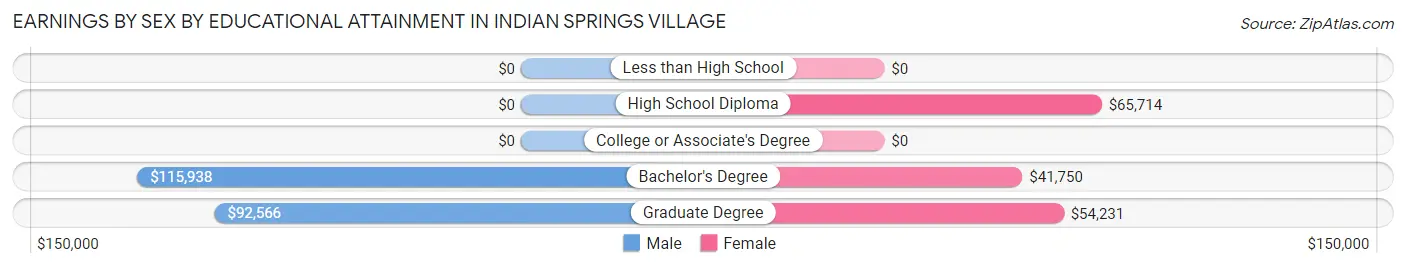
Earnings by Sex by Educational Attainment in Indian Springs Village
Average earnings in Indian Springs Village are $93,750 for men and $44,063 for women, a difference of 53.0%. Men with an educational attainment of bachelor's degree enjoy the highest average annual earnings of $115,938, while those with graduate degree education earn the least with $92,566. Women with an educational attainment of high school diploma earn the most with the average annual earnings of $65,714, while those with bachelor's degree education have the smallest earnings of $41,750.
| Educational Attainment | Male Income | Female Income |
| Less than High School | - | - |
| High School Diploma | - | - |
| College or Associate's Degree | - | - |
| Bachelor's Degree | $115,938 | $41,750 |
| Graduate Degree | $92,566 | $54,231 |
| Total | $93,750 | $44,063 |
Family Income in Indian Springs Village
Family Income Brackets in Indian Springs Village
According to the Indian Springs Village family income data, there are 202 families falling into the $200,000+ income range, which is the most common income bracket and makes up 31.5% of all families.
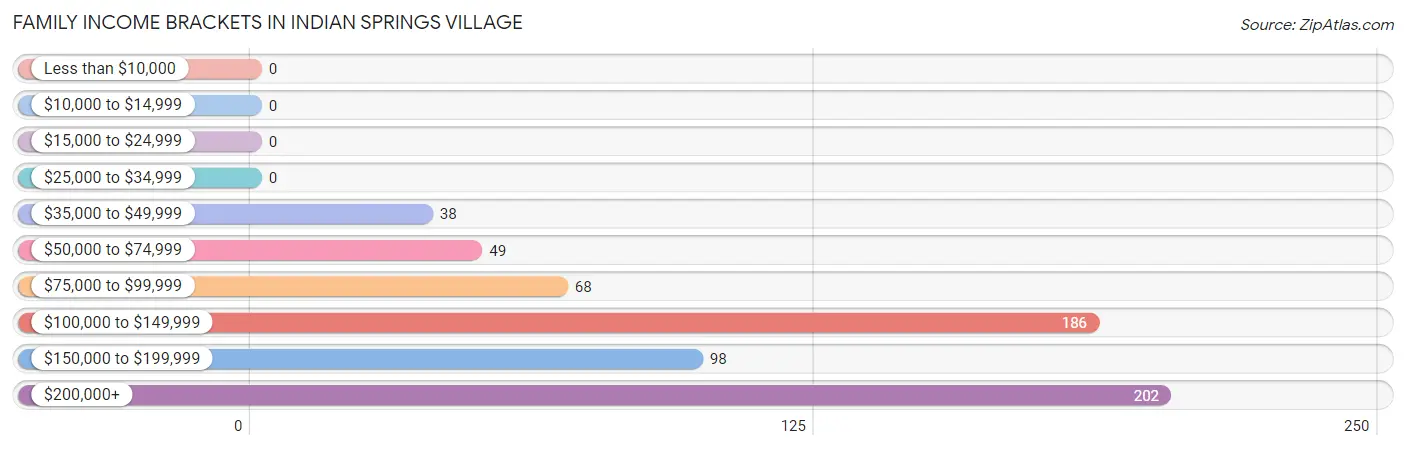
| Income Bracket | # Families | % Families |
| Less than $10,000 | 0 | 0.0% |
| $10,000 to $14,999 | 0 | 0.0% |
| $15,000 to $24,999 | 0 | 0.0% |
| $25,000 to $34,999 | 0 | 0.0% |
| $35,000 to $49,999 | 38 | 5.9% |
| $50,000 to $74,999 | 49 | 7.6% |
| $75,000 to $99,999 | 68 | 10.6% |
| $100,000 to $149,999 | 186 | 29.0% |
| $150,000 to $199,999 | 98 | 15.3% |
| $200,000+ | 202 | 31.5% |
Family Income by Famaliy Size in Indian Springs Village
6-person families (9 | 1.4%) account for the highest median family income in Indian Springs Village with $250,001 per family, while 2-person families (306 | 47.7%) have the highest median income of $60,875 per family member.
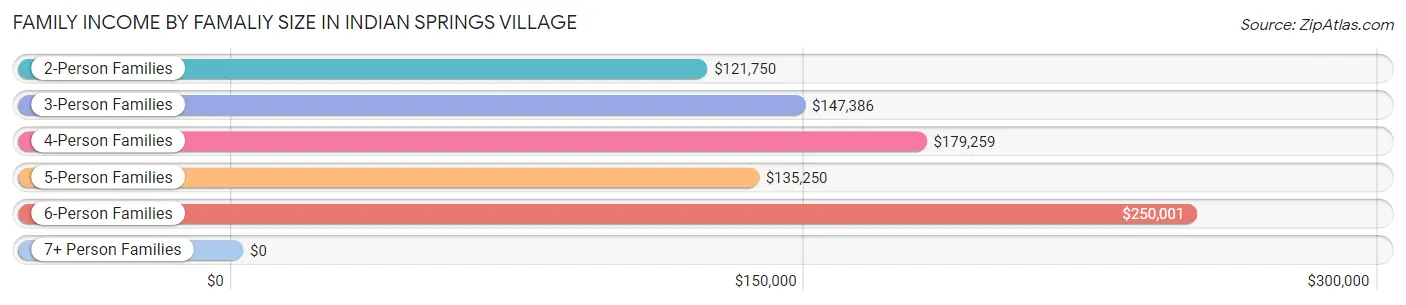
| Income Bracket | # Families | Median Income |
| 2-Person Families | 306 (47.7%) | $121,750 |
| 3-Person Families | 103 (16.1%) | $147,386 |
| 4-Person Families | 178 (27.8%) | $179,259 |
| 5-Person Families | 45 (7.0%) | $135,250 |
| 6-Person Families | 9 (1.4%) | $250,001 |
| 7+ Person Families | 0 (0.0%) | $0 |
| Total | 641 (100.0%) | $146,792 |
Family Income by Number of Earners in Indian Springs Village
The median family income in Indian Springs Village is $146,792, with families comprising 3+ earners (121) having the highest median family income of $226,250, while families with no earners (114) have the lowest median family income of $91,500, accounting for 18.9% and 17.8% of families, respectively.
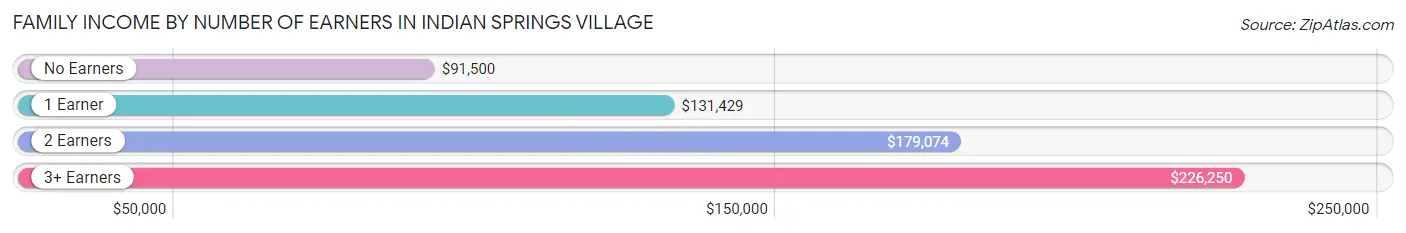
| Number of Earners | # Families | Median Income |
| No Earners | 114 (17.8%) | $91,500 |
| 1 Earner | 180 (28.1%) | $131,429 |
| 2 Earners | 226 (35.3%) | $179,074 |
| 3+ Earners | 121 (18.9%) | $226,250 |
| Total | 641 (100.0%) | $146,792 |
Household Income in Indian Springs Village
Household Income Brackets in Indian Springs Village
With 215 households falling in the category, the $200,000+ income range is the most frequent in Indian Springs Village, accounting for 28.4% of all households.
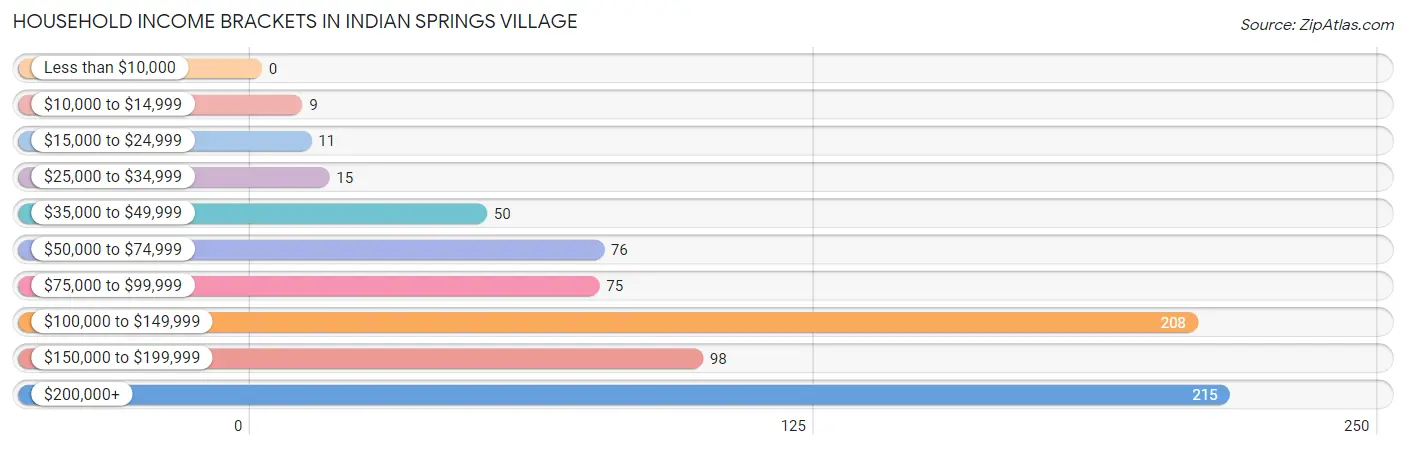
| Income Bracket | # Households | % Households |
| Less than $10,000 | 0 | 0.0% |
| $10,000 to $14,999 | 9 | 1.2% |
| $15,000 to $24,999 | 11 | 1.5% |
| $25,000 to $34,999 | 15 | 2.0% |
| $35,000 to $49,999 | 50 | 6.6% |
| $50,000 to $74,999 | 76 | 10.0% |
| $75,000 to $99,999 | 75 | 9.9% |
| $100,000 to $149,999 | 208 | 27.5% |
| $150,000 to $199,999 | 98 | 12.9% |
| $200,000+ | 215 | 28.4% |
Household Income by Householder Age in Indian Springs Village
The median household income in Indian Springs Village is $135,114, with the highest median household income of $155,667 found in the 25 to 44 years age bracket for the primary householder. A total of 162 households (21.4%) fall into this category.
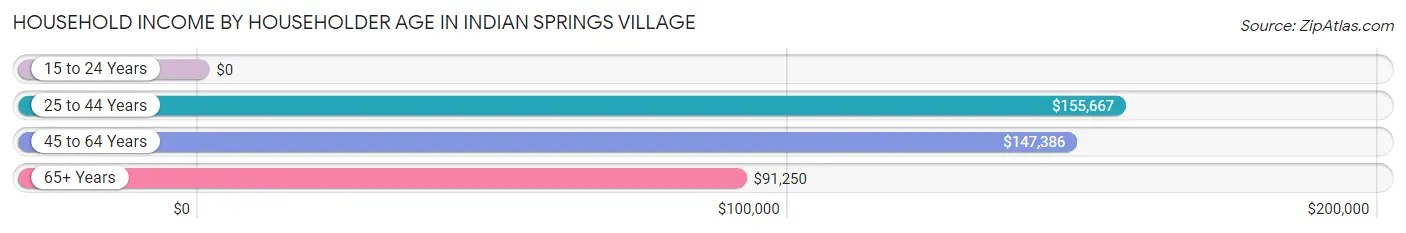
| Income Bracket | # Households | Median Income |
| 15 to 24 Years | 0 (0.0%) | $0 |
| 25 to 44 Years | 162 (21.4%) | $155,667 |
| 45 to 64 Years | 317 (41.9%) | $147,386 |
| 65+ Years | 278 (36.7%) | $91,250 |
| Total | 757 (100.0%) | $135,114 |
Poverty in Indian Springs Village
Income Below Poverty by Sex and Age in Indian Springs Village
With 3.2% poverty level for males and 5.5% for females among the residents of Indian Springs Village, 18 to 24 year old males and 75 year old and over females are the most vulnerable to poverty, with 36 males (32.1%) and 37 females (18.2%) in their respective age groups living below the poverty level.
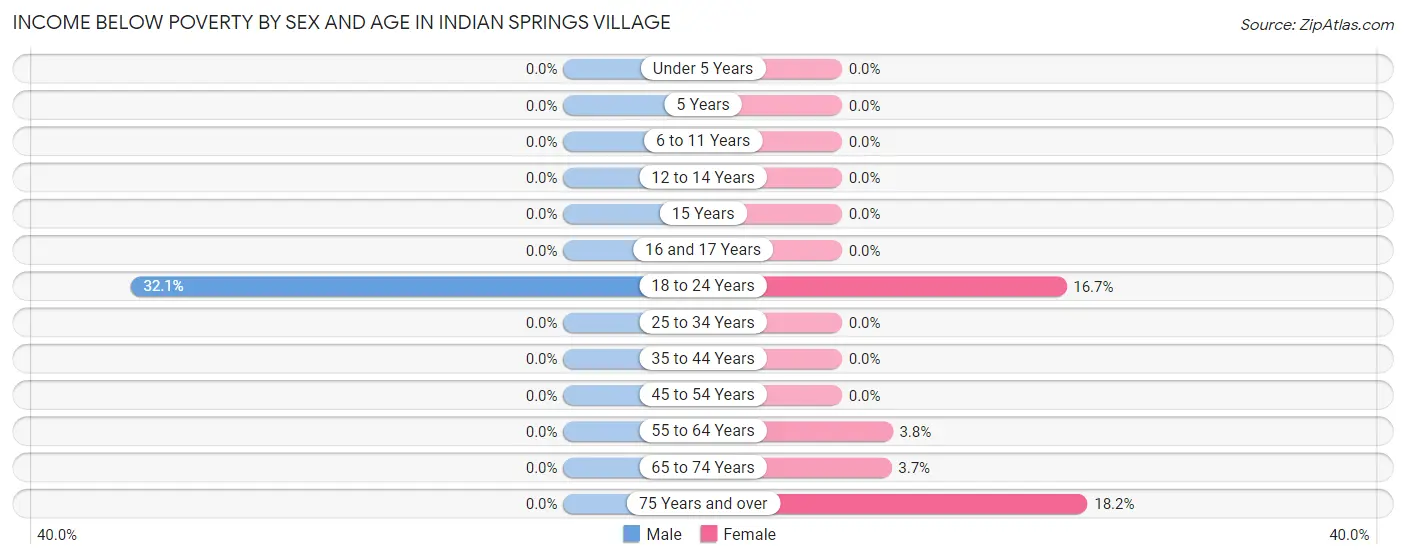
| Age Bracket | Male | Female |
| Under 5 Years | 0 (0.0%) | 0 (0.0%) |
| 5 Years | 0 (0.0%) | 0 (0.0%) |
| 6 to 11 Years | 0 (0.0%) | 0 (0.0%) |
| 12 to 14 Years | 0 (0.0%) | 0 (0.0%) |
| 15 Years | 0 (0.0%) | 0 (0.0%) |
| 16 and 17 Years | 0 (0.0%) | 0 (0.0%) |
| 18 to 24 Years | 36 (32.1%) | 19 (16.7%) |
| 25 to 34 Years | 0 (0.0%) | 0 (0.0%) |
| 35 to 44 Years | 0 (0.0%) | 0 (0.0%) |
| 45 to 54 Years | 0 (0.0%) | 0 (0.0%) |
| 55 to 64 Years | 0 (0.0%) | 7 (3.8%) |
| 65 to 74 Years | 0 (0.0%) | 5 (3.7%) |
| 75 Years and over | 0 (0.0%) | 37 (18.2%) |
| Total | 36 (3.2%) | 68 (5.5%) |
Income Above Poverty by Sex and Age in Indian Springs Village
According to the poverty statistics in Indian Springs Village, males aged under 5 years and females aged under 5 years are the age groups that are most secure financially, with 100.0% of males and 100.0% of females in these age groups living above the poverty line.
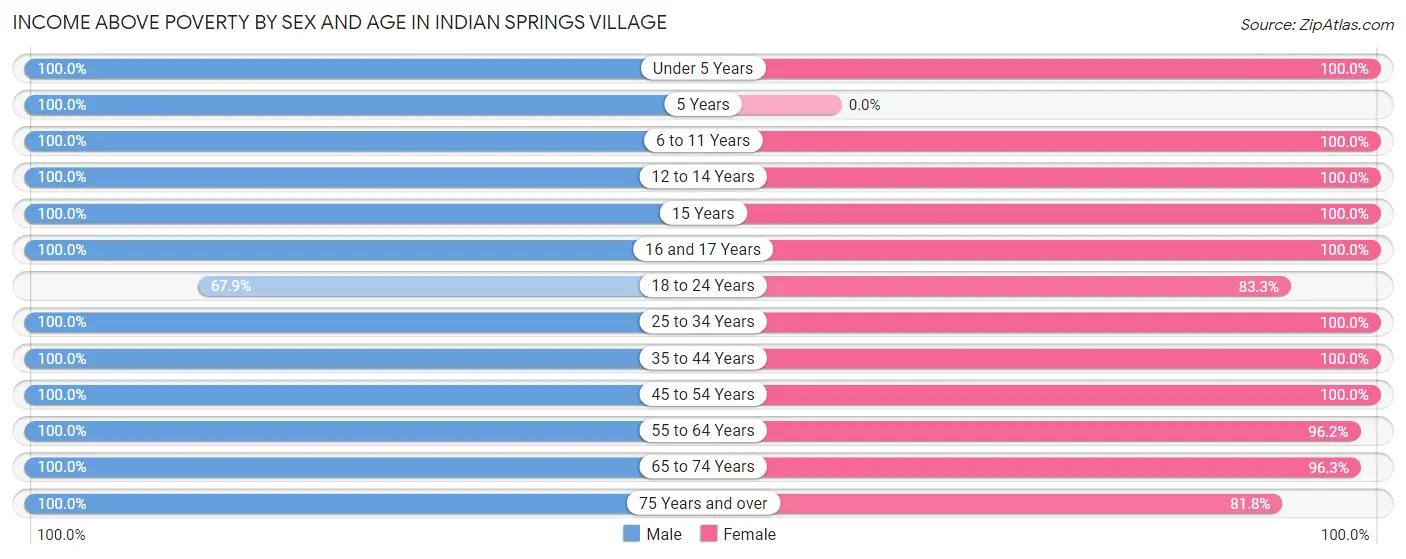
| Age Bracket | Male | Female |
| Under 5 Years | 47 (100.0%) | 4 (100.0%) |
| 5 Years | 16 (100.0%) | 0 (0.0%) |
| 6 to 11 Years | 98 (100.0%) | 73 (100.0%) |
| 12 to 14 Years | 5 (100.0%) | 72 (100.0%) |
| 15 Years | 28 (100.0%) | 57 (100.0%) |
| 16 and 17 Years | 57 (100.0%) | 49 (100.0%) |
| 18 to 24 Years | 76 (67.9%) | 95 (83.3%) |
| 25 to 34 Years | 57 (100.0%) | 38 (100.0%) |
| 35 to 44 Years | 145 (100.0%) | 111 (100.0%) |
| 45 to 54 Years | 147 (100.0%) | 188 (100.0%) |
| 55 to 64 Years | 150 (100.0%) | 179 (96.2%) |
| 65 to 74 Years | 119 (100.0%) | 131 (96.3%) |
| 75 Years and over | 129 (100.0%) | 166 (81.8%) |
| Total | 1,074 (96.8%) | 1,163 (94.5%) |
Income Below Poverty Among Married-Couple Families in Indian Springs Village
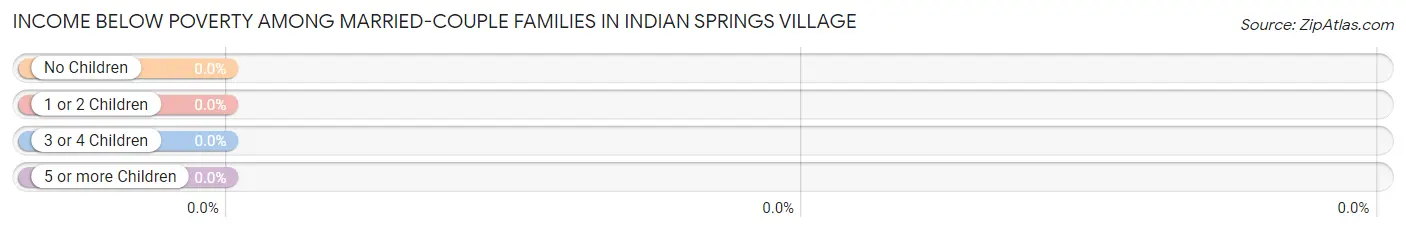
| Children | Above Poverty | Below Poverty |
| No Children | 333 (100.0%) | 0 (0.0%) |
| 1 or 2 Children | 242 (100.0%) | 0 (0.0%) |
| 3 or 4 Children | 32 (100.0%) | 0 (0.0%) |
| 5 or more Children | 0 (0.0%) | 0 (0.0%) |
| Total | 607 (100.0%) | 0 (0.0%) |
Income Below Poverty Among Single-Parent Households in Indian Springs Village
| Children | Single Father | Single Mother |
| No Children | 0 (0.0%) | 0 (0.0%) |
| 1 or 2 Children | 0 (0.0%) | 0 (0.0%) |
| 3 or 4 Children | 0 (0.0%) | 0 (0.0%) |
| 5 or more Children | 0 (0.0%) | 0 (0.0%) |
| Total | 0 (0.0%) | 0 (0.0%) |
Income Below Poverty Among Married-Couple vs Single-Parent Households in Indian Springs Village
| Children | Married-Couple Families | Single-Parent Households |
| No Children | 0 (0.0%) | 0 (0.0%) |
| 1 or 2 Children | 0 (0.0%) | 0 (0.0%) |
| 3 or 4 Children | 0 (0.0%) | 0 (0.0%) |
| 5 or more Children | 0 (0.0%) | 0 (0.0%) |
| Total | 0 (0.0%) | 0 (0.0%) |
Race in Indian Springs Village
The most populous races in Indian Springs Village are White / Caucasian (2,196 | 93.8%), Asian (69 | 2.9%), and Black / African American (47 | 2.0%).
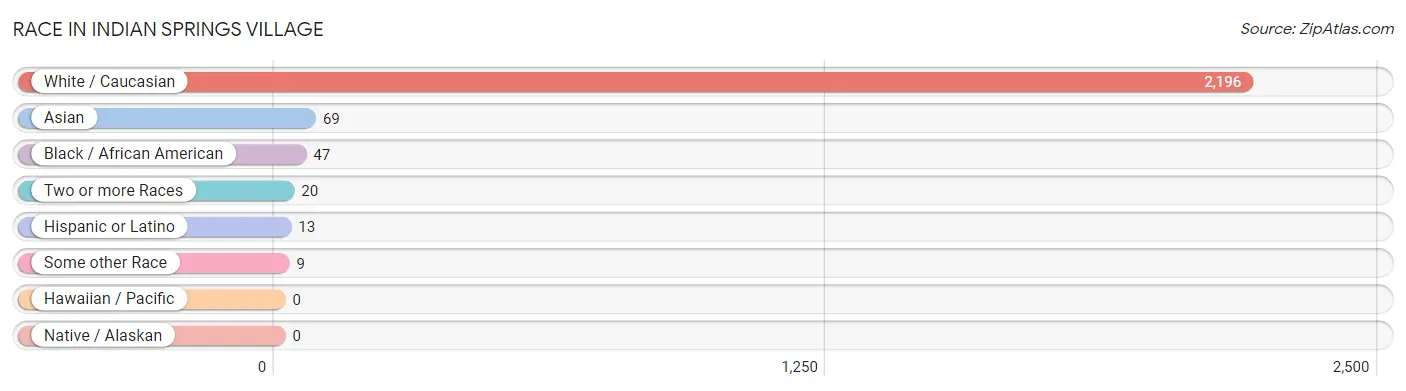
| Race | # Population | % Population |
| Asian | 69 | 2.9% |
| Black / African American | 47 | 2.0% |
| Hawaiian / Pacific | 0 | 0.0% |
| Hispanic or Latino | 13 | 0.6% |
| Native / Alaskan | 0 | 0.0% |
| White / Caucasian | 2,196 | 93.8% |
| Two or more Races | 20 | 0.9% |
| Some other Race | 9 | 0.4% |
| Total | 2,341 | 100.0% |
Ancestry in Indian Springs Village
The most populous ancestries reported in Indian Springs Village are English (616 | 26.3%), American (313 | 13.4%), Irish (211 | 9.0%), German (176 | 7.5%), and Italian (176 | 7.5%), together accounting for 63.7% of all Indian Springs Village residents.
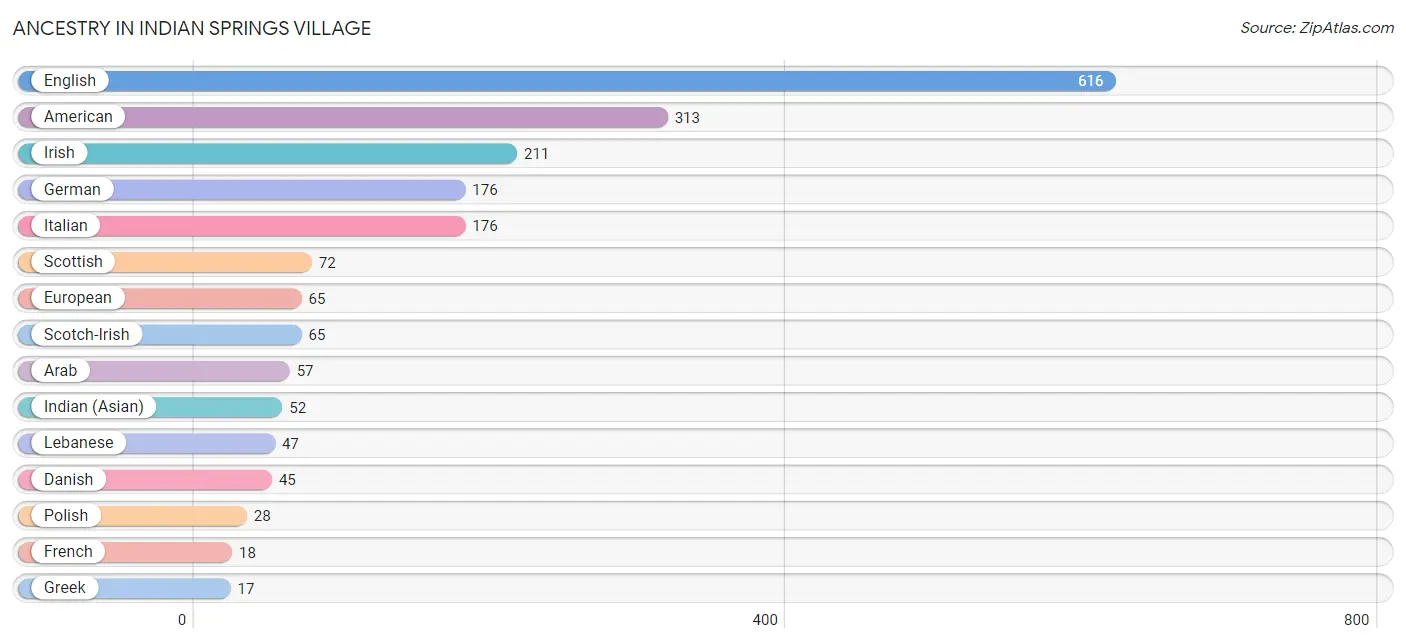
| Ancestry | # Population | % Population |
| African | 3 | 0.1% |
| American | 313 | 13.4% |
| Arab | 57 | 2.4% |
| Austrian | 9 | 0.4% |
| Bhutanese | 5 | 0.2% |
| British | 5 | 0.2% |
| Danish | 45 | 1.9% |
| English | 616 | 26.3% |
| European | 65 | 2.8% |
| French | 18 | 0.8% |
| German | 176 | 7.5% |
| Greek | 17 | 0.7% |
| Indian (Asian) | 52 | 2.2% |
| Iranian | 15 | 0.6% |
| Irish | 211 | 9.0% |
| Italian | 176 | 7.5% |
| Lebanese | 47 | 2.0% |
| Mexican | 7 | 0.3% |
| Norwegian | 12 | 0.5% |
| Palestinian | 10 | 0.4% |
| Polish | 28 | 1.2% |
| Portuguese | 5 | 0.2% |
| Scandinavian | 5 | 0.2% |
| Scotch-Irish | 65 | 2.8% |
| Scottish | 72 | 3.1% |
| Subsaharan African | 3 | 0.1% |
| Swedish | 4 | 0.2% |
| Swiss | 2 | 0.1% |
| Thai | 12 | 0.5% |
| Welsh | 12 | 0.5% | View All 30 Rows |
Immigrants in Indian Springs Village
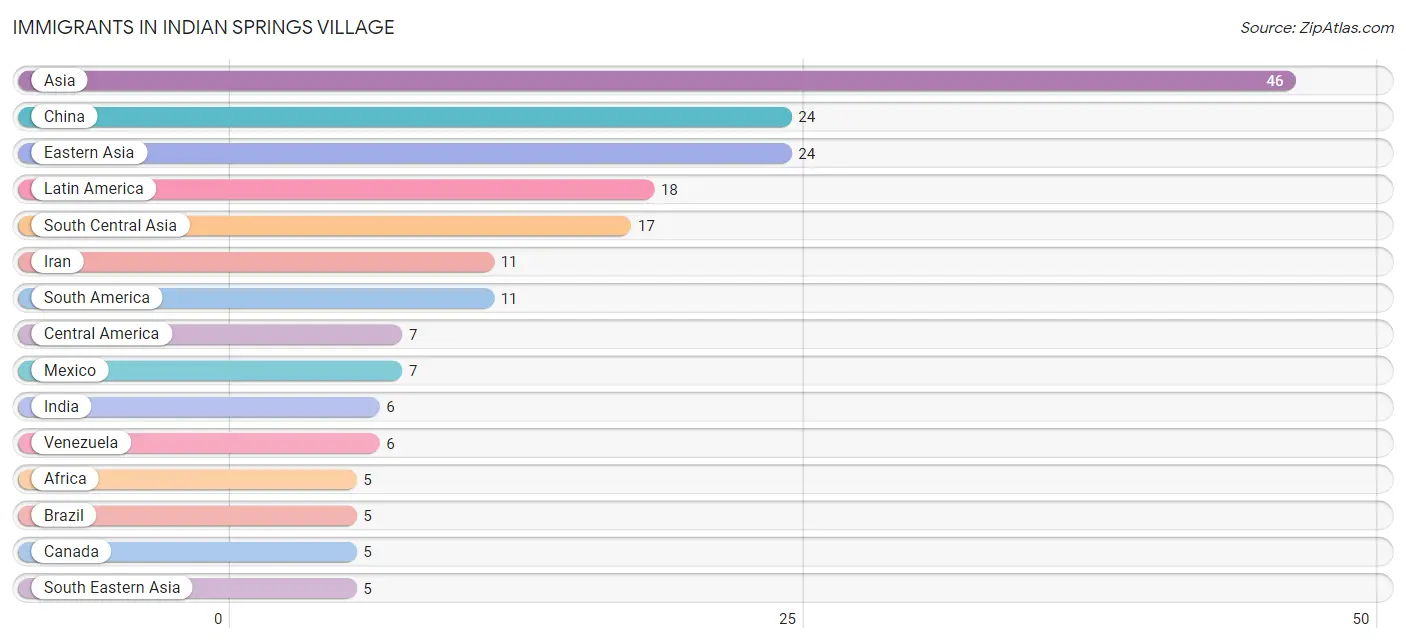
The most numerous immigrant groups reported in Indian Springs Village came from Asia (46 | 2.0%), China (24 | 1.0%), Eastern Asia (24 | 1.0%), Latin America (18 | 0.8%), and South Central Asia (17 | 0.7%), together accounting for 5.5% of all Indian Springs Village residents.
| Immigration Origin | # Population | % Population |
| Africa | 5 | 0.2% |
| Asia | 46 | 2.0% |
| Brazil | 5 | 0.2% |
| Canada | 5 | 0.2% |
| Central America | 7 | 0.3% |
| China | 24 | 1.0% |
| Eastern Africa | 3 | 0.1% |
| Eastern Asia | 24 | 1.0% |
| England | 4 | 0.2% |
| Europe | 4 | 0.2% |
| India | 6 | 0.3% |
| Iran | 11 | 0.5% |
| Latin America | 18 | 0.8% |
| Mexico | 7 | 0.3% |
| Northern Europe | 4 | 0.2% |
| South Africa | 2 | 0.1% |
| South America | 11 | 0.5% |
| South Central Asia | 17 | 0.7% |
| South Eastern Asia | 5 | 0.2% |
| Venezuela | 6 | 0.3% |
| Vietnam | 5 | 0.2% |
| Zimbabwe | 3 | 0.1% | View All 22 Rows |
Sex and Age in Indian Springs Village
Sex and Age in Indian Springs Village
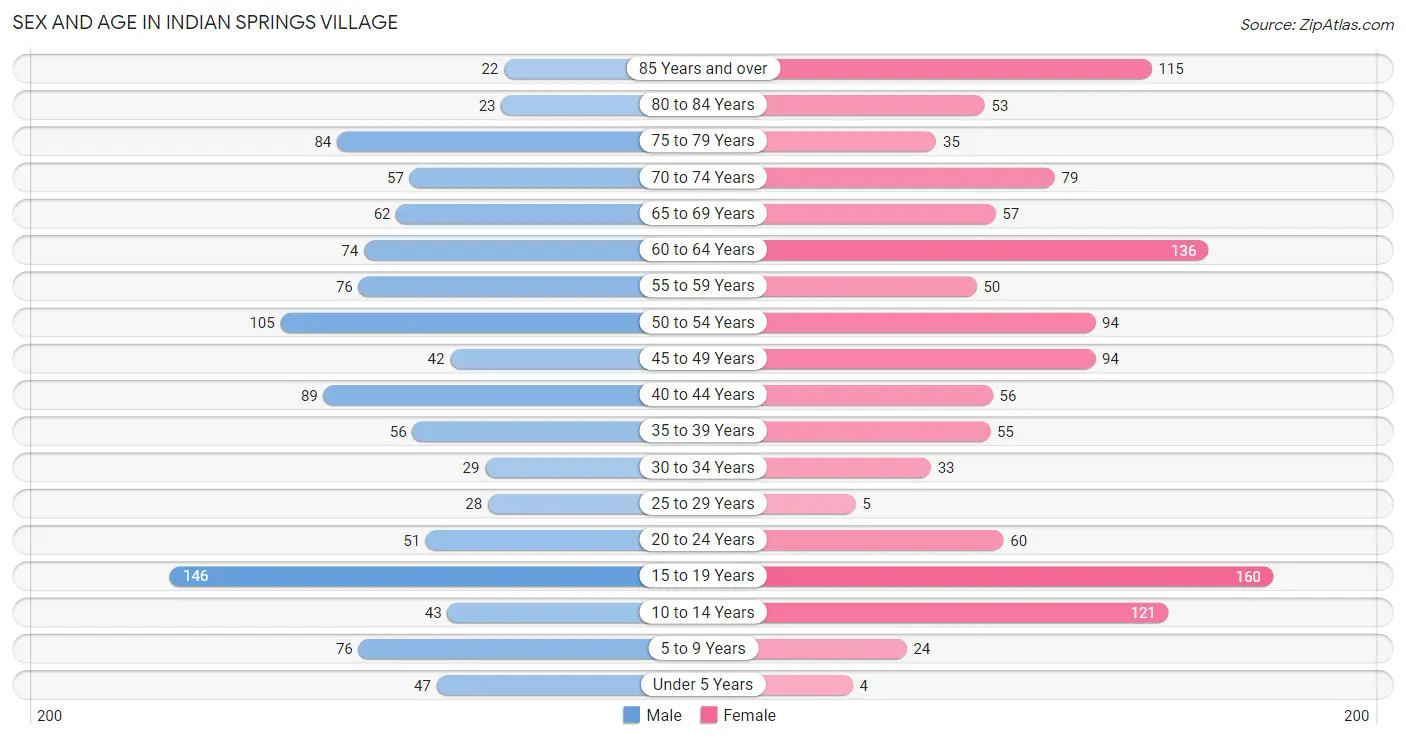
The most populous age groups in Indian Springs Village are 15 to 19 Years (146 | 13.2%) for men and 15 to 19 Years (160 | 13.0%) for women.
| Age Bracket | Male | Female |
| Under 5 Years | 47 (4.2%) | 4 (0.3%) |
| 5 to 9 Years | 76 (6.9%) | 24 (1.9%) |
| 10 to 14 Years | 43 (3.9%) | 121 (9.8%) |
| 15 to 19 Years | 146 (13.2%) | 160 (13.0%) |
| 20 to 24 Years | 51 (4.6%) | 60 (4.9%) |
| 25 to 29 Years | 28 (2.5%) | 5 (0.4%) |
| 30 to 34 Years | 29 (2.6%) | 33 (2.7%) |
| 35 to 39 Years | 56 (5.1%) | 55 (4.5%) |
| 40 to 44 Years | 89 (8.0%) | 56 (4.5%) |
| 45 to 49 Years | 42 (3.8%) | 94 (7.6%) |
| 50 to 54 Years | 105 (9.5%) | 94 (7.6%) |
| 55 to 59 Years | 76 (6.9%) | 50 (4.1%) |
| 60 to 64 Years | 74 (6.7%) | 136 (11.1%) |
| 65 to 69 Years | 62 (5.6%) | 57 (4.6%) |
| 70 to 74 Years | 57 (5.1%) | 79 (6.4%) |
| 75 to 79 Years | 84 (7.6%) | 35 (2.8%) |
| 80 to 84 Years | 23 (2.1%) | 53 (4.3%) |
| 85 Years and over | 22 (2.0%) | 115 (9.3%) |
| Total | 1,110 (100.0%) | 1,231 (100.0%) |
Families and Households in Indian Springs Village
Median Family Size in Indian Springs Village
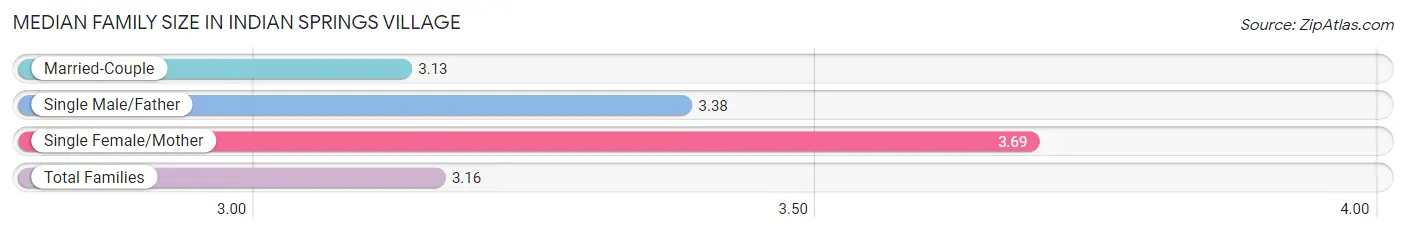
The median family size in Indian Springs Village is 3.16 persons per family, with single female/mother families (26 | 4.1%) accounting for the largest median family size of 3.69 persons per family. On the other hand, married-couple families (607 | 94.7%) represent the smallest median family size with 3.13 persons per family.
| Family Type | # Families | Family Size |
| Married-Couple | 607 (94.7%) | 3.13 |
| Single Male/Father | 8 (1.3%) | 3.38 |
| Single Female/Mother | 26 (4.1%) | 3.69 |
| Total Families | 641 (100.0%) | 3.16 |
Median Household Size in Indian Springs Village
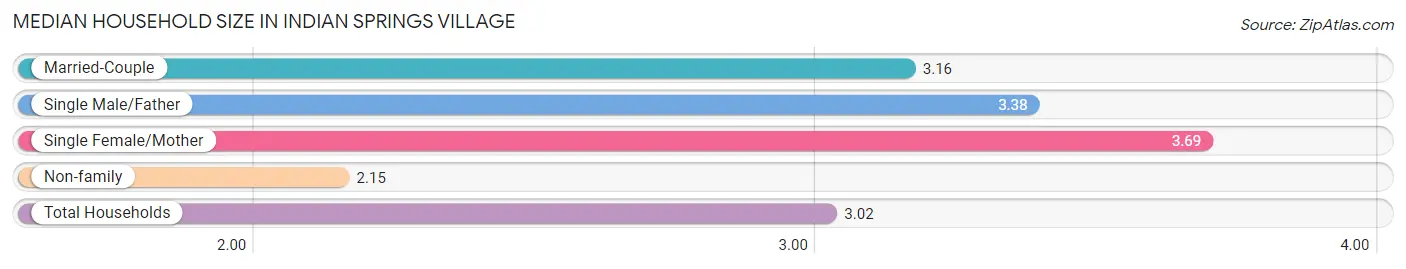
The median household size in Indian Springs Village is 3.02 persons per household, with single female/mother households (26 | 3.4%) accounting for the largest median household size of 3.69 persons per household. non-family households (116 | 15.3%) represent the smallest median household size with 2.15 persons per household.
| Household Type | # Households | Household Size |
| Married-Couple | 607 (80.2%) | 3.16 |
| Single Male/Father | 8 (1.1%) | 3.38 |
| Single Female/Mother | 26 (3.4%) | 3.69 |
| Non-family | 116 (15.3%) | 2.15 |
| Total Households | 757 (100.0%) | 3.02 |
Household Size by Marriage Status in Indian Springs Village
Out of a total of 757 households in Indian Springs Village, 641 (84.7%) are family households, while 116 (15.3%) are nonfamily households. The most numerous type of family households are 2-person households, comprising 306, and the most common type of nonfamily households are 1-person households, comprising 106.
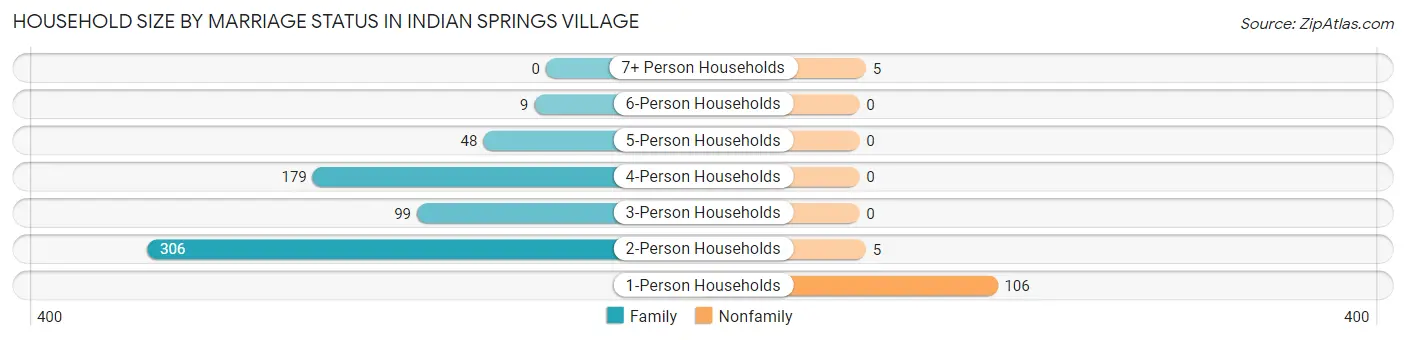
| Household Size | Family Households | Nonfamily Households |
| 1-Person Households | - | 106 (14.0%) |
| 2-Person Households | 306 (40.4%) | 5 (0.7%) |
| 3-Person Households | 99 (13.1%) | 0 (0.0%) |
| 4-Person Households | 179 (23.6%) | 0 (0.0%) |
| 5-Person Households | 48 (6.3%) | 0 (0.0%) |
| 6-Person Households | 9 (1.2%) | 0 (0.0%) |
| 7+ Person Households | 0 (0.0%) | 5 (0.7%) |
| Total | 641 (84.7%) | 116 (15.3%) |
Female Fertility in Indian Springs Village
Fertility by Age in Indian Springs Village
Average fertility rate in Indian Springs Village is 10.0 births per 1,000 women. Women in the age bracket of 20 to 34 years have the highest fertility rate with 51.0 births per 1,000 women. Women in the age bracket of 20 to 34 years acount for 100.0% of all women with births.
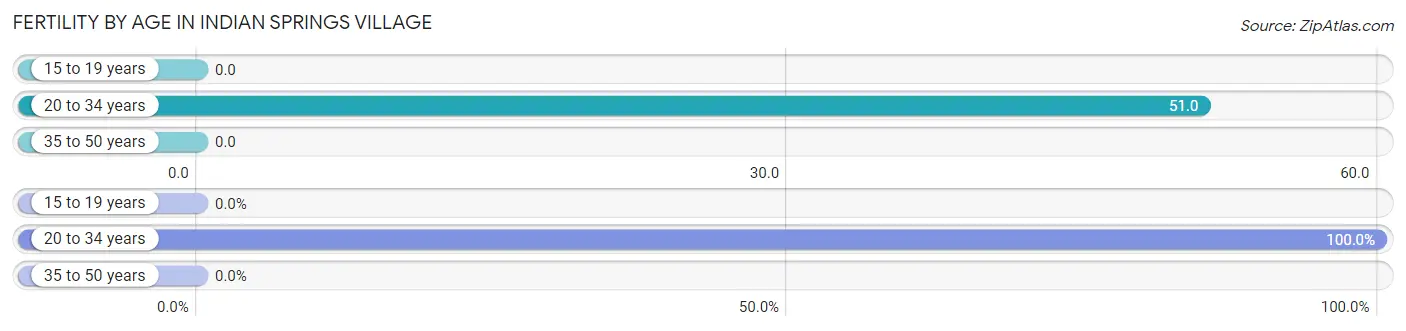
| Age Bracket | Women with Births | Births / 1,000 Women |
| 15 to 19 years | 0 (0.0%) | 0.0 |
| 20 to 34 years | 5 (100.0%) | 51.0 |
| 35 to 50 years | 0 (0.0%) | 0.0 |
| Total | 5 (100.0%) | 10.0 |
Fertility by Age by Marriage Status in Indian Springs Village
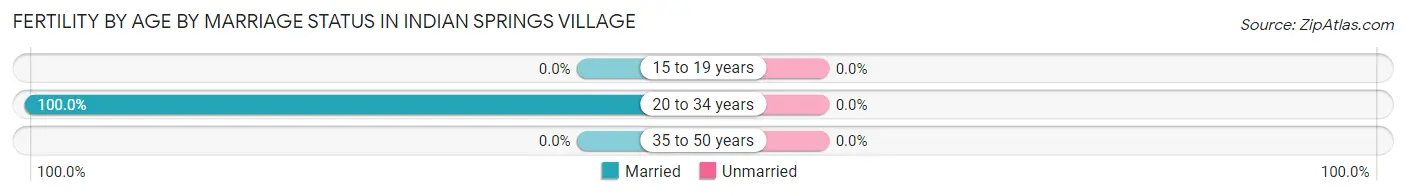
| Age Bracket | Married | Unmarried |
| 15 to 19 years | 0 (0.0%) | 0 (0.0%) |
| 20 to 34 years | 5 (100.0%) | 0 (0.0%) |
| 35 to 50 years | 0 (0.0%) | 0 (0.0%) |
| Total | 5 (100.0%) | 0 (0.0%) |
Fertility by Education in Indian Springs Village
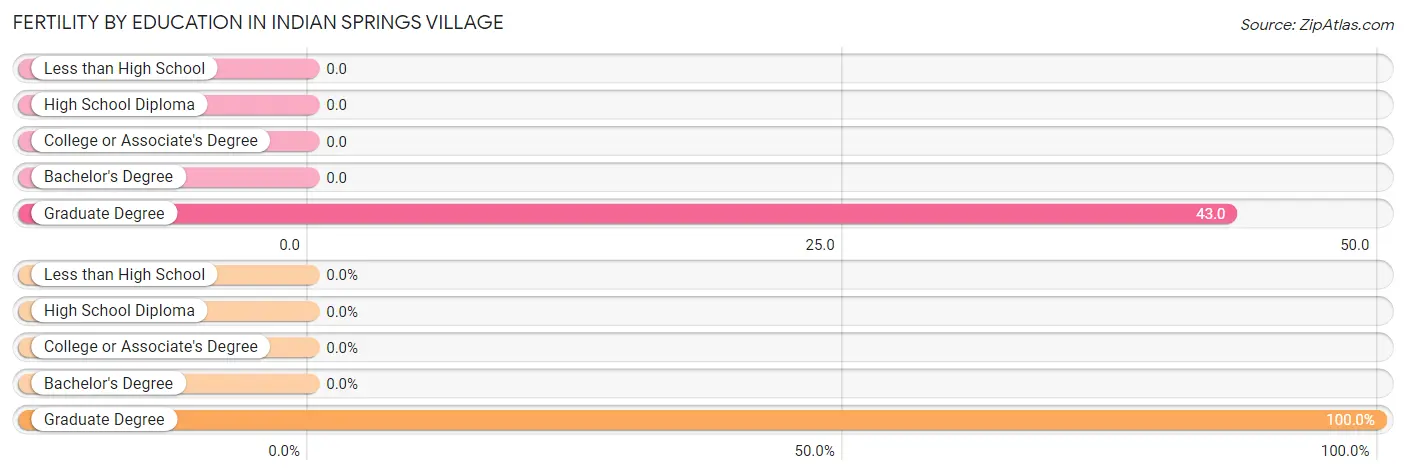
| Educational Attainment | Women with Births | Births / 1,000 Women |
| Less than High School | 0 (0.0%) | 0.0 |
| High School Diploma | 0 (0.0%) | 0.0 |
| College or Associate's Degree | 0 (0.0%) | 0.0 |
| Bachelor's Degree | 0 (0.0%) | 0.0 |
| Graduate Degree | 5 (100.0%) | 43.0 |
| Total | 5 (100.0%) | 10.0 |
Fertility by Education by Marriage Status in Indian Springs Village
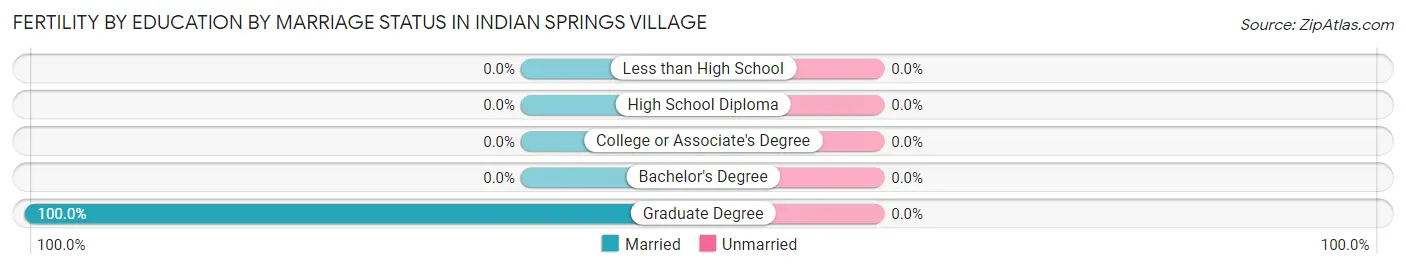
| Educational Attainment | Married | Unmarried |
| Less than High School | 0 (0.0%) | 0 (0.0%) |
| High School Diploma | 0 (0.0%) | 0 (0.0%) |
| College or Associate's Degree | 0 (0.0%) | 0 (0.0%) |
| Bachelor's Degree | 0 (0.0%) | 0 (0.0%) |
| Graduate Degree | 5 (100.0%) | 0 (0.0%) |
| Total | 5 (100.0%) | 0 (0.0%) |
Employment Characteristics in Indian Springs Village
Employment by Class of Employer in Indian Springs Village
Among the 1,075 employed individuals in Indian Springs Village, private company employees (602 | 56.0%), local government employees (110 | 10.2%), and not-for-profit organizations (106 | 9.9%) make up the most common classes of employment.
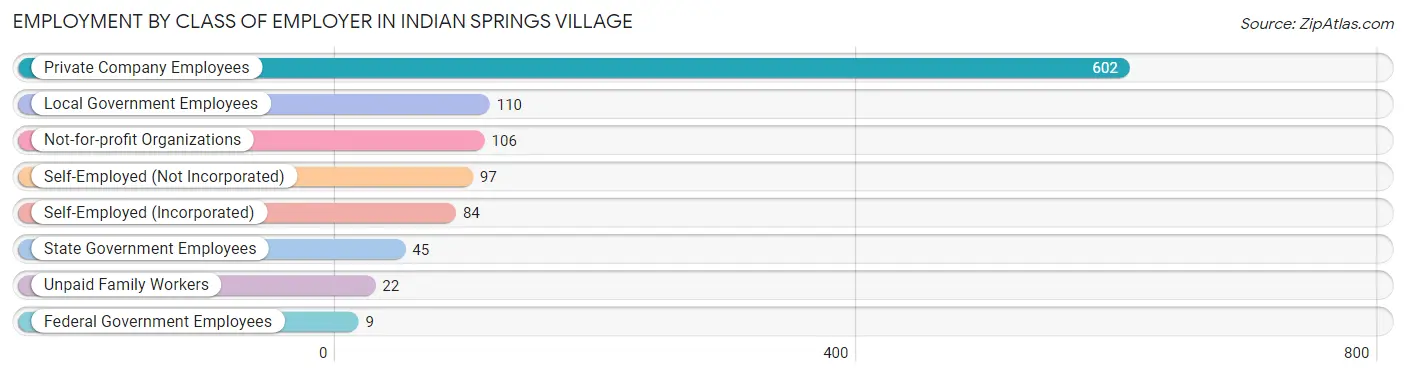
| Employer Class | # Employees | % Employees |
| Private Company Employees | 602 | 56.0% |
| Self-Employed (Incorporated) | 84 | 7.8% |
| Self-Employed (Not Incorporated) | 97 | 9.0% |
| Not-for-profit Organizations | 106 | 9.9% |
| Local Government Employees | 110 | 10.2% |
| State Government Employees | 45 | 4.2% |
| Federal Government Employees | 9 | 0.8% |
| Unpaid Family Workers | 22 | 2.1% |
| Total | 1,075 | 100.0% |
Employment Status by Age in Indian Springs Village
According to the labor force statistics for Indian Springs Village, out of the total population over 16 years of age (1,941), 58.0% or 1,126 individuals are in the labor force, with 2.5% or 28 of them unemployed. The age group with the highest labor force participation rate is 25 to 29 years, with 100.0% or 33 individuals in the labor force. Within the labor force, the 16 to 19 years age range has the highest percentage of unemployed individuals, with 7.4% or 7 of them being unemployed.
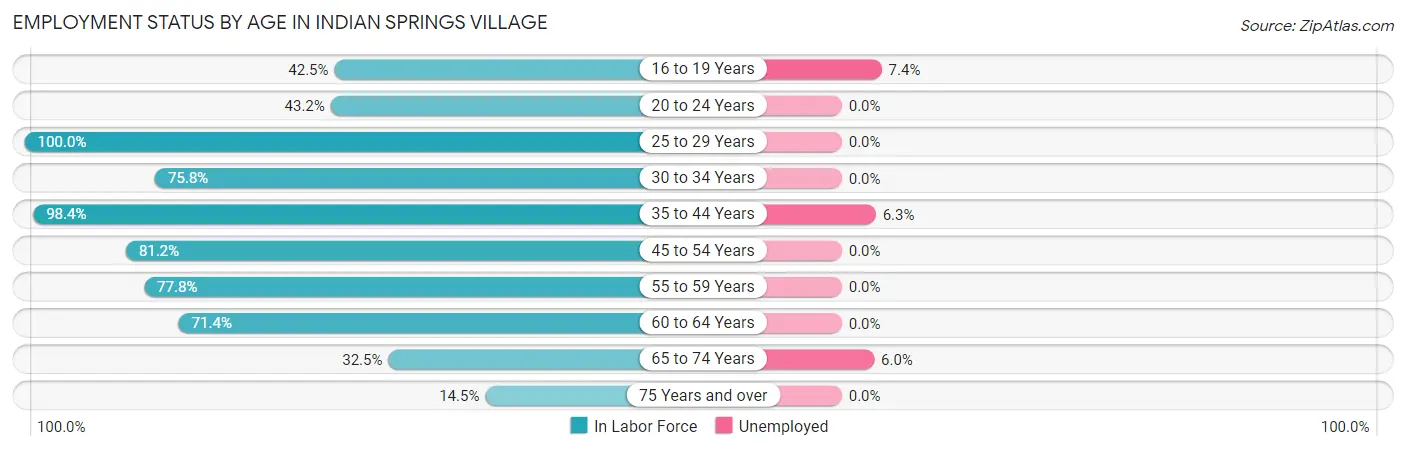
| Age Bracket | In Labor Force | Unemployed |
| 16 to 19 Years | 94 (42.5%) | 7 (7.4%) |
| 20 to 24 Years | 48 (43.2%) | 0 (0.0%) |
| 25 to 29 Years | 33 (100.0%) | 0 (0.0%) |
| 30 to 34 Years | 47 (75.8%) | 0 (0.0%) |
| 35 to 44 Years | 252 (98.4%) | 16 (6.3%) |
| 45 to 54 Years | 272 (81.2%) | 0 (0.0%) |
| 55 to 59 Years | 98 (77.8%) | 0 (0.0%) |
| 60 to 64 Years | 150 (71.4%) | 0 (0.0%) |
| 65 to 74 Years | 83 (32.5%) | 5 (6.0%) |
| 75 Years and over | 48 (14.5%) | 0 (0.0%) |
| Total | 1,126 (58.0%) | 28 (2.5%) |
Employment Status by Educational Attainment in Indian Springs Village
According to labor force statistics for Indian Springs Village, 83.4% of individuals (852) out of the total population between 25 and 64 years of age (1,022) are in the labor force, with 1.9% or 16 of them being unemployed. The group with the highest labor force participation rate are those with the educational attainment of less than high school, with 100.0% or 17 individuals in the labor force. Within the labor force, individuals with bachelor's degree or higher education have the highest percentage of unemployment, with 2.4% or 16 of them being unemployed.
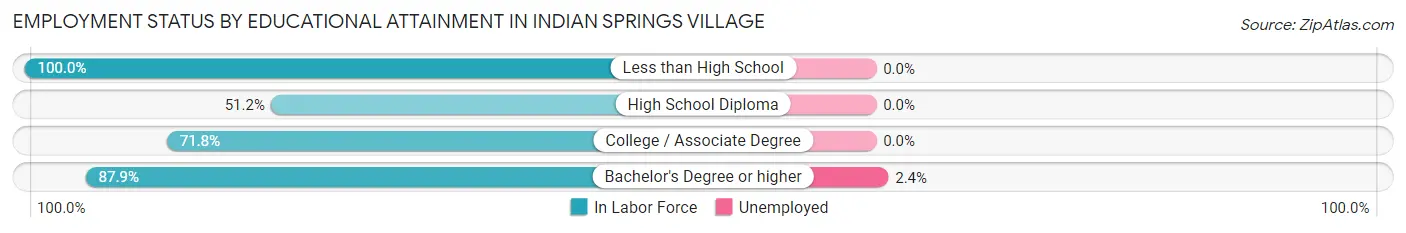
| Educational Attainment | In Labor Force | Unemployed |
| Less than High School | 17 (100.0%) | 0 (0.0%) |
| High School Diploma | 21 (51.2%) | 0 (0.0%) |
| College / Associate Degree | 148 (71.8%) | 0 (0.0%) |
| Bachelor's Degree or higher | 666 (87.9%) | 18 (2.4%) |
| Total | 852 (83.4%) | 19 (1.9%) |
Employment Occupations by Sex in Indian Springs Village
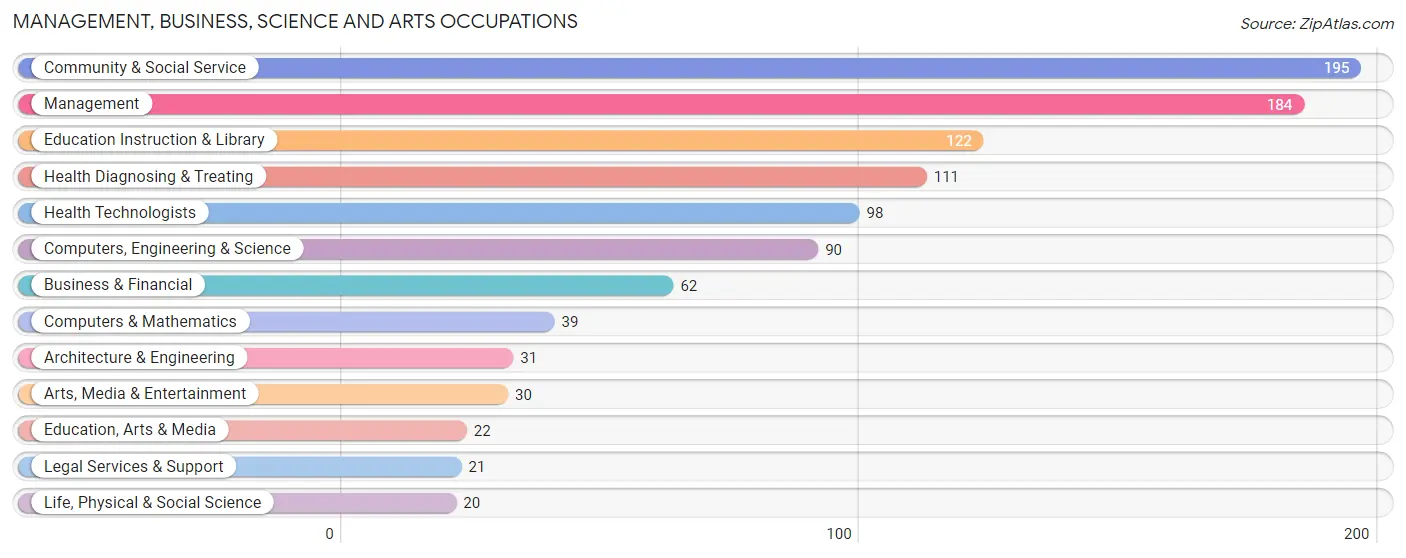
Management, Business, Science and Arts Occupations
The most common Management, Business, Science and Arts occupations in Indian Springs Village are Community & Social Service (195 | 17.8%), Management (184 | 16.8%), Education Instruction & Library (122 | 11.1%), Health Diagnosing & Treating (111 | 10.1%), and Health Technologists (98 | 8.9%).
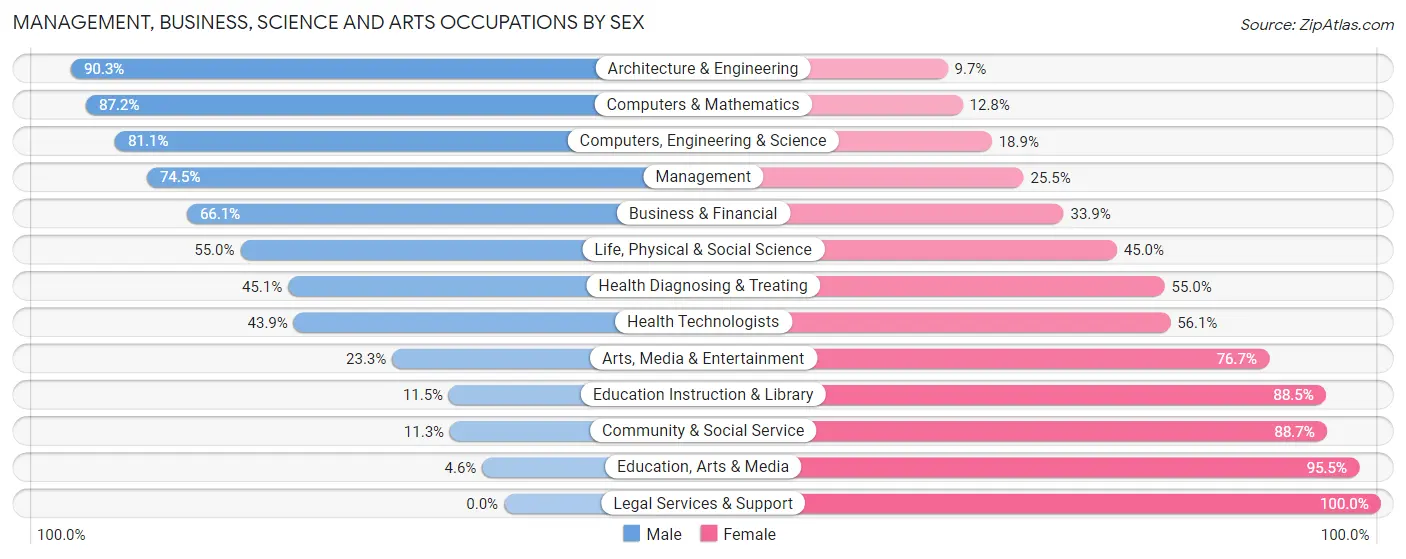
Management, Business, Science and Arts Occupations by Sex
Within the Management, Business, Science and Arts occupations in Indian Springs Village, the most male-oriented occupations are Architecture & Engineering (90.3%), Computers & Mathematics (87.2%), and Computers, Engineering & Science (81.1%), while the most female-oriented occupations are Legal Services & Support (100.0%), Education, Arts & Media (95.5%), and Community & Social Service (88.7%).
| Occupation | Male | Female |
| Management | 137 (74.5%) | 47 (25.5%) |
| Business & Financial | 41 (66.1%) | 21 (33.9%) |
| Computers, Engineering & Science | 73 (81.1%) | 17 (18.9%) |
| Computers & Mathematics | 34 (87.2%) | 5 (12.8%) |
| Architecture & Engineering | 28 (90.3%) | 3 (9.7%) |
| Life, Physical & Social Science | 11 (55.0%) | 9 (45.0%) |
| Community & Social Service | 22 (11.3%) | 173 (88.7%) |
| Education, Arts & Media | 1 (4.5%) | 21 (95.5%) |
| Legal Services & Support | 0 (0.0%) | 21 (100.0%) |
| Education Instruction & Library | 14 (11.5%) | 108 (88.5%) |
| Arts, Media & Entertainment | 7 (23.3%) | 23 (76.7%) |
| Health Diagnosing & Treating | 50 (45.1%) | 61 (54.9%) |
| Health Technologists | 43 (43.9%) | 55 (56.1%) |
| Total (Category) | 323 (50.3%) | 319 (49.7%) |
| Total (Overall) | 584 (53.2%) | 513 (46.8%) |
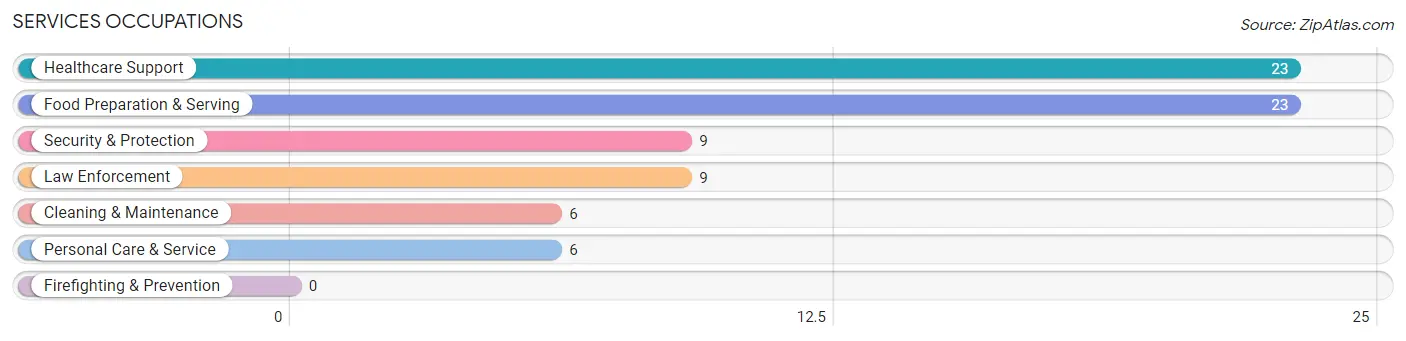
Services Occupations
The most common Services occupations in Indian Springs Village are Healthcare Support (23 | 2.1%), Food Preparation & Serving (23 | 2.1%), Security & Protection (9 | 0.8%), Law Enforcement (9 | 0.8%), and Cleaning & Maintenance (6 | 0.5%).
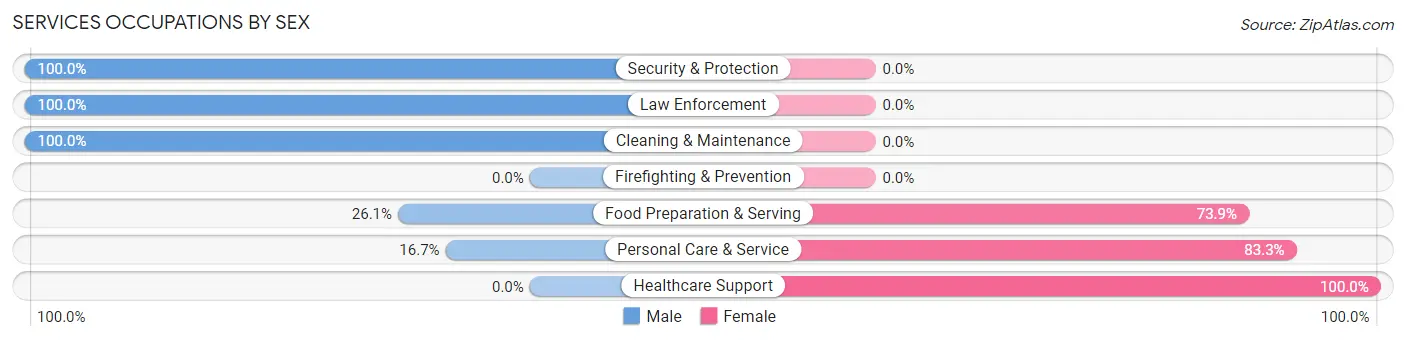
Services Occupations by Sex
Within the Services occupations in Indian Springs Village, the most male-oriented occupations are Security & Protection (100.0%), Law Enforcement (100.0%), and Cleaning & Maintenance (100.0%), while the most female-oriented occupations are Healthcare Support (100.0%), Personal Care & Service (83.3%), and Food Preparation & Serving (73.9%).
| Occupation | Male | Female |
| Healthcare Support | 0 (0.0%) | 23 (100.0%) |
| Security & Protection | 9 (100.0%) | 0 (0.0%) |
| Firefighting & Prevention | 0 (0.0%) | 0 (0.0%) |
| Law Enforcement | 9 (100.0%) | 0 (0.0%) |
| Food Preparation & Serving | 6 (26.1%) | 17 (73.9%) |
| Cleaning & Maintenance | 6 (100.0%) | 0 (0.0%) |
| Personal Care & Service | 1 (16.7%) | 5 (83.3%) |
| Total (Category) | 22 (32.8%) | 45 (67.2%) |
| Total (Overall) | 584 (53.2%) | 513 (46.8%) |
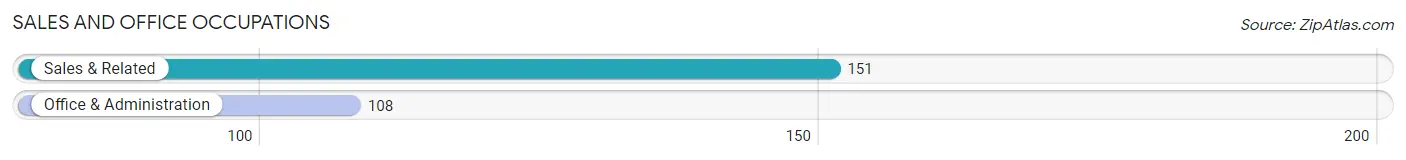
Sales and Office Occupations
The most common Sales and Office occupations in Indian Springs Village are Sales & Related (151 | 13.8%), and Office & Administration (108 | 9.9%).
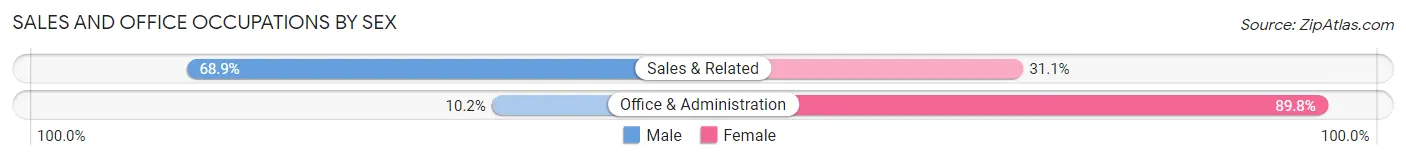
Sales and Office Occupations by Sex
| Occupation | Male | Female |
| Sales & Related | 104 (68.9%) | 47 (31.1%) |
| Office & Administration | 11 (10.2%) | 97 (89.8%) |
| Total (Category) | 115 (44.4%) | 144 (55.6%) |
| Total (Overall) | 584 (53.2%) | 513 (46.8%) |
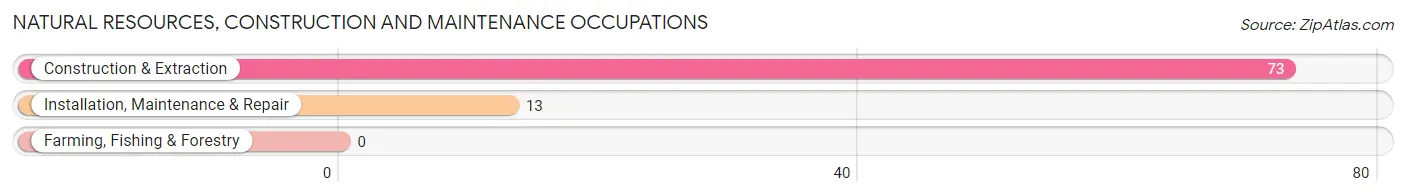
Natural Resources, Construction and Maintenance Occupations
The most common Natural Resources, Construction and Maintenance occupations in Indian Springs Village are Construction & Extraction (73 | 6.7%), and Installation, Maintenance & Repair (13 | 1.2%).
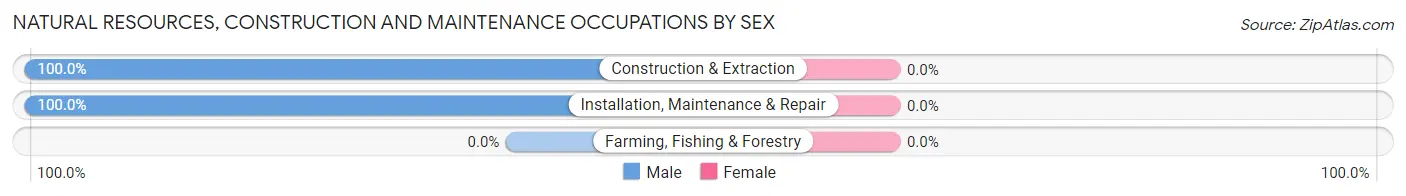
Natural Resources, Construction and Maintenance Occupations by Sex
| Occupation | Male | Female |
| Farming, Fishing & Forestry | 0 (0.0%) | 0 (0.0%) |
| Construction & Extraction | 73 (100.0%) | 0 (0.0%) |
| Installation, Maintenance & Repair | 13 (100.0%) | 0 (0.0%) |
| Total (Category) | 86 (100.0%) | 0 (0.0%) |
| Total (Overall) | 584 (53.2%) | 513 (46.8%) |
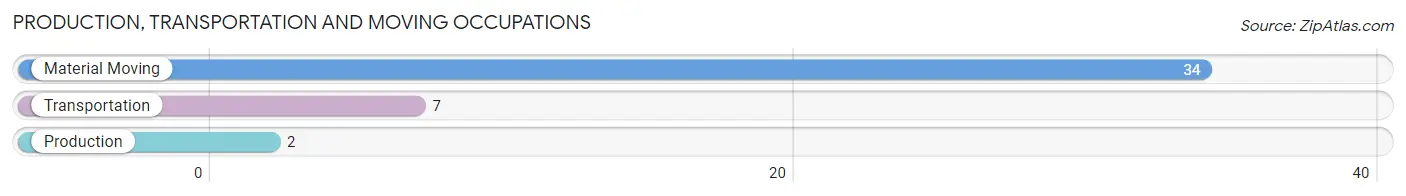
Production, Transportation and Moving Occupations
The most common Production, Transportation and Moving occupations in Indian Springs Village are Material Moving (34 | 3.1%), Transportation (7 | 0.6%), and Production (2 | 0.2%).
Production, Transportation and Moving Occupations by Sex
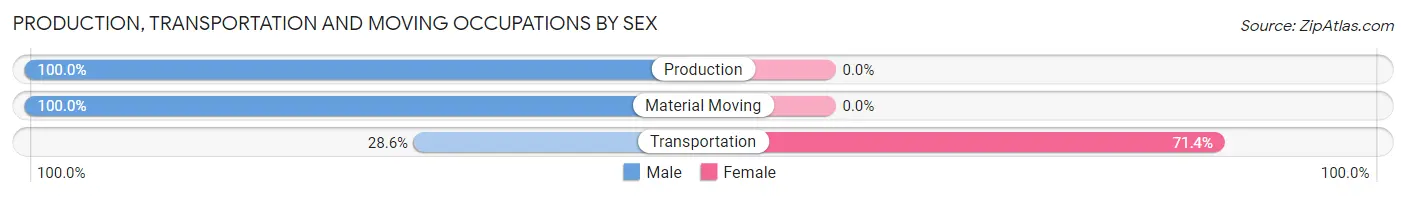
| Occupation | Male | Female |
| Production | 2 (100.0%) | 0 (0.0%) |
| Transportation | 2 (28.6%) | 5 (71.4%) |
| Material Moving | 34 (100.0%) | 0 (0.0%) |
| Total (Category) | 38 (88.4%) | 5 (11.6%) |
| Total (Overall) | 584 (53.2%) | 513 (46.8%) |
Employment Industries by Sex in Indian Springs Village
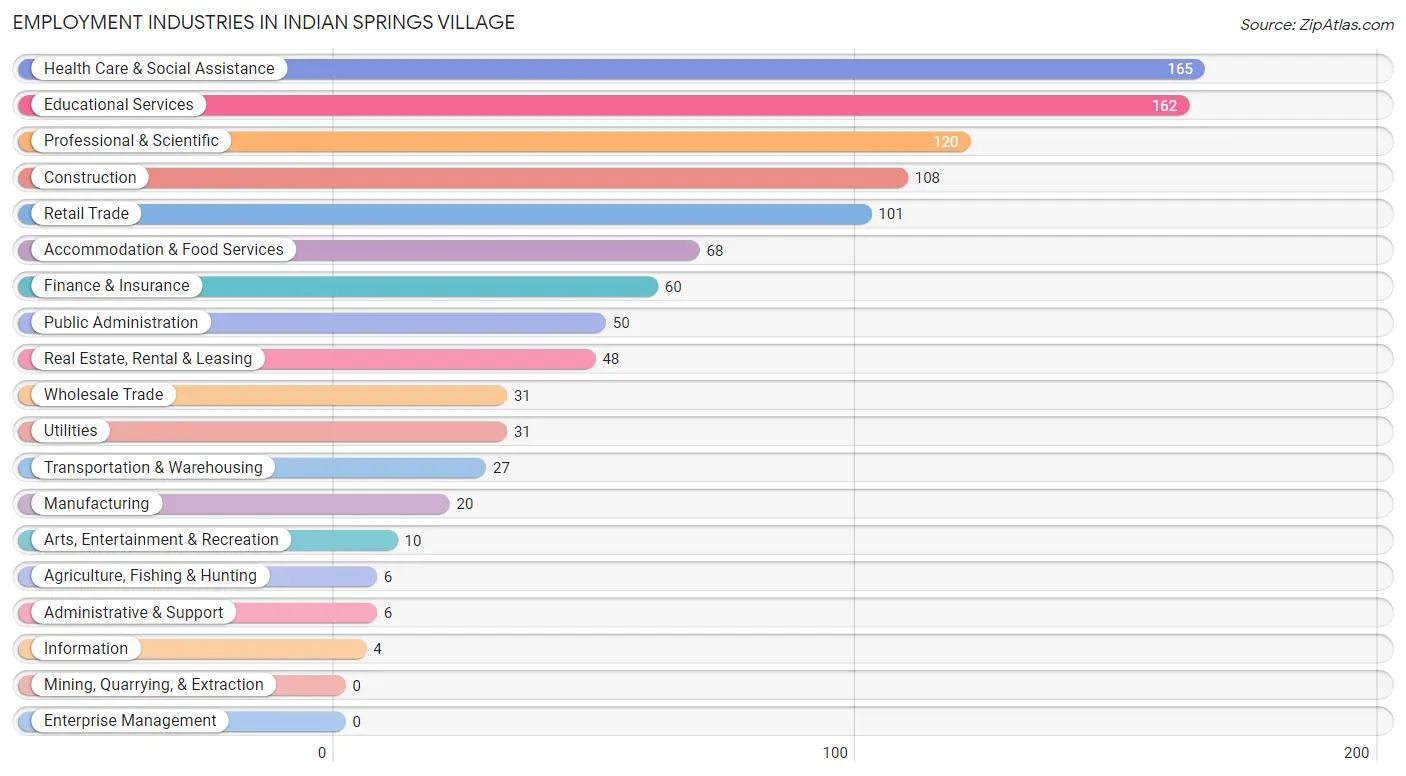
Employment Industries in Indian Springs Village
The major employment industries in Indian Springs Village include Health Care & Social Assistance (165 | 15.0%), Educational Services (162 | 14.8%), Professional & Scientific (120 | 10.9%), Construction (108 | 9.9%), and Retail Trade (101 | 9.2%).
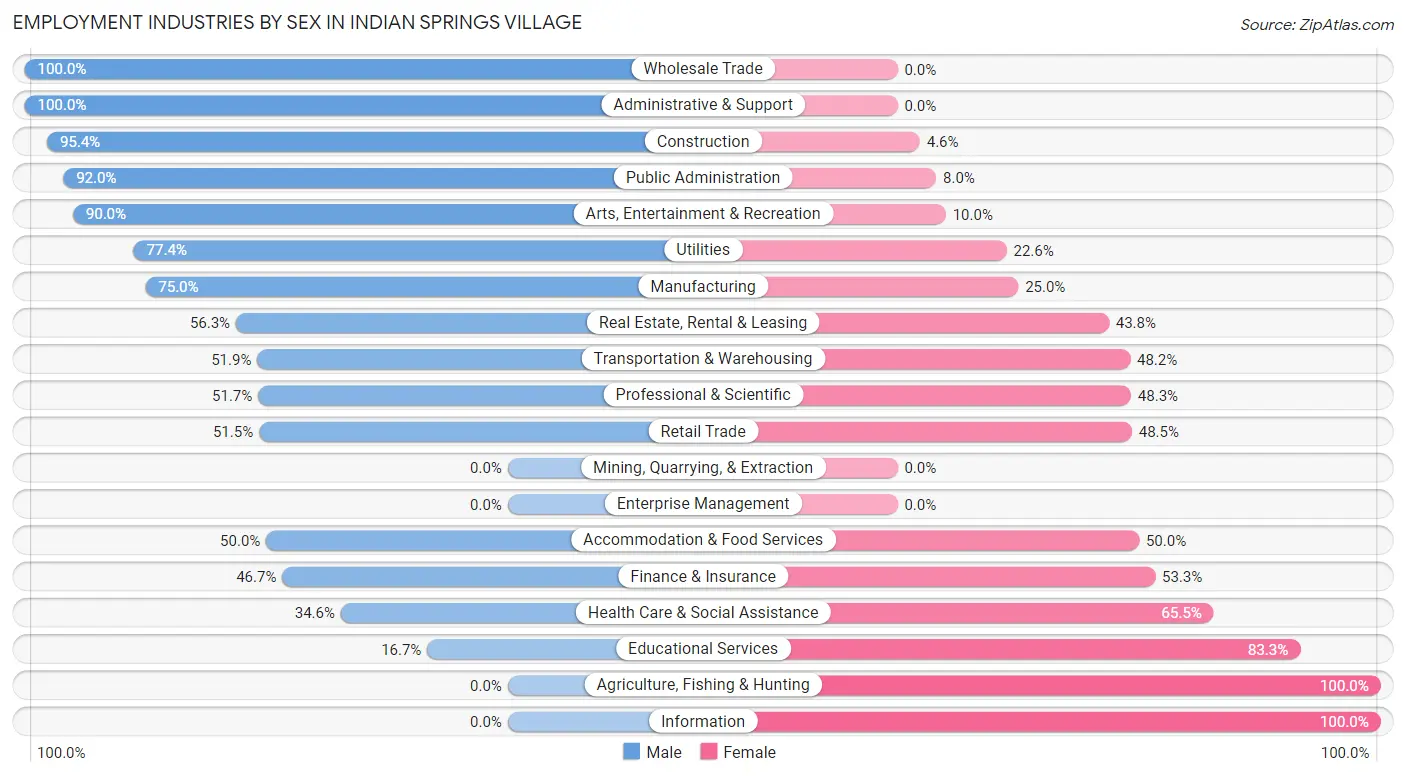
Employment Industries by Sex in Indian Springs Village
The Indian Springs Village industries that see more men than women are Wholesale Trade (100.0%), Administrative & Support (100.0%), and Construction (95.4%), whereas the industries that tend to have a higher number of women are Agriculture, Fishing & Hunting (100.0%), Information (100.0%), and Educational Services (83.3%).
| Industry | Male | Female |
| Agriculture, Fishing & Hunting | 0 (0.0%) | 6 (100.0%) |
| Mining, Quarrying, & Extraction | 0 (0.0%) | 0 (0.0%) |
| Construction | 103 (95.4%) | 5 (4.6%) |
| Manufacturing | 15 (75.0%) | 5 (25.0%) |
| Wholesale Trade | 31 (100.0%) | 0 (0.0%) |
| Retail Trade | 52 (51.5%) | 49 (48.5%) |
| Transportation & Warehousing | 14 (51.8%) | 13 (48.1%) |
| Utilities | 24 (77.4%) | 7 (22.6%) |
| Information | 0 (0.0%) | 4 (100.0%) |
| Finance & Insurance | 28 (46.7%) | 32 (53.3%) |
| Real Estate, Rental & Leasing | 27 (56.2%) | 21 (43.8%) |
| Professional & Scientific | 62 (51.7%) | 58 (48.3%) |
| Enterprise Management | 0 (0.0%) | 0 (0.0%) |
| Administrative & Support | 6 (100.0%) | 0 (0.0%) |
| Educational Services | 27 (16.7%) | 135 (83.3%) |
| Health Care & Social Assistance | 57 (34.5%) | 108 (65.4%) |
| Arts, Entertainment & Recreation | 9 (90.0%) | 1 (10.0%) |
| Accommodation & Food Services | 34 (50.0%) | 34 (50.0%) |
| Public Administration | 46 (92.0%) | 4 (8.0%) |
| Total | 584 (53.2%) | 513 (46.8%) |
Education in Indian Springs Village
School Enrollment in Indian Springs Village
The most common levels of schooling among the 638 students in Indian Springs Village are high school (258 | 40.4%), middle school (143 | 22.4%), and elementary school (72 | 11.3%).
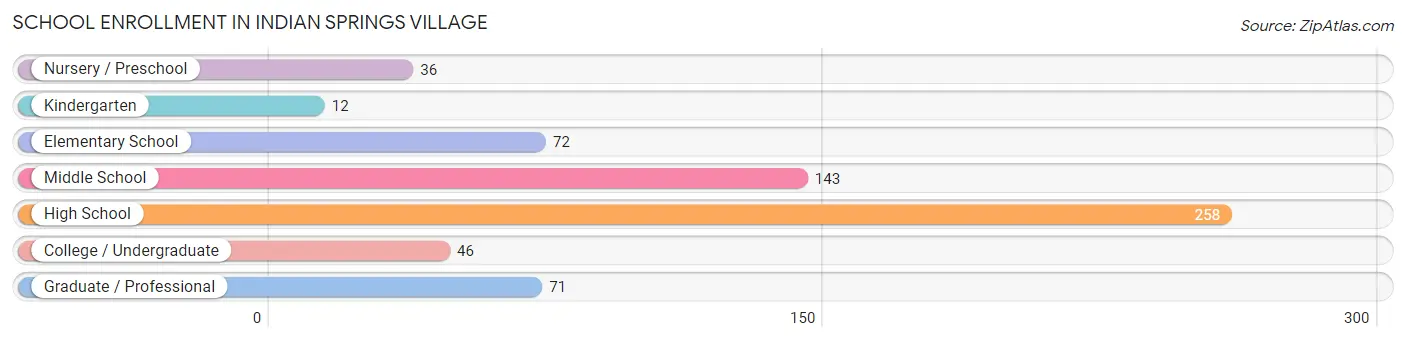
| School Level | # Students | % Students |
| Nursery / Preschool | 36 | 5.6% |
| Kindergarten | 12 | 1.9% |
| Elementary School | 72 | 11.3% |
| Middle School | 143 | 22.4% |
| High School | 258 | 40.4% |
| College / Undergraduate | 46 | 7.2% |
| Graduate / Professional | 71 | 11.1% |
| Total | 638 | 100.0% |
School Enrollment by Age by Funding Source in Indian Springs Village
Out of a total of 638 students who are enrolled in schools in Indian Springs Village, 210 (32.9%) attend a private institution, while the remaining 428 (67.1%) are enrolled in public schools. The age group of 3 to 4 year olds has the highest likelihood of being enrolled in private schools, with 25 (100.0% in the age bracket) enrolled. Conversely, the age group of 10 to 14 year olds has the lowest likelihood of being enrolled in a private school, with 134 (81.7% in the age bracket) attending a public institution.
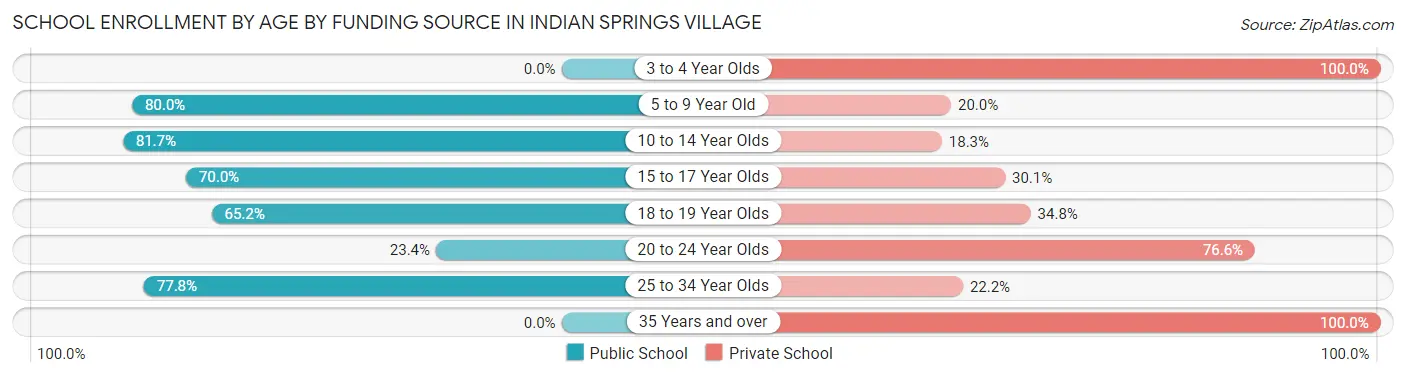
| Age Bracket | Public School | Private School |
| 3 to 4 Year Olds | 0 (0.0%) | 25 (100.0%) |
| 5 to 9 Year Old | 76 (80.0%) | 19 (20.0%) |
| 10 to 14 Year Olds | 134 (81.7%) | 30 (18.3%) |
| 15 to 17 Year Olds | 128 (70.0%) | 55 (30.0%) |
| 18 to 19 Year Olds | 58 (65.2%) | 31 (34.8%) |
| 20 to 24 Year Olds | 11 (23.4%) | 36 (76.6%) |
| 25 to 34 Year Olds | 21 (77.8%) | 6 (22.2%) |
| 35 Years and over | 0 (0.0%) | 8 (100.0%) |
| Total | 428 (67.1%) | 210 (32.9%) |
Educational Attainment by Field of Study in Indian Springs Village
Business (247 | 21.3%), education (167 | 14.4%), science & technology (111 | 9.6%), engineering (96 | 8.3%), and computers & mathematics (78 | 6.7%) are the most common fields of study among 1,157 individuals in Indian Springs Village who have obtained a bachelor's degree or higher.
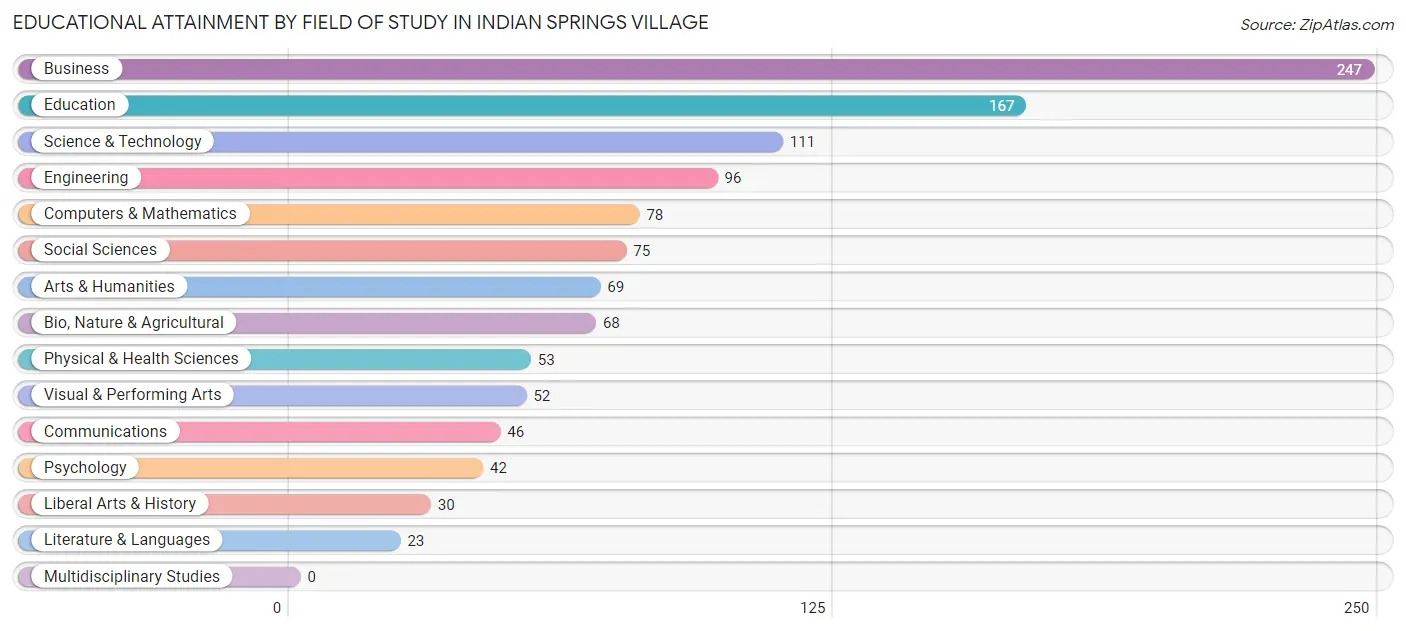
| Field of Study | # Graduates | % Graduates |
| Computers & Mathematics | 78 | 6.7% |
| Bio, Nature & Agricultural | 68 | 5.9% |
| Physical & Health Sciences | 53 | 4.6% |
| Psychology | 42 | 3.6% |
| Social Sciences | 75 | 6.5% |
| Engineering | 96 | 8.3% |
| Multidisciplinary Studies | 0 | 0.0% |
| Science & Technology | 111 | 9.6% |
| Business | 247 | 21.3% |
| Education | 167 | 14.4% |
| Literature & Languages | 23 | 2.0% |
| Liberal Arts & History | 30 | 2.6% |
| Visual & Performing Arts | 52 | 4.5% |
| Communications | 46 | 4.0% |
| Arts & Humanities | 69 | 6.0% |
| Total | 1,157 | 100.0% |
Transportation & Commute in Indian Springs Village
Vehicle Availability by Sex in Indian Springs Village
The most prevalent vehicle ownership categories in Indian Springs Village are males with 2 vehicles (207, accounting for 36.7%) and females with 2 vehicles (182, making up 41.1%).
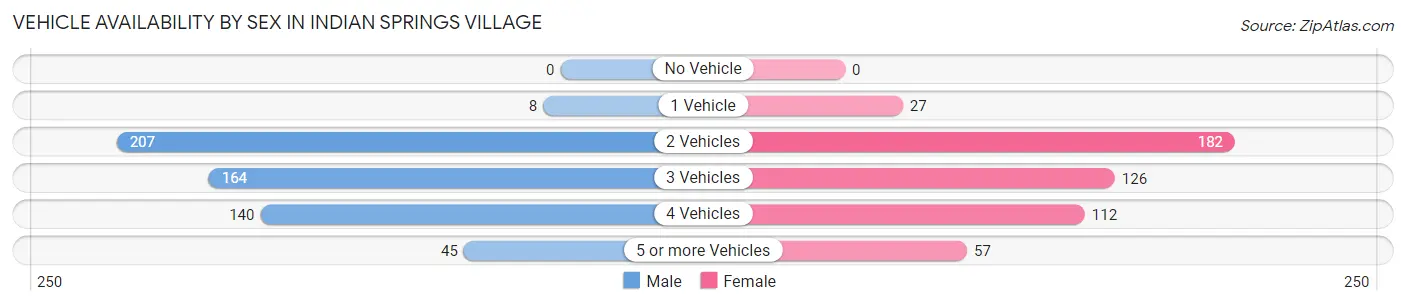
| Vehicles Available | Male | Female |
| No Vehicle | 0 (0.0%) | 0 (0.0%) |
| 1 Vehicle | 8 (1.4%) | 27 (5.4%) |
| 2 Vehicles | 207 (36.7%) | 182 (36.1%) |
| 3 Vehicles | 164 (29.1%) | 126 (25.0%) |
| 4 Vehicles | 140 (24.8%) | 112 (22.2%) |
| 5 or more Vehicles | 45 (8.0%) | 57 (11.3%) |
| Total | 564 (100.0%) | 504 (100.0%) |
Commute Time in Indian Springs Village
The most frequently occuring commute durations in Indian Springs Village are 20 to 24 minutes (223 commuters, 24.0%), 30 to 34 minutes (157 commuters, 16.9%), and 15 to 19 minutes (141 commuters, 15.2%).
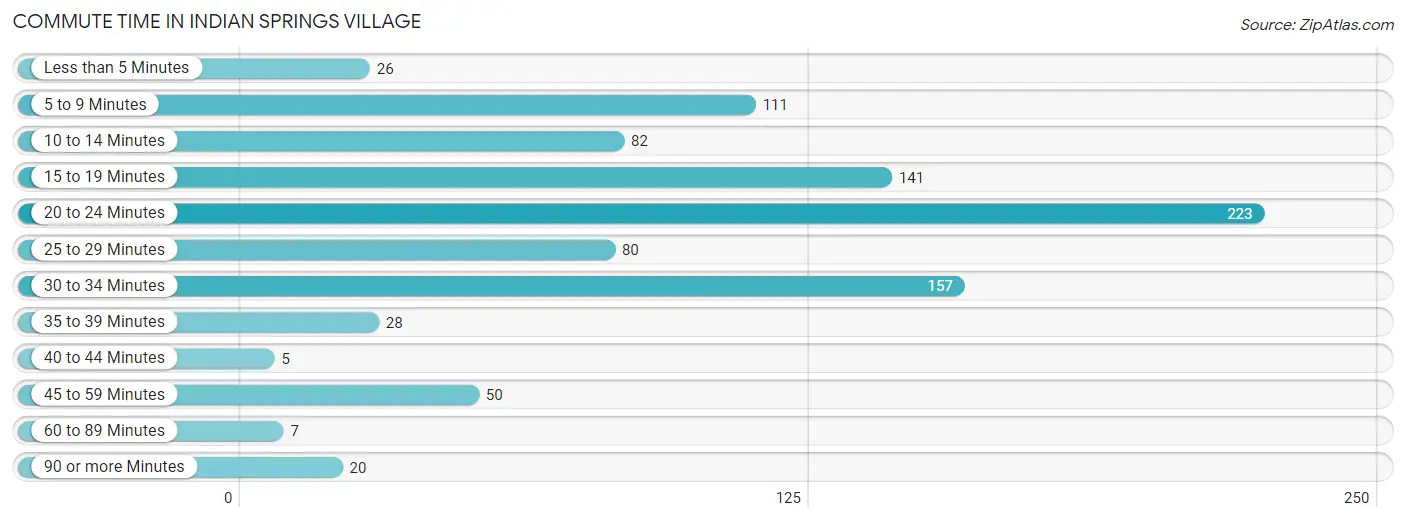
| Commute Time | # Commuters | % Commuters |
| Less than 5 Minutes | 26 | 2.8% |
| 5 to 9 Minutes | 111 | 11.9% |
| 10 to 14 Minutes | 82 | 8.8% |
| 15 to 19 Minutes | 141 | 15.2% |
| 20 to 24 Minutes | 223 | 24.0% |
| 25 to 29 Minutes | 80 | 8.6% |
| 30 to 34 Minutes | 157 | 16.9% |
| 35 to 39 Minutes | 28 | 3.0% |
| 40 to 44 Minutes | 5 | 0.5% |
| 45 to 59 Minutes | 50 | 5.4% |
| 60 to 89 Minutes | 7 | 0.7% |
| 90 or more Minutes | 20 | 2.1% |
Commute Time by Sex in Indian Springs Village
The most common commute times in Indian Springs Village are 20 to 24 minutes (139 commuters, 26.4%) for males and 20 to 24 minutes (84 commuters, 20.8%) for females.
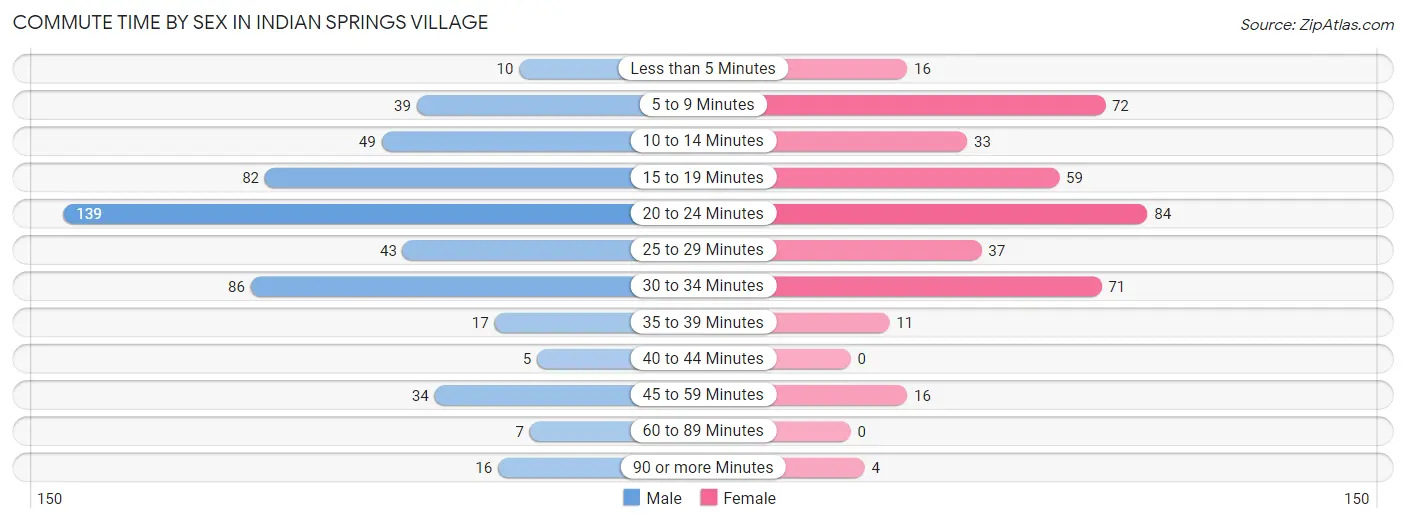
| Commute Time | Male | Female |
| Less than 5 Minutes | 10 (1.9%) | 16 (4.0%) |
| 5 to 9 Minutes | 39 (7.4%) | 72 (17.9%) |
| 10 to 14 Minutes | 49 (9.3%) | 33 (8.2%) |
| 15 to 19 Minutes | 82 (15.6%) | 59 (14.6%) |
| 20 to 24 Minutes | 139 (26.4%) | 84 (20.8%) |
| 25 to 29 Minutes | 43 (8.2%) | 37 (9.2%) |
| 30 to 34 Minutes | 86 (16.3%) | 71 (17.6%) |
| 35 to 39 Minutes | 17 (3.2%) | 11 (2.7%) |
| 40 to 44 Minutes | 5 (0.9%) | 0 (0.0%) |
| 45 to 59 Minutes | 34 (6.5%) | 16 (4.0%) |
| 60 to 89 Minutes | 7 (1.3%) | 0 (0.0%) |
| 90 or more Minutes | 16 (3.0%) | 4 (1.0%) |
Time of Departure to Work by Sex in Indian Springs Village
The most frequent times of departure to work in Indian Springs Village are 8:00 AM to 8:29 AM (124, 23.5%) for males and 7:00 AM to 7:29 AM (170, 42.2%) for females.
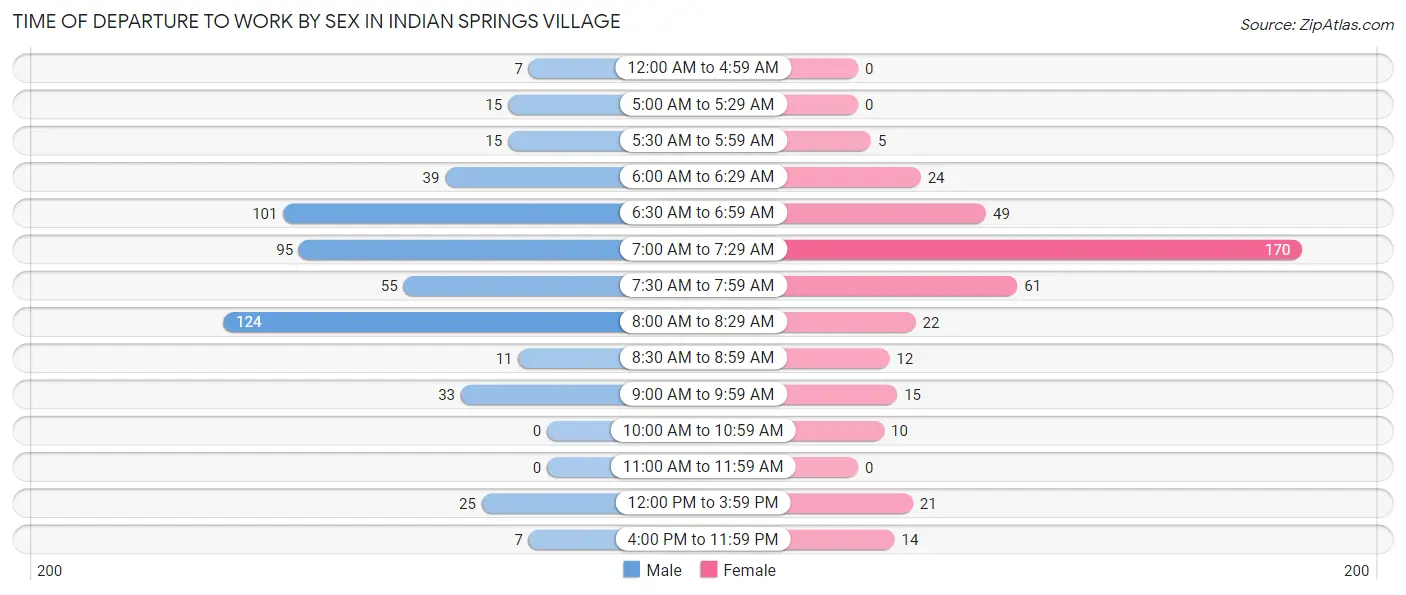
| Time of Departure | Male | Female |
| 12:00 AM to 4:59 AM | 7 (1.3%) | 0 (0.0%) |
| 5:00 AM to 5:29 AM | 15 (2.9%) | 0 (0.0%) |
| 5:30 AM to 5:59 AM | 15 (2.9%) | 5 (1.2%) |
| 6:00 AM to 6:29 AM | 39 (7.4%) | 24 (6.0%) |
| 6:30 AM to 6:59 AM | 101 (19.2%) | 49 (12.2%) |
| 7:00 AM to 7:29 AM | 95 (18.0%) | 170 (42.2%) |
| 7:30 AM to 7:59 AM | 55 (10.4%) | 61 (15.1%) |
| 8:00 AM to 8:29 AM | 124 (23.5%) | 22 (5.5%) |
| 8:30 AM to 8:59 AM | 11 (2.1%) | 12 (3.0%) |
| 9:00 AM to 9:59 AM | 33 (6.3%) | 15 (3.7%) |
| 10:00 AM to 10:59 AM | 0 (0.0%) | 10 (2.5%) |
| 11:00 AM to 11:59 AM | 0 (0.0%) | 0 (0.0%) |
| 12:00 PM to 3:59 PM | 25 (4.7%) | 21 (5.2%) |
| 4:00 PM to 11:59 PM | 7 (1.3%) | 14 (3.5%) |
| Total | 527 (100.0%) | 403 (100.0%) |
Housing Occupancy in Indian Springs Village
Occupancy by Ownership in Indian Springs Village
Of the total 757 dwellings in Indian Springs Village, owner-occupied units account for 732 (96.7%), while renter-occupied units make up 25 (3.3%).
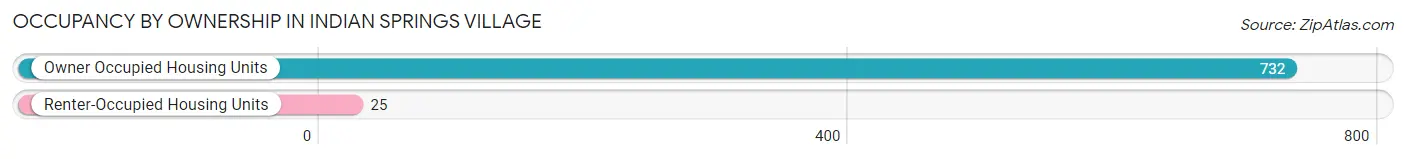
| Occupancy | # Housing Units | % Housing Units |
| Owner Occupied Housing Units | 732 | 96.7% |
| Renter-Occupied Housing Units | 25 | 3.3% |
| Total Occupied Housing Units | 757 | 100.0% |
Occupancy by Household Size in Indian Springs Village
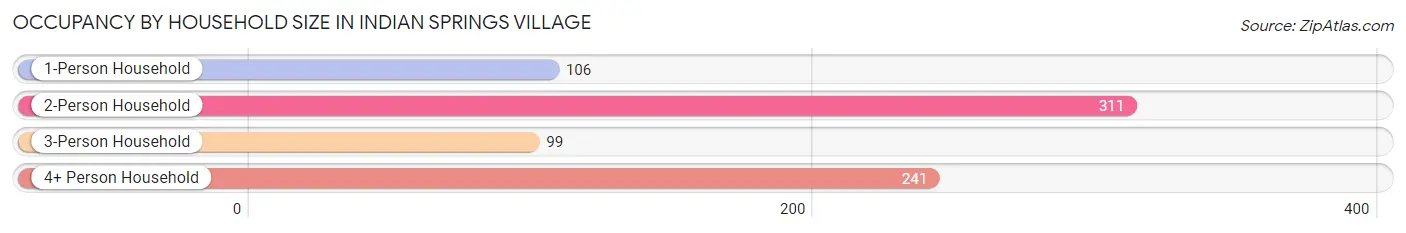
| Household Size | # Housing Units | % Housing Units |
| 1-Person Household | 106 | 14.0% |
| 2-Person Household | 311 | 41.1% |
| 3-Person Household | 99 | 13.1% |
| 4+ Person Household | 241 | 31.8% |
| Total Housing Units | 757 | 100.0% |
Occupancy by Ownership by Household Size in Indian Springs Village
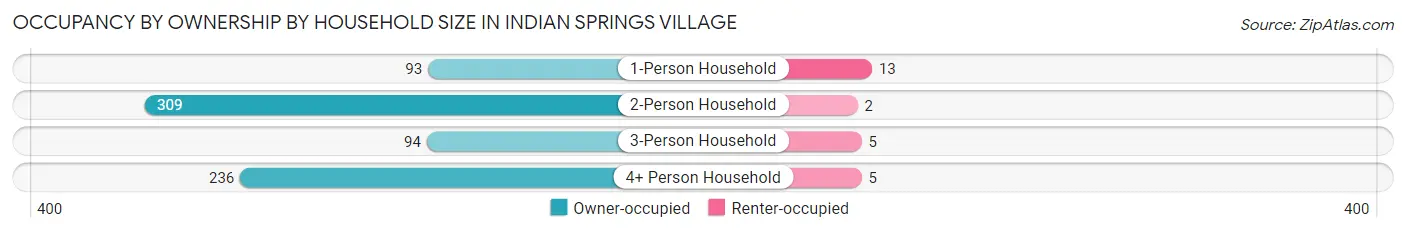
| Household Size | Owner-occupied | Renter-occupied |
| 1-Person Household | 93 (87.7%) | 13 (12.3%) |
| 2-Person Household | 309 (99.4%) | 2 (0.6%) |
| 3-Person Household | 94 (95.0%) | 5 (5.1%) |
| 4+ Person Household | 236 (97.9%) | 5 (2.1%) |
| Total Housing Units | 732 (96.7%) | 25 (3.3%) |
Occupancy by Educational Attainment in Indian Springs Village
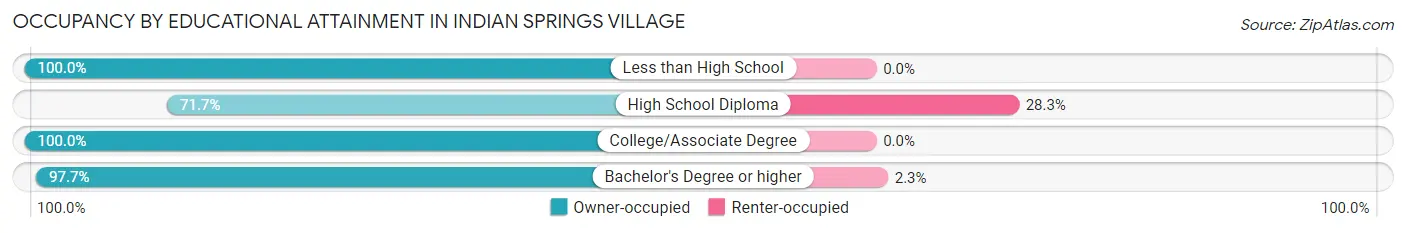
| Household Size | Owner-occupied | Renter-occupied |
| Less than High School | 7 (100.0%) | 0 (0.0%) |
| High School Diploma | 33 (71.7%) | 13 (28.3%) |
| College/Associate Degree | 183 (100.0%) | 0 (0.0%) |
| Bachelor's Degree or higher | 509 (97.7%) | 12 (2.3%) |
Occupancy by Age of Householder in Indian Springs Village
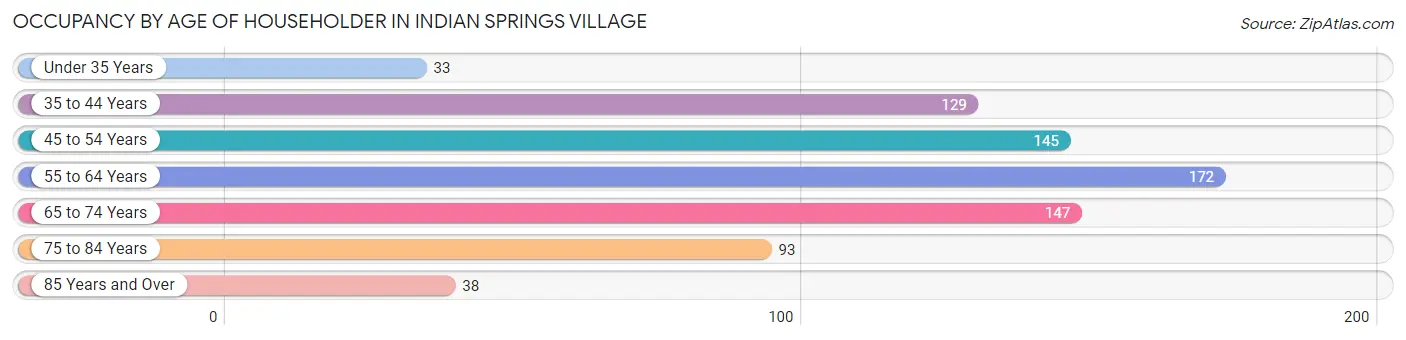
| Age Bracket | # Households | % Households |
| Under 35 Years | 33 | 4.4% |
| 35 to 44 Years | 129 | 17.0% |
| 45 to 54 Years | 145 | 19.2% |
| 55 to 64 Years | 172 | 22.7% |
| 65 to 74 Years | 147 | 19.4% |
| 75 to 84 Years | 93 | 12.3% |
| 85 Years and Over | 38 | 5.0% |
| Total | 757 | 100.0% |
Housing Finances in Indian Springs Village
Median Income by Occupancy in Indian Springs Village
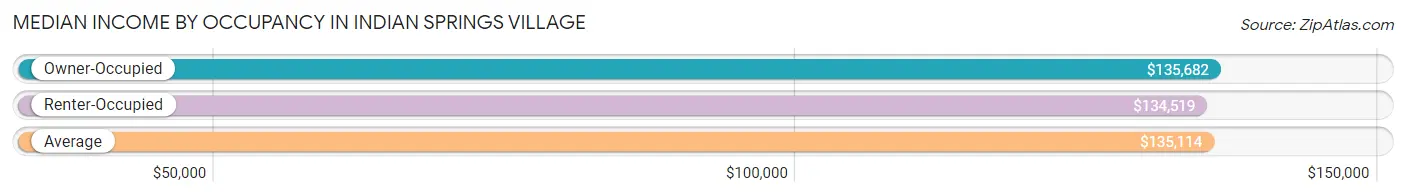
| Occupancy Type | # Households | Median Income |
| Owner-Occupied | 732 (96.7%) | $135,682 |
| Renter-Occupied | 25 (3.3%) | $134,519 |
| Average | 757 (100.0%) | $135,114 |
Occupancy by Householder Income Bracket in Indian Springs Village
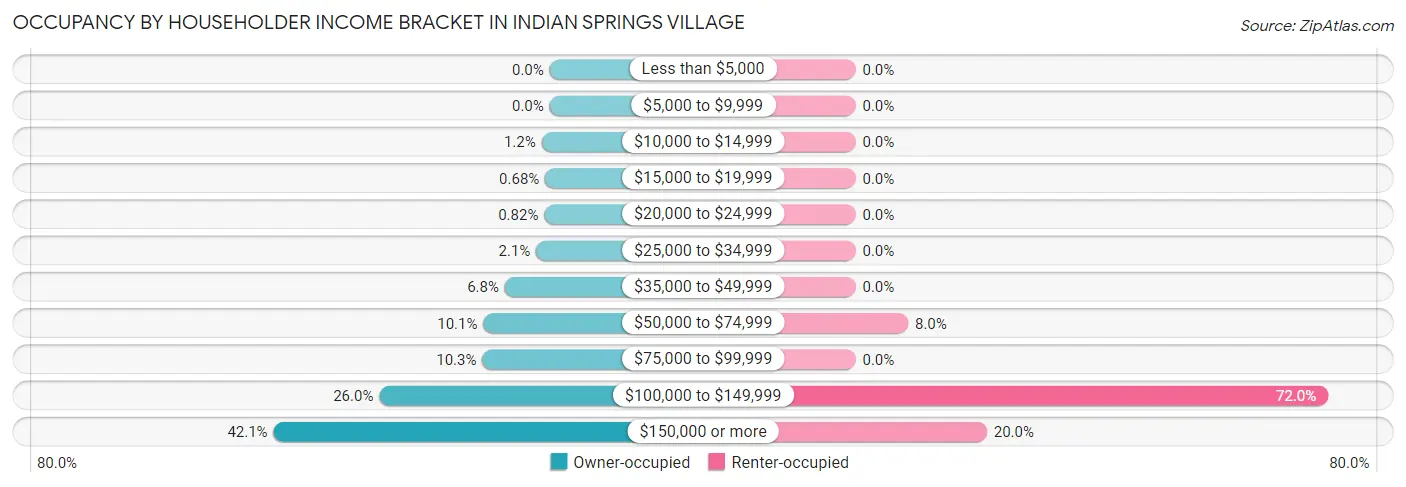
| Income Bracket | Owner-occupied | Renter-occupied |
| Less than $5,000 | 0 (0.0%) | 0 (0.0%) |
| $5,000 to $9,999 | 0 (0.0%) | 0 (0.0%) |
| $10,000 to $14,999 | 9 (1.2%) | 0 (0.0%) |
| $15,000 to $19,999 | 5 (0.7%) | 0 (0.0%) |
| $20,000 to $24,999 | 6 (0.8%) | 0 (0.0%) |
| $25,000 to $34,999 | 15 (2.1%) | 0 (0.0%) |
| $35,000 to $49,999 | 50 (6.8%) | 0 (0.0%) |
| $50,000 to $74,999 | 74 (10.1%) | 2 (8.0%) |
| $75,000 to $99,999 | 75 (10.2%) | 0 (0.0%) |
| $100,000 to $149,999 | 190 (26.0%) | 18 (72.0%) |
| $150,000 or more | 308 (42.1%) | 5 (20.0%) |
| Total | 732 (100.0%) | 25 (100.0%) |
Monthly Housing Cost Tiers in Indian Springs Village
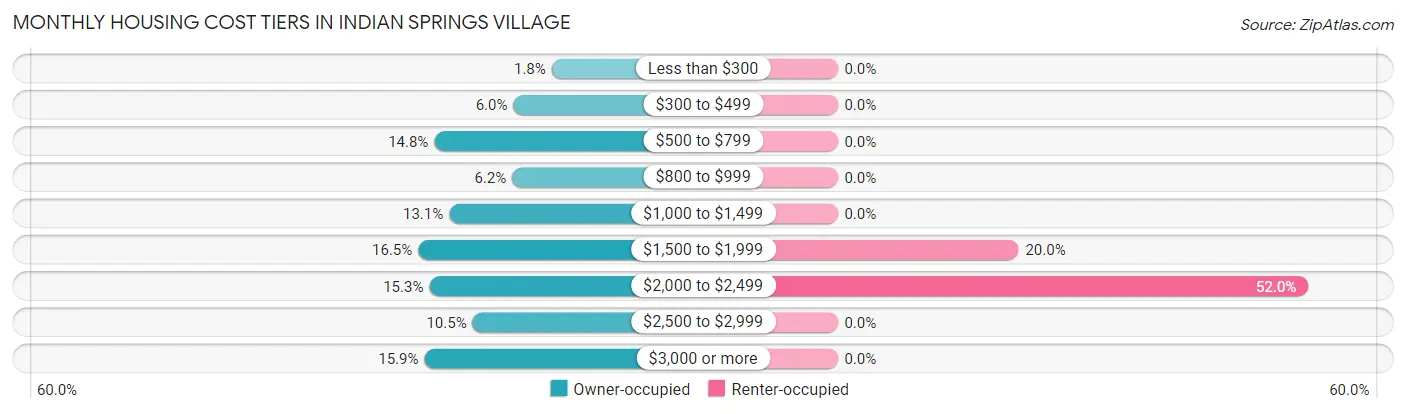
| Monthly Cost | Owner-occupied | Renter-occupied |
| Less than $300 | 13 (1.8%) | 0 (0.0%) |
| $300 to $499 | 44 (6.0%) | 0 (0.0%) |
| $500 to $799 | 108 (14.7%) | 0 (0.0%) |
| $800 to $999 | 45 (6.1%) | 0 (0.0%) |
| $1,000 to $1,499 | 96 (13.1%) | 0 (0.0%) |
| $1,500 to $1,999 | 121 (16.5%) | 5 (20.0%) |
| $2,000 to $2,499 | 112 (15.3%) | 13 (52.0%) |
| $2,500 to $2,999 | 77 (10.5%) | 0 (0.0%) |
| $3,000 or more | 116 (15.9%) | 0 (0.0%) |
| Total | 732 (100.0%) | 25 (100.0%) |
Physical Housing Characteristics in Indian Springs Village
Housing Structures in Indian Springs Village
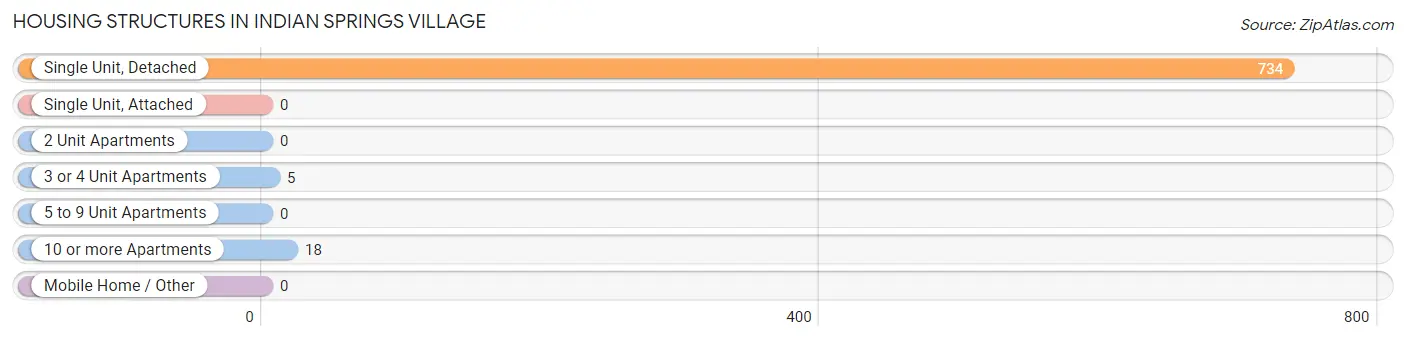
| Structure Type | # Housing Units | % Housing Units |
| Single Unit, Detached | 734 | 97.0% |
| Single Unit, Attached | 0 | 0.0% |
| 2 Unit Apartments | 0 | 0.0% |
| 3 or 4 Unit Apartments | 5 | 0.7% |
| 5 to 9 Unit Apartments | 0 | 0.0% |
| 10 or more Apartments | 18 | 2.4% |
| Mobile Home / Other | 0 | 0.0% |
| Total | 757 | 100.0% |
Housing Structures by Occupancy in Indian Springs Village
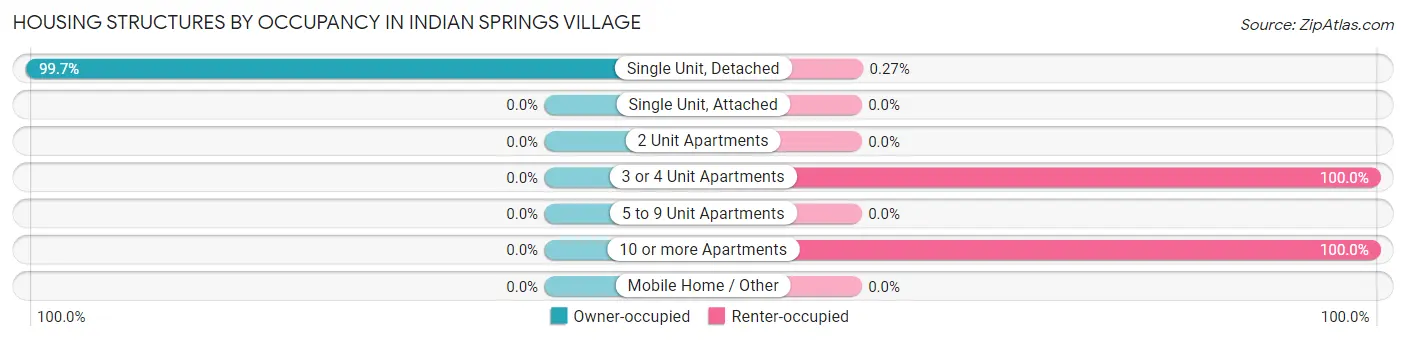
| Structure Type | Owner-occupied | Renter-occupied |
| Single Unit, Detached | 732 (99.7%) | 2 (0.3%) |
| Single Unit, Attached | 0 (0.0%) | 0 (0.0%) |
| 2 Unit Apartments | 0 (0.0%) | 0 (0.0%) |
| 3 or 4 Unit Apartments | 0 (0.0%) | 5 (100.0%) |
| 5 to 9 Unit Apartments | 0 (0.0%) | 0 (0.0%) |
| 10 or more Apartments | 0 (0.0%) | 18 (100.0%) |
| Mobile Home / Other | 0 (0.0%) | 0 (0.0%) |
| Total | 732 (96.7%) | 25 (3.3%) |
Housing Structures by Number of Rooms in Indian Springs Village
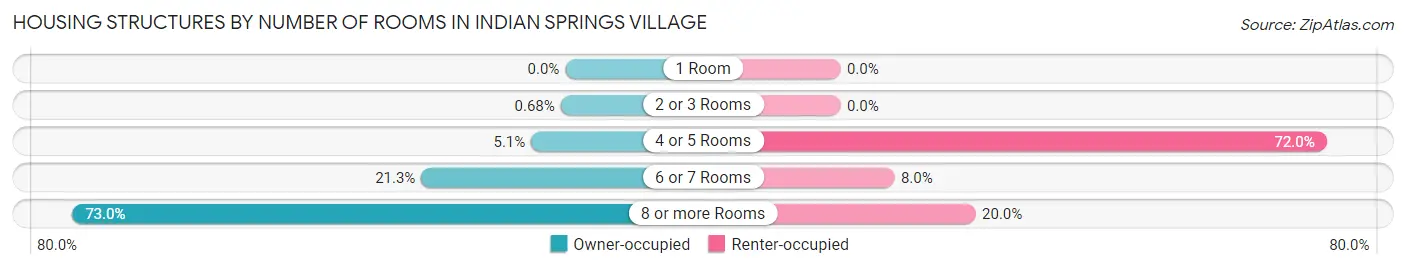
| Number of Rooms | Owner-occupied | Renter-occupied |
| 1 Room | 0 (0.0%) | 0 (0.0%) |
| 2 or 3 Rooms | 5 (0.7%) | 0 (0.0%) |
| 4 or 5 Rooms | 37 (5.1%) | 18 (72.0%) |
| 6 or 7 Rooms | 156 (21.3%) | 2 (8.0%) |
| 8 or more Rooms | 534 (73.0%) | 5 (20.0%) |
| Total | 732 (100.0%) | 25 (100.0%) |
Housing Structure by Heating Type in Indian Springs Village
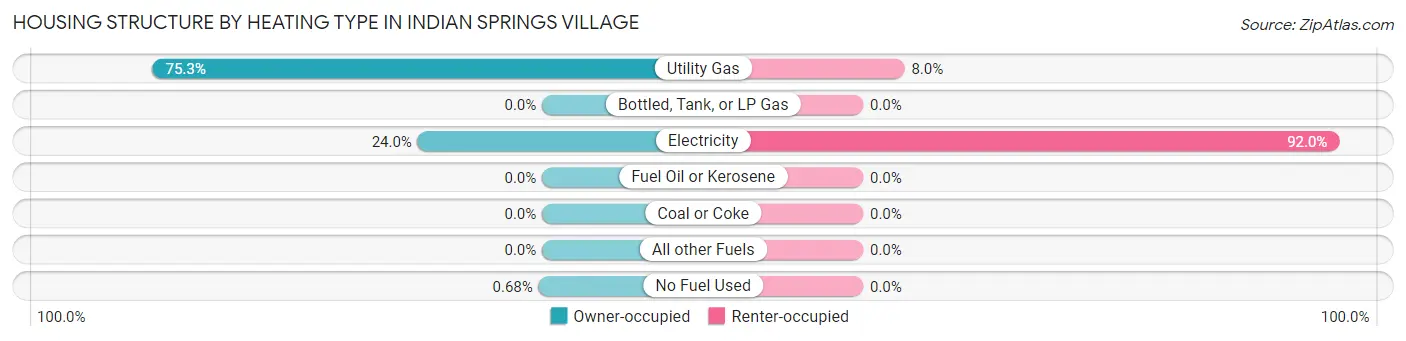
| Heating Type | Owner-occupied | Renter-occupied |
| Utility Gas | 551 (75.3%) | 2 (8.0%) |
| Bottled, Tank, or LP Gas | 0 (0.0%) | 0 (0.0%) |
| Electricity | 176 (24.0%) | 23 (92.0%) |
| Fuel Oil or Kerosene | 0 (0.0%) | 0 (0.0%) |
| Coal or Coke | 0 (0.0%) | 0 (0.0%) |
| All other Fuels | 0 (0.0%) | 0 (0.0%) |
| No Fuel Used | 5 (0.7%) | 0 (0.0%) |
| Total | 732 (100.0%) | 25 (100.0%) |
Household Vehicle Usage in Indian Springs Village
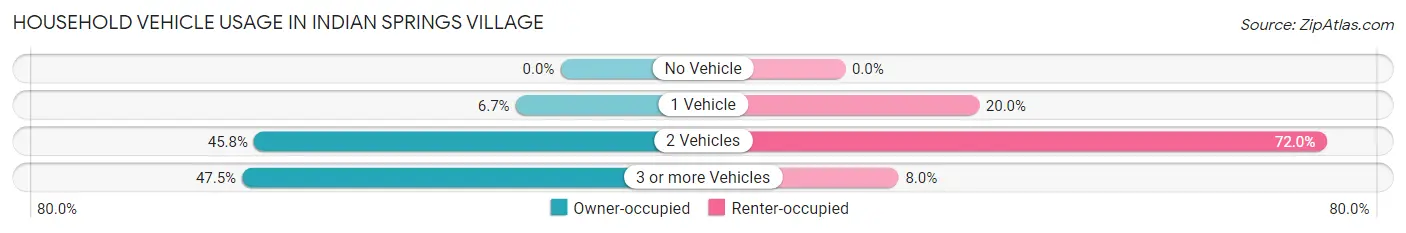
| Vehicles per Household | Owner-occupied | Renter-occupied |
| No Vehicle | 0 (0.0%) | 0 (0.0%) |
| 1 Vehicle | 49 (6.7%) | 5 (20.0%) |
| 2 Vehicles | 335 (45.8%) | 18 (72.0%) |
| 3 or more Vehicles | 348 (47.5%) | 2 (8.0%) |
| Total | 732 (100.0%) | 25 (100.0%) |
Real Estate & Mortgages in Indian Springs Village
Real Estate and Mortgage Overview in Indian Springs Village
| Characteristic | Without Mortgage | With Mortgage |
| Housing Units | 228 | 504 |
| Median Property Value | $498,100 | $460,300 |
| Median Household Income | $111,000 | $238 |
| Monthly Housing Costs | $637 | $116 |
| Real Estate Taxes | $2,021 | $10 |
Property Value by Mortgage Status in Indian Springs Village
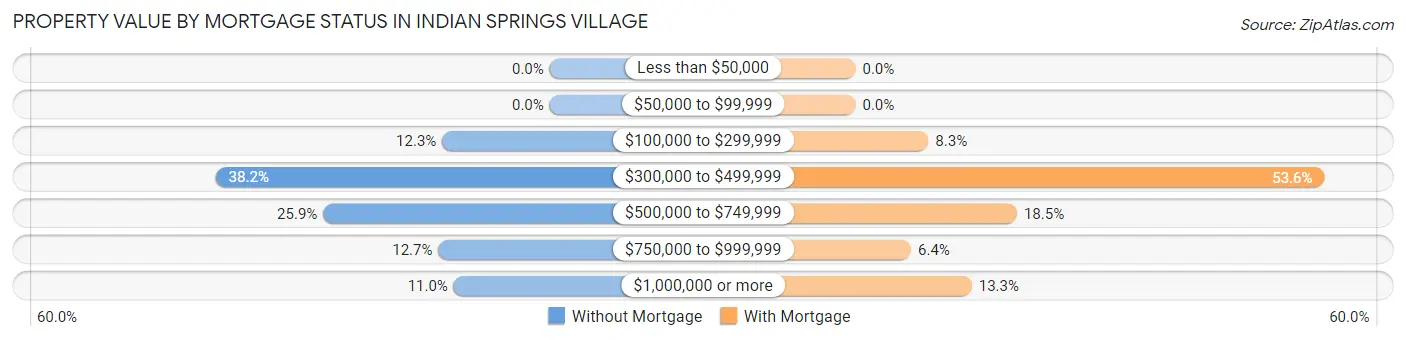
| Property Value | Without Mortgage | With Mortgage |
| Less than $50,000 | 0 (0.0%) | 0 (0.0%) |
| $50,000 to $99,999 | 0 (0.0%) | 0 (0.0%) |
| $100,000 to $299,999 | 28 (12.3%) | 42 (8.3%) |
| $300,000 to $499,999 | 87 (38.2%) | 270 (53.6%) |
| $500,000 to $749,999 | 59 (25.9%) | 93 (18.4%) |
| $750,000 to $999,999 | 29 (12.7%) | 32 (6.4%) |
| $1,000,000 or more | 25 (11.0%) | 67 (13.3%) |
| Total | 228 (100.0%) | 504 (100.0%) |
Household Income by Mortgage Status in Indian Springs Village
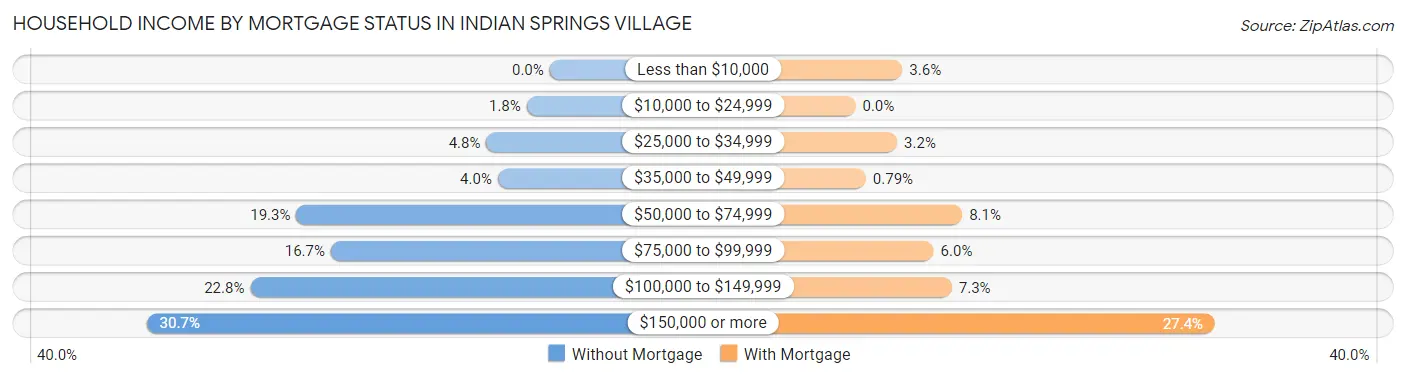
| Household Income | Without Mortgage | With Mortgage |
| Less than $10,000 | 0 (0.0%) | 18 (3.6%) |
| $10,000 to $24,999 | 4 (1.8%) | 0 (0.0%) |
| $25,000 to $34,999 | 11 (4.8%) | 16 (3.2%) |
| $35,000 to $49,999 | 9 (4.0%) | 4 (0.8%) |
| $50,000 to $74,999 | 44 (19.3%) | 41 (8.1%) |
| $75,000 to $99,999 | 38 (16.7%) | 30 (5.9%) |
| $100,000 to $149,999 | 52 (22.8%) | 37 (7.3%) |
| $150,000 or more | 70 (30.7%) | 138 (27.4%) |
| Total | 228 (100.0%) | 504 (100.0%) |
Property Value to Household Income Ratio in Indian Springs Village
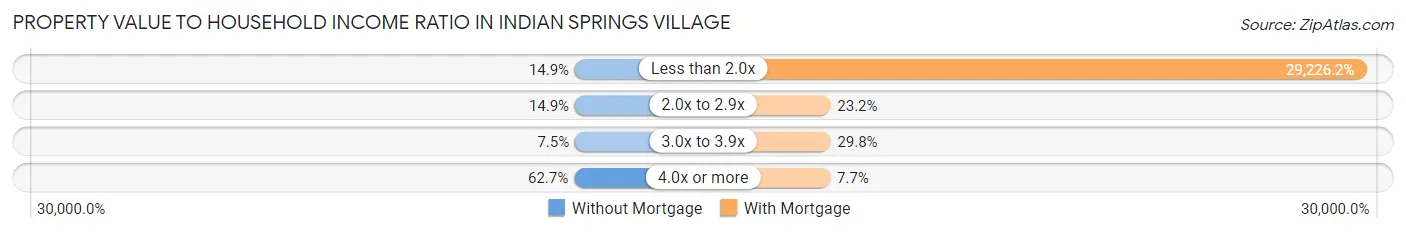
| Value-to-Income Ratio | Without Mortgage | With Mortgage |
| Less than 2.0x | 34 (14.9%) | 147,300 (29,226.2%) |
| 2.0x to 2.9x | 34 (14.9%) | 117 (23.2%) |
| 3.0x to 3.9x | 17 (7.5%) | 150 (29.8%) |
| 4.0x or more | 143 (62.7%) | 39 (7.7%) |
| Total | 228 (100.0%) | 504 (100.0%) |
Real Estate Taxes by Mortgage Status in Indian Springs Village
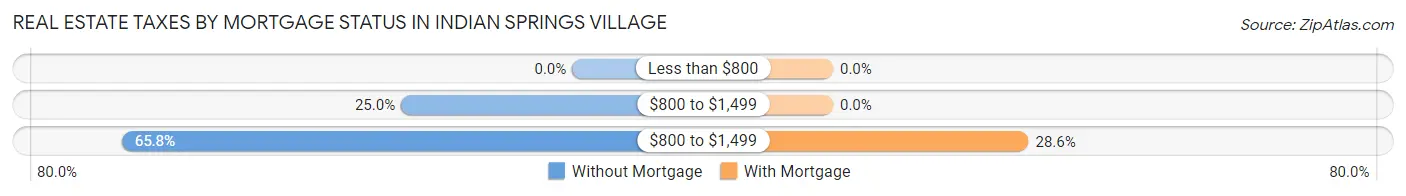
| Property Taxes | Without Mortgage | With Mortgage |
| Less than $800 | 0 (0.0%) | 0 (0.0%) |
| $800 to $1,499 | 57 (25.0%) | 0 (0.0%) |
| $800 to $1,499 | 150 (65.8%) | 144 (28.6%) |
| Total | 228 (100.0%) | 504 (100.0%) |
Health & Disability in Indian Springs Village
Health Insurance Coverage by Age in Indian Springs Village
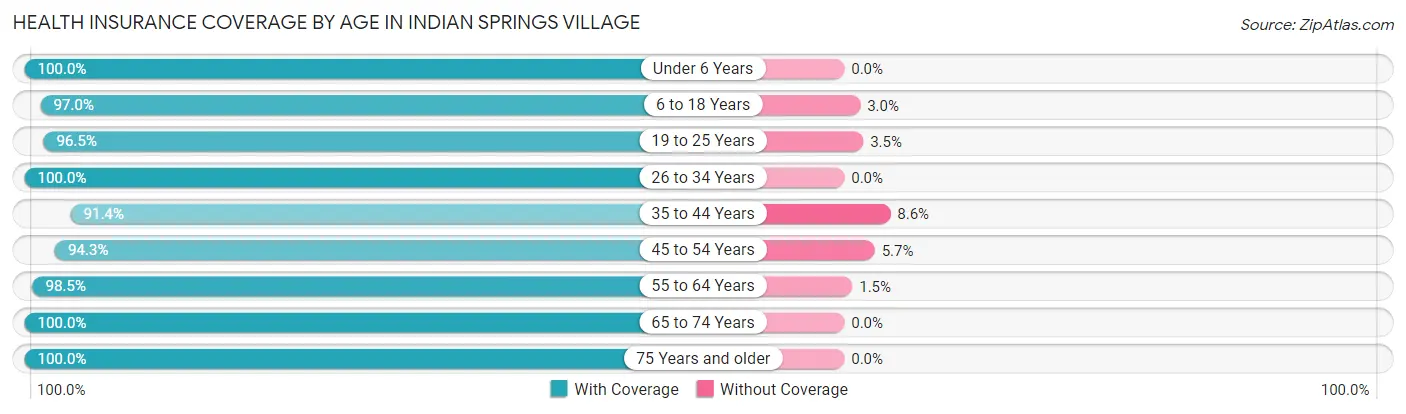
| Age Bracket | With Coverage | Without Coverage |
| Under 6 Years | 67 (100.0%) | 0 (0.0%) |
| 6 to 18 Years | 490 (97.0%) | 15 (3.0%) |
| 19 to 25 Years | 164 (96.5%) | 6 (3.5%) |
| 26 to 34 Years | 85 (100.0%) | 0 (0.0%) |
| 35 to 44 Years | 234 (91.4%) | 22 (8.6%) |
| 45 to 54 Years | 316 (94.3%) | 19 (5.7%) |
| 55 to 64 Years | 331 (98.5%) | 5 (1.5%) |
| 65 to 74 Years | 255 (100.0%) | 0 (0.0%) |
| 75 Years and older | 332 (100.0%) | 0 (0.0%) |
| Total | 2,274 (97.1%) | 67 (2.9%) |
Health Insurance Coverage by Citizenship Status in Indian Springs Village
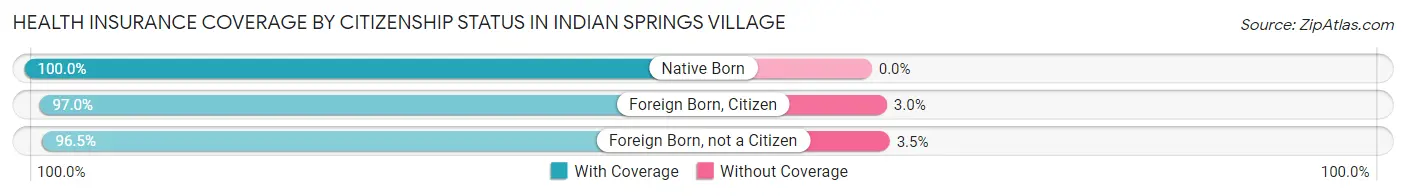
| Citizenship Status | With Coverage | Without Coverage |
| Native Born | 67 (100.0%) | 0 (0.0%) |
| Foreign Born, Citizen | 490 (97.0%) | 15 (3.0%) |
| Foreign Born, not a Citizen | 164 (96.5%) | 6 (3.5%) |
Health Insurance Coverage by Household Income in Indian Springs Village
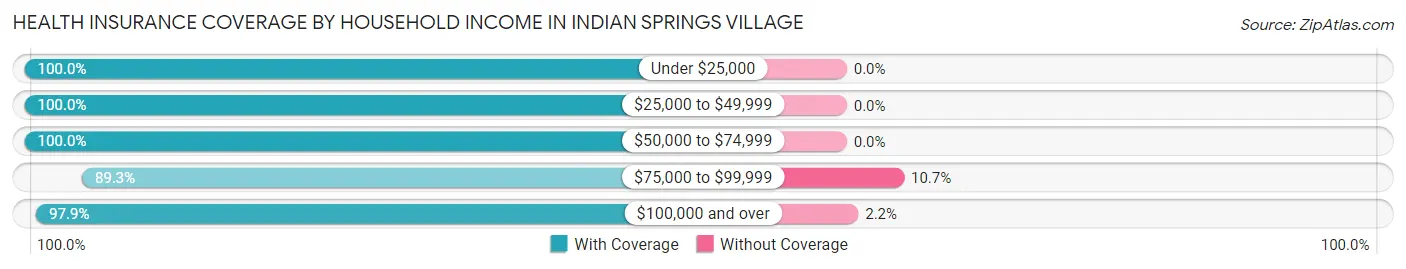
| Household Income | With Coverage | Without Coverage |
| Under $25,000 | 20 (100.0%) | 0 (0.0%) |
| $25,000 to $49,999 | 96 (100.0%) | 0 (0.0%) |
| $50,000 to $74,999 | 153 (100.0%) | 0 (0.0%) |
| $75,000 to $99,999 | 183 (89.3%) | 22 (10.7%) |
| $100,000 and over | 1,776 (97.9%) | 39 (2.1%) |
Public vs Private Health Insurance Coverage by Age in Indian Springs Village
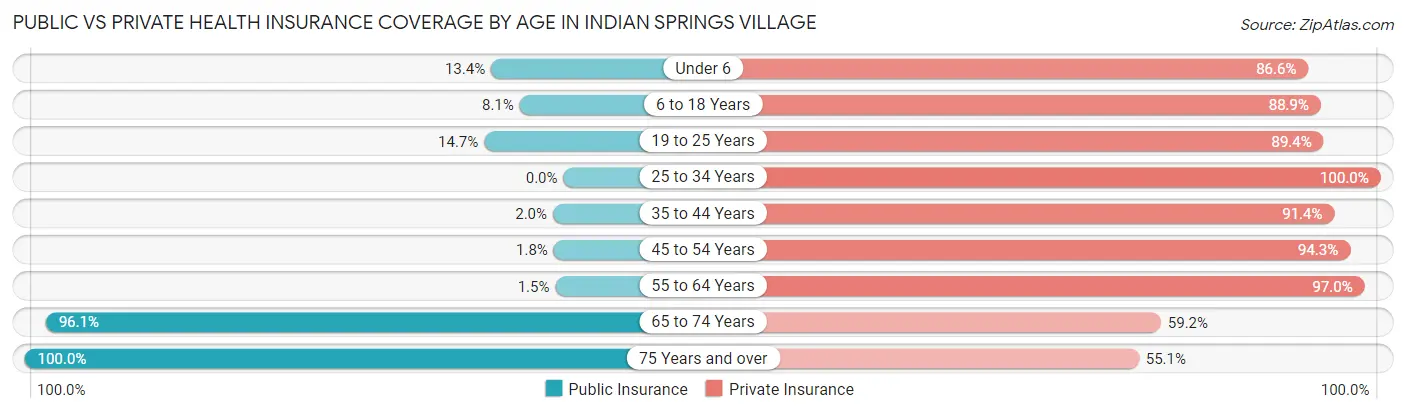
| Age Bracket | Public Insurance | Private Insurance |
| Under 6 | 9 (13.4%) | 58 (86.6%) |
| 6 to 18 Years | 41 (8.1%) | 449 (88.9%) |
| 19 to 25 Years | 25 (14.7%) | 152 (89.4%) |
| 25 to 34 Years | 0 (0.0%) | 85 (100.0%) |
| 35 to 44 Years | 5 (1.9%) | 234 (91.4%) |
| 45 to 54 Years | 6 (1.8%) | 316 (94.3%) |
| 55 to 64 Years | 5 (1.5%) | 326 (97.0%) |
| 65 to 74 Years | 245 (96.1%) | 151 (59.2%) |
| 75 Years and over | 332 (100.0%) | 183 (55.1%) |
| Total | 668 (28.5%) | 1,954 (83.5%) |
Disability Status by Sex by Age in Indian Springs Village
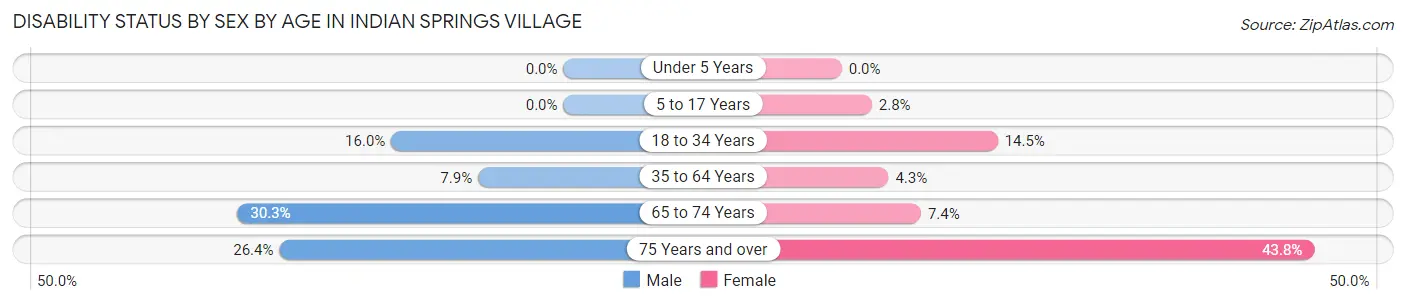
| Age Bracket | Male | Female |
| Under 5 Years | 0 (0.0%) | 0 (0.0%) |
| 5 to 17 Years | 0 (0.0%) | 7 (2.8%) |
| 18 to 34 Years | 27 (16.0%) | 22 (14.5%) |
| 35 to 64 Years | 35 (7.9%) | 21 (4.3%) |
| 65 to 74 Years | 36 (30.2%) | 10 (7.3%) |
| 75 Years and over | 34 (26.4%) | 89 (43.8%) |
Disability Class by Sex by Age in Indian Springs Village
Disability Class: Hearing Difficulty
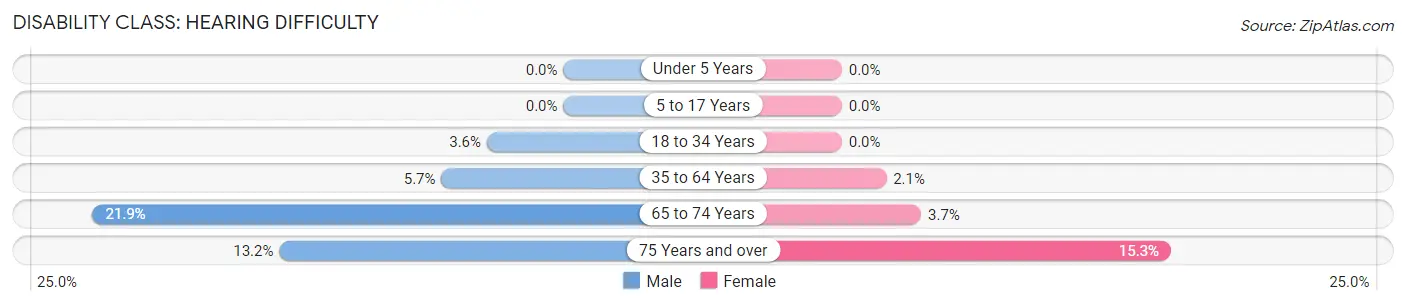
| Age Bracket | Male | Female |
| Under 5 Years | 0 (0.0%) | 0 (0.0%) |
| 5 to 17 Years | 0 (0.0%) | 0 (0.0%) |
| 18 to 34 Years | 6 (3.5%) | 0 (0.0%) |
| 35 to 64 Years | 25 (5.7%) | 10 (2.1%) |
| 65 to 74 Years | 26 (21.8%) | 5 (3.7%) |
| 75 Years and over | 17 (13.2%) | 31 (15.3%) |
Disability Class: Vision Difficulty
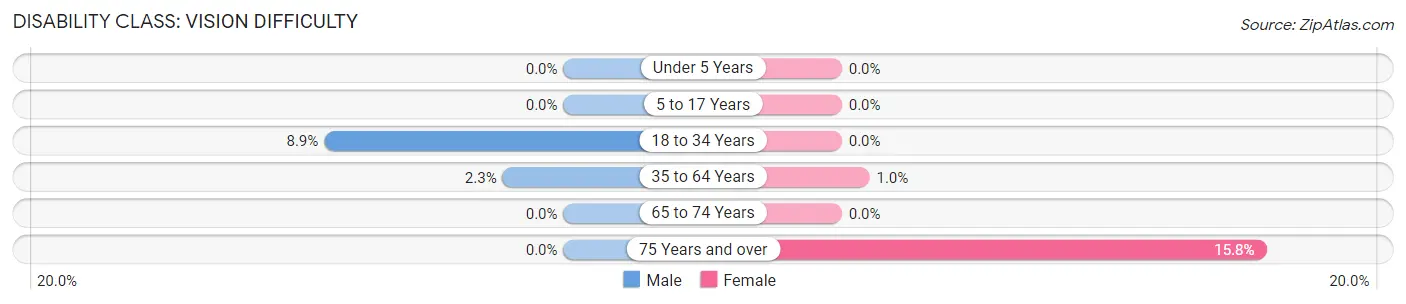
| Age Bracket | Male | Female |
| Under 5 Years | 0 (0.0%) | 0 (0.0%) |
| 5 to 17 Years | 0 (0.0%) | 0 (0.0%) |
| 18 to 34 Years | 15 (8.9%) | 0 (0.0%) |
| 35 to 64 Years | 10 (2.3%) | 5 (1.0%) |
| 65 to 74 Years | 0 (0.0%) | 0 (0.0%) |
| 75 Years and over | 0 (0.0%) | 32 (15.8%) |
Disability Class: Cognitive Difficulty
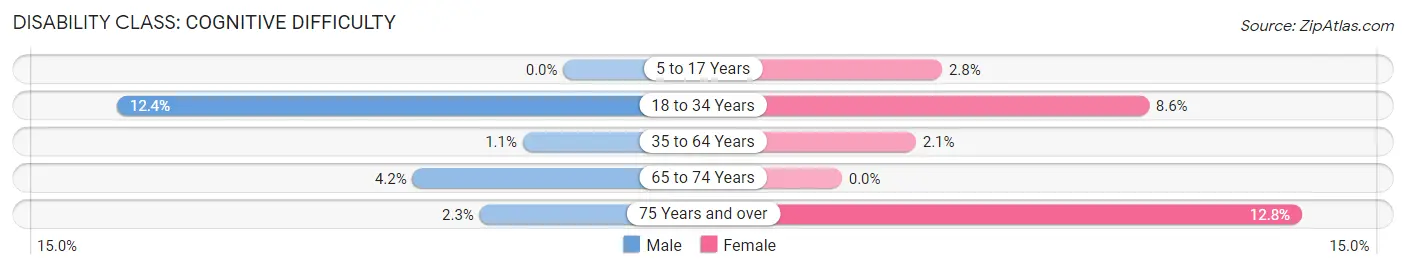
| Age Bracket | Male | Female |
| 5 to 17 Years | 0 (0.0%) | 7 (2.8%) |
| 18 to 34 Years | 21 (12.4%) | 13 (8.6%) |
| 35 to 64 Years | 5 (1.1%) | 10 (2.1%) |
| 65 to 74 Years | 5 (4.2%) | 0 (0.0%) |
| 75 Years and over | 3 (2.3%) | 26 (12.8%) |
Disability Class: Ambulatory Difficulty
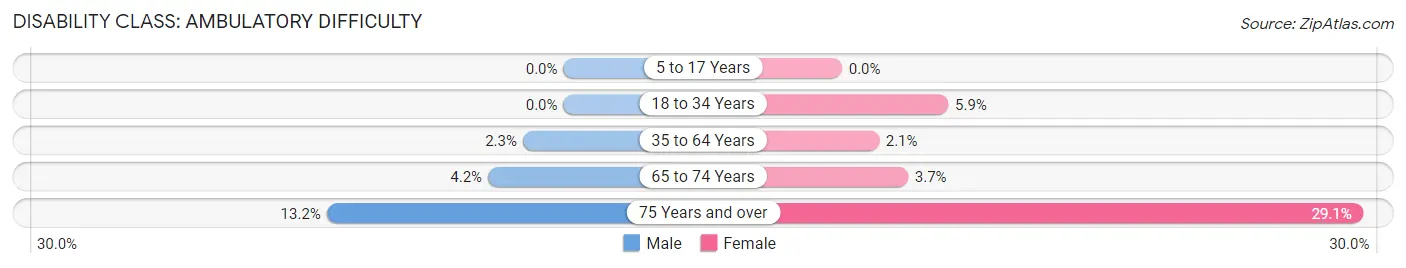
| Age Bracket | Male | Female |
| 5 to 17 Years | 0 (0.0%) | 0 (0.0%) |
| 18 to 34 Years | 0 (0.0%) | 9 (5.9%) |
| 35 to 64 Years | 10 (2.3%) | 10 (2.1%) |
| 65 to 74 Years | 5 (4.2%) | 5 (3.7%) |
| 75 Years and over | 17 (13.2%) | 59 (29.1%) |
Disability Class: Self-Care Difficulty
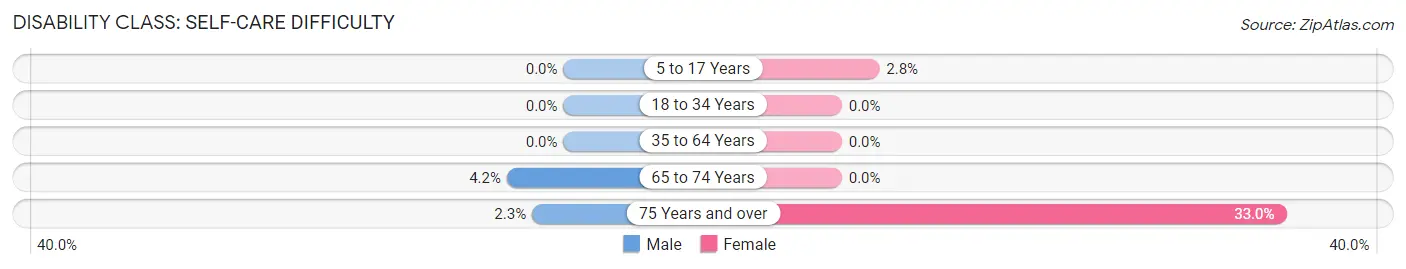
| Age Bracket | Male | Female |
| 5 to 17 Years | 0 (0.0%) | 7 (2.8%) |
| 18 to 34 Years | 0 (0.0%) | 0 (0.0%) |
| 35 to 64 Years | 0 (0.0%) | 0 (0.0%) |
| 65 to 74 Years | 5 (4.2%) | 0 (0.0%) |
| 75 Years and over | 3 (2.3%) | 67 (33.0%) |
Technology Access in Indian Springs Village
Computing Device Access in Indian Springs Village
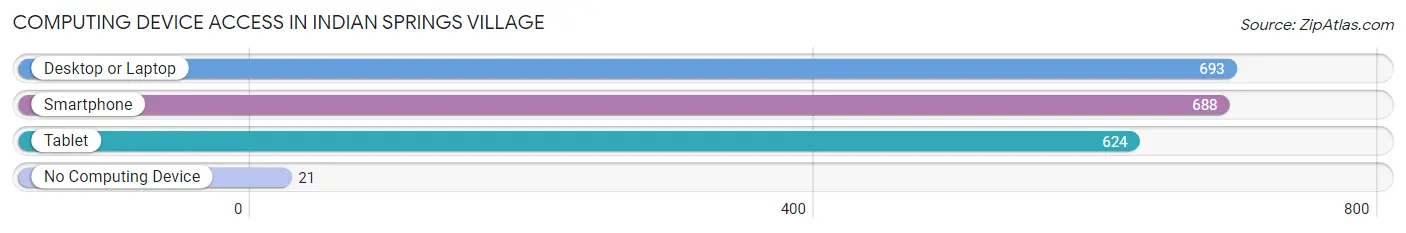
| Device Type | # Households | % Households |
| Desktop or Laptop | 693 | 91.5% |
| Smartphone | 688 | 90.9% |
| Tablet | 624 | 82.4% |
| No Computing Device | 21 | 2.8% |
| Total | 757 | 100.0% |
Internet Access in Indian Springs Village
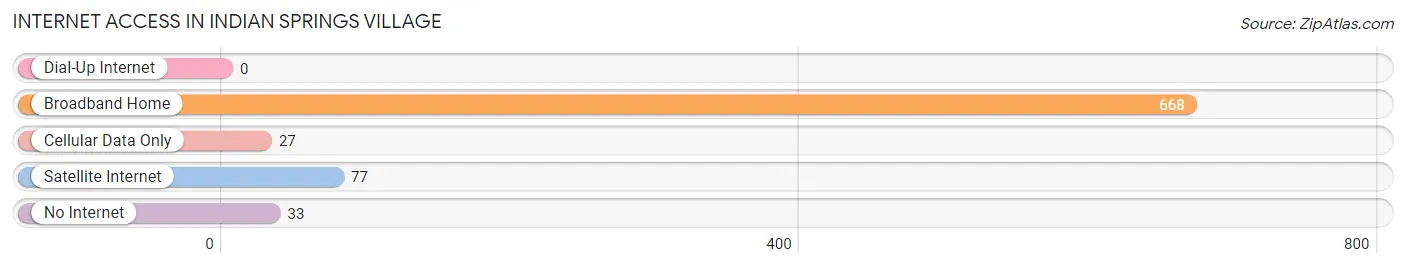
| Internet Type | # Households | % Households |
| Dial-Up Internet | 0 | 0.0% |
| Broadband Home | 668 | 88.2% |
| Cellular Data Only | 27 | 3.6% |
| Satellite Internet | 77 | 10.2% |
| No Internet | 33 | 4.4% |
| Total | 757 | 100.0% |
Indian Springs Village Summary
Introduction
Indian Springs Village is a small town located in Shelby County, Alabama. It is situated in the foothills of the Appalachian Mountains and is part of the Birmingham-Hoover Metropolitan Statistical Area. The town has a population of approximately 4,000 people and is known for its rural charm and small-town atmosphere. The town is home to a variety of businesses, including a golf course, a winery, and a variety of restaurants. The town is also home to a number of historic sites, including the Indian Springs State Park, which is the oldest state park in Alabama.
History
The area that is now Indian Springs Village was originally inhabited by the Creek Indians. The Creek Indians were a Native American tribe that lived in the area for centuries before the arrival of European settlers. The first European settlers arrived in the area in the early 1800s and established a small settlement. The settlement was named Indian Springs Village after the nearby Indian Springs State Park.
The town was officially incorporated in 1891 and has remained a small, rural community ever since. The town has seen some growth in recent years, with the population increasing from 3,000 in 2000 to 4,000 in 2020.
Geography
Indian Springs Village is located in Shelby County, Alabama. The town is situated in the foothills of the Appalachian Mountains and is part of the Birmingham-Hoover Metropolitan Statistical Area. The town is located approximately 20 miles north of Birmingham and is bordered by the cities of Hoover, Pelham, and Alabaster.
The town has a total area of 4.2 square miles, all of which is land. The town is located at an elevation of 645 feet above sea level. The town is located in a humid subtropical climate zone, with hot, humid summers and mild winters.
Economy
The economy of Indian Springs Village is largely based on tourism and retail. The town is home to a variety of businesses, including a golf course, a winery, and a variety of restaurants. The town is also home to a number of historic sites, including the Indian Springs State Park, which is the oldest state park in Alabama.
The town is also home to a number of manufacturing and industrial businesses, including a steel mill, a paper mill, and a chemical plant. The town is also home to a number of small businesses, including a variety of retail stores, restaurants, and other services.
Demographics
As of the 2010 census, the population of Indian Springs Village was 4,000. The racial makeup of the town was 97.2% White, 0.7% African American, 0.2% Native American, 0.3% Asian, 0.1% Pacific Islander, 0.7% from other races, and 0.9% from two or more races. Hispanic or Latino of any race were 1.7% of the population.
The median income for a household in the town was $50,000, and the median income for a family was $60,000. The per capita income for the town was $25,000. About 8.3% of families and 10.2% of the population were below the poverty line, including 14.3% of those under age 18 and 6.2% of those age 65 or over.
Conclusion
Indian Springs Village is a small town located in Shelby County, Alabama. The town has a population of approximately 4,000 people and is known for its rural charm and small-town atmosphere. The town is home to a variety of businesses, including a golf course, a winery, and a variety of restaurants. The town is also home to a number of historic sites, including the Indian Springs State Park, which is the oldest state park in Alabama. The economy of Indian Springs Village is largely based on tourism and retail, and the town has a population that is predominantly white.
Common Questions
What is Per Capita Income in Indian Springs Village?
Per Capita income in Indian Springs Village is $65,351.
What is the Median Family Income in Indian Springs Village?
Median Family Income in Indian Springs Village is $146,792.
What is the Median Household income in Indian Springs Village?
Median Household Income in Indian Springs Village is $135,114.
What is Income or Wage Gap in Indian Springs Village?
Income or Wage Gap in Indian Springs Village is 63.4%.
Women in Indian Springs Village earn 36.6 cents for every dollar earned by a man.
What is Inequality or Gini Index in Indian Springs Village?
Inequality or Gini Index in Indian Springs Village is 0.45.
What is the Total Population of Indian Springs Village?
Total Population of Indian Springs Village is 2,341.
What is the Total Male Population of Indian Springs Village?
Total Male Population of Indian Springs Village is 1,110.
What is the Total Female Population of Indian Springs Village?
Total Female Population of Indian Springs Village is 1,231.
What is the Ratio of Males per 100 Females in Indian Springs Village?
There are 90.17 Males per 100 Females in Indian Springs Village.
What is the Ratio of Females per 100 Males in Indian Springs Village?
There are 110.90 Females per 100 Males in Indian Springs Village.
What is the Median Population Age in Indian Springs Village?
Median Population Age in Indian Springs Village is 48.0 Years.
What is the Average Family Size in Indian Springs Village
Average Family Size in Indian Springs Village is 3.2 People.
What is the Average Household Size in Indian Springs Village
Average Household Size in Indian Springs Village is 3.0 People.
How Large is the Labor Force in Indian Springs Village?
There are 1,126 People in the Labor Forcein in Indian Springs Village.
What is the Percentage of People in the Labor Force in Indian Springs Village?
58.0% of People are in the Labor Force in Indian Springs Village.
What is the Unemployment Rate in Indian Springs Village?
Unemployment Rate in Indian Springs Village is 2.5%.