Anderson, AL Map & Demographics
Anderson Map
Anderson Overview
$40,122
PER CAPITA INCOME
$92,083
AVG FAMILY INCOME
$81,250
AVG HOUSEHOLD INCOME
0.34
INEQUALITY / GINI INDEX
241
TOTAL POPULATION
134
MALE POPULATION
107
FEMALE POPULATION
125.23
MALES / 100 FEMALES
79.85
FEMALES / 100 MALES
57.2
MEDIAN AGE
2.4
AVG FAMILY SIZE
2.2
AVG HOUSEHOLD SIZE
99
LABOR FORCE [ PEOPLE ]
45.6%
PERCENT IN LABOR FORCE
7.1%
UNEMPLOYMENT RATE
Anderson Zip Codes
Anderson Area Codes
Income in Anderson
Income Overview in Anderson
Per Capita Income in Anderson is $40,122, while median incomes of families and households are $92,083 and $81,250 respectively.
| Characteristic | Number | Measure |
| Per Capita Income | 241 | $40,122 |
| Median Family Income | 94 | $92,083 |
| Mean Family Income | 94 | $90,252 |
| Median Household Income | 111 | $81,250 |
| Mean Household Income | 111 | $80,136 |
| Income Deficit | 94 | $0 |
| Wage / Income Gap (%) | 241 | 0.00% |
| Wage / Income Gap ($) | 241 | 100.00¢ per $1 |
| Gini / Inequality Index | 241 | 0.34 |
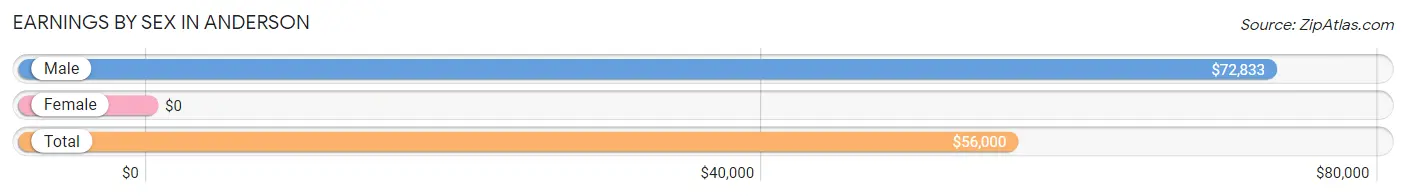
Earnings by Sex in Anderson
| Sex | Number | Average Earnings |
| Male | 62 (63.3%) | $72,833 |
| Female | 36 (36.7%) | $0 |
| Total | 98 (100.0%) | $56,000 |
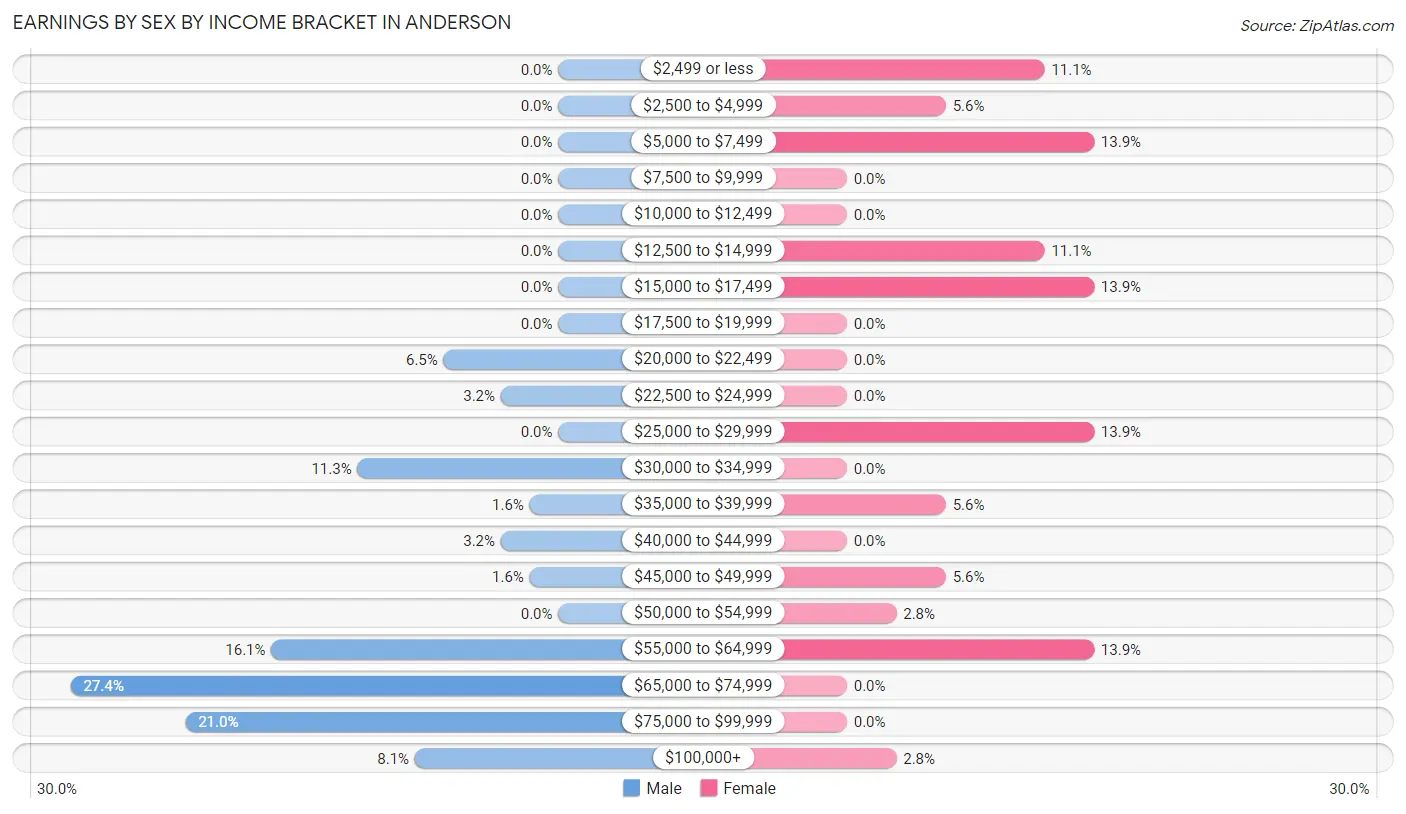
Earnings by Sex by Income Bracket in Anderson
The most common earnings brackets in Anderson are $65,000 to $74,999 for men (17 | 27.4%) and $5,000 to $7,499 for women (5 | 13.9%).
| Income | Male | Female |
| $2,499 or less | 0 (0.0%) | 4 (11.1%) |
| $2,500 to $4,999 | 0 (0.0%) | 2 (5.6%) |
| $5,000 to $7,499 | 0 (0.0%) | 5 (13.9%) |
| $7,500 to $9,999 | 0 (0.0%) | 0 (0.0%) |
| $10,000 to $12,499 | 0 (0.0%) | 0 (0.0%) |
| $12,500 to $14,999 | 0 (0.0%) | 4 (11.1%) |
| $15,000 to $17,499 | 0 (0.0%) | 5 (13.9%) |
| $17,500 to $19,999 | 0 (0.0%) | 0 (0.0%) |
| $20,000 to $22,499 | 4 (6.5%) | 0 (0.0%) |
| $22,500 to $24,999 | 2 (3.2%) | 0 (0.0%) |
| $25,000 to $29,999 | 0 (0.0%) | 5 (13.9%) |
| $30,000 to $34,999 | 7 (11.3%) | 0 (0.0%) |
| $35,000 to $39,999 | 1 (1.6%) | 2 (5.6%) |
| $40,000 to $44,999 | 2 (3.2%) | 0 (0.0%) |
| $45,000 to $49,999 | 1 (1.6%) | 2 (5.6%) |
| $50,000 to $54,999 | 0 (0.0%) | 1 (2.8%) |
| $55,000 to $64,999 | 10 (16.1%) | 5 (13.9%) |
| $65,000 to $74,999 | 17 (27.4%) | 0 (0.0%) |
| $75,000 to $99,999 | 13 (21.0%) | 0 (0.0%) |
| $100,000+ | 5 (8.1%) | 1 (2.8%) |
| Total | 62 (100.0%) | 36 (100.0%) |
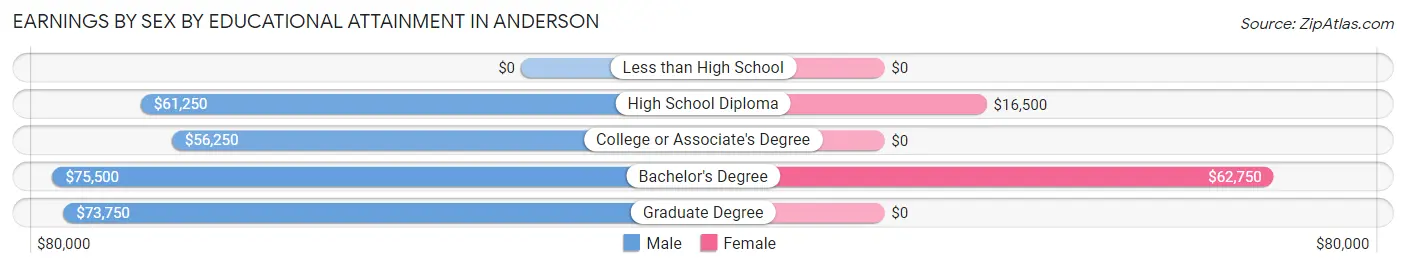
Earnings by Sex by Educational Attainment in Anderson
Average earnings in Anderson are $72,917 for men and $28,000 for women, a difference of 61.6%. Men with an educational attainment of bachelor's degree enjoy the highest average annual earnings of $75,500, while those with college or associate's degree education earn the least with $56,250. Women with an educational attainment of bachelor's degree earn the most with the average annual earnings of $62,750, while those with high school diploma education have the smallest earnings of $16,500.
| Educational Attainment | Male Income | Female Income |
| Less than High School | - | - |
| High School Diploma | $61,250 | $16,500 |
| College or Associate's Degree | $56,250 | $0 |
| Bachelor's Degree | $75,500 | $62,750 |
| Graduate Degree | $73,750 | $0 |
| Total | $72,917 | $28,000 |
Family Income in Anderson
Family Income Brackets in Anderson
According to the Anderson family income data, there are 34 families falling into the $100,000 to $149,999 income range, which is the most common income bracket and makes up 36.2% of all families.
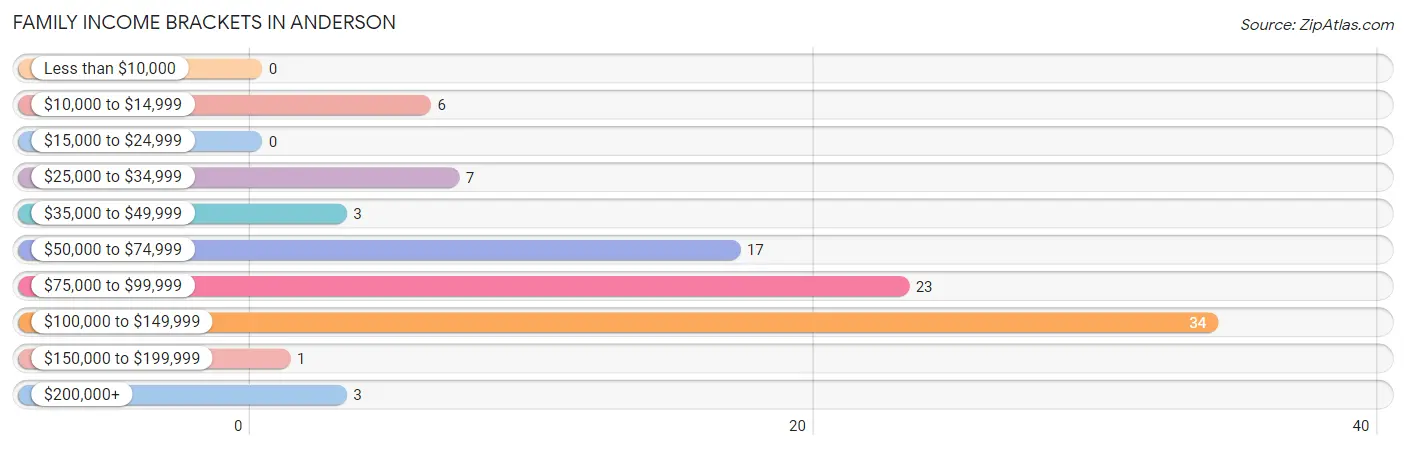
| Income Bracket | # Families | % Families |
| Less than $10,000 | 0 | 0.0% |
| $10,000 to $14,999 | 6 | 6.4% |
| $15,000 to $24,999 | 0 | 0.0% |
| $25,000 to $34,999 | 7 | 7.4% |
| $35,000 to $49,999 | 3 | 3.2% |
| $50,000 to $74,999 | 17 | 18.1% |
| $75,000 to $99,999 | 23 | 24.5% |
| $100,000 to $149,999 | 34 | 36.2% |
| $150,000 to $199,999 | 1 | 1.1% |
| $200,000+ | 3 | 3.2% |
Family Income by Famaliy Size in Anderson
2-person families (67 | 71.3%) account for the highest median family income in Anderson with $96,875 per family, while 2-person families (67 | 71.3%) have the highest median income of $48,438 per family member.
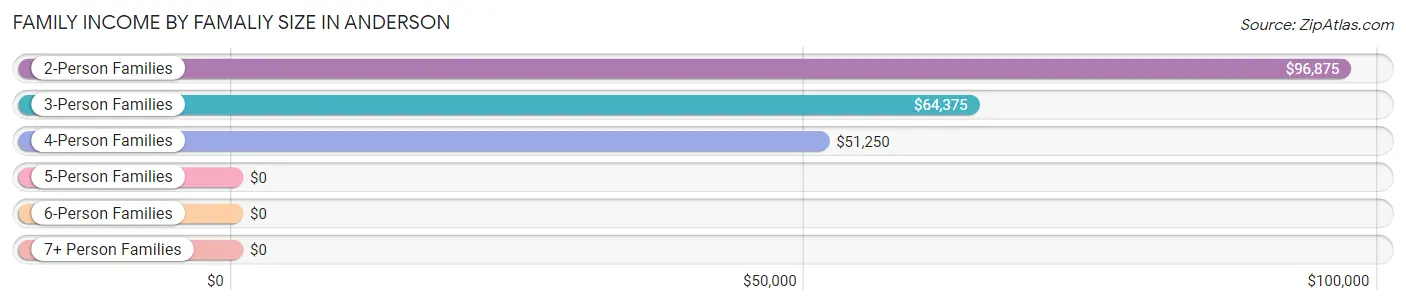
| Income Bracket | # Families | Median Income |
| 2-Person Families | 67 (71.3%) | $96,875 |
| 3-Person Families | 15 (16.0%) | $64,375 |
| 4-Person Families | 11 (11.7%) | $51,250 |
| 5-Person Families | 0 (0.0%) | $0 |
| 6-Person Families | 1 (1.1%) | $0 |
| 7+ Person Families | 0 (0.0%) | $0 |
| Total | 94 (100.0%) | $92,083 |
Family Income by Number of Earners in Anderson
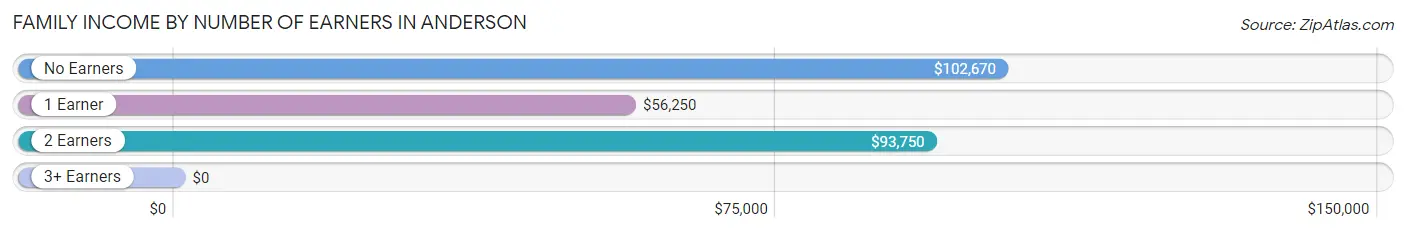
| Number of Earners | # Families | Median Income |
| No Earners | 41 (43.6%) | $102,670 |
| 1 Earner | 22 (23.4%) | $56,250 |
| 2 Earners | 30 (31.9%) | $93,750 |
| 3+ Earners | 1 (1.1%) | $0 |
| Total | 94 (100.0%) | $92,083 |
Household Income in Anderson
Household Income Brackets in Anderson
With 34 households falling in the category, the $100,000 to $149,999 income range is the most frequent in Anderson, accounting for 30.6% of all households. In contrast, only 1 households (0.9%) fall into the $150,000 to $199,999 income bracket, making it the least populous group.
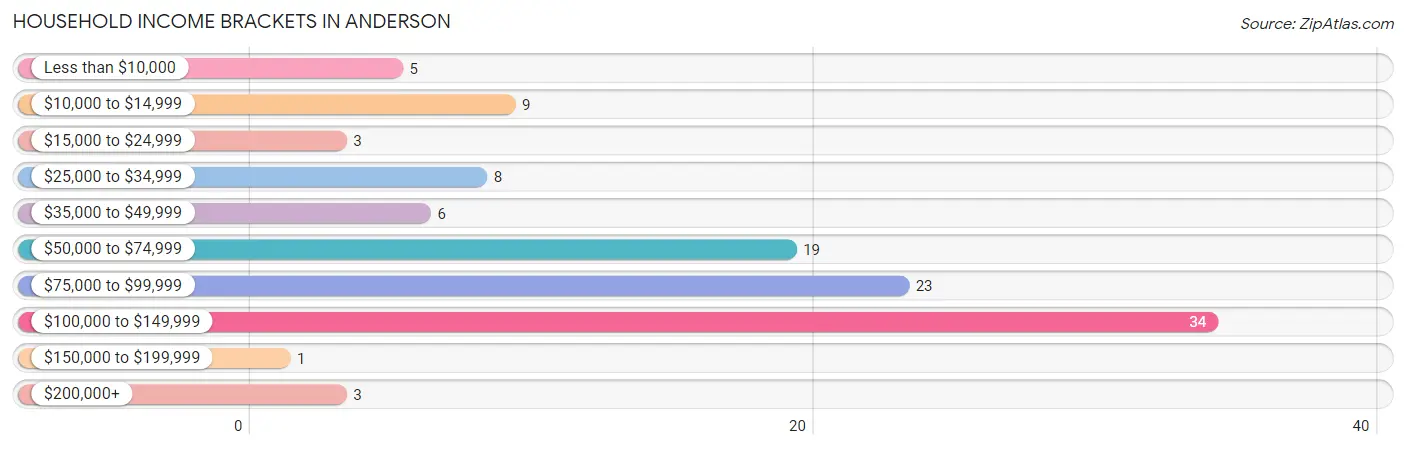
| Income Bracket | # Households | % Households |
| Less than $10,000 | 5 | 4.5% |
| $10,000 to $14,999 | 9 | 8.1% |
| $15,000 to $24,999 | 3 | 2.7% |
| $25,000 to $34,999 | 8 | 7.2% |
| $35,000 to $49,999 | 6 | 5.4% |
| $50,000 to $74,999 | 19 | 17.1% |
| $75,000 to $99,999 | 23 | 20.7% |
| $100,000 to $149,999 | 34 | 30.6% |
| $150,000 to $199,999 | 1 | 0.9% |
| $200,000+ | 3 | 2.7% |
Household Income by Householder Age in Anderson
The median household income in Anderson is $81,250, with the highest median household income of $88,750 found in the 25 to 44 years age bracket for the primary householder. A total of 20 households (18.0%) fall into this category. Meanwhile, the 15 to 24 years age bracket for the primary householder has the lowest median household income of $0, with 2 households (1.8%) in this group.
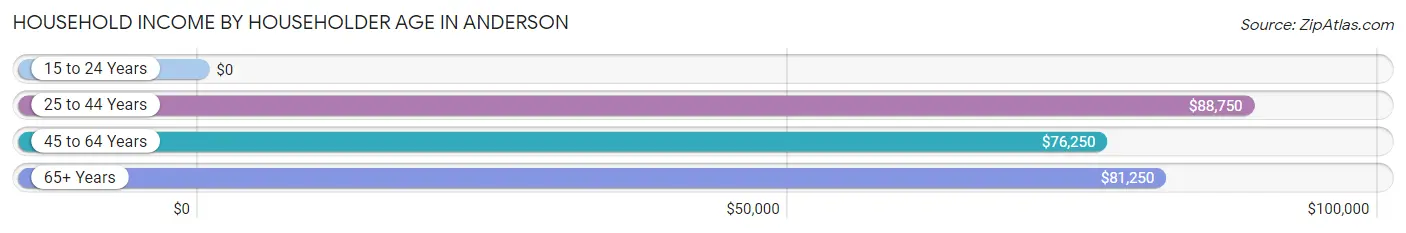
| Income Bracket | # Households | Median Income |
| 15 to 24 Years | 2 (1.8%) | $0 |
| 25 to 44 Years | 20 (18.0%) | $88,750 |
| 45 to 64 Years | 36 (32.4%) | $76,250 |
| 65+ Years | 53 (47.7%) | $81,250 |
| Total | 111 (100.0%) | $81,250 |
Poverty in Anderson
Income Below Poverty by Sex and Age in Anderson
With 3.7% poverty level for males and 14.9% for females among the residents of Anderson, 55 to 64 year old males and 16 and 17 year old females are the most vulnerable to poverty, with 4 males (14.8%) and 1 females (100.0%) in their respective age groups living below the poverty level.
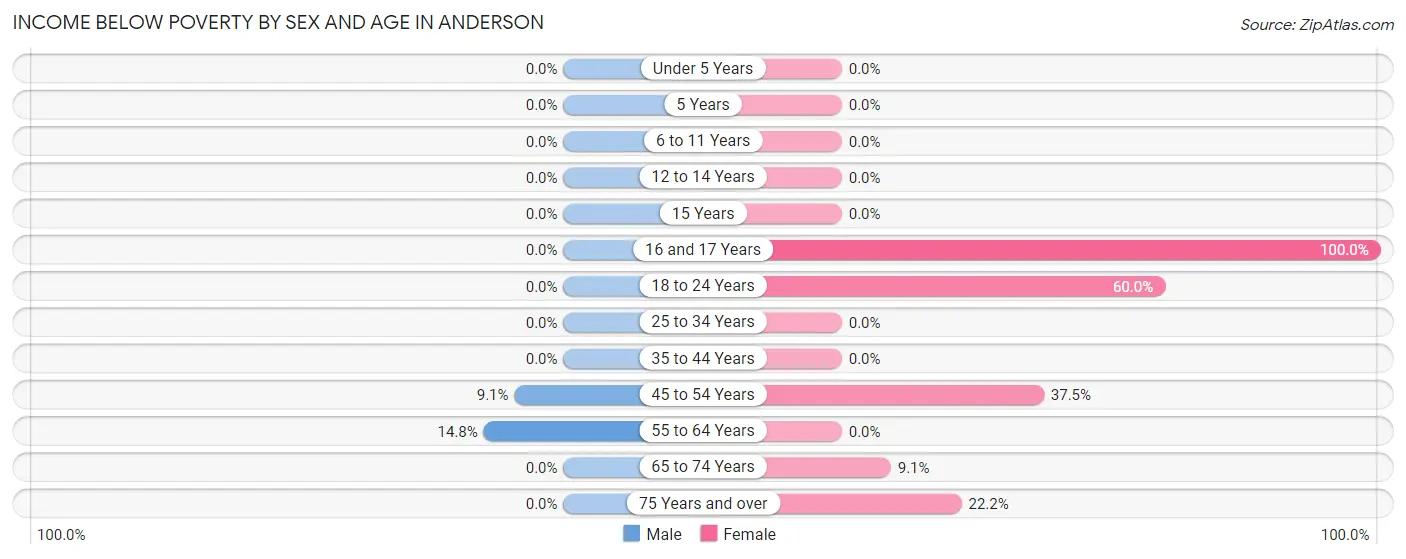
| Age Bracket | Male | Female |
| Under 5 Years | 0 (0.0%) | 0 (0.0%) |
| 5 Years | 0 (0.0%) | 0 (0.0%) |
| 6 to 11 Years | 0 (0.0%) | 0 (0.0%) |
| 12 to 14 Years | 0 (0.0%) | 0 (0.0%) |
| 15 Years | 0 (0.0%) | 0 (0.0%) |
| 16 and 17 Years | 0 (0.0%) | 1 (100.0%) |
| 18 to 24 Years | 0 (0.0%) | 3 (60.0%) |
| 25 to 34 Years | 0 (0.0%) | 0 (0.0%) |
| 35 to 44 Years | 0 (0.0%) | 0 (0.0%) |
| 45 to 54 Years | 1 (9.1%) | 6 (37.5%) |
| 55 to 64 Years | 4 (14.8%) | 0 (0.0%) |
| 65 to 74 Years | 0 (0.0%) | 2 (9.1%) |
| 75 Years and over | 0 (0.0%) | 4 (22.2%) |
| Total | 5 (3.7%) | 16 (14.9%) |
Income Above Poverty by Sex and Age in Anderson
According to the poverty statistics in Anderson, males aged under 5 years and females aged under 5 years are the age groups that are most secure financially, with 100.0% of males and 100.0% of females in these age groups living above the poverty line.
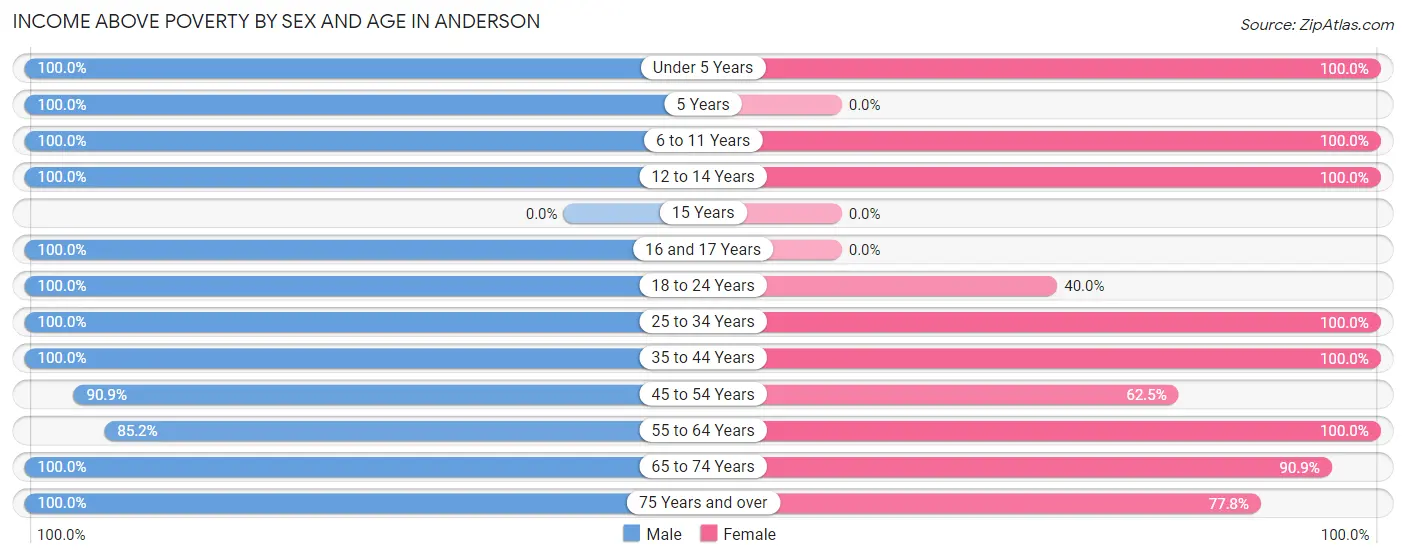
| Age Bracket | Male | Female |
| Under 5 Years | 9 (100.0%) | 7 (100.0%) |
| 5 Years | 1 (100.0%) | 0 (0.0%) |
| 6 to 11 Years | 3 (100.0%) | 1 (100.0%) |
| 12 to 14 Years | 1 (100.0%) | 2 (100.0%) |
| 15 Years | 0 (0.0%) | 0 (0.0%) |
| 16 and 17 Years | 1 (100.0%) | 0 (0.0%) |
| 18 to 24 Years | 5 (100.0%) | 2 (40.0%) |
| 25 to 34 Years | 24 (100.0%) | 15 (100.0%) |
| 35 to 44 Years | 11 (100.0%) | 3 (100.0%) |
| 45 to 54 Years | 10 (90.9%) | 10 (62.5%) |
| 55 to 64 Years | 23 (85.2%) | 17 (100.0%) |
| 65 to 74 Years | 27 (100.0%) | 20 (90.9%) |
| 75 Years and over | 14 (100.0%) | 14 (77.8%) |
| Total | 129 (96.3%) | 91 (85.1%) |
Income Below Poverty Among Married-Couple Families in Anderson
The poverty statistics for married-couple families in Anderson show that 5.6% or 5 of the total 90 families live below the poverty line. Families with no children have the highest poverty rate of 7.1%, comprising of 5 families. On the other hand, families with 1 or 2 children have the lowest poverty rate of 0.0%, which includes 0 families.
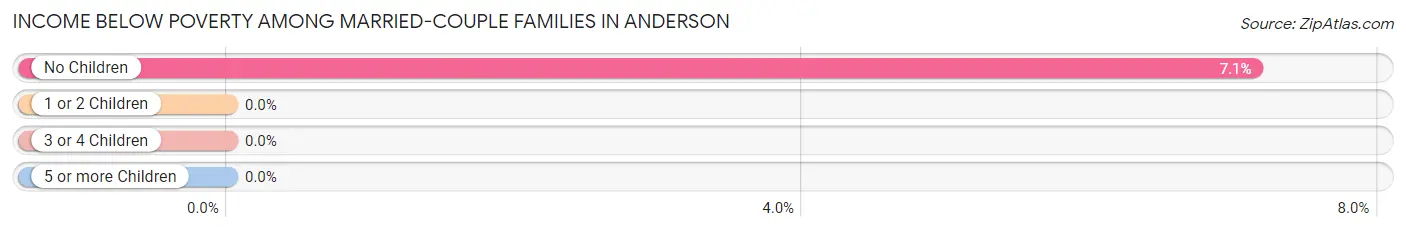
| Children | Above Poverty | Below Poverty |
| No Children | 65 (92.9%) | 5 (7.1%) |
| 1 or 2 Children | 20 (100.0%) | 0 (0.0%) |
| 3 or 4 Children | 0 (0.0%) | 0 (0.0%) |
| 5 or more Children | 0 (0.0%) | 0 (0.0%) |
| Total | 85 (94.4%) | 5 (5.6%) |
Income Below Poverty Among Single-Parent Households in Anderson
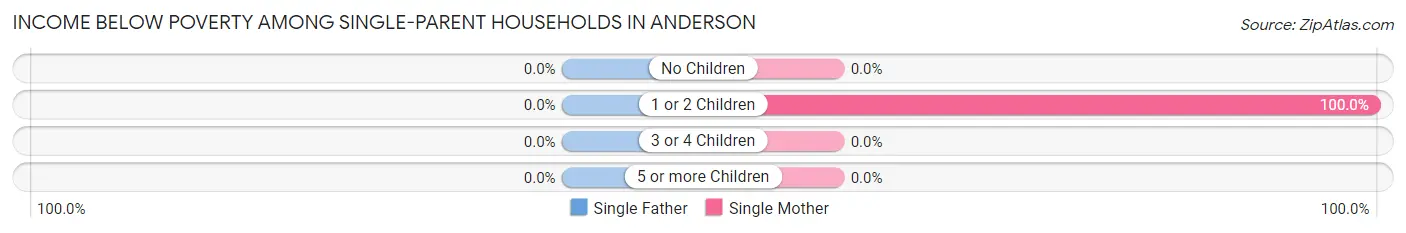
| Children | Single Father | Single Mother |
| No Children | 0 (0.0%) | 0 (0.0%) |
| 1 or 2 Children | 0 (0.0%) | 1 (100.0%) |
| 3 or 4 Children | 0 (0.0%) | 0 (0.0%) |
| 5 or more Children | 0 (0.0%) | 0 (0.0%) |
| Total | 0 (0.0%) | 1 (25.0%) |
Income Below Poverty Among Married-Couple vs Single-Parent Households in Anderson
The poverty data for Anderson shows that 5 of the married-couple family households (5.6%) and 1 of the single-parent households (25.0%) are living below the poverty level. Within the married-couple family households, those with no children have the highest poverty rate, with 5 households (7.1%) falling below the poverty line. Among the single-parent households, those with 1 or 2 children have the highest poverty rate, with 1 household (100.0%) living below poverty.
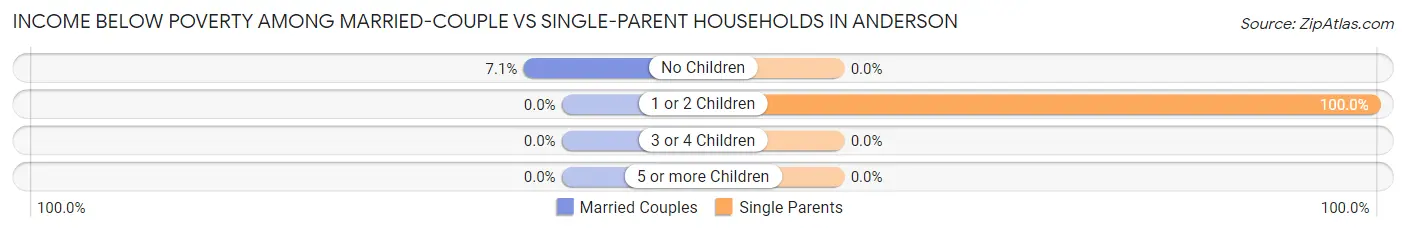
| Children | Married-Couple Families | Single-Parent Households |
| No Children | 5 (7.1%) | 0 (0.0%) |
| 1 or 2 Children | 0 (0.0%) | 1 (100.0%) |
| 3 or 4 Children | 0 (0.0%) | 0 (0.0%) |
| 5 or more Children | 0 (0.0%) | 0 (0.0%) |
| Total | 5 (5.6%) | 1 (25.0%) |
Race in Anderson
The most populous races in Anderson are White / Caucasian (211 | 87.5%), Asian (24 | 10.0%), and Black / African American (5 | 2.1%).
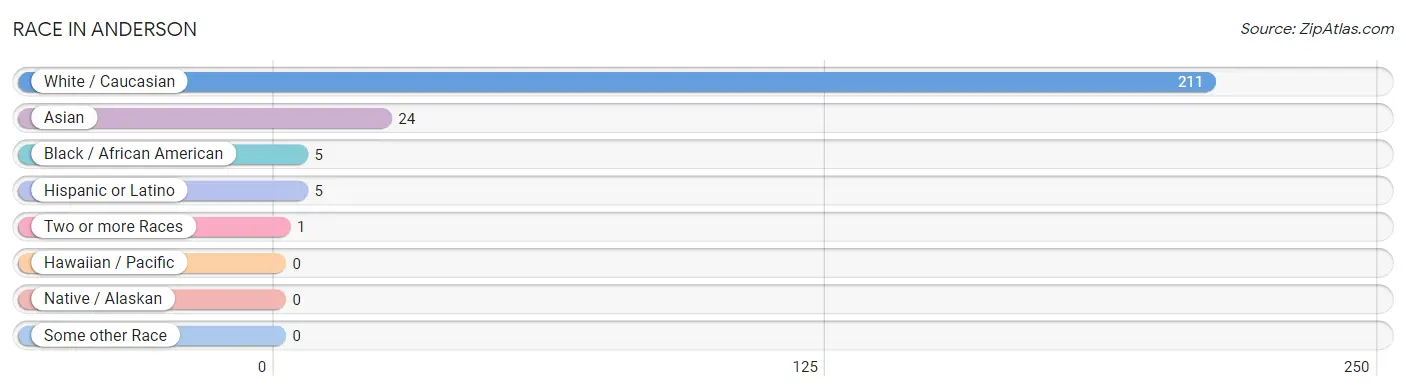
| Race | # Population | % Population |
| Asian | 24 | 10.0% |
| Black / African American | 5 | 2.1% |
| Hawaiian / Pacific | 0 | 0.0% |
| Hispanic or Latino | 5 | 2.1% |
| Native / Alaskan | 0 | 0.0% |
| White / Caucasian | 211 | 87.5% |
| Two or more Races | 1 | 0.4% |
| Some other Race | 0 | 0.0% |
| Total | 241 | 100.0% |
Ancestry in Anderson
The most populous ancestries reported in Anderson are American (50 | 20.7%), English (22 | 9.1%), Thai (18 | 7.5%), Irish (14 | 5.8%), and Scotch-Irish (8 | 3.3%), together accounting for 46.5% of all Anderson residents.
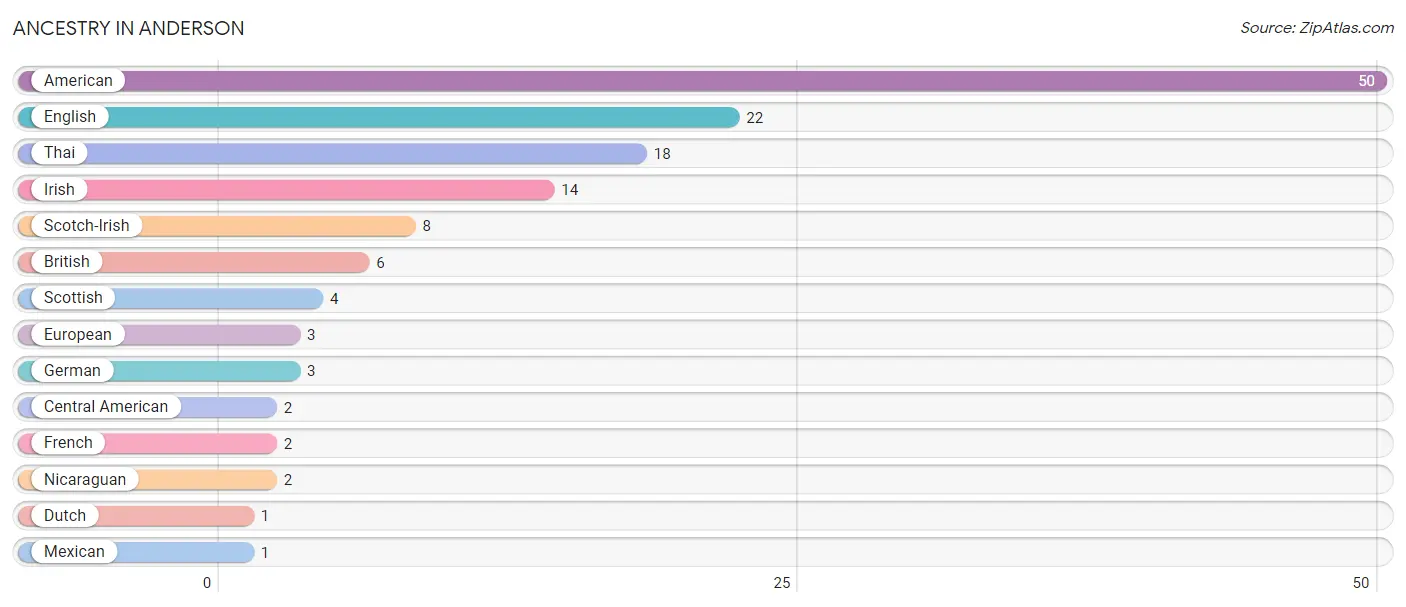
| Ancestry | # Population | % Population |
| American | 50 | 20.7% |
| British | 6 | 2.5% |
| Central American | 2 | 0.8% |
| Dutch | 1 | 0.4% |
| English | 22 | 9.1% |
| European | 3 | 1.2% |
| French | 2 | 0.8% |
| German | 3 | 1.2% |
| Irish | 14 | 5.8% |
| Mexican | 1 | 0.4% |
| Nicaraguan | 2 | 0.8% |
| Scotch-Irish | 8 | 3.3% |
| Scottish | 4 | 1.7% |
| Thai | 18 | 7.5% | View All 14 Rows |
Immigrants in Anderson
The most numerous immigrant groups reported in Anderson came from Asia (23 | 9.5%), South Central Asia (23 | 9.5%), India (18 | 7.5%), Nepal (5 | 2.1%), and Central America (2 | 0.8%), together accounting for 29.4% of all Anderson residents.
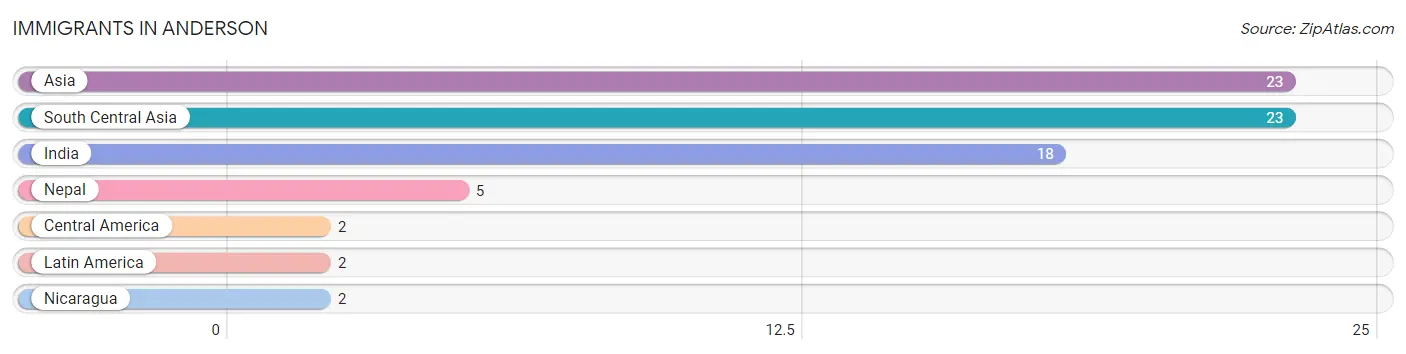
| Immigration Origin | # Population | % Population |
| Asia | 23 | 9.5% |
| Central America | 2 | 0.8% |
| India | 18 | 7.5% |
| Latin America | 2 | 0.8% |
| Nepal | 5 | 2.1% |
| Nicaragua | 2 | 0.8% |
| South Central Asia | 23 | 9.5% | View All 7 Rows |
Sex and Age in Anderson
Sex and Age in Anderson
The most populous age groups in Anderson are 70 to 74 Years (23 | 17.2%) for men and 70 to 74 Years (16 | 14.9%) for women.
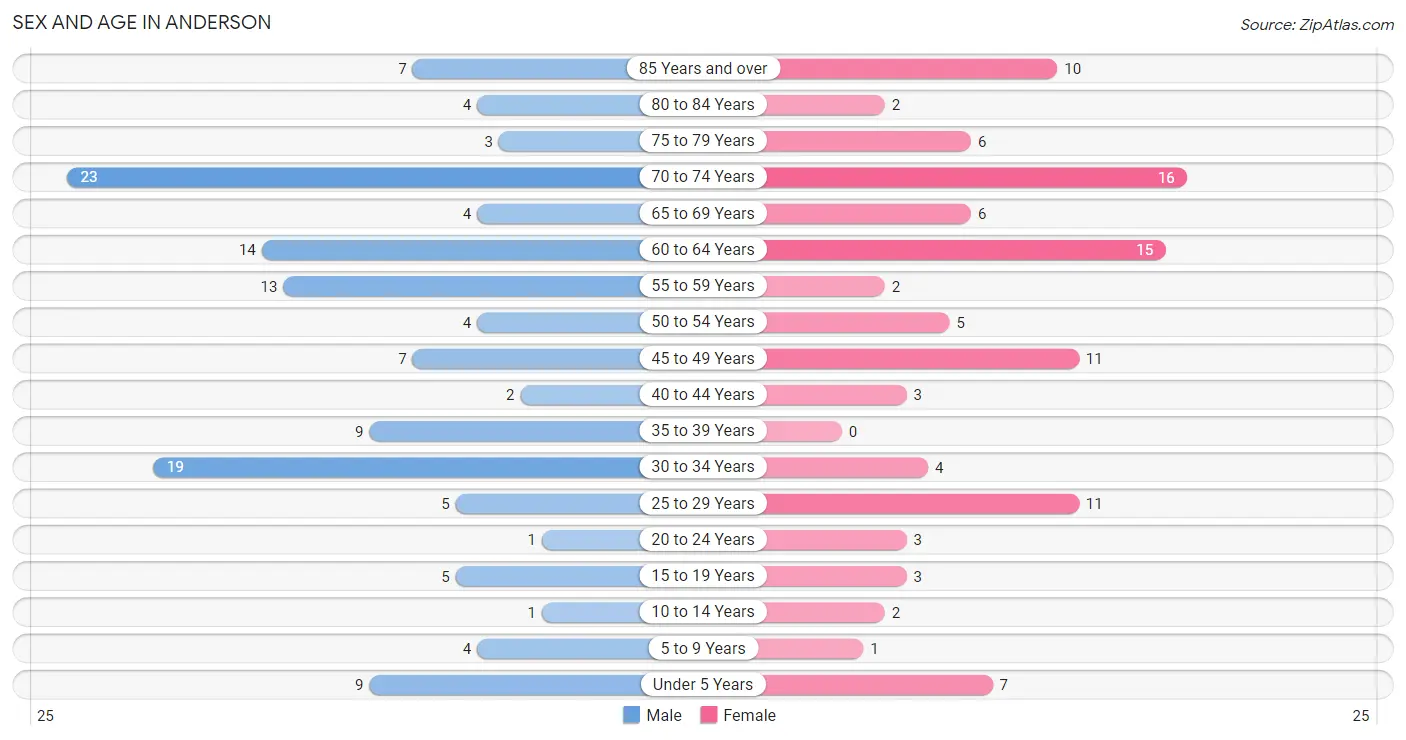
| Age Bracket | Male | Female |
| Under 5 Years | 9 (6.7%) | 7 (6.5%) |
| 5 to 9 Years | 4 (3.0%) | 1 (0.9%) |
| 10 to 14 Years | 1 (0.7%) | 2 (1.9%) |
| 15 to 19 Years | 5 (3.7%) | 3 (2.8%) |
| 20 to 24 Years | 1 (0.7%) | 3 (2.8%) |
| 25 to 29 Years | 5 (3.7%) | 11 (10.3%) |
| 30 to 34 Years | 19 (14.2%) | 4 (3.7%) |
| 35 to 39 Years | 9 (6.7%) | 0 (0.0%) |
| 40 to 44 Years | 2 (1.5%) | 3 (2.8%) |
| 45 to 49 Years | 7 (5.2%) | 11 (10.3%) |
| 50 to 54 Years | 4 (3.0%) | 5 (4.7%) |
| 55 to 59 Years | 13 (9.7%) | 2 (1.9%) |
| 60 to 64 Years | 14 (10.4%) | 15 (14.0%) |
| 65 to 69 Years | 4 (3.0%) | 6 (5.6%) |
| 70 to 74 Years | 23 (17.2%) | 16 (14.9%) |
| 75 to 79 Years | 3 (2.2%) | 6 (5.6%) |
| 80 to 84 Years | 4 (3.0%) | 2 (1.9%) |
| 85 Years and over | 7 (5.2%) | 10 (9.3%) |
| Total | 134 (100.0%) | 107 (100.0%) |
Families and Households in Anderson
Median Family Size in Anderson
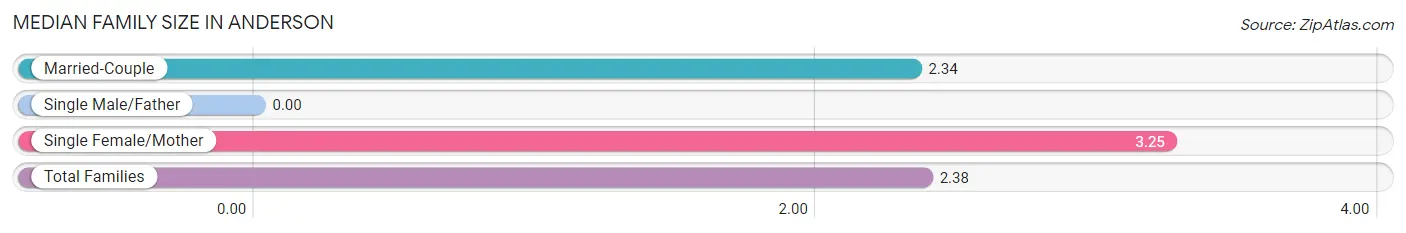
| Family Type | # Families | Family Size |
| Married-Couple | 90 (95.7%) | 2.34 |
| Single Male/Father | 0 (0.0%) | - |
| Single Female/Mother | 4 (4.3%) | 3.25 |
| Total Families | 94 (100.0%) | 2.38 |
Median Household Size in Anderson
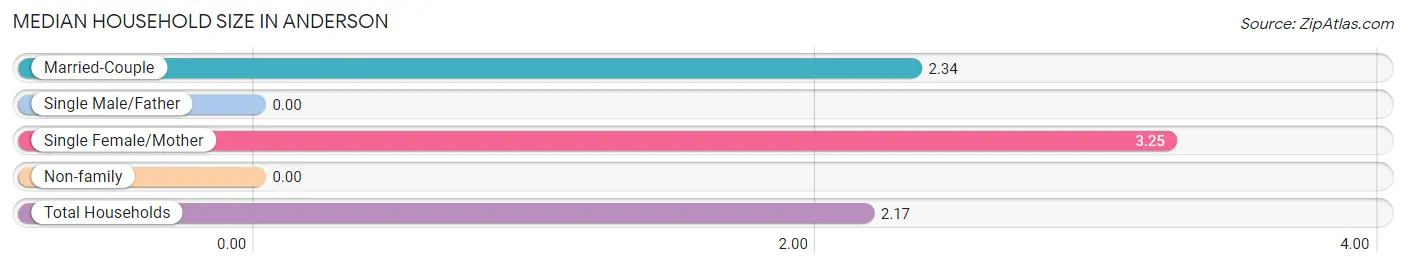
| Household Type | # Households | Household Size |
| Married-Couple | 90 (81.1%) | 2.34 |
| Single Male/Father | 0 (0.0%) | - |
| Single Female/Mother | 4 (3.6%) | 3.25 |
| Non-family | 17 (15.3%) | - |
| Total Households | 111 (100.0%) | 2.17 |
Household Size by Marriage Status in Anderson
Out of a total of 111 households in Anderson, 94 (84.7%) are family households, while 17 (15.3%) are nonfamily households. The most numerous type of family households are 2-person households, comprising 67, and the most common type of nonfamily households are 1-person households, comprising 17.
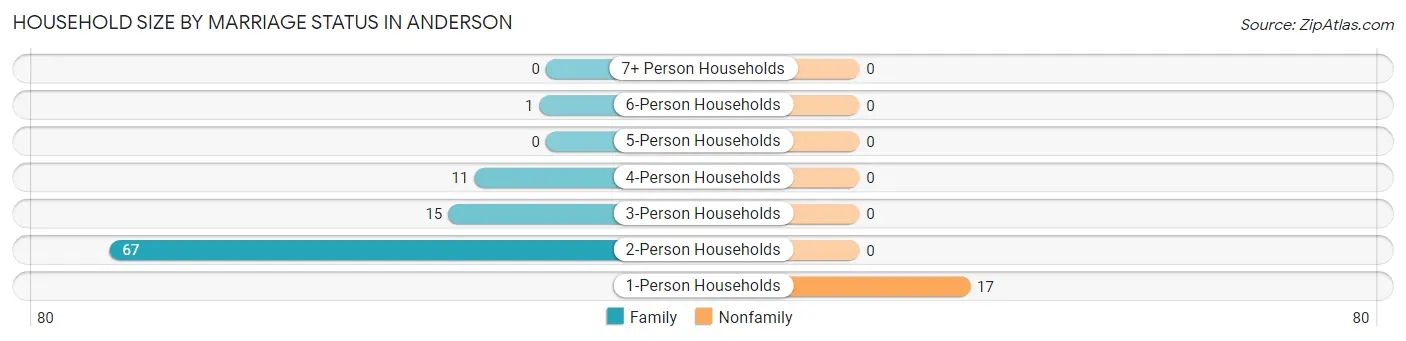
| Household Size | Family Households | Nonfamily Households |
| 1-Person Households | - | 17 (15.3%) |
| 2-Person Households | 67 (60.4%) | 0 (0.0%) |
| 3-Person Households | 15 (13.5%) | 0 (0.0%) |
| 4-Person Households | 11 (9.9%) | 0 (0.0%) |
| 5-Person Households | 0 (0.0%) | 0 (0.0%) |
| 6-Person Households | 1 (0.9%) | 0 (0.0%) |
| 7+ Person Households | 0 (0.0%) | 0 (0.0%) |
| Total | 94 (84.7%) | 17 (15.3%) |
Female Fertility in Anderson
Fertility by Age in Anderson
Average fertility rate in Anderson is 86.0 births per 1,000 women. Women in the age bracket of 20 to 34 years have the highest fertility rate with 167.0 births per 1,000 women. Women in the age bracket of 20 to 34 years acount for 100.0% of all women with births.
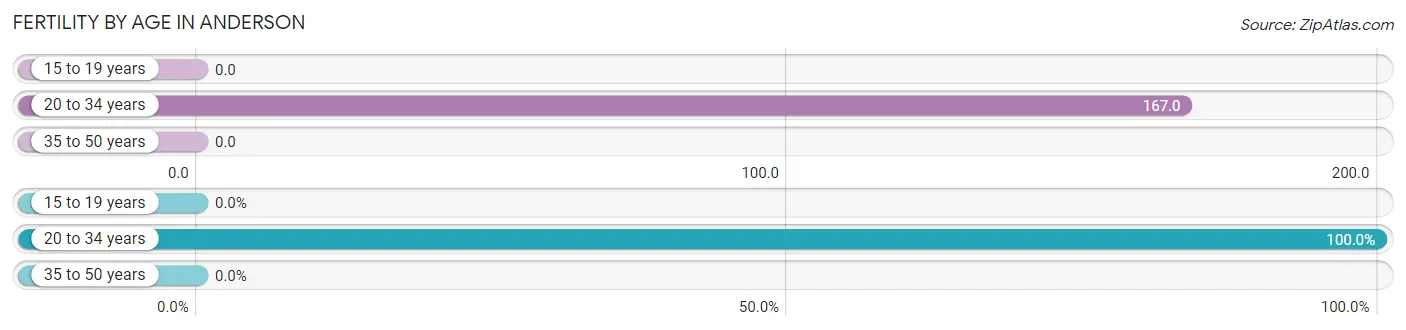
| Age Bracket | Women with Births | Births / 1,000 Women |
| 15 to 19 years | 0 (0.0%) | 0.0 |
| 20 to 34 years | 3 (100.0%) | 167.0 |
| 35 to 50 years | 0 (0.0%) | 0.0 |
| Total | 3 (100.0%) | 86.0 |
Fertility by Age by Marriage Status in Anderson
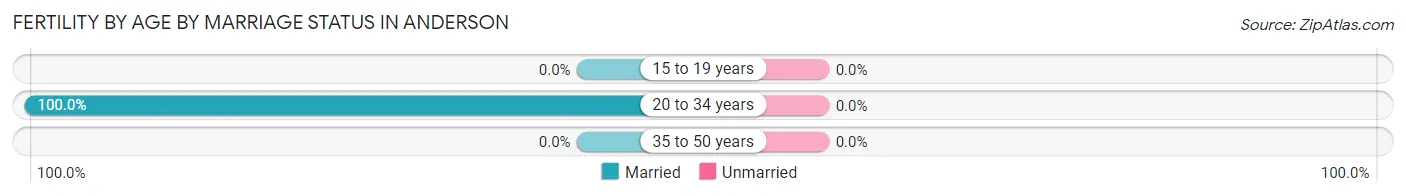
| Age Bracket | Married | Unmarried |
| 15 to 19 years | 0 (0.0%) | 0 (0.0%) |
| 20 to 34 years | 3 (100.0%) | 0 (0.0%) |
| 35 to 50 years | 0 (0.0%) | 0 (0.0%) |
| Total | 3 (100.0%) | 0 (0.0%) |
Fertility by Education in Anderson
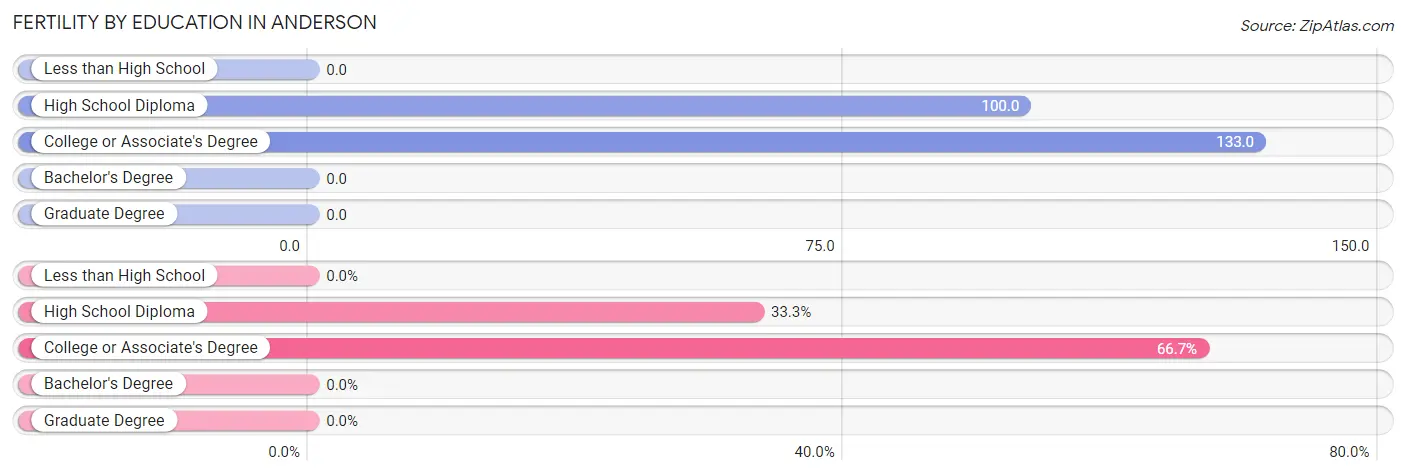
| Educational Attainment | Women with Births | Births / 1,000 Women |
| Less than High School | 0 (0.0%) | 0.0 |
| High School Diploma | 1 (33.3%) | 100.0 |
| College or Associate's Degree | 2 (66.7%) | 133.0 |
| Bachelor's Degree | 0 (0.0%) | 0.0 |
| Graduate Degree | 0 (0.0%) | 0.0 |
| Total | 3 (100.0%) | 86.0 |
Fertility by Education by Marriage Status in Anderson
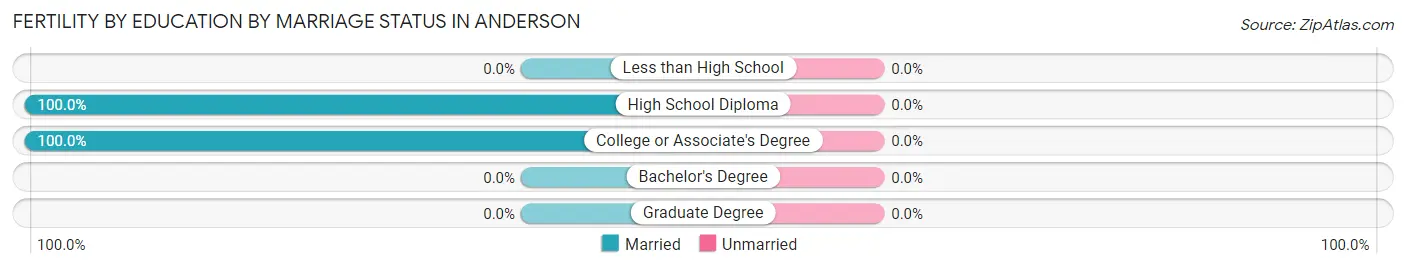
| Educational Attainment | Married | Unmarried |
| Less than High School | 0 (0.0%) | 0 (0.0%) |
| High School Diploma | 1 (100.0%) | 0 (0.0%) |
| College or Associate's Degree | 2 (100.0%) | 0 (0.0%) |
| Bachelor's Degree | 0 (0.0%) | 0 (0.0%) |
| Graduate Degree | 0 (0.0%) | 0 (0.0%) |
| Total | 3 (100.0%) | 0 (0.0%) |
Employment Characteristics in Anderson
Employment by Class of Employer in Anderson
Among the 92 employed individuals in Anderson, private company employees (66 | 71.7%), self-employed (not incorporated) (8 | 8.7%), and state government employees (8 | 8.7%) make up the most common classes of employment.
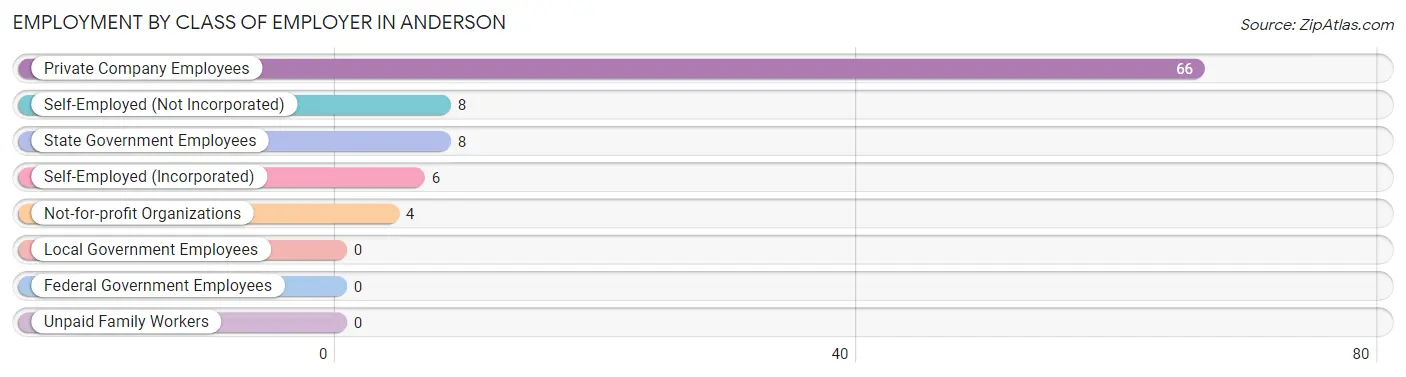
| Employer Class | # Employees | % Employees |
| Private Company Employees | 66 | 71.7% |
| Self-Employed (Incorporated) | 6 | 6.5% |
| Self-Employed (Not Incorporated) | 8 | 8.7% |
| Not-for-profit Organizations | 4 | 4.3% |
| Local Government Employees | 0 | 0.0% |
| State Government Employees | 8 | 8.7% |
| Federal Government Employees | 0 | 0.0% |
| Unpaid Family Workers | 0 | 0.0% |
| Total | 92 | 100.0% |
Employment Status by Age in Anderson
According to the labor force statistics for Anderson, out of the total population over 16 years of age (217), 45.6% or 99 individuals are in the labor force, with 7.1% or 7 of them unemployed. The age group with the highest labor force participation rate is 30 to 34 years, with 87.0% or 20 individuals in the labor force. Within the labor force, the 16 to 19 years age range has the highest percentage of unemployed individuals, with 40.0% or 2 of them being unemployed.
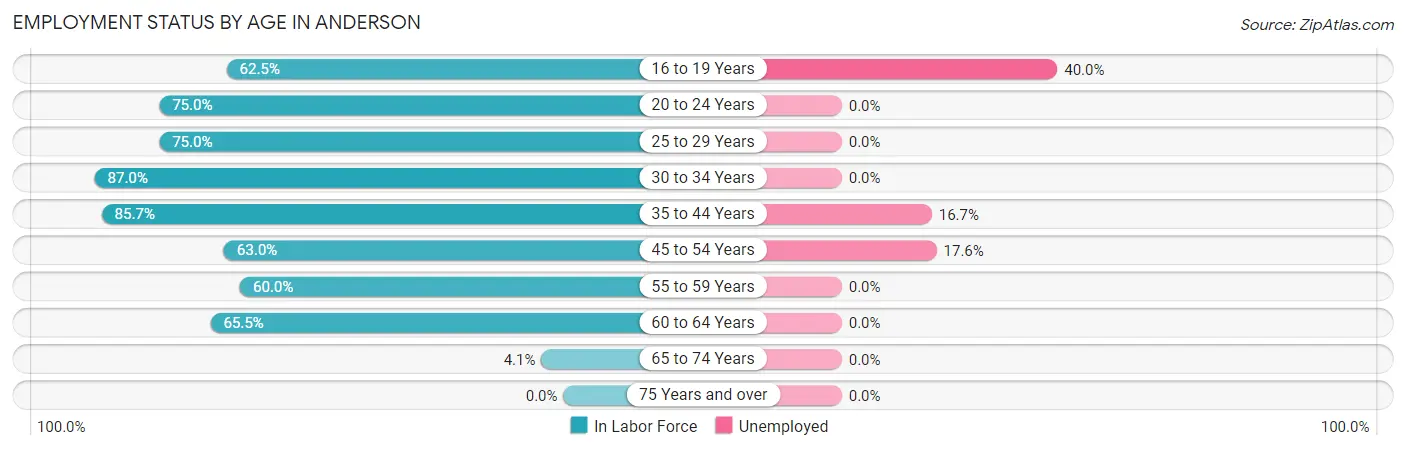
| Age Bracket | In Labor Force | Unemployed |
| 16 to 19 Years | 5 (62.5%) | 2 (40.0%) |
| 20 to 24 Years | 3 (75.0%) | 0 (0.0%) |
| 25 to 29 Years | 12 (75.0%) | 0 (0.0%) |
| 30 to 34 Years | 20 (87.0%) | 0 (0.0%) |
| 35 to 44 Years | 12 (85.7%) | 2 (16.7%) |
| 45 to 54 Years | 17 (63.0%) | 3 (17.6%) |
| 55 to 59 Years | 9 (60.0%) | 0 (0.0%) |
| 60 to 64 Years | 19 (65.5%) | 0 (0.0%) |
| 65 to 74 Years | 2 (4.1%) | 0 (0.0%) |
| 75 Years and over | 0 (0.0%) | 0 (0.0%) |
| Total | 99 (45.6%) | 7 (7.1%) |
Employment Status by Educational Attainment in Anderson
According to labor force statistics for Anderson, 71.8% of individuals (89) out of the total population between 25 and 64 years of age (124) are in the labor force, with 5.6% or 5 of them being unemployed. The group with the highest labor force participation rate are those with the educational attainment of bachelor's degree or higher, with 97.2% or 35 individuals in the labor force. Within the labor force, individuals with high school diploma education have the highest percentage of unemployment, with 11.1% or 2 of them being unemployed.
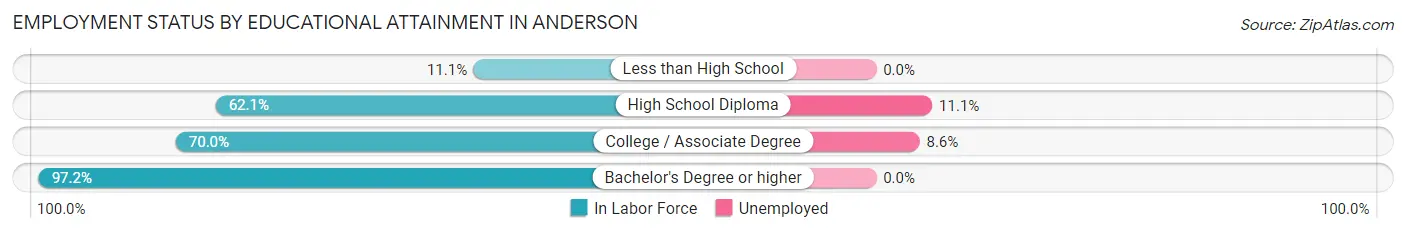
| Educational Attainment | In Labor Force | Unemployed |
| Less than High School | 1 (11.1%) | 0 (0.0%) |
| High School Diploma | 18 (62.1%) | 3 (11.1%) |
| College / Associate Degree | 35 (70.0%) | 4 (8.6%) |
| Bachelor's Degree or higher | 35 (97.2%) | 0 (0.0%) |
| Total | 89 (71.8%) | 7 (5.6%) |
Employment Occupations by Sex in Anderson
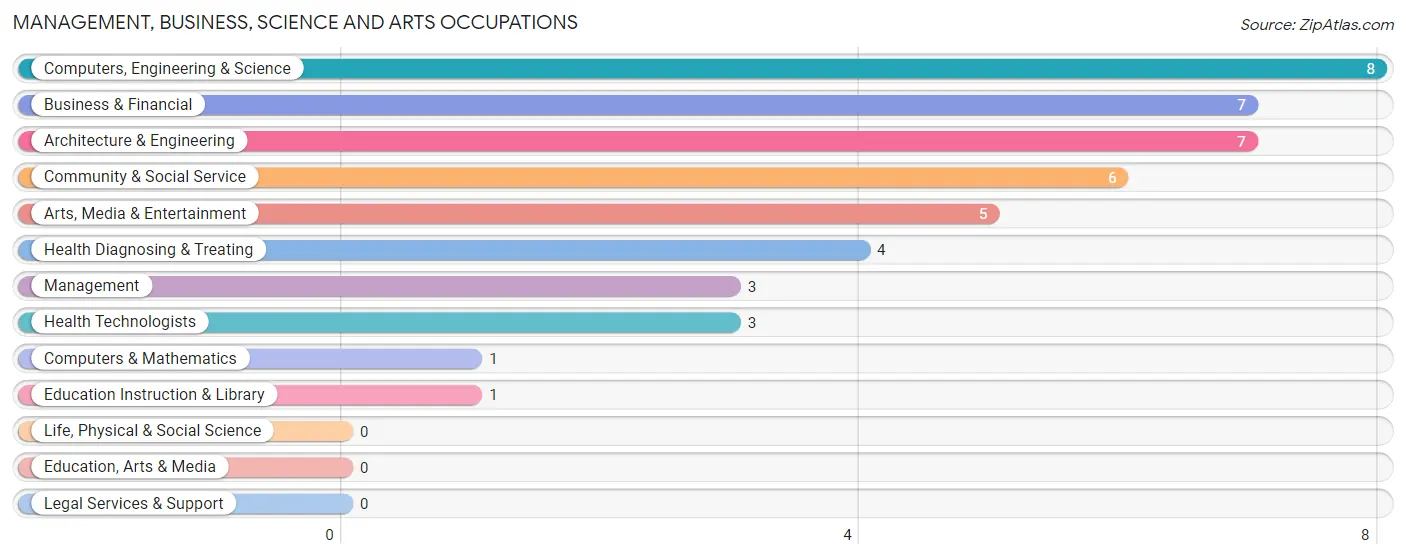
Management, Business, Science and Arts Occupations
The most common Management, Business, Science and Arts occupations in Anderson are Computers, Engineering & Science (8 | 8.7%), Business & Financial (7 | 7.6%), Architecture & Engineering (7 | 7.6%), Community & Social Service (6 | 6.5%), and Arts, Media & Entertainment (5 | 5.4%).
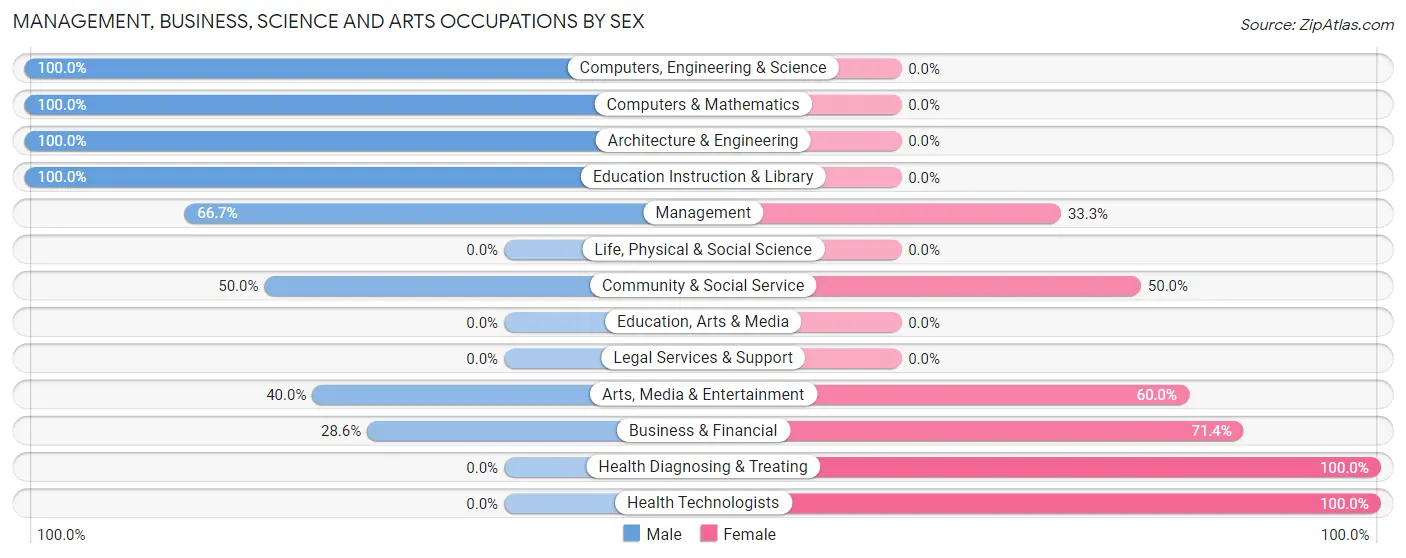
Management, Business, Science and Arts Occupations by Sex
Within the Management, Business, Science and Arts occupations in Anderson, the most male-oriented occupations are Computers, Engineering & Science (100.0%), Computers & Mathematics (100.0%), and Architecture & Engineering (100.0%), while the most female-oriented occupations are Health Diagnosing & Treating (100.0%), Health Technologists (100.0%), and Business & Financial (71.4%).
| Occupation | Male | Female |
| Management | 2 (66.7%) | 1 (33.3%) |
| Business & Financial | 2 (28.6%) | 5 (71.4%) |
| Computers, Engineering & Science | 8 (100.0%) | 0 (0.0%) |
| Computers & Mathematics | 1 (100.0%) | 0 (0.0%) |
| Architecture & Engineering | 7 (100.0%) | 0 (0.0%) |
| Life, Physical & Social Science | 0 (0.0%) | 0 (0.0%) |
| Community & Social Service | 3 (50.0%) | 3 (50.0%) |
| Education, Arts & Media | 0 (0.0%) | 0 (0.0%) |
| Legal Services & Support | 0 (0.0%) | 0 (0.0%) |
| Education Instruction & Library | 1 (100.0%) | 0 (0.0%) |
| Arts, Media & Entertainment | 2 (40.0%) | 3 (60.0%) |
| Health Diagnosing & Treating | 0 (0.0%) | 4 (100.0%) |
| Health Technologists | 0 (0.0%) | 3 (100.0%) |
| Total (Category) | 15 (53.6%) | 13 (46.4%) |
| Total (Overall) | 58 (63.0%) | 34 (37.0%) |
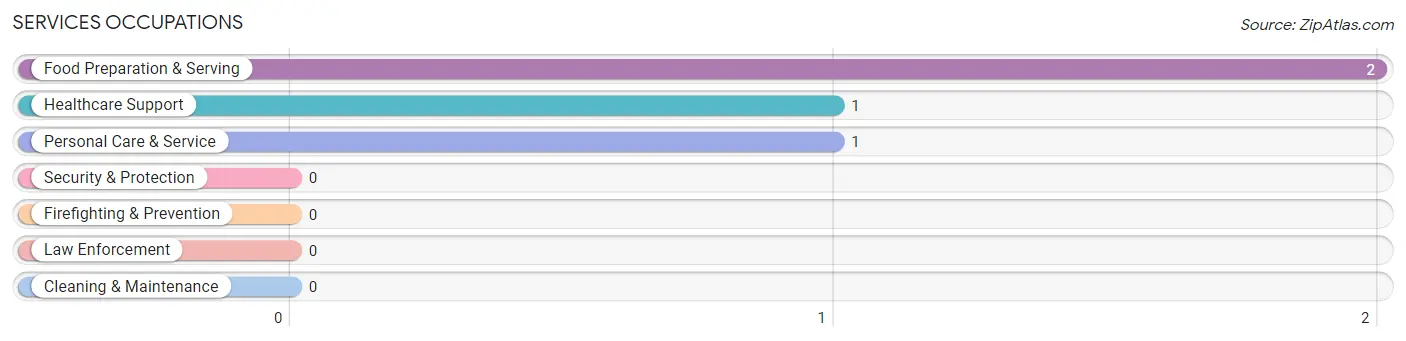
Services Occupations
The most common Services occupations in Anderson are Food Preparation & Serving (2 | 2.2%), Healthcare Support (1 | 1.1%), and Personal Care & Service (1 | 1.1%).
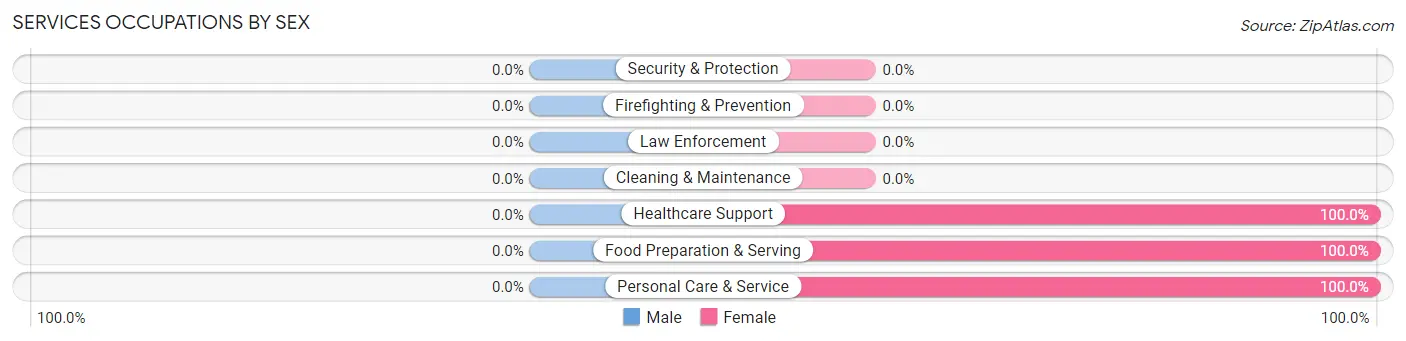
Services Occupations by Sex
| Occupation | Male | Female |
| Healthcare Support | 0 (0.0%) | 1 (100.0%) |
| Security & Protection | 0 (0.0%) | 0 (0.0%) |
| Firefighting & Prevention | 0 (0.0%) | 0 (0.0%) |
| Law Enforcement | 0 (0.0%) | 0 (0.0%) |
| Food Preparation & Serving | 0 (0.0%) | 2 (100.0%) |
| Cleaning & Maintenance | 0 (0.0%) | 0 (0.0%) |
| Personal Care & Service | 0 (0.0%) | 1 (100.0%) |
| Total (Category) | 0 (0.0%) | 4 (100.0%) |
| Total (Overall) | 58 (63.0%) | 34 (37.0%) |
Sales and Office Occupations
The most common Sales and Office occupations in Anderson are Sales & Related (17 | 18.5%), and Office & Administration (9 | 9.8%).
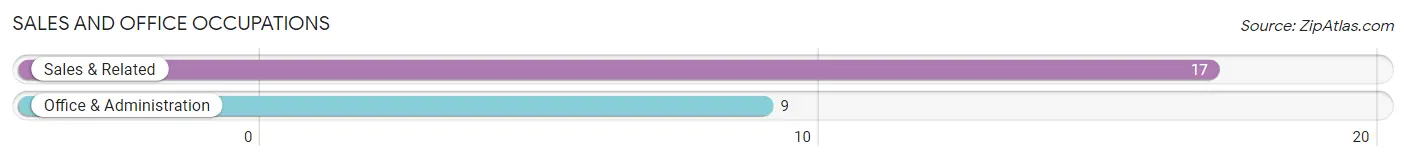
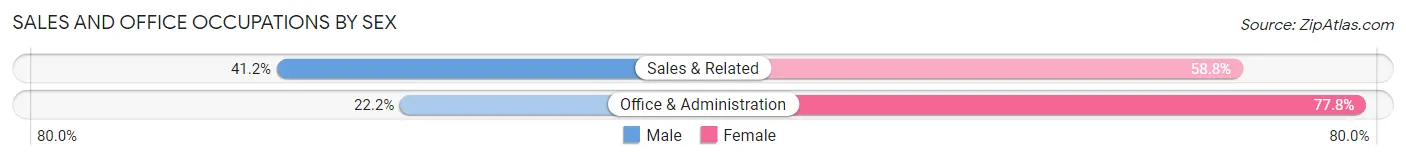
Sales and Office Occupations by Sex
| Occupation | Male | Female |
| Sales & Related | 7 (41.2%) | 10 (58.8%) |
| Office & Administration | 2 (22.2%) | 7 (77.8%) |
| Total (Category) | 9 (34.6%) | 17 (65.4%) |
| Total (Overall) | 58 (63.0%) | 34 (37.0%) |
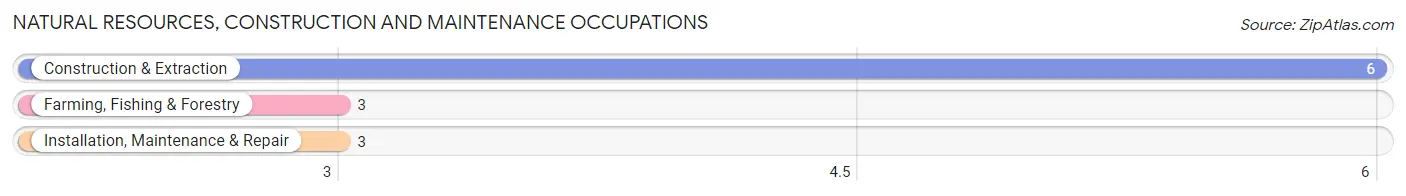
Natural Resources, Construction and Maintenance Occupations
The most common Natural Resources, Construction and Maintenance occupations in Anderson are Construction & Extraction (6 | 6.5%), Farming, Fishing & Forestry (3 | 3.3%), and Installation, Maintenance & Repair (3 | 3.3%).
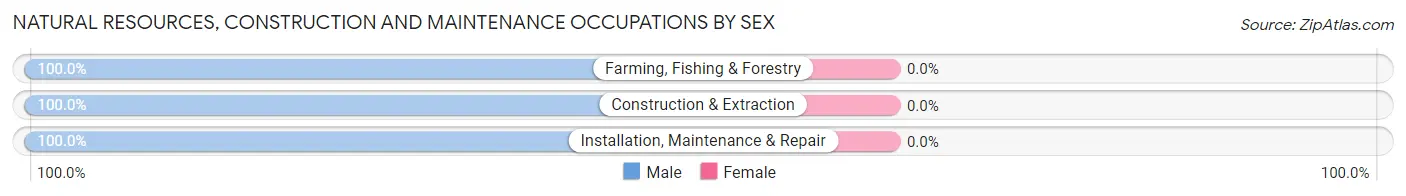
Natural Resources, Construction and Maintenance Occupations by Sex
| Occupation | Male | Female |
| Farming, Fishing & Forestry | 3 (100.0%) | 0 (0.0%) |
| Construction & Extraction | 6 (100.0%) | 0 (0.0%) |
| Installation, Maintenance & Repair | 3 (100.0%) | 0 (0.0%) |
| Total (Category) | 12 (100.0%) | 0 (0.0%) |
| Total (Overall) | 58 (63.0%) | 34 (37.0%) |
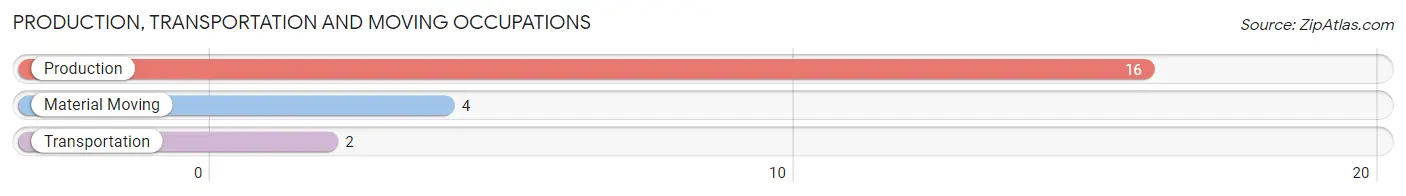
Production, Transportation and Moving Occupations
The most common Production, Transportation and Moving occupations in Anderson are Production (16 | 17.4%), Material Moving (4 | 4.3%), and Transportation (2 | 2.2%).
Production, Transportation and Moving Occupations by Sex
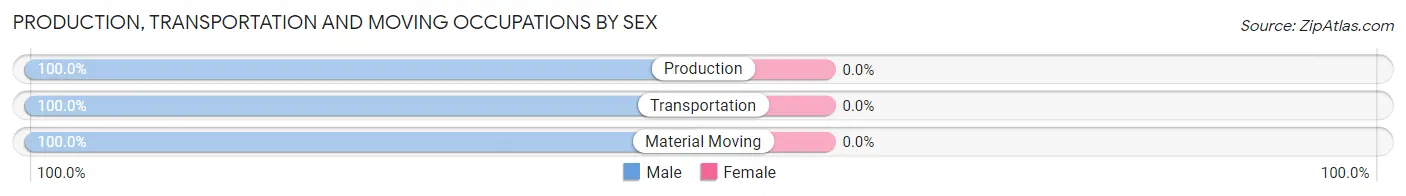
| Occupation | Male | Female |
| Production | 16 (100.0%) | 0 (0.0%) |
| Transportation | 2 (100.0%) | 0 (0.0%) |
| Material Moving | 4 (100.0%) | 0 (0.0%) |
| Total (Category) | 22 (100.0%) | 0 (0.0%) |
| Total (Overall) | 58 (63.0%) | 34 (37.0%) |
Employment Industries by Sex in Anderson
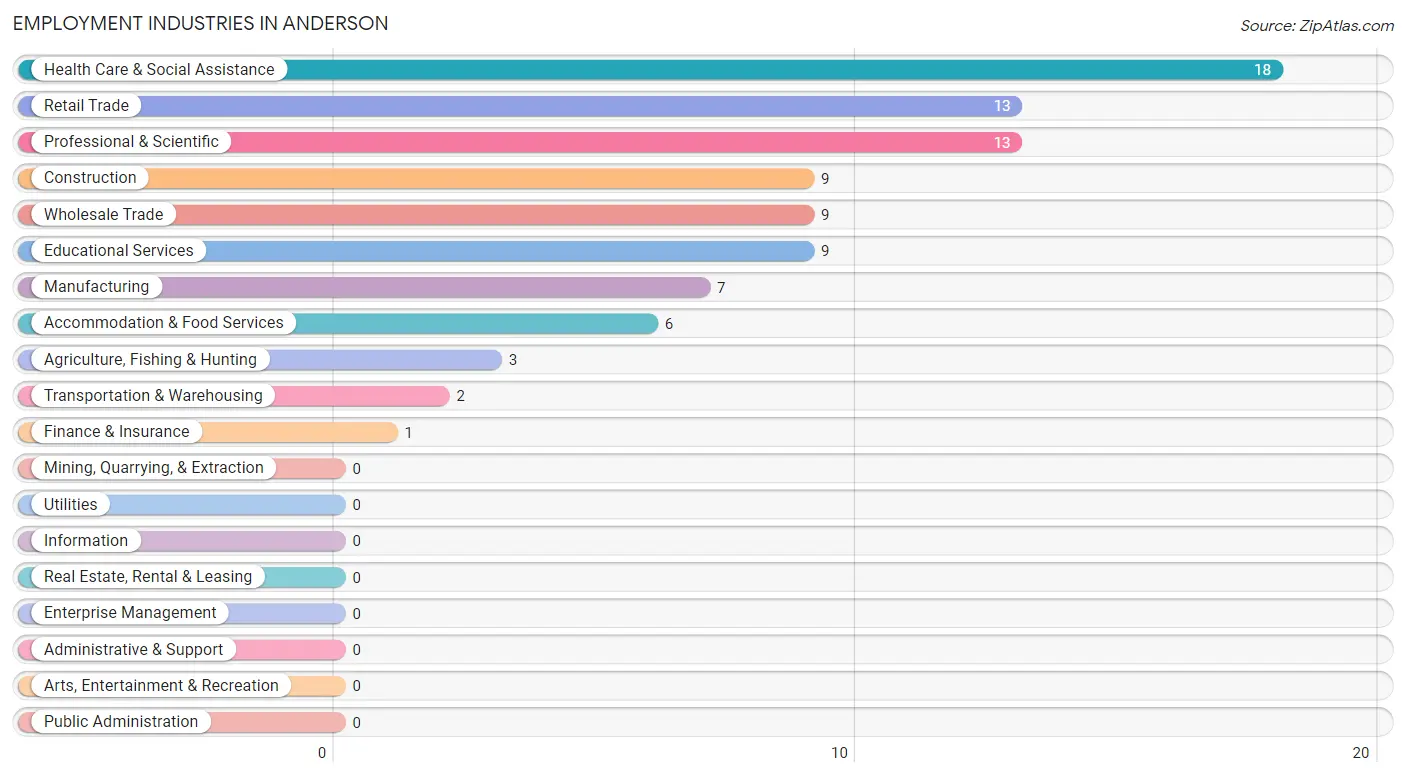
Employment Industries in Anderson
The major employment industries in Anderson include Health Care & Social Assistance (18 | 19.6%), Retail Trade (13 | 14.1%), Professional & Scientific (13 | 14.1%), Construction (9 | 9.8%), and Wholesale Trade (9 | 9.8%).
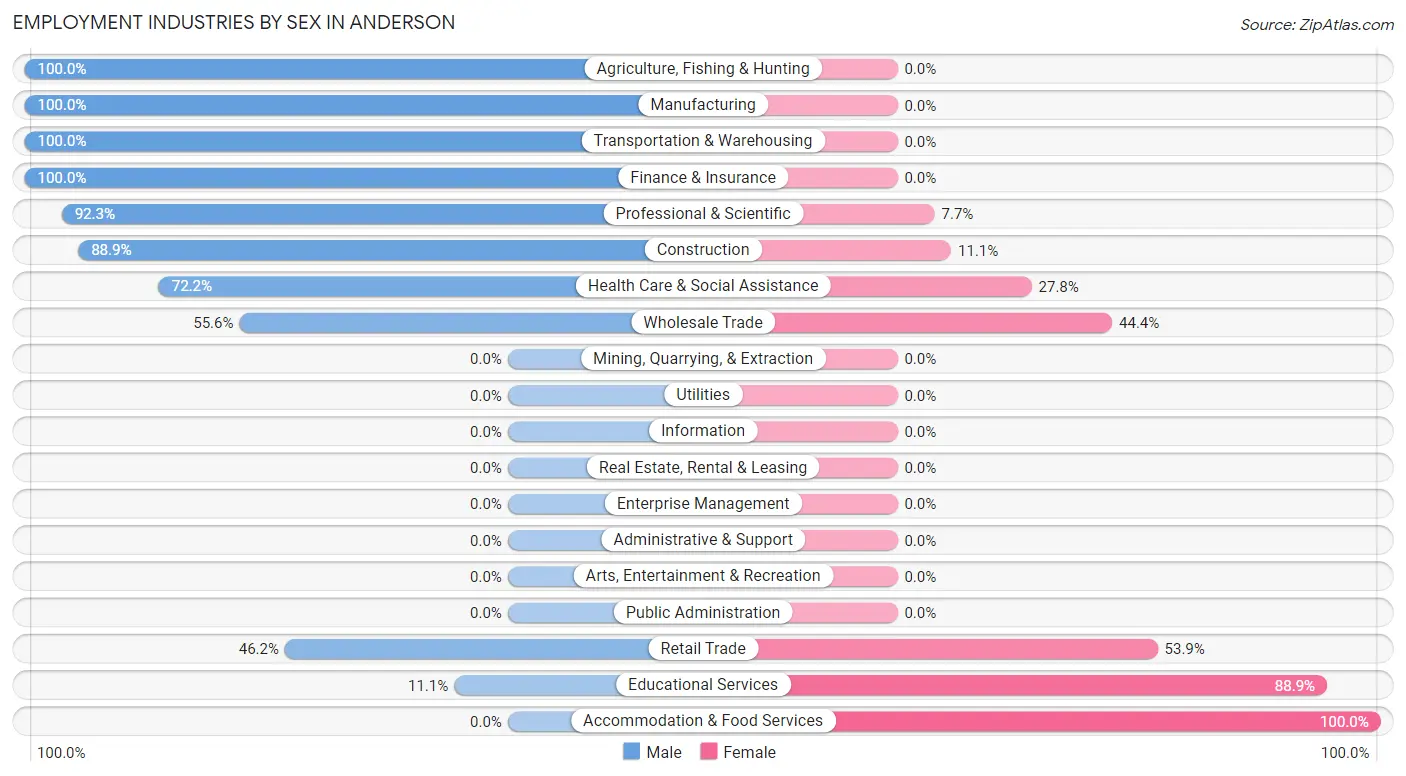
Employment Industries by Sex in Anderson
The Anderson industries that see more men than women are Agriculture, Fishing & Hunting (100.0%), Manufacturing (100.0%), and Transportation & Warehousing (100.0%), whereas the industries that tend to have a higher number of women are Accommodation & Food Services (100.0%), Educational Services (88.9%), and Retail Trade (53.8%).
| Industry | Male | Female |
| Agriculture, Fishing & Hunting | 3 (100.0%) | 0 (0.0%) |
| Mining, Quarrying, & Extraction | 0 (0.0%) | 0 (0.0%) |
| Construction | 8 (88.9%) | 1 (11.1%) |
| Manufacturing | 7 (100.0%) | 0 (0.0%) |
| Wholesale Trade | 5 (55.6%) | 4 (44.4%) |
| Retail Trade | 6 (46.2%) | 7 (53.8%) |
| Transportation & Warehousing | 2 (100.0%) | 0 (0.0%) |
| Utilities | 0 (0.0%) | 0 (0.0%) |
| Information | 0 (0.0%) | 0 (0.0%) |
| Finance & Insurance | 1 (100.0%) | 0 (0.0%) |
| Real Estate, Rental & Leasing | 0 (0.0%) | 0 (0.0%) |
| Professional & Scientific | 12 (92.3%) | 1 (7.7%) |
| Enterprise Management | 0 (0.0%) | 0 (0.0%) |
| Administrative & Support | 0 (0.0%) | 0 (0.0%) |
| Educational Services | 1 (11.1%) | 8 (88.9%) |
| Health Care & Social Assistance | 13 (72.2%) | 5 (27.8%) |
| Arts, Entertainment & Recreation | 0 (0.0%) | 0 (0.0%) |
| Accommodation & Food Services | 0 (0.0%) | 6 (100.0%) |
| Public Administration | 0 (0.0%) | 0 (0.0%) |
| Total | 58 (63.0%) | 34 (37.0%) |
Education in Anderson
School Enrollment in Anderson
The most common levels of schooling among the 36 students in Anderson are graduate / professional (14 | 38.9%), college / undergraduate (8 | 22.2%), and nursery / preschool (5 | 13.9%).
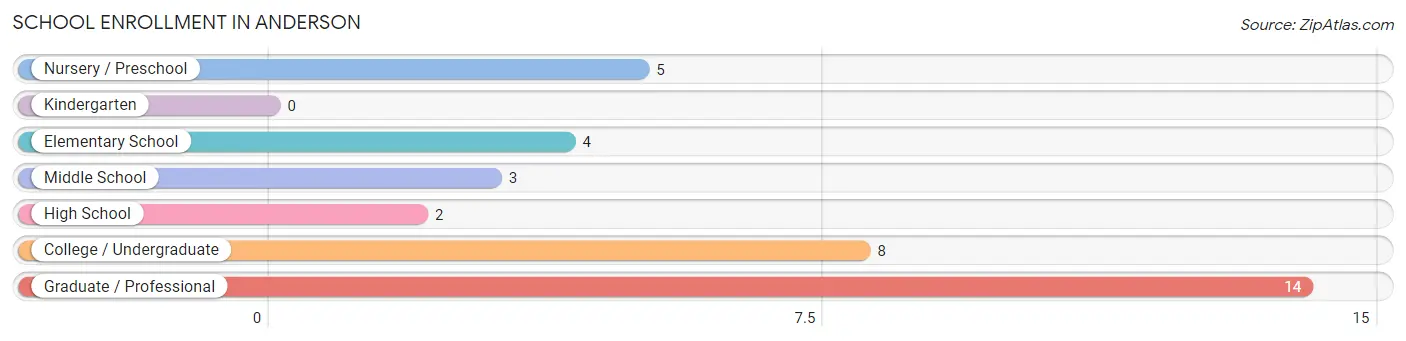
| School Level | # Students | % Students |
| Nursery / Preschool | 5 | 13.9% |
| Kindergarten | 0 | 0.0% |
| Elementary School | 4 | 11.1% |
| Middle School | 3 | 8.3% |
| High School | 2 | 5.6% |
| College / Undergraduate | 8 | 22.2% |
| Graduate / Professional | 14 | 38.9% |
| Total | 36 | 100.0% |
School Enrollment by Age by Funding Source in Anderson
Out of a total of 36 students who are enrolled in schools in Anderson, 3 (8.3%) attend a private institution, while the remaining 33 (91.7%) are enrolled in public schools. The age group of 3 to 4 year olds has the highest likelihood of being enrolled in private schools, with 3 (75.0% in the age bracket) enrolled. Conversely, the age group of 5 to 9 year old has the lowest likelihood of being enrolled in a private school, with 5 (100.0% in the age bracket) attending a public institution.
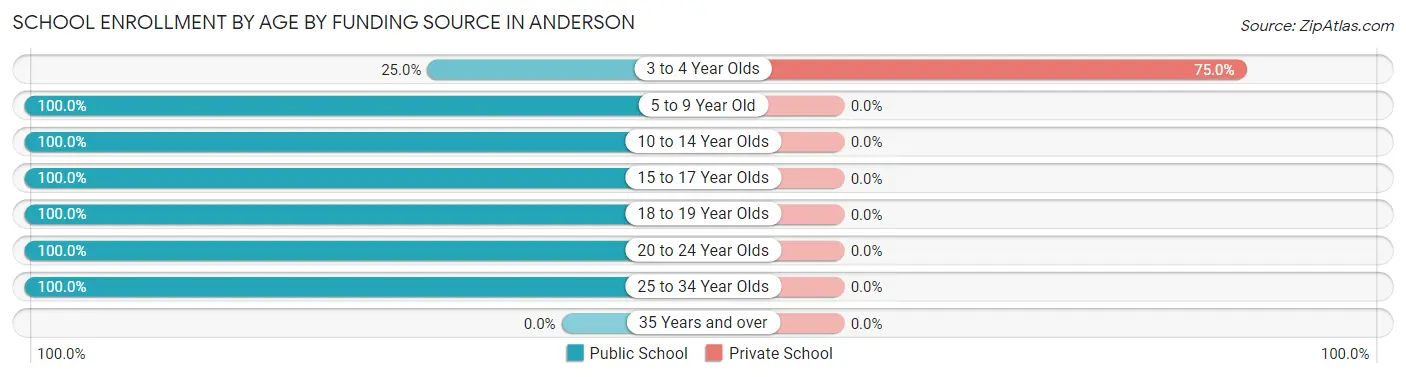
| Age Bracket | Public School | Private School |
| 3 to 4 Year Olds | 1 (25.0%) | 3 (75.0%) |
| 5 to 9 Year Old | 5 (100.0%) | 0 (0.0%) |
| 10 to 14 Year Olds | 3 (100.0%) | 0 (0.0%) |
| 15 to 17 Year Olds | 2 (100.0%) | 0 (0.0%) |
| 18 to 19 Year Olds | 4 (100.0%) | 0 (0.0%) |
| 20 to 24 Year Olds | 4 (100.0%) | 0 (0.0%) |
| 25 to 34 Year Olds | 14 (100.0%) | 0 (0.0%) |
| 35 Years and over | 0 (0.0%) | 0 (0.0%) |
| Total | 33 (91.7%) | 3 (8.3%) |
Educational Attainment by Field of Study in Anderson
Business (31 | 45.6%), physical & health sciences (13 | 19.1%), engineering (7 | 10.3%), psychology (5 | 7.3%), and education (5 | 7.3%) are the most common fields of study among 68 individuals in Anderson who have obtained a bachelor's degree or higher.
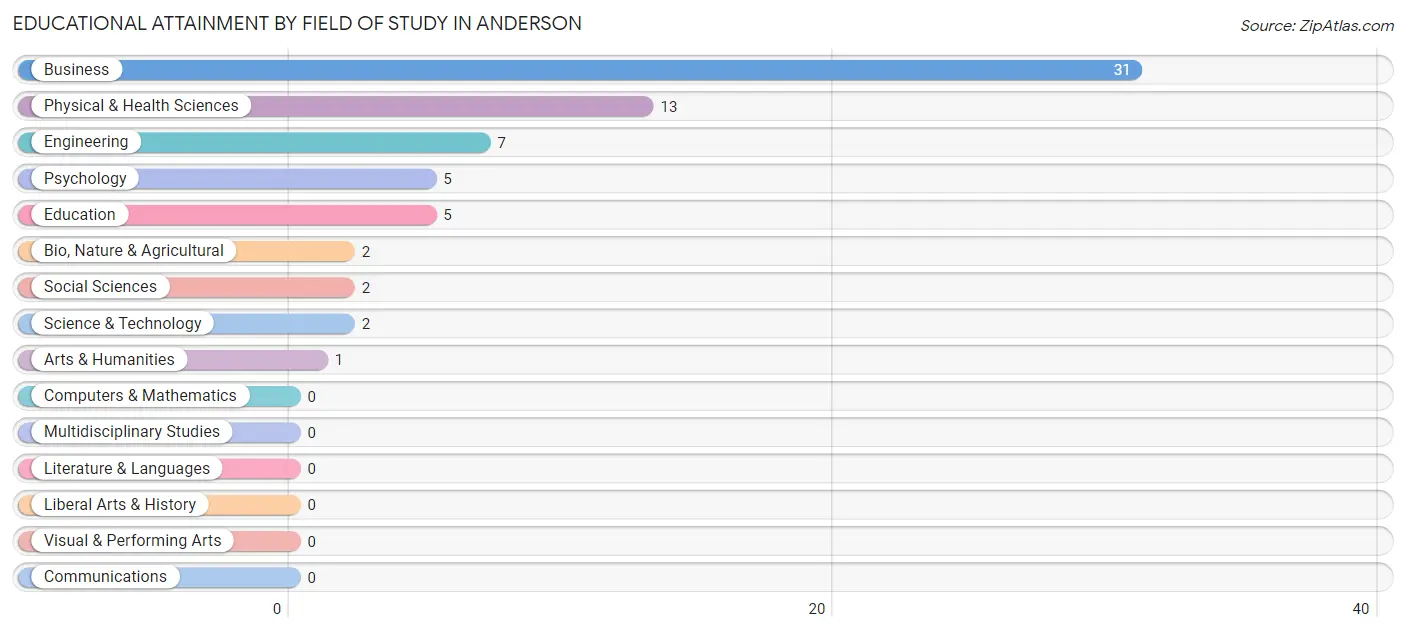
| Field of Study | # Graduates | % Graduates |
| Computers & Mathematics | 0 | 0.0% |
| Bio, Nature & Agricultural | 2 | 2.9% |
| Physical & Health Sciences | 13 | 19.1% |
| Psychology | 5 | 7.3% |
| Social Sciences | 2 | 2.9% |
| Engineering | 7 | 10.3% |
| Multidisciplinary Studies | 0 | 0.0% |
| Science & Technology | 2 | 2.9% |
| Business | 31 | 45.6% |
| Education | 5 | 7.3% |
| Literature & Languages | 0 | 0.0% |
| Liberal Arts & History | 0 | 0.0% |
| Visual & Performing Arts | 0 | 0.0% |
| Communications | 0 | 0.0% |
| Arts & Humanities | 1 | 1.5% |
| Total | 68 | 100.0% |
Transportation & Commute in Anderson
Vehicle Availability by Sex in Anderson
The most prevalent vehicle ownership categories in Anderson are males with 2 vehicles (31, accounting for 53.4%) and females with 2 vehicles (21, making up 91.2%).
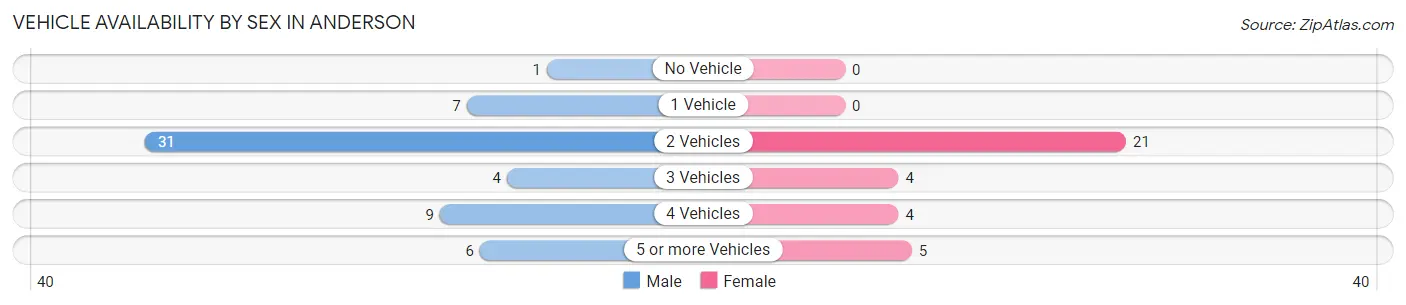
| Vehicles Available | Male | Female |
| No Vehicle | 1 (1.7%) | 0 (0.0%) |
| 1 Vehicle | 7 (12.1%) | 0 (0.0%) |
| 2 Vehicles | 31 (53.4%) | 21 (61.8%) |
| 3 Vehicles | 4 (6.9%) | 4 (11.8%) |
| 4 Vehicles | 9 (15.5%) | 4 (11.8%) |
| 5 or more Vehicles | 6 (10.3%) | 5 (14.7%) |
| Total | 58 (100.0%) | 34 (100.0%) |
Commute Time in Anderson
The most frequently occuring commute durations in Anderson are 45 to 59 minutes (19 commuters, 21.8%), 60 to 89 minutes (13 commuters, 14.9%), and less than 5 minutes (12 commuters, 13.8%).
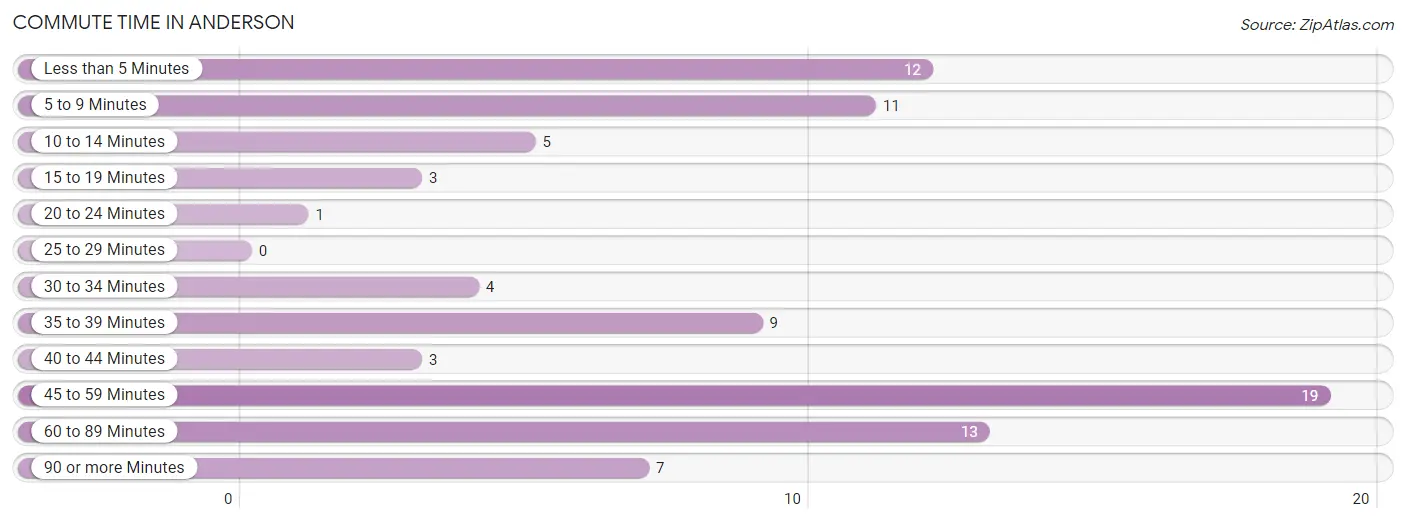
| Commute Time | # Commuters | % Commuters |
| Less than 5 Minutes | 12 | 13.8% |
| 5 to 9 Minutes | 11 | 12.6% |
| 10 to 14 Minutes | 5 | 5.8% |
| 15 to 19 Minutes | 3 | 3.5% |
| 20 to 24 Minutes | 1 | 1.1% |
| 25 to 29 Minutes | 0 | 0.0% |
| 30 to 34 Minutes | 4 | 4.6% |
| 35 to 39 Minutes | 9 | 10.3% |
| 40 to 44 Minutes | 3 | 3.5% |
| 45 to 59 Minutes | 19 | 21.8% |
| 60 to 89 Minutes | 13 | 14.9% |
| 90 or more Minutes | 7 | 8.1% |
Commute Time by Sex in Anderson
The most common commute times in Anderson are 45 to 59 minutes (18 commuters, 34.0%) for males and less than 5 minutes (7 commuters, 20.6%) for females.
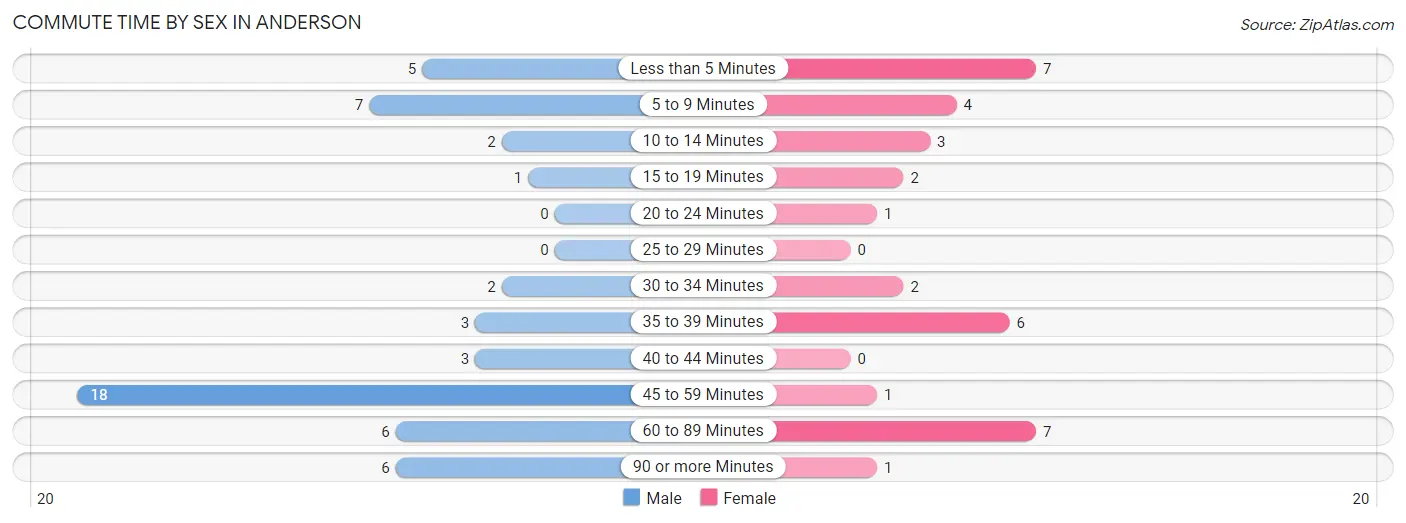
| Commute Time | Male | Female |
| Less than 5 Minutes | 5 (9.4%) | 7 (20.6%) |
| 5 to 9 Minutes | 7 (13.2%) | 4 (11.8%) |
| 10 to 14 Minutes | 2 (3.8%) | 3 (8.8%) |
| 15 to 19 Minutes | 1 (1.9%) | 2 (5.9%) |
| 20 to 24 Minutes | 0 (0.0%) | 1 (2.9%) |
| 25 to 29 Minutes | 0 (0.0%) | 0 (0.0%) |
| 30 to 34 Minutes | 2 (3.8%) | 2 (5.9%) |
| 35 to 39 Minutes | 3 (5.7%) | 6 (17.6%) |
| 40 to 44 Minutes | 3 (5.7%) | 0 (0.0%) |
| 45 to 59 Minutes | 18 (34.0%) | 1 (2.9%) |
| 60 to 89 Minutes | 6 (11.3%) | 7 (20.6%) |
| 90 or more Minutes | 6 (11.3%) | 1 (2.9%) |
Time of Departure to Work by Sex in Anderson
The most frequent times of departure to work in Anderson are 6:00 AM to 6:29 AM (19, 35.8%) for males and 7:00 AM to 7:29 AM (9, 26.5%) for females.
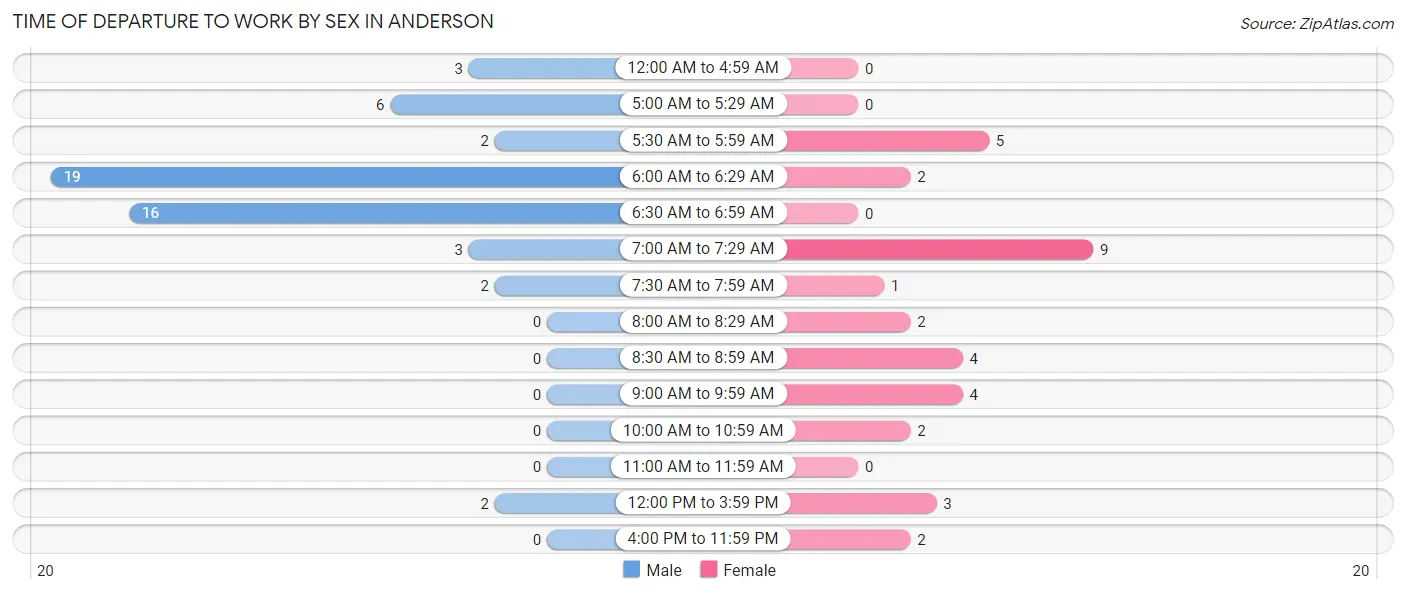
| Time of Departure | Male | Female |
| 12:00 AM to 4:59 AM | 3 (5.7%) | 0 (0.0%) |
| 5:00 AM to 5:29 AM | 6 (11.3%) | 0 (0.0%) |
| 5:30 AM to 5:59 AM | 2 (3.8%) | 5 (14.7%) |
| 6:00 AM to 6:29 AM | 19 (35.8%) | 2 (5.9%) |
| 6:30 AM to 6:59 AM | 16 (30.2%) | 0 (0.0%) |
| 7:00 AM to 7:29 AM | 3 (5.7%) | 9 (26.5%) |
| 7:30 AM to 7:59 AM | 2 (3.8%) | 1 (2.9%) |
| 8:00 AM to 8:29 AM | 0 (0.0%) | 2 (5.9%) |
| 8:30 AM to 8:59 AM | 0 (0.0%) | 4 (11.8%) |
| 9:00 AM to 9:59 AM | 0 (0.0%) | 4 (11.8%) |
| 10:00 AM to 10:59 AM | 0 (0.0%) | 2 (5.9%) |
| 11:00 AM to 11:59 AM | 0 (0.0%) | 0 (0.0%) |
| 12:00 PM to 3:59 PM | 2 (3.8%) | 3 (8.8%) |
| 4:00 PM to 11:59 PM | 0 (0.0%) | 2 (5.9%) |
| Total | 53 (100.0%) | 34 (100.0%) |
Housing Occupancy in Anderson
Occupancy by Ownership in Anderson
Of the total 111 dwellings in Anderson, owner-occupied units account for 90 (81.1%), while renter-occupied units make up 21 (18.9%).
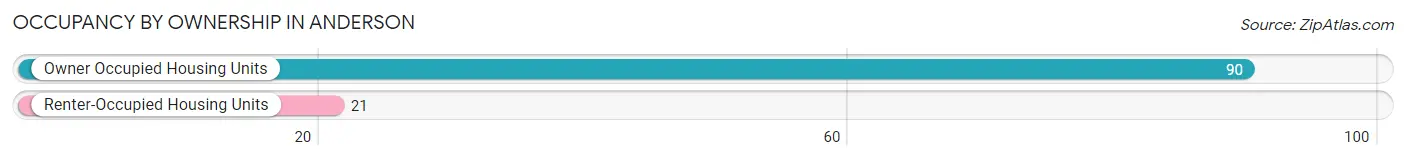
| Occupancy | # Housing Units | % Housing Units |
| Owner Occupied Housing Units | 90 | 81.1% |
| Renter-Occupied Housing Units | 21 | 18.9% |
| Total Occupied Housing Units | 111 | 100.0% |
Occupancy by Household Size in Anderson
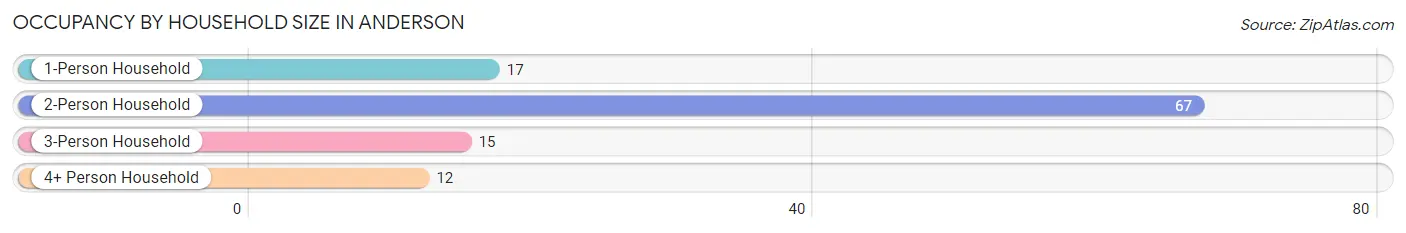
| Household Size | # Housing Units | % Housing Units |
| 1-Person Household | 17 | 15.3% |
| 2-Person Household | 67 | 60.4% |
| 3-Person Household | 15 | 13.5% |
| 4+ Person Household | 12 | 10.8% |
| Total Housing Units | 111 | 100.0% |
Occupancy by Ownership by Household Size in Anderson
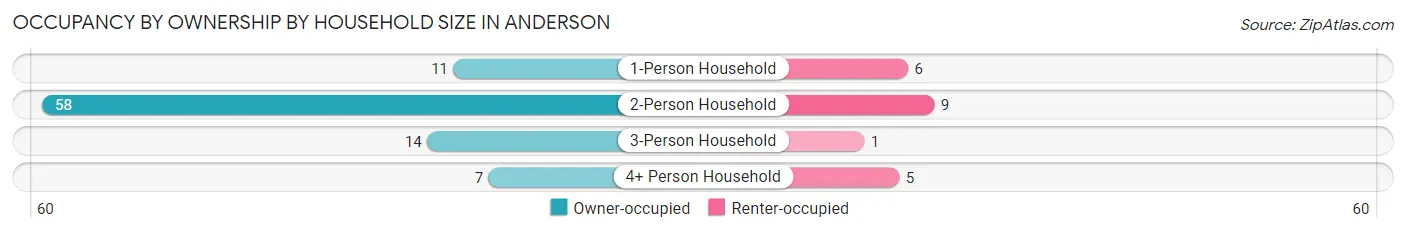
| Household Size | Owner-occupied | Renter-occupied |
| 1-Person Household | 11 (64.7%) | 6 (35.3%) |
| 2-Person Household | 58 (86.6%) | 9 (13.4%) |
| 3-Person Household | 14 (93.3%) | 1 (6.7%) |
| 4+ Person Household | 7 (58.3%) | 5 (41.7%) |
| Total Housing Units | 90 (81.1%) | 21 (18.9%) |
Occupancy by Educational Attainment in Anderson
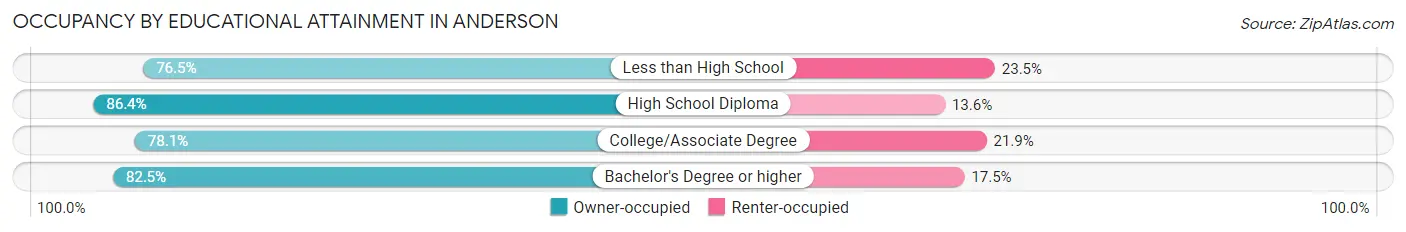
| Household Size | Owner-occupied | Renter-occupied |
| Less than High School | 13 (76.5%) | 4 (23.5%) |
| High School Diploma | 19 (86.4%) | 3 (13.6%) |
| College/Associate Degree | 25 (78.1%) | 7 (21.9%) |
| Bachelor's Degree or higher | 33 (82.5%) | 7 (17.5%) |
Occupancy by Age of Householder in Anderson
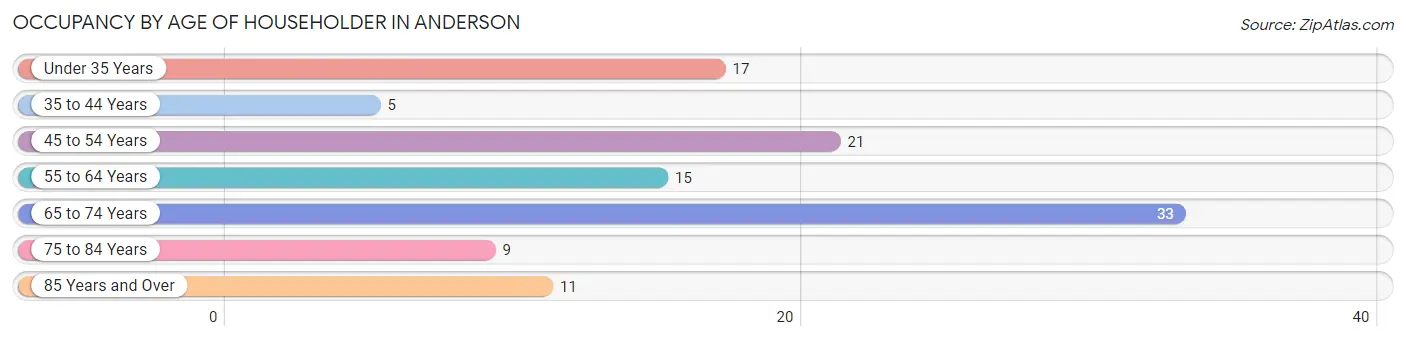
| Age Bracket | # Households | % Households |
| Under 35 Years | 17 | 15.3% |
| 35 to 44 Years | 5 | 4.5% |
| 45 to 54 Years | 21 | 18.9% |
| 55 to 64 Years | 15 | 13.5% |
| 65 to 74 Years | 33 | 29.7% |
| 75 to 84 Years | 9 | 8.1% |
| 85 Years and Over | 11 | 9.9% |
| Total | 111 | 100.0% |
Housing Finances in Anderson
Median Income by Occupancy in Anderson
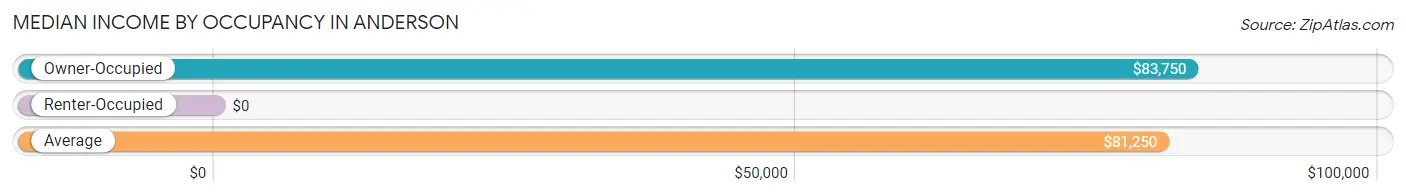
| Occupancy Type | # Households | Median Income |
| Owner-Occupied | 90 (81.1%) | $83,750 |
| Renter-Occupied | 21 (18.9%) | $0 |
| Average | 111 (100.0%) | $81,250 |
Occupancy by Householder Income Bracket in Anderson
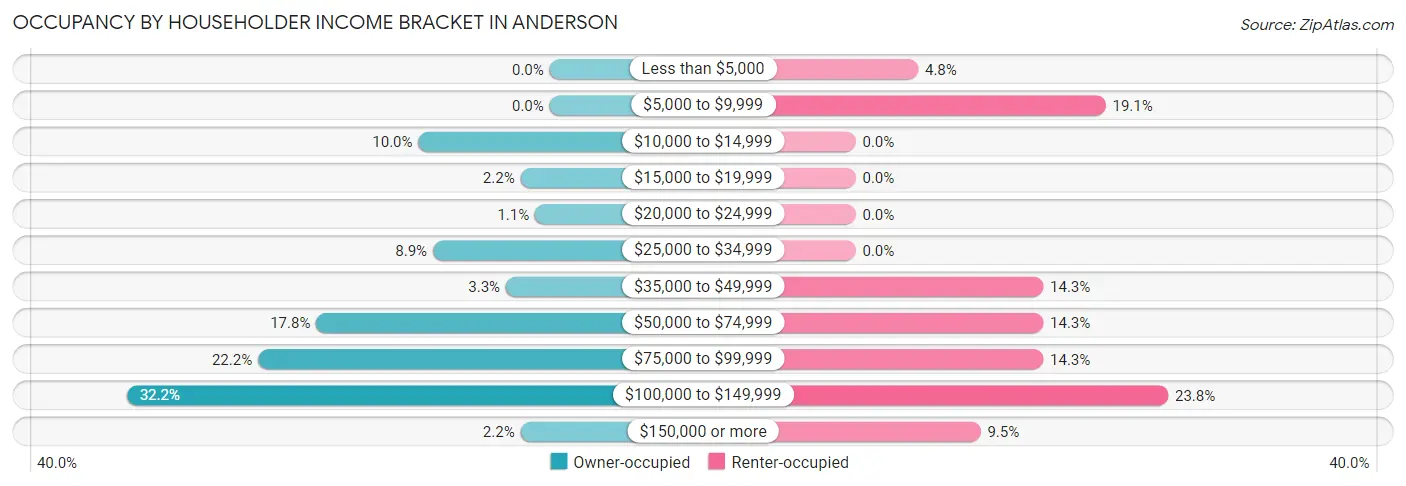
| Income Bracket | Owner-occupied | Renter-occupied |
| Less than $5,000 | 0 (0.0%) | 1 (4.8%) |
| $5,000 to $9,999 | 0 (0.0%) | 4 (19.1%) |
| $10,000 to $14,999 | 9 (10.0%) | 0 (0.0%) |
| $15,000 to $19,999 | 2 (2.2%) | 0 (0.0%) |
| $20,000 to $24,999 | 1 (1.1%) | 0 (0.0%) |
| $25,000 to $34,999 | 8 (8.9%) | 0 (0.0%) |
| $35,000 to $49,999 | 3 (3.3%) | 3 (14.3%) |
| $50,000 to $74,999 | 16 (17.8%) | 3 (14.3%) |
| $75,000 to $99,999 | 20 (22.2%) | 3 (14.3%) |
| $100,000 to $149,999 | 29 (32.2%) | 5 (23.8%) |
| $150,000 or more | 2 (2.2%) | 2 (9.5%) |
| Total | 90 (100.0%) | 21 (100.0%) |
Monthly Housing Cost Tiers in Anderson
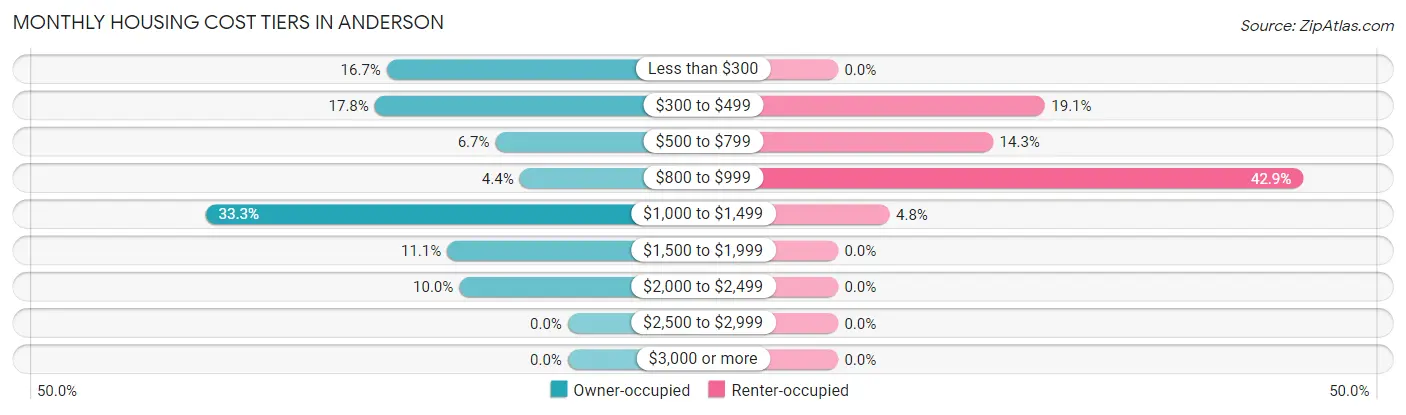
| Monthly Cost | Owner-occupied | Renter-occupied |
| Less than $300 | 15 (16.7%) | 0 (0.0%) |
| $300 to $499 | 16 (17.8%) | 4 (19.1%) |
| $500 to $799 | 6 (6.7%) | 3 (14.3%) |
| $800 to $999 | 4 (4.4%) | 9 (42.9%) |
| $1,000 to $1,499 | 30 (33.3%) | 1 (4.8%) |
| $1,500 to $1,999 | 10 (11.1%) | 0 (0.0%) |
| $2,000 to $2,499 | 9 (10.0%) | 0 (0.0%) |
| $2,500 to $2,999 | 0 (0.0%) | 0 (0.0%) |
| $3,000 or more | 0 (0.0%) | 0 (0.0%) |
| Total | 90 (100.0%) | 21 (100.0%) |
Physical Housing Characteristics in Anderson
Housing Structures in Anderson
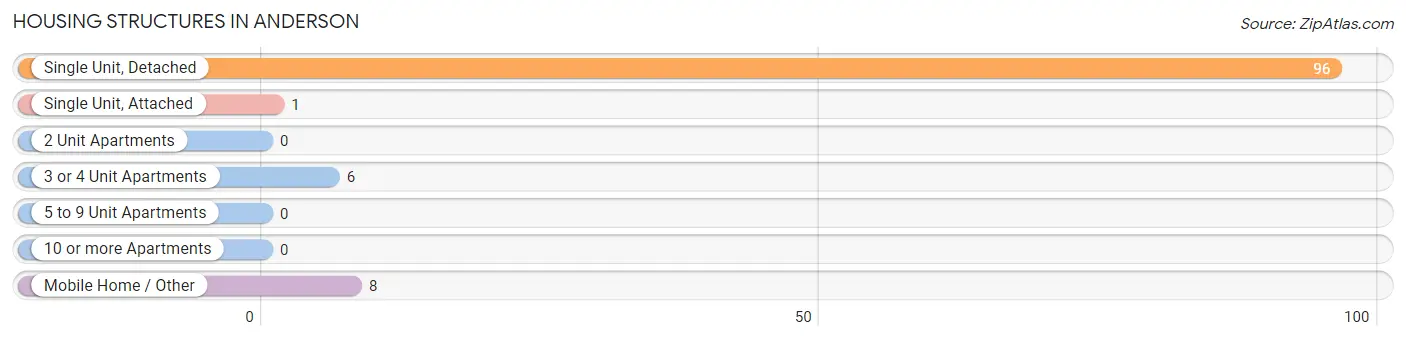
| Structure Type | # Housing Units | % Housing Units |
| Single Unit, Detached | 96 | 86.5% |
| Single Unit, Attached | 1 | 0.9% |
| 2 Unit Apartments | 0 | 0.0% |
| 3 or 4 Unit Apartments | 6 | 5.4% |
| 5 to 9 Unit Apartments | 0 | 0.0% |
| 10 or more Apartments | 0 | 0.0% |
| Mobile Home / Other | 8 | 7.2% |
| Total | 111 | 100.0% |
Housing Structures by Occupancy in Anderson
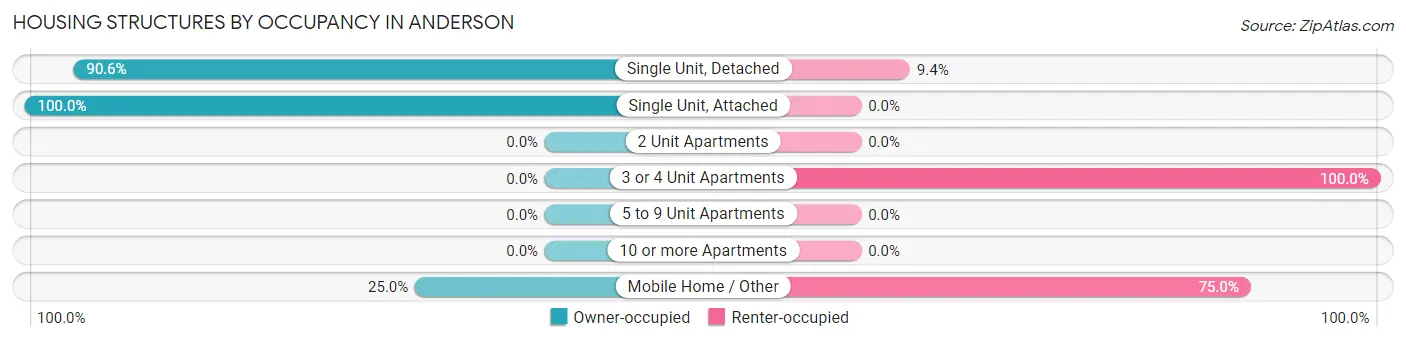
| Structure Type | Owner-occupied | Renter-occupied |
| Single Unit, Detached | 87 (90.6%) | 9 (9.4%) |
| Single Unit, Attached | 1 (100.0%) | 0 (0.0%) |
| 2 Unit Apartments | 0 (0.0%) | 0 (0.0%) |
| 3 or 4 Unit Apartments | 0 (0.0%) | 6 (100.0%) |
| 5 to 9 Unit Apartments | 0 (0.0%) | 0 (0.0%) |
| 10 or more Apartments | 0 (0.0%) | 0 (0.0%) |
| Mobile Home / Other | 2 (25.0%) | 6 (75.0%) |
| Total | 90 (81.1%) | 21 (18.9%) |
Housing Structures by Number of Rooms in Anderson
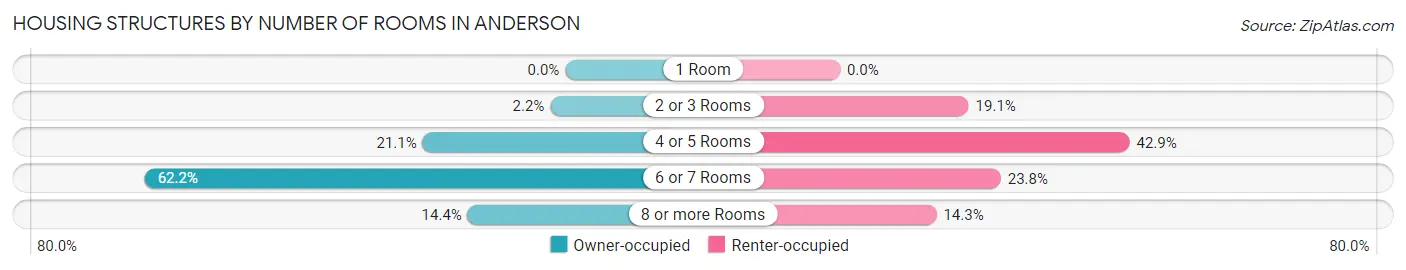
| Number of Rooms | Owner-occupied | Renter-occupied |
| 1 Room | 0 (0.0%) | 0 (0.0%) |
| 2 or 3 Rooms | 2 (2.2%) | 4 (19.1%) |
| 4 or 5 Rooms | 19 (21.1%) | 9 (42.9%) |
| 6 or 7 Rooms | 56 (62.2%) | 5 (23.8%) |
| 8 or more Rooms | 13 (14.4%) | 3 (14.3%) |
| Total | 90 (100.0%) | 21 (100.0%) |
Housing Structure by Heating Type in Anderson
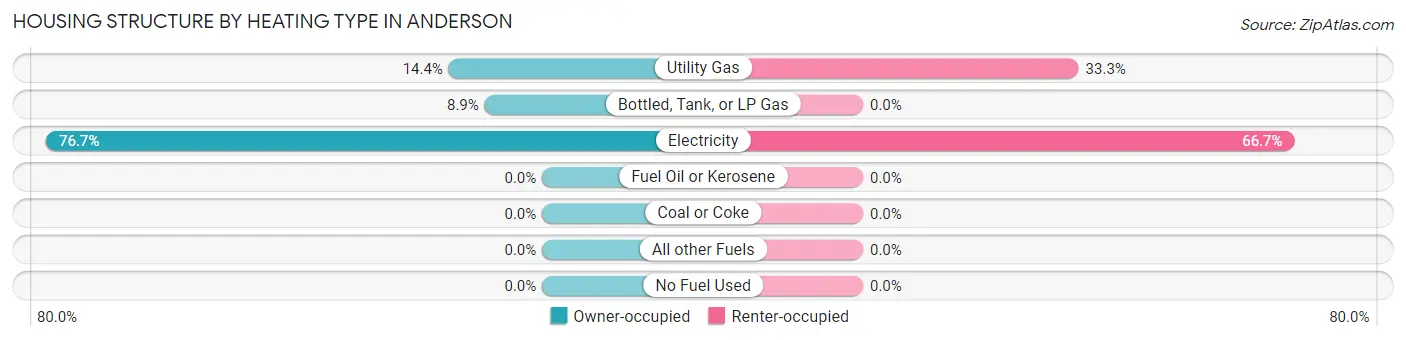
| Heating Type | Owner-occupied | Renter-occupied |
| Utility Gas | 13 (14.4%) | 7 (33.3%) |
| Bottled, Tank, or LP Gas | 8 (8.9%) | 0 (0.0%) |
| Electricity | 69 (76.7%) | 14 (66.7%) |
| Fuel Oil or Kerosene | 0 (0.0%) | 0 (0.0%) |
| Coal or Coke | 0 (0.0%) | 0 (0.0%) |
| All other Fuels | 0 (0.0%) | 0 (0.0%) |
| No Fuel Used | 0 (0.0%) | 0 (0.0%) |
| Total | 90 (100.0%) | 21 (100.0%) |
Household Vehicle Usage in Anderson
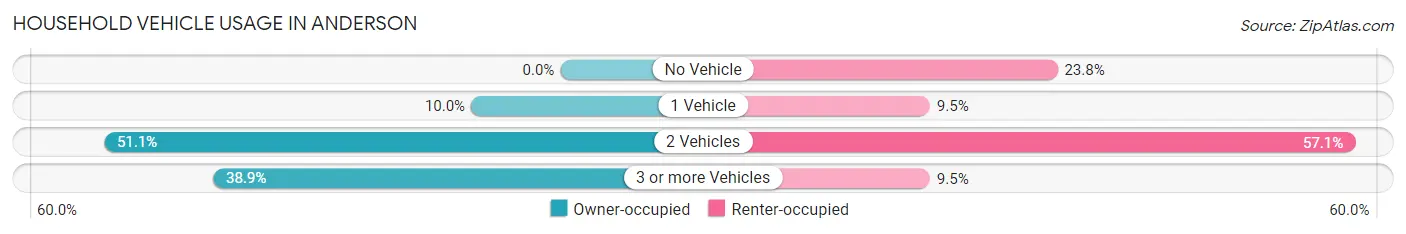
| Vehicles per Household | Owner-occupied | Renter-occupied |
| No Vehicle | 0 (0.0%) | 5 (23.8%) |
| 1 Vehicle | 9 (10.0%) | 2 (9.5%) |
| 2 Vehicles | 46 (51.1%) | 12 (57.1%) |
| 3 or more Vehicles | 35 (38.9%) | 2 (9.5%) |
| Total | 90 (100.0%) | 21 (100.0%) |
Real Estate & Mortgages in Anderson
Real Estate and Mortgage Overview in Anderson
| Characteristic | Without Mortgage | With Mortgage |
| Housing Units | 36 | 54 |
| Median Property Value | $125,000 | $264,600 |
| Median Household Income | $65,000 | $1 |
| Monthly Housing Costs | $321 | $0 |
| Real Estate Taxes | - | - |
Property Value by Mortgage Status in Anderson
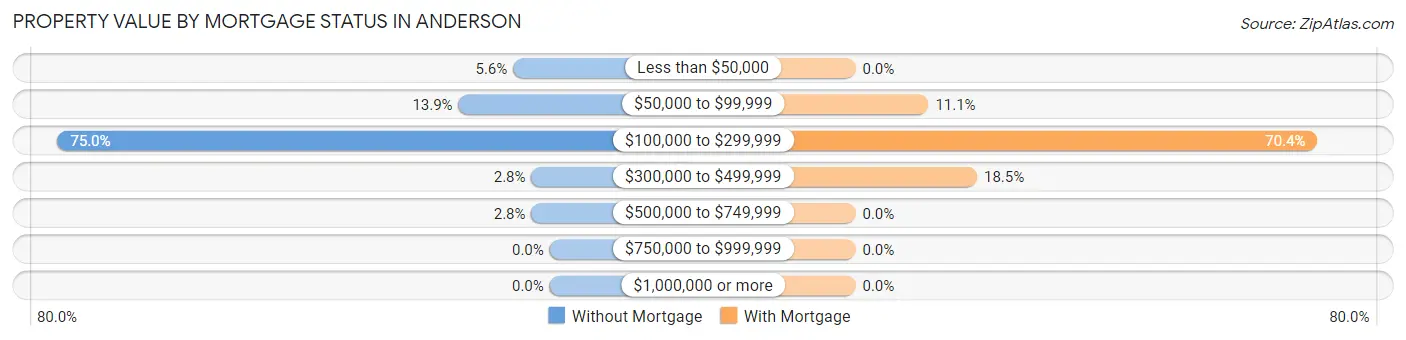
| Property Value | Without Mortgage | With Mortgage |
| Less than $50,000 | 2 (5.6%) | 0 (0.0%) |
| $50,000 to $99,999 | 5 (13.9%) | 6 (11.1%) |
| $100,000 to $299,999 | 27 (75.0%) | 38 (70.4%) |
| $300,000 to $499,999 | 1 (2.8%) | 10 (18.5%) |
| $500,000 to $749,999 | 1 (2.8%) | 0 (0.0%) |
| $750,000 to $999,999 | 0 (0.0%) | 0 (0.0%) |
| $1,000,000 or more | 0 (0.0%) | 0 (0.0%) |
| Total | 36 (100.0%) | 54 (100.0%) |
Household Income by Mortgage Status in Anderson
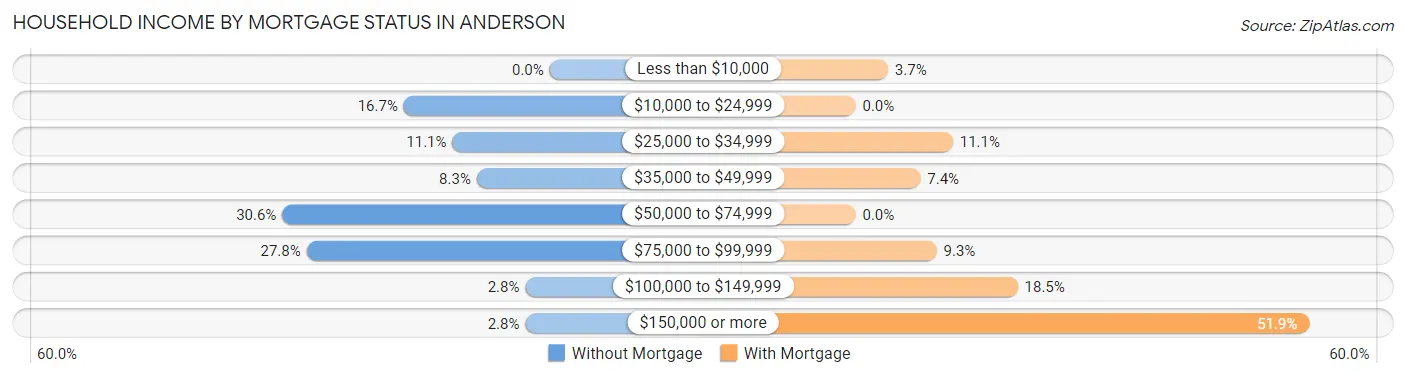
| Household Income | Without Mortgage | With Mortgage |
| Less than $10,000 | 0 (0.0%) | 2 (3.7%) |
| $10,000 to $24,999 | 6 (16.7%) | 0 (0.0%) |
| $25,000 to $34,999 | 4 (11.1%) | 6 (11.1%) |
| $35,000 to $49,999 | 3 (8.3%) | 4 (7.4%) |
| $50,000 to $74,999 | 11 (30.6%) | 0 (0.0%) |
| $75,000 to $99,999 | 10 (27.8%) | 5 (9.3%) |
| $100,000 to $149,999 | 1 (2.8%) | 10 (18.5%) |
| $150,000 or more | 1 (2.8%) | 28 (51.8%) |
| Total | 36 (100.0%) | 54 (100.0%) |
Property Value to Household Income Ratio in Anderson
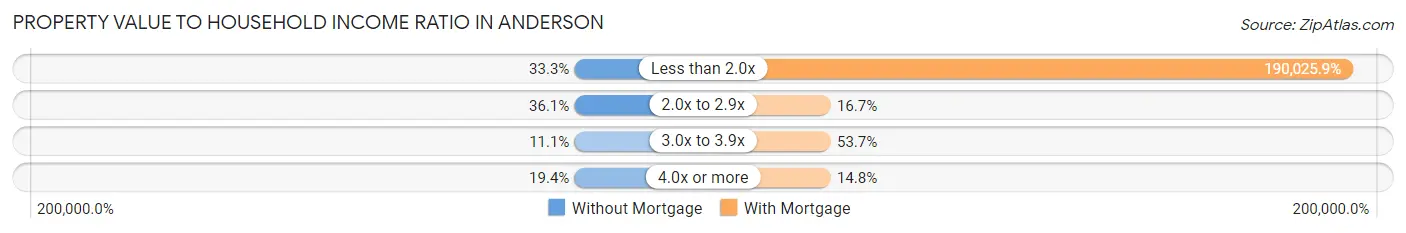
| Value-to-Income Ratio | Without Mortgage | With Mortgage |
| Less than 2.0x | 12 (33.3%) | 102,614 (190,025.9%) |
| 2.0x to 2.9x | 13 (36.1%) | 9 (16.7%) |
| 3.0x to 3.9x | 4 (11.1%) | 29 (53.7%) |
| 4.0x or more | 7 (19.4%) | 8 (14.8%) |
| Total | 36 (100.0%) | 54 (100.0%) |
Real Estate Taxes by Mortgage Status in Anderson
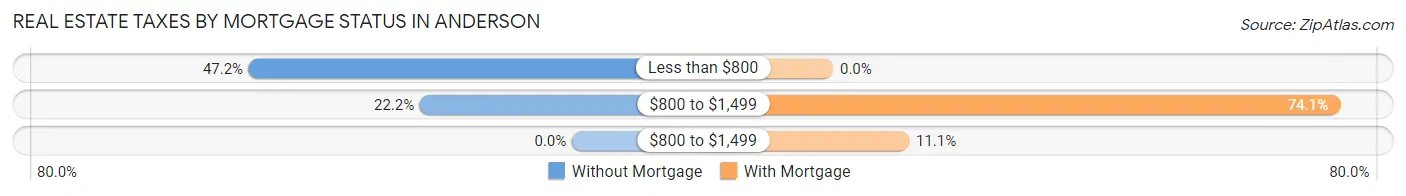
| Property Taxes | Without Mortgage | With Mortgage |
| Less than $800 | 17 (47.2%) | 0 (0.0%) |
| $800 to $1,499 | 8 (22.2%) | 40 (74.1%) |
| $800 to $1,499 | 0 (0.0%) | 6 (11.1%) |
| Total | 36 (100.0%) | 54 (100.0%) |
Health & Disability in Anderson
Health Insurance Coverage by Age in Anderson
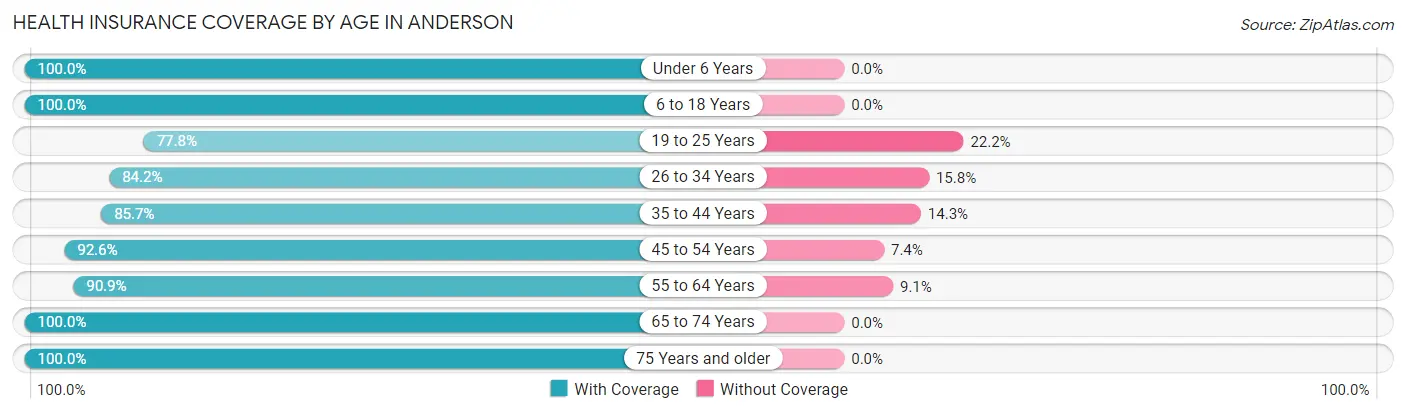
| Age Bracket | With Coverage | Without Coverage |
| Under 6 Years | 17 (100.0%) | 0 (0.0%) |
| 6 to 18 Years | 11 (100.0%) | 0 (0.0%) |
| 19 to 25 Years | 7 (77.8%) | 2 (22.2%) |
| 26 to 34 Years | 32 (84.2%) | 6 (15.8%) |
| 35 to 44 Years | 12 (85.7%) | 2 (14.3%) |
| 45 to 54 Years | 25 (92.6%) | 2 (7.4%) |
| 55 to 64 Years | 40 (90.9%) | 4 (9.1%) |
| 65 to 74 Years | 49 (100.0%) | 0 (0.0%) |
| 75 Years and older | 32 (100.0%) | 0 (0.0%) |
| Total | 225 (93.4%) | 16 (6.6%) |
Health Insurance Coverage by Citizenship Status in Anderson
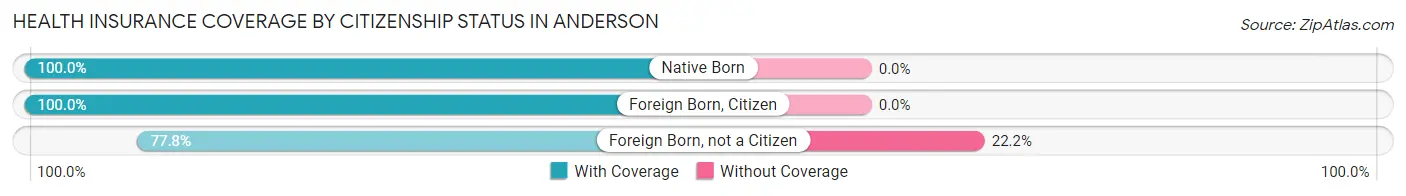
| Citizenship Status | With Coverage | Without Coverage |
| Native Born | 17 (100.0%) | 0 (0.0%) |
| Foreign Born, Citizen | 11 (100.0%) | 0 (0.0%) |
| Foreign Born, not a Citizen | 7 (77.8%) | 2 (22.2%) |
Health Insurance Coverage by Household Income in Anderson
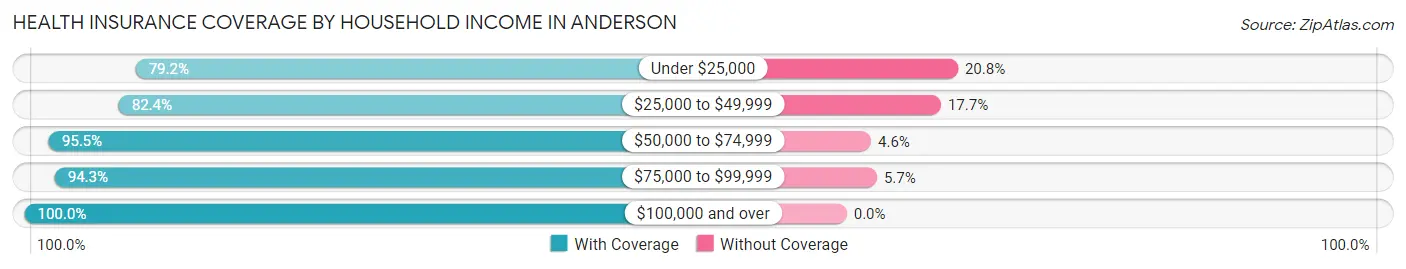
| Household Income | With Coverage | Without Coverage |
| Under $25,000 | 19 (79.2%) | 5 (20.8%) |
| $25,000 to $49,999 | 28 (82.4%) | 6 (17.6%) |
| $50,000 to $74,999 | 42 (95.5%) | 2 (4.5%) |
| $75,000 to $99,999 | 50 (94.3%) | 3 (5.7%) |
| $100,000 and over | 86 (100.0%) | 0 (0.0%) |
Public vs Private Health Insurance Coverage by Age in Anderson
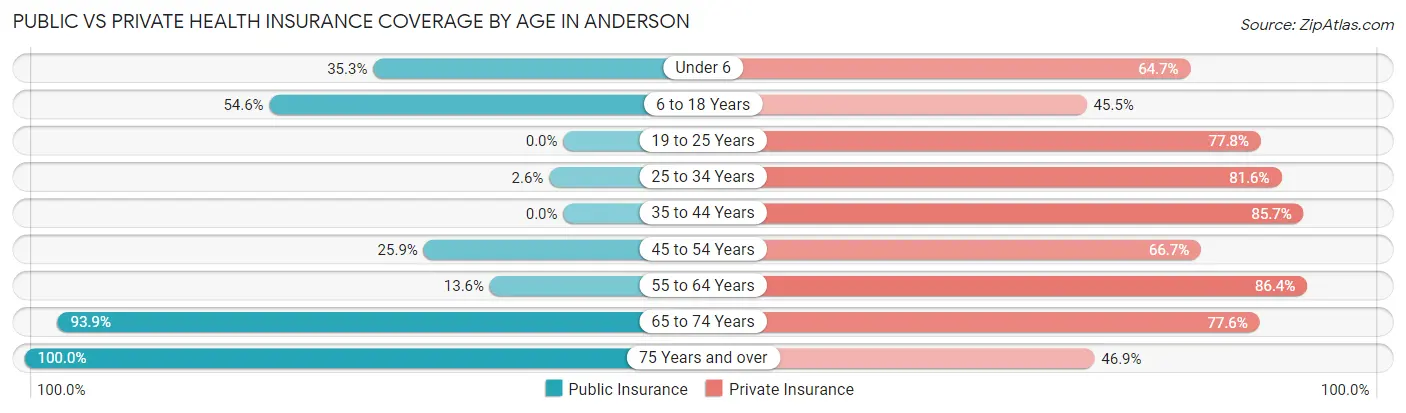
| Age Bracket | Public Insurance | Private Insurance |
| Under 6 | 6 (35.3%) | 11 (64.7%) |
| 6 to 18 Years | 6 (54.5%) | 5 (45.5%) |
| 19 to 25 Years | 0 (0.0%) | 7 (77.8%) |
| 25 to 34 Years | 1 (2.6%) | 31 (81.6%) |
| 35 to 44 Years | 0 (0.0%) | 12 (85.7%) |
| 45 to 54 Years | 7 (25.9%) | 18 (66.7%) |
| 55 to 64 Years | 6 (13.6%) | 38 (86.4%) |
| 65 to 74 Years | 46 (93.9%) | 38 (77.5%) |
| 75 Years and over | 32 (100.0%) | 15 (46.9%) |
| Total | 104 (43.1%) | 175 (72.6%) |
Disability Status by Sex by Age in Anderson
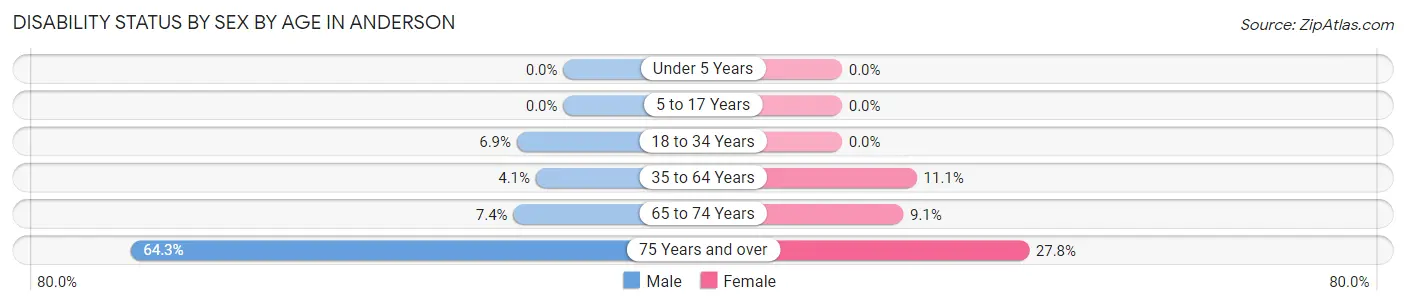
| Age Bracket | Male | Female |
| Under 5 Years | 0 (0.0%) | 0 (0.0%) |
| 5 to 17 Years | 0 (0.0%) | 0 (0.0%) |
| 18 to 34 Years | 2 (6.9%) | 0 (0.0%) |
| 35 to 64 Years | 2 (4.1%) | 4 (11.1%) |
| 65 to 74 Years | 2 (7.4%) | 2 (9.1%) |
| 75 Years and over | 9 (64.3%) | 5 (27.8%) |
Disability Class by Sex by Age in Anderson
Disability Class: Hearing Difficulty
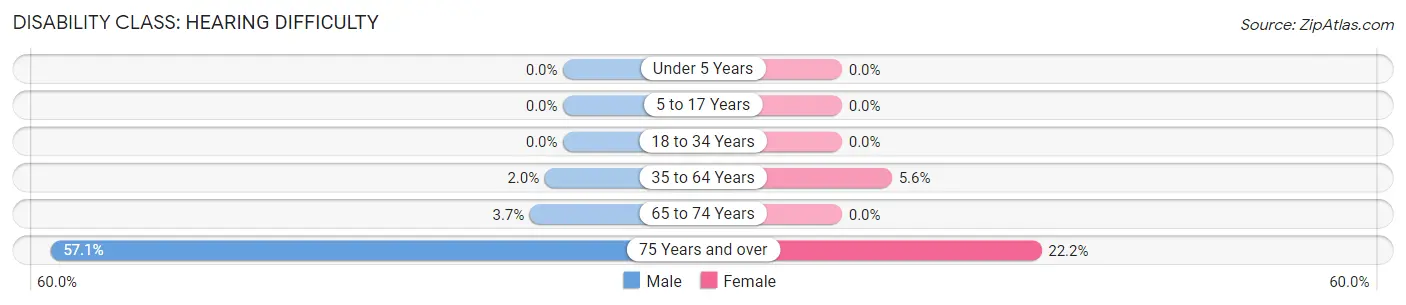
| Age Bracket | Male | Female |
| Under 5 Years | 0 (0.0%) | 0 (0.0%) |
| 5 to 17 Years | 0 (0.0%) | 0 (0.0%) |
| 18 to 34 Years | 0 (0.0%) | 0 (0.0%) |
| 35 to 64 Years | 1 (2.0%) | 2 (5.6%) |
| 65 to 74 Years | 1 (3.7%) | 0 (0.0%) |
| 75 Years and over | 8 (57.1%) | 4 (22.2%) |
Disability Class: Vision Difficulty
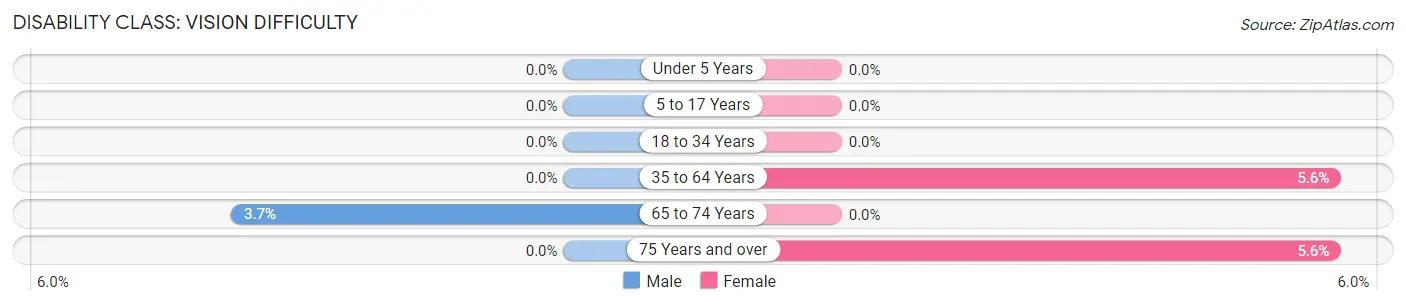
| Age Bracket | Male | Female |
| Under 5 Years | 0 (0.0%) | 0 (0.0%) |
| 5 to 17 Years | 0 (0.0%) | 0 (0.0%) |
| 18 to 34 Years | 0 (0.0%) | 0 (0.0%) |
| 35 to 64 Years | 0 (0.0%) | 2 (5.6%) |
| 65 to 74 Years | 1 (3.7%) | 0 (0.0%) |
| 75 Years and over | 0 (0.0%) | 1 (5.6%) |
Disability Class: Cognitive Difficulty
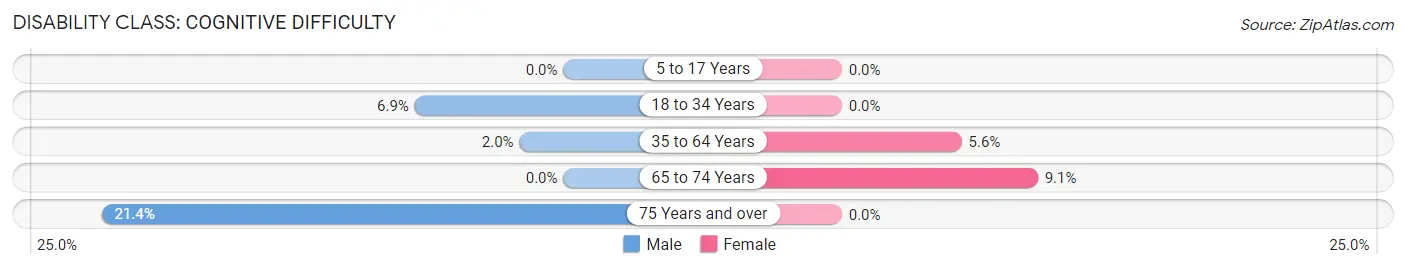
| Age Bracket | Male | Female |
| 5 to 17 Years | 0 (0.0%) | 0 (0.0%) |
| 18 to 34 Years | 2 (6.9%) | 0 (0.0%) |
| 35 to 64 Years | 1 (2.0%) | 2 (5.6%) |
| 65 to 74 Years | 0 (0.0%) | 2 (9.1%) |
| 75 Years and over | 3 (21.4%) | 0 (0.0%) |
Disability Class: Ambulatory Difficulty
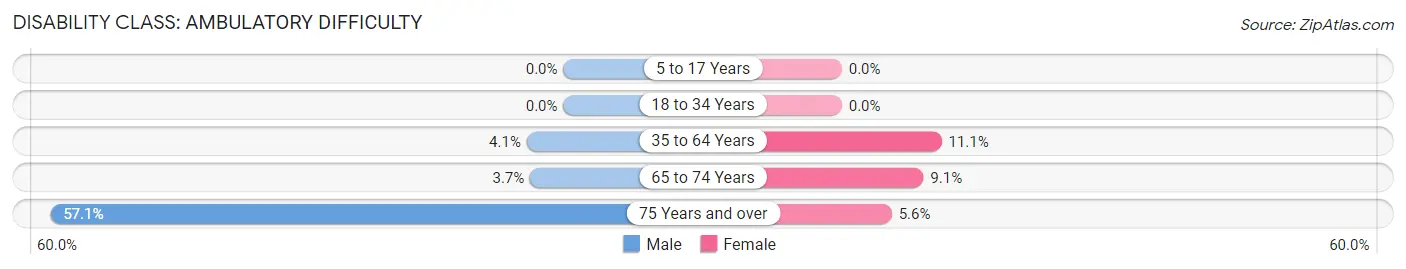
| Age Bracket | Male | Female |
| 5 to 17 Years | 0 (0.0%) | 0 (0.0%) |
| 18 to 34 Years | 0 (0.0%) | 0 (0.0%) |
| 35 to 64 Years | 2 (4.1%) | 4 (11.1%) |
| 65 to 74 Years | 1 (3.7%) | 2 (9.1%) |
| 75 Years and over | 8 (57.1%) | 1 (5.6%) |
Disability Class: Self-Care Difficulty
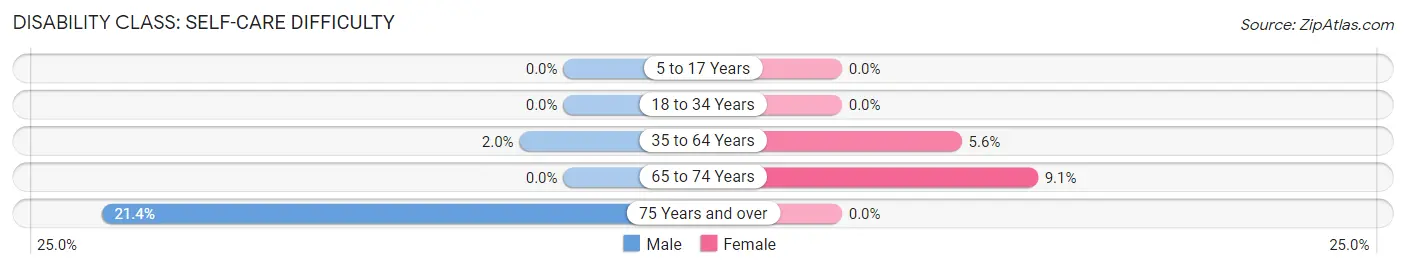
| Age Bracket | Male | Female |
| 5 to 17 Years | 0 (0.0%) | 0 (0.0%) |
| 18 to 34 Years | 0 (0.0%) | 0 (0.0%) |
| 35 to 64 Years | 1 (2.0%) | 2 (5.6%) |
| 65 to 74 Years | 0 (0.0%) | 2 (9.1%) |
| 75 Years and over | 3 (21.4%) | 0 (0.0%) |
Technology Access in Anderson
Computing Device Access in Anderson
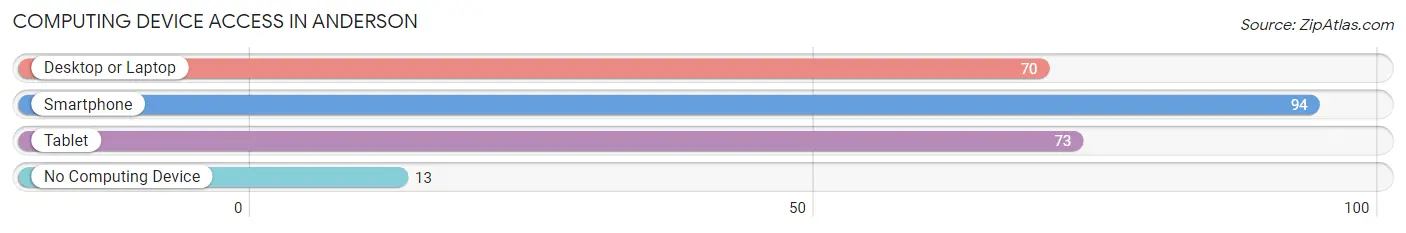
| Device Type | # Households | % Households |
| Desktop or Laptop | 70 | 63.1% |
| Smartphone | 94 | 84.7% |
| Tablet | 73 | 65.8% |
| No Computing Device | 13 | 11.7% |
| Total | 111 | 100.0% |
Internet Access in Anderson
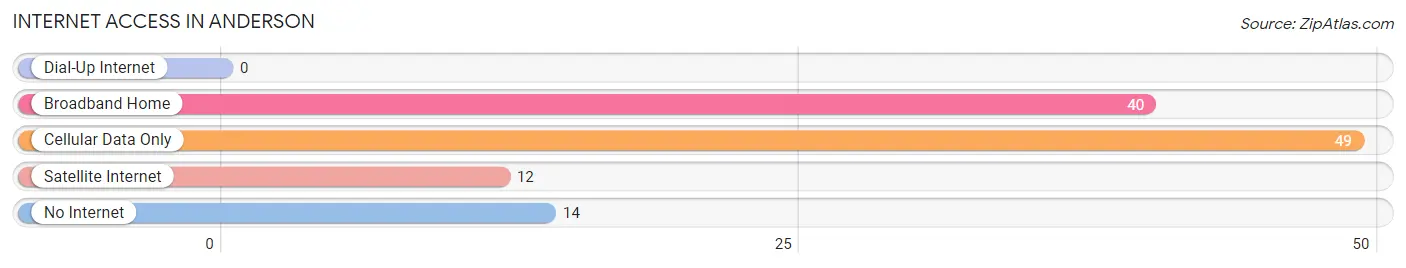
| Internet Type | # Households | % Households |
| Dial-Up Internet | 0 | 0.0% |
| Broadband Home | 40 | 36.0% |
| Cellular Data Only | 49 | 44.1% |
| Satellite Internet | 12 | 10.8% |
| No Internet | 14 | 12.6% |
| Total | 111 | 100.0% |
Anderson Summary
Anderson is a city located in the state of Alabama, in the United States of America. It is located in the northwest corner of the state, in Limestone County. The city has a population of approximately 5,000 people, and is part of the Huntsville-Decatur Combined Statistical Area.
History
The area that is now Anderson was first settled in the early 1800s by settlers from Tennessee and Virginia. The town was originally known as Andersonville, and was named after the Anderson family, who were among the first settlers. The town was officially incorporated in 1891.
In the early 1900s, Anderson was a thriving agricultural community, with cotton, corn, and other crops being grown in the area. The town also had a number of small businesses, including a sawmill, a gristmill, and a cotton gin.
In the 1950s, Anderson began to experience a period of growth and development. The town was connected to the rest of the state by the completion of Interstate 65 in the late 1950s. This allowed for increased access to the city, and helped to spur economic growth.
In the late 1960s, Anderson experienced a period of racial unrest. This was due to the city's segregated schools, which were not integrated until the 1970s.
Geography
Anderson is located in the northwest corner of Alabama, in Limestone County. The city is situated at the intersection of Interstate 65 and U.S. Highway 72. The city is located approximately 20 miles north of Huntsville, and approximately 50 miles south of Nashville, Tennessee.
The city has a total area of 4.2 square miles, all of which is land. The city is located in the foothills of the Appalachian Mountains, and is surrounded by rolling hills and forests.
Economy
The economy of Anderson is largely based on agriculture and manufacturing. The city is home to a number of small businesses, including a sawmill, a gristmill, and a cotton gin. The city is also home to a number of manufacturing companies, including a furniture manufacturer, a plastics manufacturer, and a metal fabrication company.
The city is also home to a number of retail stores, including a grocery store, a hardware store, and a number of restaurants.
Demographics
As of the 2010 census, the population of Anderson was 5,000. The racial makeup of the city was 87.3% White, 8.7% African American, 0.3% Native American, 0.7% Asian, and 2.9% from other races. Hispanic or Latino of any race were 1.7% of the population.
The median household income in Anderson was $37,500, and the median family income was $45,000. The per capita income in the city was $19,000. Approximately 16.3% of the population was below the poverty line.
Common Questions
What is Per Capita Income in Anderson?
Per Capita income in Anderson is $40,122.
What is the Median Family Income in Anderson?
Median Family Income in Anderson is $92,083.
What is the Median Household income in Anderson?
Median Household Income in Anderson is $81,250.
What is Inequality or Gini Index in Anderson?
Inequality or Gini Index in Anderson is 0.34.
What is the Total Population of Anderson?
Total Population of Anderson is 241.
What is the Total Male Population of Anderson?
Total Male Population of Anderson is 134.
What is the Total Female Population of Anderson?
Total Female Population of Anderson is 107.
What is the Ratio of Males per 100 Females in Anderson?
There are 125.23 Males per 100 Females in Anderson.
What is the Ratio of Females per 100 Males in Anderson?
There are 79.85 Females per 100 Males in Anderson.
What is the Median Population Age in Anderson?
Median Population Age in Anderson is 57.2 Years.
What is the Average Family Size in Anderson
Average Family Size in Anderson is 2.4 People.
What is the Average Household Size in Anderson
Average Household Size in Anderson is 2.2 People.
How Large is the Labor Force in Anderson?
There are 99 People in the Labor Forcein in Anderson.
What is the Percentage of People in the Labor Force in Anderson?
45.6% of People are in the Labor Force in Anderson.
What is the Unemployment Rate in Anderson?
Unemployment Rate in Anderson is 7.1%.