Highland Lakes, AL Map & Demographics
Highland Lakes Map
Highland Lakes Overview
$83,247
PER CAPITA INCOME
$162,467
AVG FAMILY INCOME
$157,868
AVG HOUSEHOLD INCOME
54.2%
WAGE / INCOME GAP [ % ]
45.8¢/ $1
WAGE / INCOME GAP [ $ ]
0.46
INEQUALITY / GINI INDEX
5,628
TOTAL POPULATION
2,749
MALE POPULATION
2,879
FEMALE POPULATION
95.48
MALES / 100 FEMALES
104.73
FEMALES / 100 MALES
47.8
MEDIAN AGE
3.0
AVG FAMILY SIZE
2.8
AVG HOUSEHOLD SIZE
3,165
LABOR FORCE [ PEOPLE ]
66.6%
PERCENT IN LABOR FORCE
2.8%
UNEMPLOYMENT RATE
Income in Highland Lakes
Income Overview in Highland Lakes
Per Capita Income in Highland Lakes is $83,247, while median incomes of families and households are $162,467 and $157,868 respectively.
| Characteristic | Number | Measure |
| Per Capita Income | 5,628 | $83,247 |
| Median Family Income | 1,804 | $162,467 |
| Mean Family Income | 1,804 | $248,865 |
| Median Household Income | 2,011 | $157,868 |
| Mean Household Income | 2,011 | $232,945 |
| Income Deficit | 1,804 | $0 |
| Wage / Income Gap (%) | 5,628 | 54.24% |
| Wage / Income Gap ($) | 5,628 | 45.76¢ per $1 |
| Gini / Inequality Index | 5,628 | 0.46 |
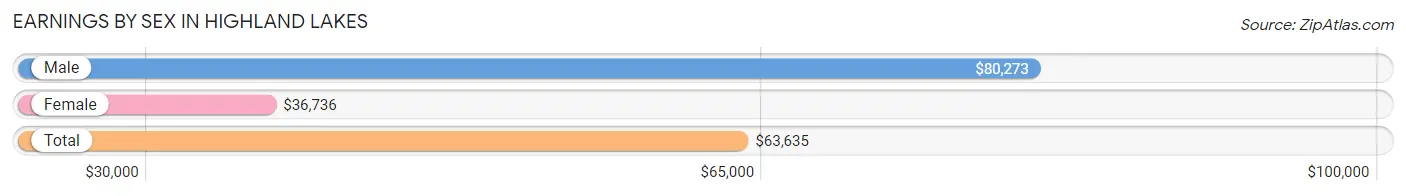
Earnings by Sex in Highland Lakes
Average Earnings in Highland Lakes are $63,635, $80,273 for men and $36,736 for women, a difference of 54.2%.
| Sex | Number | Average Earnings |
| Male | 1,892 (57.0%) | $80,273 |
| Female | 1,425 (43.0%) | $36,736 |
| Total | 3,317 (100.0%) | $63,635 |
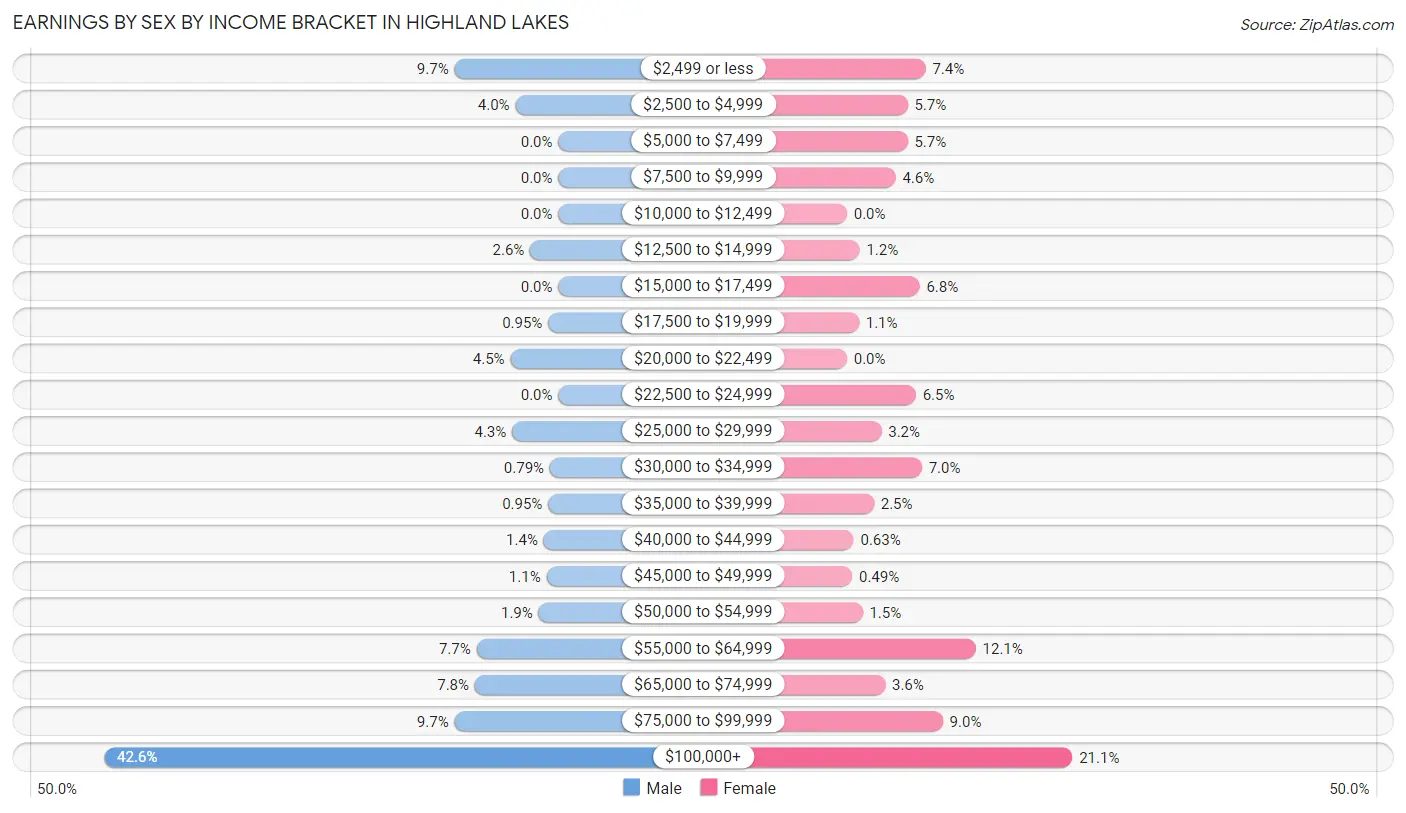
Earnings by Sex by Income Bracket in Highland Lakes
The most common earnings brackets in Highland Lakes are $100,000+ for men (805 | 42.5%) and $100,000+ for women (301 | 21.1%).
| Income | Male | Female |
| $2,499 or less | 184 (9.7%) | 105 (7.4%) |
| $2,500 to $4,999 | 76 (4.0%) | 81 (5.7%) |
| $5,000 to $7,499 | 0 (0.0%) | 81 (5.7%) |
| $7,500 to $9,999 | 0 (0.0%) | 65 (4.6%) |
| $10,000 to $12,499 | 0 (0.0%) | 0 (0.0%) |
| $12,500 to $14,999 | 50 (2.6%) | 17 (1.2%) |
| $15,000 to $17,499 | 0 (0.0%) | 97 (6.8%) |
| $17,500 to $19,999 | 18 (0.9%) | 16 (1.1%) |
| $20,000 to $22,499 | 85 (4.5%) | 0 (0.0%) |
| $22,500 to $24,999 | 0 (0.0%) | 92 (6.5%) |
| $25,000 to $29,999 | 82 (4.3%) | 46 (3.2%) |
| $30,000 to $34,999 | 15 (0.8%) | 100 (7.0%) |
| $35,000 to $39,999 | 18 (0.9%) | 36 (2.5%) |
| $40,000 to $44,999 | 26 (1.4%) | 9 (0.6%) |
| $45,000 to $49,999 | 21 (1.1%) | 7 (0.5%) |
| $50,000 to $54,999 | 35 (1.8%) | 21 (1.5%) |
| $55,000 to $64,999 | 145 (7.7%) | 172 (12.1%) |
| $65,000 to $74,999 | 148 (7.8%) | 51 (3.6%) |
| $75,000 to $99,999 | 184 (9.7%) | 128 (9.0%) |
| $100,000+ | 805 (42.5%) | 301 (21.1%) |
| Total | 1,892 (100.0%) | 1,425 (100.0%) |
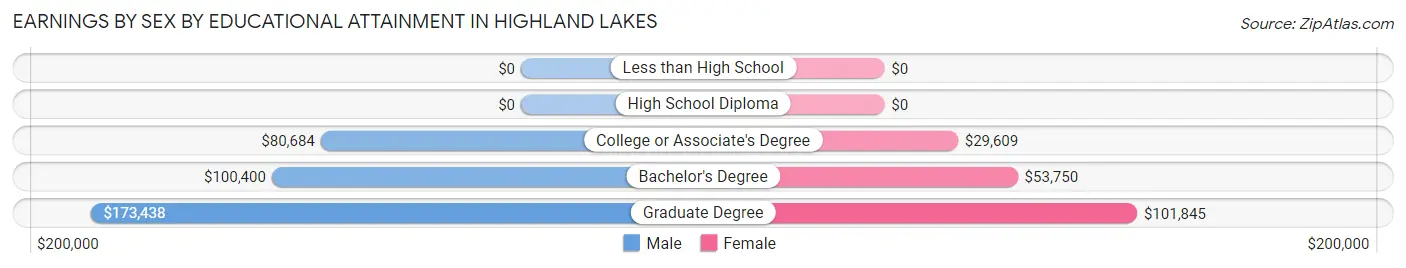
Earnings by Sex by Educational Attainment in Highland Lakes
Average earnings in Highland Lakes are $104,167 for men and $56,815 for women, a difference of 45.5%. Men with an educational attainment of graduate degree enjoy the highest average annual earnings of $173,438, while those with college or associate's degree education earn the least with $80,684. Women with an educational attainment of graduate degree earn the most with the average annual earnings of $101,845, while those with college or associate's degree education have the smallest earnings of $29,609.
| Educational Attainment | Male Income | Female Income |
| Less than High School | - | - |
| High School Diploma | - | - |
| College or Associate's Degree | $80,684 | $29,609 |
| Bachelor's Degree | $100,400 | $53,750 |
| Graduate Degree | $173,438 | $101,845 |
| Total | $104,167 | $56,815 |
Family Income in Highland Lakes
Family Income Brackets in Highland Lakes
According to the Highland Lakes family income data, there are 788 families falling into the $200,000+ income range, which is the most common income bracket and makes up 43.7% of all families.
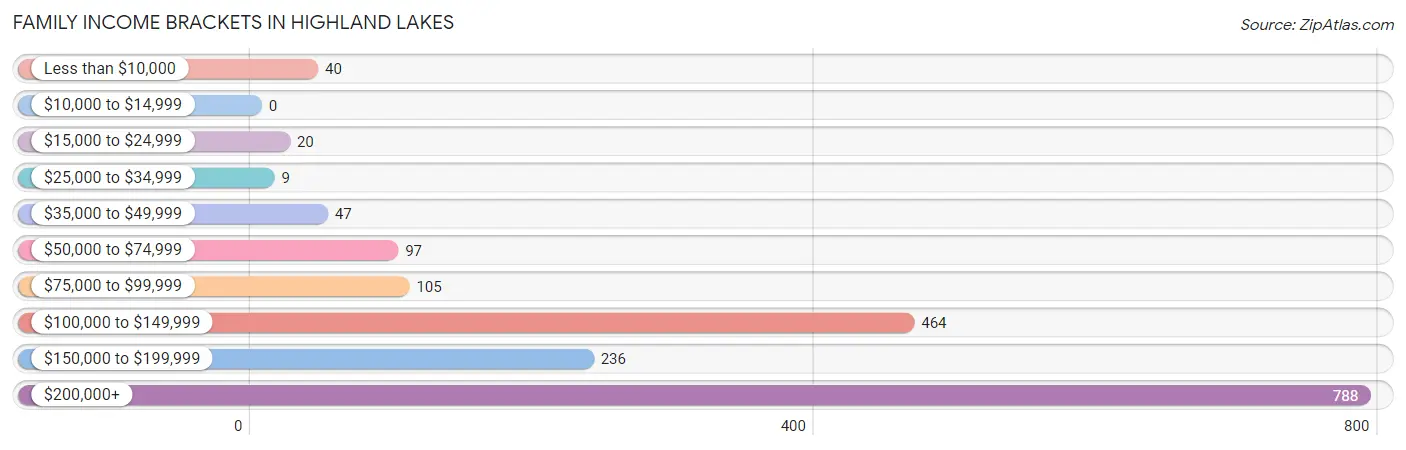
| Income Bracket | # Families | % Families |
| Less than $10,000 | 40 | 2.2% |
| $10,000 to $14,999 | 0 | 0.0% |
| $15,000 to $24,999 | 20 | 1.1% |
| $25,000 to $34,999 | 9 | 0.5% |
| $35,000 to $49,999 | 47 | 2.6% |
| $50,000 to $74,999 | 97 | 5.4% |
| $75,000 to $99,999 | 105 | 5.8% |
| $100,000 to $149,999 | 464 | 25.7% |
| $150,000 to $199,999 | 236 | 13.1% |
| $200,000+ | 788 | 43.7% |
Family Income by Famaliy Size in Highland Lakes
4-person families (484 | 26.8%) account for the highest median family income in Highland Lakes with $250,001 per family, while 2-person families (858 | 47.6%) have the highest median income of $79,118 per family member.
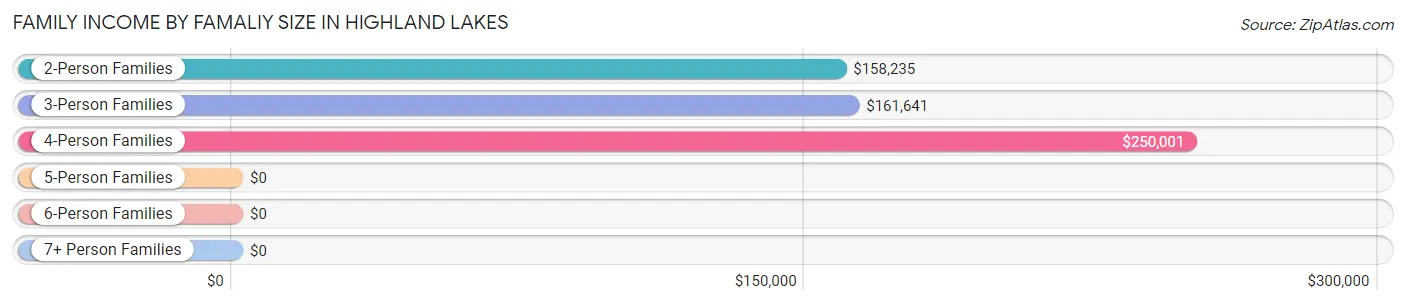
| Income Bracket | # Families | Median Income |
| 2-Person Families | 858 (47.6%) | $158,235 |
| 3-Person Families | 367 (20.3%) | $161,641 |
| 4-Person Families | 484 (26.8%) | $250,001 |
| 5-Person Families | 85 (4.7%) | $0 |
| 6-Person Families | 10 (0.5%) | $0 |
| 7+ Person Families | 0 (0.0%) | $0 |
| Total | 1,804 (100.0%) | $162,467 |
Family Income by Number of Earners in Highland Lakes
The median family income in Highland Lakes is $162,467, with families comprising 2 earners (731) having the highest median family income of $238,365, while families with no earners (181) have the lowest median family income of $120,125, accounting for 40.5% and 10.0% of families, respectively.
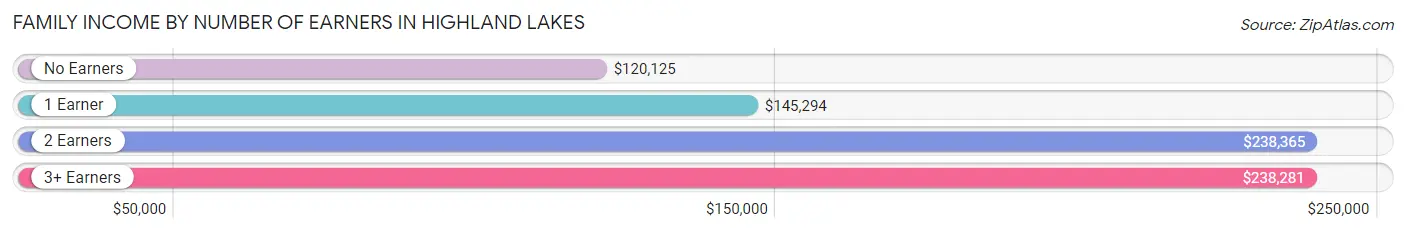
| Number of Earners | # Families | Median Income |
| No Earners | 181 (10.0%) | $120,125 |
| 1 Earner | 576 (31.9%) | $145,294 |
| 2 Earners | 731 (40.5%) | $238,365 |
| 3+ Earners | 316 (17.5%) | $238,281 |
| Total | 1,804 (100.0%) | $162,467 |
Household Income in Highland Lakes
Household Income Brackets in Highland Lakes
With 804 households falling in the category, the $200,000+ income range is the most frequent in Highland Lakes, accounting for 40.0% of all households. In contrast, only 8 households (0.4%) fall into the $25,000 to $34,999 income bracket, making it the least populous group.
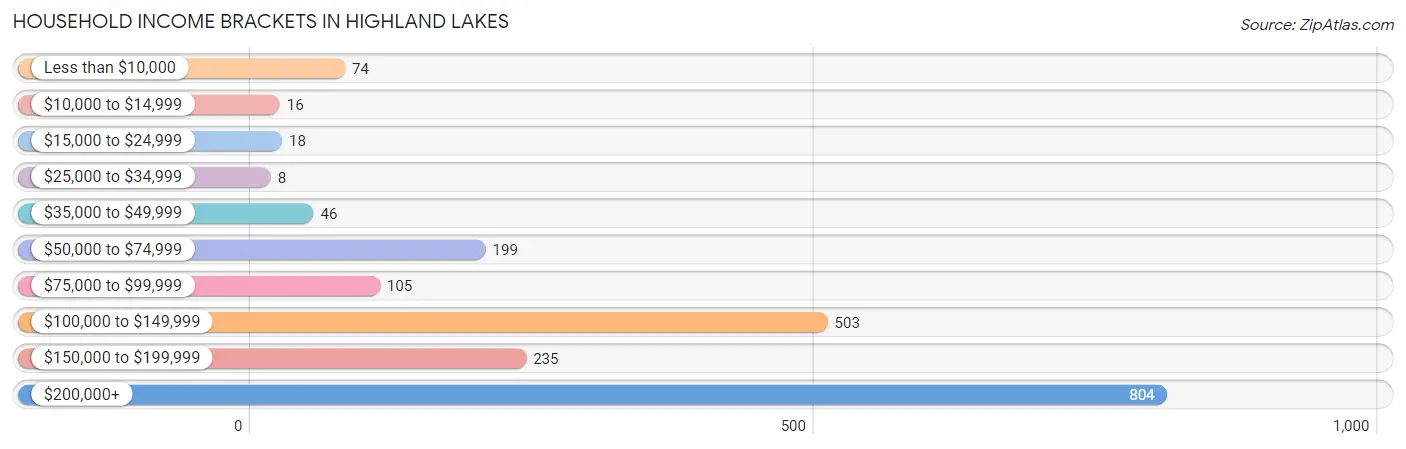
| Income Bracket | # Households | % Households |
| Less than $10,000 | 74 | 3.7% |
| $10,000 to $14,999 | 16 | 0.8% |
| $15,000 to $24,999 | 18 | 0.9% |
| $25,000 to $34,999 | 8 | 0.4% |
| $35,000 to $49,999 | 46 | 2.3% |
| $50,000 to $74,999 | 199 | 9.9% |
| $75,000 to $99,999 | 105 | 5.2% |
| $100,000 to $149,999 | 503 | 25.0% |
| $150,000 to $199,999 | 235 | 11.7% |
| $200,000+ | 804 | 40.0% |
Household Income by Householder Age in Highland Lakes
The median household income in Highland Lakes is $157,868, with the highest median household income of $209,777 found in the 25 to 44 years age bracket for the primary householder. A total of 393 households (19.5%) fall into this category.
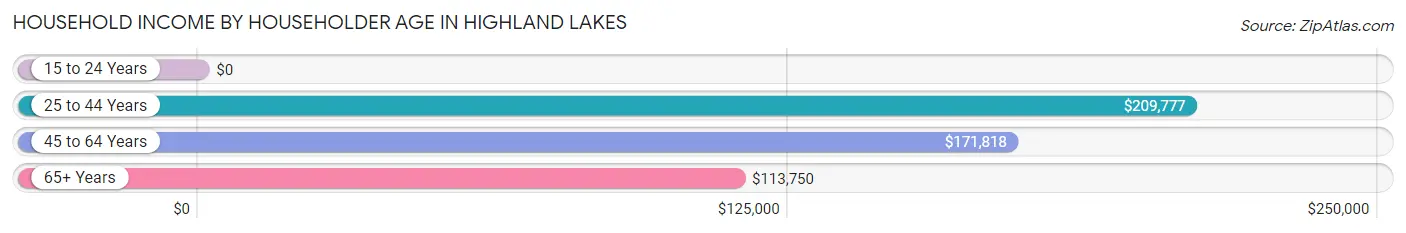
| Income Bracket | # Households | Median Income |
| 15 to 24 Years | 0 (0.0%) | $0 |
| 25 to 44 Years | 393 (19.5%) | $209,777 |
| 45 to 64 Years | 1,072 (53.3%) | $171,818 |
| 65+ Years | 546 (27.2%) | $113,750 |
| Total | 2,011 (100.0%) | $157,868 |
Poverty in Highland Lakes
Income Below Poverty by Sex and Age in Highland Lakes
With 2.2% poverty level for males and 5.4% for females among the residents of Highland Lakes, 55 to 64 year old males and 18 to 24 year old females are the most vulnerable to poverty, with 60 males (11.9%) and 26 females (18.2%) in their respective age groups living below the poverty level.
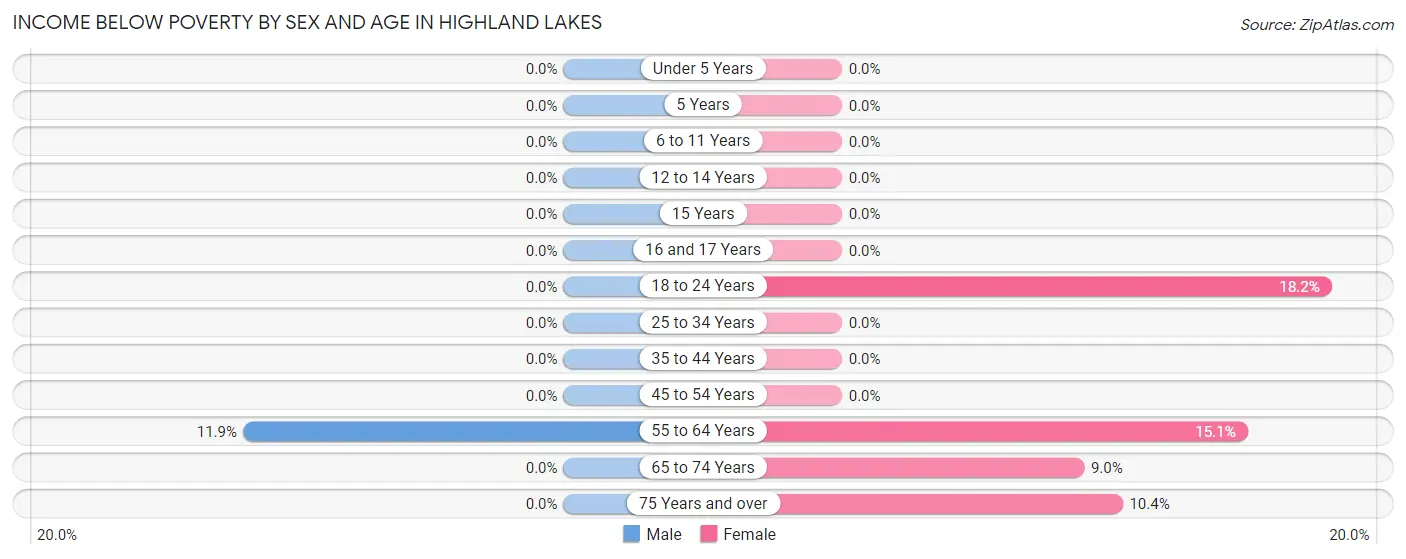
| Age Bracket | Male | Female |
| Under 5 Years | 0 (0.0%) | 0 (0.0%) |
| 5 Years | 0 (0.0%) | 0 (0.0%) |
| 6 to 11 Years | 0 (0.0%) | 0 (0.0%) |
| 12 to 14 Years | 0 (0.0%) | 0 (0.0%) |
| 15 Years | 0 (0.0%) | 0 (0.0%) |
| 16 and 17 Years | 0 (0.0%) | 0 (0.0%) |
| 18 to 24 Years | 0 (0.0%) | 26 (18.2%) |
| 25 to 34 Years | 0 (0.0%) | 0 (0.0%) |
| 35 to 44 Years | 0 (0.0%) | 0 (0.0%) |
| 45 to 54 Years | 0 (0.0%) | 0 (0.0%) |
| 55 to 64 Years | 60 (11.9%) | 78 (15.1%) |
| 65 to 74 Years | 0 (0.0%) | 31 (9.0%) |
| 75 Years and over | 0 (0.0%) | 20 (10.4%) |
| Total | 60 (2.2%) | 155 (5.4%) |
Income Above Poverty by Sex and Age in Highland Lakes
According to the poverty statistics in Highland Lakes, males aged under 5 years and females aged under 5 years are the age groups that are most secure financially, with 100.0% of males and 100.0% of females in these age groups living above the poverty line.
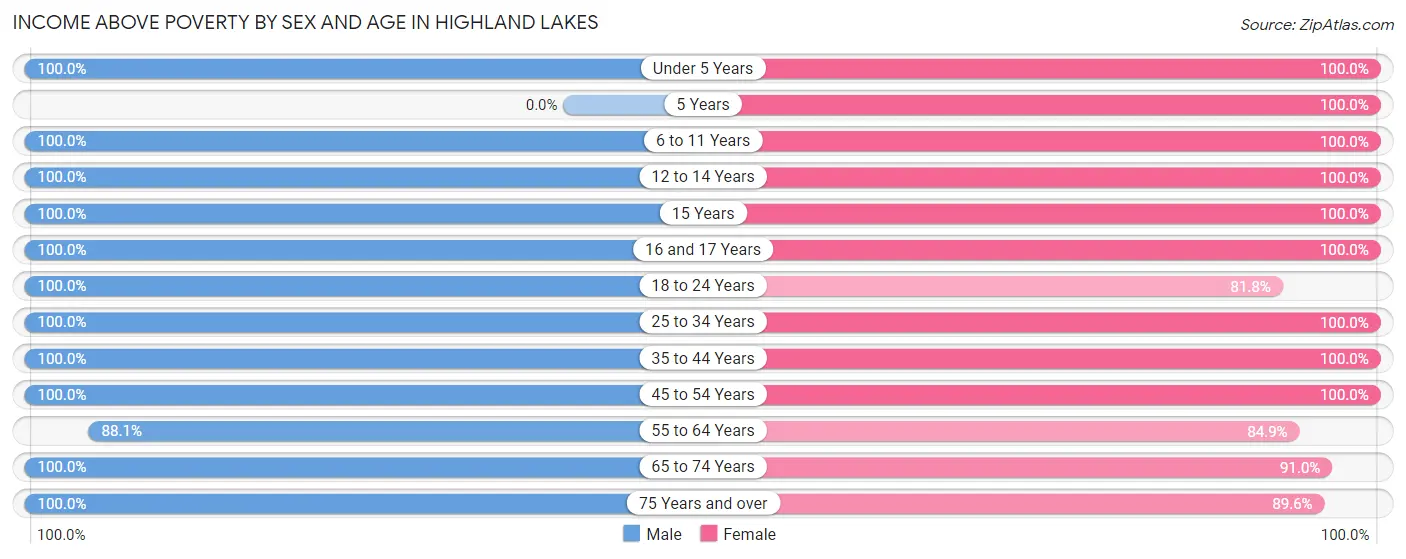
| Age Bracket | Male | Female |
| Under 5 Years | 32 (100.0%) | 107 (100.0%) |
| 5 Years | 0 (0.0%) | 15 (100.0%) |
| 6 to 11 Years | 272 (100.0%) | 248 (100.0%) |
| 12 to 14 Years | 43 (100.0%) | 131 (100.0%) |
| 15 Years | 17 (100.0%) | 11 (100.0%) |
| 16 and 17 Years | 33 (100.0%) | 108 (100.0%) |
| 18 to 24 Years | 338 (100.0%) | 117 (81.8%) |
| 25 to 34 Years | 159 (100.0%) | 176 (100.0%) |
| 35 to 44 Years | 298 (100.0%) | 381 (100.0%) |
| 45 to 54 Years | 488 (100.0%) | 504 (100.0%) |
| 55 to 64 Years | 444 (88.1%) | 440 (84.9%) |
| 65 to 74 Years | 402 (100.0%) | 314 (91.0%) |
| 75 Years and over | 163 (100.0%) | 172 (89.6%) |
| Total | 2,689 (97.8%) | 2,724 (94.6%) |
Income Below Poverty Among Married-Couple Families in Highland Lakes
The poverty statistics for married-couple families in Highland Lakes show that 3.4% or 58 of the total 1,693 families live below the poverty line. Families with no children have the highest poverty rate of 5.2%, comprising of 58 families. On the other hand, families with 1 or 2 children have the lowest poverty rate of 0.0%, which includes 0 families.
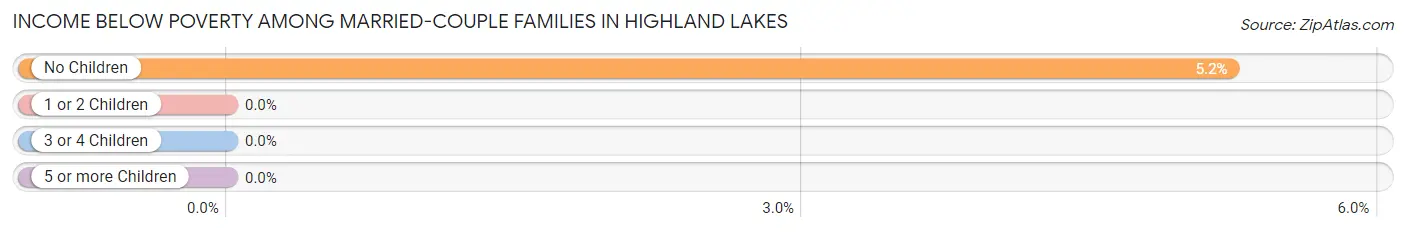
| Children | Above Poverty | Below Poverty |
| No Children | 1,052 (94.8%) | 58 (5.2%) |
| 1 or 2 Children | 488 (100.0%) | 0 (0.0%) |
| 3 or 4 Children | 95 (100.0%) | 0 (0.0%) |
| 5 or more Children | 0 (0.0%) | 0 (0.0%) |
| Total | 1,635 (96.6%) | 58 (3.4%) |
Income Below Poverty Among Single-Parent Households in Highland Lakes
| Children | Single Father | Single Mother |
| No Children | 0 (0.0%) | 0 (0.0%) |
| 1 or 2 Children | 0 (0.0%) | 0 (0.0%) |
| 3 or 4 Children | 0 (0.0%) | 0 (0.0%) |
| 5 or more Children | 0 (0.0%) | 0 (0.0%) |
| Total | 0 (0.0%) | 0 (0.0%) |
Income Below Poverty Among Married-Couple vs Single-Parent Households in Highland Lakes
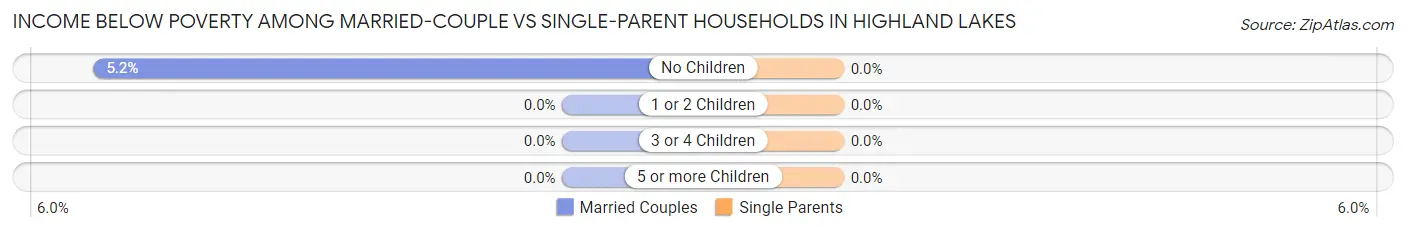
| Children | Married-Couple Families | Single-Parent Households |
| No Children | 58 (5.2%) | 0 (0.0%) |
| 1 or 2 Children | 0 (0.0%) | 0 (0.0%) |
| 3 or 4 Children | 0 (0.0%) | 0 (0.0%) |
| 5 or more Children | 0 (0.0%) | 0 (0.0%) |
| Total | 58 (3.4%) | 0 (0.0%) |
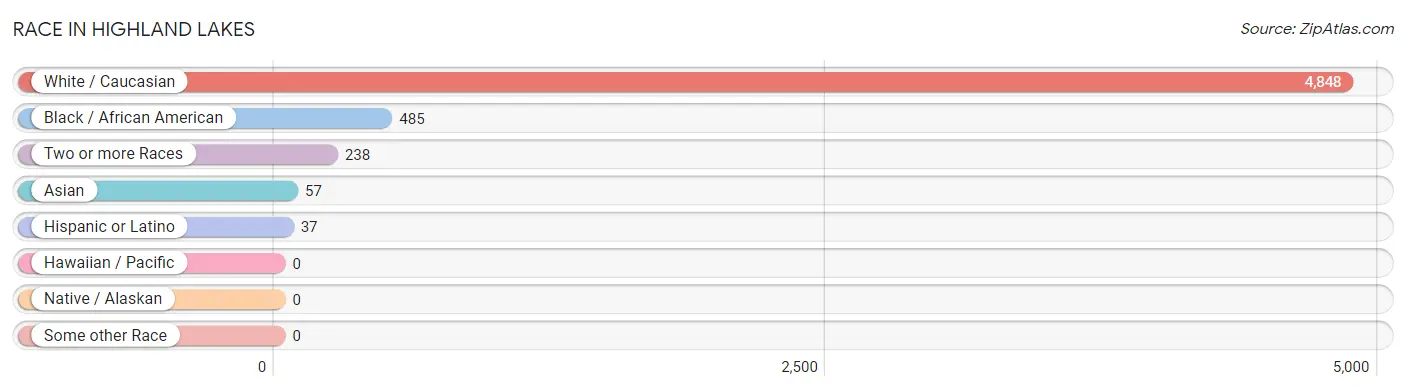
Race in Highland Lakes
The most populous races in Highland Lakes are White / Caucasian (4,848 | 86.1%), Black / African American (485 | 8.6%), and Two or more Races (238 | 4.2%).
| Race | # Population | % Population |
| Asian | 57 | 1.0% |
| Black / African American | 485 | 8.6% |
| Hawaiian / Pacific | 0 | 0.0% |
| Hispanic or Latino | 37 | 0.7% |
| Native / Alaskan | 0 | 0.0% |
| White / Caucasian | 4,848 | 86.1% |
| Two or more Races | 238 | 4.2% |
| Some other Race | 0 | 0.0% |
| Total | 5,628 | 100.0% |
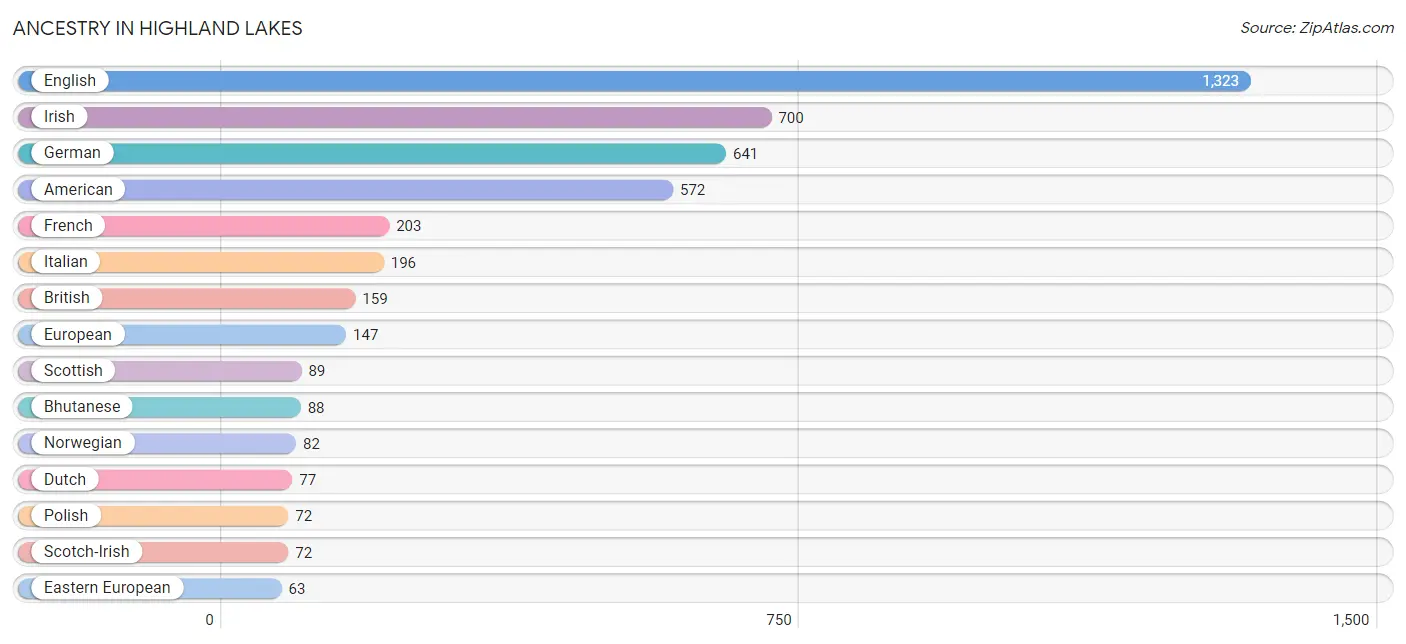
Ancestry in Highland Lakes
The most populous ancestries reported in Highland Lakes are English (1,323 | 23.5%), Irish (700 | 12.4%), German (641 | 11.4%), American (572 | 10.2%), and French (203 | 3.6%), together accounting for 61.1% of all Highland Lakes residents.
| Ancestry | # Population | % Population |
| African | 24 | 0.4% |
| American | 572 | 10.2% |
| Arab | 49 | 0.9% |
| Belgian | 19 | 0.3% |
| Bhutanese | 88 | 1.6% |
| British | 159 | 2.8% |
| Cape Verdean | 22 | 0.4% |
| Dutch | 77 | 1.4% |
| Eastern European | 63 | 1.1% |
| English | 1,323 | 23.5% |
| European | 147 | 2.6% |
| French | 203 | 3.6% |
| French Canadian | 22 | 0.4% |
| German | 641 | 11.4% |
| Indian (Asian) | 44 | 0.8% |
| Iranian | 15 | 0.3% |
| Irish | 700 | 12.4% |
| Italian | 196 | 3.5% |
| Norwegian | 82 | 1.5% |
| Polish | 72 | 1.3% |
| Portuguese | 39 | 0.7% |
| Scandinavian | 6 | 0.1% |
| Scotch-Irish | 72 | 1.3% |
| Scottish | 89 | 1.6% |
| South African | 39 | 0.7% |
| Spaniard | 17 | 0.3% |
| Subsaharan African | 63 | 1.1% |
| Swedish | 16 | 0.3% |
| Syrian | 49 | 0.9% |
| Ukrainian | 56 | 1.0% | View All 30 Rows |
Immigrants in Highland Lakes
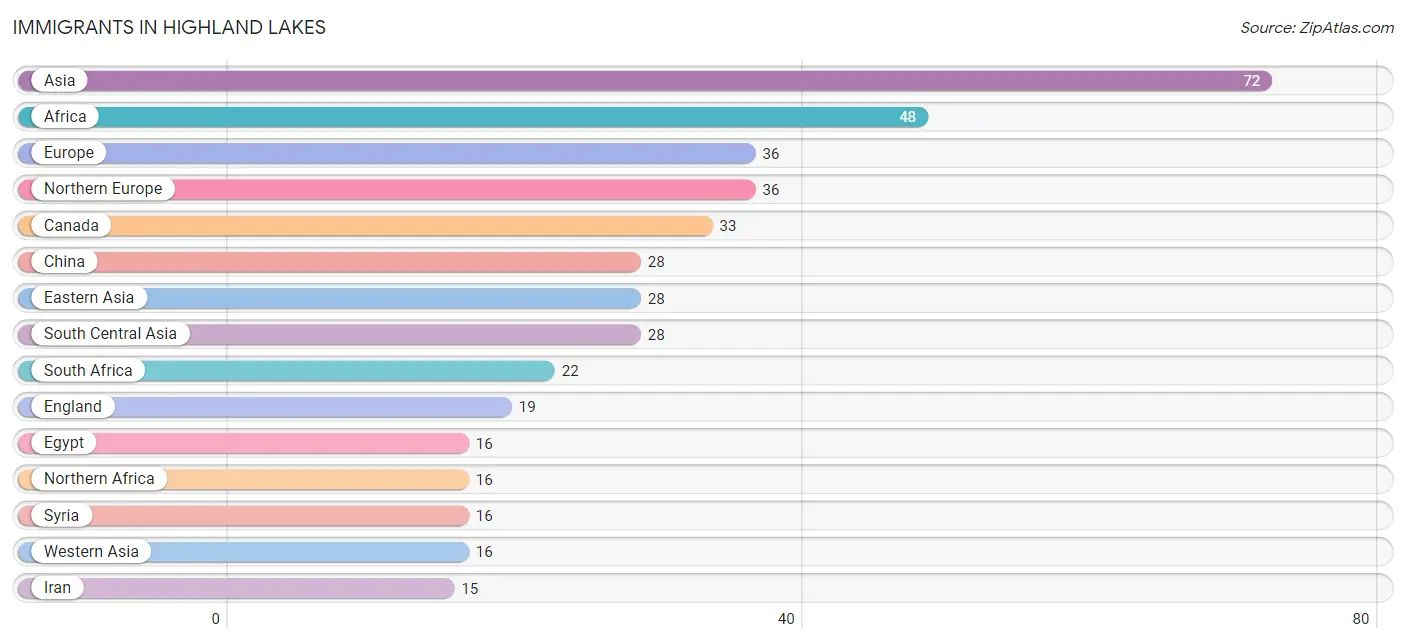
The most numerous immigrant groups reported in Highland Lakes came from Asia (72 | 1.3%), Africa (48 | 0.9%), Europe (36 | 0.6%), Northern Europe (36 | 0.6%), and Canada (33 | 0.6%), together accounting for 4.0% of all Highland Lakes residents.
| Immigration Origin | # Population | % Population |
| Africa | 48 | 0.9% |
| Asia | 72 | 1.3% |
| Cameroon | 10 | 0.2% |
| Canada | 33 | 0.6% |
| China | 28 | 0.5% |
| Eastern Asia | 28 | 0.5% |
| Egypt | 16 | 0.3% |
| England | 19 | 0.3% |
| Europe | 36 | 0.6% |
| Iran | 15 | 0.3% |
| Middle Africa | 10 | 0.2% |
| Northern Africa | 16 | 0.3% |
| Northern Europe | 36 | 0.6% |
| South Africa | 22 | 0.4% |
| South Central Asia | 28 | 0.5% |
| Sri Lanka | 13 | 0.2% |
| Syria | 16 | 0.3% |
| Western Asia | 16 | 0.3% | View All 18 Rows |
Sex and Age in Highland Lakes
Sex and Age in Highland Lakes
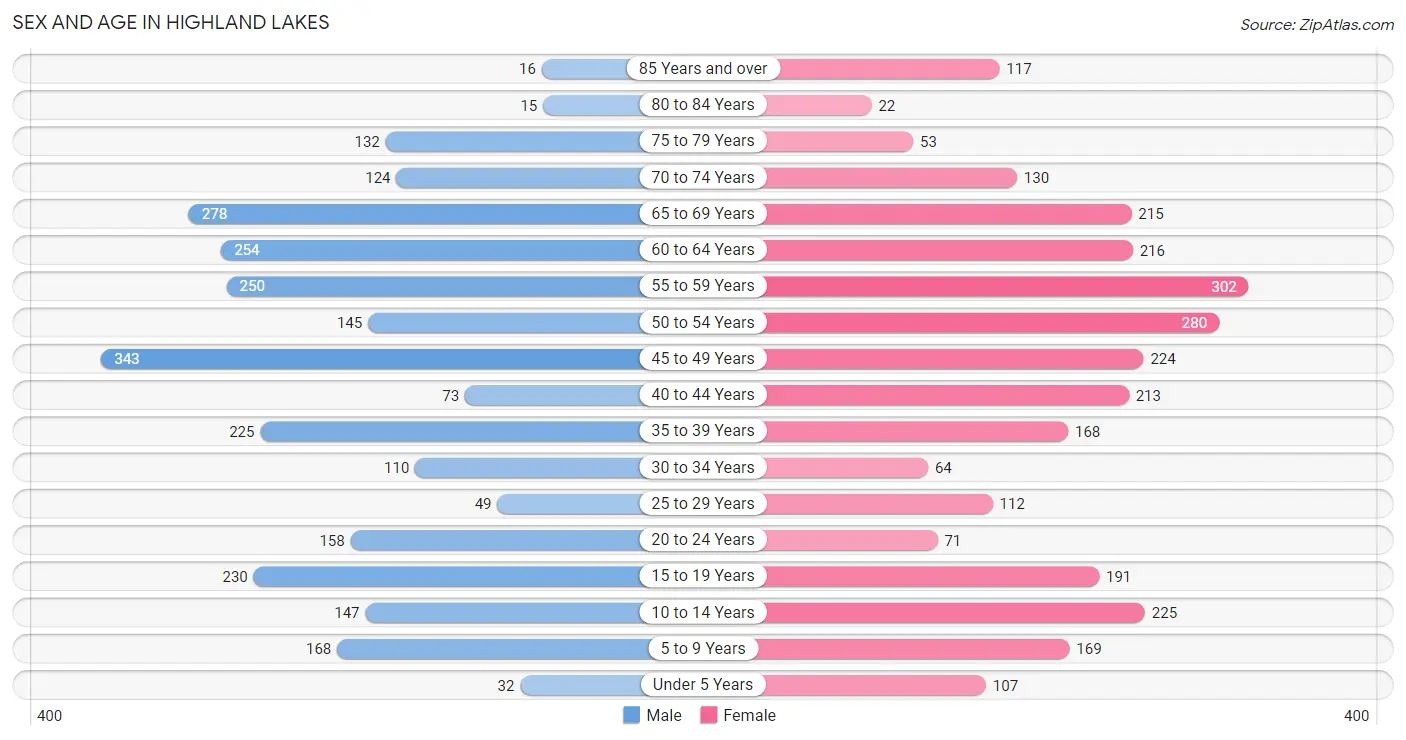
The most populous age groups in Highland Lakes are 45 to 49 Years (343 | 12.5%) for men and 55 to 59 Years (302 | 10.5%) for women.
| Age Bracket | Male | Female |
| Under 5 Years | 32 (1.2%) | 107 (3.7%) |
| 5 to 9 Years | 168 (6.1%) | 169 (5.9%) |
| 10 to 14 Years | 147 (5.3%) | 225 (7.8%) |
| 15 to 19 Years | 230 (8.4%) | 191 (6.6%) |
| 20 to 24 Years | 158 (5.8%) | 71 (2.5%) |
| 25 to 29 Years | 49 (1.8%) | 112 (3.9%) |
| 30 to 34 Years | 110 (4.0%) | 64 (2.2%) |
| 35 to 39 Years | 225 (8.2%) | 168 (5.8%) |
| 40 to 44 Years | 73 (2.7%) | 213 (7.4%) |
| 45 to 49 Years | 343 (12.5%) | 224 (7.8%) |
| 50 to 54 Years | 145 (5.3%) | 280 (9.7%) |
| 55 to 59 Years | 250 (9.1%) | 302 (10.5%) |
| 60 to 64 Years | 254 (9.2%) | 216 (7.5%) |
| 65 to 69 Years | 278 (10.1%) | 215 (7.5%) |
| 70 to 74 Years | 124 (4.5%) | 130 (4.5%) |
| 75 to 79 Years | 132 (4.8%) | 53 (1.8%) |
| 80 to 84 Years | 15 (0.5%) | 22 (0.8%) |
| 85 Years and over | 16 (0.6%) | 117 (4.1%) |
| Total | 2,749 (100.0%) | 2,879 (100.0%) |
Families and Households in Highland Lakes
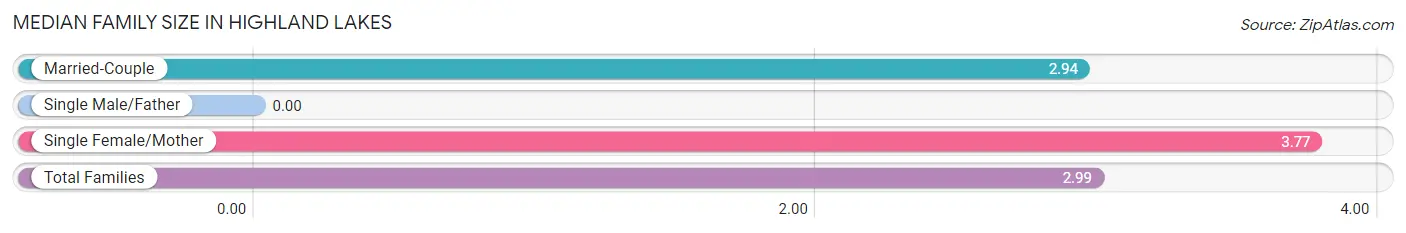
Median Family Size in Highland Lakes
| Family Type | # Families | Family Size |
| Married-Couple | 1,693 (93.9%) | 2.94 |
| Single Male/Father | 0 (0.0%) | - |
| Single Female/Mother | 111 (6.1%) | 3.77 |
| Total Families | 1,804 (100.0%) | 2.99 |
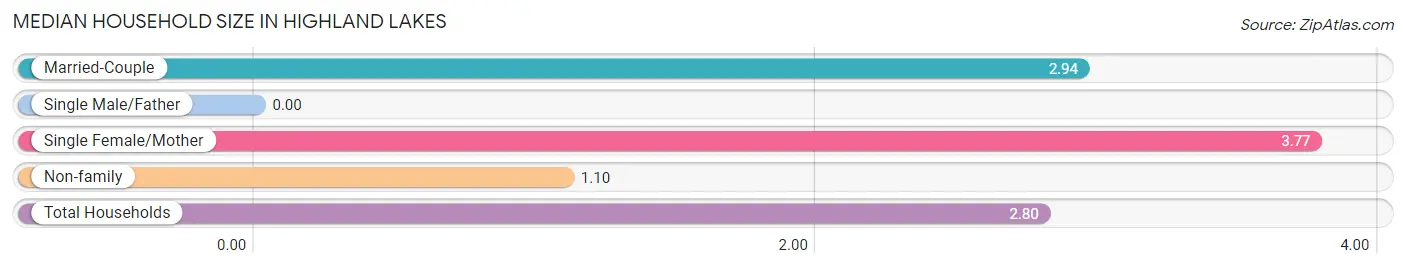
Median Household Size in Highland Lakes
| Household Type | # Households | Household Size |
| Married-Couple | 1,693 (84.2%) | 2.94 |
| Single Male/Father | 0 (0.0%) | - |
| Single Female/Mother | 111 (5.5%) | 3.77 |
| Non-family | 207 (10.3%) | 1.10 |
| Total Households | 2,011 (100.0%) | 2.80 |
Household Size by Marriage Status in Highland Lakes
Out of a total of 2,011 households in Highland Lakes, 1,804 (89.7%) are family households, while 207 (10.3%) are nonfamily households. The most numerous type of family households are 2-person households, comprising 858, and the most common type of nonfamily households are 1-person households, comprising 192.
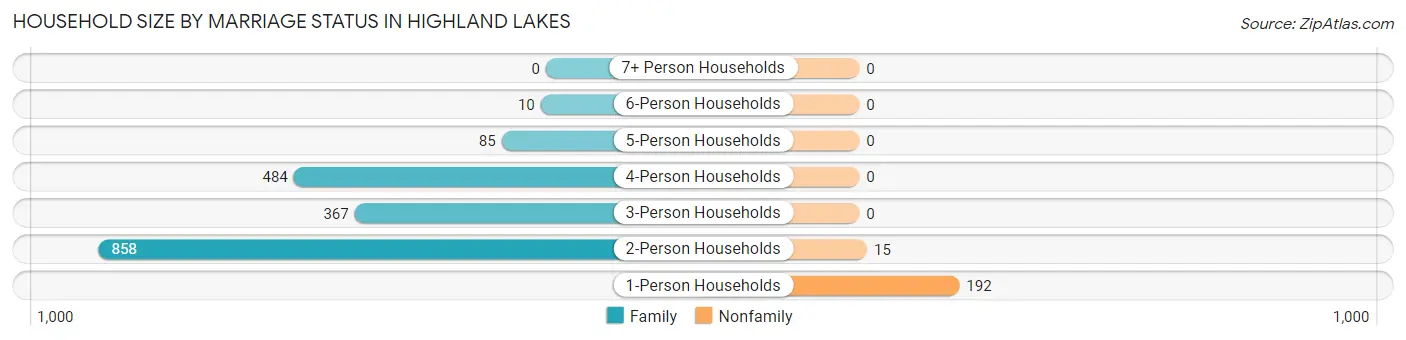
| Household Size | Family Households | Nonfamily Households |
| 1-Person Households | - | 192 (9.6%) |
| 2-Person Households | 858 (42.7%) | 15 (0.7%) |
| 3-Person Households | 367 (18.2%) | 0 (0.0%) |
| 4-Person Households | 484 (24.1%) | 0 (0.0%) |
| 5-Person Households | 85 (4.2%) | 0 (0.0%) |
| 6-Person Households | 10 (0.5%) | 0 (0.0%) |
| 7+ Person Households | 0 (0.0%) | 0 (0.0%) |
| Total | 1,804 (89.7%) | 207 (10.3%) |
Female Fertility in Highland Lakes
Fertility by Age in Highland Lakes
Average fertility rate in Highland Lakes is 28.0 births per 1,000 women. Women in the age bracket of 35 to 50 years have the highest fertility rate with 37.0 births per 1,000 women. Women in the age bracket of 35 to 50 years acount for 76.7% of all women with births.
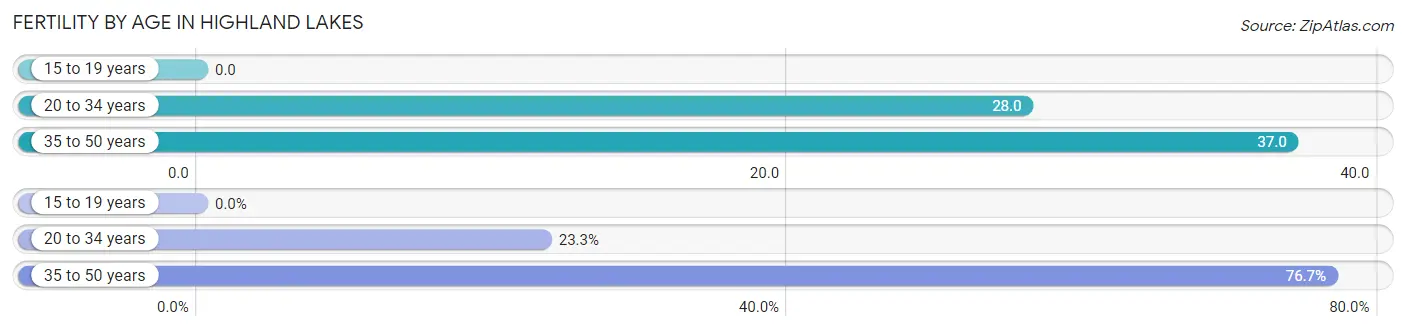
| Age Bracket | Women with Births | Births / 1,000 Women |
| 15 to 19 years | 0 (0.0%) | 0.0 |
| 20 to 34 years | 7 (23.3%) | 28.0 |
| 35 to 50 years | 23 (76.7%) | 37.0 |
| Total | 30 (100.0%) | 28.0 |
Fertility by Age by Marriage Status in Highland Lakes
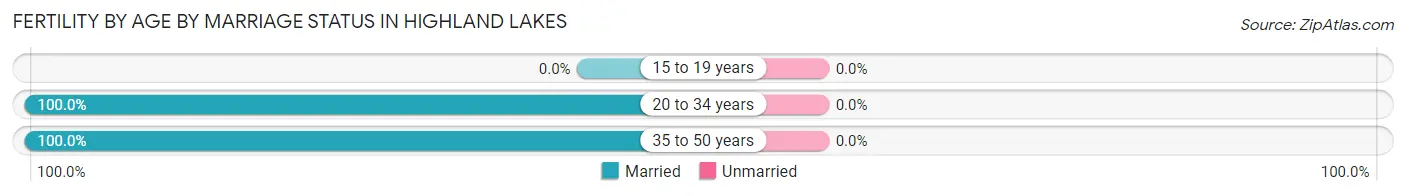
| Age Bracket | Married | Unmarried |
| 15 to 19 years | 0 (0.0%) | 0 (0.0%) |
| 20 to 34 years | 7 (100.0%) | 0 (0.0%) |
| 35 to 50 years | 23 (100.0%) | 0 (0.0%) |
| Total | 30 (100.0%) | 0 (0.0%) |
Fertility by Education in Highland Lakes
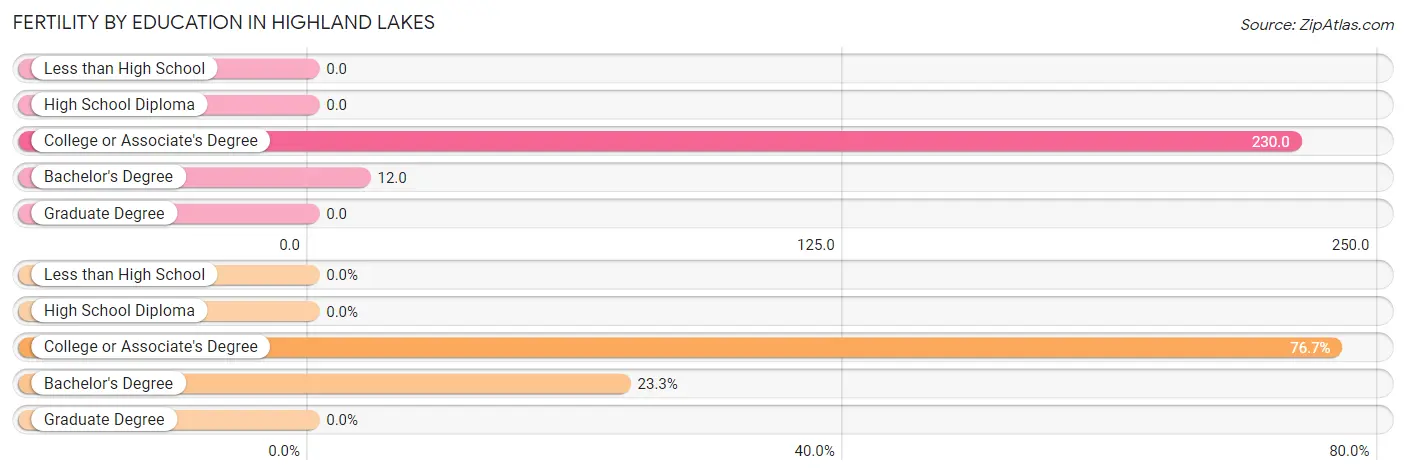
| Educational Attainment | Women with Births | Births / 1,000 Women |
| Less than High School | 0 (0.0%) | 0.0 |
| High School Diploma | 0 (0.0%) | 0.0 |
| College or Associate's Degree | 23 (76.7%) | 230.0 |
| Bachelor's Degree | 7 (23.3%) | 12.0 |
| Graduate Degree | 0 (0.0%) | 0.0 |
| Total | 30 (100.0%) | 28.0 |
Fertility by Education by Marriage Status in Highland Lakes
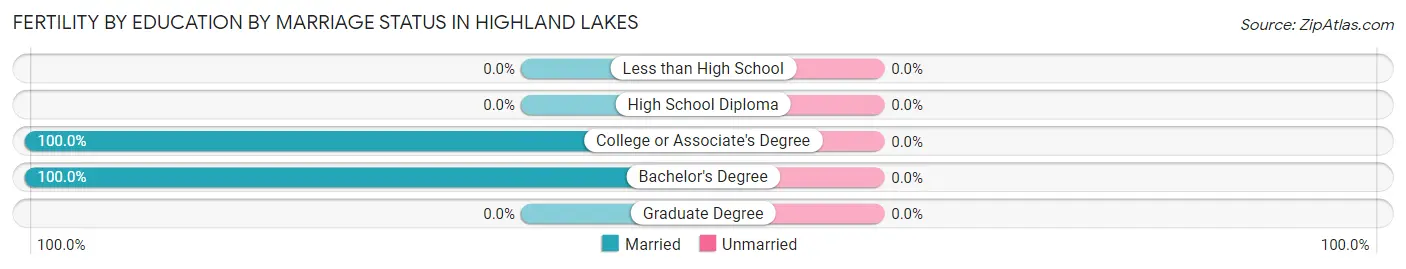
| Educational Attainment | Married | Unmarried |
| Less than High School | 0 (0.0%) | 0 (0.0%) |
| High School Diploma | 0 (0.0%) | 0 (0.0%) |
| College or Associate's Degree | 23 (100.0%) | 0 (0.0%) |
| Bachelor's Degree | 7 (100.0%) | 0 (0.0%) |
| Graduate Degree | 0 (0.0%) | 0 (0.0%) |
| Total | 30 (100.0%) | 0 (0.0%) |
Employment Characteristics in Highland Lakes
Employment by Class of Employer in Highland Lakes
Among the 3,051 employed individuals in Highland Lakes, private company employees (2,121 | 69.5%), self-employed (incorporated) (225 | 7.4%), and not-for-profit organizations (213 | 7.0%) make up the most common classes of employment.
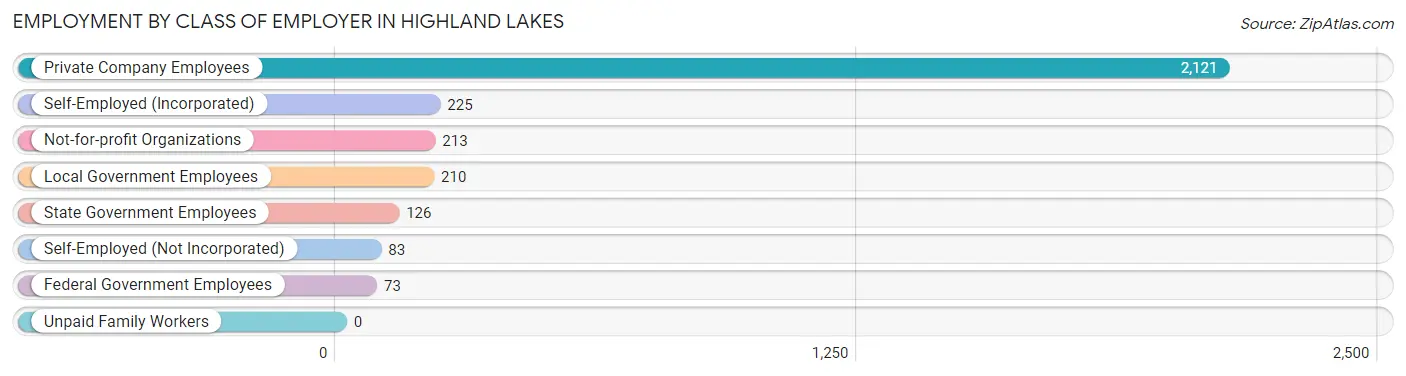
| Employer Class | # Employees | % Employees |
| Private Company Employees | 2,121 | 69.5% |
| Self-Employed (Incorporated) | 225 | 7.4% |
| Self-Employed (Not Incorporated) | 83 | 2.7% |
| Not-for-profit Organizations | 213 | 7.0% |
| Local Government Employees | 210 | 6.9% |
| State Government Employees | 126 | 4.1% |
| Federal Government Employees | 73 | 2.4% |
| Unpaid Family Workers | 0 | 0.0% |
| Total | 3,051 | 100.0% |
Employment Status by Age in Highland Lakes
According to the labor force statistics for Highland Lakes, out of the total population over 16 years of age (4,752), 66.6% or 3,165 individuals are in the labor force, with 2.8% or 89 of them unemployed. The age group with the highest labor force participation rate is 45 to 54 years, with 93.8% or 930 individuals in the labor force. Within the labor force, the 20 to 24 years age range has the highest percentage of unemployed individuals, with 24.0% or 25 of them being unemployed.
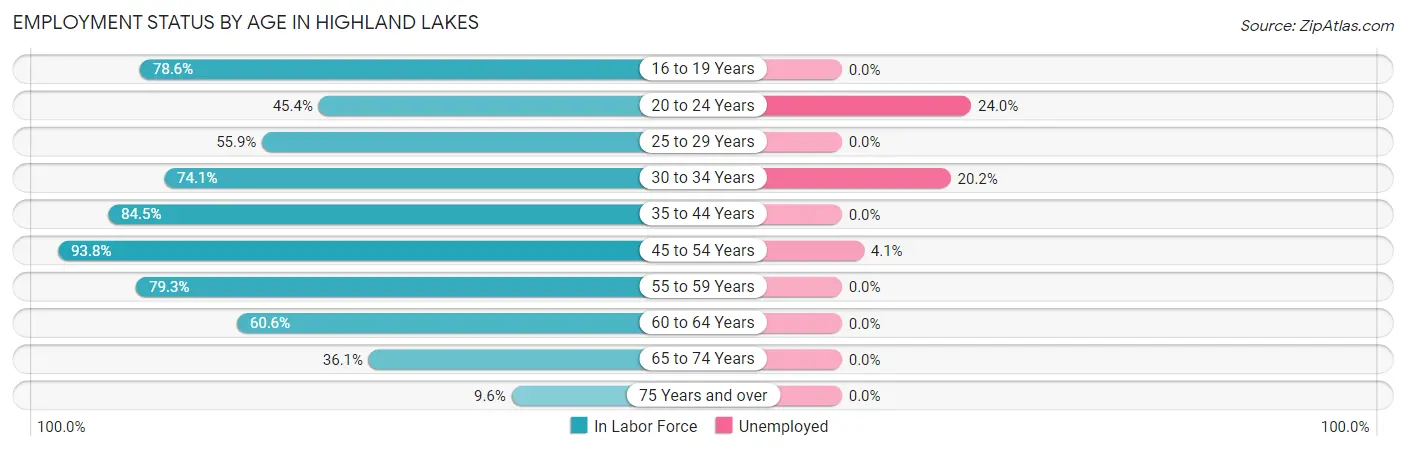
| Age Bracket | In Labor Force | Unemployed |
| 16 to 19 Years | 309 (78.6%) | 0 (0.0%) |
| 20 to 24 Years | 104 (45.4%) | 25 (24.0%) |
| 25 to 29 Years | 90 (55.9%) | 0 (0.0%) |
| 30 to 34 Years | 129 (74.1%) | 26 (20.2%) |
| 35 to 44 Years | 574 (84.5%) | 0 (0.0%) |
| 45 to 54 Years | 930 (93.8%) | 38 (4.1%) |
| 55 to 59 Years | 438 (79.3%) | 0 (0.0%) |
| 60 to 64 Years | 285 (60.6%) | 0 (0.0%) |
| 65 to 74 Years | 270 (36.1%) | 0 (0.0%) |
| 75 Years and over | 34 (9.6%) | 0 (0.0%) |
| Total | 3,165 (66.6%) | 89 (2.8%) |
Employment Status by Educational Attainment in Highland Lakes
According to labor force statistics for Highland Lakes, 80.8% of individuals (2,447) out of the total population between 25 and 64 years of age (3,028) are in the labor force, with 2.6% or 64 of them being unemployed. The group with the highest labor force participation rate are those with the educational attainment of bachelor's degree or higher, with 84.2% or 1,974 individuals in the labor force. Within the labor force, individuals with college / associate degree education have the highest percentage of unemployment, with 6.2% or 26 of them being unemployed.
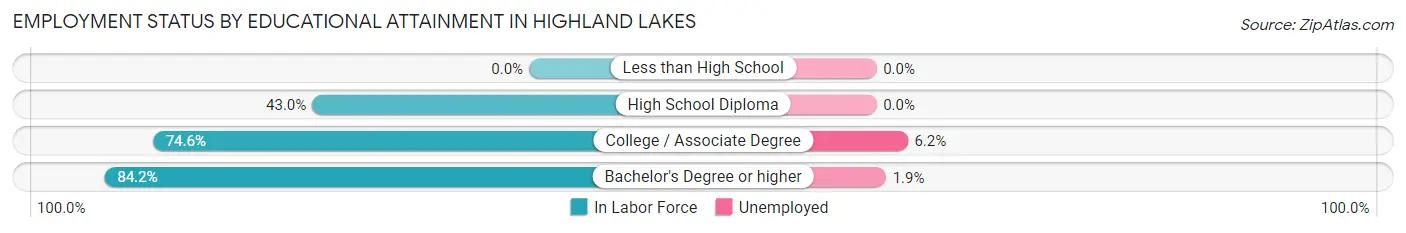
| Educational Attainment | In Labor Force | Unemployed |
| Less than High School | 0 (0.0%) | 0 (0.0%) |
| High School Diploma | 52 (43.0%) | 0 (0.0%) |
| College / Associate Degree | 420 (74.6%) | 35 (6.2%) |
| Bachelor's Degree or higher | 1,974 (84.2%) | 45 (1.9%) |
| Total | 2,447 (80.8%) | 79 (2.6%) |
Employment Occupations by Sex in Highland Lakes
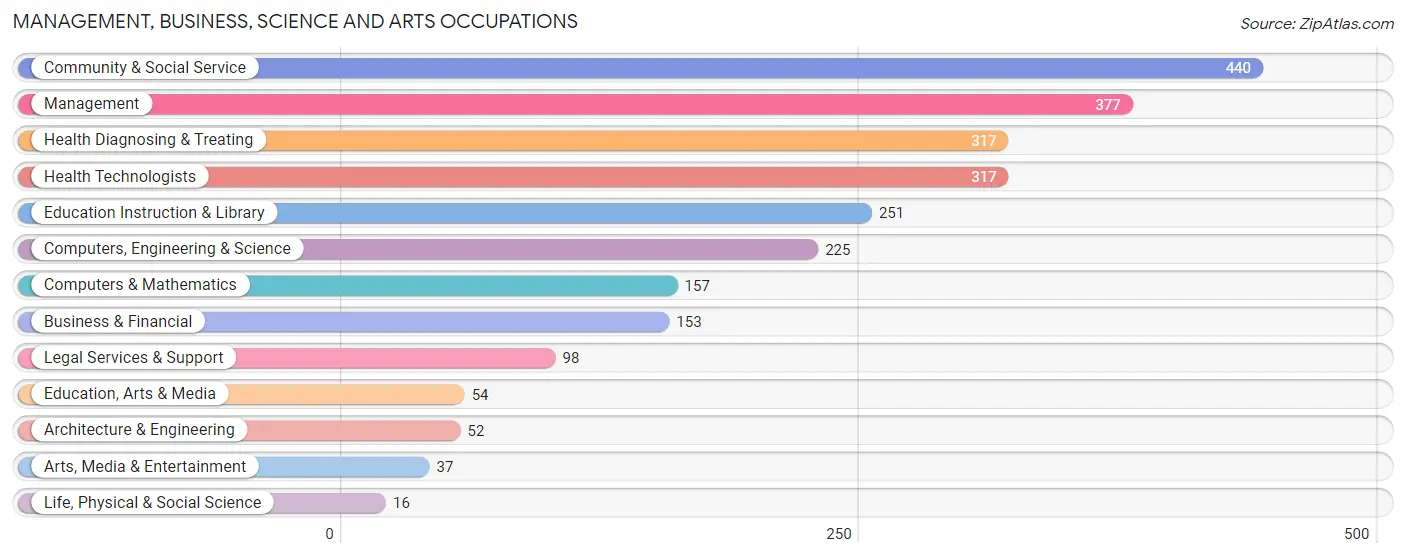
Management, Business, Science and Arts Occupations
The most common Management, Business, Science and Arts occupations in Highland Lakes are Community & Social Service (440 | 14.3%), Management (377 | 12.3%), Health Diagnosing & Treating (317 | 10.3%), Health Technologists (317 | 10.3%), and Education Instruction & Library (251 | 8.2%).
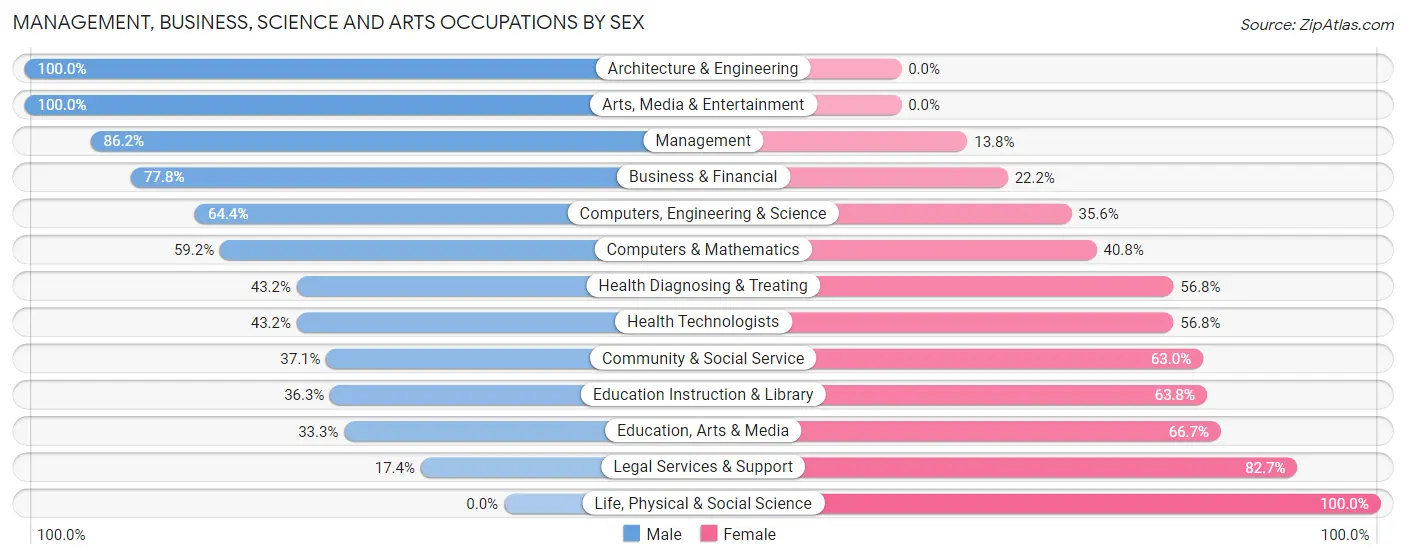
Management, Business, Science and Arts Occupations by Sex
Within the Management, Business, Science and Arts occupations in Highland Lakes, the most male-oriented occupations are Architecture & Engineering (100.0%), Arts, Media & Entertainment (100.0%), and Management (86.2%), while the most female-oriented occupations are Life, Physical & Social Science (100.0%), Legal Services & Support (82.7%), and Education, Arts & Media (66.7%).
| Occupation | Male | Female |
| Management | 325 (86.2%) | 52 (13.8%) |
| Business & Financial | 119 (77.8%) | 34 (22.2%) |
| Computers, Engineering & Science | 145 (64.4%) | 80 (35.6%) |
| Computers & Mathematics | 93 (59.2%) | 64 (40.8%) |
| Architecture & Engineering | 52 (100.0%) | 0 (0.0%) |
| Life, Physical & Social Science | 0 (0.0%) | 16 (100.0%) |
| Community & Social Service | 163 (37.0%) | 277 (62.9%) |
| Education, Arts & Media | 18 (33.3%) | 36 (66.7%) |
| Legal Services & Support | 17 (17.3%) | 81 (82.7%) |
| Education Instruction & Library | 91 (36.2%) | 160 (63.7%) |
| Arts, Media & Entertainment | 37 (100.0%) | 0 (0.0%) |
| Health Diagnosing & Treating | 137 (43.2%) | 180 (56.8%) |
| Health Technologists | 137 (43.2%) | 180 (56.8%) |
| Total (Category) | 889 (58.8%) | 623 (41.2%) |
| Total (Overall) | 1,752 (57.0%) | 1,322 (43.0%) |
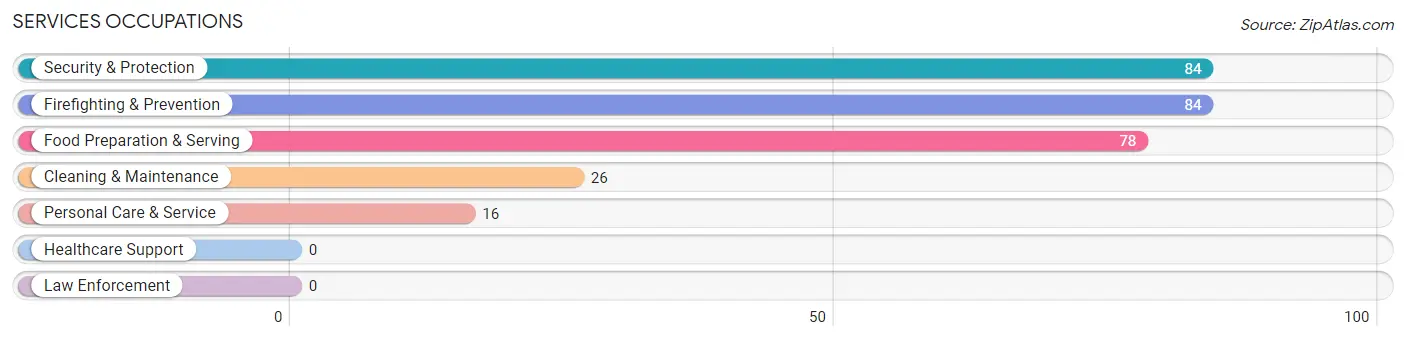
Services Occupations
The most common Services occupations in Highland Lakes are Security & Protection (84 | 2.7%), Firefighting & Prevention (84 | 2.7%), Food Preparation & Serving (78 | 2.5%), Cleaning & Maintenance (26 | 0.9%), and Personal Care & Service (16 | 0.5%).
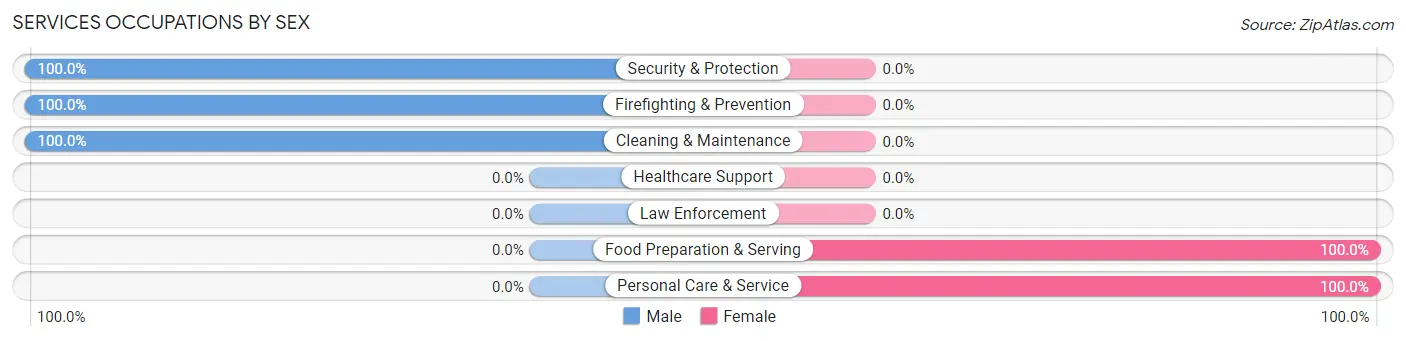
Services Occupations by Sex
Within the Services occupations in Highland Lakes, the most male-oriented occupations are Security & Protection (100.0%), Firefighting & Prevention (100.0%), and Cleaning & Maintenance (100.0%), while the most female-oriented occupations are Food Preparation & Serving (100.0%), and Personal Care & Service (100.0%).
| Occupation | Male | Female |
| Healthcare Support | 0 (0.0%) | 0 (0.0%) |
| Security & Protection | 84 (100.0%) | 0 (0.0%) |
| Firefighting & Prevention | 84 (100.0%) | 0 (0.0%) |
| Law Enforcement | 0 (0.0%) | 0 (0.0%) |
| Food Preparation & Serving | 0 (0.0%) | 78 (100.0%) |
| Cleaning & Maintenance | 26 (100.0%) | 0 (0.0%) |
| Personal Care & Service | 0 (0.0%) | 16 (100.0%) |
| Total (Category) | 110 (53.9%) | 94 (46.1%) |
| Total (Overall) | 1,752 (57.0%) | 1,322 (43.0%) |
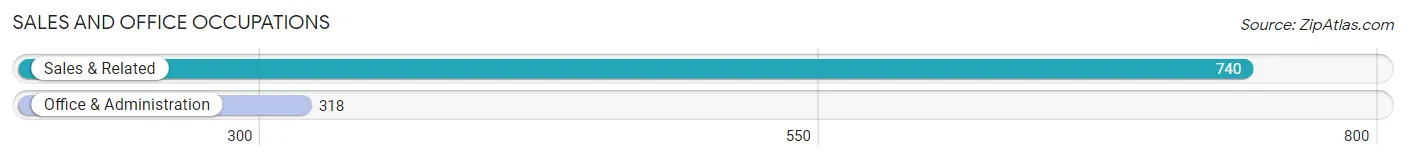
Sales and Office Occupations
The most common Sales and Office occupations in Highland Lakes are Sales & Related (740 | 24.1%), and Office & Administration (318 | 10.3%).
Sales and Office Occupations by Sex
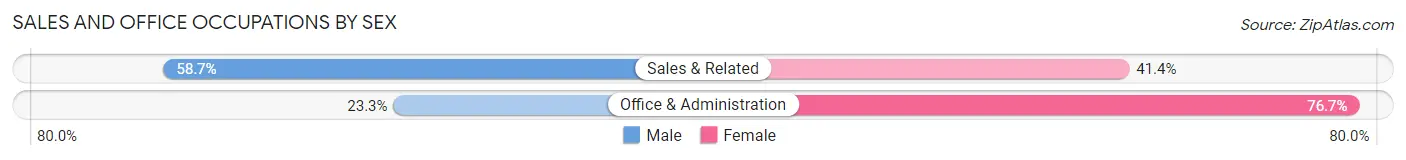
| Occupation | Male | Female |
| Sales & Related | 434 (58.7%) | 306 (41.3%) |
| Office & Administration | 74 (23.3%) | 244 (76.7%) |
| Total (Category) | 508 (48.0%) | 550 (52.0%) |
| Total (Overall) | 1,752 (57.0%) | 1,322 (43.0%) |
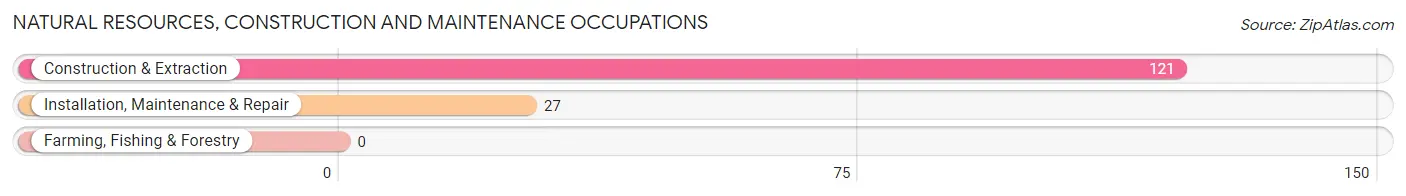
Natural Resources, Construction and Maintenance Occupations
The most common Natural Resources, Construction and Maintenance occupations in Highland Lakes are Construction & Extraction (121 | 3.9%), and Installation, Maintenance & Repair (27 | 0.9%).
Natural Resources, Construction and Maintenance Occupations by Sex
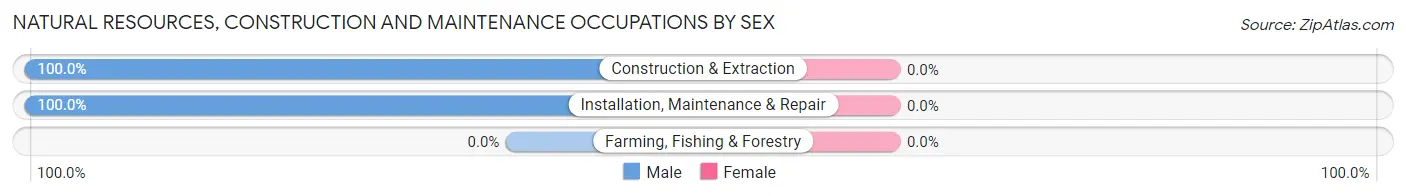
| Occupation | Male | Female |
| Farming, Fishing & Forestry | 0 (0.0%) | 0 (0.0%) |
| Construction & Extraction | 121 (100.0%) | 0 (0.0%) |
| Installation, Maintenance & Repair | 27 (100.0%) | 0 (0.0%) |
| Total (Category) | 148 (100.0%) | 0 (0.0%) |
| Total (Overall) | 1,752 (57.0%) | 1,322 (43.0%) |
Production, Transportation and Moving Occupations
The most common Production, Transportation and Moving occupations in Highland Lakes are Transportation (121 | 3.9%), and Production (31 | 1.0%).
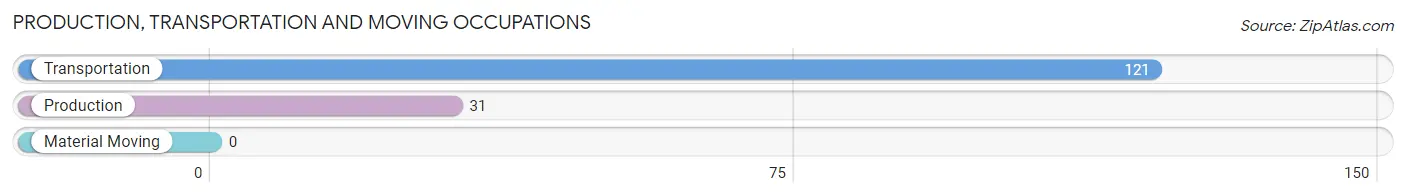
Production, Transportation and Moving Occupations by Sex
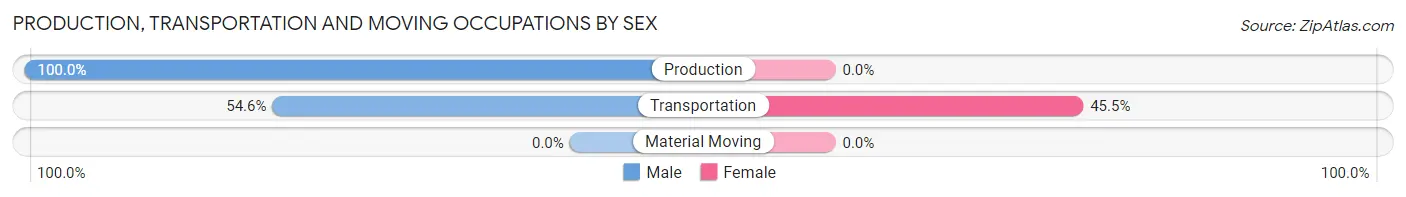
| Occupation | Male | Female |
| Production | 31 (100.0%) | 0 (0.0%) |
| Transportation | 66 (54.5%) | 55 (45.5%) |
| Material Moving | 0 (0.0%) | 0 (0.0%) |
| Total (Category) | 97 (63.8%) | 55 (36.2%) |
| Total (Overall) | 1,752 (57.0%) | 1,322 (43.0%) |
Employment Industries by Sex in Highland Lakes
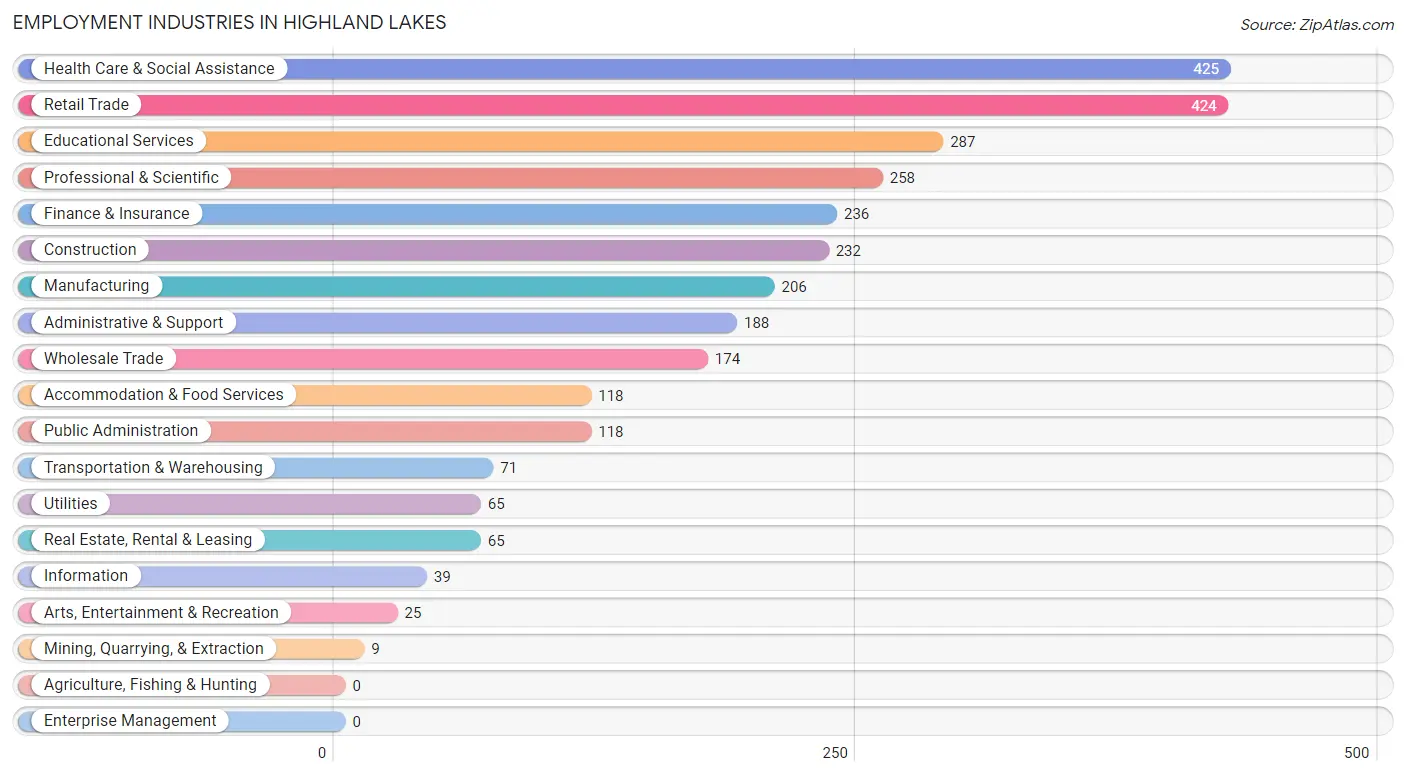
Employment Industries in Highland Lakes
The major employment industries in Highland Lakes include Health Care & Social Assistance (425 | 13.8%), Retail Trade (424 | 13.8%), Educational Services (287 | 9.3%), Professional & Scientific (258 | 8.4%), and Finance & Insurance (236 | 7.7%).
Employment Industries by Sex in Highland Lakes
The Highland Lakes industries that see more men than women are Mining, Quarrying, & Extraction (100.0%), Information (100.0%), and Manufacturing (94.2%), whereas the industries that tend to have a higher number of women are Arts, Entertainment & Recreation (100.0%), Accommodation & Food Services (67.8%), and Finance & Insurance (64.4%).
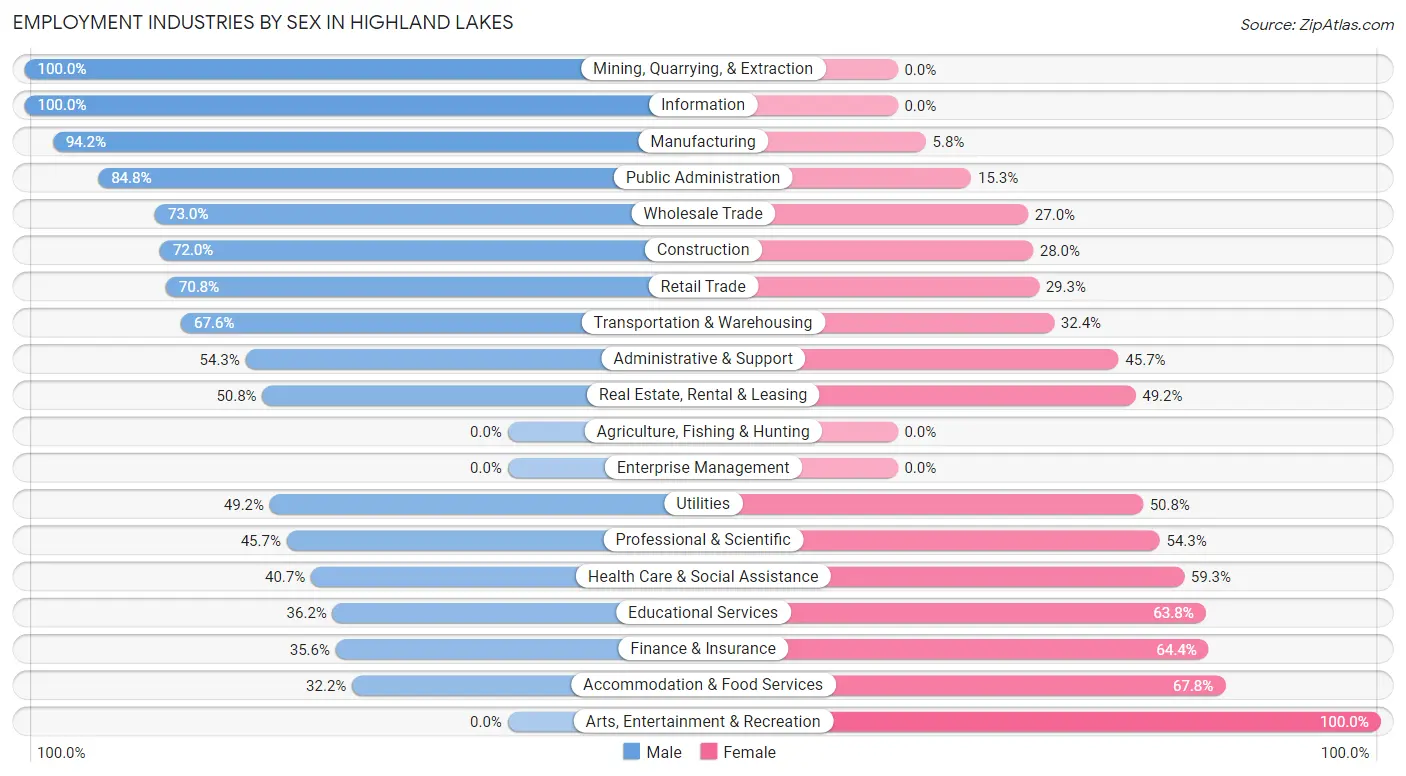
| Industry | Male | Female |
| Agriculture, Fishing & Hunting | 0 (0.0%) | 0 (0.0%) |
| Mining, Quarrying, & Extraction | 9 (100.0%) | 0 (0.0%) |
| Construction | 167 (72.0%) | 65 (28.0%) |
| Manufacturing | 194 (94.2%) | 12 (5.8%) |
| Wholesale Trade | 127 (73.0%) | 47 (27.0%) |
| Retail Trade | 300 (70.8%) | 124 (29.2%) |
| Transportation & Warehousing | 48 (67.6%) | 23 (32.4%) |
| Utilities | 32 (49.2%) | 33 (50.8%) |
| Information | 39 (100.0%) | 0 (0.0%) |
| Finance & Insurance | 84 (35.6%) | 152 (64.4%) |
| Real Estate, Rental & Leasing | 33 (50.8%) | 32 (49.2%) |
| Professional & Scientific | 118 (45.7%) | 140 (54.3%) |
| Enterprise Management | 0 (0.0%) | 0 (0.0%) |
| Administrative & Support | 102 (54.3%) | 86 (45.7%) |
| Educational Services | 104 (36.2%) | 183 (63.8%) |
| Health Care & Social Assistance | 173 (40.7%) | 252 (59.3%) |
| Arts, Entertainment & Recreation | 0 (0.0%) | 25 (100.0%) |
| Accommodation & Food Services | 38 (32.2%) | 80 (67.8%) |
| Public Administration | 100 (84.8%) | 18 (15.2%) |
| Total | 1,752 (57.0%) | 1,322 (43.0%) |
Education in Highland Lakes
School Enrollment in Highland Lakes
The most common levels of schooling among the 1,472 students in Highland Lakes are college / undergraduate (392 | 26.6%), elementary school (376 | 25.5%), and middle school (260 | 17.7%).
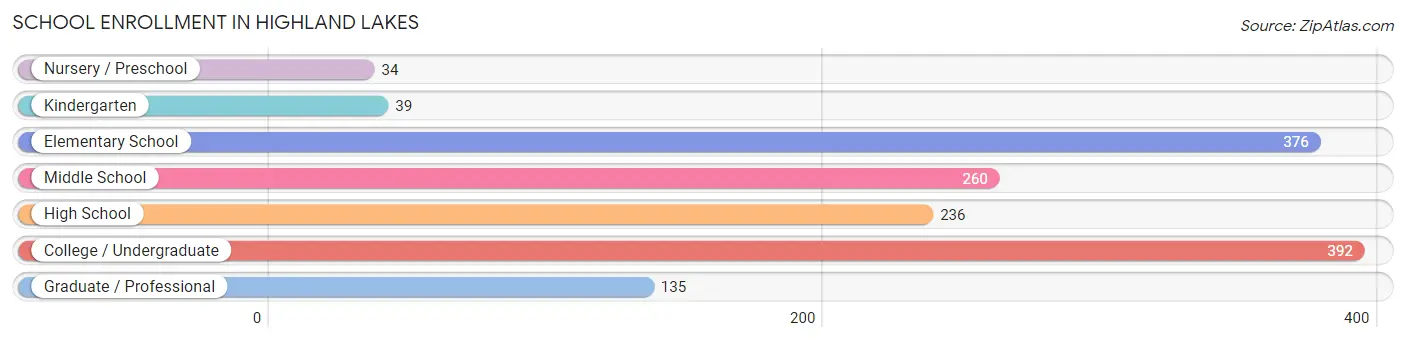
| School Level | # Students | % Students |
| Nursery / Preschool | 34 | 2.3% |
| Kindergarten | 39 | 2.6% |
| Elementary School | 376 | 25.5% |
| Middle School | 260 | 17.7% |
| High School | 236 | 16.0% |
| College / Undergraduate | 392 | 26.6% |
| Graduate / Professional | 135 | 9.2% |
| Total | 1,472 | 100.0% |
School Enrollment by Age by Funding Source in Highland Lakes
Out of a total of 1,472 students who are enrolled in schools in Highland Lakes, 667 (45.3%) attend a private institution, while the remaining 805 (54.7%) are enrolled in public schools. The age group of 3 to 4 year olds has the highest likelihood of being enrolled in private schools, with 34 (100.0% in the age bracket) enrolled. Conversely, the age group of 20 to 24 year olds has the lowest likelihood of being enrolled in a private school, with 184 (100.0% in the age bracket) attending a public institution.
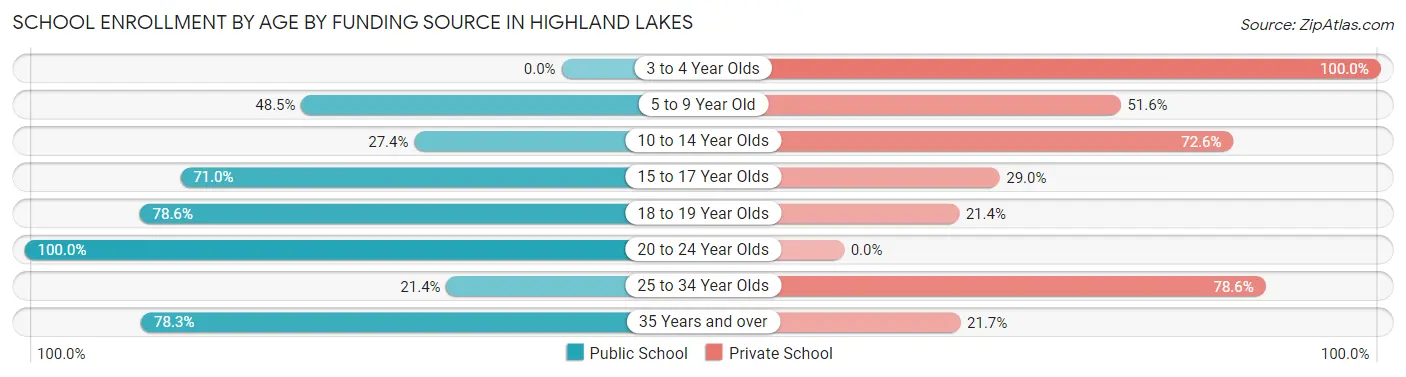
| Age Bracket | Public School | Private School |
| 3 to 4 Year Olds | 0 (0.0%) | 34 (100.0%) |
| 5 to 9 Year Old | 156 (48.4%) | 166 (51.5%) |
| 10 to 14 Year Olds | 102 (27.4%) | 270 (72.6%) |
| 15 to 17 Year Olds | 120 (71.0%) | 49 (29.0%) |
| 18 to 19 Year Olds | 154 (78.6%) | 42 (21.4%) |
| 20 to 24 Year Olds | 184 (100.0%) | 0 (0.0%) |
| 25 to 34 Year Olds | 24 (21.4%) | 88 (78.6%) |
| 35 Years and over | 65 (78.3%) | 18 (21.7%) |
| Total | 805 (54.7%) | 667 (45.3%) |
Educational Attainment by Field of Study in Highland Lakes
Business (922 | 28.4%), science & technology (511 | 15.8%), education (495 | 15.2%), arts & humanities (202 | 6.2%), and computers & mathematics (188 | 5.8%) are the most common fields of study among 3,245 individuals in Highland Lakes who have obtained a bachelor's degree or higher.
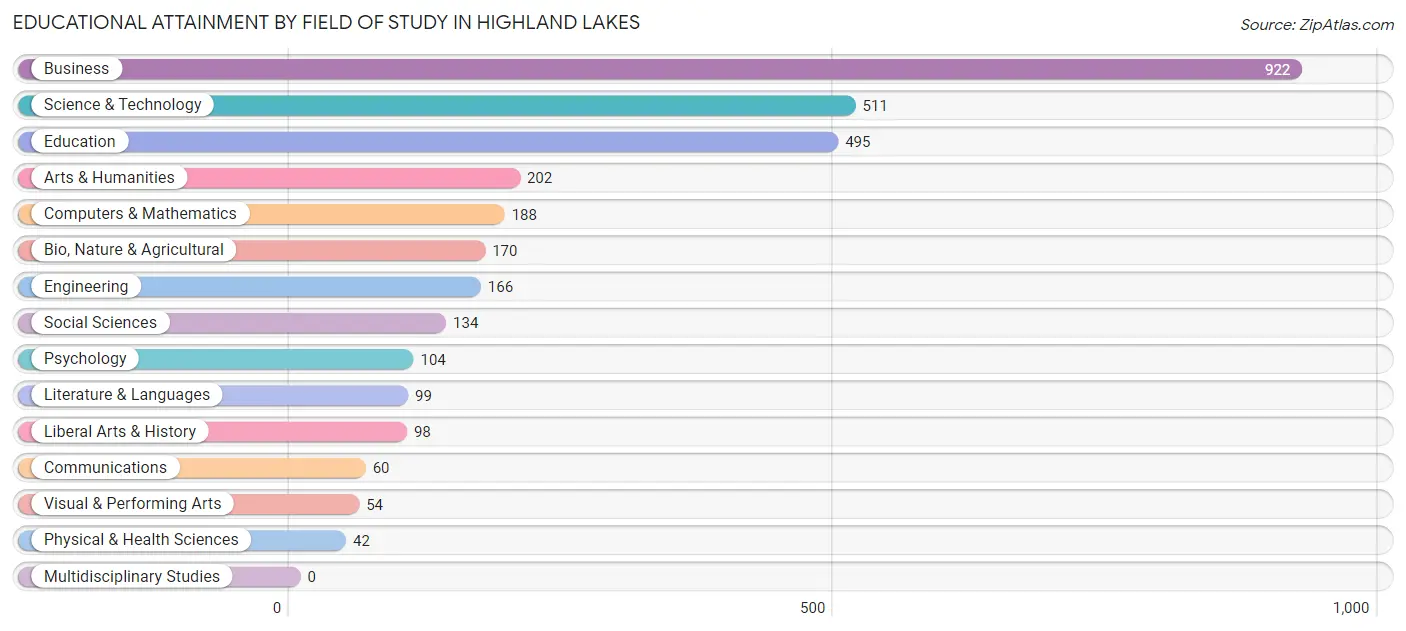
| Field of Study | # Graduates | % Graduates |
| Computers & Mathematics | 188 | 5.8% |
| Bio, Nature & Agricultural | 170 | 5.2% |
| Physical & Health Sciences | 42 | 1.3% |
| Psychology | 104 | 3.2% |
| Social Sciences | 134 | 4.1% |
| Engineering | 166 | 5.1% |
| Multidisciplinary Studies | 0 | 0.0% |
| Science & Technology | 511 | 15.8% |
| Business | 922 | 28.4% |
| Education | 495 | 15.2% |
| Literature & Languages | 99 | 3.0% |
| Liberal Arts & History | 98 | 3.0% |
| Visual & Performing Arts | 54 | 1.7% |
| Communications | 60 | 1.8% |
| Arts & Humanities | 202 | 6.2% |
| Total | 3,245 | 100.0% |
Transportation & Commute in Highland Lakes
Vehicle Availability by Sex in Highland Lakes
The most prevalent vehicle ownership categories in Highland Lakes are males with 2 vehicles (680, accounting for 39.0%) and females with 2 vehicles (565, making up 51.9%).
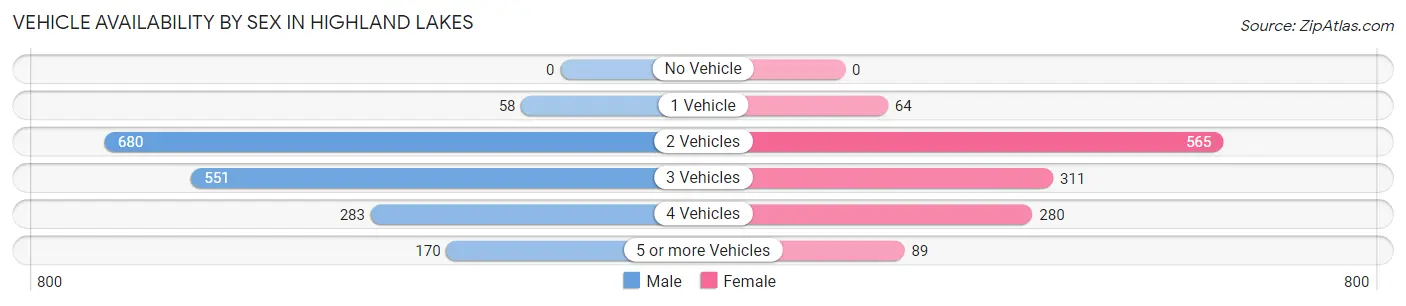
| Vehicles Available | Male | Female |
| No Vehicle | 0 (0.0%) | 0 (0.0%) |
| 1 Vehicle | 58 (3.3%) | 64 (4.9%) |
| 2 Vehicles | 680 (39.0%) | 565 (43.2%) |
| 3 Vehicles | 551 (31.6%) | 311 (23.8%) |
| 4 Vehicles | 283 (16.3%) | 280 (21.4%) |
| 5 or more Vehicles | 170 (9.8%) | 89 (6.8%) |
| Total | 1,742 (100.0%) | 1,309 (100.0%) |
Commute Time in Highland Lakes
The most frequently occuring commute durations in Highland Lakes are 30 to 34 minutes (584 commuters, 22.8%), 20 to 24 minutes (361 commuters, 14.1%), and 25 to 29 minutes (330 commuters, 12.9%).
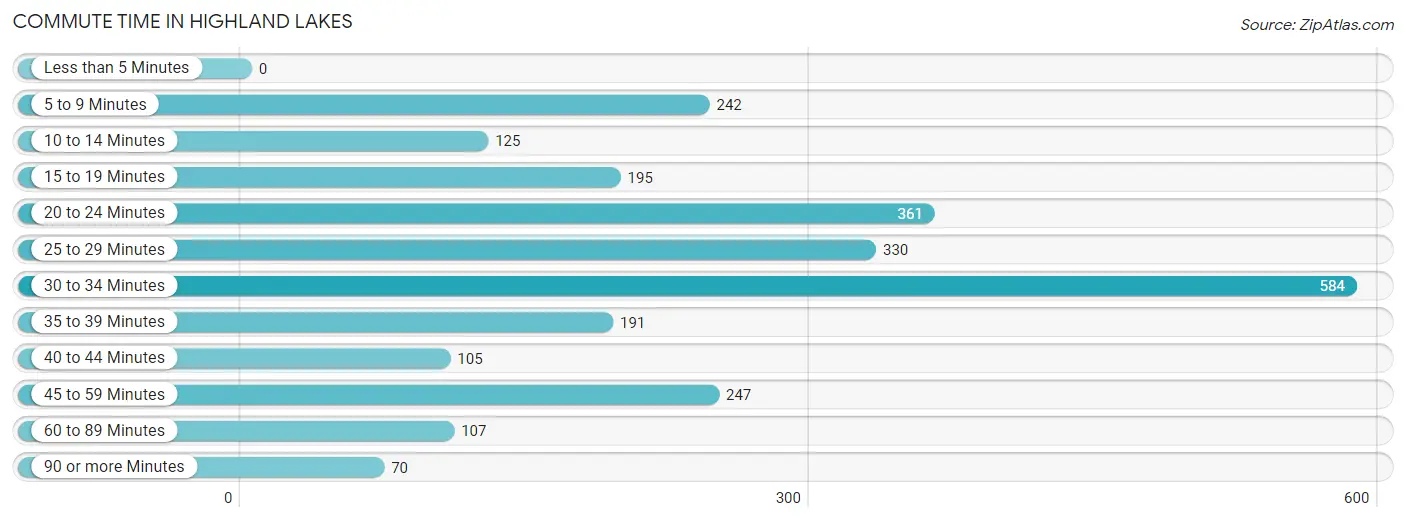
| Commute Time | # Commuters | % Commuters |
| Less than 5 Minutes | 0 | 0.0% |
| 5 to 9 Minutes | 242 | 9.5% |
| 10 to 14 Minutes | 125 | 4.9% |
| 15 to 19 Minutes | 195 | 7.6% |
| 20 to 24 Minutes | 361 | 14.1% |
| 25 to 29 Minutes | 330 | 12.9% |
| 30 to 34 Minutes | 584 | 22.8% |
| 35 to 39 Minutes | 191 | 7.5% |
| 40 to 44 Minutes | 105 | 4.1% |
| 45 to 59 Minutes | 247 | 9.7% |
| 60 to 89 Minutes | 107 | 4.2% |
| 90 or more Minutes | 70 | 2.7% |
Commute Time by Sex in Highland Lakes
The most common commute times in Highland Lakes are 30 to 34 minutes (328 commuters, 22.0%) for males and 30 to 34 minutes (256 commuters, 24.0%) for females.
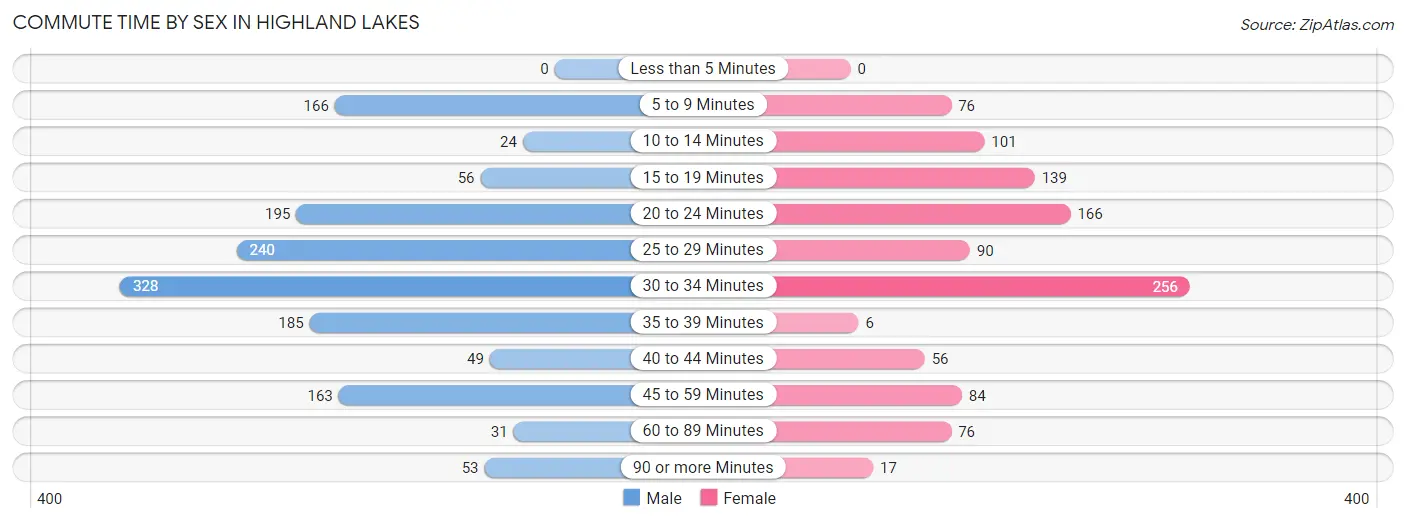
| Commute Time | Male | Female |
| Less than 5 Minutes | 0 (0.0%) | 0 (0.0%) |
| 5 to 9 Minutes | 166 (11.1%) | 76 (7.1%) |
| 10 to 14 Minutes | 24 (1.6%) | 101 (9.5%) |
| 15 to 19 Minutes | 56 (3.8%) | 139 (13.0%) |
| 20 to 24 Minutes | 195 (13.1%) | 166 (15.6%) |
| 25 to 29 Minutes | 240 (16.1%) | 90 (8.4%) |
| 30 to 34 Minutes | 328 (22.0%) | 256 (24.0%) |
| 35 to 39 Minutes | 185 (12.4%) | 6 (0.6%) |
| 40 to 44 Minutes | 49 (3.3%) | 56 (5.2%) |
| 45 to 59 Minutes | 163 (10.9%) | 84 (7.9%) |
| 60 to 89 Minutes | 31 (2.1%) | 76 (7.1%) |
| 90 or more Minutes | 53 (3.6%) | 17 (1.6%) |
Time of Departure to Work by Sex in Highland Lakes
The most frequent times of departure to work in Highland Lakes are 7:00 AM to 7:29 AM (327, 22.0%) for males and 6:30 AM to 6:59 AM (290, 27.2%) for females.
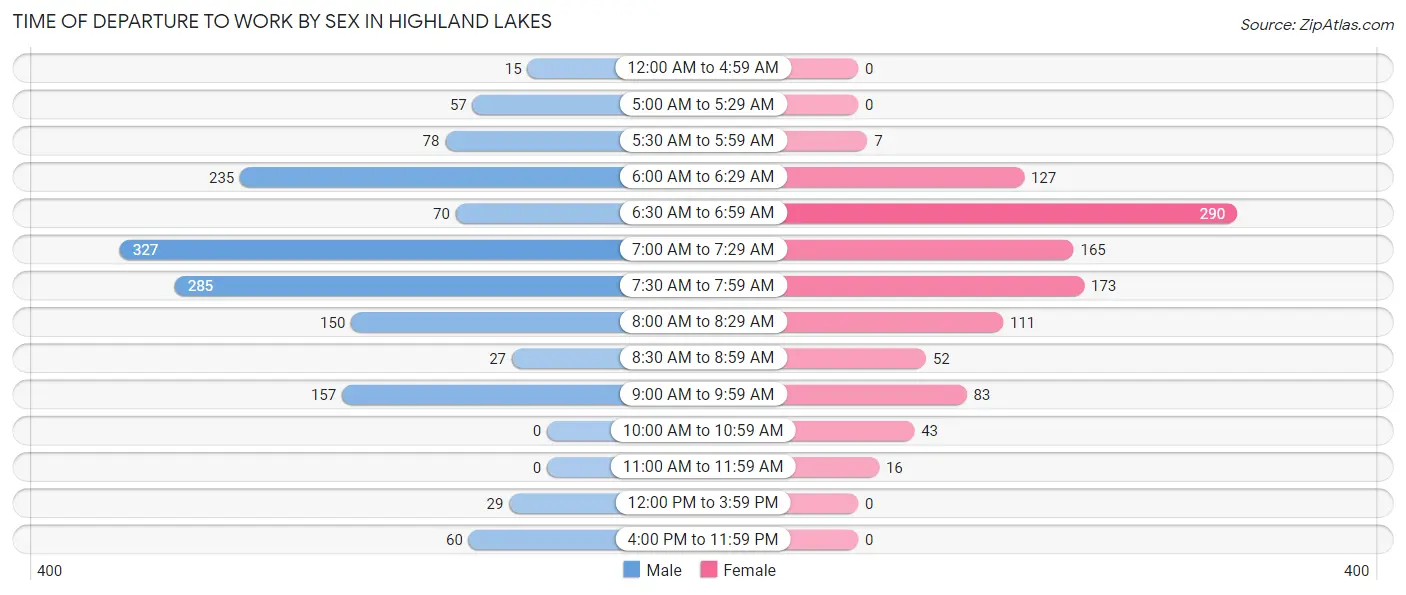
| Time of Departure | Male | Female |
| 12:00 AM to 4:59 AM | 15 (1.0%) | 0 (0.0%) |
| 5:00 AM to 5:29 AM | 57 (3.8%) | 0 (0.0%) |
| 5:30 AM to 5:59 AM | 78 (5.2%) | 7 (0.7%) |
| 6:00 AM to 6:29 AM | 235 (15.8%) | 127 (11.9%) |
| 6:30 AM to 6:59 AM | 70 (4.7%) | 290 (27.2%) |
| 7:00 AM to 7:29 AM | 327 (22.0%) | 165 (15.5%) |
| 7:30 AM to 7:59 AM | 285 (19.1%) | 173 (16.2%) |
| 8:00 AM to 8:29 AM | 150 (10.1%) | 111 (10.4%) |
| 8:30 AM to 8:59 AM | 27 (1.8%) | 52 (4.9%) |
| 9:00 AM to 9:59 AM | 157 (10.5%) | 83 (7.8%) |
| 10:00 AM to 10:59 AM | 0 (0.0%) | 43 (4.0%) |
| 11:00 AM to 11:59 AM | 0 (0.0%) | 16 (1.5%) |
| 12:00 PM to 3:59 PM | 29 (1.9%) | 0 (0.0%) |
| 4:00 PM to 11:59 PM | 60 (4.0%) | 0 (0.0%) |
| Total | 1,490 (100.0%) | 1,067 (100.0%) |
Housing Occupancy in Highland Lakes
Occupancy by Ownership in Highland Lakes
Of the total 2,011 dwellings in Highland Lakes, owner-occupied units account for 1,995 (99.2%), while renter-occupied units make up 16 (0.8%).
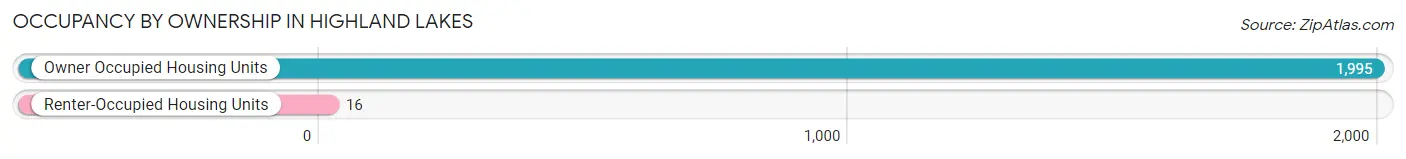
| Occupancy | # Housing Units | % Housing Units |
| Owner Occupied Housing Units | 1,995 | 99.2% |
| Renter-Occupied Housing Units | 16 | 0.8% |
| Total Occupied Housing Units | 2,011 | 100.0% |
Occupancy by Household Size in Highland Lakes
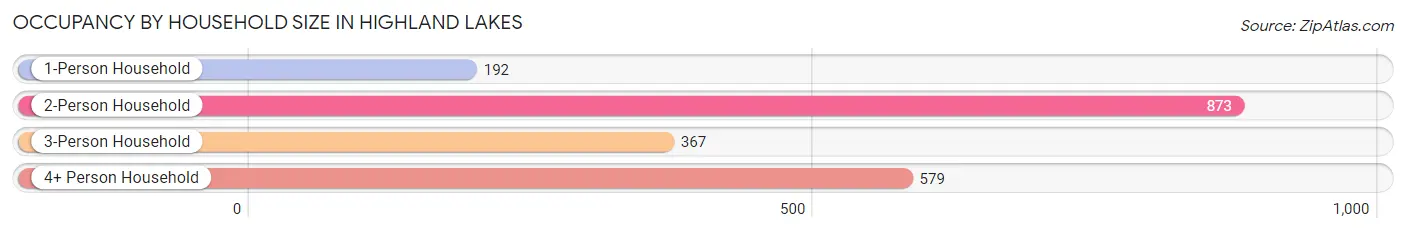
| Household Size | # Housing Units | % Housing Units |
| 1-Person Household | 192 | 9.6% |
| 2-Person Household | 873 | 43.4% |
| 3-Person Household | 367 | 18.2% |
| 4+ Person Household | 579 | 28.8% |
| Total Housing Units | 2,011 | 100.0% |
Occupancy by Ownership by Household Size in Highland Lakes
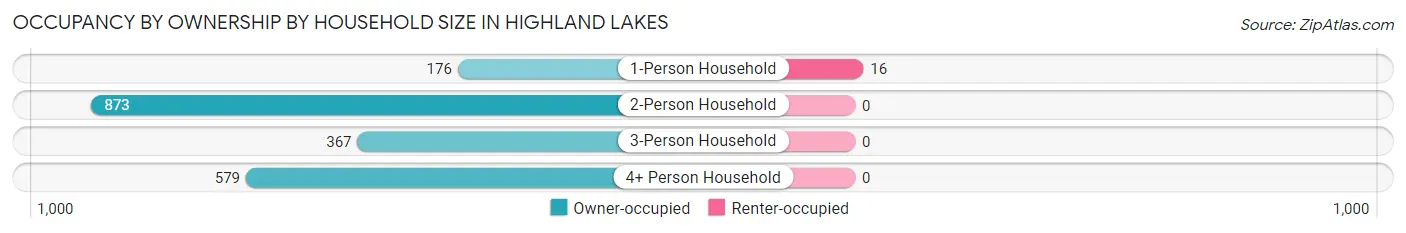
| Household Size | Owner-occupied | Renter-occupied |
| 1-Person Household | 176 (91.7%) | 16 (8.3%) |
| 2-Person Household | 873 (100.0%) | 0 (0.0%) |
| 3-Person Household | 367 (100.0%) | 0 (0.0%) |
| 4+ Person Household | 579 (100.0%) | 0 (0.0%) |
| Total Housing Units | 1,995 (99.2%) | 16 (0.8%) |
Occupancy by Educational Attainment in Highland Lakes
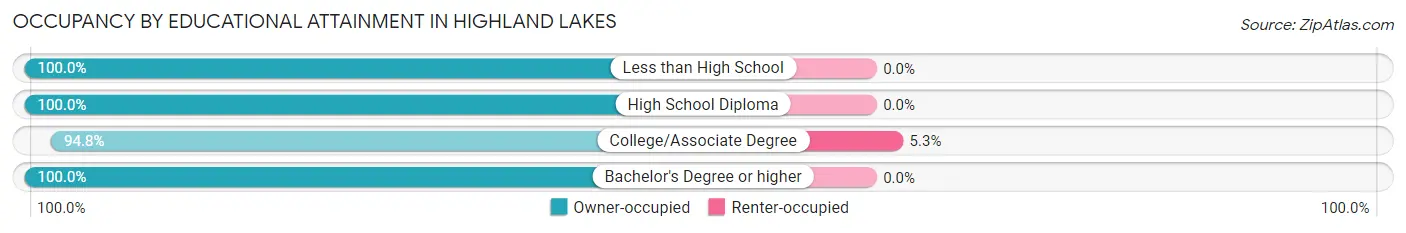
| Household Size | Owner-occupied | Renter-occupied |
| Less than High School | 47 (100.0%) | 0 (0.0%) |
| High School Diploma | 61 (100.0%) | 0 (0.0%) |
| College/Associate Degree | 289 (94.8%) | 16 (5.2%) |
| Bachelor's Degree or higher | 1,598 (100.0%) | 0 (0.0%) |
Occupancy by Age of Householder in Highland Lakes
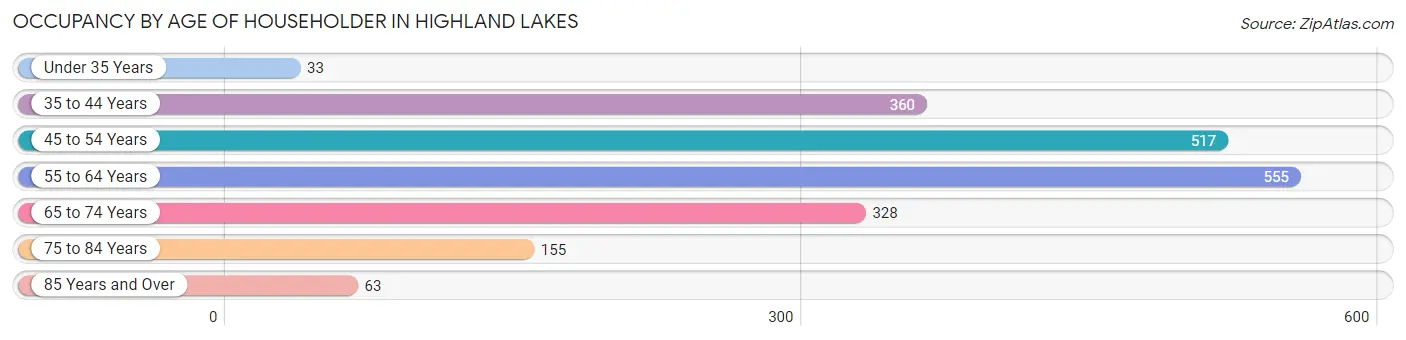
| Age Bracket | # Households | % Households |
| Under 35 Years | 33 | 1.6% |
| 35 to 44 Years | 360 | 17.9% |
| 45 to 54 Years | 517 | 25.7% |
| 55 to 64 Years | 555 | 27.6% |
| 65 to 74 Years | 328 | 16.3% |
| 75 to 84 Years | 155 | 7.7% |
| 85 Years and Over | 63 | 3.1% |
| Total | 2,011 | 100.0% |
Housing Finances in Highland Lakes
Median Income by Occupancy in Highland Lakes
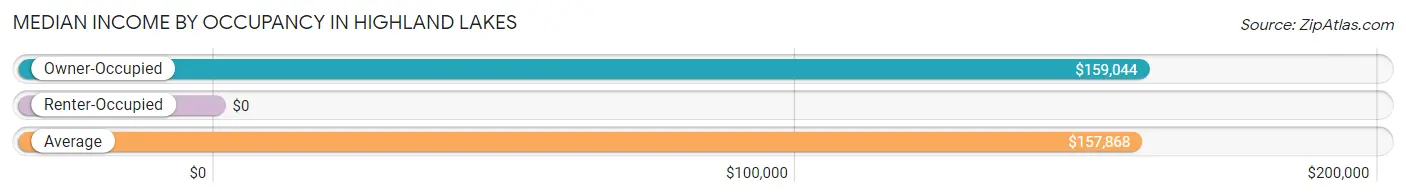
| Occupancy Type | # Households | Median Income |
| Owner-Occupied | 1,995 (99.2%) | $159,044 |
| Renter-Occupied | 16 (0.8%) | $0 |
| Average | 2,011 (100.0%) | $157,868 |
Occupancy by Householder Income Bracket in Highland Lakes
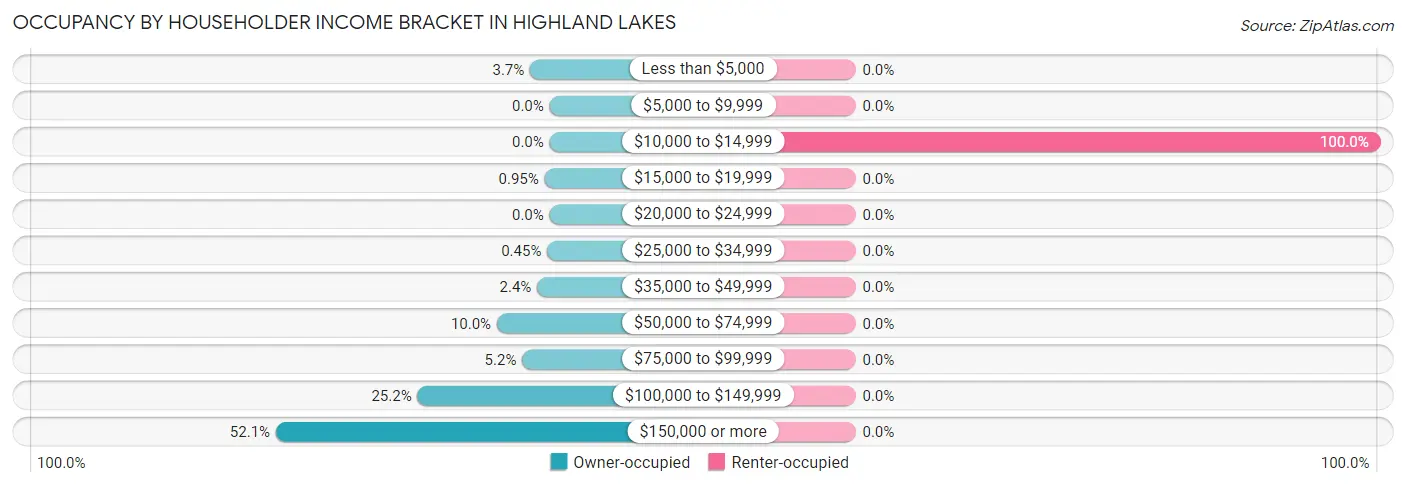
| Income Bracket | Owner-occupied | Renter-occupied |
| Less than $5,000 | 74 (3.7%) | 0 (0.0%) |
| $5,000 to $9,999 | 0 (0.0%) | 0 (0.0%) |
| $10,000 to $14,999 | 0 (0.0%) | 16 (100.0%) |
| $15,000 to $19,999 | 19 (0.9%) | 0 (0.0%) |
| $20,000 to $24,999 | 0 (0.0%) | 0 (0.0%) |
| $25,000 to $34,999 | 9 (0.4%) | 0 (0.0%) |
| $35,000 to $49,999 | 47 (2.4%) | 0 (0.0%) |
| $50,000 to $74,999 | 200 (10.0%) | 0 (0.0%) |
| $75,000 to $99,999 | 104 (5.2%) | 0 (0.0%) |
| $100,000 to $149,999 | 502 (25.2%) | 0 (0.0%) |
| $150,000 or more | 1,040 (52.1%) | 0 (0.0%) |
| Total | 1,995 (100.0%) | 16 (100.0%) |
Monthly Housing Cost Tiers in Highland Lakes
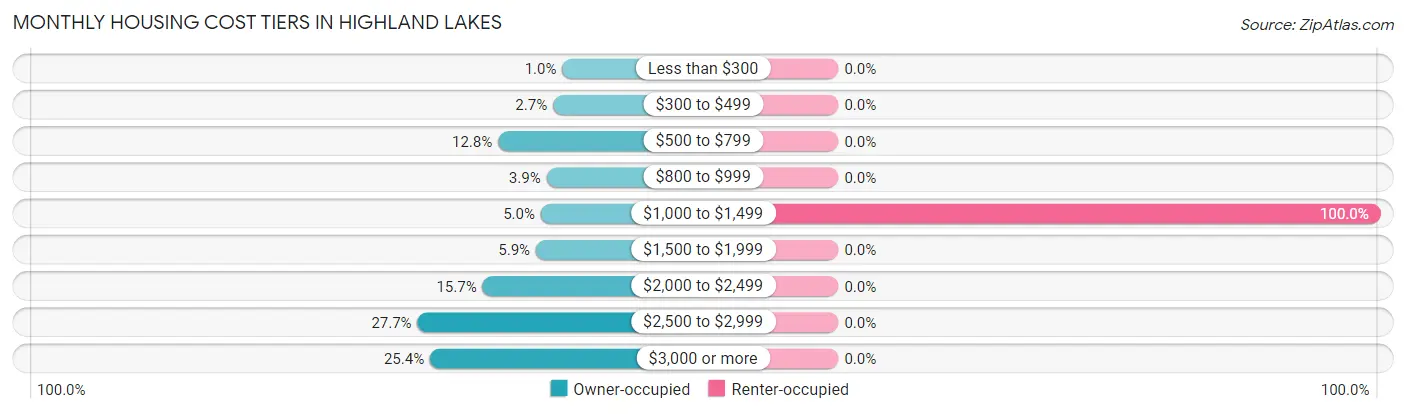
| Monthly Cost | Owner-occupied | Renter-occupied |
| Less than $300 | 20 (1.0%) | 0 (0.0%) |
| $300 to $499 | 54 (2.7%) | 0 (0.0%) |
| $500 to $799 | 256 (12.8%) | 0 (0.0%) |
| $800 to $999 | 78 (3.9%) | 0 (0.0%) |
| $1,000 to $1,499 | 99 (5.0%) | 16 (100.0%) |
| $1,500 to $1,999 | 117 (5.9%) | 0 (0.0%) |
| $2,000 to $2,499 | 313 (15.7%) | 0 (0.0%) |
| $2,500 to $2,999 | 552 (27.7%) | 0 (0.0%) |
| $3,000 or more | 506 (25.4%) | 0 (0.0%) |
| Total | 1,995 (100.0%) | 16 (100.0%) |
Physical Housing Characteristics in Highland Lakes
Housing Structures in Highland Lakes
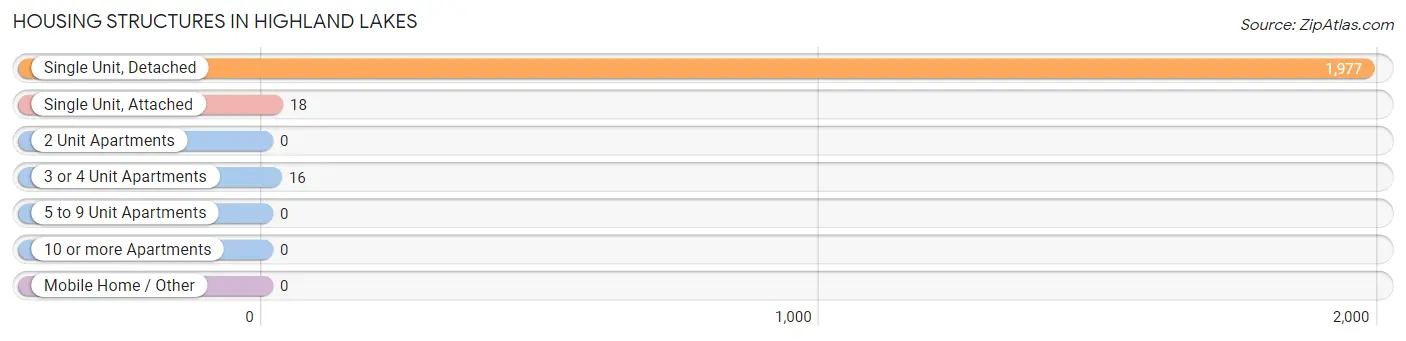
| Structure Type | # Housing Units | % Housing Units |
| Single Unit, Detached | 1,977 | 98.3% |
| Single Unit, Attached | 18 | 0.9% |
| 2 Unit Apartments | 0 | 0.0% |
| 3 or 4 Unit Apartments | 16 | 0.8% |
| 5 to 9 Unit Apartments | 0 | 0.0% |
| 10 or more Apartments | 0 | 0.0% |
| Mobile Home / Other | 0 | 0.0% |
| Total | 2,011 | 100.0% |
Housing Structures by Occupancy in Highland Lakes
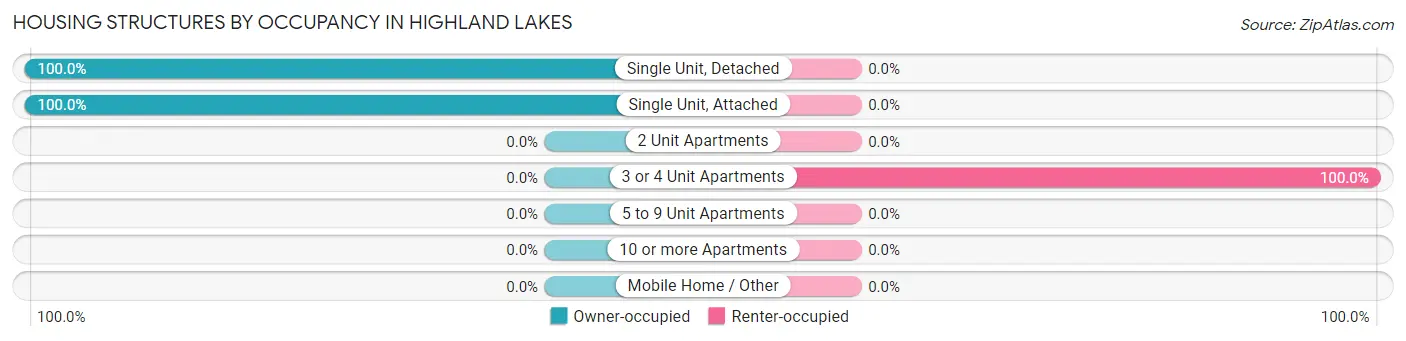
| Structure Type | Owner-occupied | Renter-occupied |
| Single Unit, Detached | 1,977 (100.0%) | 0 (0.0%) |
| Single Unit, Attached | 18 (100.0%) | 0 (0.0%) |
| 2 Unit Apartments | 0 (0.0%) | 0 (0.0%) |
| 3 or 4 Unit Apartments | 0 (0.0%) | 16 (100.0%) |
| 5 to 9 Unit Apartments | 0 (0.0%) | 0 (0.0%) |
| 10 or more Apartments | 0 (0.0%) | 0 (0.0%) |
| Mobile Home / Other | 0 (0.0%) | 0 (0.0%) |
| Total | 1,995 (99.2%) | 16 (0.8%) |
Housing Structures by Number of Rooms in Highland Lakes
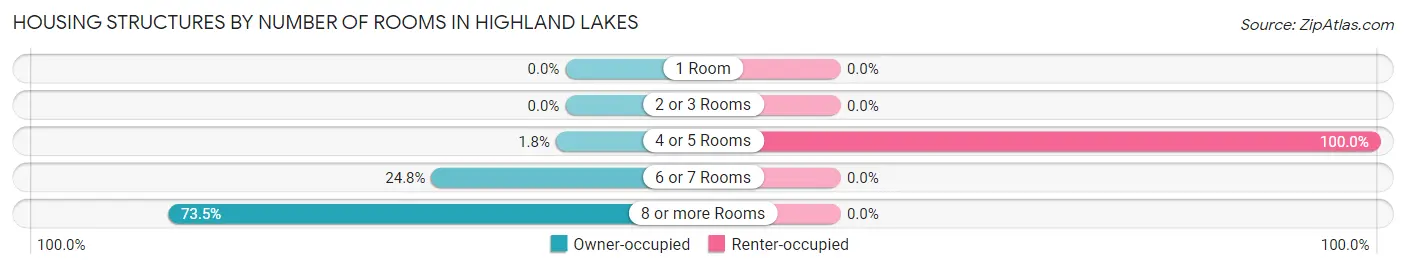
| Number of Rooms | Owner-occupied | Renter-occupied |
| 1 Room | 0 (0.0%) | 0 (0.0%) |
| 2 or 3 Rooms | 0 (0.0%) | 0 (0.0%) |
| 4 or 5 Rooms | 35 (1.8%) | 16 (100.0%) |
| 6 or 7 Rooms | 494 (24.8%) | 0 (0.0%) |
| 8 or more Rooms | 1,466 (73.5%) | 0 (0.0%) |
| Total | 1,995 (100.0%) | 16 (100.0%) |
Housing Structure by Heating Type in Highland Lakes
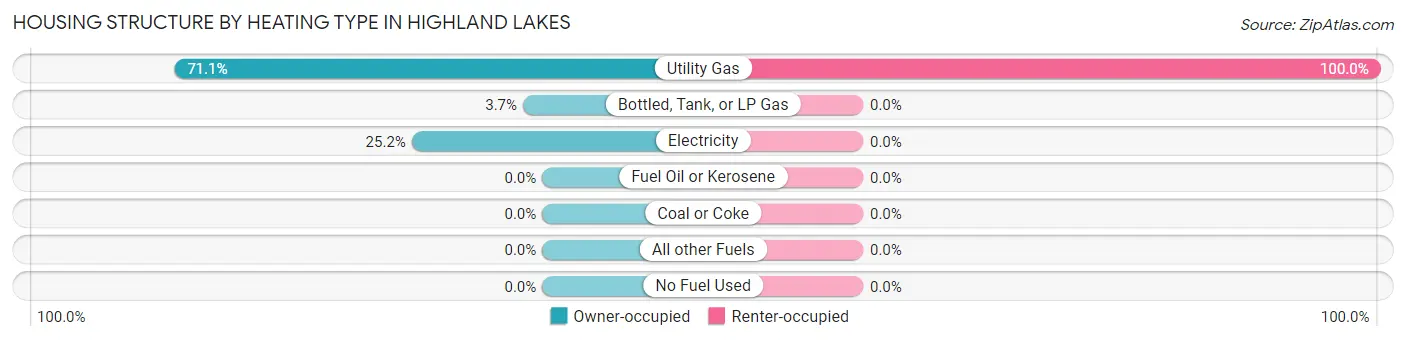
| Heating Type | Owner-occupied | Renter-occupied |
| Utility Gas | 1,418 (71.1%) | 16 (100.0%) |
| Bottled, Tank, or LP Gas | 74 (3.7%) | 0 (0.0%) |
| Electricity | 503 (25.2%) | 0 (0.0%) |
| Fuel Oil or Kerosene | 0 (0.0%) | 0 (0.0%) |
| Coal or Coke | 0 (0.0%) | 0 (0.0%) |
| All other Fuels | 0 (0.0%) | 0 (0.0%) |
| No Fuel Used | 0 (0.0%) | 0 (0.0%) |
| Total | 1,995 (100.0%) | 16 (100.0%) |
Household Vehicle Usage in Highland Lakes
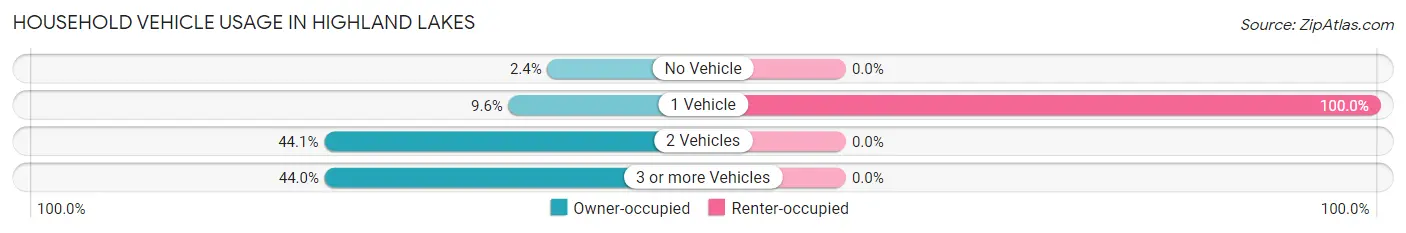
| Vehicles per Household | Owner-occupied | Renter-occupied |
| No Vehicle | 47 (2.4%) | 0 (0.0%) |
| 1 Vehicle | 192 (9.6%) | 16 (100.0%) |
| 2 Vehicles | 879 (44.1%) | 0 (0.0%) |
| 3 or more Vehicles | 877 (44.0%) | 0 (0.0%) |
| Total | 1,995 (100.0%) | 16 (100.0%) |
Real Estate & Mortgages in Highland Lakes
Real Estate and Mortgage Overview in Highland Lakes
| Characteristic | Without Mortgage | With Mortgage |
| Housing Units | 416 | 1,579 |
| Median Property Value | $496,300 | $526,200 |
| Median Household Income | $114,565 | $899 |
| Monthly Housing Costs | $734 | $506 |
| Real Estate Taxes | $2,061 | $34 |
Property Value by Mortgage Status in Highland Lakes
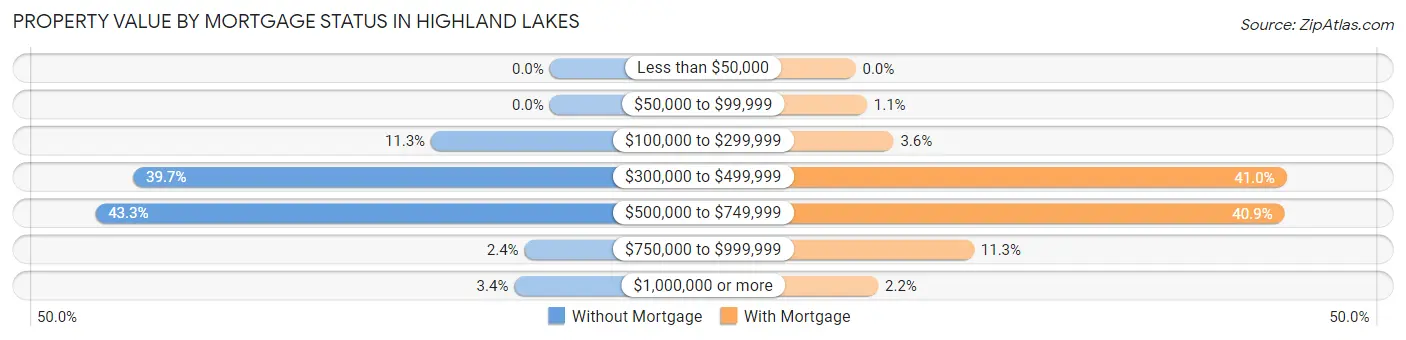
| Property Value | Without Mortgage | With Mortgage |
| Less than $50,000 | 0 (0.0%) | 0 (0.0%) |
| $50,000 to $99,999 | 0 (0.0%) | 17 (1.1%) |
| $100,000 to $299,999 | 47 (11.3%) | 57 (3.6%) |
| $300,000 to $499,999 | 165 (39.7%) | 648 (41.0%) |
| $500,000 to $749,999 | 180 (43.3%) | 645 (40.8%) |
| $750,000 to $999,999 | 10 (2.4%) | 178 (11.3%) |
| $1,000,000 or more | 14 (3.4%) | 34 (2.1%) |
| Total | 416 (100.0%) | 1,579 (100.0%) |
Household Income by Mortgage Status in Highland Lakes
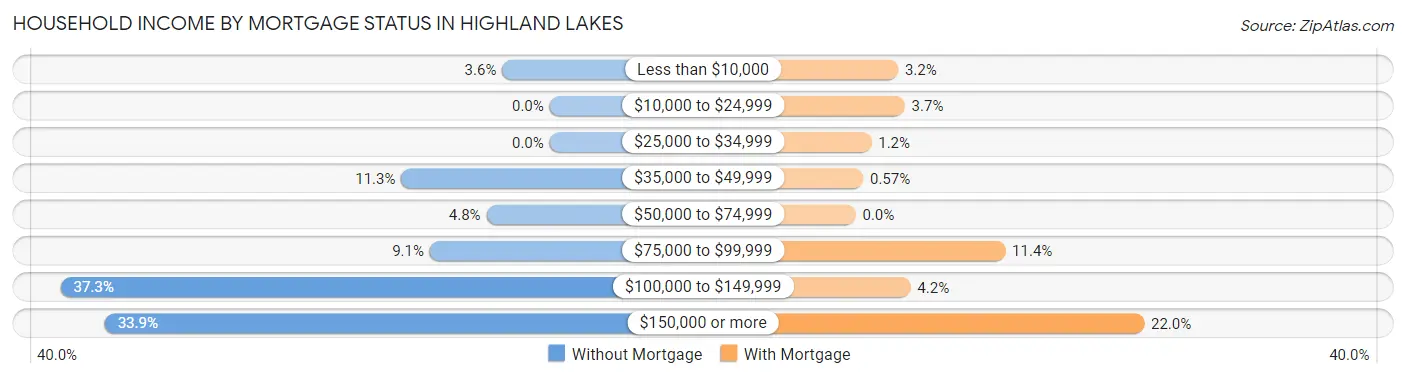
| Household Income | Without Mortgage | With Mortgage |
| Less than $10,000 | 15 (3.6%) | 51 (3.2%) |
| $10,000 to $24,999 | 0 (0.0%) | 59 (3.7%) |
| $25,000 to $34,999 | 0 (0.0%) | 19 (1.2%) |
| $35,000 to $49,999 | 47 (11.3%) | 9 (0.6%) |
| $50,000 to $74,999 | 20 (4.8%) | 0 (0.0%) |
| $75,000 to $99,999 | 38 (9.1%) | 180 (11.4%) |
| $100,000 to $149,999 | 155 (37.3%) | 66 (4.2%) |
| $150,000 or more | 141 (33.9%) | 347 (22.0%) |
| Total | 416 (100.0%) | 1,579 (100.0%) |
Property Value to Household Income Ratio in Highland Lakes
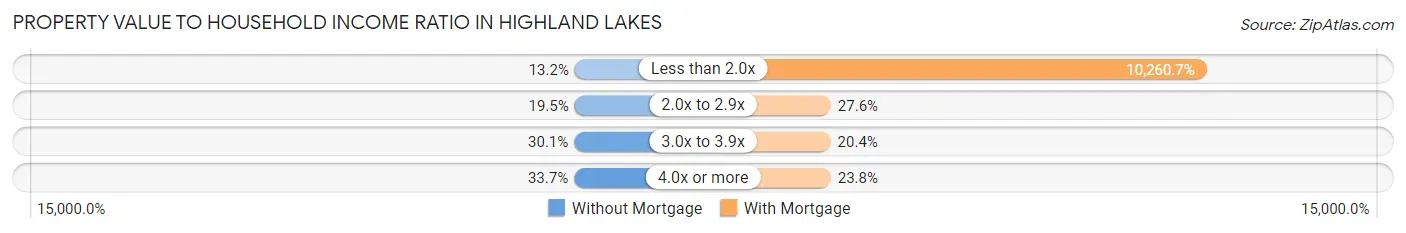
| Value-to-Income Ratio | Without Mortgage | With Mortgage |
| Less than 2.0x | 55 (13.2%) | 162,017 (10,260.7%) |
| 2.0x to 2.9x | 81 (19.5%) | 436 (27.6%) |
| 3.0x to 3.9x | 125 (30.0%) | 322 (20.4%) |
| 4.0x or more | 140 (33.7%) | 375 (23.7%) |
| Total | 416 (100.0%) | 1,579 (100.0%) |
Real Estate Taxes by Mortgage Status in Highland Lakes
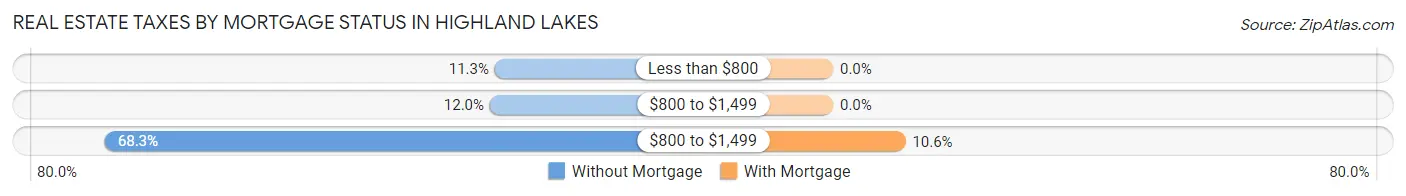
| Property Taxes | Without Mortgage | With Mortgage |
| Less than $800 | 47 (11.3%) | 0 (0.0%) |
| $800 to $1,499 | 50 (12.0%) | 0 (0.0%) |
| $800 to $1,499 | 284 (68.3%) | 167 (10.6%) |
| Total | 416 (100.0%) | 1,579 (100.0%) |
Health & Disability in Highland Lakes
Health Insurance Coverage by Age in Highland Lakes
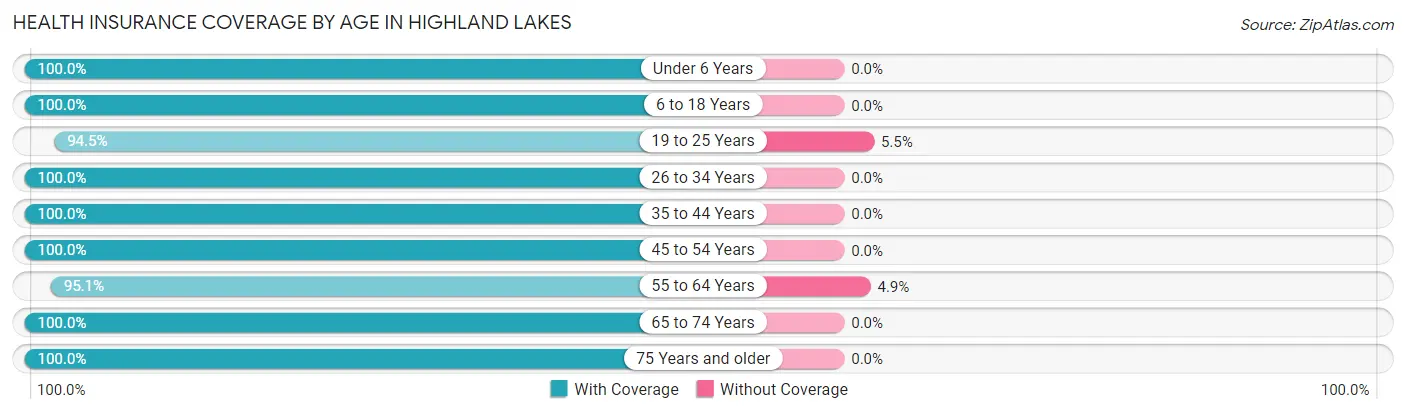
| Age Bracket | With Coverage | Without Coverage |
| Under 6 Years | 154 (100.0%) | 0 (0.0%) |
| 6 to 18 Years | 939 (100.0%) | 0 (0.0%) |
| 19 to 25 Years | 427 (94.5%) | 25 (5.5%) |
| 26 to 34 Years | 288 (100.0%) | 0 (0.0%) |
| 35 to 44 Years | 679 (100.0%) | 0 (0.0%) |
| 45 to 54 Years | 992 (100.0%) | 0 (0.0%) |
| 55 to 64 Years | 972 (95.1%) | 50 (4.9%) |
| 65 to 74 Years | 747 (100.0%) | 0 (0.0%) |
| 75 Years and older | 355 (100.0%) | 0 (0.0%) |
| Total | 5,553 (98.7%) | 75 (1.3%) |
Health Insurance Coverage by Citizenship Status in Highland Lakes
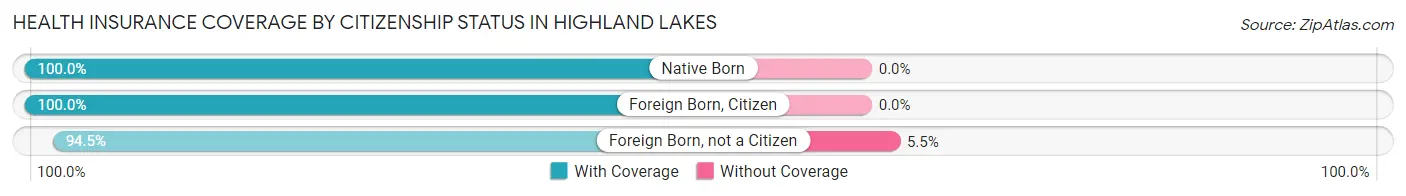
| Citizenship Status | With Coverage | Without Coverage |
| Native Born | 154 (100.0%) | 0 (0.0%) |
| Foreign Born, Citizen | 939 (100.0%) | 0 (0.0%) |
| Foreign Born, not a Citizen | 427 (94.5%) | 25 (5.5%) |
Health Insurance Coverage by Household Income in Highland Lakes
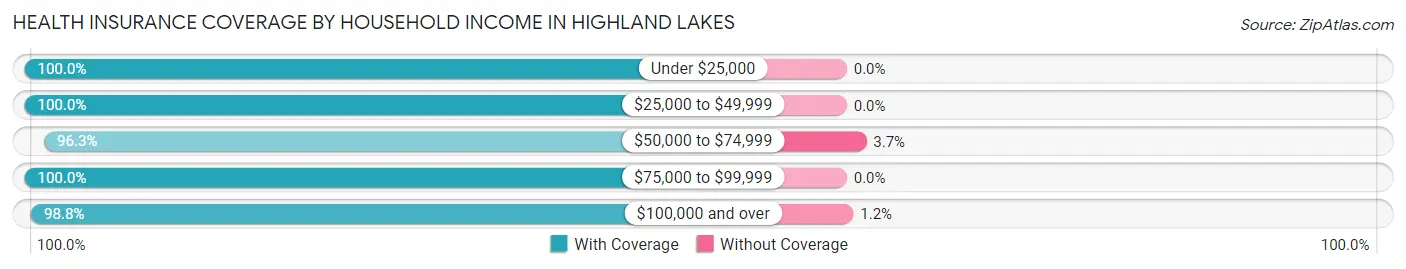
| Household Income | With Coverage | Without Coverage |
| Under $25,000 | 194 (100.0%) | 0 (0.0%) |
| $25,000 to $49,999 | 240 (100.0%) | 0 (0.0%) |
| $50,000 to $74,999 | 551 (96.3%) | 21 (3.7%) |
| $75,000 to $99,999 | 223 (100.0%) | 0 (0.0%) |
| $100,000 and over | 4,345 (98.8%) | 54 (1.2%) |
Public vs Private Health Insurance Coverage by Age in Highland Lakes
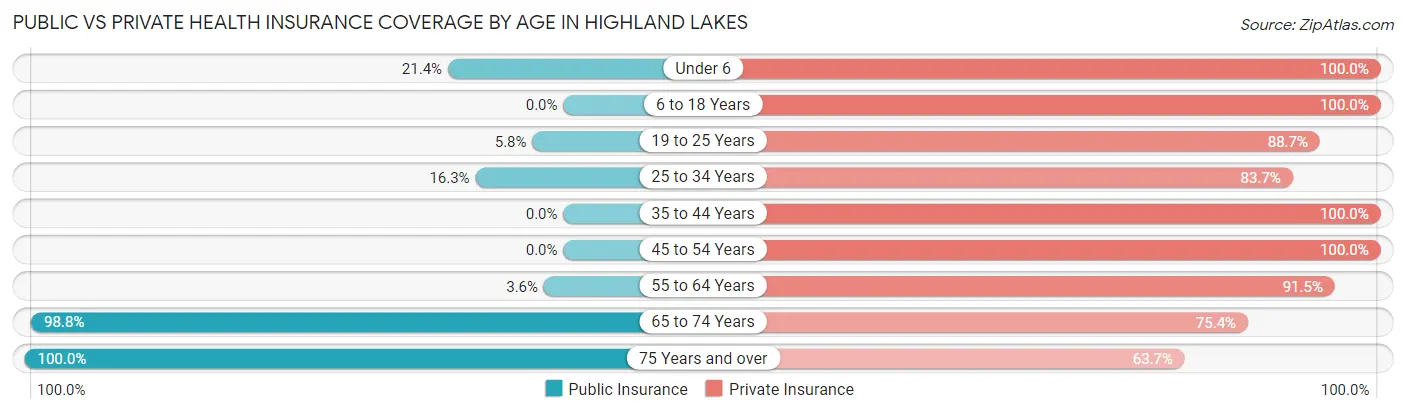
| Age Bracket | Public Insurance | Private Insurance |
| Under 6 | 33 (21.4%) | 154 (100.0%) |
| 6 to 18 Years | 0 (0.0%) | 939 (100.0%) |
| 19 to 25 Years | 26 (5.8%) | 401 (88.7%) |
| 25 to 34 Years | 47 (16.3%) | 241 (83.7%) |
| 35 to 44 Years | 0 (0.0%) | 679 (100.0%) |
| 45 to 54 Years | 0 (0.0%) | 992 (100.0%) |
| 55 to 64 Years | 37 (3.6%) | 935 (91.5%) |
| 65 to 74 Years | 738 (98.8%) | 563 (75.4%) |
| 75 Years and over | 355 (100.0%) | 226 (63.7%) |
| Total | 1,236 (22.0%) | 5,130 (91.1%) |
Disability Status by Sex by Age in Highland Lakes
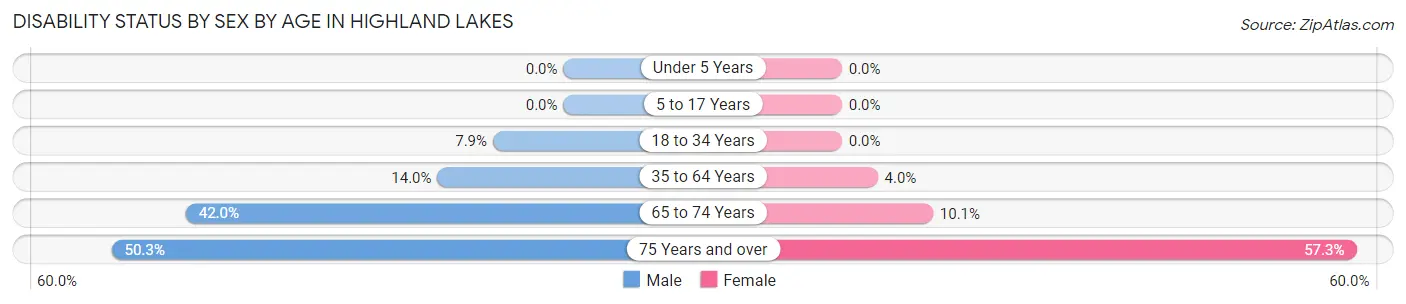
| Age Bracket | Male | Female |
| Under 5 Years | 0 (0.0%) | 0 (0.0%) |
| 5 to 17 Years | 0 (0.0%) | 0 (0.0%) |
| 18 to 34 Years | 39 (7.9%) | 0 (0.0%) |
| 35 to 64 Years | 181 (14.0%) | 56 (4.0%) |
| 65 to 74 Years | 169 (42.0%) | 35 (10.1%) |
| 75 Years and over | 82 (50.3%) | 110 (57.3%) |
Disability Class by Sex by Age in Highland Lakes
Disability Class: Hearing Difficulty
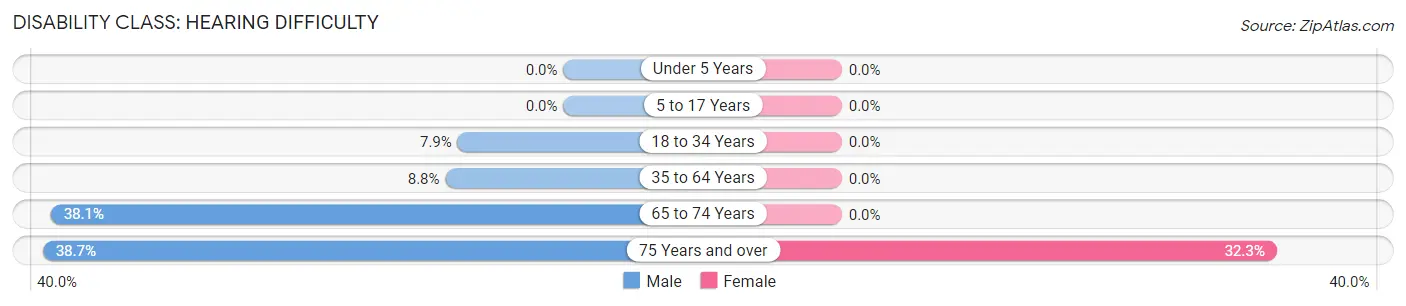
| Age Bracket | Male | Female |
| Under 5 Years | 0 (0.0%) | 0 (0.0%) |
| 5 to 17 Years | 0 (0.0%) | 0 (0.0%) |
| 18 to 34 Years | 39 (7.9%) | 0 (0.0%) |
| 35 to 64 Years | 113 (8.8%) | 0 (0.0%) |
| 65 to 74 Years | 153 (38.1%) | 0 (0.0%) |
| 75 Years and over | 63 (38.7%) | 62 (32.3%) |
Disability Class: Vision Difficulty
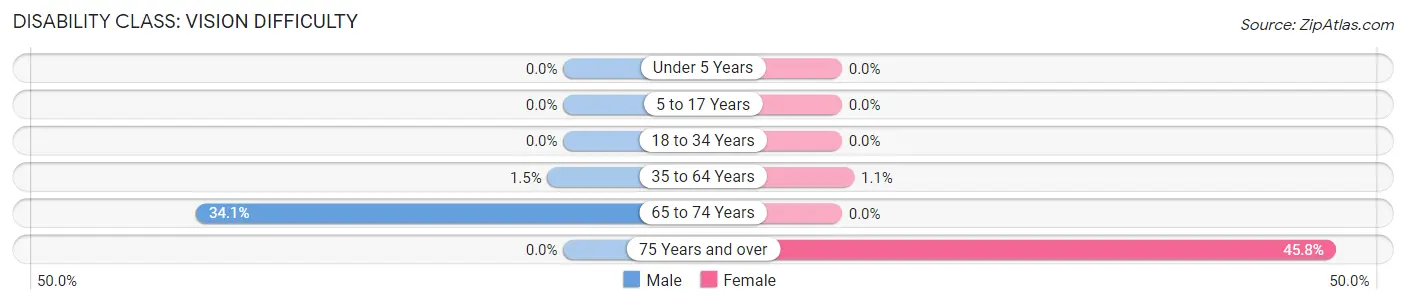
| Age Bracket | Male | Female |
| Under 5 Years | 0 (0.0%) | 0 (0.0%) |
| 5 to 17 Years | 0 (0.0%) | 0 (0.0%) |
| 18 to 34 Years | 0 (0.0%) | 0 (0.0%) |
| 35 to 64 Years | 19 (1.5%) | 16 (1.1%) |
| 65 to 74 Years | 137 (34.1%) | 0 (0.0%) |
| 75 Years and over | 0 (0.0%) | 88 (45.8%) |
Disability Class: Cognitive Difficulty
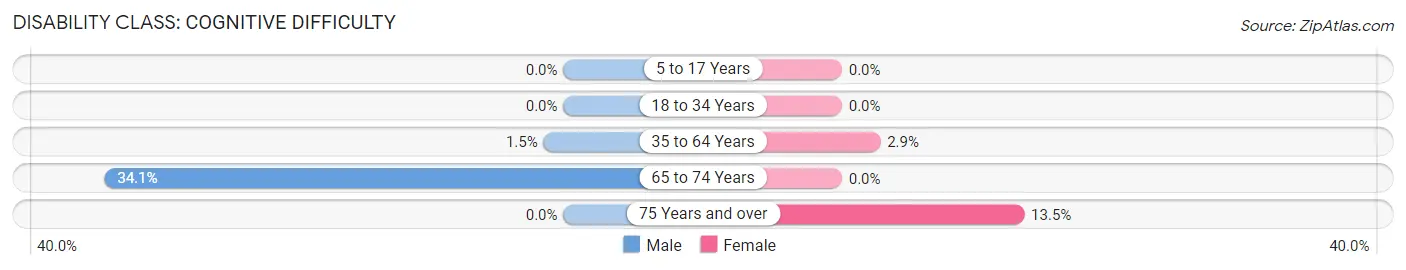
| Age Bracket | Male | Female |
| 5 to 17 Years | 0 (0.0%) | 0 (0.0%) |
| 18 to 34 Years | 0 (0.0%) | 0 (0.0%) |
| 35 to 64 Years | 19 (1.5%) | 40 (2.9%) |
| 65 to 74 Years | 137 (34.1%) | 0 (0.0%) |
| 75 Years and over | 0 (0.0%) | 26 (13.5%) |
Disability Class: Ambulatory Difficulty
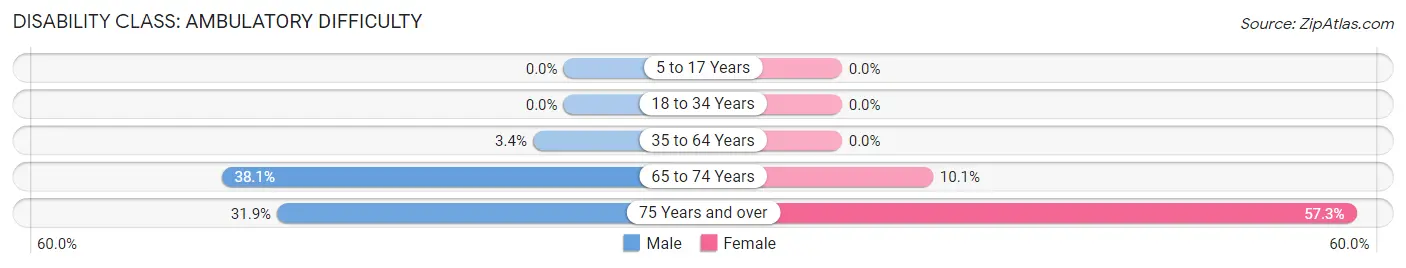
| Age Bracket | Male | Female |
| 5 to 17 Years | 0 (0.0%) | 0 (0.0%) |
| 18 to 34 Years | 0 (0.0%) | 0 (0.0%) |
| 35 to 64 Years | 44 (3.4%) | 0 (0.0%) |
| 65 to 74 Years | 153 (38.1%) | 35 (10.1%) |
| 75 Years and over | 52 (31.9%) | 110 (57.3%) |
Disability Class: Self-Care Difficulty
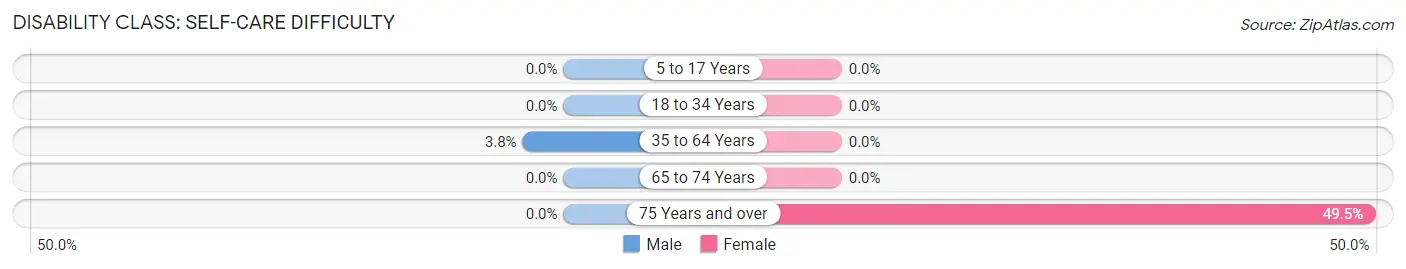
| Age Bracket | Male | Female |
| 5 to 17 Years | 0 (0.0%) | 0 (0.0%) |
| 18 to 34 Years | 0 (0.0%) | 0 (0.0%) |
| 35 to 64 Years | 49 (3.8%) | 0 (0.0%) |
| 65 to 74 Years | 0 (0.0%) | 0 (0.0%) |
| 75 Years and over | 0 (0.0%) | 95 (49.5%) |
Technology Access in Highland Lakes
Computing Device Access in Highland Lakes
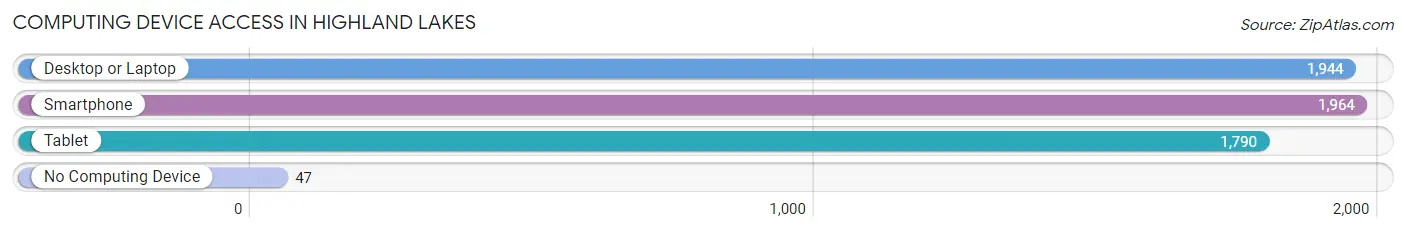
| Device Type | # Households | % Households |
| Desktop or Laptop | 1,944 | 96.7% |
| Smartphone | 1,964 | 97.7% |
| Tablet | 1,790 | 89.0% |
| No Computing Device | 47 | 2.3% |
| Total | 2,011 | 100.0% |
Internet Access in Highland Lakes
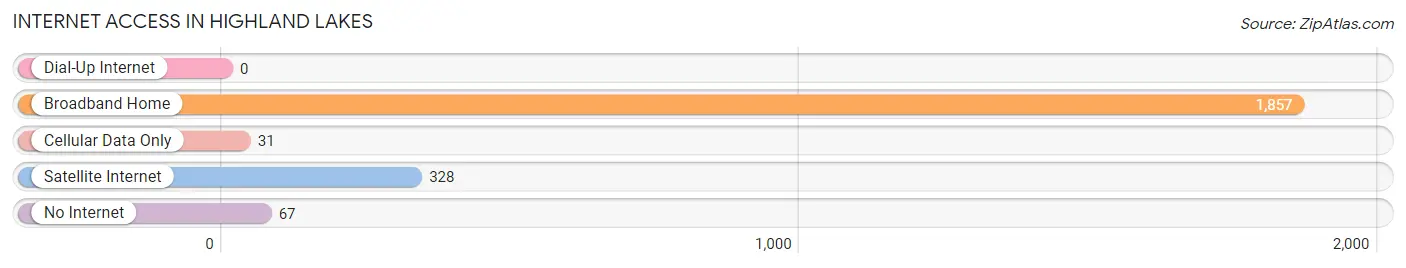
| Internet Type | # Households | % Households |
| Dial-Up Internet | 0 | 0.0% |
| Broadband Home | 1,857 | 92.3% |
| Cellular Data Only | 31 | 1.5% |
| Satellite Internet | 328 | 16.3% |
| No Internet | 67 | 3.3% |
| Total | 2,011 | 100.0% |
Highland Lakes Summary
Highland Lakes is a census-designated place (CDP) located in Blount County, Alabama, United States. It is situated in the foothills of the Appalachian Mountains, approximately 20 miles northeast of Birmingham. The population was 1,845 at the 2010 census.
Geography
Highland Lakes is located at 33 59 45 North 86 30 45 West 33 995833 86 5125
According to the United States Census Bureau, the CDP has a total area of 4.2 square miles (10.8 km2), all land.
History
Highland Lakes was first settled in the early 1800s by settlers from the Appalachian Mountains. The area was originally known as "Highland Valley" and was home to a small farming community. In the late 1800s, the area was renamed "Highland Lakes" after the numerous small lakes in the area.
The area was primarily a rural farming community until the 1950s when the population began to grow due to the influx of people from the nearby cities of Birmingham and Gadsden. The population continued to grow throughout the 1960s and 1970s as more people moved to the area for its rural charm and proximity to the larger cities.
Economy
Highland Lakes is primarily a residential community, with most of its residents commuting to nearby cities for work. The area is home to several small businesses, including a grocery store, a hardware store, and a few restaurants.
Demographics
As of the census of 2000, there were 1,845 people, 745 households, and 545 families residing in the CDP. The population density was 441.3 people per square mile (170.3/km2). There were 809 housing units at an average density of 191.9/sq mi (73.9/km2). The racial makeup of the CDP was 97.2% White, 0.9% Black or African American, 0.2% Native American, 0.2% Asian, 0.2% from other races, and 1.3% from two or more races. 1.1% of the population were Hispanic or Latino of any race.
There were 745 households, out of which 28.2% had children under the age of 18 living with them, 59.2% were married couples living together, 8.7% had a female householder with no husband present, and 28.2% were non-families. 24.3% of all households were made up of individuals, and 10.2% had someone living alone who was 65 years of age or older. The average household size was 2.47 and the average family size was 2.93.
In the CDP, the population was spread out, with 23.2% under the age of 18, 6.7% from 18 to 24, 28.2% from 25 to 44, 26.2% from 45 to 64, and 15.7% who were 65 years of age or older. The median age was 40 years. For every 100 females, there were 97.2 males. For every 100 females age 18 and over, there were 94.2 males.
The median income for a household in the CDP was $37,500, and the median income for a family was $45,000. Males had a median income of $31,250 versus $21,250 for females. The per capita income for the CDP was $17,945. About 6.2% of families and 8.2% of the population were below the poverty line, including 10.2% of those under age 18 and 8.3% of those age 65 or over.
Common Questions
What is Per Capita Income in Highland Lakes?
Per Capita income in Highland Lakes is $83,247.
What is the Median Family Income in Highland Lakes?
Median Family Income in Highland Lakes is $162,467.
What is the Median Household income in Highland Lakes?
Median Household Income in Highland Lakes is $157,868.
What is Income or Wage Gap in Highland Lakes?
Income or Wage Gap in Highland Lakes is 54.2%.
Women in Highland Lakes earn 45.8 cents for every dollar earned by a man.
What is Inequality or Gini Index in Highland Lakes?
Inequality or Gini Index in Highland Lakes is 0.46.
What is the Total Population of Highland Lakes?
Total Population of Highland Lakes is 5,628.
What is the Total Male Population of Highland Lakes?
Total Male Population of Highland Lakes is 2,749.
What is the Total Female Population of Highland Lakes?
Total Female Population of Highland Lakes is 2,879.
What is the Ratio of Males per 100 Females in Highland Lakes?
There are 95.48 Males per 100 Females in Highland Lakes.
What is the Ratio of Females per 100 Males in Highland Lakes?
There are 104.73 Females per 100 Males in Highland Lakes.
What is the Median Population Age in Highland Lakes?
Median Population Age in Highland Lakes is 47.8 Years.
What is the Average Family Size in Highland Lakes
Average Family Size in Highland Lakes is 3.0 People.
What is the Average Household Size in Highland Lakes
Average Household Size in Highland Lakes is 2.8 People.
How Large is the Labor Force in Highland Lakes?
There are 3,165 People in the Labor Forcein in Highland Lakes.
What is the Percentage of People in the Labor Force in Highland Lakes?
66.6% of People are in the Labor Force in Highland Lakes.
What is the Unemployment Rate in Highland Lakes?
Unemployment Rate in Highland Lakes is 2.8%.