Lookout Mountain, AL Map & Demographics
Lookout Mountain Map
Lookout Mountain Overview
$43,942
PER CAPITA INCOME
$65,391
AVG FAMILY INCOME
$32,071
AVG HOUSEHOLD INCOME
25.7%
WAGE / INCOME GAP [ % ]
74.3¢/ $1
WAGE / INCOME GAP [ $ ]
0.63
INEQUALITY / GINI INDEX
1,287
TOTAL POPULATION
800
MALE POPULATION
487
FEMALE POPULATION
164.27
MALES / 100 FEMALES
60.88
FEMALES / 100 MALES
52.6
MEDIAN AGE
3.4
AVG FAMILY SIZE
2.7
AVG HOUSEHOLD SIZE
353
LABOR FORCE [ PEOPLE ]
30.8%
PERCENT IN LABOR FORCE
Income in Lookout Mountain
Income Overview in Lookout Mountain
Per Capita Income in Lookout Mountain is $43,942, while median incomes of families and households are $65,391 and $32,071 respectively.
| Characteristic | Number | Measure |
| Per Capita Income | 1,287 | $43,942 |
| Median Family Income | 297 | $65,391 |
| Mean Family Income | 297 | $123,663 |
| Median Household Income | 462 | $32,071 |
| Mean Household Income | 462 | $89,628 |
| Income Deficit | 297 | $0 |
| Wage / Income Gap (%) | 1,287 | 25.71% |
| Wage / Income Gap ($) | 1,287 | 74.29¢ per $1 |
| Gini / Inequality Index | 1,287 | 0.63 |
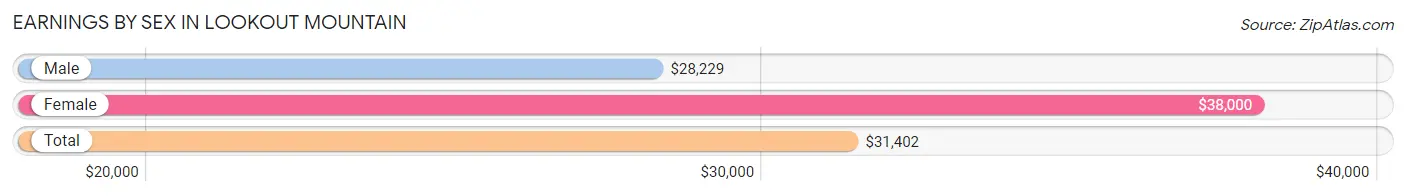
Earnings by Sex in Lookout Mountain
Average Earnings in Lookout Mountain are $31,402, $28,229 for men and $38,000 for women, a difference of 25.7%.
| Sex | Number | Average Earnings |
| Male | 251 (59.3%) | $28,229 |
| Female | 172 (40.7%) | $38,000 |
| Total | 423 (100.0%) | $31,402 |
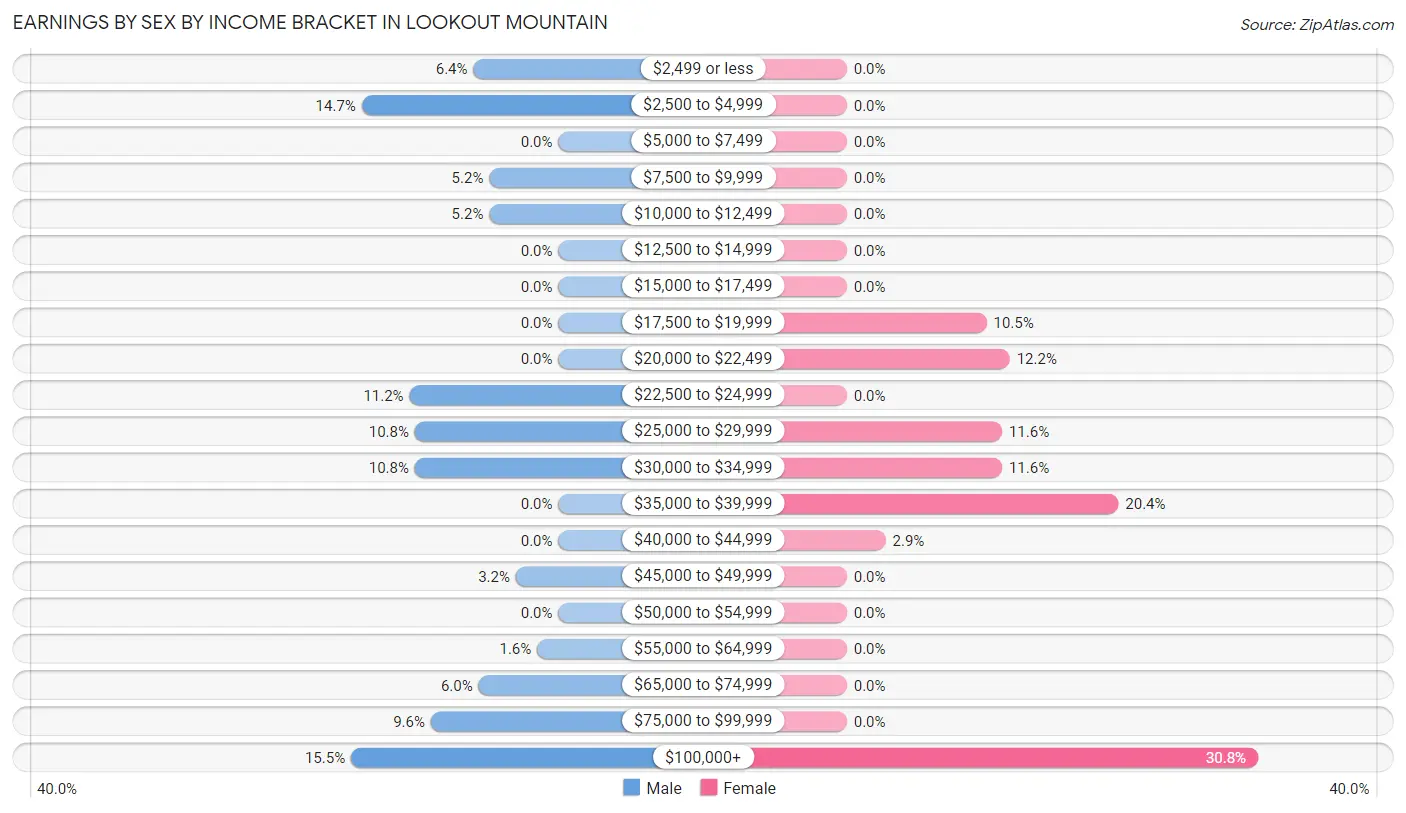
Earnings by Sex by Income Bracket in Lookout Mountain
The most common earnings brackets in Lookout Mountain are $100,000+ for men (39 | 15.5%) and $100,000+ for women (53 | 30.8%).
| Income | Male | Female |
| $2,499 or less | 16 (6.4%) | 0 (0.0%) |
| $2,500 to $4,999 | 37 (14.7%) | 0 (0.0%) |
| $5,000 to $7,499 | 0 (0.0%) | 0 (0.0%) |
| $7,500 to $9,999 | 13 (5.2%) | 0 (0.0%) |
| $10,000 to $12,499 | 13 (5.2%) | 0 (0.0%) |
| $12,500 to $14,999 | 0 (0.0%) | 0 (0.0%) |
| $15,000 to $17,499 | 0 (0.0%) | 0 (0.0%) |
| $17,500 to $19,999 | 0 (0.0%) | 18 (10.5%) |
| $20,000 to $22,499 | 0 (0.0%) | 21 (12.2%) |
| $22,500 to $24,999 | 28 (11.2%) | 0 (0.0%) |
| $25,000 to $29,999 | 27 (10.8%) | 20 (11.6%) |
| $30,000 to $34,999 | 27 (10.8%) | 20 (11.6%) |
| $35,000 to $39,999 | 0 (0.0%) | 35 (20.3%) |
| $40,000 to $44,999 | 0 (0.0%) | 5 (2.9%) |
| $45,000 to $49,999 | 8 (3.2%) | 0 (0.0%) |
| $50,000 to $54,999 | 0 (0.0%) | 0 (0.0%) |
| $55,000 to $64,999 | 4 (1.6%) | 0 (0.0%) |
| $65,000 to $74,999 | 15 (6.0%) | 0 (0.0%) |
| $75,000 to $99,999 | 24 (9.6%) | 0 (0.0%) |
| $100,000+ | 39 (15.5%) | 53 (30.8%) |
| Total | 251 (100.0%) | 172 (100.0%) |
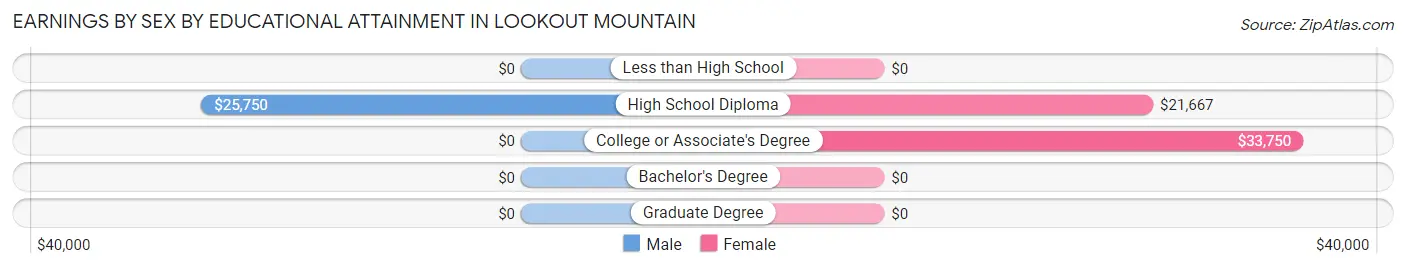
Earnings by Sex by Educational Attainment in Lookout Mountain
| Educational Attainment | Male Income | Female Income |
| Less than High School | - | - |
| High School Diploma | $25,750 | $21,667 |
| College or Associate's Degree | - | - |
| Bachelor's Degree | - | - |
| Graduate Degree | - | - |
| Total | - | - |
Family Income in Lookout Mountain
Family Income Brackets in Lookout Mountain
According to the Lookout Mountain family income data, there are 69 families falling into the $50,000 to $74,999 income range, which is the most common income bracket and makes up 23.2% of all families.
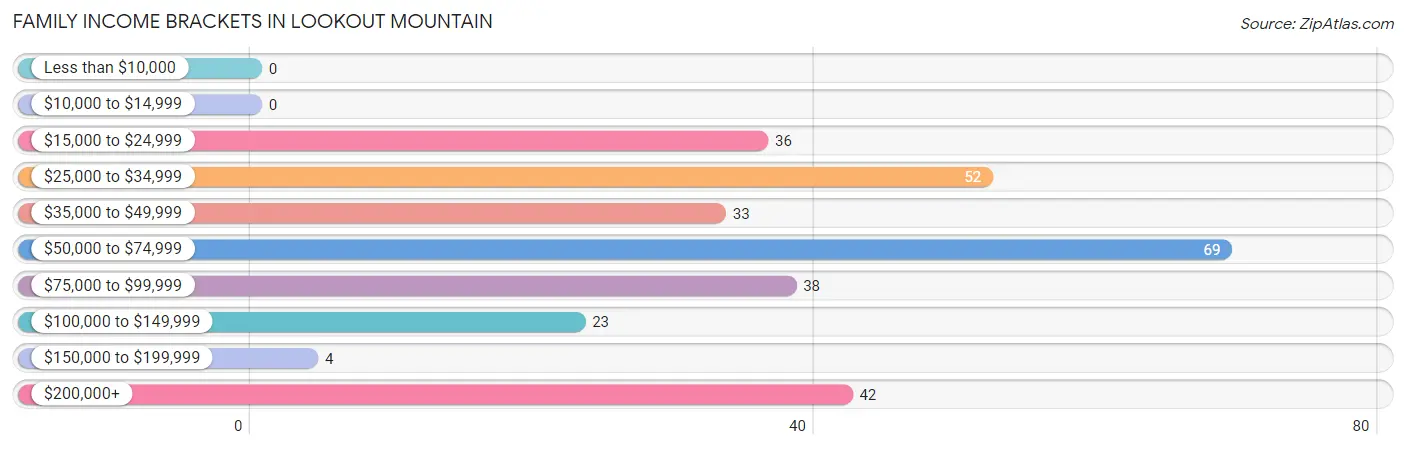
| Income Bracket | # Families | % Families |
| Less than $10,000 | 0 | 0.0% |
| $10,000 to $14,999 | 0 | 0.0% |
| $15,000 to $24,999 | 36 | 12.1% |
| $25,000 to $34,999 | 52 | 17.5% |
| $35,000 to $49,999 | 33 | 11.1% |
| $50,000 to $74,999 | 69 | 23.2% |
| $75,000 to $99,999 | 38 | 12.8% |
| $100,000 to $149,999 | 23 | 7.7% |
| $150,000 to $199,999 | 4 | 1.3% |
| $200,000+ | 42 | 14.1% |
Family Income by Famaliy Size in Lookout Mountain
3-person families (44 | 14.8%) account for the highest median family income in Lookout Mountain with $81,875 per family, while 2-person families (165 | 55.6%) have the highest median income of $28,884 per family member.
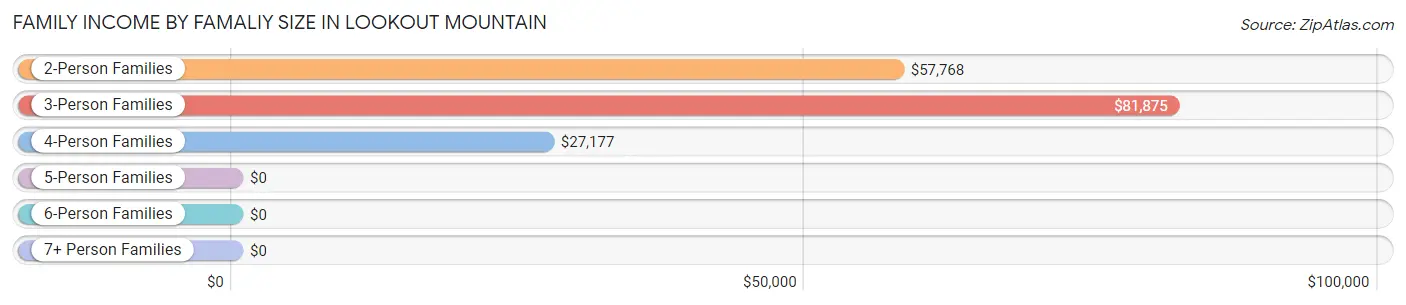
| Income Bracket | # Families | Median Income |
| 2-Person Families | 165 (55.6%) | $57,768 |
| 3-Person Families | 44 (14.8%) | $81,875 |
| 4-Person Families | 54 (18.2%) | $27,177 |
| 5-Person Families | 34 (11.5%) | $0 |
| 6-Person Families | 0 (0.0%) | $0 |
| 7+ Person Families | 0 (0.0%) | $0 |
| Total | 297 (100.0%) | $65,391 |
Family Income by Number of Earners in Lookout Mountain
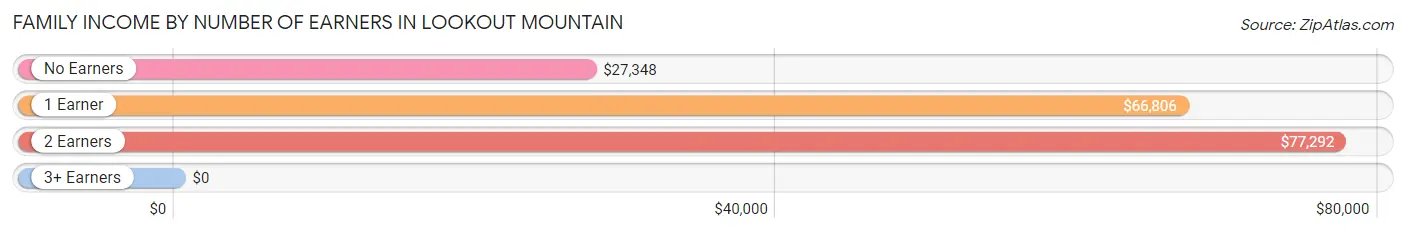
| Number of Earners | # Families | Median Income |
| No Earners | 134 (45.1%) | $27,348 |
| 1 Earner | 53 (17.8%) | $66,806 |
| 2 Earners | 71 (23.9%) | $77,292 |
| 3+ Earners | 39 (13.1%) | $0 |
| Total | 297 (100.0%) | $65,391 |
Household Income in Lookout Mountain
Household Income Brackets in Lookout Mountain
With 97 households falling in the category, the $15,000 to $24,999 income range is the most frequent in Lookout Mountain, accounting for 21.0% of all households. In contrast, only 4 households (0.9%) fall into the $150,000 to $199,999 income bracket, making it the least populous group.
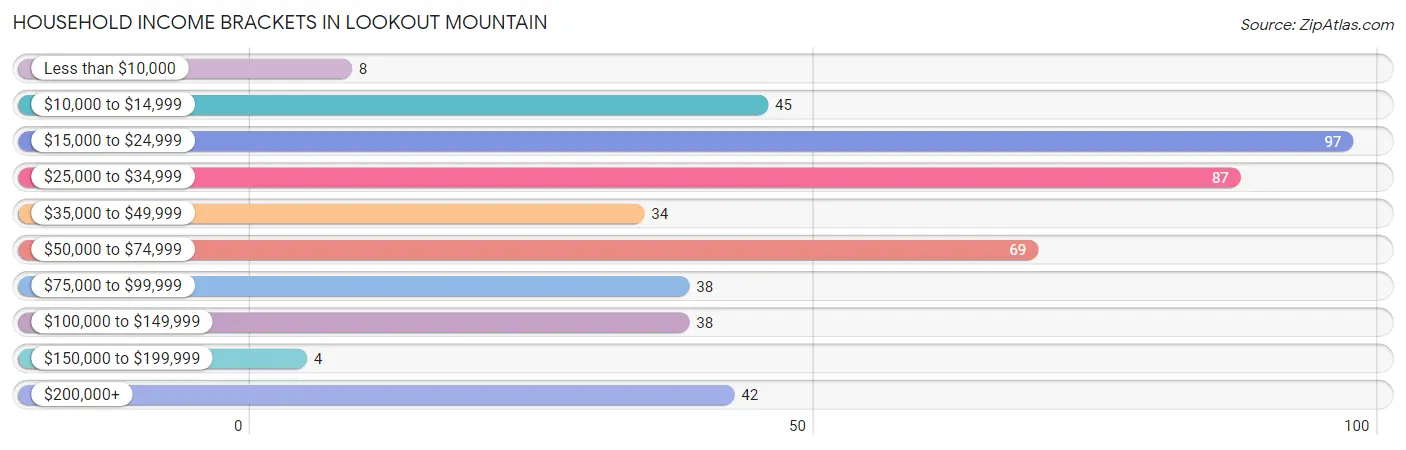
| Income Bracket | # Households | % Households |
| Less than $10,000 | 8 | 1.7% |
| $10,000 to $14,999 | 45 | 9.7% |
| $15,000 to $24,999 | 97 | 21.0% |
| $25,000 to $34,999 | 87 | 18.8% |
| $35,000 to $49,999 | 34 | 7.4% |
| $50,000 to $74,999 | 69 | 14.9% |
| $75,000 to $99,999 | 38 | 8.2% |
| $100,000 to $149,999 | 38 | 8.2% |
| $150,000 to $199,999 | 4 | 0.9% |
| $200,000+ | 42 | 9.1% |
Household Income by Householder Age in Lookout Mountain
The median household income in Lookout Mountain is $32,071, with the highest median household income of $37,768 found in the 65+ years age bracket for the primary householder. A total of 163 households (35.3%) fall into this category.
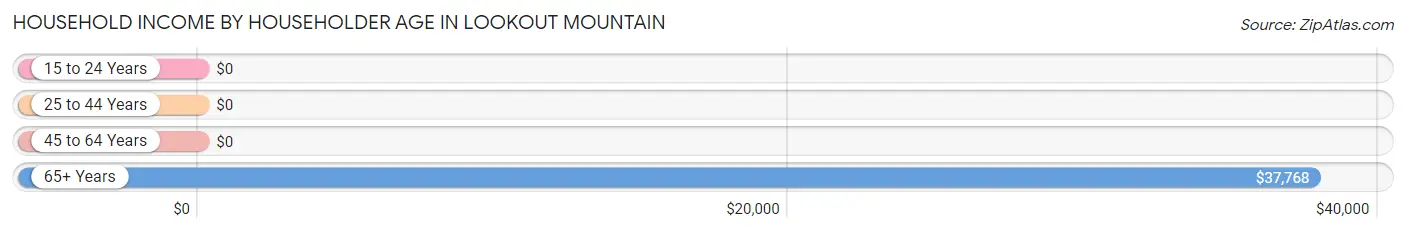
| Income Bracket | # Households | Median Income |
| 15 to 24 Years | 0 (0.0%) | $0 |
| 25 to 44 Years | 29 (6.3%) | $0 |
| 45 to 64 Years | 270 (58.4%) | $0 |
| 65+ Years | 163 (35.3%) | $37,768 |
| Total | 462 (100.0%) | $32,071 |
Poverty in Lookout Mountain
Income Below Poverty by Sex and Age in Lookout Mountain
With 34.3% poverty level for males and 38.8% for females among the residents of Lookout Mountain, 12 to 14 year old males and under 5 year old females are the most vulnerable to poverty, with 34 males (60.7%) and 14 females (100.0%) in their respective age groups living below the poverty level.
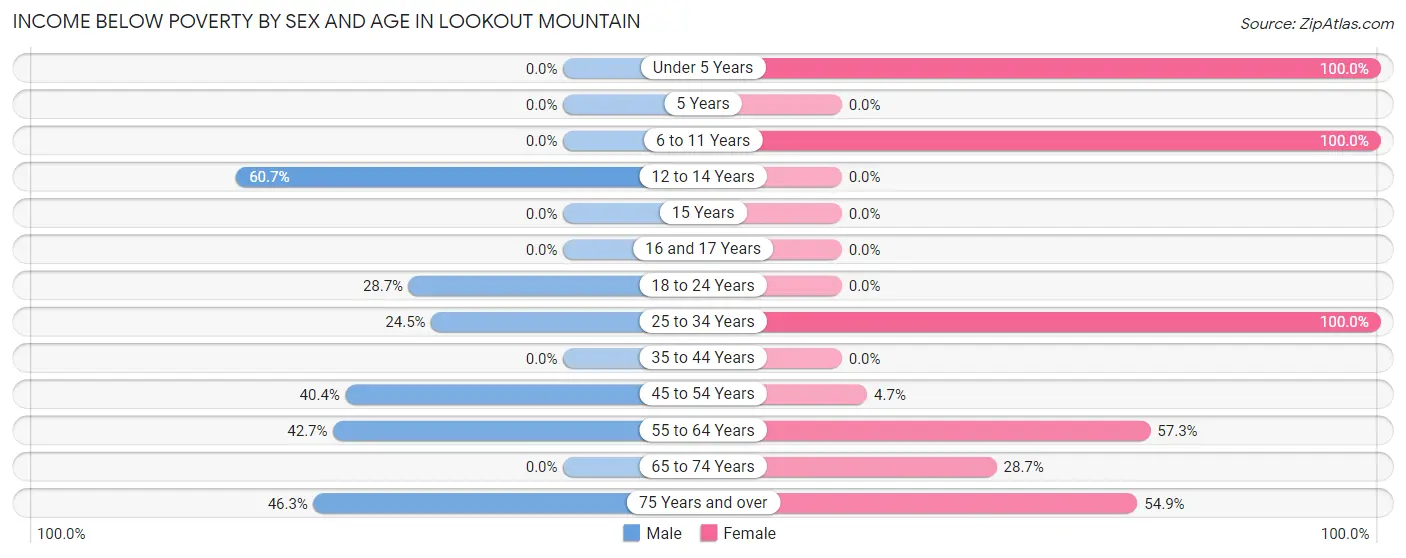
| Age Bracket | Male | Female |
| Under 5 Years | 0 (0.0%) | 14 (100.0%) |
| 5 Years | 0 (0.0%) | 0 (0.0%) |
| 6 to 11 Years | 0 (0.0%) | 15 (100.0%) |
| 12 to 14 Years | 34 (60.7%) | 0 (0.0%) |
| 15 Years | 0 (0.0%) | 0 (0.0%) |
| 16 and 17 Years | 0 (0.0%) | 0 (0.0%) |
| 18 to 24 Years | 45 (28.7%) | 0 (0.0%) |
| 25 to 34 Years | 12 (24.5%) | 10 (100.0%) |
| 35 to 44 Years | 0 (0.0%) | 0 (0.0%) |
| 45 to 54 Years | 59 (40.4%) | 4 (4.7%) |
| 55 to 64 Years | 73 (42.7%) | 59 (57.3%) |
| 65 to 74 Years | 0 (0.0%) | 25 (28.7%) |
| 75 Years and over | 38 (46.3%) | 62 (54.9%) |
| Total | 261 (34.3%) | 189 (38.8%) |
Income Above Poverty by Sex and Age in Lookout Mountain
According to the poverty statistics in Lookout Mountain, males aged 6 to 11 years and females aged 15 years are the age groups that are most secure financially, with 100.0% of males and 100.0% of females in these age groups living above the poverty line.
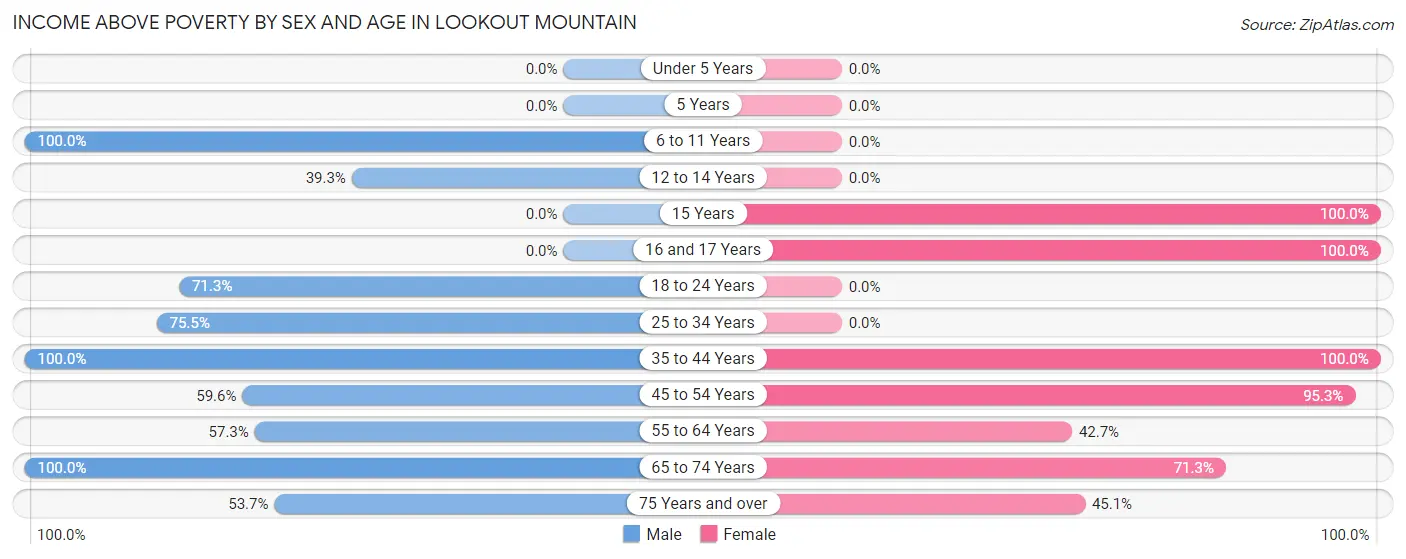
| Age Bracket | Male | Female |
| Under 5 Years | 0 (0.0%) | 0 (0.0%) |
| 5 Years | 0 (0.0%) | 0 (0.0%) |
| 6 to 11 Years | 12 (100.0%) | 0 (0.0%) |
| 12 to 14 Years | 22 (39.3%) | 0 (0.0%) |
| 15 Years | 0 (0.0%) | 10 (100.0%) |
| 16 and 17 Years | 0 (0.0%) | 10 (100.0%) |
| 18 to 24 Years | 112 (71.3%) | 0 (0.0%) |
| 25 to 34 Years | 37 (75.5%) | 0 (0.0%) |
| 35 to 44 Years | 37 (100.0%) | 40 (100.0%) |
| 45 to 54 Years | 87 (59.6%) | 81 (95.3%) |
| 55 to 64 Years | 98 (57.3%) | 44 (42.7%) |
| 65 to 74 Years | 51 (100.0%) | 62 (71.3%) |
| 75 Years and over | 44 (53.7%) | 51 (45.1%) |
| Total | 500 (65.7%) | 298 (61.2%) |
Income Below Poverty Among Married-Couple Families in Lookout Mountain
The poverty statistics for married-couple families in Lookout Mountain show that 17.4% or 41 of the total 235 families live below the poverty line. Families with 1 or 2 children have the highest poverty rate of 100.0%, comprising of 10 families. On the other hand, families with 3 or 4 children have the lowest poverty rate of 0.0%, which includes 0 families.
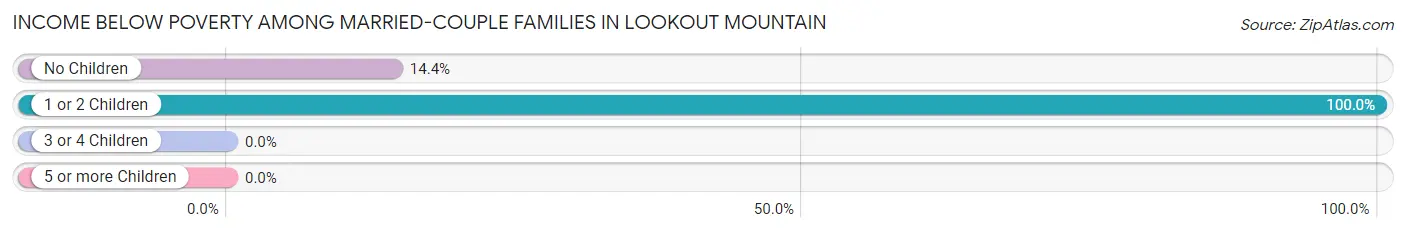
| Children | Above Poverty | Below Poverty |
| No Children | 185 (85.7%) | 31 (14.3%) |
| 1 or 2 Children | 0 (0.0%) | 10 (100.0%) |
| 3 or 4 Children | 9 (100.0%) | 0 (0.0%) |
| 5 or more Children | 0 (0.0%) | 0 (0.0%) |
| Total | 194 (82.6%) | 41 (17.4%) |
Income Below Poverty Among Single-Parent Households in Lookout Mountain
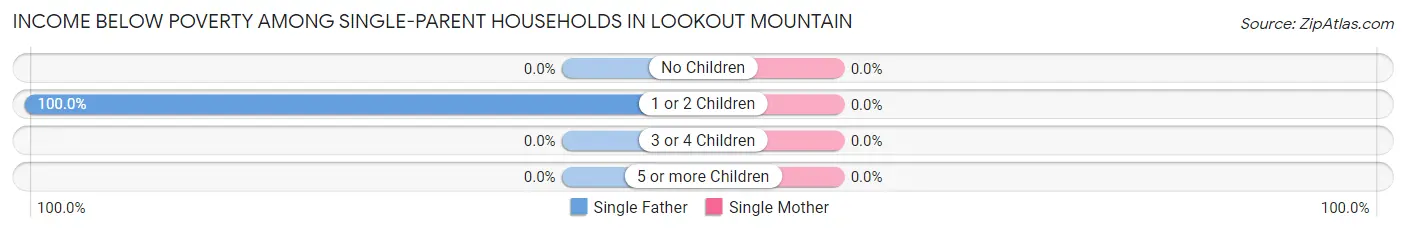
| Children | Single Father | Single Mother |
| No Children | 0 (0.0%) | 0 (0.0%) |
| 1 or 2 Children | 36 (100.0%) | 0 (0.0%) |
| 3 or 4 Children | 0 (0.0%) | 0 (0.0%) |
| 5 or more Children | 0 (0.0%) | 0 (0.0%) |
| Total | 36 (100.0%) | 0 (0.0%) |
Income Below Poverty Among Married-Couple vs Single-Parent Households in Lookout Mountain
The poverty data for Lookout Mountain shows that 41 of the married-couple family households (17.4%) and 36 of the single-parent households (58.1%) are living below the poverty level. Within the married-couple family households, those with 1 or 2 children have the highest poverty rate, with 10 households (100.0%) falling below the poverty line. Among the single-parent households, those with 1 or 2 children have the highest poverty rate, with 36 household (78.3%) living below poverty.
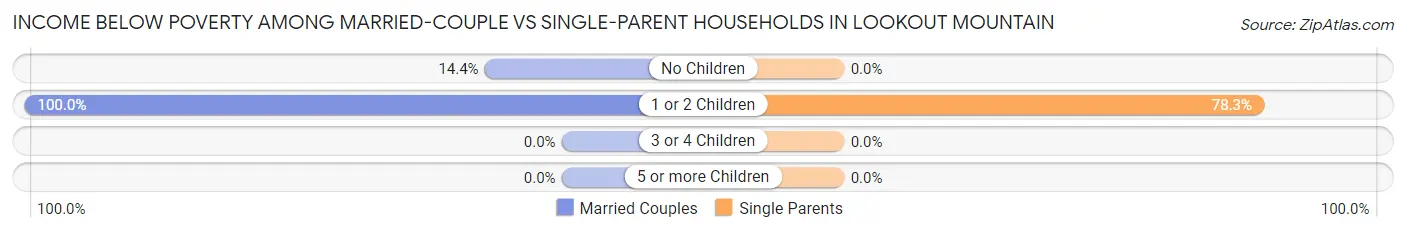
| Children | Married-Couple Families | Single-Parent Households |
| No Children | 31 (14.3%) | 0 (0.0%) |
| 1 or 2 Children | 10 (100.0%) | 36 (78.3%) |
| 3 or 4 Children | 0 (0.0%) | 0 (0.0%) |
| 5 or more Children | 0 (0.0%) | 0 (0.0%) |
| Total | 41 (17.4%) | 36 (58.1%) |
Race in Lookout Mountain
The most populous races in Lookout Mountain are White / Caucasian (1,251 | 97.2%), Black / African American (30 | 2.3%), and Two or more Races (5 | 0.4%).
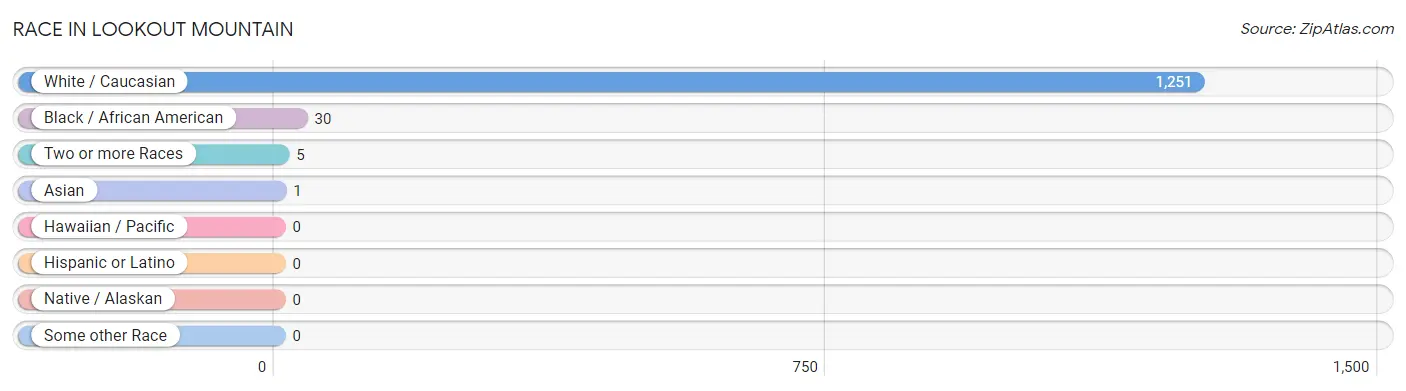
| Race | # Population | % Population |
| Asian | 1 | 0.1% |
| Black / African American | 30 | 2.3% |
| Hawaiian / Pacific | 0 | 0.0% |
| Hispanic or Latino | 0 | 0.0% |
| Native / Alaskan | 0 | 0.0% |
| White / Caucasian | 1,251 | 97.2% |
| Two or more Races | 5 | 0.4% |
| Some other Race | 0 | 0.0% |
| Total | 1,287 | 100.0% |
Ancestry in Lookout Mountain
The most populous ancestries reported in Lookout Mountain are American (286 | 22.2%), English (109 | 8.5%), Irish (100 | 7.8%), German (74 | 5.8%), and Scotch-Irish (17 | 1.3%), together accounting for 45.5% of all Lookout Mountain residents.
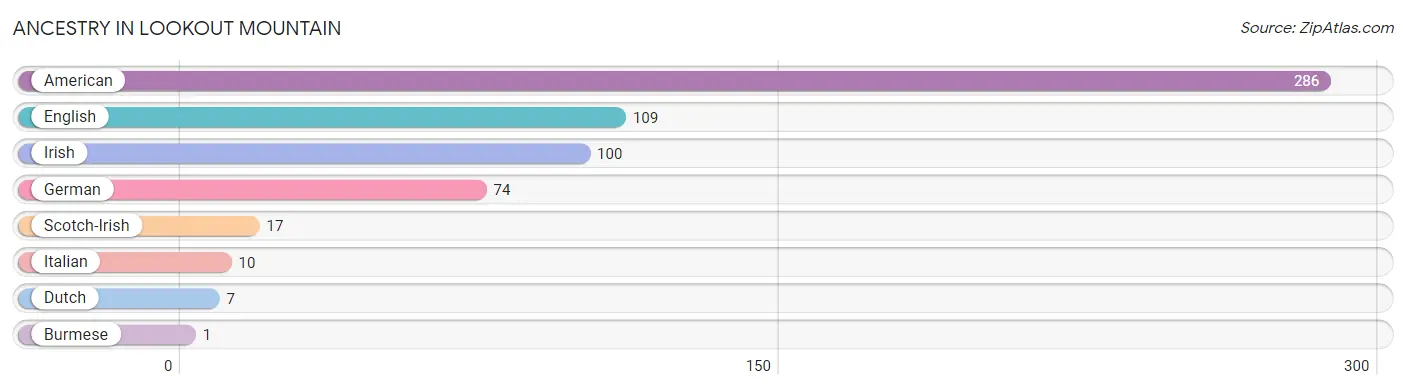
| Ancestry | # Population | % Population |
| American | 286 | 22.2% |
| Burmese | 1 | 0.1% |
| Dutch | 7 | 0.5% |
| English | 109 | 8.5% |
| German | 74 | 5.8% |
| Irish | 100 | 7.8% |
| Italian | 10 | 0.8% |
| Scotch-Irish | 17 | 1.3% | View All 8 Rows |
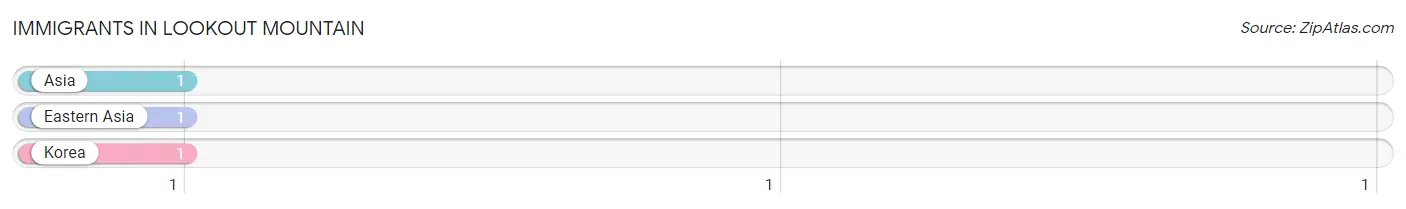
Immigrants in Lookout Mountain
The most numerous immigrant groups reported in Lookout Mountain came from Asia (1 | 0.1%), Eastern Asia (1 | 0.1%), and Korea (1 | 0.1%), together accounting for 0.2% of all Lookout Mountain residents.
| Immigration Origin | # Population | % Population |
| Asia | 1 | 0.1% |
| Eastern Asia | 1 | 0.1% |
| Korea | 1 | 0.1% | View All 3 Rows |
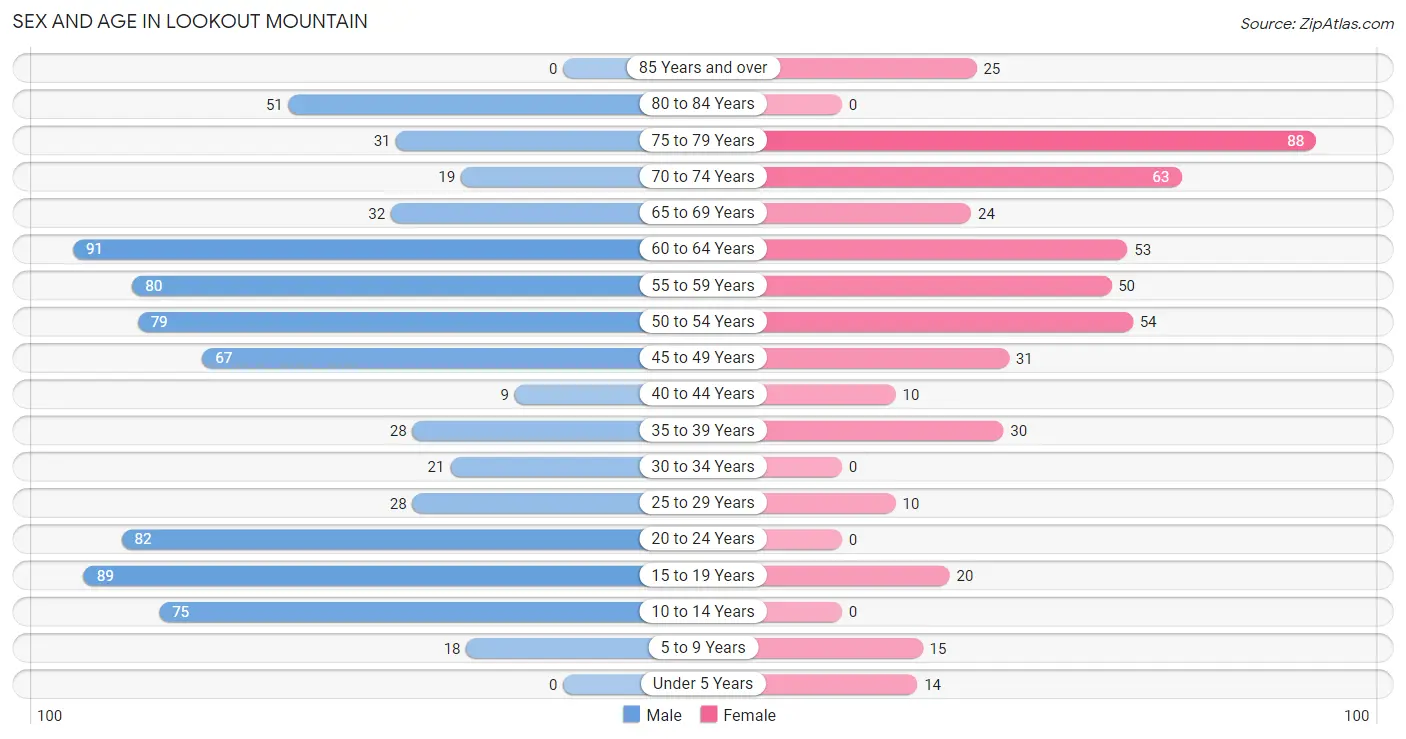
Sex and Age in Lookout Mountain
Sex and Age in Lookout Mountain
The most populous age groups in Lookout Mountain are 60 to 64 Years (91 | 11.4%) for men and 75 to 79 Years (88 | 18.1%) for women.
| Age Bracket | Male | Female |
| Under 5 Years | 0 (0.0%) | 14 (2.9%) |
| 5 to 9 Years | 18 (2.2%) | 15 (3.1%) |
| 10 to 14 Years | 75 (9.4%) | 0 (0.0%) |
| 15 to 19 Years | 89 (11.1%) | 20 (4.1%) |
| 20 to 24 Years | 82 (10.2%) | 0 (0.0%) |
| 25 to 29 Years | 28 (3.5%) | 10 (2.1%) |
| 30 to 34 Years | 21 (2.6%) | 0 (0.0%) |
| 35 to 39 Years | 28 (3.5%) | 30 (6.2%) |
| 40 to 44 Years | 9 (1.1%) | 10 (2.1%) |
| 45 to 49 Years | 67 (8.4%) | 31 (6.4%) |
| 50 to 54 Years | 79 (9.9%) | 54 (11.1%) |
| 55 to 59 Years | 80 (10.0%) | 50 (10.3%) |
| 60 to 64 Years | 91 (11.4%) | 53 (10.9%) |
| 65 to 69 Years | 32 (4.0%) | 24 (4.9%) |
| 70 to 74 Years | 19 (2.4%) | 63 (12.9%) |
| 75 to 79 Years | 31 (3.9%) | 88 (18.1%) |
| 80 to 84 Years | 51 (6.4%) | 0 (0.0%) |
| 85 Years and over | 0 (0.0%) | 25 (5.1%) |
| Total | 800 (100.0%) | 487 (100.0%) |
Families and Households in Lookout Mountain
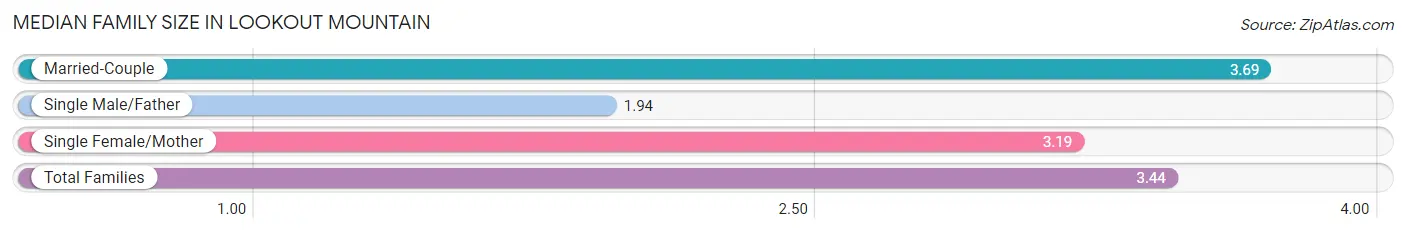
Median Family Size in Lookout Mountain
The median family size in Lookout Mountain is 3.44 persons per family, with married-couple families (235 | 79.1%) accounting for the largest median family size of 3.69 persons per family. On the other hand, single male/father families (36 | 12.1%) represent the smallest median family size with 1.94 persons per family.
| Family Type | # Families | Family Size |
| Married-Couple | 235 (79.1%) | 3.69 |
| Single Male/Father | 36 (12.1%) | 1.94 |
| Single Female/Mother | 26 (8.7%) | 3.19 |
| Total Families | 297 (100.0%) | 3.44 |
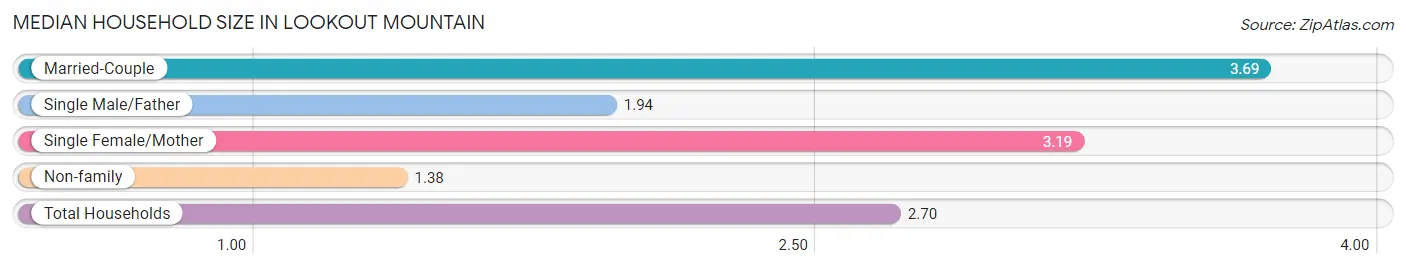
Median Household Size in Lookout Mountain
The median household size in Lookout Mountain is 2.70 persons per household, with married-couple households (235 | 50.9%) accounting for the largest median household size of 3.69 persons per household. non-family households (165 | 35.7%) represent the smallest median household size with 1.38 persons per household.
| Household Type | # Households | Household Size |
| Married-Couple | 235 (50.9%) | 3.69 |
| Single Male/Father | 36 (7.8%) | 1.94 |
| Single Female/Mother | 26 (5.6%) | 3.19 |
| Non-family | 165 (35.7%) | 1.38 |
| Total Households | 462 (100.0%) | 2.70 |
Household Size by Marriage Status in Lookout Mountain
Out of a total of 462 households in Lookout Mountain, 297 (64.3%) are family households, while 165 (35.7%) are nonfamily households. The most numerous type of family households are 2-person households, comprising 165, and the most common type of nonfamily households are 1-person households, comprising 127.
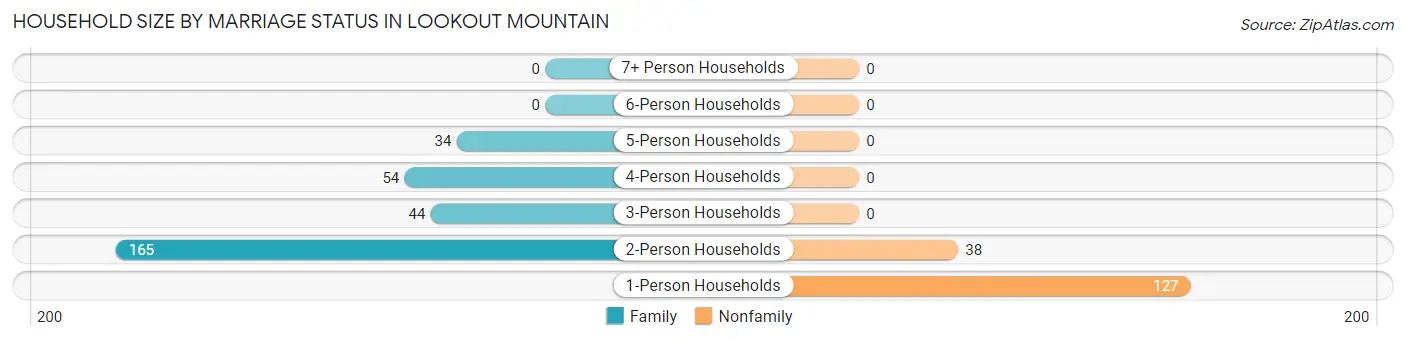
| Household Size | Family Households | Nonfamily Households |
| 1-Person Households | - | 127 (27.5%) |
| 2-Person Households | 165 (35.7%) | 38 (8.2%) |
| 3-Person Households | 44 (9.5%) | 0 (0.0%) |
| 4-Person Households | 54 (11.7%) | 0 (0.0%) |
| 5-Person Households | 34 (7.4%) | 0 (0.0%) |
| 6-Person Households | 0 (0.0%) | 0 (0.0%) |
| 7+ Person Households | 0 (0.0%) | 0 (0.0%) |
| Total | 297 (64.3%) | 165 (35.7%) |
Female Fertility in Lookout Mountain
Fertility by Age in Lookout Mountain
| Age Bracket | Women with Births | Births / 1,000 Women |
| 15 to 19 years | 0 (0.0%) | 0.0 |
| 20 to 34 years | 0 (0.0%) | 0.0 |
| 35 to 50 years | 0 (0.0%) | 0.0 |
| Total | 0 (0.0%) | 0.0 |
Fertility by Age by Marriage Status in Lookout Mountain
| Age Bracket | Married | Unmarried |
| 15 to 19 years | 0 (0.0%) | 0 (0.0%) |
| 20 to 34 years | 0 (0.0%) | 0 (0.0%) |
| 35 to 50 years | 0 (0.0%) | 0 (0.0%) |
| Total | 0 (0.0%) | 0 (0.0%) |
Fertility by Education in Lookout Mountain
| Educational Attainment | Women with Births | Births / 1,000 Women |
| Less than High School | 0 (0.0%) | 0.0 |
| High School Diploma | 0 (0.0%) | 0.0 |
| College or Associate's Degree | 0 (0.0%) | 0.0 |
| Bachelor's Degree | 0 (0.0%) | 0.0 |
| Graduate Degree | 0 (0.0%) | 0.0 |
| Total | 0 (0.0%) | 0.0 |
Fertility by Education by Marriage Status in Lookout Mountain
| Educational Attainment | Married | Unmarried |
| Less than High School | 0 (0.0%) | 0 (0.0%) |
| High School Diploma | 0 (0.0%) | 0 (0.0%) |
| College or Associate's Degree | 0 (0.0%) | 0 (0.0%) |
| Bachelor's Degree | 0 (0.0%) | 0 (0.0%) |
| Graduate Degree | 0 (0.0%) | 0 (0.0%) |
| Total | 0 (0.0%) | 0 (0.0%) |
Employment Characteristics in Lookout Mountain
Employment by Class of Employer in Lookout Mountain
Among the 341 employed individuals in Lookout Mountain, private company employees (219 | 64.2%), local government employees (51 | 15.0%), and state government employees (32 | 9.4%) make up the most common classes of employment.
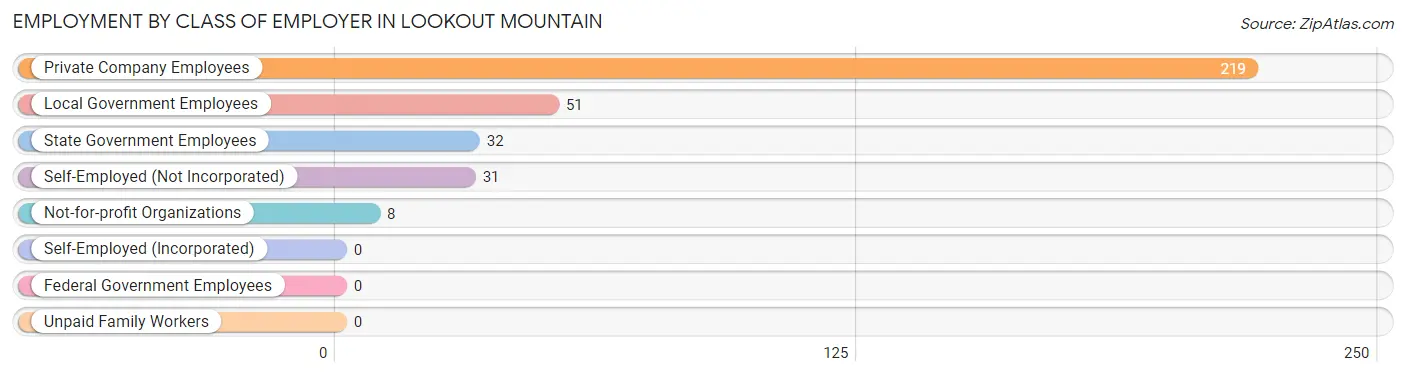
| Employer Class | # Employees | % Employees |
| Private Company Employees | 219 | 64.2% |
| Self-Employed (Incorporated) | 0 | 0.0% |
| Self-Employed (Not Incorporated) | 31 | 9.1% |
| Not-for-profit Organizations | 8 | 2.4% |
| Local Government Employees | 51 | 15.0% |
| State Government Employees | 32 | 9.4% |
| Federal Government Employees | 0 | 0.0% |
| Unpaid Family Workers | 0 | 0.0% |
| Total | 341 | 100.0% |
Employment Status by Age in Lookout Mountain
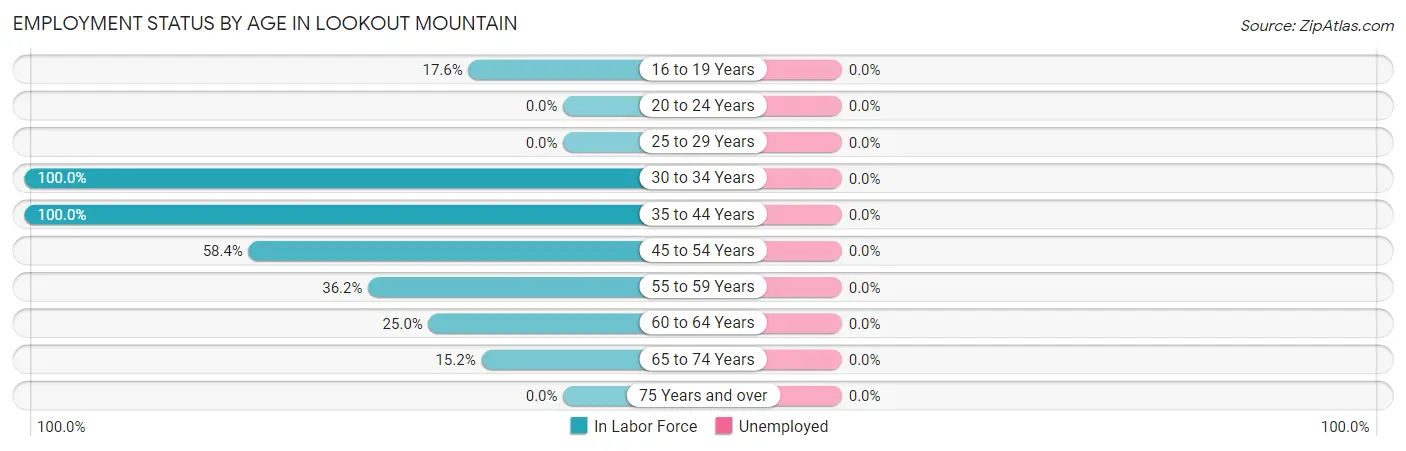
| Age Bracket | In Labor Force | Unemployed |
| 16 to 19 Years | 16 (17.6%) | 0 (0.0%) |
| 20 to 24 Years | 0 (0.0%) | 0 (0.0%) |
| 25 to 29 Years | 0 (0.0%) | 0 (0.0%) |
| 30 to 34 Years | 21 (100.0%) | 0 (0.0%) |
| 35 to 44 Years | 77 (100.0%) | 0 (0.0%) |
| 45 to 54 Years | 135 (58.4%) | 0 (0.0%) |
| 55 to 59 Years | 47 (36.2%) | 0 (0.0%) |
| 60 to 64 Years | 36 (25.0%) | 0 (0.0%) |
| 65 to 74 Years | 21 (15.2%) | 0 (0.0%) |
| 75 Years and over | 0 (0.0%) | 0 (0.0%) |
| Total | 353 (30.8%) | 0 (0.0%) |
Employment Status by Educational Attainment in Lookout Mountain
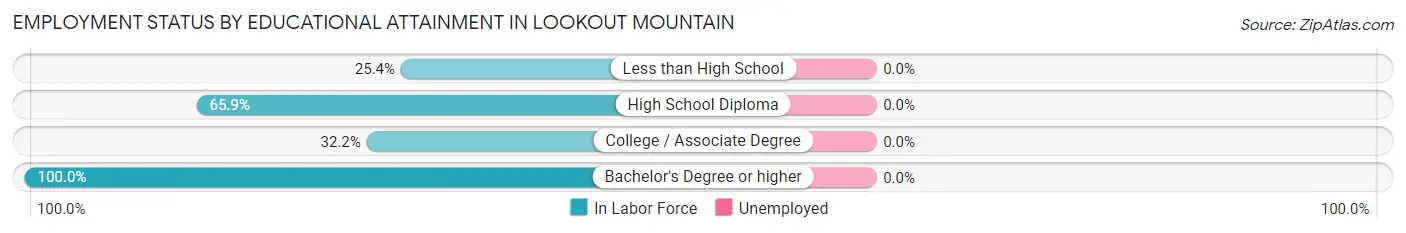
| Educational Attainment | In Labor Force | Unemployed |
| Less than High School | 45 (25.4%) | 0 (0.0%) |
| High School Diploma | 108 (65.9%) | 0 (0.0%) |
| College / Associate Degree | 65 (32.2%) | 0 (0.0%) |
| Bachelor's Degree or higher | 98 (100.0%) | 0 (0.0%) |
| Total | 316 (49.3%) | 0 (0.0%) |
Employment Occupations by Sex in Lookout Mountain
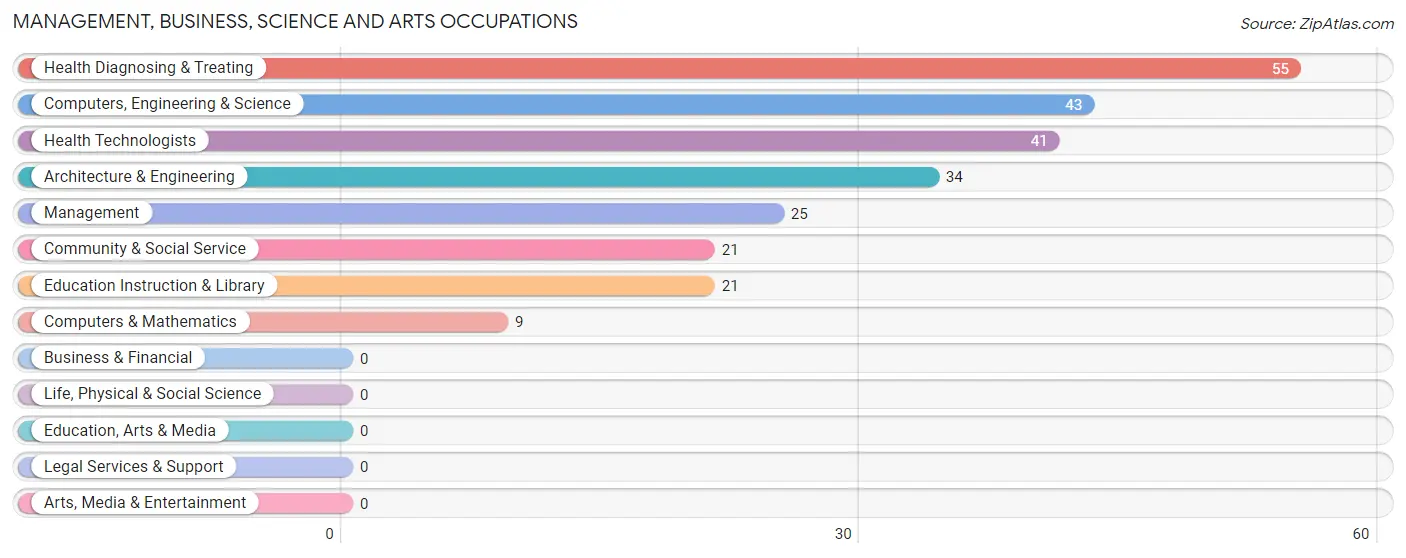
Management, Business, Science and Arts Occupations
The most common Management, Business, Science and Arts occupations in Lookout Mountain are Health Diagnosing & Treating (55 | 15.6%), Computers, Engineering & Science (43 | 12.2%), Health Technologists (41 | 11.6%), Architecture & Engineering (34 | 9.6%), and Management (25 | 7.1%).
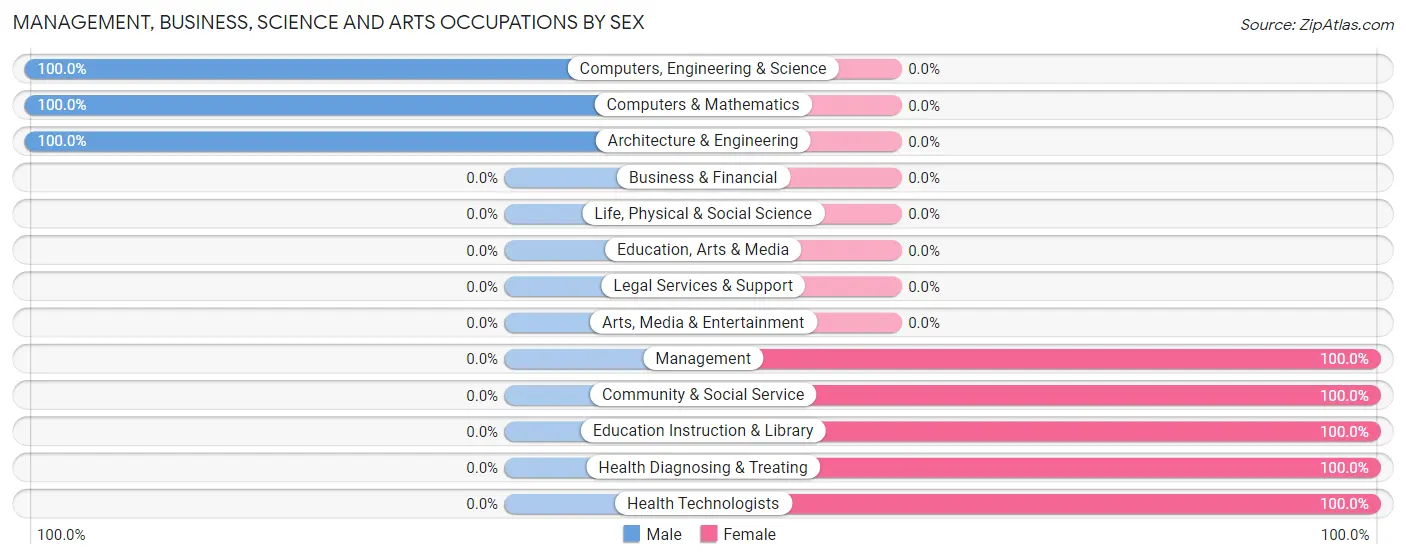
Management, Business, Science and Arts Occupations by Sex
Within the Management, Business, Science and Arts occupations in Lookout Mountain, the most male-oriented occupations are Computers, Engineering & Science (100.0%), Computers & Mathematics (100.0%), and Architecture & Engineering (100.0%), while the most female-oriented occupations are Management (100.0%), Community & Social Service (100.0%), and Education Instruction & Library (100.0%).
| Occupation | Male | Female |
| Management | 0 (0.0%) | 25 (100.0%) |
| Business & Financial | 0 (0.0%) | 0 (0.0%) |
| Computers, Engineering & Science | 43 (100.0%) | 0 (0.0%) |
| Computers & Mathematics | 9 (100.0%) | 0 (0.0%) |
| Architecture & Engineering | 34 (100.0%) | 0 (0.0%) |
| Life, Physical & Social Science | 0 (0.0%) | 0 (0.0%) |
| Community & Social Service | 0 (0.0%) | 21 (100.0%) |
| Education, Arts & Media | 0 (0.0%) | 0 (0.0%) |
| Legal Services & Support | 0 (0.0%) | 0 (0.0%) |
| Education Instruction & Library | 0 (0.0%) | 21 (100.0%) |
| Arts, Media & Entertainment | 0 (0.0%) | 0 (0.0%) |
| Health Diagnosing & Treating | 0 (0.0%) | 55 (100.0%) |
| Health Technologists | 0 (0.0%) | 41 (100.0%) |
| Total (Category) | 43 (29.9%) | 101 (70.1%) |
| Total (Overall) | 181 (51.3%) | 172 (48.7%) |
Services Occupations
Services Occupations by Sex
| Occupation | Male | Female |
| Healthcare Support | 0 (0.0%) | 0 (0.0%) |
| Security & Protection | 0 (0.0%) | 0 (0.0%) |
| Firefighting & Prevention | 0 (0.0%) | 0 (0.0%) |
| Law Enforcement | 0 (0.0%) | 0 (0.0%) |
| Food Preparation & Serving | 0 (0.0%) | 0 (0.0%) |
| Cleaning & Maintenance | 0 (0.0%) | 0 (0.0%) |
| Personal Care & Service | 0 (0.0%) | 0 (0.0%) |
| Total (Category) | 0 (0.0%) | 0 (0.0%) |
| Total (Overall) | 181 (51.3%) | 172 (48.7%) |
Sales and Office Occupations
The most common Sales and Office occupations in Lookout Mountain are Office & Administration (71 | 20.1%), and Sales & Related (8 | 2.3%).
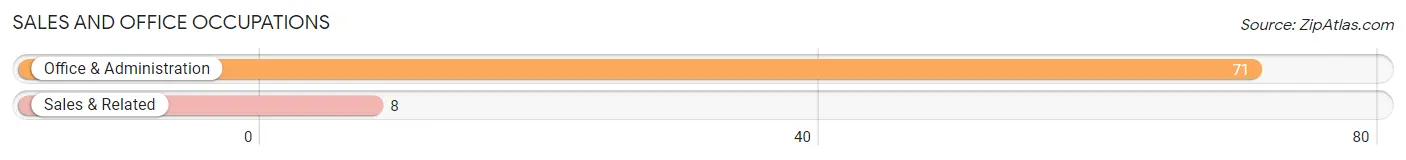
Sales and Office Occupations by Sex
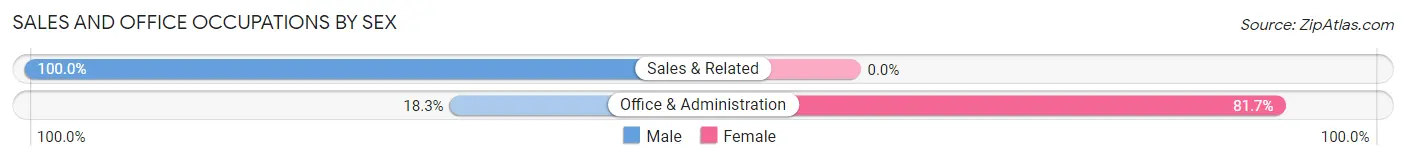
| Occupation | Male | Female |
| Sales & Related | 8 (100.0%) | 0 (0.0%) |
| Office & Administration | 13 (18.3%) | 58 (81.7%) |
| Total (Category) | 21 (26.6%) | 58 (73.4%) |
| Total (Overall) | 181 (51.3%) | 172 (48.7%) |
Natural Resources, Construction and Maintenance Occupations
The most common Natural Resources, Construction and Maintenance occupations in Lookout Mountain are Construction & Extraction (67 | 19.0%), and Installation, Maintenance & Repair (15 | 4.3%).
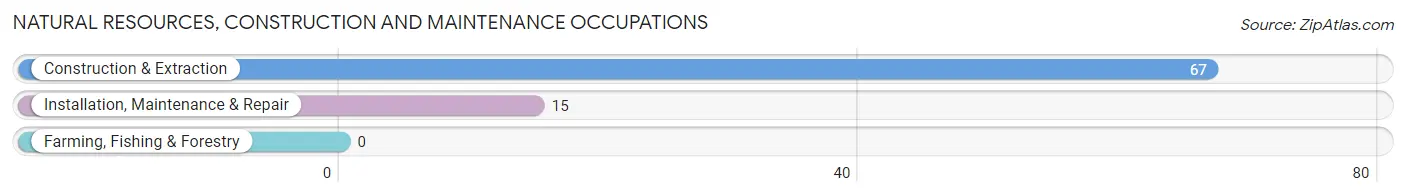
Natural Resources, Construction and Maintenance Occupations by Sex
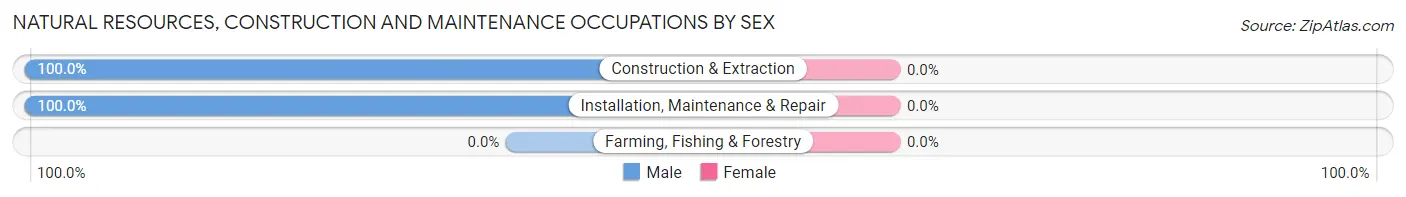
| Occupation | Male | Female |
| Farming, Fishing & Forestry | 0 (0.0%) | 0 (0.0%) |
| Construction & Extraction | 67 (100.0%) | 0 (0.0%) |
| Installation, Maintenance & Repair | 15 (100.0%) | 0 (0.0%) |
| Total (Category) | 82 (100.0%) | 0 (0.0%) |
| Total (Overall) | 181 (51.3%) | 172 (48.7%) |
Production, Transportation and Moving Occupations
The most common Production, Transportation and Moving occupations in Lookout Mountain are Production (28 | 7.9%), and Material Moving (20 | 5.7%).
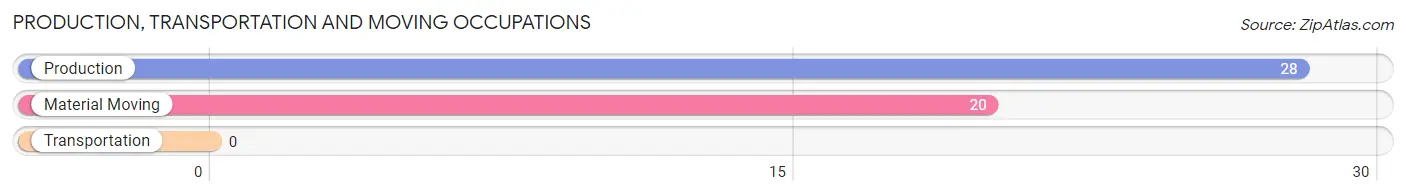
Production, Transportation and Moving Occupations by Sex
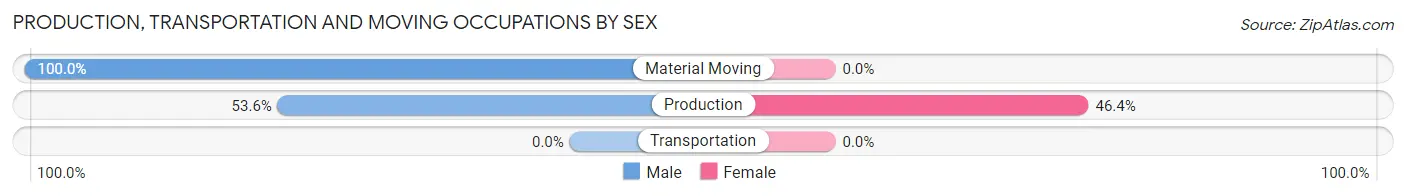
| Occupation | Male | Female |
| Production | 15 (53.6%) | 13 (46.4%) |
| Transportation | 0 (0.0%) | 0 (0.0%) |
| Material Moving | 20 (100.0%) | 0 (0.0%) |
| Total (Category) | 35 (72.9%) | 13 (27.1%) |
| Total (Overall) | 181 (51.3%) | 172 (48.7%) |
Employment Industries by Sex in Lookout Mountain
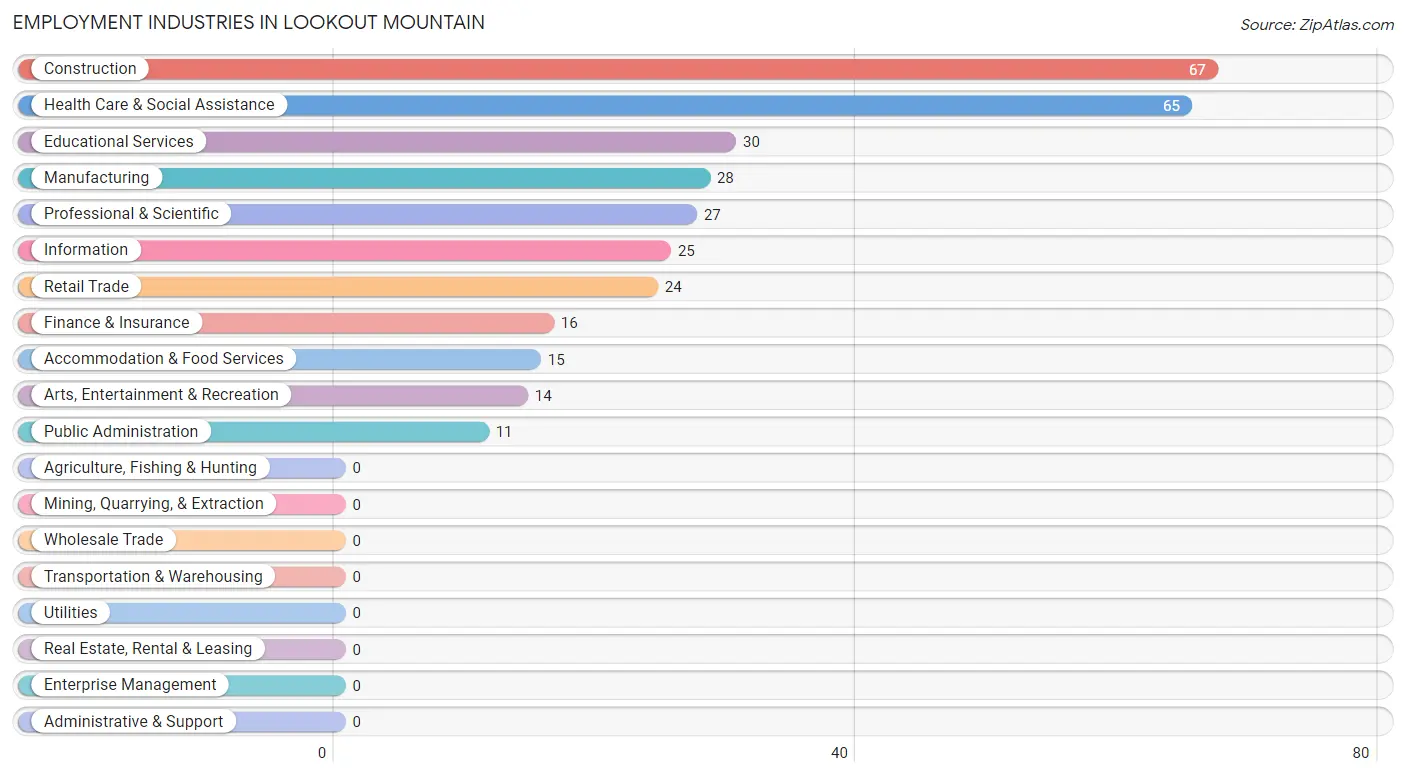
Employment Industries in Lookout Mountain
The major employment industries in Lookout Mountain include Construction (67 | 19.0%), Health Care & Social Assistance (65 | 18.4%), Educational Services (30 | 8.5%), Manufacturing (28 | 7.9%), and Professional & Scientific (27 | 7.6%).
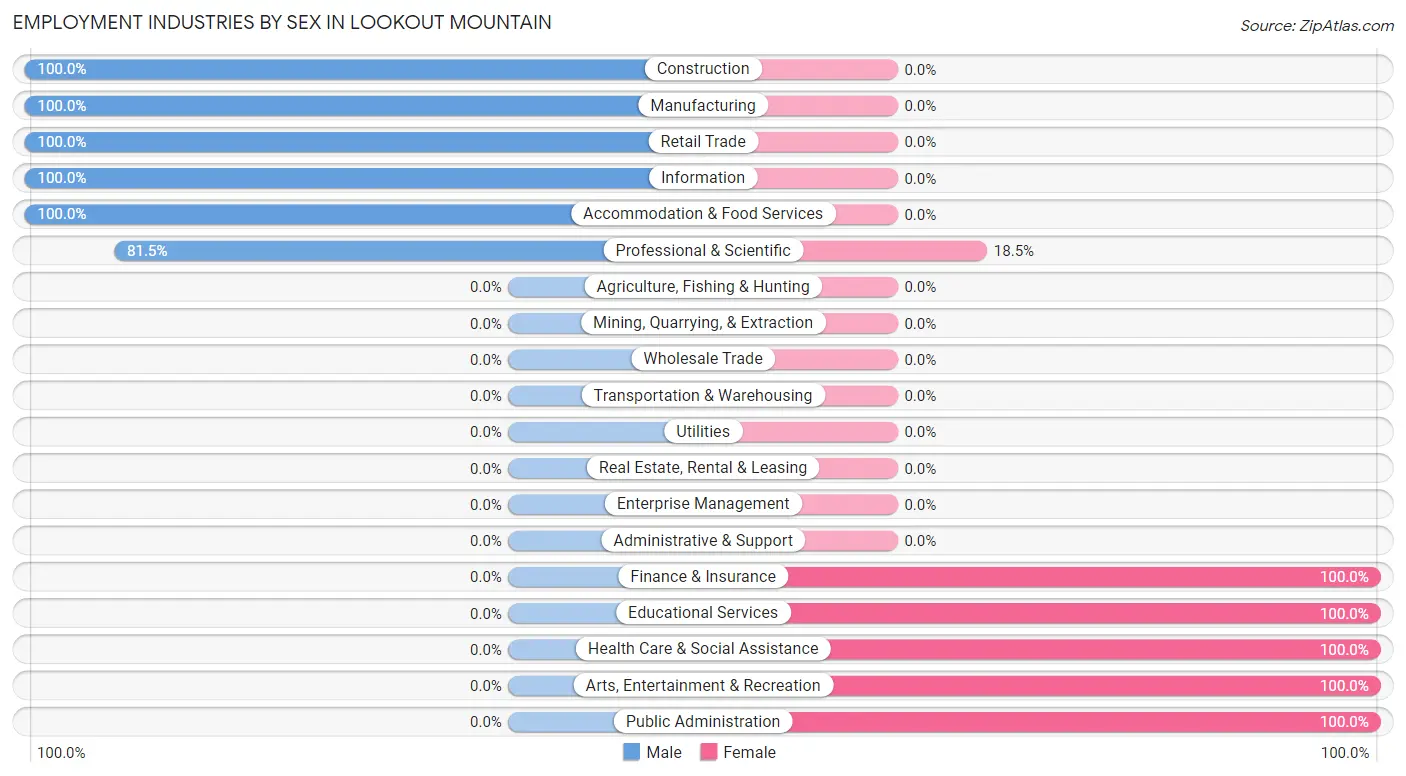
Employment Industries by Sex in Lookout Mountain
The Lookout Mountain industries that see more men than women are Construction (100.0%), Manufacturing (100.0%), and Retail Trade (100.0%), whereas the industries that tend to have a higher number of women are Finance & Insurance (100.0%), Educational Services (100.0%), and Health Care & Social Assistance (100.0%).
| Industry | Male | Female |
| Agriculture, Fishing & Hunting | 0 (0.0%) | 0 (0.0%) |
| Mining, Quarrying, & Extraction | 0 (0.0%) | 0 (0.0%) |
| Construction | 67 (100.0%) | 0 (0.0%) |
| Manufacturing | 28 (100.0%) | 0 (0.0%) |
| Wholesale Trade | 0 (0.0%) | 0 (0.0%) |
| Retail Trade | 24 (100.0%) | 0 (0.0%) |
| Transportation & Warehousing | 0 (0.0%) | 0 (0.0%) |
| Utilities | 0 (0.0%) | 0 (0.0%) |
| Information | 25 (100.0%) | 0 (0.0%) |
| Finance & Insurance | 0 (0.0%) | 16 (100.0%) |
| Real Estate, Rental & Leasing | 0 (0.0%) | 0 (0.0%) |
| Professional & Scientific | 22 (81.5%) | 5 (18.5%) |
| Enterprise Management | 0 (0.0%) | 0 (0.0%) |
| Administrative & Support | 0 (0.0%) | 0 (0.0%) |
| Educational Services | 0 (0.0%) | 30 (100.0%) |
| Health Care & Social Assistance | 0 (0.0%) | 65 (100.0%) |
| Arts, Entertainment & Recreation | 0 (0.0%) | 14 (100.0%) |
| Accommodation & Food Services | 15 (100.0%) | 0 (0.0%) |
| Public Administration | 0 (0.0%) | 11 (100.0%) |
| Total | 181 (51.3%) | 172 (48.7%) |
Education in Lookout Mountain
School Enrollment in Lookout Mountain
The most common levels of schooling among the 312 students in Lookout Mountain are high school (119 | 38.1%), middle school (81 | 26.0%), and graduate / professional (42 | 13.5%).
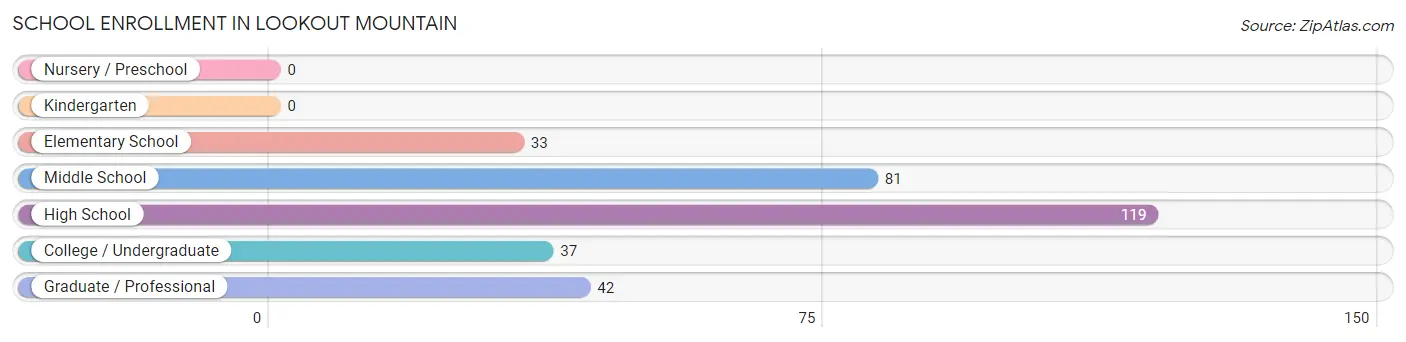
| School Level | # Students | % Students |
| Nursery / Preschool | 0 | 0.0% |
| Kindergarten | 0 | 0.0% |
| Elementary School | 33 | 10.6% |
| Middle School | 81 | 26.0% |
| High School | 119 | 38.1% |
| College / Undergraduate | 37 | 11.9% |
| Graduate / Professional | 42 | 13.5% |
| Total | 312 | 100.0% |
School Enrollment by Age by Funding Source in Lookout Mountain
Out of a total of 312 students who are enrolled in schools in Lookout Mountain, 18 (5.8%) attend a private institution, while the remaining 294 (94.2%) are enrolled in public schools. The age group of 15 to 17 year olds has the highest likelihood of being enrolled in private schools, with 8 (23.5% in the age bracket) enrolled. Conversely, the age group of 5 to 9 year old has the lowest likelihood of being enrolled in a private school, with 33 (100.0% in the age bracket) attending a public institution.
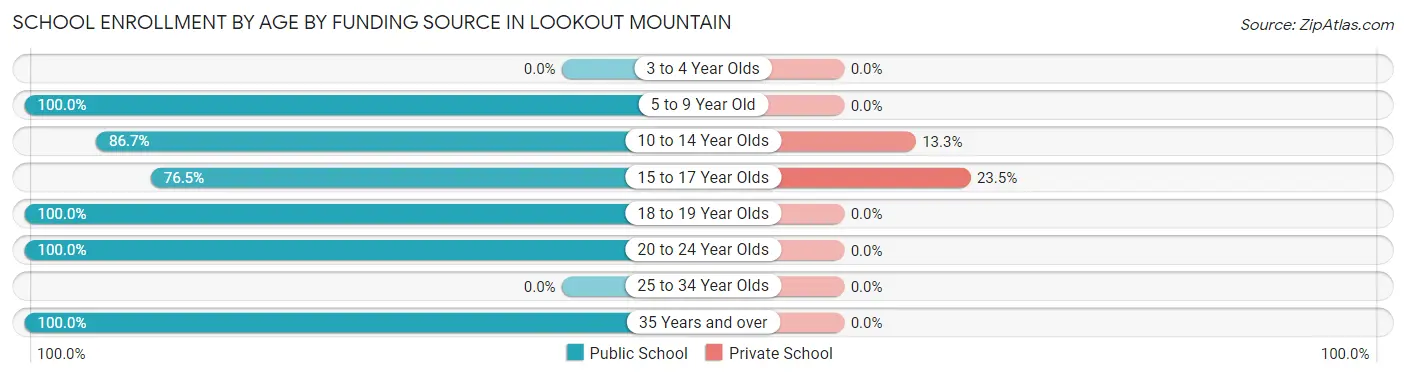
| Age Bracket | Public School | Private School |
| 3 to 4 Year Olds | 0 (0.0%) | 0 (0.0%) |
| 5 to 9 Year Old | 33 (100.0%) | 0 (0.0%) |
| 10 to 14 Year Olds | 65 (86.7%) | 10 (13.3%) |
| 15 to 17 Year Olds | 26 (76.5%) | 8 (23.5%) |
| 18 to 19 Year Olds | 59 (100.0%) | 0 (0.0%) |
| 20 to 24 Year Olds | 37 (100.0%) | 0 (0.0%) |
| 25 to 34 Year Olds | 0 (0.0%) | 0 (0.0%) |
| 35 Years and over | 74 (100.0%) | 0 (0.0%) |
| Total | 294 (94.2%) | 18 (5.8%) |
Educational Attainment by Field of Study in Lookout Mountain
Science & technology (43 | 33.3%), engineering (25 | 19.4%), business (22 | 17.1%), education (21 | 16.3%), and bio, nature & agricultural (10 | 7.7%) are the most common fields of study among 129 individuals in Lookout Mountain who have obtained a bachelor's degree or higher.
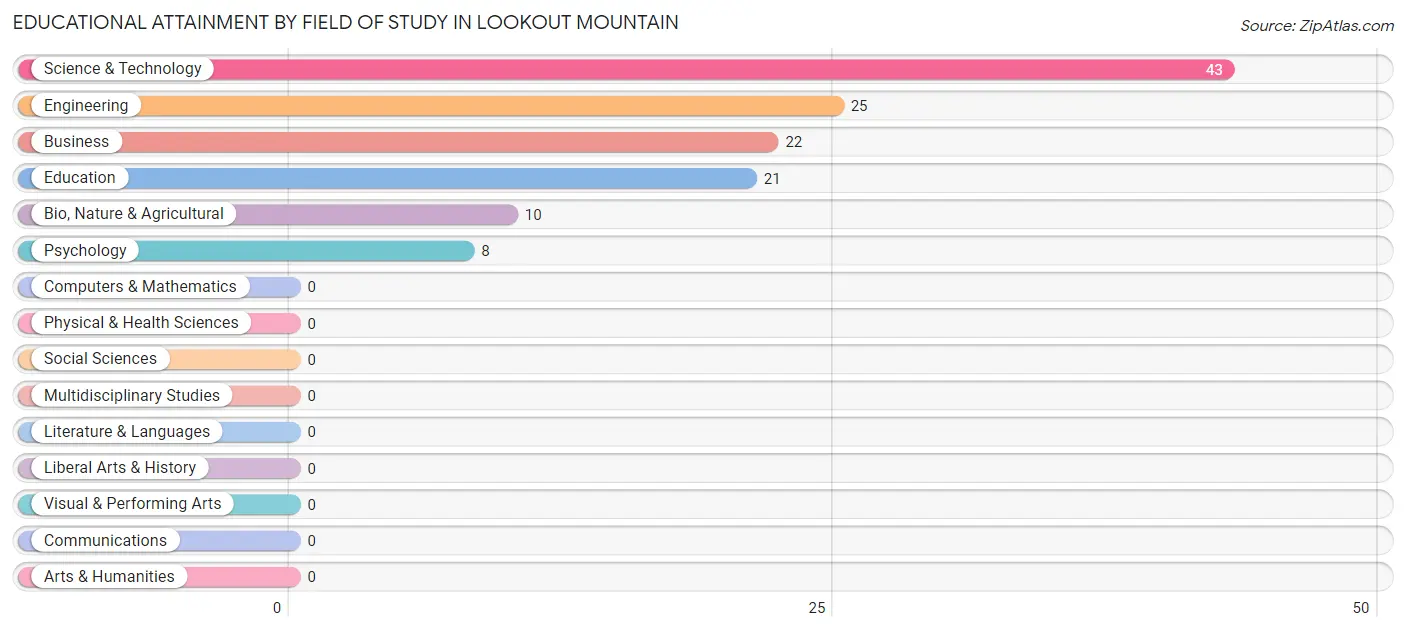
| Field of Study | # Graduates | % Graduates |
| Computers & Mathematics | 0 | 0.0% |
| Bio, Nature & Agricultural | 10 | 7.7% |
| Physical & Health Sciences | 0 | 0.0% |
| Psychology | 8 | 6.2% |
| Social Sciences | 0 | 0.0% |
| Engineering | 25 | 19.4% |
| Multidisciplinary Studies | 0 | 0.0% |
| Science & Technology | 43 | 33.3% |
| Business | 22 | 17.1% |
| Education | 21 | 16.3% |
| Literature & Languages | 0 | 0.0% |
| Liberal Arts & History | 0 | 0.0% |
| Visual & Performing Arts | 0 | 0.0% |
| Communications | 0 | 0.0% |
| Arts & Humanities | 0 | 0.0% |
| Total | 129 | 100.0% |
Transportation & Commute in Lookout Mountain
Vehicle Availability by Sex in Lookout Mountain
The most prevalent vehicle ownership categories in Lookout Mountain are males with 3 vehicles (92, accounting for 54.4%) and females with 3 vehicles (77, making up 53.5%).
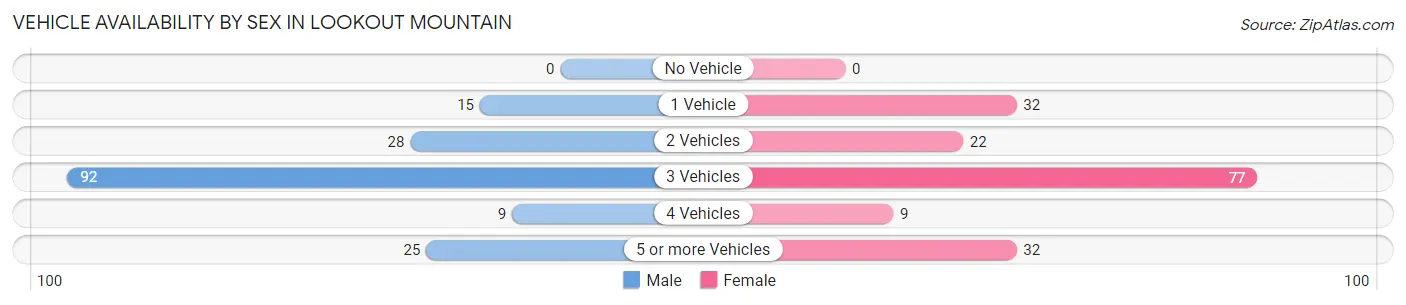
| Vehicles Available | Male | Female |
| No Vehicle | 0 (0.0%) | 0 (0.0%) |
| 1 Vehicle | 15 (8.9%) | 32 (18.6%) |
| 2 Vehicles | 28 (16.6%) | 22 (12.8%) |
| 3 Vehicles | 92 (54.4%) | 77 (44.8%) |
| 4 Vehicles | 9 (5.3%) | 9 (5.2%) |
| 5 or more Vehicles | 25 (14.8%) | 32 (18.6%) |
| Total | 169 (100.0%) | 172 (100.0%) |
Commute Time in Lookout Mountain
The most frequently occuring commute durations in Lookout Mountain are 20 to 24 minutes (85 commuters, 24.9%), 30 to 34 minutes (57 commuters, 16.7%), and 10 to 14 minutes (55 commuters, 16.1%).
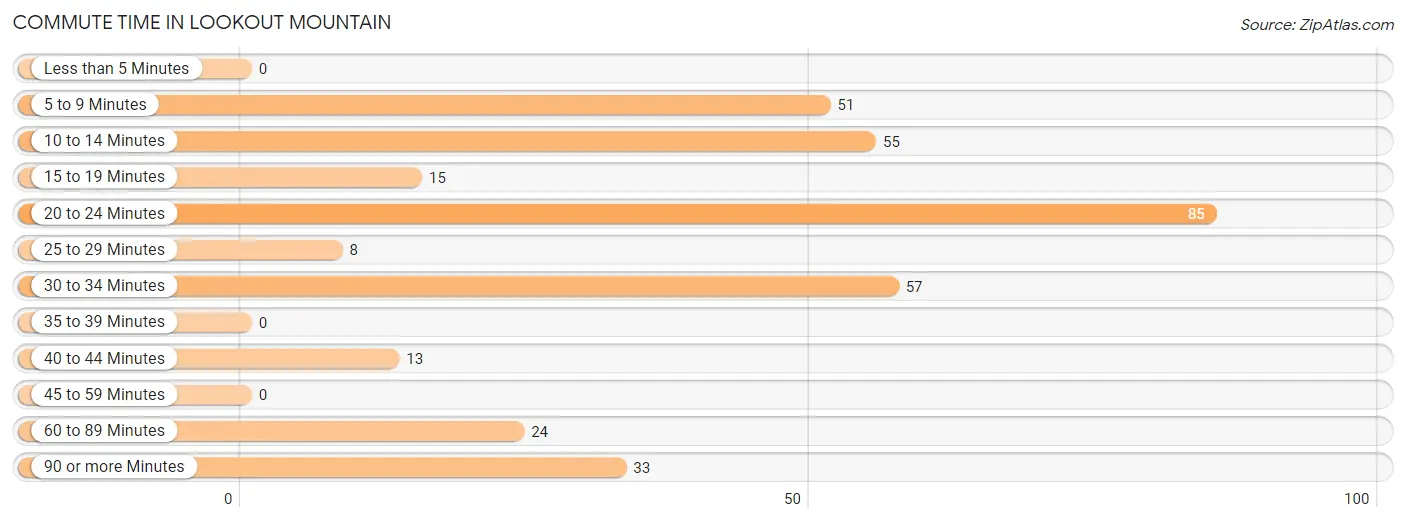
| Commute Time | # Commuters | % Commuters |
| Less than 5 Minutes | 0 | 0.0% |
| 5 to 9 Minutes | 51 | 15.0% |
| 10 to 14 Minutes | 55 | 16.1% |
| 15 to 19 Minutes | 15 | 4.4% |
| 20 to 24 Minutes | 85 | 24.9% |
| 25 to 29 Minutes | 8 | 2.4% |
| 30 to 34 Minutes | 57 | 16.7% |
| 35 to 39 Minutes | 0 | 0.0% |
| 40 to 44 Minutes | 13 | 3.8% |
| 45 to 59 Minutes | 0 | 0.0% |
| 60 to 89 Minutes | 24 | 7.0% |
| 90 or more Minutes | 33 | 9.7% |
Commute Time by Sex in Lookout Mountain
The most common commute times in Lookout Mountain are 20 to 24 minutes (43 commuters, 25.4%) for males and 5 to 9 minutes (51 commuters, 29.6%) for females.
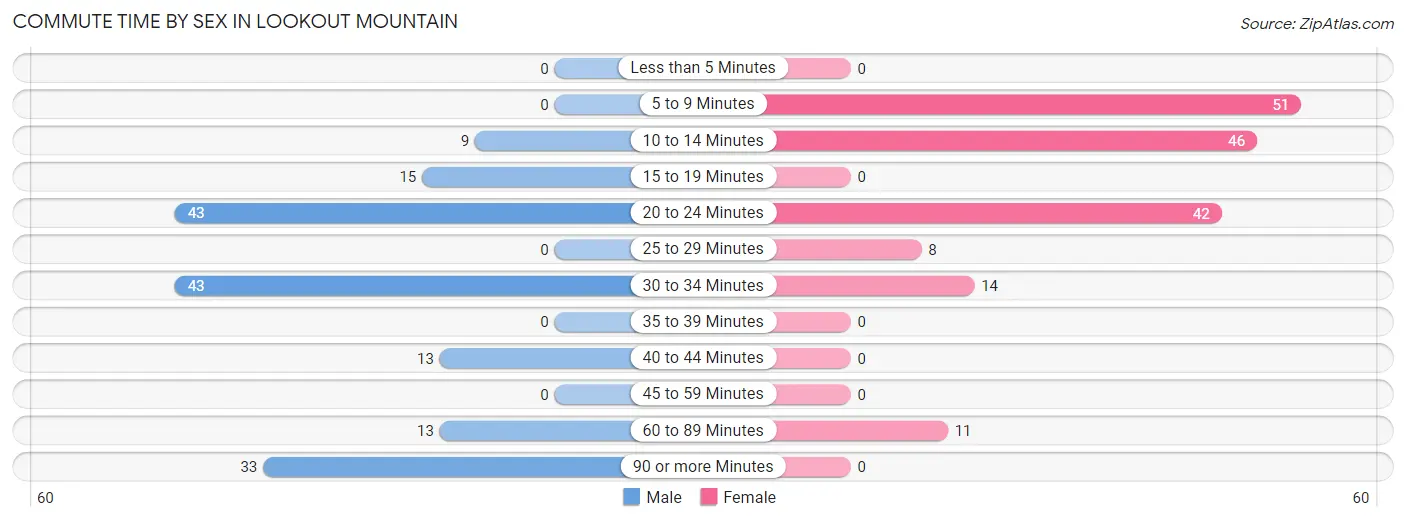
| Commute Time | Male | Female |
| Less than 5 Minutes | 0 (0.0%) | 0 (0.0%) |
| 5 to 9 Minutes | 0 (0.0%) | 51 (29.6%) |
| 10 to 14 Minutes | 9 (5.3%) | 46 (26.7%) |
| 15 to 19 Minutes | 15 (8.9%) | 0 (0.0%) |
| 20 to 24 Minutes | 43 (25.4%) | 42 (24.4%) |
| 25 to 29 Minutes | 0 (0.0%) | 8 (4.6%) |
| 30 to 34 Minutes | 43 (25.4%) | 14 (8.1%) |
| 35 to 39 Minutes | 0 (0.0%) | 0 (0.0%) |
| 40 to 44 Minutes | 13 (7.7%) | 0 (0.0%) |
| 45 to 59 Minutes | 0 (0.0%) | 0 (0.0%) |
| 60 to 89 Minutes | 13 (7.7%) | 11 (6.4%) |
| 90 or more Minutes | 33 (19.5%) | 0 (0.0%) |
Time of Departure to Work by Sex in Lookout Mountain
The most frequent times of departure to work in Lookout Mountain are 5:00 AM to 5:29 AM (34, 20.1%) for males and 7:30 AM to 7:59 AM (55, 32.0%) for females.
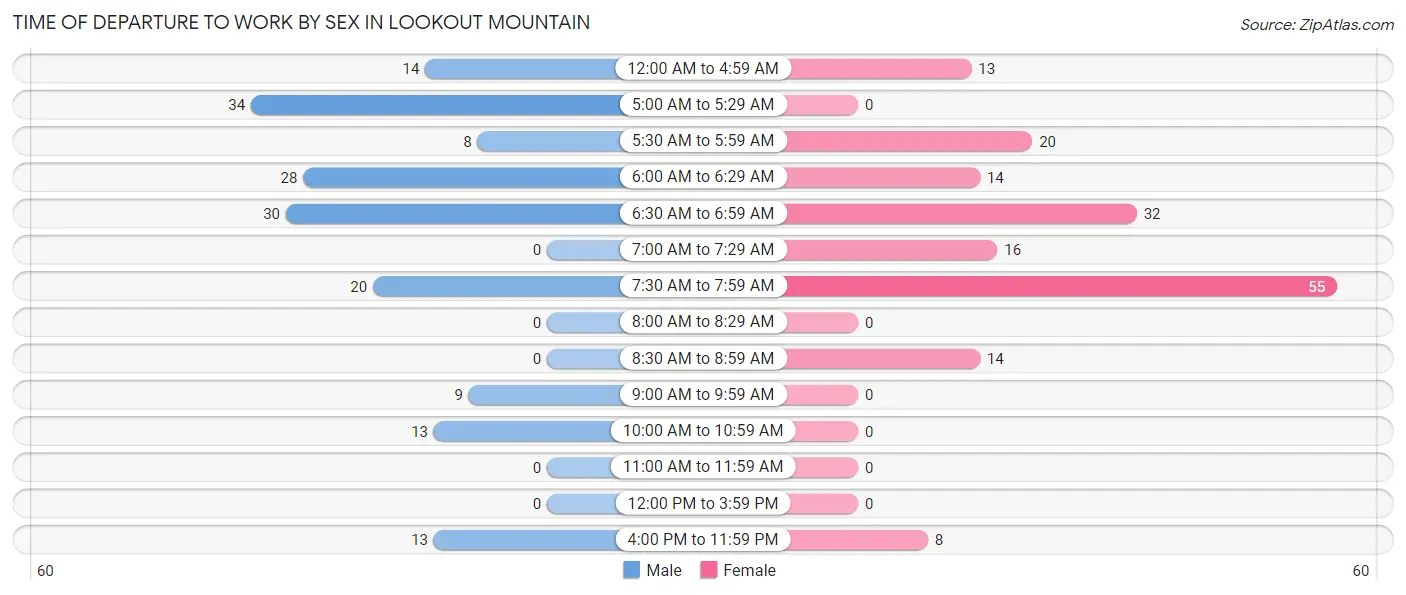
| Time of Departure | Male | Female |
| 12:00 AM to 4:59 AM | 14 (8.3%) | 13 (7.6%) |
| 5:00 AM to 5:29 AM | 34 (20.1%) | 0 (0.0%) |
| 5:30 AM to 5:59 AM | 8 (4.7%) | 20 (11.6%) |
| 6:00 AM to 6:29 AM | 28 (16.6%) | 14 (8.1%) |
| 6:30 AM to 6:59 AM | 30 (17.7%) | 32 (18.6%) |
| 7:00 AM to 7:29 AM | 0 (0.0%) | 16 (9.3%) |
| 7:30 AM to 7:59 AM | 20 (11.8%) | 55 (32.0%) |
| 8:00 AM to 8:29 AM | 0 (0.0%) | 0 (0.0%) |
| 8:30 AM to 8:59 AM | 0 (0.0%) | 14 (8.1%) |
| 9:00 AM to 9:59 AM | 9 (5.3%) | 0 (0.0%) |
| 10:00 AM to 10:59 AM | 13 (7.7%) | 0 (0.0%) |
| 11:00 AM to 11:59 AM | 0 (0.0%) | 0 (0.0%) |
| 12:00 PM to 3:59 PM | 0 (0.0%) | 0 (0.0%) |
| 4:00 PM to 11:59 PM | 13 (7.7%) | 8 (4.6%) |
| Total | 169 (100.0%) | 172 (100.0%) |
Housing Occupancy in Lookout Mountain
Occupancy by Ownership in Lookout Mountain
Of the total 462 dwellings in Lookout Mountain, owner-occupied units account for 430 (93.1%), while renter-occupied units make up 32 (6.9%).
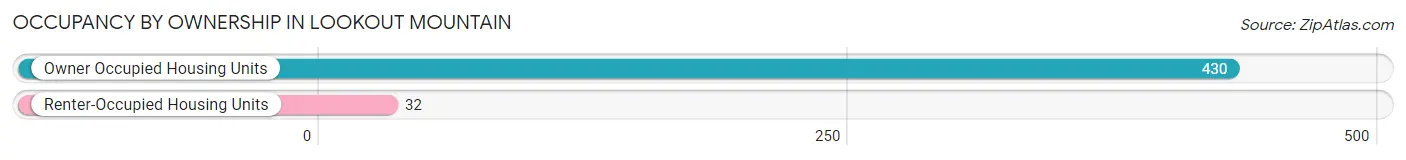
| Occupancy | # Housing Units | % Housing Units |
| Owner Occupied Housing Units | 430 | 93.1% |
| Renter-Occupied Housing Units | 32 | 6.9% |
| Total Occupied Housing Units | 462 | 100.0% |
Occupancy by Household Size in Lookout Mountain
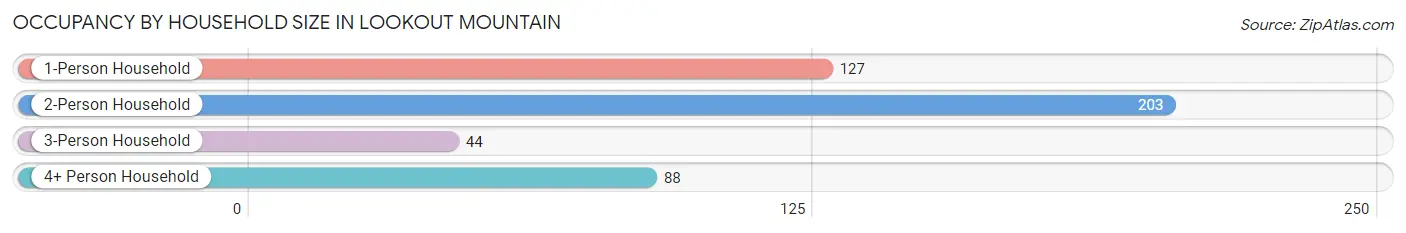
| Household Size | # Housing Units | % Housing Units |
| 1-Person Household | 127 | 27.5% |
| 2-Person Household | 203 | 43.9% |
| 3-Person Household | 44 | 9.5% |
| 4+ Person Household | 88 | 19.1% |
| Total Housing Units | 462 | 100.0% |
Occupancy by Ownership by Household Size in Lookout Mountain
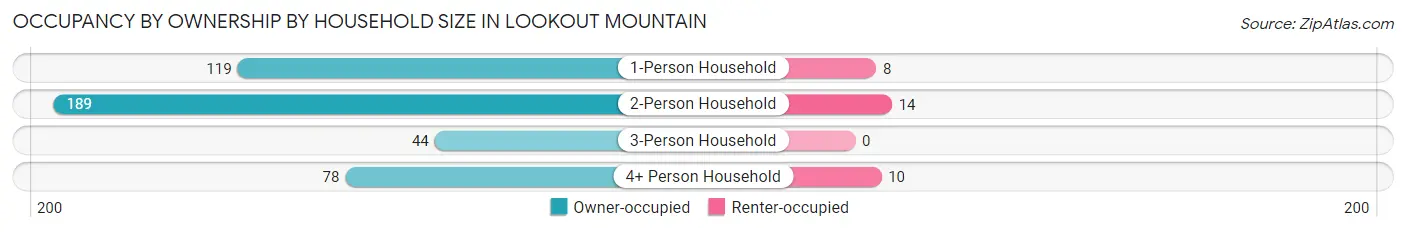
| Household Size | Owner-occupied | Renter-occupied |
| 1-Person Household | 119 (93.7%) | 8 (6.3%) |
| 2-Person Household | 189 (93.1%) | 14 (6.9%) |
| 3-Person Household | 44 (100.0%) | 0 (0.0%) |
| 4+ Person Household | 78 (88.6%) | 10 (11.4%) |
| Total Housing Units | 430 (93.1%) | 32 (6.9%) |
Occupancy by Educational Attainment in Lookout Mountain
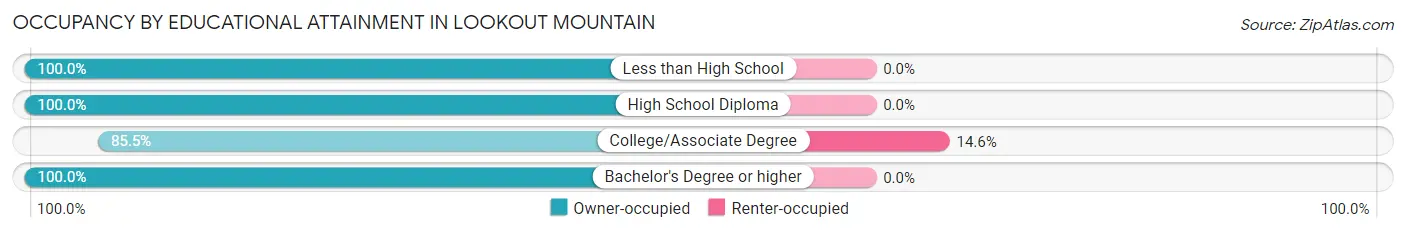
| Household Size | Owner-occupied | Renter-occupied |
| Less than High School | 102 (100.0%) | 0 (0.0%) |
| High School Diploma | 84 (100.0%) | 0 (0.0%) |
| College/Associate Degree | 188 (85.5%) | 32 (14.5%) |
| Bachelor's Degree or higher | 56 (100.0%) | 0 (0.0%) |
Occupancy by Age of Householder in Lookout Mountain
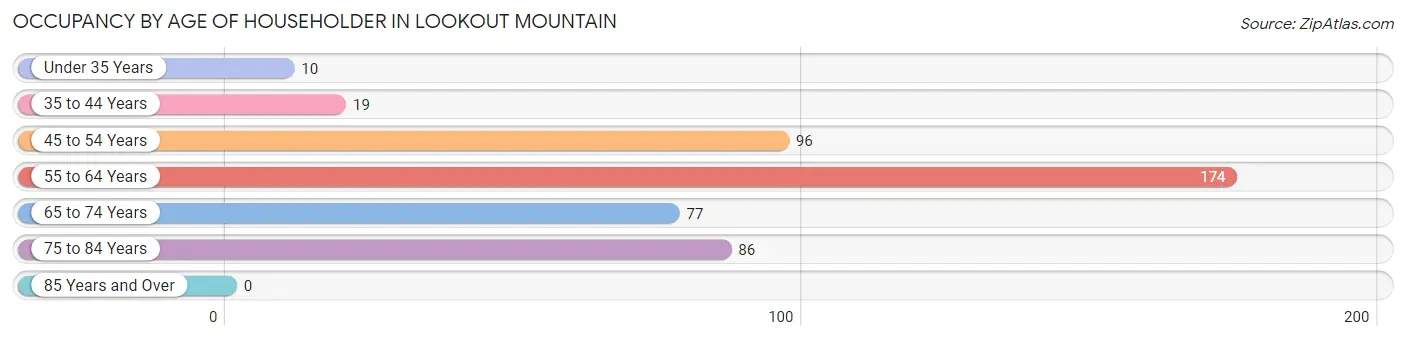
| Age Bracket | # Households | % Households |
| Under 35 Years | 10 | 2.2% |
| 35 to 44 Years | 19 | 4.1% |
| 45 to 54 Years | 96 | 20.8% |
| 55 to 64 Years | 174 | 37.7% |
| 65 to 74 Years | 77 | 16.7% |
| 75 to 84 Years | 86 | 18.6% |
| 85 Years and Over | 0 | 0.0% |
| Total | 462 | 100.0% |
Housing Finances in Lookout Mountain
Median Income by Occupancy in Lookout Mountain
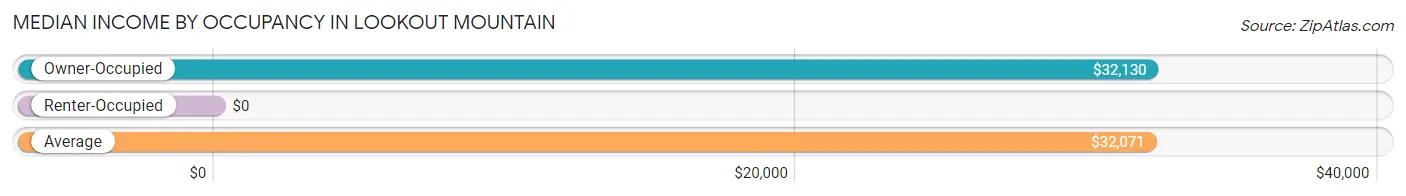
| Occupancy Type | # Households | Median Income |
| Owner-Occupied | 430 (93.1%) | $32,130 |
| Renter-Occupied | 32 (6.9%) | $0 |
| Average | 462 (100.0%) | $32,071 |
Occupancy by Householder Income Bracket in Lookout Mountain
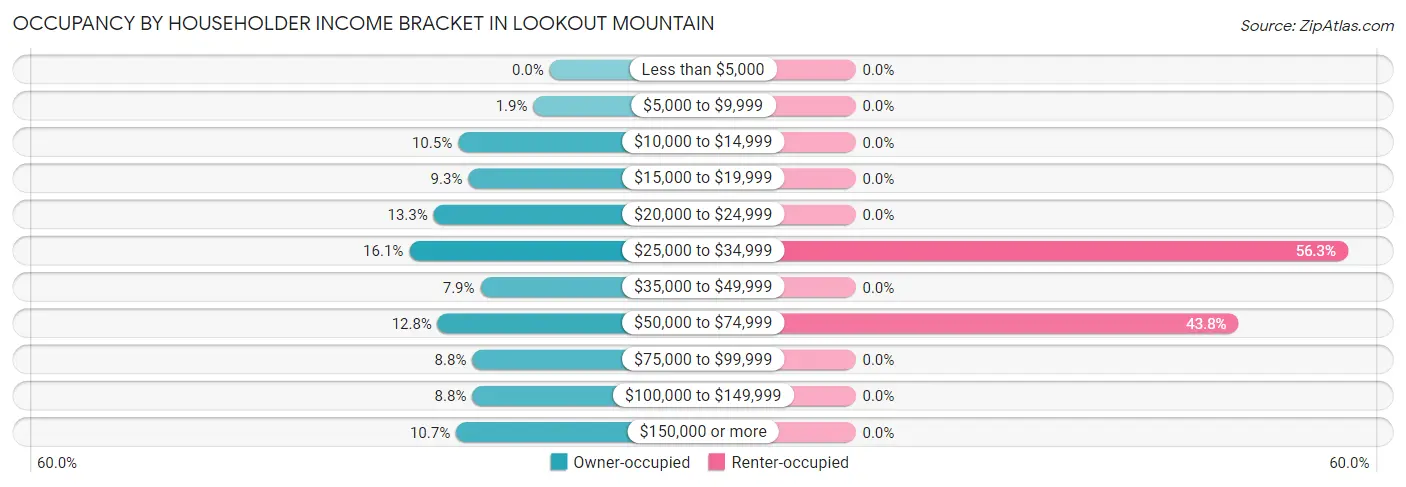
| Income Bracket | Owner-occupied | Renter-occupied |
| Less than $5,000 | 0 (0.0%) | 0 (0.0%) |
| $5,000 to $9,999 | 8 (1.9%) | 0 (0.0%) |
| $10,000 to $14,999 | 45 (10.5%) | 0 (0.0%) |
| $15,000 to $19,999 | 40 (9.3%) | 0 (0.0%) |
| $20,000 to $24,999 | 57 (13.3%) | 0 (0.0%) |
| $25,000 to $34,999 | 69 (16.1%) | 18 (56.2%) |
| $35,000 to $49,999 | 34 (7.9%) | 0 (0.0%) |
| $50,000 to $74,999 | 55 (12.8%) | 14 (43.8%) |
| $75,000 to $99,999 | 38 (8.8%) | 0 (0.0%) |
| $100,000 to $149,999 | 38 (8.8%) | 0 (0.0%) |
| $150,000 or more | 46 (10.7%) | 0 (0.0%) |
| Total | 430 (100.0%) | 32 (100.0%) |
Monthly Housing Cost Tiers in Lookout Mountain
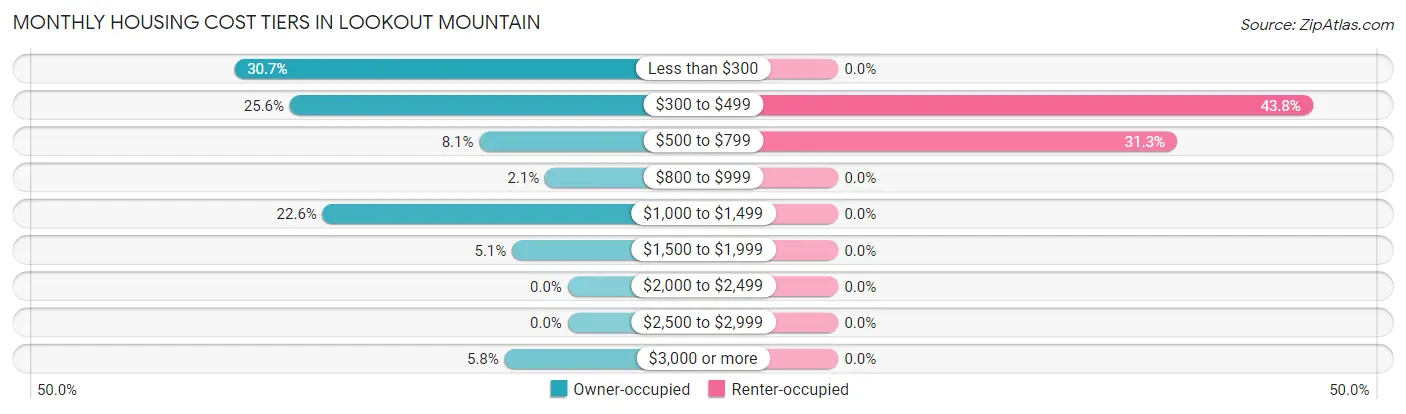
| Monthly Cost | Owner-occupied | Renter-occupied |
| Less than $300 | 132 (30.7%) | 0 (0.0%) |
| $300 to $499 | 110 (25.6%) | 14 (43.8%) |
| $500 to $799 | 35 (8.1%) | 10 (31.2%) |
| $800 to $999 | 9 (2.1%) | 0 (0.0%) |
| $1,000 to $1,499 | 97 (22.6%) | 0 (0.0%) |
| $1,500 to $1,999 | 22 (5.1%) | 0 (0.0%) |
| $2,000 to $2,499 | 0 (0.0%) | 0 (0.0%) |
| $2,500 to $2,999 | 0 (0.0%) | 0 (0.0%) |
| $3,000 or more | 25 (5.8%) | 0 (0.0%) |
| Total | 430 (100.0%) | 32 (100.0%) |
Physical Housing Characteristics in Lookout Mountain
Housing Structures in Lookout Mountain
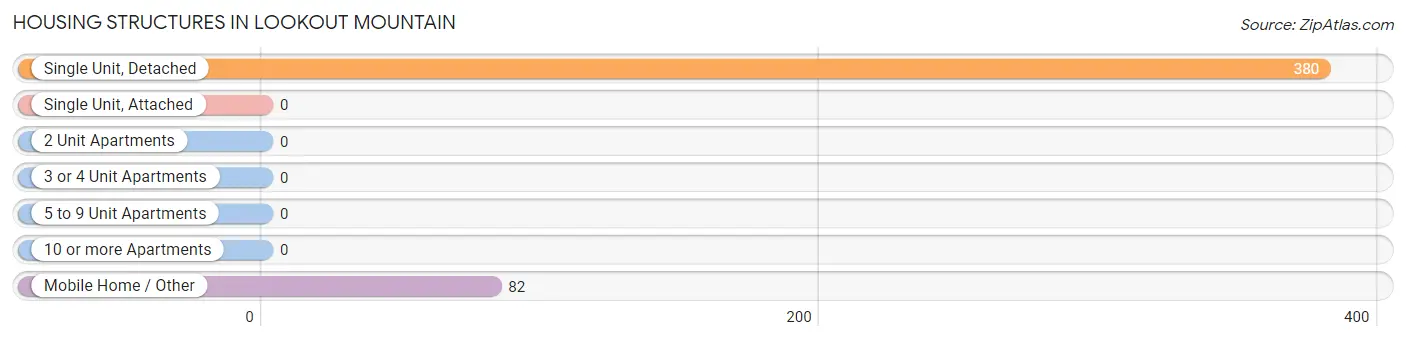
| Structure Type | # Housing Units | % Housing Units |
| Single Unit, Detached | 380 | 82.3% |
| Single Unit, Attached | 0 | 0.0% |
| 2 Unit Apartments | 0 | 0.0% |
| 3 or 4 Unit Apartments | 0 | 0.0% |
| 5 to 9 Unit Apartments | 0 | 0.0% |
| 10 or more Apartments | 0 | 0.0% |
| Mobile Home / Other | 82 | 17.7% |
| Total | 462 | 100.0% |
Housing Structures by Occupancy in Lookout Mountain
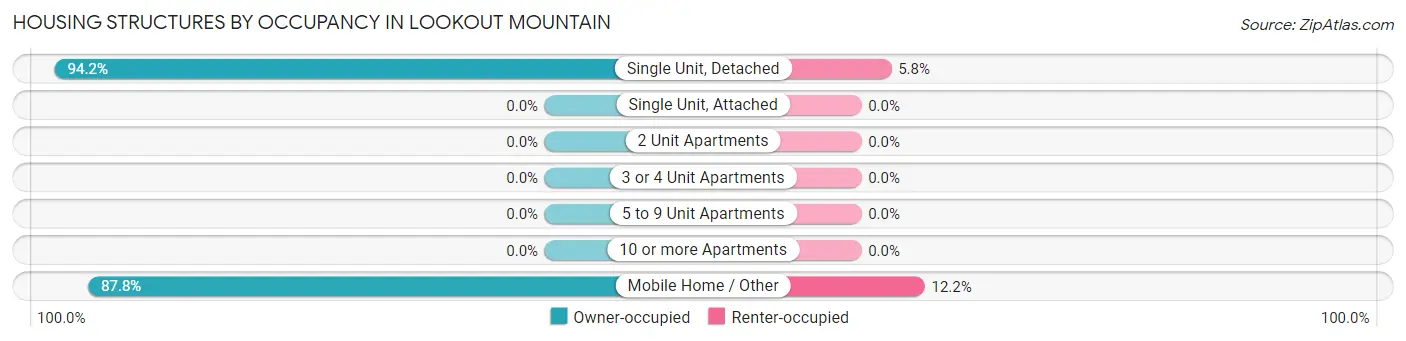
| Structure Type | Owner-occupied | Renter-occupied |
| Single Unit, Detached | 358 (94.2%) | 22 (5.8%) |
| Single Unit, Attached | 0 (0.0%) | 0 (0.0%) |
| 2 Unit Apartments | 0 (0.0%) | 0 (0.0%) |
| 3 or 4 Unit Apartments | 0 (0.0%) | 0 (0.0%) |
| 5 to 9 Unit Apartments | 0 (0.0%) | 0 (0.0%) |
| 10 or more Apartments | 0 (0.0%) | 0 (0.0%) |
| Mobile Home / Other | 72 (87.8%) | 10 (12.2%) |
| Total | 430 (93.1%) | 32 (6.9%) |
Housing Structures by Number of Rooms in Lookout Mountain
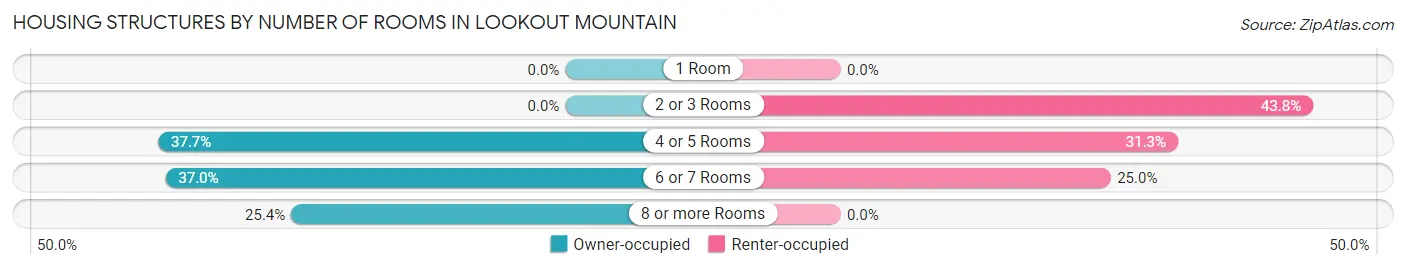
| Number of Rooms | Owner-occupied | Renter-occupied |
| 1 Room | 0 (0.0%) | 0 (0.0%) |
| 2 or 3 Rooms | 0 (0.0%) | 14 (43.8%) |
| 4 or 5 Rooms | 162 (37.7%) | 10 (31.2%) |
| 6 or 7 Rooms | 159 (37.0%) | 8 (25.0%) |
| 8 or more Rooms | 109 (25.4%) | 0 (0.0%) |
| Total | 430 (100.0%) | 32 (100.0%) |
Housing Structure by Heating Type in Lookout Mountain
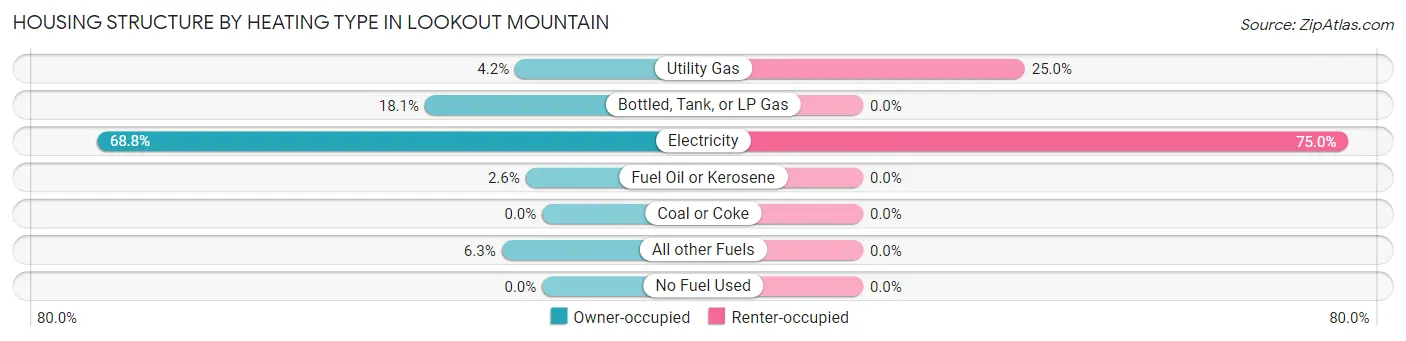
| Heating Type | Owner-occupied | Renter-occupied |
| Utility Gas | 18 (4.2%) | 8 (25.0%) |
| Bottled, Tank, or LP Gas | 78 (18.1%) | 0 (0.0%) |
| Electricity | 296 (68.8%) | 24 (75.0%) |
| Fuel Oil or Kerosene | 11 (2.6%) | 0 (0.0%) |
| Coal or Coke | 0 (0.0%) | 0 (0.0%) |
| All other Fuels | 27 (6.3%) | 0 (0.0%) |
| No Fuel Used | 0 (0.0%) | 0 (0.0%) |
| Total | 430 (100.0%) | 32 (100.0%) |
Household Vehicle Usage in Lookout Mountain
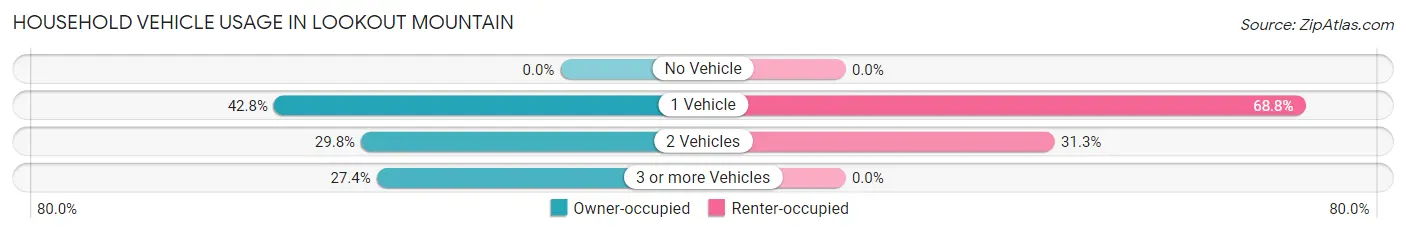
| Vehicles per Household | Owner-occupied | Renter-occupied |
| No Vehicle | 0 (0.0%) | 0 (0.0%) |
| 1 Vehicle | 184 (42.8%) | 22 (68.8%) |
| 2 Vehicles | 128 (29.8%) | 10 (31.2%) |
| 3 or more Vehicles | 118 (27.4%) | 0 (0.0%) |
| Total | 430 (100.0%) | 32 (100.0%) |
Real Estate & Mortgages in Lookout Mountain
Real Estate and Mortgage Overview in Lookout Mountain
| Characteristic | Without Mortgage | With Mortgage |
| Housing Units | 253 | 177 |
| Median Property Value | - | - |
| Median Household Income | $24,495 | $35 |
| Monthly Housing Costs | $297 | $25 |
| Real Estate Taxes | $199 | $11 |
Property Value by Mortgage Status in Lookout Mountain
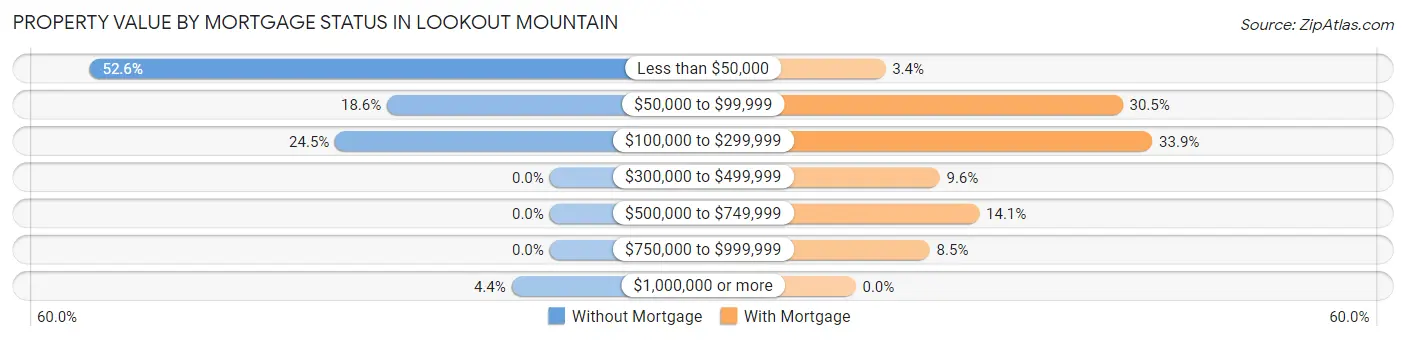
| Property Value | Without Mortgage | With Mortgage |
| Less than $50,000 | 133 (52.6%) | 6 (3.4%) |
| $50,000 to $99,999 | 47 (18.6%) | 54 (30.5%) |
| $100,000 to $299,999 | 62 (24.5%) | 60 (33.9%) |
| $300,000 to $499,999 | 0 (0.0%) | 17 (9.6%) |
| $500,000 to $749,999 | 0 (0.0%) | 25 (14.1%) |
| $750,000 to $999,999 | 0 (0.0%) | 15 (8.5%) |
| $1,000,000 or more | 11 (4.3%) | 0 (0.0%) |
| Total | 253 (100.0%) | 177 (100.0%) |
Household Income by Mortgage Status in Lookout Mountain
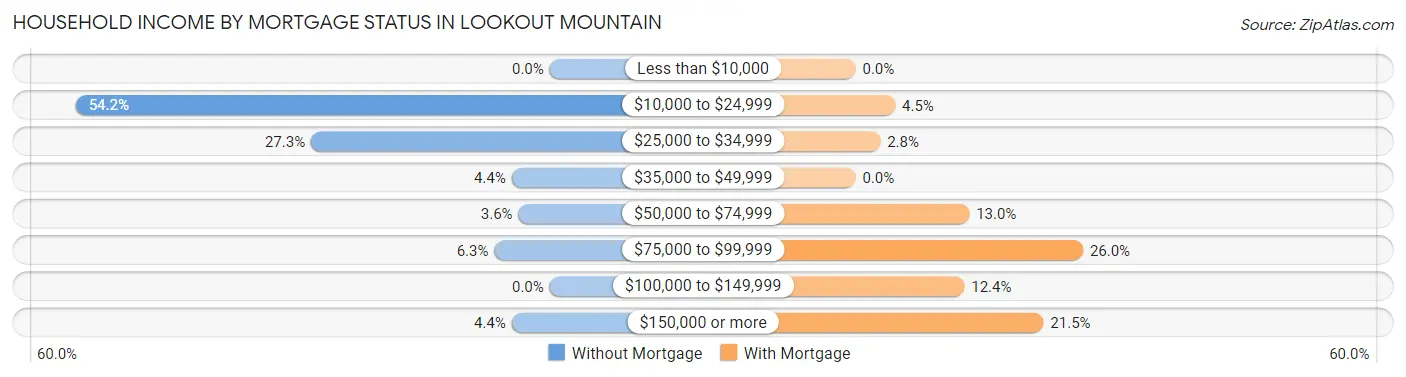
| Household Income | Without Mortgage | With Mortgage |
| Less than $10,000 | 0 (0.0%) | 0 (0.0%) |
| $10,000 to $24,999 | 137 (54.1%) | 8 (4.5%) |
| $25,000 to $34,999 | 69 (27.3%) | 5 (2.8%) |
| $35,000 to $49,999 | 11 (4.3%) | 0 (0.0%) |
| $50,000 to $74,999 | 9 (3.6%) | 23 (13.0%) |
| $75,000 to $99,999 | 16 (6.3%) | 46 (26.0%) |
| $100,000 to $149,999 | 0 (0.0%) | 22 (12.4%) |
| $150,000 or more | 11 (4.3%) | 38 (21.5%) |
| Total | 253 (100.0%) | 177 (100.0%) |
Property Value to Household Income Ratio in Lookout Mountain
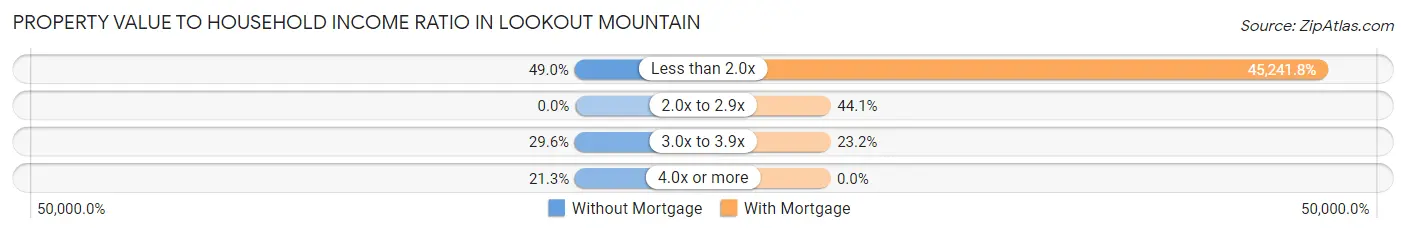
| Value-to-Income Ratio | Without Mortgage | With Mortgage |
| Less than 2.0x | 124 (49.0%) | 80,078 (45,241.8%) |
| 2.0x to 2.9x | 0 (0.0%) | 78 (44.1%) |
| 3.0x to 3.9x | 75 (29.6%) | 41 (23.2%) |
| 4.0x or more | 54 (21.3%) | 0 (0.0%) |
| Total | 253 (100.0%) | 177 (100.0%) |
Real Estate Taxes by Mortgage Status in Lookout Mountain
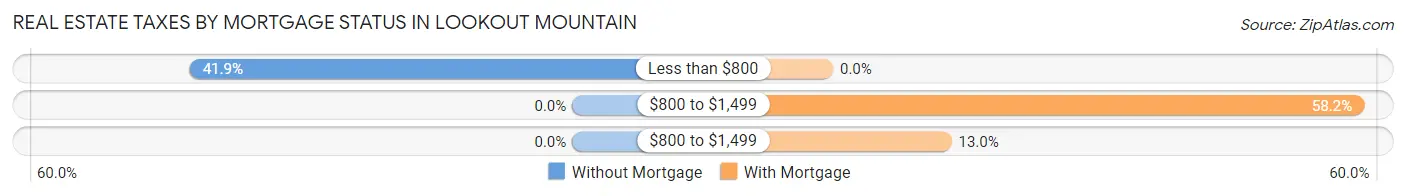
| Property Taxes | Without Mortgage | With Mortgage |
| Less than $800 | 106 (41.9%) | 0 (0.0%) |
| $800 to $1,499 | 0 (0.0%) | 103 (58.2%) |
| $800 to $1,499 | 0 (0.0%) | 23 (13.0%) |
| Total | 253 (100.0%) | 177 (100.0%) |
Health & Disability in Lookout Mountain
Health Insurance Coverage by Age in Lookout Mountain
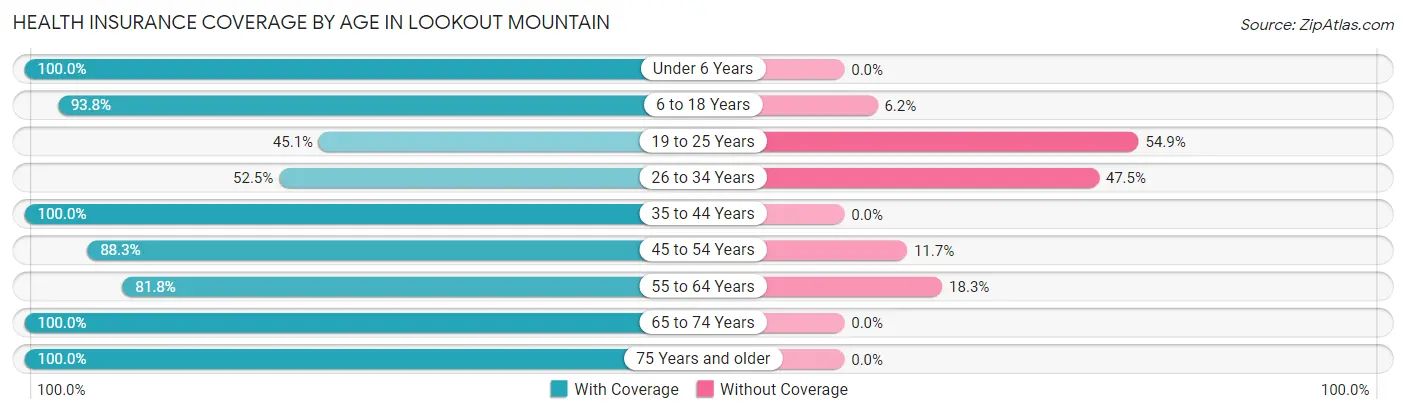
| Age Bracket | With Coverage | Without Coverage |
| Under 6 Years | 14 (100.0%) | 0 (0.0%) |
| 6 to 18 Years | 167 (93.8%) | 11 (6.2%) |
| 19 to 25 Years | 37 (45.1%) | 45 (54.9%) |
| 26 to 34 Years | 31 (52.5%) | 28 (47.5%) |
| 35 to 44 Years | 77 (100.0%) | 0 (0.0%) |
| 45 to 54 Years | 204 (88.3%) | 27 (11.7%) |
| 55 to 64 Years | 224 (81.8%) | 50 (18.2%) |
| 65 to 74 Years | 138 (100.0%) | 0 (0.0%) |
| 75 Years and older | 195 (100.0%) | 0 (0.0%) |
| Total | 1,087 (87.1%) | 161 (12.9%) |
Health Insurance Coverage by Citizenship Status in Lookout Mountain
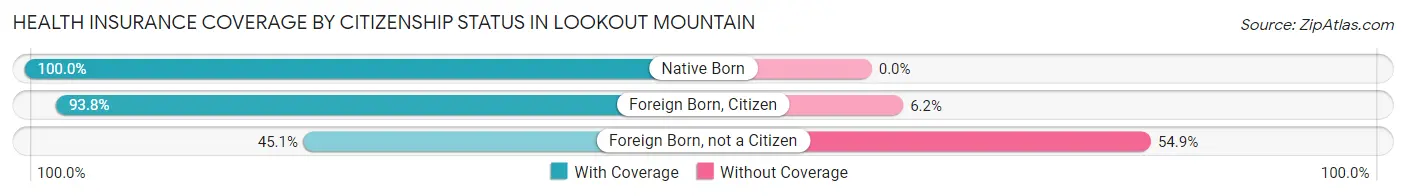
| Citizenship Status | With Coverage | Without Coverage |
| Native Born | 14 (100.0%) | 0 (0.0%) |
| Foreign Born, Citizen | 167 (93.8%) | 11 (6.2%) |
| Foreign Born, not a Citizen | 37 (45.1%) | 45 (54.9%) |
Health Insurance Coverage by Household Income in Lookout Mountain
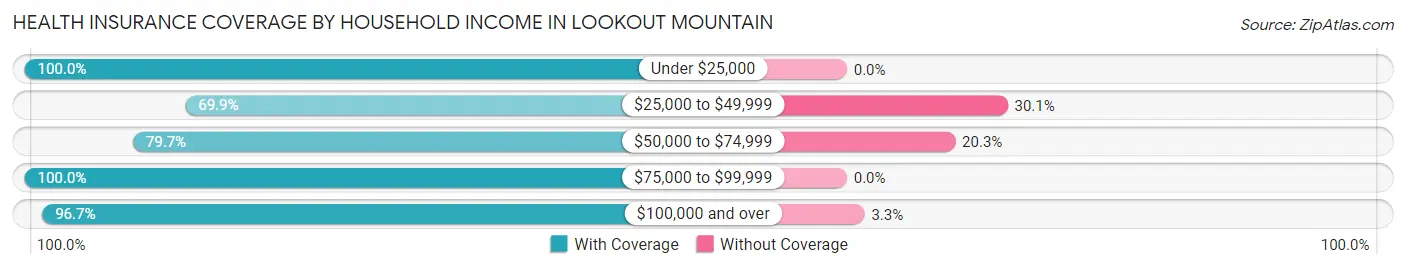
| Household Income | With Coverage | Without Coverage |
| Under $25,000 | 246 (100.0%) | 0 (0.0%) |
| $25,000 to $49,999 | 253 (69.9%) | 109 (30.1%) |
| $50,000 to $74,999 | 161 (79.7%) | 41 (20.3%) |
| $75,000 to $99,999 | 106 (100.0%) | 0 (0.0%) |
| $100,000 and over | 321 (96.7%) | 11 (3.3%) |
Public vs Private Health Insurance Coverage by Age in Lookout Mountain
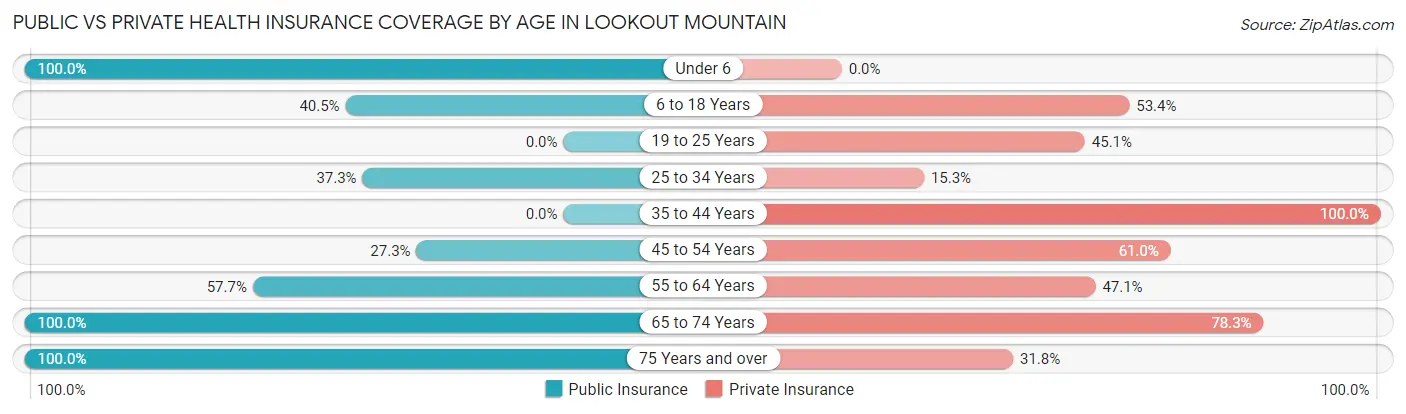
| Age Bracket | Public Insurance | Private Insurance |
| Under 6 | 14 (100.0%) | 0 (0.0%) |
| 6 to 18 Years | 72 (40.5%) | 95 (53.4%) |
| 19 to 25 Years | 0 (0.0%) | 37 (45.1%) |
| 25 to 34 Years | 22 (37.3%) | 9 (15.2%) |
| 35 to 44 Years | 0 (0.0%) | 77 (100.0%) |
| 45 to 54 Years | 63 (27.3%) | 141 (61.0%) |
| 55 to 64 Years | 158 (57.7%) | 129 (47.1%) |
| 65 to 74 Years | 138 (100.0%) | 108 (78.3%) |
| 75 Years and over | 195 (100.0%) | 62 (31.8%) |
| Total | 662 (53.0%) | 658 (52.7%) |
Disability Status by Sex by Age in Lookout Mountain
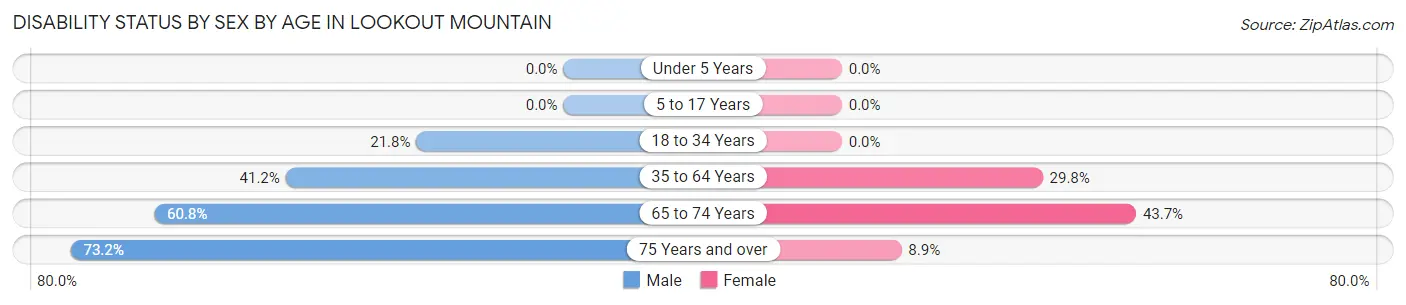
| Age Bracket | Male | Female |
| Under 5 Years | 0 (0.0%) | 0 (0.0%) |
| 5 to 17 Years | 0 (0.0%) | 0 (0.0%) |
| 18 to 34 Years | 45 (21.8%) | 0 (0.0%) |
| 35 to 64 Years | 146 (41.2%) | 68 (29.8%) |
| 65 to 74 Years | 31 (60.8%) | 38 (43.7%) |
| 75 Years and over | 60 (73.2%) | 10 (8.8%) |
Disability Class by Sex by Age in Lookout Mountain
Disability Class: Hearing Difficulty
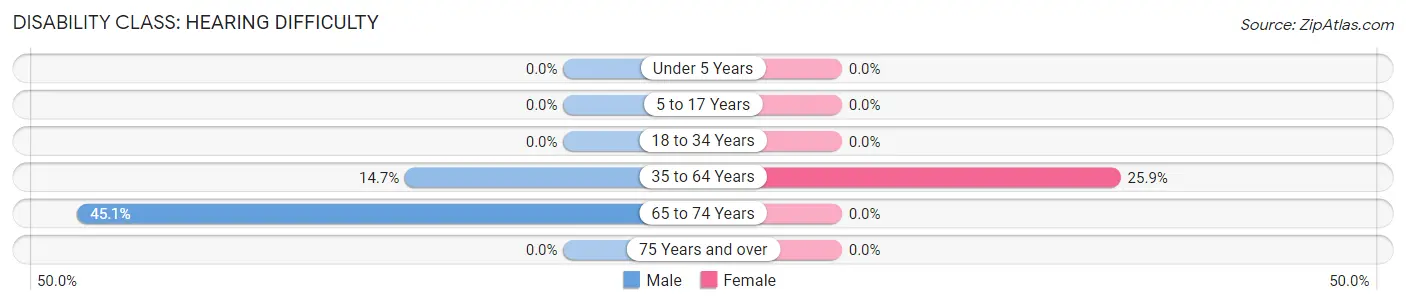
| Age Bracket | Male | Female |
| Under 5 Years | 0 (0.0%) | 0 (0.0%) |
| 5 to 17 Years | 0 (0.0%) | 0 (0.0%) |
| 18 to 34 Years | 0 (0.0%) | 0 (0.0%) |
| 35 to 64 Years | 52 (14.7%) | 59 (25.9%) |
| 65 to 74 Years | 23 (45.1%) | 0 (0.0%) |
| 75 Years and over | 0 (0.0%) | 0 (0.0%) |
Disability Class: Vision Difficulty
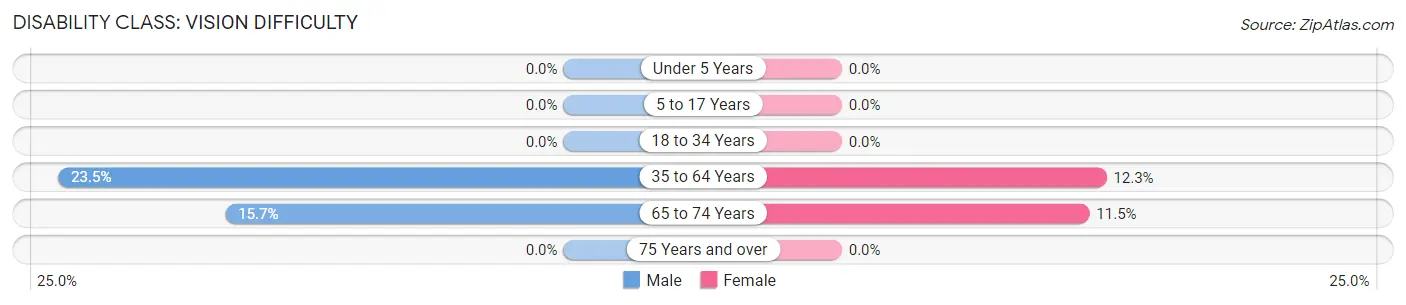
| Age Bracket | Male | Female |
| Under 5 Years | 0 (0.0%) | 0 (0.0%) |
| 5 to 17 Years | 0 (0.0%) | 0 (0.0%) |
| 18 to 34 Years | 0 (0.0%) | 0 (0.0%) |
| 35 to 64 Years | 83 (23.4%) | 28 (12.3%) |
| 65 to 74 Years | 8 (15.7%) | 10 (11.5%) |
| 75 Years and over | 0 (0.0%) | 0 (0.0%) |
Disability Class: Cognitive Difficulty
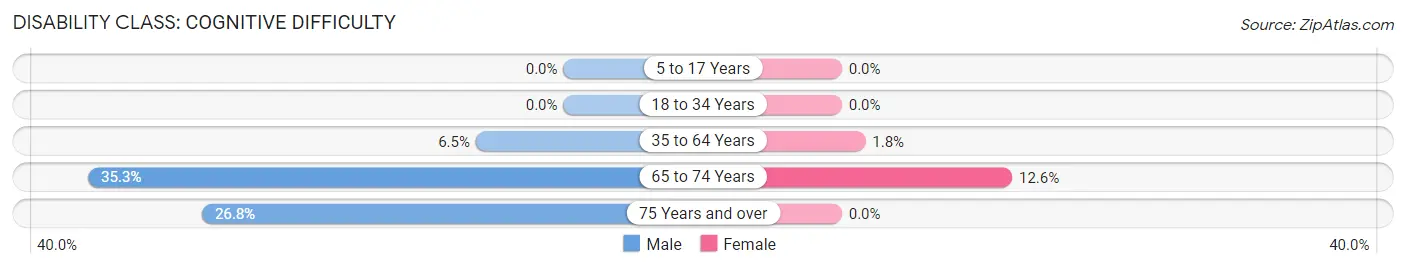
| Age Bracket | Male | Female |
| 5 to 17 Years | 0 (0.0%) | 0 (0.0%) |
| 18 to 34 Years | 0 (0.0%) | 0 (0.0%) |
| 35 to 64 Years | 23 (6.5%) | 4 (1.8%) |
| 65 to 74 Years | 18 (35.3%) | 11 (12.6%) |
| 75 Years and over | 22 (26.8%) | 0 (0.0%) |
Disability Class: Ambulatory Difficulty
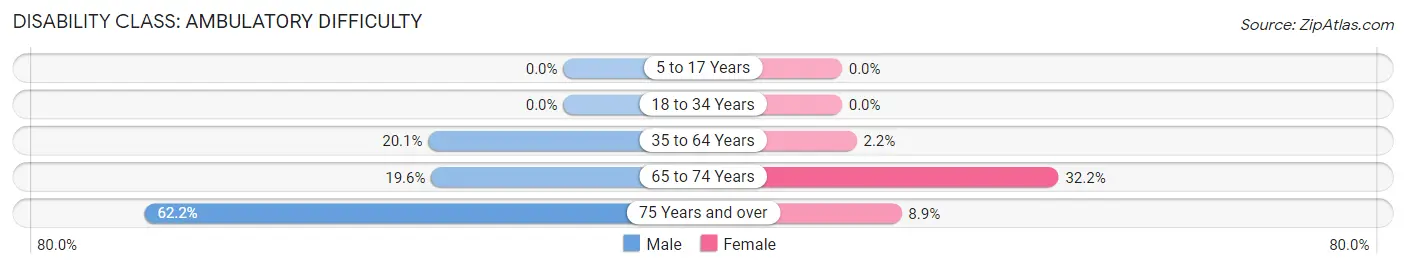
| Age Bracket | Male | Female |
| 5 to 17 Years | 0 (0.0%) | 0 (0.0%) |
| 18 to 34 Years | 0 (0.0%) | 0 (0.0%) |
| 35 to 64 Years | 71 (20.1%) | 5 (2.2%) |
| 65 to 74 Years | 10 (19.6%) | 28 (32.2%) |
| 75 Years and over | 51 (62.2%) | 10 (8.8%) |
Disability Class: Self-Care Difficulty
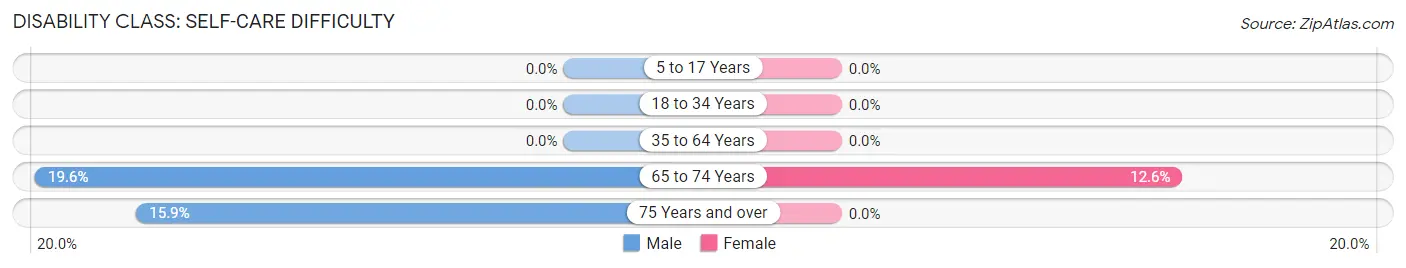
| Age Bracket | Male | Female |
| 5 to 17 Years | 0 (0.0%) | 0 (0.0%) |
| 18 to 34 Years | 0 (0.0%) | 0 (0.0%) |
| 35 to 64 Years | 0 (0.0%) | 0 (0.0%) |
| 65 to 74 Years | 10 (19.6%) | 11 (12.6%) |
| 75 Years and over | 13 (15.9%) | 0 (0.0%) |
Technology Access in Lookout Mountain
Computing Device Access in Lookout Mountain
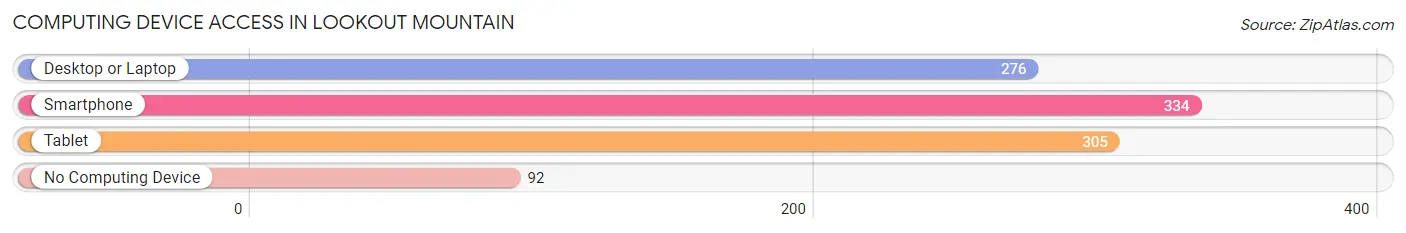
| Device Type | # Households | % Households |
| Desktop or Laptop | 276 | 59.7% |
| Smartphone | 334 | 72.3% |
| Tablet | 305 | 66.0% |
| No Computing Device | 92 | 19.9% |
| Total | 462 | 100.0% |
Internet Access in Lookout Mountain
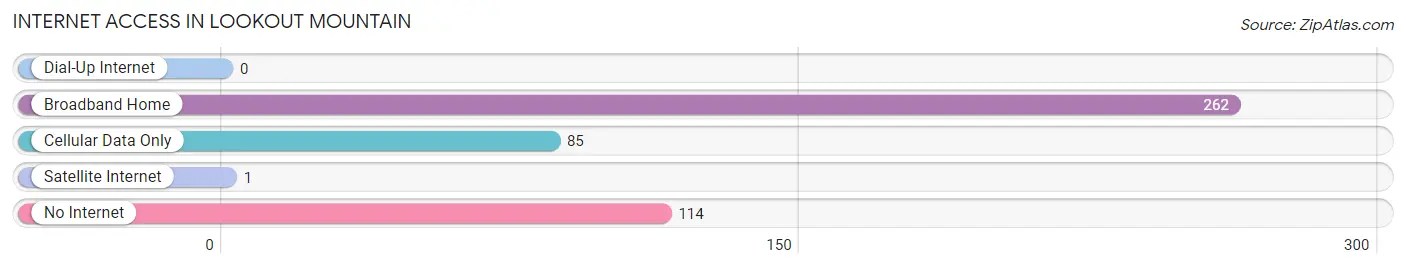
| Internet Type | # Households | % Households |
| Dial-Up Internet | 0 | 0.0% |
| Broadband Home | 262 | 56.7% |
| Cellular Data Only | 85 | 18.4% |
| Satellite Internet | 1 | 0.2% |
| No Internet | 114 | 24.7% |
| Total | 462 | 100.0% |
Lookout Mountain Summary
Lookout Mountain is a small town located in the state of Alabama, in the United States. It is situated in the foothills of the Appalachian Mountains, and is part of the Lookout Mountain region. The town is located in the northwest corner of the state, and is bordered by the states of Tennessee and Georgia. The town has a population of approximately 1,000 people, and is known for its scenic beauty and outdoor activities.
History
The area that is now Lookout Mountain was first settled by Native Americans, who lived in the area for thousands of years before the arrival of European settlers. The Cherokee and Creek tribes were the most prominent tribes in the area, and the Cherokee were the first to establish a permanent settlement in the area. The town of Lookout Mountain was founded in 1838, and was named after the nearby Lookout Mountain. The town was originally a small farming community, and was home to a number of small businesses.
In the late 19th century, Lookout Mountain became a popular tourist destination, due to its scenic beauty and outdoor activities. The town was home to a number of resorts and hotels, and was a popular destination for vacationers from all over the country. The town also became a popular destination for Civil War reenactments, and was the site of several battles during the war.
Geography
Lookout Mountain is located in the northwest corner of Alabama, and is bordered by the states of Tennessee and Georgia. The town is situated in the foothills of the Appalachian Mountains, and is part of the Lookout Mountain region. The town is located at an elevation of 1,000 feet, and is surrounded by rolling hills and forests. The town is located near the Tennessee River, and is home to a number of lakes and streams.
The climate in Lookout Mountain is mild, with temperatures ranging from the low 40s in the winter to the mid-80s in the summer. The town receives an average of 45 inches of rain per year, and is known for its mild winters and hot summers.
Economy
The economy of Lookout Mountain is largely based on tourism and outdoor recreation. The town is home to a number of resorts and hotels, and is a popular destination for vacationers from all over the country. The town is also home to a number of small businesses, including restaurants, shops, and galleries. The town is also home to a number of outdoor activities, including hiking, camping, fishing, and hunting.
Demographics
As of the 2010 census, the population of Lookout Mountain was 1,000 people. The town is predominantly white, with a small African American population. The median household income in the town is $45,000, and the median home value is $150,000. The town is home to a number of churches, and is served by the Lookout Mountain School District.
Common Questions
What is Per Capita Income in Lookout Mountain?
Per Capita income in Lookout Mountain is $43,942.
What is the Median Family Income in Lookout Mountain?
Median Family Income in Lookout Mountain is $65,391.
What is the Median Household income in Lookout Mountain?
Median Household Income in Lookout Mountain is $32,071.
What is Income or Wage Gap in Lookout Mountain?
Income or Wage Gap in Lookout Mountain is 25.7%.
Women in Lookout Mountain earn 74.3 cents for every dollar earned by a man.
What is Inequality or Gini Index in Lookout Mountain?
Inequality or Gini Index in Lookout Mountain is 0.63.
What is the Total Population of Lookout Mountain?
Total Population of Lookout Mountain is 1,287.
What is the Total Male Population of Lookout Mountain?
Total Male Population of Lookout Mountain is 800.
What is the Total Female Population of Lookout Mountain?
Total Female Population of Lookout Mountain is 487.
What is the Ratio of Males per 100 Females in Lookout Mountain?
There are 164.27 Males per 100 Females in Lookout Mountain.
What is the Ratio of Females per 100 Males in Lookout Mountain?
There are 60.88 Females per 100 Males in Lookout Mountain.
What is the Median Population Age in Lookout Mountain?
Median Population Age in Lookout Mountain is 52.6 Years.
What is the Average Family Size in Lookout Mountain
Average Family Size in Lookout Mountain is 3.4 People.
What is the Average Household Size in Lookout Mountain
Average Household Size in Lookout Mountain is 2.7 People.
How Large is the Labor Force in Lookout Mountain?
There are 353 People in the Labor Forcein in Lookout Mountain.
What is the Percentage of People in the Labor Force in Lookout Mountain?
30.8% of People are in the Labor Force in Lookout Mountain.