Mooresville, AL Map & Demographics
Mooresville Map
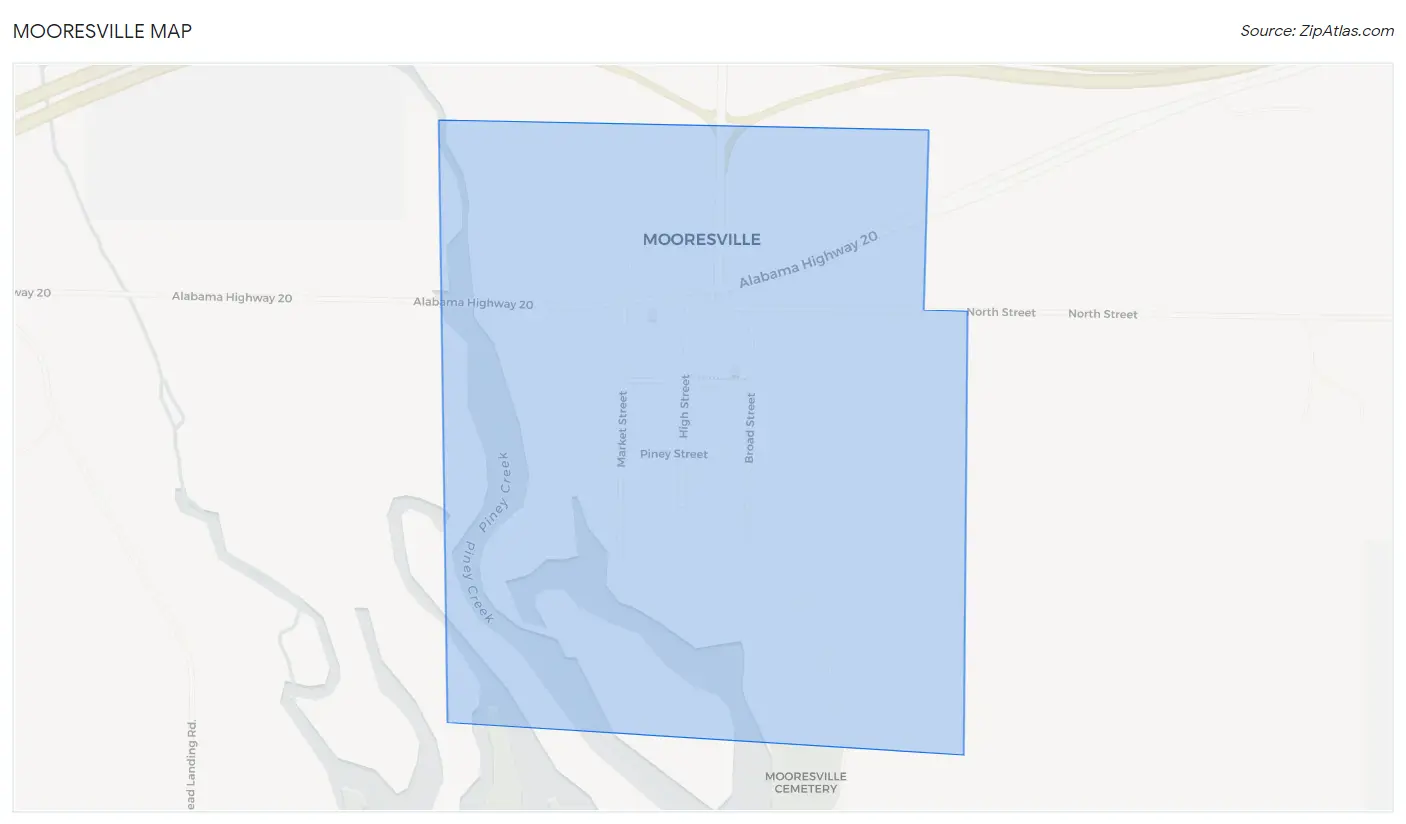
Mooresville Overview
$80,180
PER CAPITA INCOME
0.8%
WAGE / INCOME GAP [ % ]
99.2¢/ $1
WAGE / INCOME GAP [ $ ]
0.49
INEQUALITY / GINI INDEX
93
TOTAL POPULATION
30
MALE POPULATION
63
FEMALE POPULATION
47.62
MALES / 100 FEMALES
210.00
FEMALES / 100 MALES
56.3
MEDIAN AGE
2.7
AVG FAMILY SIZE
2.6
AVG HOUSEHOLD SIZE
35
LABOR FORCE [ PEOPLE ]
43.2%
PERCENT IN LABOR FORCE
Mooresville Zip Codes
Mooresville Area Codes
Income in Mooresville
Income Overview in Mooresville
| Characteristic | Number | Measure |
| Per Capita Income | 93 | $80,180 |
| Median Family Income | 34 | $0 |
| Mean Family Income | 34 | $198,856 |
| Median Household Income | 36 | $0 |
| Mean Household Income | 36 | $197,472 |
| Income Deficit | 34 | $0 |
| Wage / Income Gap (%) | 93 | 0.77% |
| Wage / Income Gap ($) | 93 | 99.23¢ per $1 |
| Gini / Inequality Index | 93 | 0.49 |
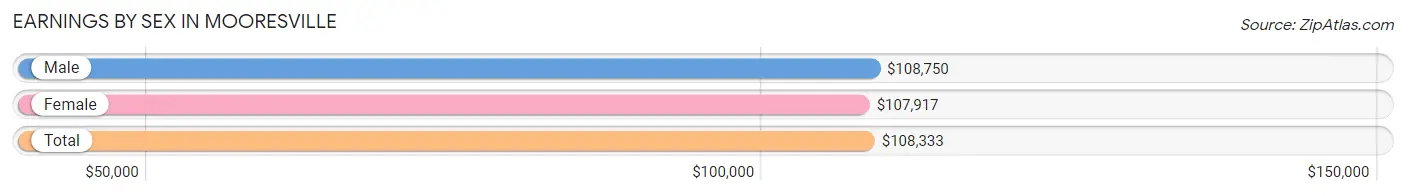
Earnings by Sex in Mooresville
Average Earnings in Mooresville are $108,333, $108,750 for men and $107,917 for women, a difference of 0.8%.
| Sex | Number | Average Earnings |
| Male | 19 (50.0%) | $108,750 |
| Female | 19 (50.0%) | $107,917 |
| Total | 38 (100.0%) | $108,333 |
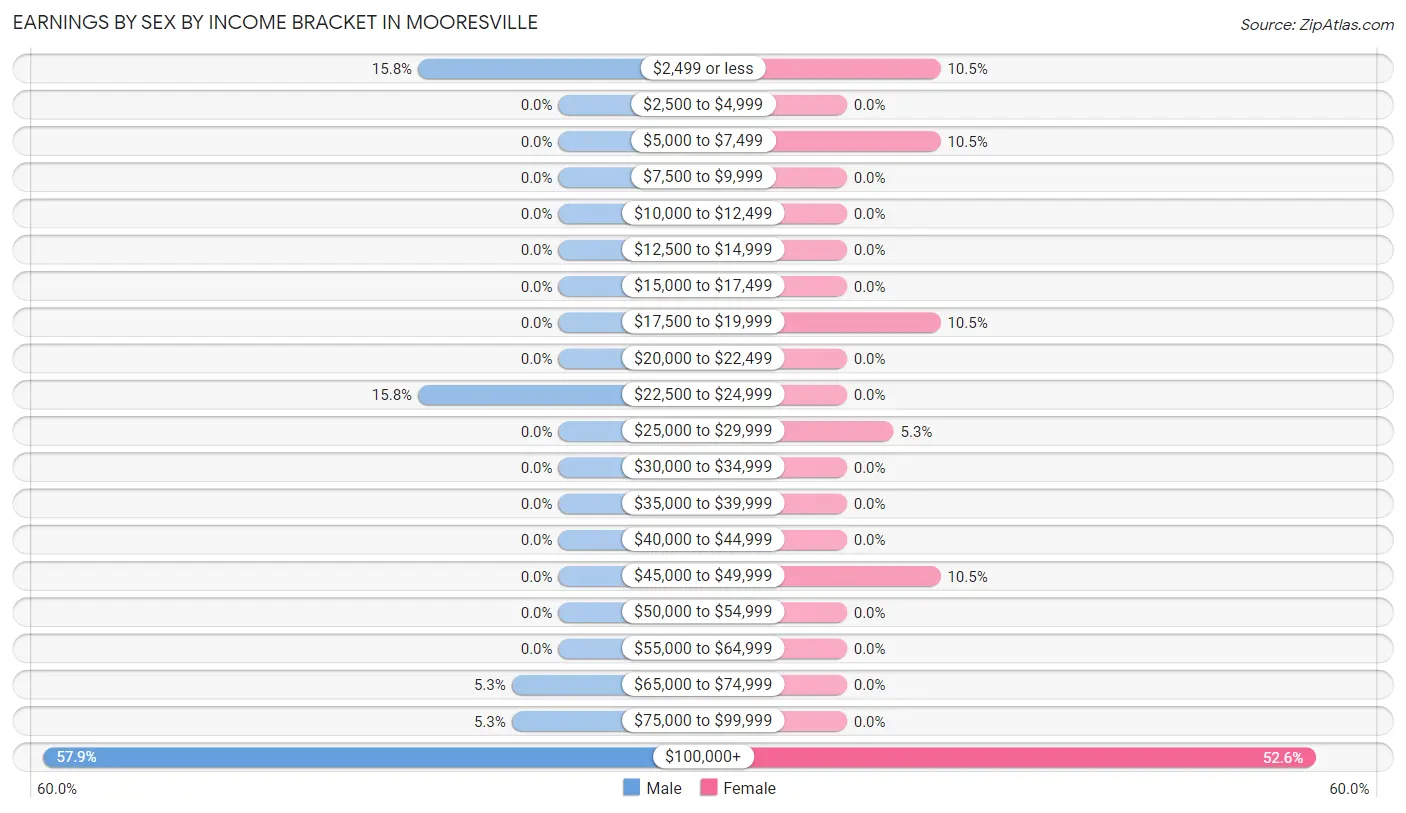
Earnings by Sex by Income Bracket in Mooresville
The most common earnings brackets in Mooresville are $100,000+ for men (11 | 57.9%) and $100,000+ for women (10 | 52.6%).
| Income | Male | Female |
| $2,499 or less | 3 (15.8%) | 2 (10.5%) |
| $2,500 to $4,999 | 0 (0.0%) | 0 (0.0%) |
| $5,000 to $7,499 | 0 (0.0%) | 2 (10.5%) |
| $7,500 to $9,999 | 0 (0.0%) | 0 (0.0%) |
| $10,000 to $12,499 | 0 (0.0%) | 0 (0.0%) |
| $12,500 to $14,999 | 0 (0.0%) | 0 (0.0%) |
| $15,000 to $17,499 | 0 (0.0%) | 0 (0.0%) |
| $17,500 to $19,999 | 0 (0.0%) | 2 (10.5%) |
| $20,000 to $22,499 | 0 (0.0%) | 0 (0.0%) |
| $22,500 to $24,999 | 3 (15.8%) | 0 (0.0%) |
| $25,000 to $29,999 | 0 (0.0%) | 1 (5.3%) |
| $30,000 to $34,999 | 0 (0.0%) | 0 (0.0%) |
| $35,000 to $39,999 | 0 (0.0%) | 0 (0.0%) |
| $40,000 to $44,999 | 0 (0.0%) | 0 (0.0%) |
| $45,000 to $49,999 | 0 (0.0%) | 2 (10.5%) |
| $50,000 to $54,999 | 0 (0.0%) | 0 (0.0%) |
| $55,000 to $64,999 | 0 (0.0%) | 0 (0.0%) |
| $65,000 to $74,999 | 1 (5.3%) | 0 (0.0%) |
| $75,000 to $99,999 | 1 (5.3%) | 0 (0.0%) |
| $100,000+ | 11 (57.9%) | 10 (52.6%) |
| Total | 19 (100.0%) | 19 (100.0%) |
Earnings by Sex by Educational Attainment in Mooresville
| Educational Attainment | Male Income | Female Income |
| Less than High School | - | - |
| High School Diploma | - | - |
| College or Associate's Degree | - | - |
| Bachelor's Degree | - | - |
| Graduate Degree | - | - |
| Total | $108,750 | $107,917 |
Family Income in Mooresville
Family Income Brackets in Mooresville
According to the Mooresville family income data, there are 14 families falling into the $35,000 to $49,999 income range, which is the most common income bracket and makes up 41.2% of all families.
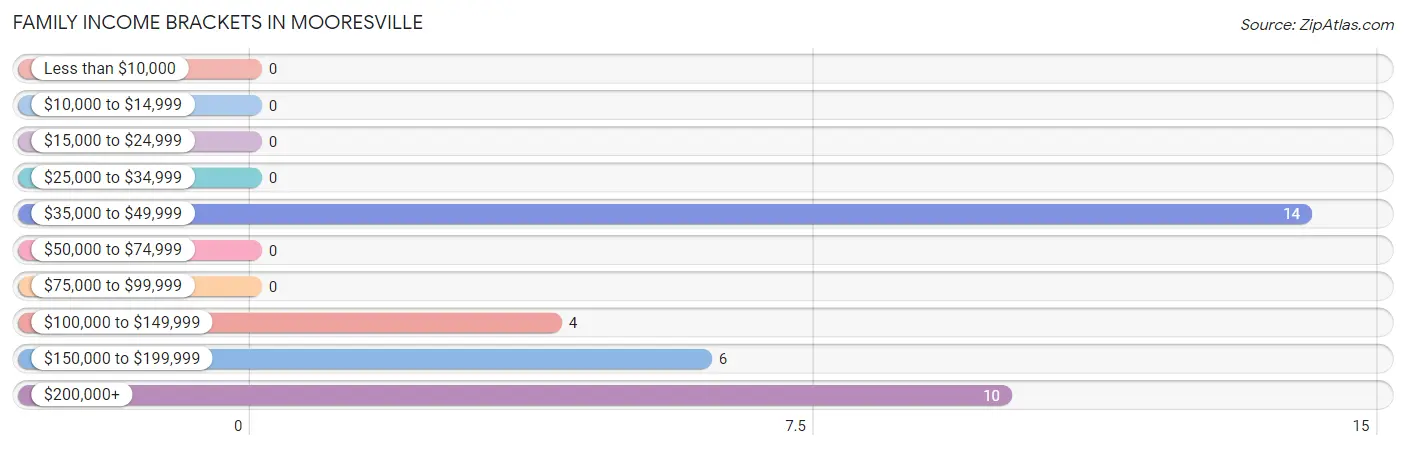
| Income Bracket | # Families | % Families |
| Less than $10,000 | 0 | 0.0% |
| $10,000 to $14,999 | 0 | 0.0% |
| $15,000 to $24,999 | 0 | 0.0% |
| $25,000 to $34,999 | 0 | 0.0% |
| $35,000 to $49,999 | 14 | 41.2% |
| $50,000 to $74,999 | 0 | 0.0% |
| $75,000 to $99,999 | 0 | 0.0% |
| $100,000 to $149,999 | 4 | 11.8% |
| $150,000 to $199,999 | 6 | 17.6% |
| $200,000+ | 10 | 29.4% |
Family Income by Famaliy Size in Mooresville
3-person families (5 | 14.7%) account for the highest median family income in Mooresville with $173,125 per family, while 3-person families (5 | 14.7%) have the highest median income of $57,708 per family member.
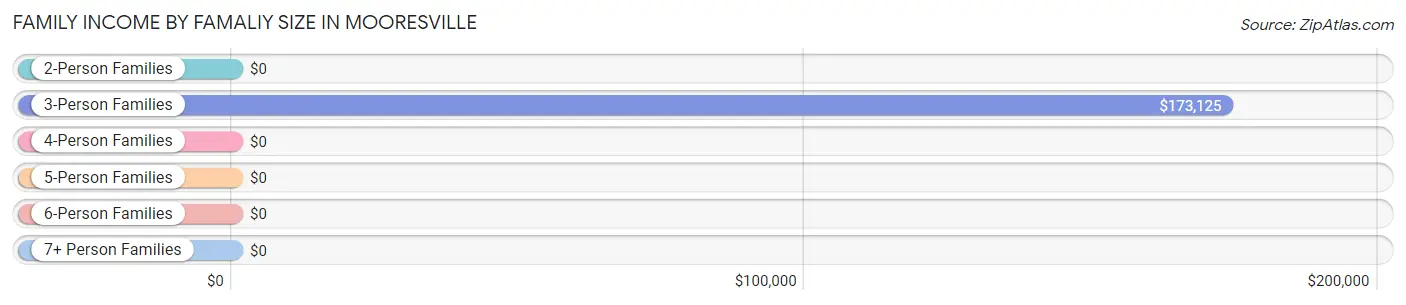
| Income Bracket | # Families | Median Income |
| 2-Person Families | 23 (67.6%) | $0 |
| 3-Person Families | 5 (14.7%) | $173,125 |
| 4-Person Families | 6 (17.6%) | $0 |
| 5-Person Families | 0 (0.0%) | $0 |
| 6-Person Families | 0 (0.0%) | $0 |
| 7+ Person Families | 0 (0.0%) | $0 |
| Total | 34 (100.0%) | $0 |
Family Income by Number of Earners in Mooresville
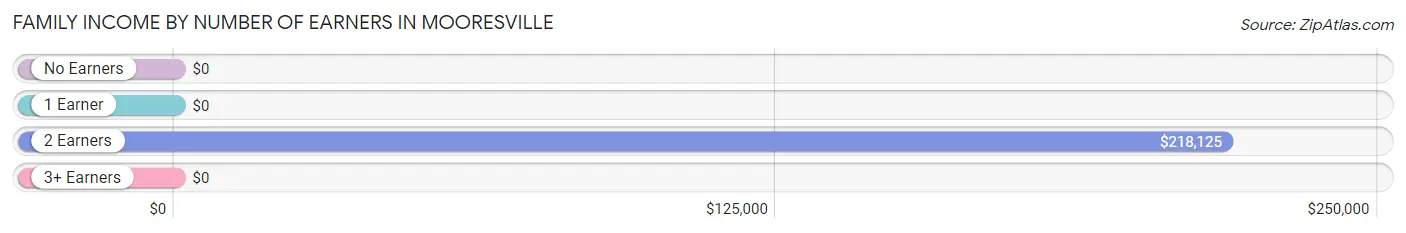
| Number of Earners | # Families | Median Income |
| No Earners | 12 (35.3%) | $0 |
| 1 Earner | 7 (20.6%) | $0 |
| 2 Earners | 15 (44.1%) | $218,125 |
| 3+ Earners | 0 (0.0%) | $0 |
| Total | 34 (100.0%) | $0 |
Household Income in Mooresville
Household Income Brackets in Mooresville
With 14 households falling in the category, the $35,000 to $49,999 income range is the most frequent in Mooresville, accounting for 38.9% of all households.
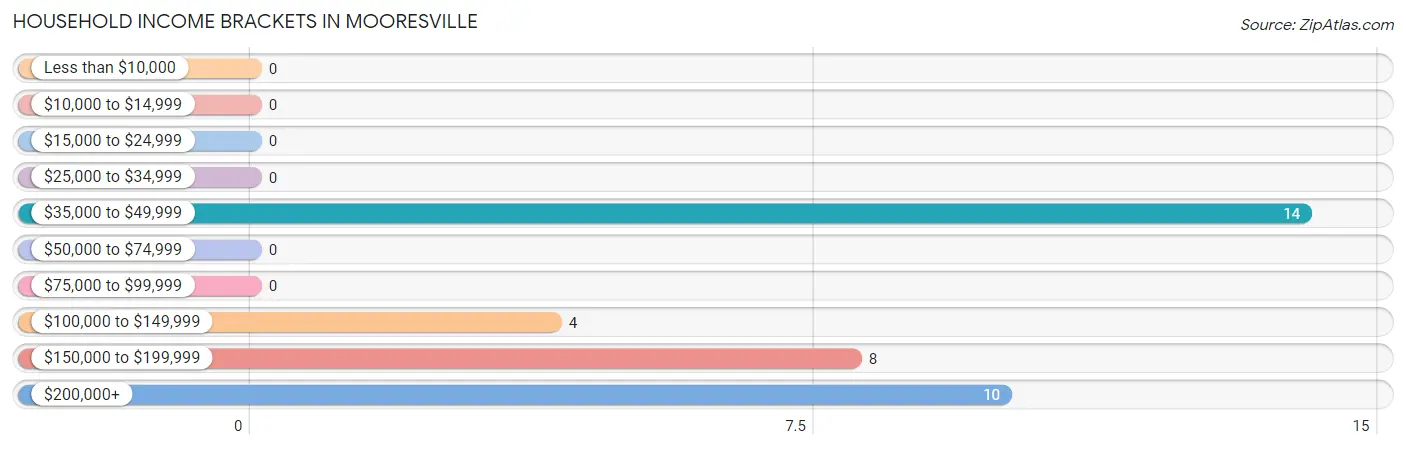
| Income Bracket | # Households | % Households |
| Less than $10,000 | 0 | 0.0% |
| $10,000 to $14,999 | 0 | 0.0% |
| $15,000 to $24,999 | 0 | 0.0% |
| $25,000 to $34,999 | 0 | 0.0% |
| $35,000 to $49,999 | 14 | 38.9% |
| $50,000 to $74,999 | 0 | 0.0% |
| $75,000 to $99,999 | 0 | 0.0% |
| $100,000 to $149,999 | 4 | 11.1% |
| $150,000 to $199,999 | 8 | 22.2% |
| $200,000+ | 10 | 27.8% |
Household Income by Householder Age in Mooresville
The median household income in Mooresville is $0, with the highest median household income of $202,500 found in the 45 to 64 years age bracket for the primary householder. A total of 12 households (33.3%) fall into this category.
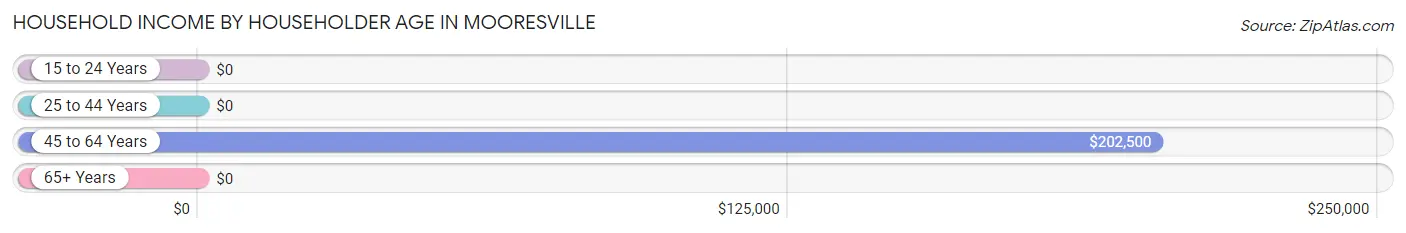
| Income Bracket | # Households | Median Income |
| 15 to 24 Years | 0 (0.0%) | $0 |
| 25 to 44 Years | 5 (13.9%) | $0 |
| 45 to 64 Years | 12 (33.3%) | $202,500 |
| 65+ Years | 19 (52.8%) | $0 |
| Total | 36 (100.0%) | $0 |
Poverty in Mooresville
Income Below Poverty by Sex and Age in Mooresville
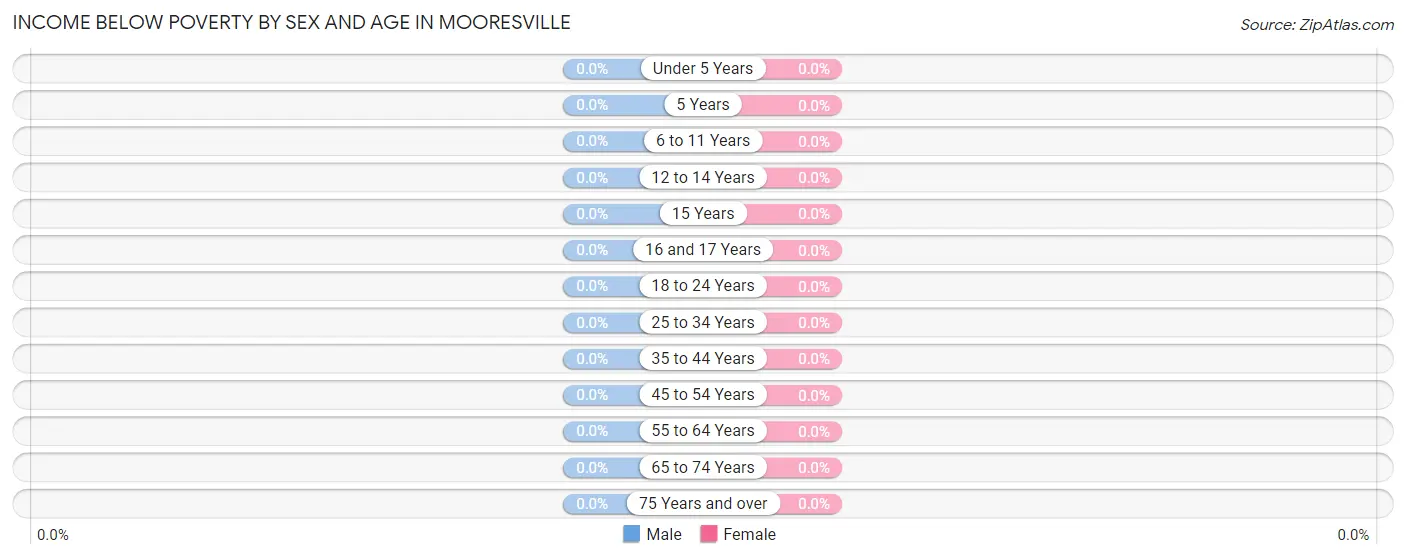
| Age Bracket | Male | Female |
| Under 5 Years | 0 (0.0%) | 0 (0.0%) |
| 5 Years | 0 (0.0%) | 0 (0.0%) |
| 6 to 11 Years | 0 (0.0%) | 0 (0.0%) |
| 12 to 14 Years | 0 (0.0%) | 0 (0.0%) |
| 15 Years | 0 (0.0%) | 0 (0.0%) |
| 16 and 17 Years | 0 (0.0%) | 0 (0.0%) |
| 18 to 24 Years | 0 (0.0%) | 0 (0.0%) |
| 25 to 34 Years | 0 (0.0%) | 0 (0.0%) |
| 35 to 44 Years | 0 (0.0%) | 0 (0.0%) |
| 45 to 54 Years | 0 (0.0%) | 0 (0.0%) |
| 55 to 64 Years | 0 (0.0%) | 0 (0.0%) |
| 65 to 74 Years | 0 (0.0%) | 0 (0.0%) |
| 75 Years and over | 0 (0.0%) | 0 (0.0%) |
| Total | 0 (0.0%) | 0 (0.0%) |
Income Above Poverty by Sex and Age in Mooresville
According to the poverty statistics in Mooresville, males aged 18 to 24 years and females aged under 5 years are the age groups that are most secure financially, with 100.0% of males and 100.0% of females in these age groups living above the poverty line.
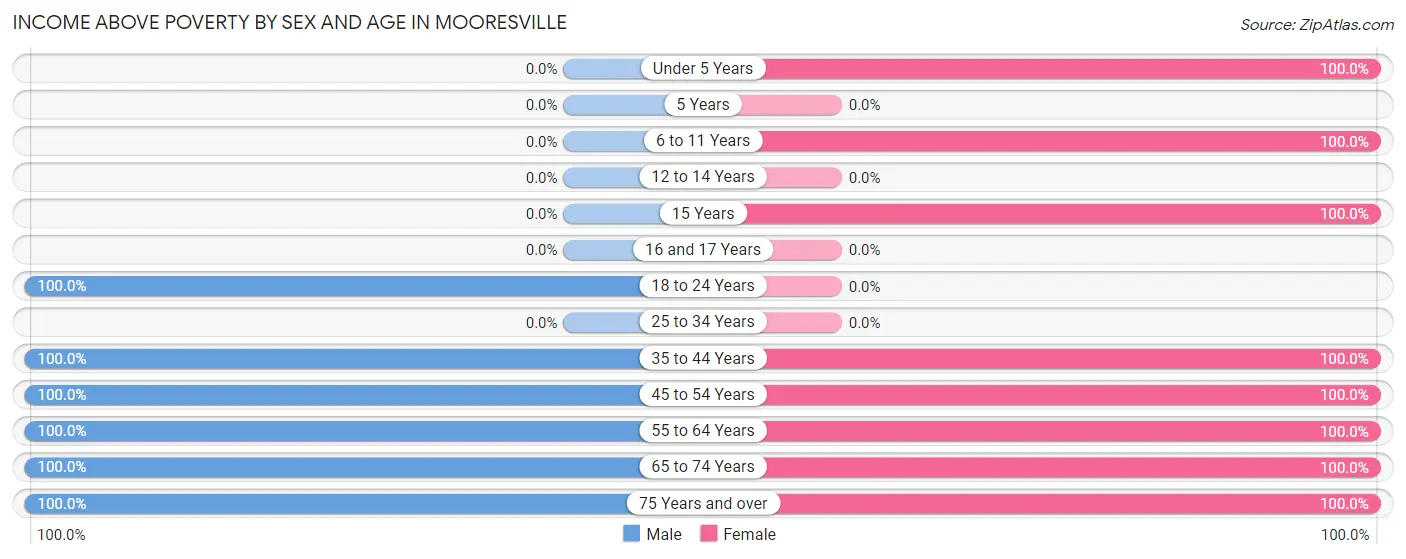
| Age Bracket | Male | Female |
| Under 5 Years | 0 (0.0%) | 3 (100.0%) |
| 5 Years | 0 (0.0%) | 0 (0.0%) |
| 6 to 11 Years | 0 (0.0%) | 4 (100.0%) |
| 12 to 14 Years | 0 (0.0%) | 0 (0.0%) |
| 15 Years | 0 (0.0%) | 5 (100.0%) |
| 16 and 17 Years | 0 (0.0%) | 0 (0.0%) |
| 18 to 24 Years | 7 (100.0%) | 0 (0.0%) |
| 25 to 34 Years | 0 (0.0%) | 0 (0.0%) |
| 35 to 44 Years | 5 (100.0%) | 5 (100.0%) |
| 45 to 54 Years | 5 (100.0%) | 8 (100.0%) |
| 55 to 64 Years | 8 (100.0%) | 22 (100.0%) |
| 65 to 74 Years | 3 (100.0%) | 4 (100.0%) |
| 75 Years and over | 2 (100.0%) | 12 (100.0%) |
| Total | 30 (100.0%) | 63 (100.0%) |
Income Below Poverty Among Married-Couple Families in Mooresville
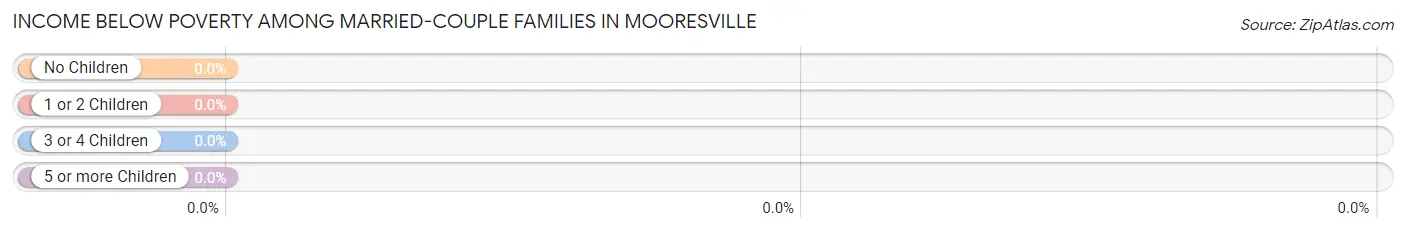
| Children | Above Poverty | Below Poverty |
| No Children | 15 (100.0%) | 0 (0.0%) |
| 1 or 2 Children | 8 (100.0%) | 0 (0.0%) |
| 3 or 4 Children | 0 (0.0%) | 0 (0.0%) |
| 5 or more Children | 0 (0.0%) | 0 (0.0%) |
| Total | 23 (100.0%) | 0 (0.0%) |
Income Below Poverty Among Single-Parent Households in Mooresville
| Children | Single Father | Single Mother |
| No Children | 0 (0.0%) | 0 (0.0%) |
| 1 or 2 Children | 0 (0.0%) | 0 (0.0%) |
| 3 or 4 Children | 0 (0.0%) | 0 (0.0%) |
| 5 or more Children | 0 (0.0%) | 0 (0.0%) |
| Total | 0 (0.0%) | 0 (0.0%) |
Income Below Poverty Among Married-Couple vs Single-Parent Households in Mooresville
| Children | Married-Couple Families | Single-Parent Households |
| No Children | 0 (0.0%) | 0 (0.0%) |
| 1 or 2 Children | 0 (0.0%) | 0 (0.0%) |
| 3 or 4 Children | 0 (0.0%) | 0 (0.0%) |
| 5 or more Children | 0 (0.0%) | 0 (0.0%) |
| Total | 0 (0.0%) | 0 (0.0%) |
Race in Mooresville
The most populous races in Mooresville are White / Caucasian (92 | 98.9%), Hispanic or Latino (1 | 1.1%), and Some other Race (1 | 1.1%).
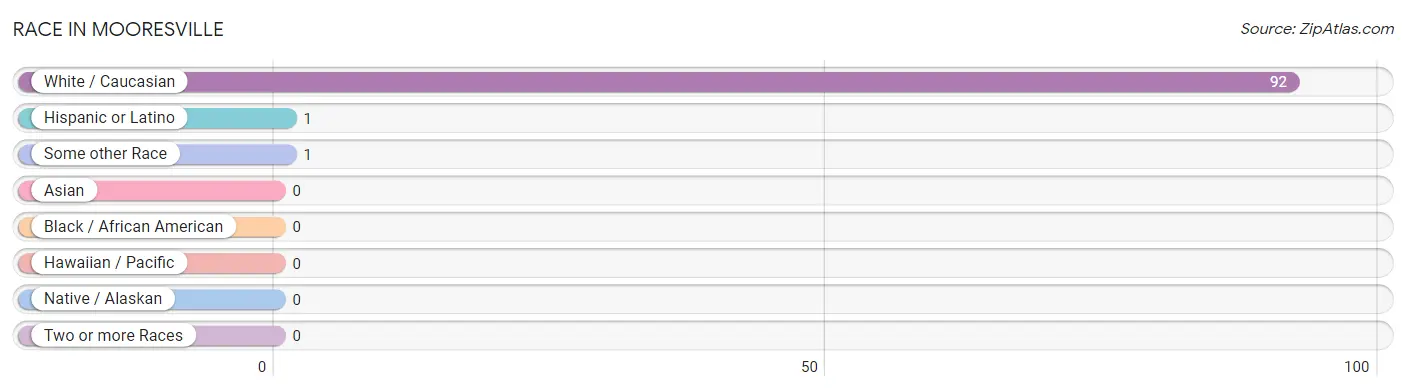
| Race | # Population | % Population |
| Asian | 0 | 0.0% |
| Black / African American | 0 | 0.0% |
| Hawaiian / Pacific | 0 | 0.0% |
| Hispanic or Latino | 1 | 1.1% |
| Native / Alaskan | 0 | 0.0% |
| White / Caucasian | 92 | 98.9% |
| Two or more Races | 0 | 0.0% |
| Some other Race | 1 | 1.1% |
| Total | 93 | 100.0% |
Ancestry in Mooresville
The most populous ancestries reported in Mooresville are English (31 | 33.3%), German (28 | 30.1%), Irish (13 | 14.0%), American (7 | 7.5%), and Scotch-Irish (7 | 7.5%), together accounting for 92.5% of all Mooresville residents.
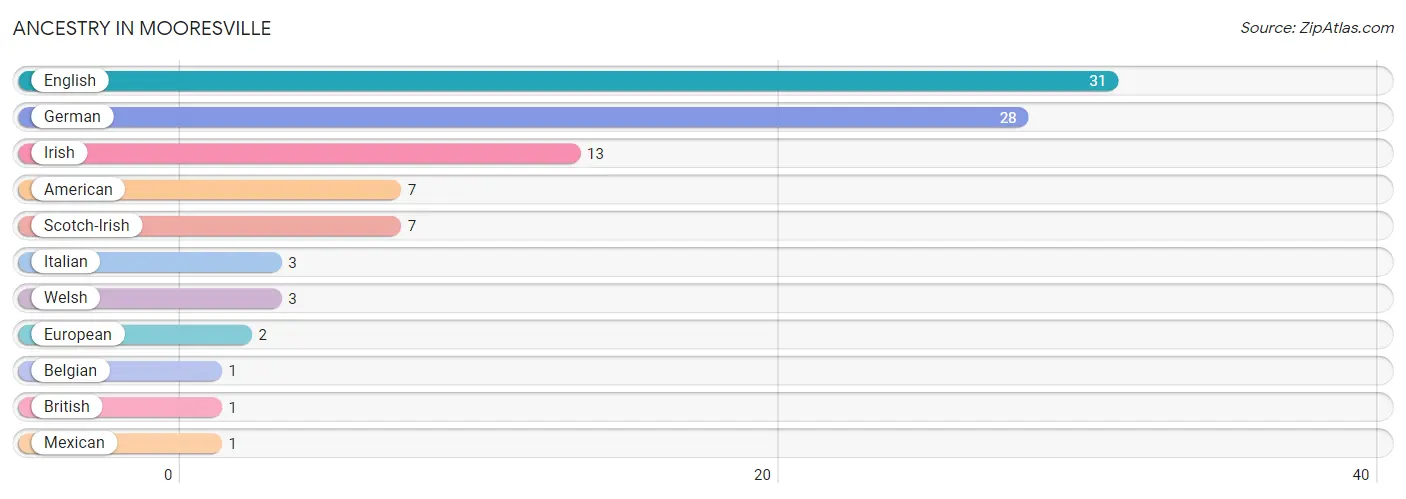
| Ancestry | # Population | % Population |
| American | 7 | 7.5% |
| Belgian | 1 | 1.1% |
| British | 1 | 1.1% |
| English | 31 | 33.3% |
| European | 2 | 2.1% |
| German | 28 | 30.1% |
| Irish | 13 | 14.0% |
| Italian | 3 | 3.2% |
| Mexican | 1 | 1.1% |
| Scotch-Irish | 7 | 7.5% |
| Welsh | 3 | 3.2% | View All 11 Rows |
Immigrants in Mooresville
The most numerous immigrant groups reported in Mooresville came from Europe (4 | 4.3%), Ireland (4 | 4.3%), and Northern Europe (4 | 4.3%), together accounting for 12.9% of all Mooresville residents.
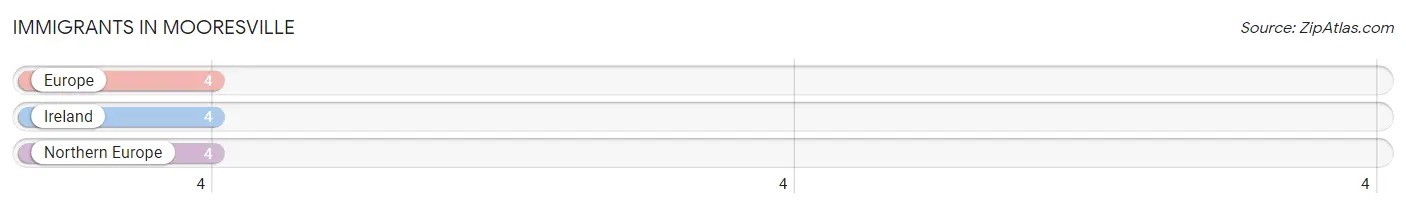
| Immigration Origin | # Population | % Population |
| Europe | 4 | 4.3% |
| Ireland | 4 | 4.3% |
| Northern Europe | 4 | 4.3% | View All 3 Rows |
Sex and Age in Mooresville
Sex and Age in Mooresville
The most populous age groups in Mooresville are 15 to 19 Years (7 | 23.3%) for men and 55 to 59 Years (19 | 30.2%) for women.
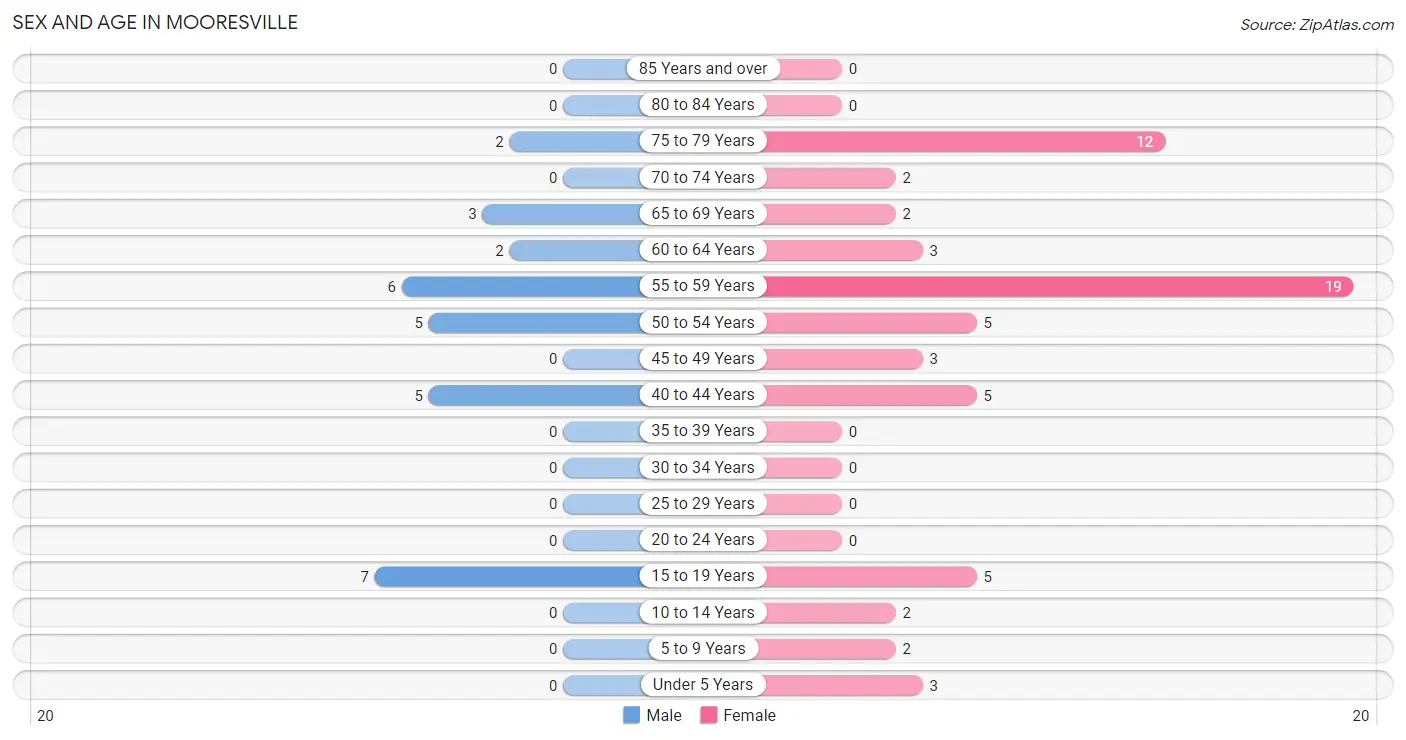
| Age Bracket | Male | Female |
| Under 5 Years | 0 (0.0%) | 3 (4.8%) |
| 5 to 9 Years | 0 (0.0%) | 2 (3.2%) |
| 10 to 14 Years | 0 (0.0%) | 2 (3.2%) |
| 15 to 19 Years | 7 (23.3%) | 5 (7.9%) |
| 20 to 24 Years | 0 (0.0%) | 0 (0.0%) |
| 25 to 29 Years | 0 (0.0%) | 0 (0.0%) |
| 30 to 34 Years | 0 (0.0%) | 0 (0.0%) |
| 35 to 39 Years | 0 (0.0%) | 0 (0.0%) |
| 40 to 44 Years | 5 (16.7%) | 5 (7.9%) |
| 45 to 49 Years | 0 (0.0%) | 3 (4.8%) |
| 50 to 54 Years | 5 (16.7%) | 5 (7.9%) |
| 55 to 59 Years | 6 (20.0%) | 19 (30.2%) |
| 60 to 64 Years | 2 (6.7%) | 3 (4.8%) |
| 65 to 69 Years | 3 (10.0%) | 2 (3.2%) |
| 70 to 74 Years | 0 (0.0%) | 2 (3.2%) |
| 75 to 79 Years | 2 (6.7%) | 12 (19.1%) |
| 80 to 84 Years | 0 (0.0%) | 0 (0.0%) |
| 85 Years and over | 0 (0.0%) | 0 (0.0%) |
| Total | 30 (100.0%) | 63 (100.0%) |
Families and Households in Mooresville
Median Family Size in Mooresville
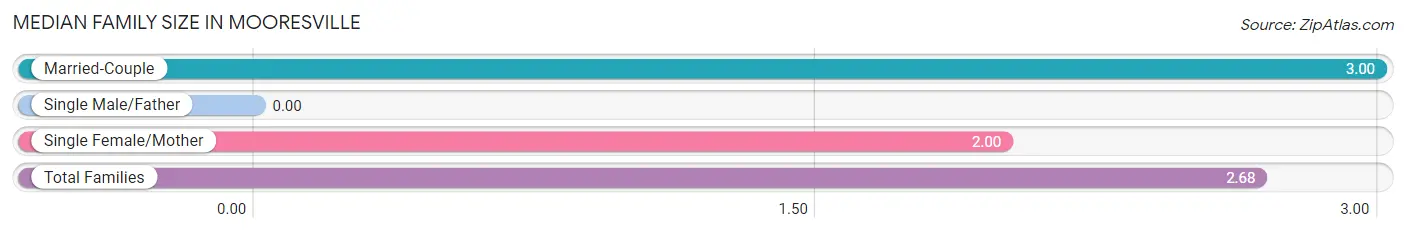
| Family Type | # Families | Family Size |
| Married-Couple | 23 (67.6%) | 3.00 |
| Single Male/Father | 0 (0.0%) | - |
| Single Female/Mother | 11 (32.4%) | 2.00 |
| Total Families | 34 (100.0%) | 2.68 |
Median Household Size in Mooresville
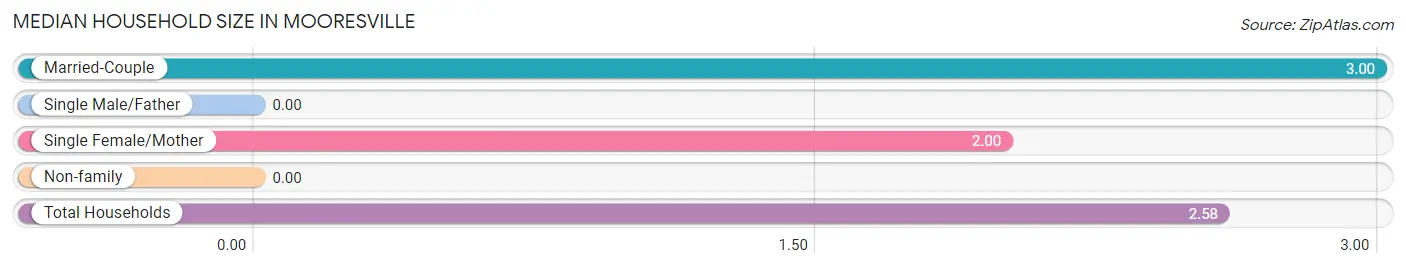
| Household Type | # Households | Household Size |
| Married-Couple | 23 (63.9%) | 3.00 |
| Single Male/Father | 0 (0.0%) | - |
| Single Female/Mother | 11 (30.6%) | 2.00 |
| Non-family | 2 (5.6%) | - |
| Total Households | 36 (100.0%) | 2.58 |
Household Size by Marriage Status in Mooresville
Out of a total of 36 households in Mooresville, 34 (94.4%) are family households, while 2 (5.6%) are nonfamily households. The most numerous type of family households are 2-person households, comprising 23, and the most common type of nonfamily households are 1-person households, comprising 2.
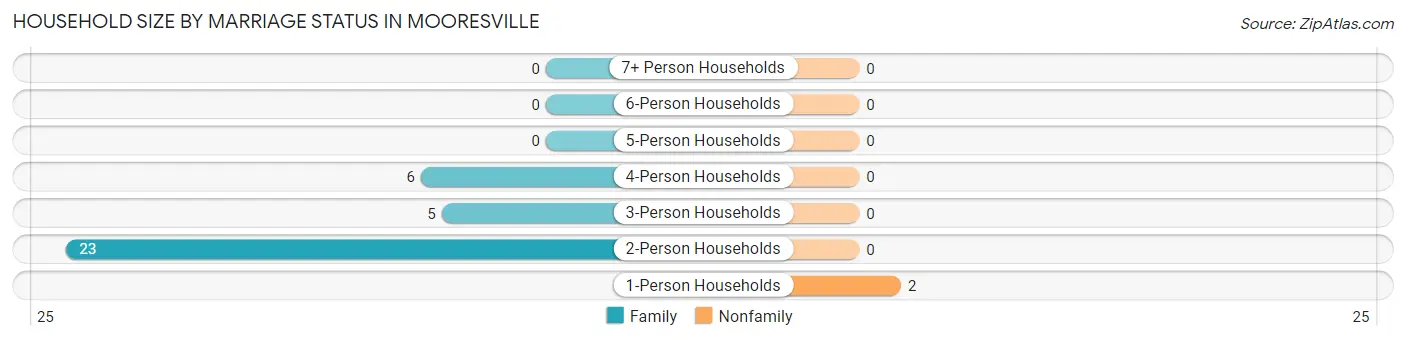
| Household Size | Family Households | Nonfamily Households |
| 1-Person Households | - | 2 (5.6%) |
| 2-Person Households | 23 (63.9%) | 0 (0.0%) |
| 3-Person Households | 5 (13.9%) | 0 (0.0%) |
| 4-Person Households | 6 (16.7%) | 0 (0.0%) |
| 5-Person Households | 0 (0.0%) | 0 (0.0%) |
| 6-Person Households | 0 (0.0%) | 0 (0.0%) |
| 7+ Person Households | 0 (0.0%) | 0 (0.0%) |
| Total | 34 (94.4%) | 2 (5.6%) |
Female Fertility in Mooresville
Fertility by Age in Mooresville
Average fertility rate in Mooresville is 231.0 births per 1,000 women. Women in the age bracket of 35 to 50 years have the highest fertility rate with 375.0 births per 1,000 women. Women in the age bracket of 35 to 50 years acount for 100.0% of all women with births.
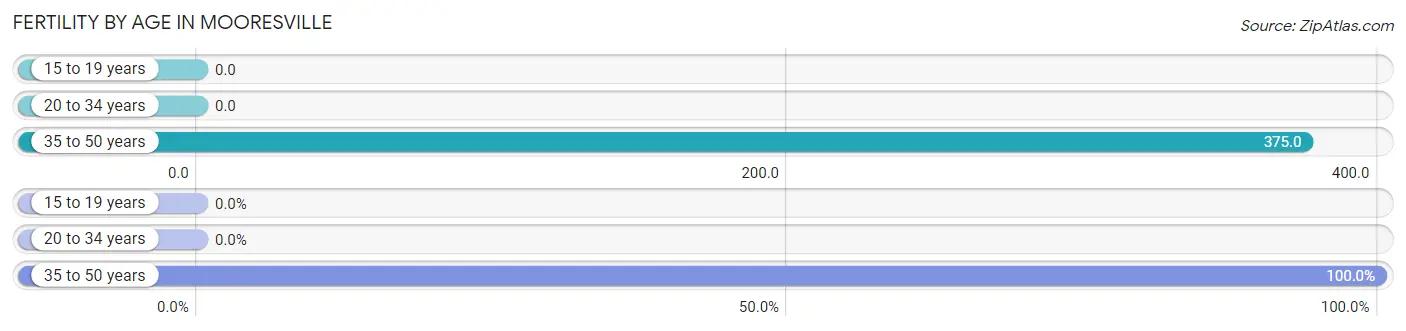
| Age Bracket | Women with Births | Births / 1,000 Women |
| 15 to 19 years | 0 (0.0%) | 0.0 |
| 20 to 34 years | 0 (0.0%) | 0.0 |
| 35 to 50 years | 3 (100.0%) | 375.0 |
| Total | 3 (100.0%) | 231.0 |
Fertility by Age by Marriage Status in Mooresville
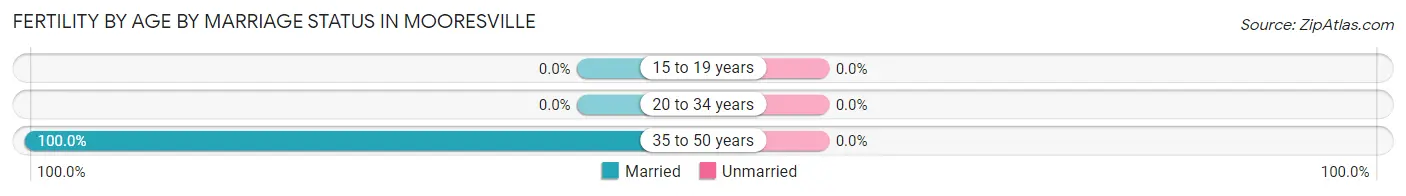
| Age Bracket | Married | Unmarried |
| 15 to 19 years | 0 (0.0%) | 0 (0.0%) |
| 20 to 34 years | 0 (0.0%) | 0 (0.0%) |
| 35 to 50 years | 3 (100.0%) | 0 (0.0%) |
| Total | 3 (100.0%) | 0 (0.0%) |
Fertility by Education in Mooresville
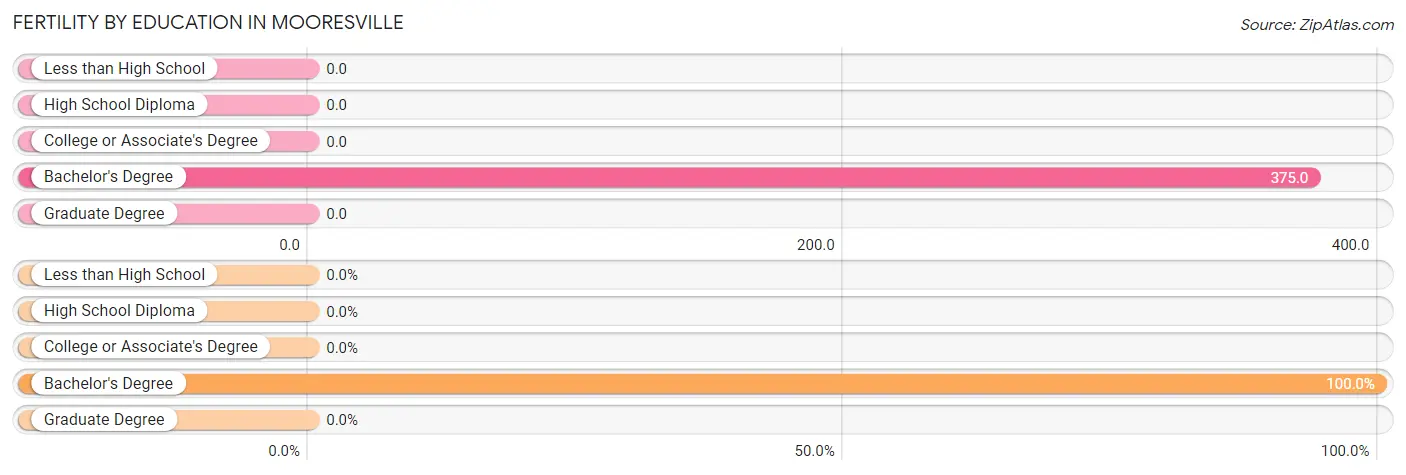
| Educational Attainment | Women with Births | Births / 1,000 Women |
| Less than High School | 0 (0.0%) | 0.0 |
| High School Diploma | 0 (0.0%) | 0.0 |
| College or Associate's Degree | 0 (0.0%) | 0.0 |
| Bachelor's Degree | 3 (100.0%) | 375.0 |
| Graduate Degree | 0 (0.0%) | 0.0 |
| Total | 3 (100.0%) | 231.0 |
Fertility by Education by Marriage Status in Mooresville
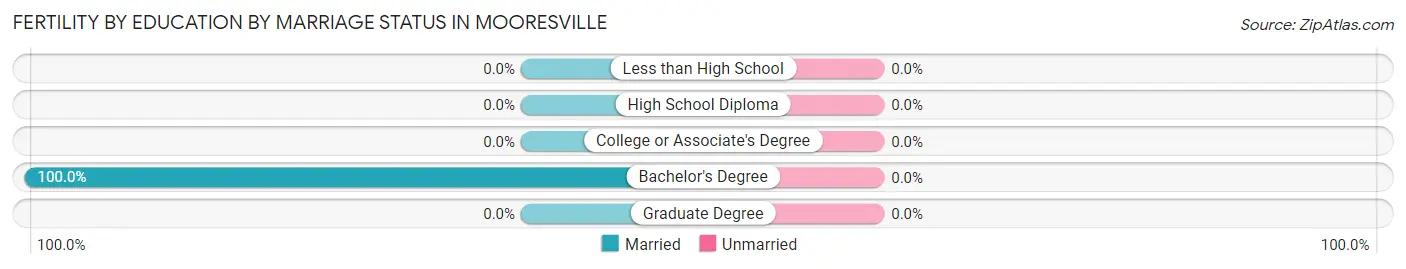
| Educational Attainment | Married | Unmarried |
| Less than High School | 0 (0.0%) | 0 (0.0%) |
| High School Diploma | 0 (0.0%) | 0 (0.0%) |
| College or Associate's Degree | 0 (0.0%) | 0 (0.0%) |
| Bachelor's Degree | 3 (100.0%) | 0 (0.0%) |
| Graduate Degree | 0 (0.0%) | 0 (0.0%) |
| Total | 3 (100.0%) | 0 (0.0%) |
Employment Characteristics in Mooresville
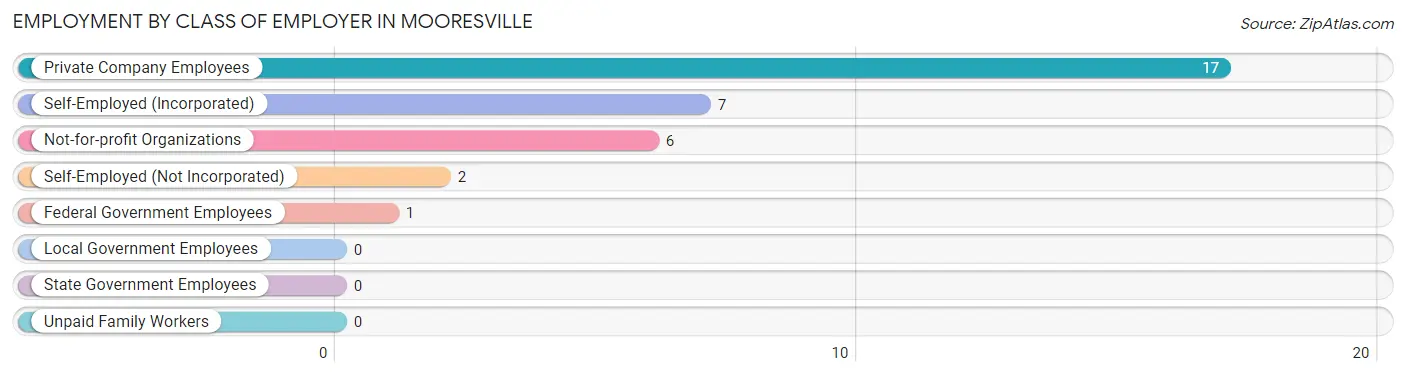
Employment by Class of Employer in Mooresville
Among the 33 employed individuals in Mooresville, private company employees (17 | 51.5%), self-employed (incorporated) (7 | 21.2%), and not-for-profit organizations (6 | 18.2%) make up the most common classes of employment.
| Employer Class | # Employees | % Employees |
| Private Company Employees | 17 | 51.5% |
| Self-Employed (Incorporated) | 7 | 21.2% |
| Self-Employed (Not Incorporated) | 2 | 6.1% |
| Not-for-profit Organizations | 6 | 18.2% |
| Local Government Employees | 0 | 0.0% |
| State Government Employees | 0 | 0.0% |
| Federal Government Employees | 1 | 3.0% |
| Unpaid Family Workers | 0 | 0.0% |
| Total | 33 | 100.0% |
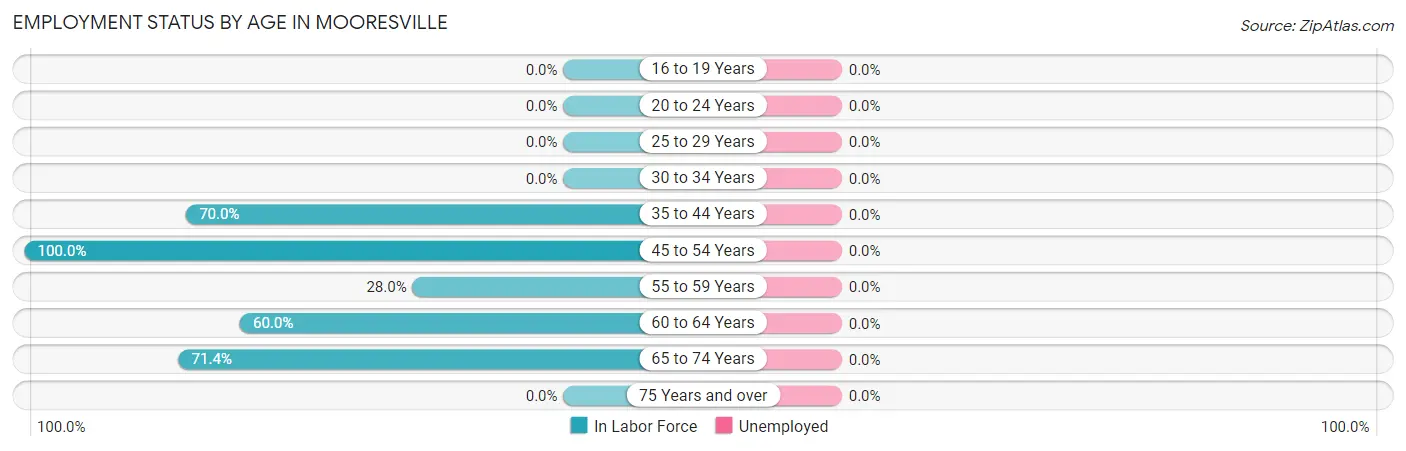
Employment Status by Age in Mooresville
| Age Bracket | In Labor Force | Unemployed |
| 16 to 19 Years | 0 (0.0%) | 0 (0.0%) |
| 20 to 24 Years | 0 (0.0%) | 0 (0.0%) |
| 25 to 29 Years | 0 (0.0%) | 0 (0.0%) |
| 30 to 34 Years | 0 (0.0%) | 0 (0.0%) |
| 35 to 44 Years | 7 (70.0%) | 0 (0.0%) |
| 45 to 54 Years | 13 (100.0%) | 0 (0.0%) |
| 55 to 59 Years | 7 (28.0%) | 0 (0.0%) |
| 60 to 64 Years | 3 (60.0%) | 0 (0.0%) |
| 65 to 74 Years | 5 (71.4%) | 0 (0.0%) |
| 75 Years and over | 0 (0.0%) | 0 (0.0%) |
| Total | 35 (43.2%) | 0 (0.0%) |
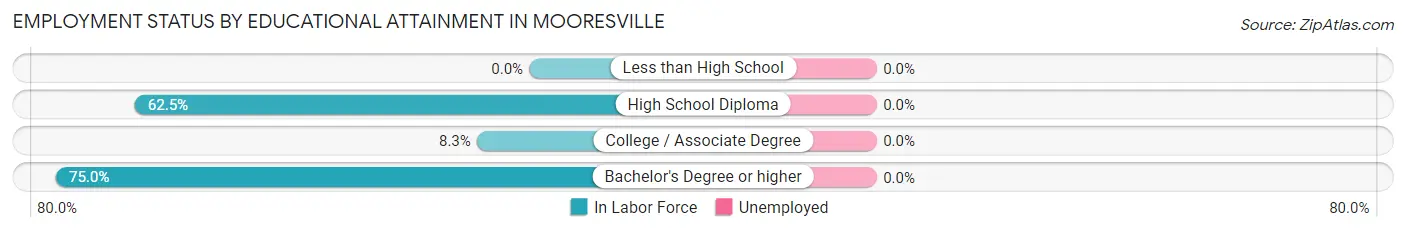
Employment Status by Educational Attainment in Mooresville
| Educational Attainment | In Labor Force | Unemployed |
| Less than High School | 0 (0.0%) | 0 (0.0%) |
| High School Diploma | 5 (62.5%) | 0 (0.0%) |
| College / Associate Degree | 1 (8.3%) | 0 (0.0%) |
| Bachelor's Degree or higher | 24 (75.0%) | 0 (0.0%) |
| Total | 30 (56.6%) | 0 (0.0%) |
Employment Occupations by Sex in Mooresville
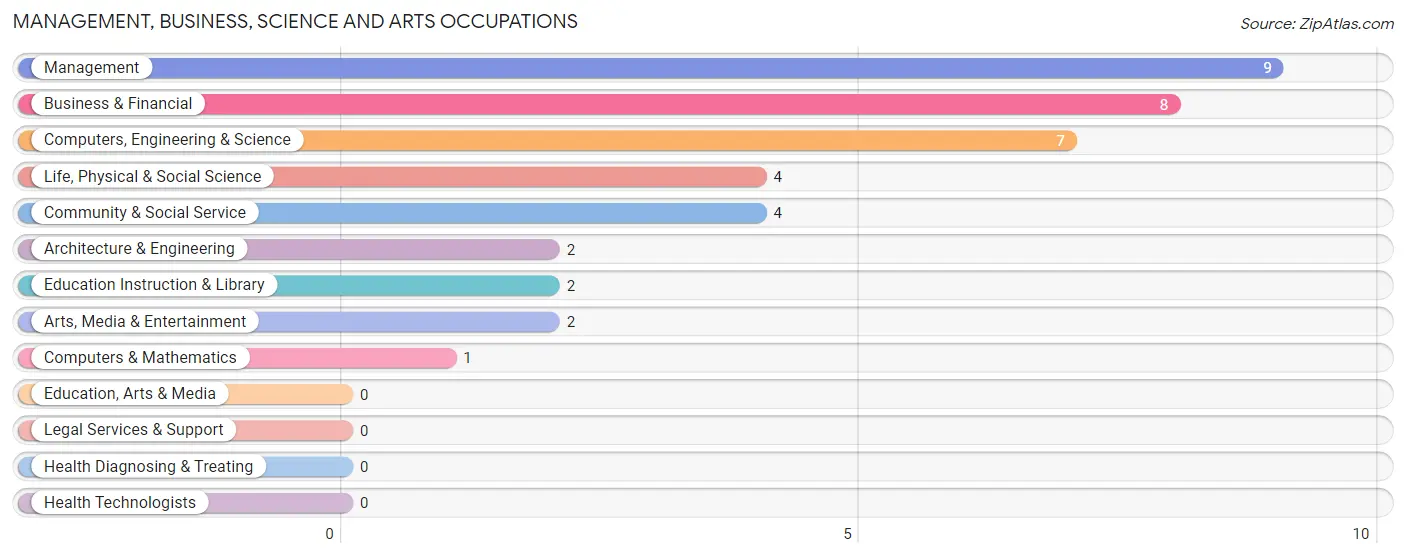
Management, Business, Science and Arts Occupations
The most common Management, Business, Science and Arts occupations in Mooresville are Management (9 | 25.7%), Business & Financial (8 | 22.9%), Computers, Engineering & Science (7 | 20.0%), Life, Physical & Social Science (4 | 11.4%), and Community & Social Service (4 | 11.4%).
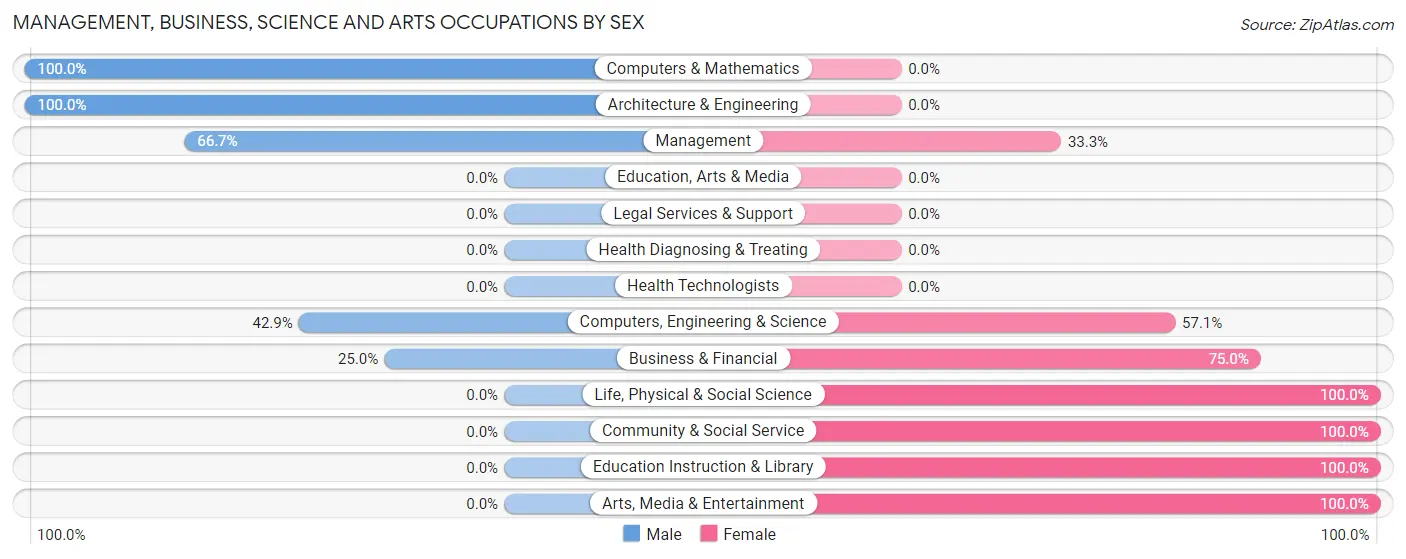
Management, Business, Science and Arts Occupations by Sex
Within the Management, Business, Science and Arts occupations in Mooresville, the most male-oriented occupations are Computers & Mathematics (100.0%), Architecture & Engineering (100.0%), and Management (66.7%), while the most female-oriented occupations are Life, Physical & Social Science (100.0%), Community & Social Service (100.0%), and Education Instruction & Library (100.0%).
| Occupation | Male | Female |
| Management | 6 (66.7%) | 3 (33.3%) |
| Business & Financial | 2 (25.0%) | 6 (75.0%) |
| Computers, Engineering & Science | 3 (42.9%) | 4 (57.1%) |
| Computers & Mathematics | 1 (100.0%) | 0 (0.0%) |
| Architecture & Engineering | 2 (100.0%) | 0 (0.0%) |
| Life, Physical & Social Science | 0 (0.0%) | 4 (100.0%) |
| Community & Social Service | 0 (0.0%) | 4 (100.0%) |
| Education, Arts & Media | 0 (0.0%) | 0 (0.0%) |
| Legal Services & Support | 0 (0.0%) | 0 (0.0%) |
| Education Instruction & Library | 0 (0.0%) | 2 (100.0%) |
| Arts, Media & Entertainment | 0 (0.0%) | 2 (100.0%) |
| Health Diagnosing & Treating | 0 (0.0%) | 0 (0.0%) |
| Health Technologists | 0 (0.0%) | 0 (0.0%) |
| Total (Category) | 11 (39.3%) | 17 (60.7%) |
| Total (Overall) | 16 (45.7%) | 19 (54.3%) |
Services Occupations
Services Occupations by Sex
| Occupation | Male | Female |
| Healthcare Support | 0 (0.0%) | 0 (0.0%) |
| Security & Protection | 0 (0.0%) | 0 (0.0%) |
| Firefighting & Prevention | 0 (0.0%) | 0 (0.0%) |
| Law Enforcement | 0 (0.0%) | 0 (0.0%) |
| Food Preparation & Serving | 0 (0.0%) | 0 (0.0%) |
| Cleaning & Maintenance | 0 (0.0%) | 0 (0.0%) |
| Personal Care & Service | 0 (0.0%) | 0 (0.0%) |
| Total (Category) | 0 (0.0%) | 0 (0.0%) |
| Total (Overall) | 16 (45.7%) | 19 (54.3%) |
Sales and Office Occupations
The most common Sales and Office occupations in Mooresville are , and Sales & Related (5 | 14.3%).
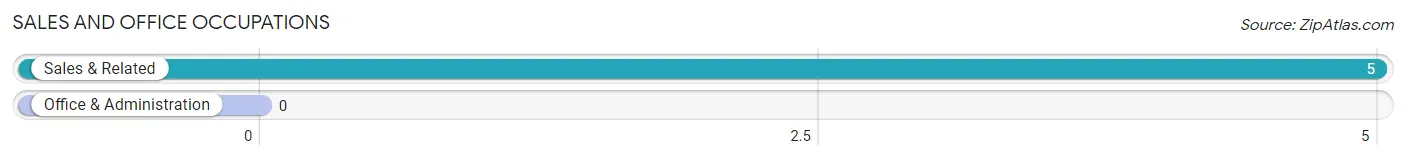
Sales and Office Occupations by Sex
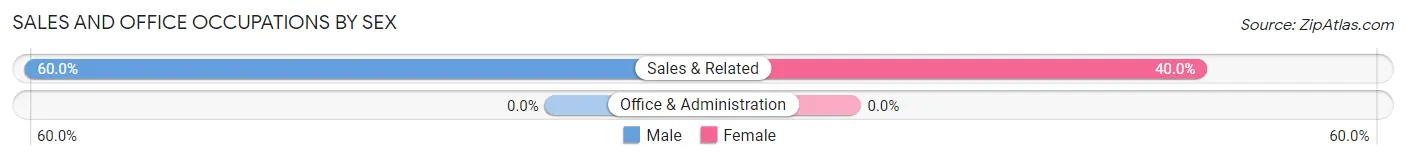
| Occupation | Male | Female |
| Sales & Related | 3 (60.0%) | 2 (40.0%) |
| Office & Administration | 0 (0.0%) | 0 (0.0%) |
| Total (Category) | 3 (60.0%) | 2 (40.0%) |
| Total (Overall) | 16 (45.7%) | 19 (54.3%) |
Natural Resources, Construction and Maintenance Occupations
The most common Natural Resources, Construction and Maintenance occupations in Mooresville are , and Construction & Extraction (2 | 5.7%).
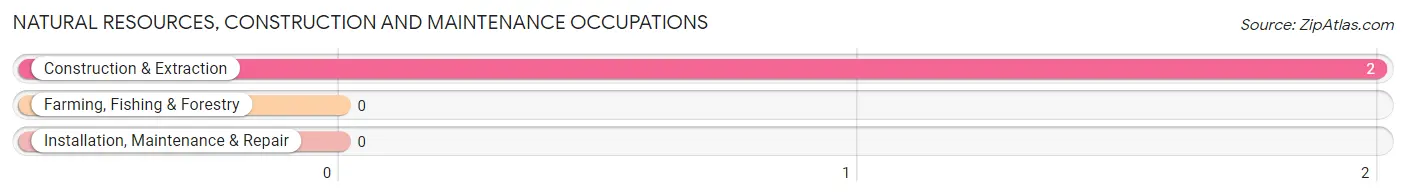
Natural Resources, Construction and Maintenance Occupations by Sex
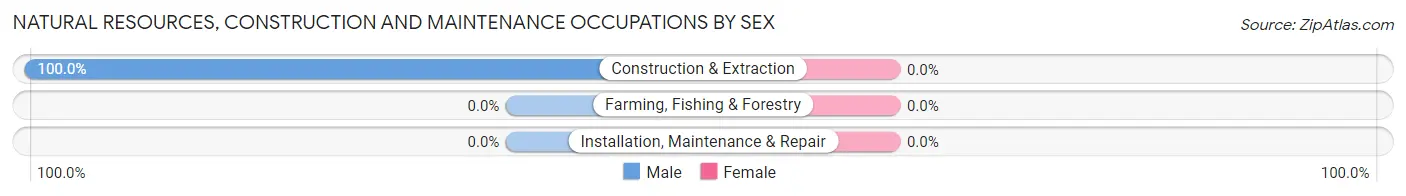
| Occupation | Male | Female |
| Farming, Fishing & Forestry | 0 (0.0%) | 0 (0.0%) |
| Construction & Extraction | 2 (100.0%) | 0 (0.0%) |
| Installation, Maintenance & Repair | 0 (0.0%) | 0 (0.0%) |
| Total (Category) | 2 (100.0%) | 0 (0.0%) |
| Total (Overall) | 16 (45.7%) | 19 (54.3%) |
Production, Transportation and Moving Occupations
Production, Transportation and Moving Occupations by Sex
| Occupation | Male | Female |
| Production | 0 (0.0%) | 0 (0.0%) |
| Transportation | 0 (0.0%) | 0 (0.0%) |
| Material Moving | 0 (0.0%) | 0 (0.0%) |
| Total (Category) | 0 (0.0%) | 0 (0.0%) |
| Total (Overall) | 16 (45.7%) | 19 (54.3%) |
Employment Industries by Sex in Mooresville
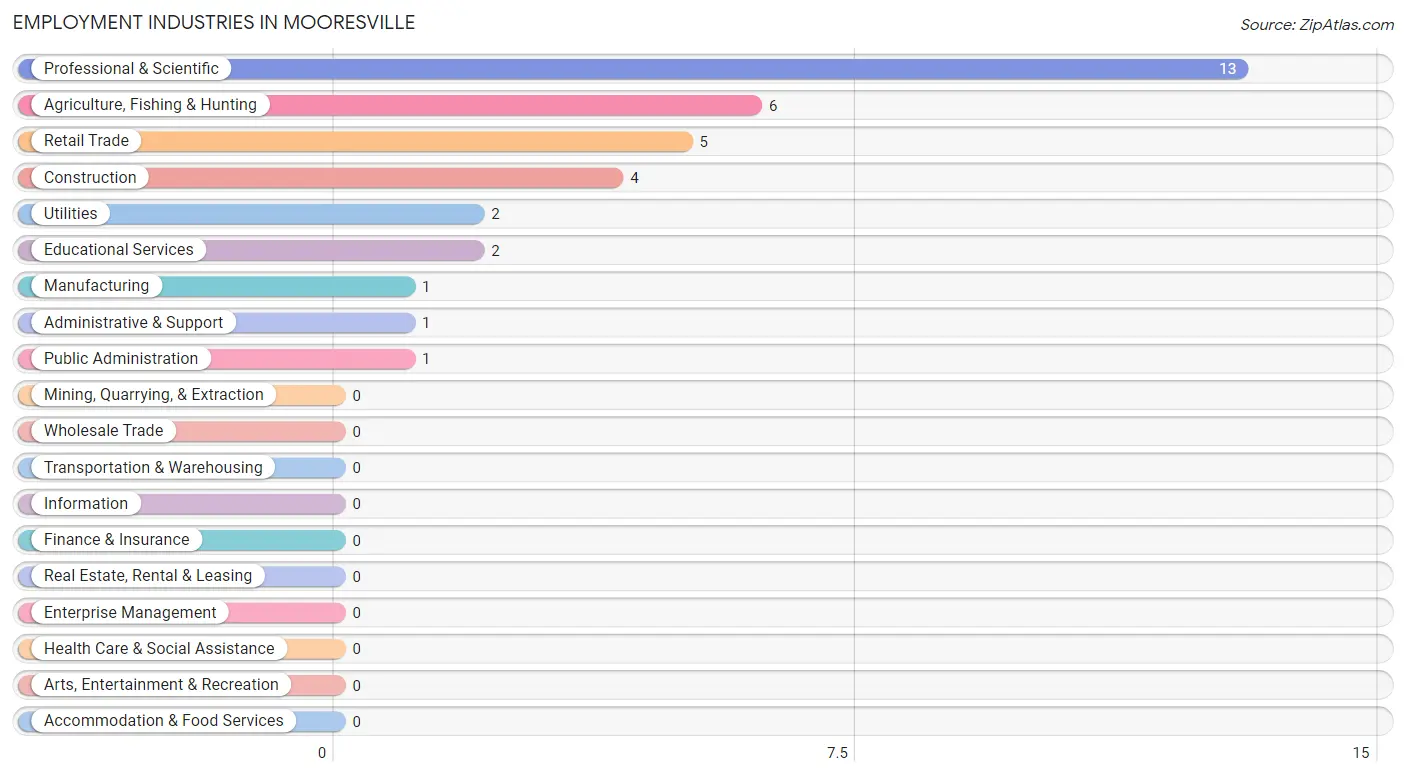
Employment Industries in Mooresville
The major employment industries in Mooresville include Professional & Scientific (13 | 37.1%), Agriculture, Fishing & Hunting (6 | 17.1%), Retail Trade (5 | 14.3%), Construction (4 | 11.4%), and Utilities (2 | 5.7%).
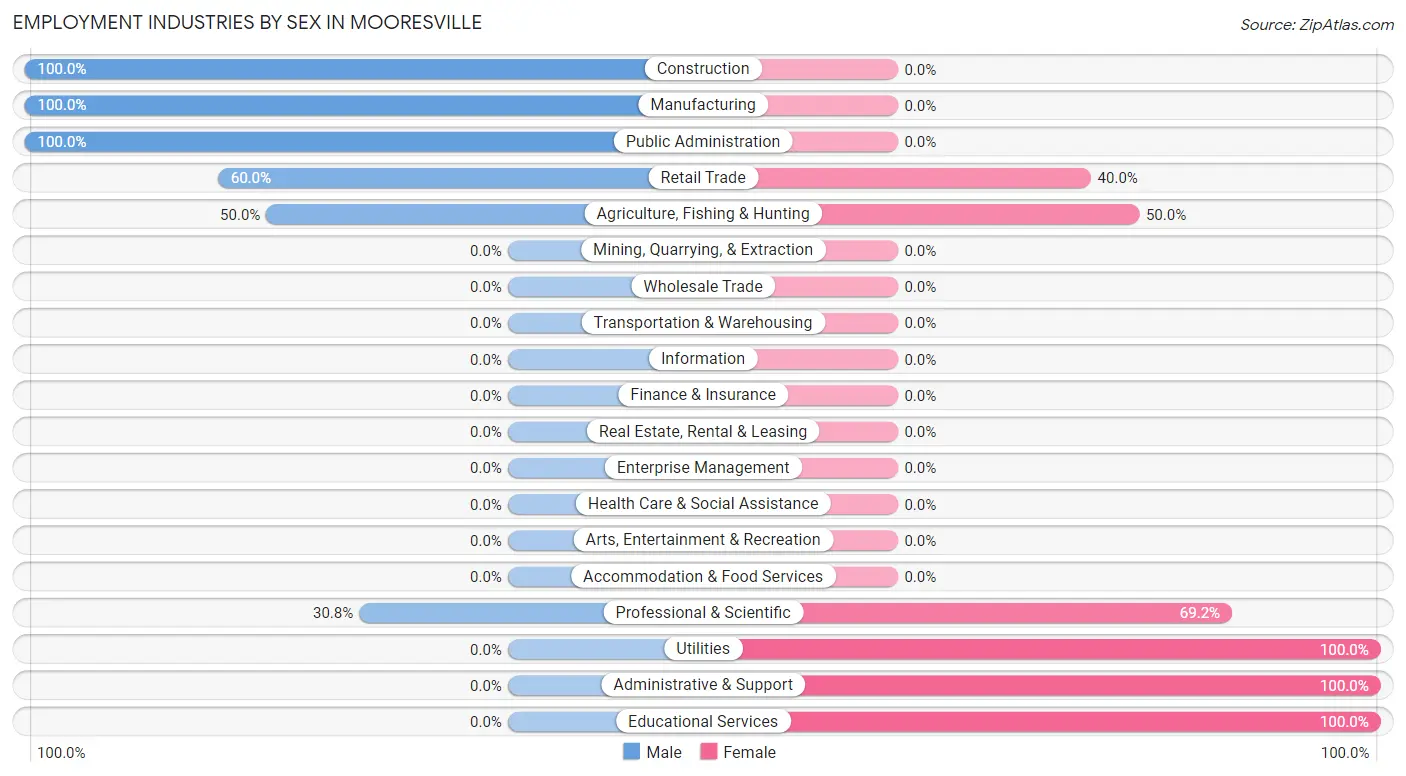
Employment Industries by Sex in Mooresville
The Mooresville industries that see more men than women are Construction (100.0%), Manufacturing (100.0%), and Public Administration (100.0%), whereas the industries that tend to have a higher number of women are Utilities (100.0%), Administrative & Support (100.0%), and Educational Services (100.0%).
| Industry | Male | Female |
| Agriculture, Fishing & Hunting | 3 (50.0%) | 3 (50.0%) |
| Mining, Quarrying, & Extraction | 0 (0.0%) | 0 (0.0%) |
| Construction | 4 (100.0%) | 0 (0.0%) |
| Manufacturing | 1 (100.0%) | 0 (0.0%) |
| Wholesale Trade | 0 (0.0%) | 0 (0.0%) |
| Retail Trade | 3 (60.0%) | 2 (40.0%) |
| Transportation & Warehousing | 0 (0.0%) | 0 (0.0%) |
| Utilities | 0 (0.0%) | 2 (100.0%) |
| Information | 0 (0.0%) | 0 (0.0%) |
| Finance & Insurance | 0 (0.0%) | 0 (0.0%) |
| Real Estate, Rental & Leasing | 0 (0.0%) | 0 (0.0%) |
| Professional & Scientific | 4 (30.8%) | 9 (69.2%) |
| Enterprise Management | 0 (0.0%) | 0 (0.0%) |
| Administrative & Support | 0 (0.0%) | 1 (100.0%) |
| Educational Services | 0 (0.0%) | 2 (100.0%) |
| Health Care & Social Assistance | 0 (0.0%) | 0 (0.0%) |
| Arts, Entertainment & Recreation | 0 (0.0%) | 0 (0.0%) |
| Accommodation & Food Services | 0 (0.0%) | 0 (0.0%) |
| Public Administration | 1 (100.0%) | 0 (0.0%) |
| Total | 16 (45.7%) | 19 (54.3%) |
Education in Mooresville
School Enrollment in Mooresville
The most common levels of schooling among the 16 students in Mooresville are high school (12 | 75.0%), elementary school (2 | 12.5%), and middle school (2 | 12.5%).
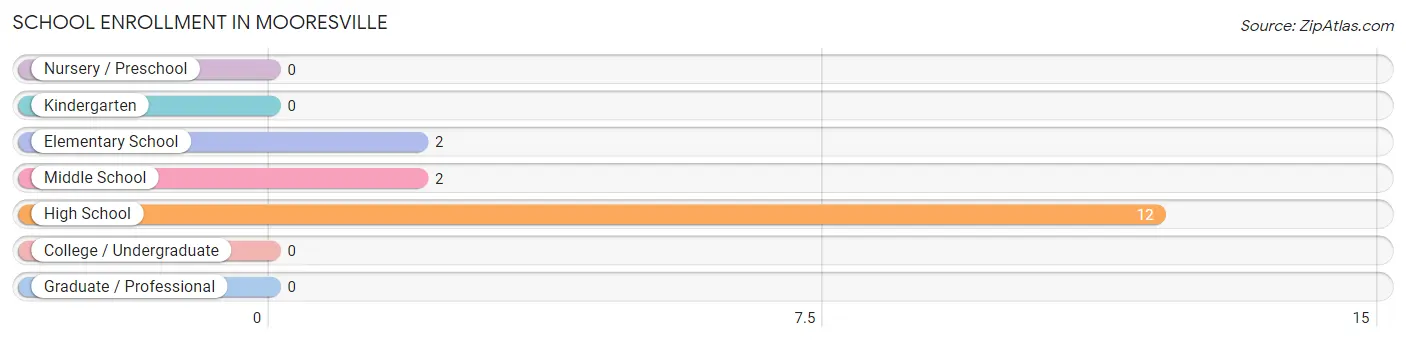
| School Level | # Students | % Students |
| Nursery / Preschool | 0 | 0.0% |
| Kindergarten | 0 | 0.0% |
| Elementary School | 2 | 12.5% |
| Middle School | 2 | 12.5% |
| High School | 12 | 75.0% |
| College / Undergraduate | 0 | 0.0% |
| Graduate / Professional | 0 | 0.0% |
| Total | 16 | 100.0% |
School Enrollment by Age by Funding Source in Mooresville
Out of a total of 16 students who are enrolled in schools in Mooresville, 14 (87.5%) attend a private institution, while the remaining 2 (12.5%) are enrolled in public schools. The age group of 5 to 9 year old has the highest likelihood of being enrolled in private schools, with 2 (100.0% in the age bracket) enrolled. Conversely, the age group of 10 to 14 year olds has the lowest likelihood of being enrolled in a private school, with 2 (100.0% in the age bracket) attending a public institution.
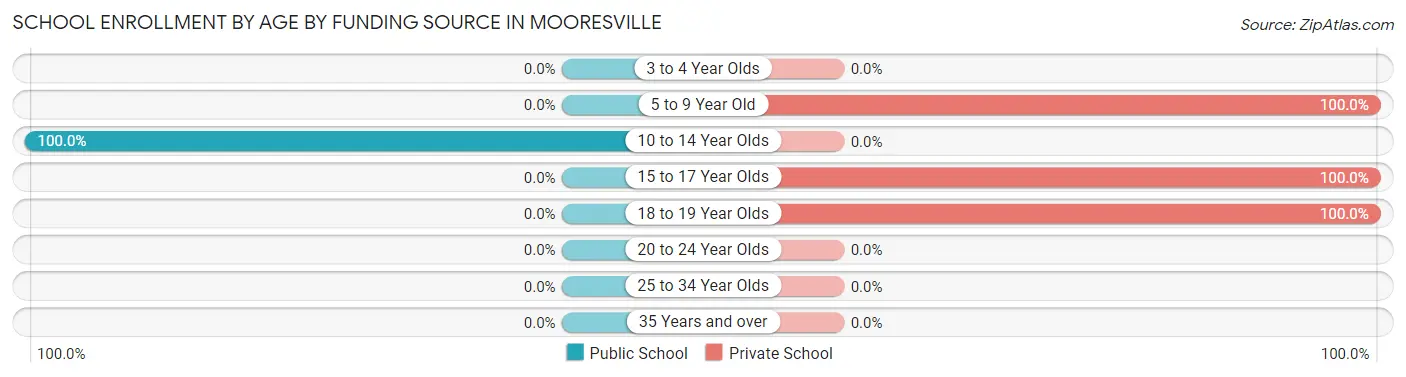
| Age Bracket | Public School | Private School |
| 3 to 4 Year Olds | 0 (0.0%) | 0 (0.0%) |
| 5 to 9 Year Old | 0 (0.0%) | 2 (100.0%) |
| 10 to 14 Year Olds | 2 (100.0%) | 0 (0.0%) |
| 15 to 17 Year Olds | 0 (0.0%) | 5 (100.0%) |
| 18 to 19 Year Olds | 0 (0.0%) | 7 (100.0%) |
| 20 to 24 Year Olds | 0 (0.0%) | 0 (0.0%) |
| 25 to 34 Year Olds | 0 (0.0%) | 0 (0.0%) |
| 35 Years and over | 0 (0.0%) | 0 (0.0%) |
| Total | 2 (12.5%) | 14 (87.5%) |
Educational Attainment by Field of Study in Mooresville
Business (21 | 38.2%), bio, nature & agricultural (6 | 10.9%), computers & mathematics (4 | 7.3%), engineering (4 | 7.3%), and science & technology (4 | 7.3%) are the most common fields of study among 55 individuals in Mooresville who have obtained a bachelor's degree or higher.
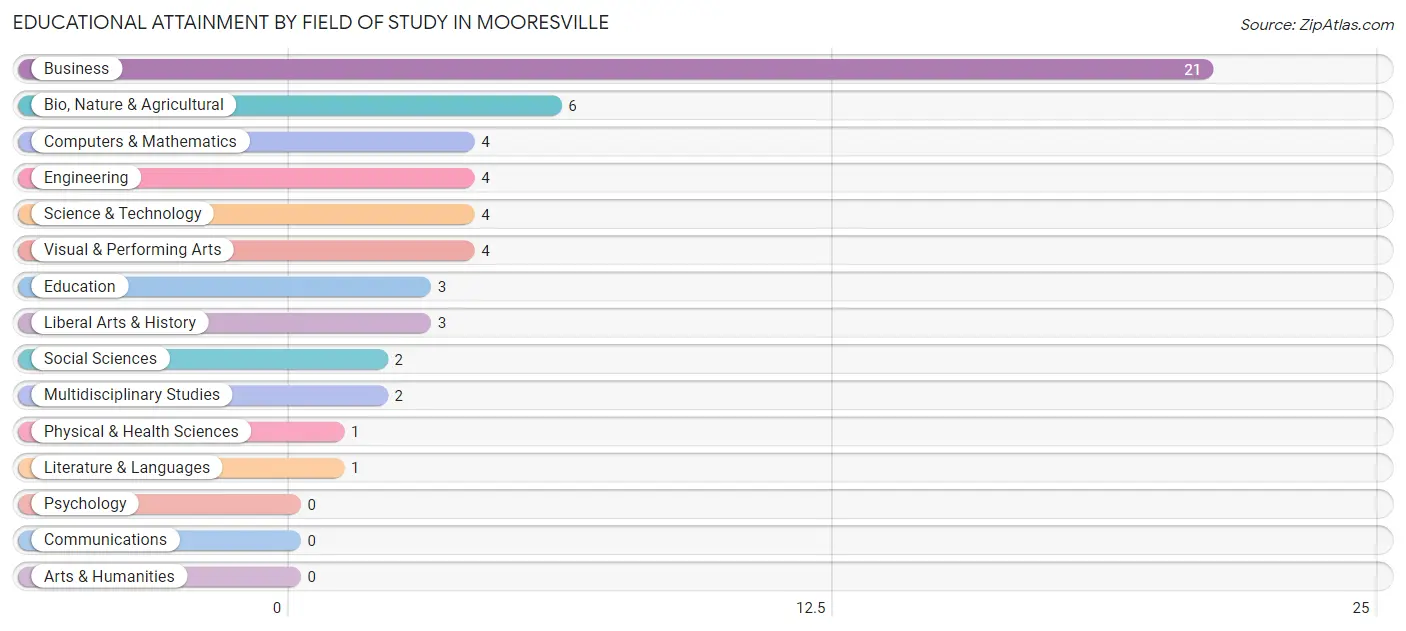
| Field of Study | # Graduates | % Graduates |
| Computers & Mathematics | 4 | 7.3% |
| Bio, Nature & Agricultural | 6 | 10.9% |
| Physical & Health Sciences | 1 | 1.8% |
| Psychology | 0 | 0.0% |
| Social Sciences | 2 | 3.6% |
| Engineering | 4 | 7.3% |
| Multidisciplinary Studies | 2 | 3.6% |
| Science & Technology | 4 | 7.3% |
| Business | 21 | 38.2% |
| Education | 3 | 5.4% |
| Literature & Languages | 1 | 1.8% |
| Liberal Arts & History | 3 | 5.4% |
| Visual & Performing Arts | 4 | 7.3% |
| Communications | 0 | 0.0% |
| Arts & Humanities | 0 | 0.0% |
| Total | 55 | 100.0% |
Transportation & Commute in Mooresville
Vehicle Availability by Sex in Mooresville
The most prevalent vehicle ownership categories in Mooresville are males with 3 vehicles (8, accounting for 50.0%) and females with 3 vehicles (7, making up 47.1%).
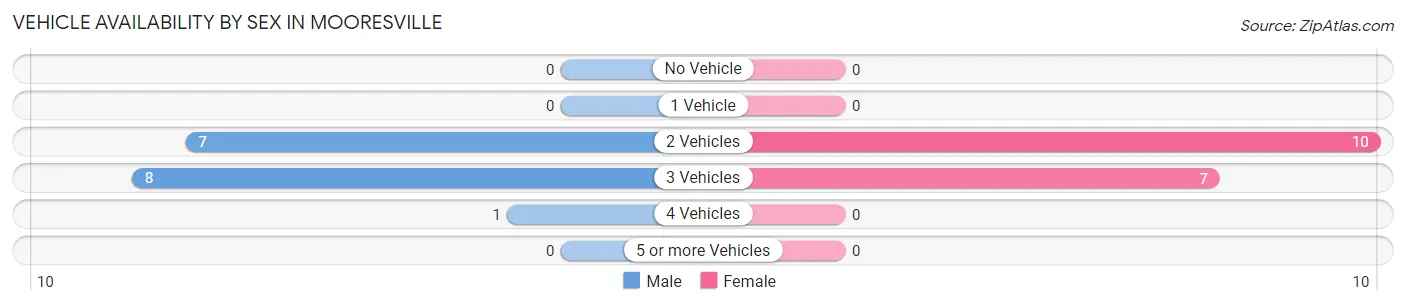
| Vehicles Available | Male | Female |
| No Vehicle | 0 (0.0%) | 0 (0.0%) |
| 1 Vehicle | 0 (0.0%) | 0 (0.0%) |
| 2 Vehicles | 7 (43.8%) | 10 (58.8%) |
| 3 Vehicles | 8 (50.0%) | 7 (41.2%) |
| 4 Vehicles | 1 (6.2%) | 0 (0.0%) |
| 5 or more Vehicles | 0 (0.0%) | 0 (0.0%) |
| Total | 16 (100.0%) | 17 (100.0%) |
Commute Time in Mooresville
The most frequently occuring commute durations in Mooresville are 20 to 24 minutes (10 commuters, 35.7%), less than 5 minutes (6 commuters, 21.4%), and 5 to 9 minutes (3 commuters, 10.7%).
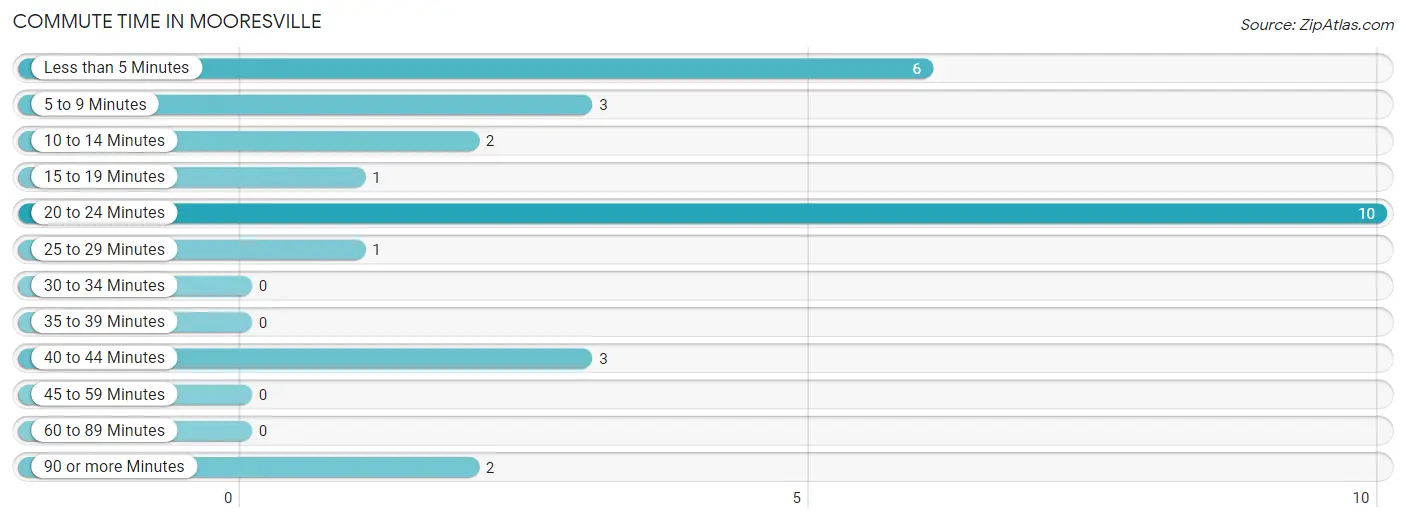
| Commute Time | # Commuters | % Commuters |
| Less than 5 Minutes | 6 | 21.4% |
| 5 to 9 Minutes | 3 | 10.7% |
| 10 to 14 Minutes | 2 | 7.1% |
| 15 to 19 Minutes | 1 | 3.6% |
| 20 to 24 Minutes | 10 | 35.7% |
| 25 to 29 Minutes | 1 | 3.6% |
| 30 to 34 Minutes | 0 | 0.0% |
| 35 to 39 Minutes | 0 | 0.0% |
| 40 to 44 Minutes | 3 | 10.7% |
| 45 to 59 Minutes | 0 | 0.0% |
| 60 to 89 Minutes | 0 | 0.0% |
| 90 or more Minutes | 2 | 7.1% |
Commute Time by Sex in Mooresville
The most common commute times in Mooresville are less than 5 minutes (6 commuters, 37.5%) for males and 20 to 24 minutes (7 commuters, 58.3%) for females.
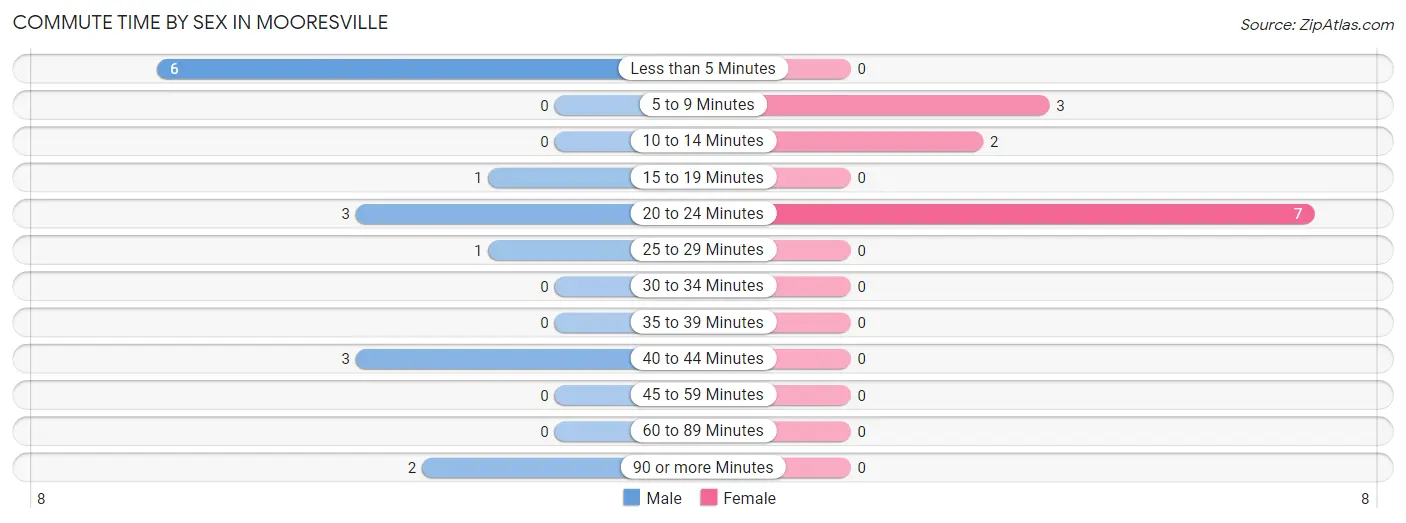
| Commute Time | Male | Female |
| Less than 5 Minutes | 6 (37.5%) | 0 (0.0%) |
| 5 to 9 Minutes | 0 (0.0%) | 3 (25.0%) |
| 10 to 14 Minutes | 0 (0.0%) | 2 (16.7%) |
| 15 to 19 Minutes | 1 (6.2%) | 0 (0.0%) |
| 20 to 24 Minutes | 3 (18.8%) | 7 (58.3%) |
| 25 to 29 Minutes | 1 (6.2%) | 0 (0.0%) |
| 30 to 34 Minutes | 0 (0.0%) | 0 (0.0%) |
| 35 to 39 Minutes | 0 (0.0%) | 0 (0.0%) |
| 40 to 44 Minutes | 3 (18.8%) | 0 (0.0%) |
| 45 to 59 Minutes | 0 (0.0%) | 0 (0.0%) |
| 60 to 89 Minutes | 0 (0.0%) | 0 (0.0%) |
| 90 or more Minutes | 2 (12.5%) | 0 (0.0%) |
Time of Departure to Work by Sex in Mooresville
The most frequent times of departure to work in Mooresville are 8:00 AM to 8:29 AM (7, 43.8%) for males and 7:30 AM to 7:59 AM (5, 41.7%) for females.
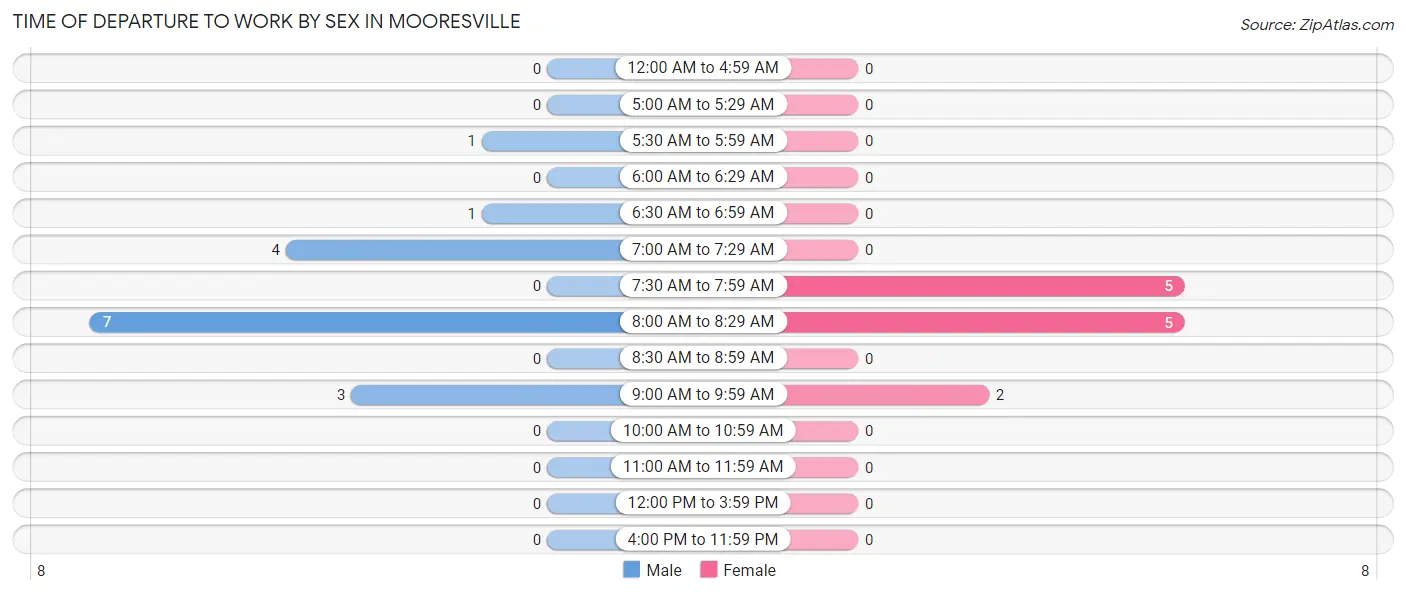
| Time of Departure | Male | Female |
| 12:00 AM to 4:59 AM | 0 (0.0%) | 0 (0.0%) |
| 5:00 AM to 5:29 AM | 0 (0.0%) | 0 (0.0%) |
| 5:30 AM to 5:59 AM | 1 (6.2%) | 0 (0.0%) |
| 6:00 AM to 6:29 AM | 0 (0.0%) | 0 (0.0%) |
| 6:30 AM to 6:59 AM | 1 (6.2%) | 0 (0.0%) |
| 7:00 AM to 7:29 AM | 4 (25.0%) | 0 (0.0%) |
| 7:30 AM to 7:59 AM | 0 (0.0%) | 5 (41.7%) |
| 8:00 AM to 8:29 AM | 7 (43.8%) | 5 (41.7%) |
| 8:30 AM to 8:59 AM | 0 (0.0%) | 0 (0.0%) |
| 9:00 AM to 9:59 AM | 3 (18.8%) | 2 (16.7%) |
| 10:00 AM to 10:59 AM | 0 (0.0%) | 0 (0.0%) |
| 11:00 AM to 11:59 AM | 0 (0.0%) | 0 (0.0%) |
| 12:00 PM to 3:59 PM | 0 (0.0%) | 0 (0.0%) |
| 4:00 PM to 11:59 PM | 0 (0.0%) | 0 (0.0%) |
| Total | 16 (100.0%) | 12 (100.0%) |
Housing Occupancy in Mooresville
Occupancy by Ownership in Mooresville
Of the total 36 dwellings in Mooresville, owner-occupied units account for 36 (100.0%), while renter-occupied units make up 0 (0.0%).
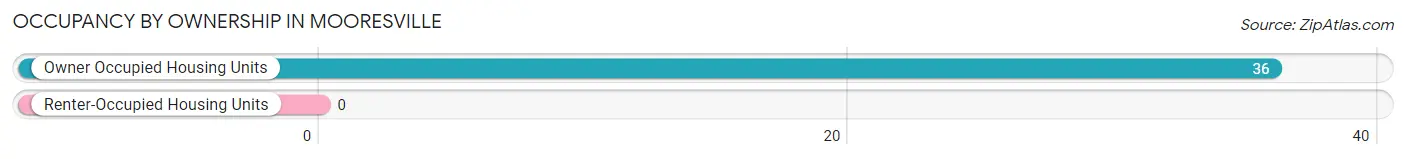
| Occupancy | # Housing Units | % Housing Units |
| Owner Occupied Housing Units | 36 | 100.0% |
| Renter-Occupied Housing Units | 0 | 0.0% |
| Total Occupied Housing Units | 36 | 100.0% |
Occupancy by Household Size in Mooresville
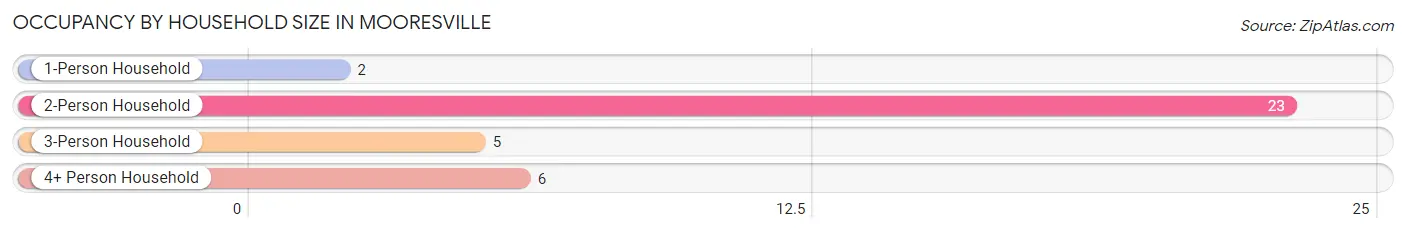
| Household Size | # Housing Units | % Housing Units |
| 1-Person Household | 2 | 5.6% |
| 2-Person Household | 23 | 63.9% |
| 3-Person Household | 5 | 13.9% |
| 4+ Person Household | 6 | 16.7% |
| Total Housing Units | 36 | 100.0% |
Occupancy by Ownership by Household Size in Mooresville
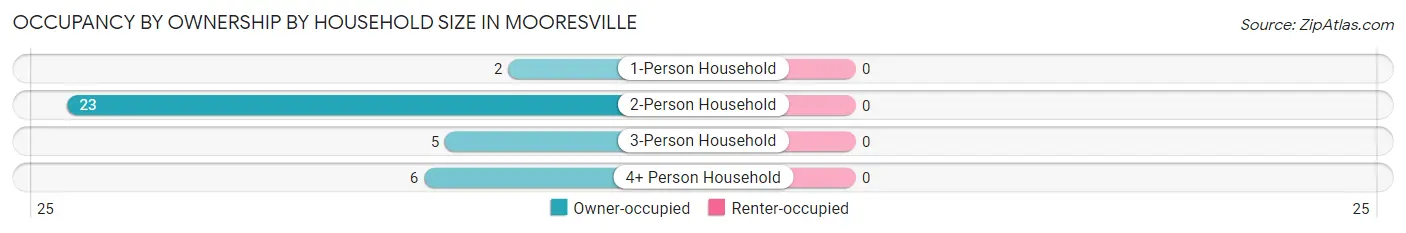
| Household Size | Owner-occupied | Renter-occupied |
| 1-Person Household | 2 (100.0%) | 0 (0.0%) |
| 2-Person Household | 23 (100.0%) | 0 (0.0%) |
| 3-Person Household | 5 (100.0%) | 0 (0.0%) |
| 4+ Person Household | 6 (100.0%) | 0 (0.0%) |
| Total Housing Units | 36 (100.0%) | 0 (0.0%) |
Occupancy by Educational Attainment in Mooresville
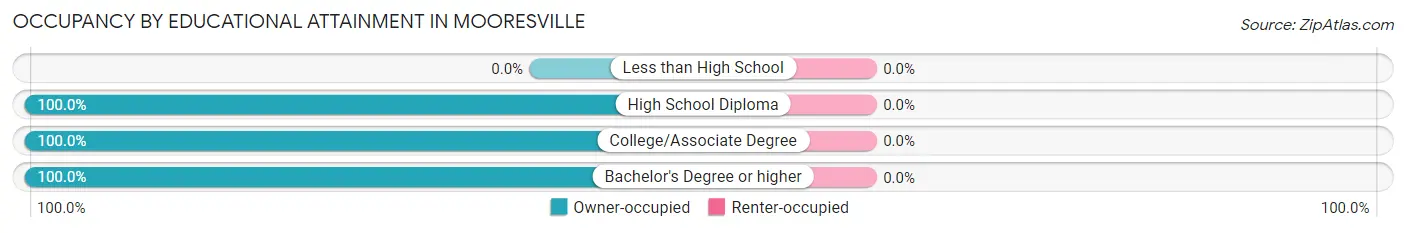
| Household Size | Owner-occupied | Renter-occupied |
| Less than High School | 0 (0.0%) | 0 (0.0%) |
| High School Diploma | 1 (100.0%) | 0 (0.0%) |
| College/Associate Degree | 1 (100.0%) | 0 (0.0%) |
| Bachelor's Degree or higher | 34 (100.0%) | 0 (0.0%) |
Occupancy by Age of Householder in Mooresville
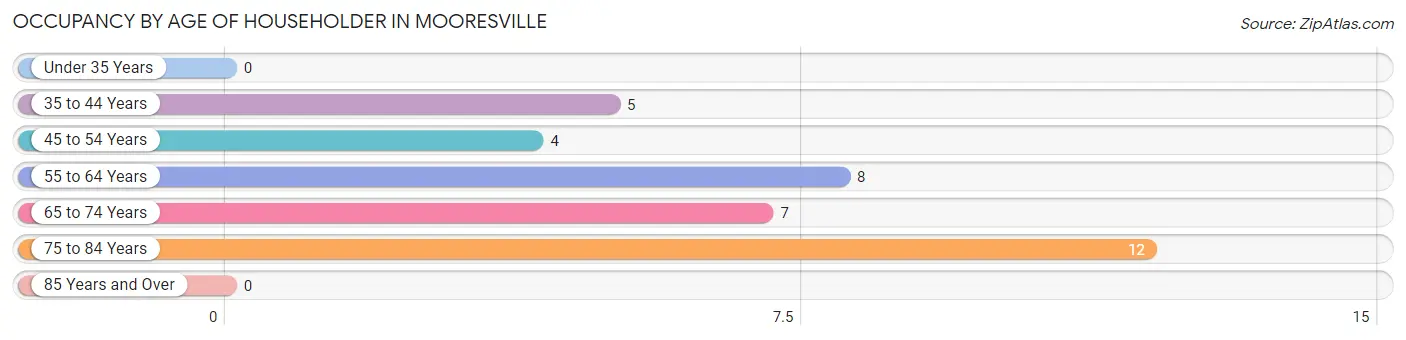
| Age Bracket | # Households | % Households |
| Under 35 Years | 0 | 0.0% |
| 35 to 44 Years | 5 | 13.9% |
| 45 to 54 Years | 4 | 11.1% |
| 55 to 64 Years | 8 | 22.2% |
| 65 to 74 Years | 7 | 19.4% |
| 75 to 84 Years | 12 | 33.3% |
| 85 Years and Over | 0 | 0.0% |
| Total | 36 | 100.0% |
Housing Finances in Mooresville
Median Income by Occupancy in Mooresville
| Occupancy Type | # Households | Median Income |
| Owner-Occupied | 36 (100.0%) | $0 |
| Renter-Occupied | 0 (0.0%) | $0 |
| Average | 36 (100.0%) | $0 |
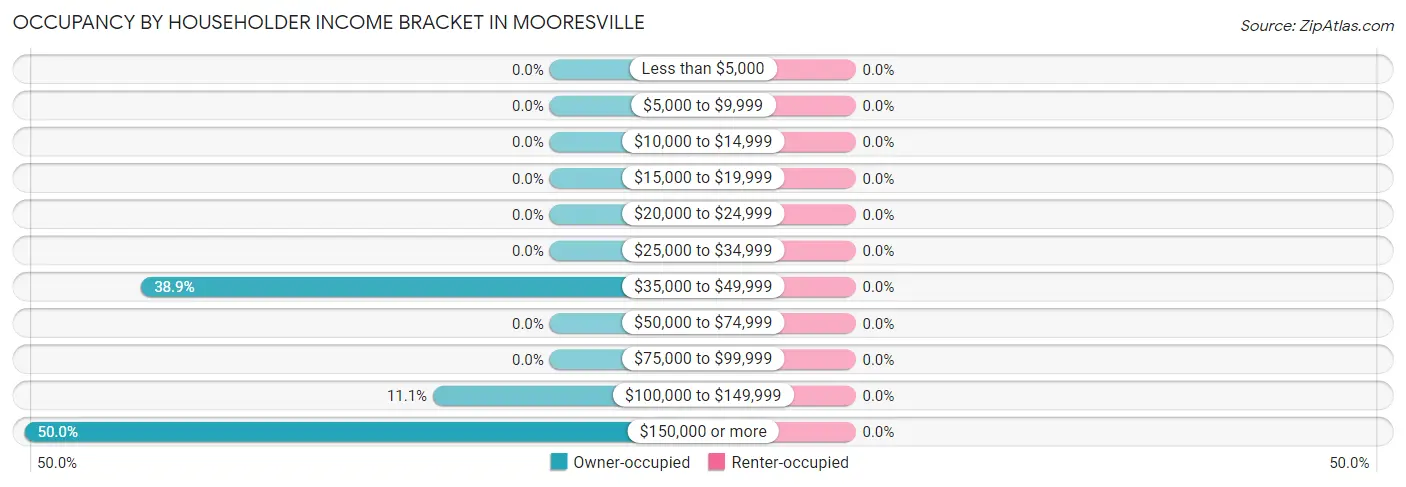
Occupancy by Householder Income Bracket in Mooresville
| Income Bracket | Owner-occupied | Renter-occupied |
| Less than $5,000 | 0 (0.0%) | 0 (0.0%) |
| $5,000 to $9,999 | 0 (0.0%) | 0 (0.0%) |
| $10,000 to $14,999 | 0 (0.0%) | 0 (0.0%) |
| $15,000 to $19,999 | 0 (0.0%) | 0 (0.0%) |
| $20,000 to $24,999 | 0 (0.0%) | 0 (0.0%) |
| $25,000 to $34,999 | 0 (0.0%) | 0 (0.0%) |
| $35,000 to $49,999 | 14 (38.9%) | 0 (0.0%) |
| $50,000 to $74,999 | 0 (0.0%) | 0 (0.0%) |
| $75,000 to $99,999 | 0 (0.0%) | 0 (0.0%) |
| $100,000 to $149,999 | 4 (11.1%) | 0 (0.0%) |
| $150,000 or more | 18 (50.0%) | 0 (0.0%) |
| Total | 36 (100.0%) | 0 (0.0%) |
Monthly Housing Cost Tiers in Mooresville
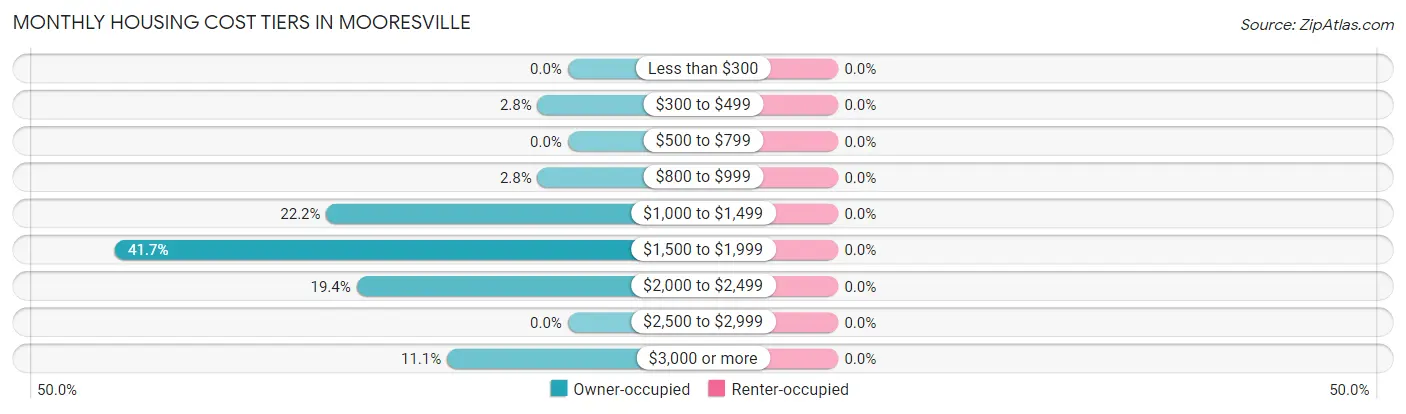
| Monthly Cost | Owner-occupied | Renter-occupied |
| Less than $300 | 0 (0.0%) | 0 (0.0%) |
| $300 to $499 | 1 (2.8%) | 0 (0.0%) |
| $500 to $799 | 0 (0.0%) | 0 (0.0%) |
| $800 to $999 | 1 (2.8%) | 0 (0.0%) |
| $1,000 to $1,499 | 8 (22.2%) | 0 (0.0%) |
| $1,500 to $1,999 | 15 (41.7%) | 0 (0.0%) |
| $2,000 to $2,499 | 7 (19.4%) | 0 (0.0%) |
| $2,500 to $2,999 | 0 (0.0%) | 0 (0.0%) |
| $3,000 or more | 4 (11.1%) | 0 (0.0%) |
| Total | 36 (100.0%) | 0 (0.0%) |
Physical Housing Characteristics in Mooresville
Housing Structures in Mooresville
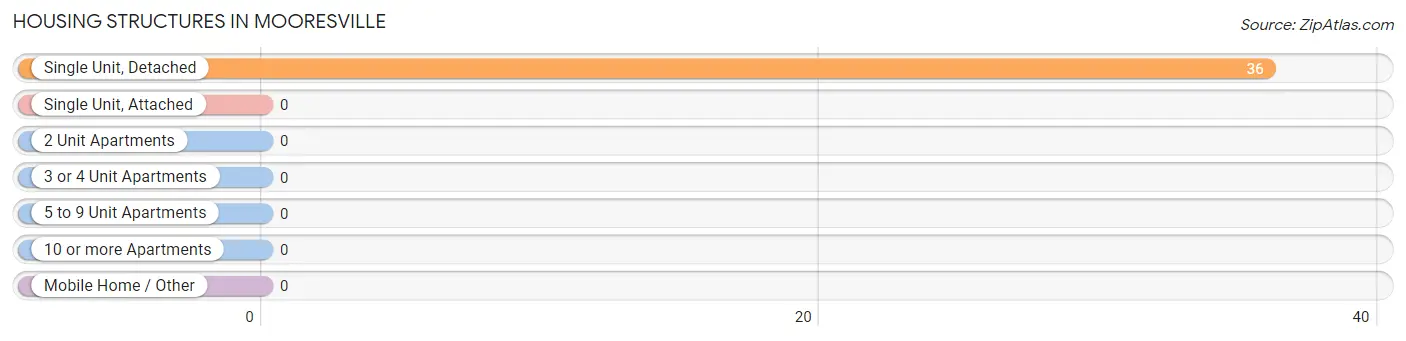
| Structure Type | # Housing Units | % Housing Units |
| Single Unit, Detached | 36 | 100.0% |
| Single Unit, Attached | 0 | 0.0% |
| 2 Unit Apartments | 0 | 0.0% |
| 3 or 4 Unit Apartments | 0 | 0.0% |
| 5 to 9 Unit Apartments | 0 | 0.0% |
| 10 or more Apartments | 0 | 0.0% |
| Mobile Home / Other | 0 | 0.0% |
| Total | 36 | 100.0% |
Housing Structures by Occupancy in Mooresville
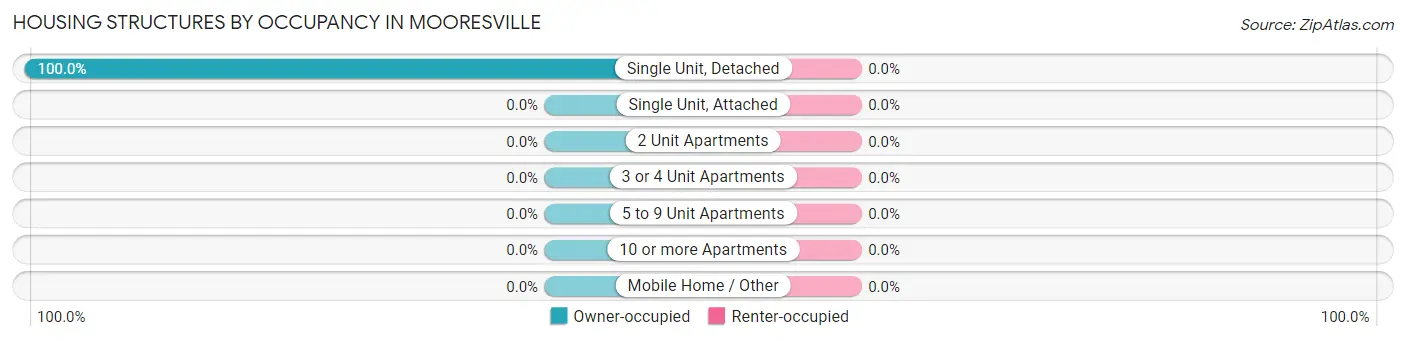
| Structure Type | Owner-occupied | Renter-occupied |
| Single Unit, Detached | 36 (100.0%) | 0 (0.0%) |
| Single Unit, Attached | 0 (0.0%) | 0 (0.0%) |
| 2 Unit Apartments | 0 (0.0%) | 0 (0.0%) |
| 3 or 4 Unit Apartments | 0 (0.0%) | 0 (0.0%) |
| 5 to 9 Unit Apartments | 0 (0.0%) | 0 (0.0%) |
| 10 or more Apartments | 0 (0.0%) | 0 (0.0%) |
| Mobile Home / Other | 0 (0.0%) | 0 (0.0%) |
| Total | 36 (100.0%) | 0 (0.0%) |
Housing Structures by Number of Rooms in Mooresville
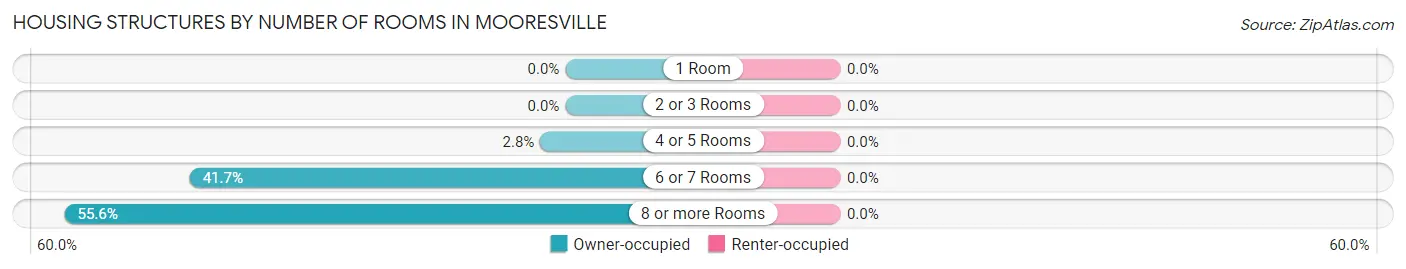
| Number of Rooms | Owner-occupied | Renter-occupied |
| 1 Room | 0 (0.0%) | 0 (0.0%) |
| 2 or 3 Rooms | 0 (0.0%) | 0 (0.0%) |
| 4 or 5 Rooms | 1 (2.8%) | 0 (0.0%) |
| 6 or 7 Rooms | 15 (41.7%) | 0 (0.0%) |
| 8 or more Rooms | 20 (55.6%) | 0 (0.0%) |
| Total | 36 (100.0%) | 0 (0.0%) |
Housing Structure by Heating Type in Mooresville
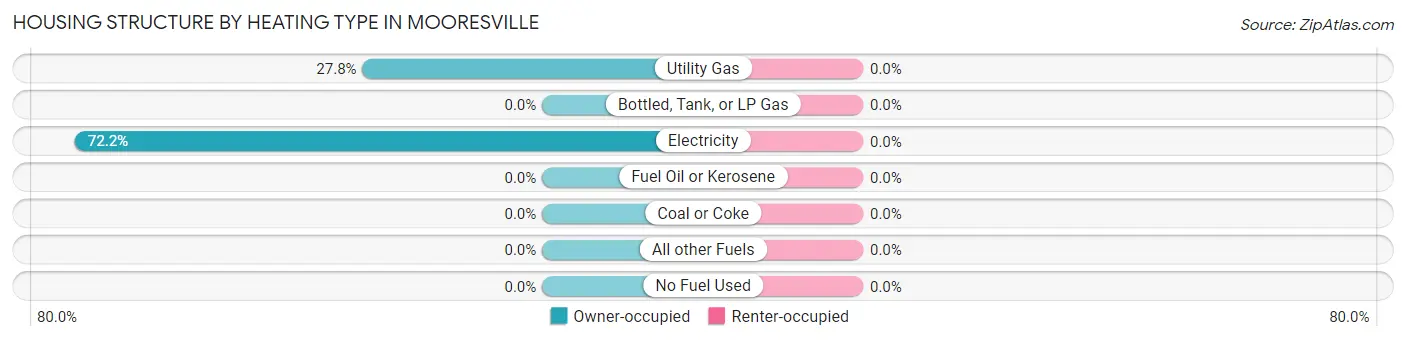
| Heating Type | Owner-occupied | Renter-occupied |
| Utility Gas | 10 (27.8%) | 0 (0.0%) |
| Bottled, Tank, or LP Gas | 0 (0.0%) | 0 (0.0%) |
| Electricity | 26 (72.2%) | 0 (0.0%) |
| Fuel Oil or Kerosene | 0 (0.0%) | 0 (0.0%) |
| Coal or Coke | 0 (0.0%) | 0 (0.0%) |
| All other Fuels | 0 (0.0%) | 0 (0.0%) |
| No Fuel Used | 0 (0.0%) | 0 (0.0%) |
| Total | 36 (100.0%) | 0 (0.0%) |
Household Vehicle Usage in Mooresville
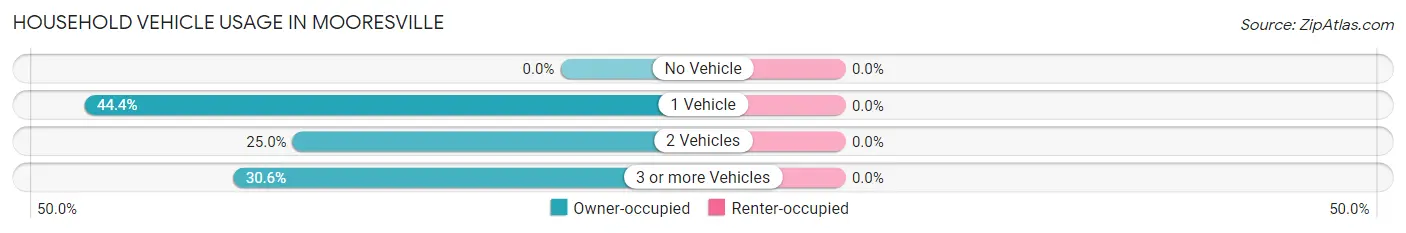
| Vehicles per Household | Owner-occupied | Renter-occupied |
| No Vehicle | 0 (0.0%) | 0 (0.0%) |
| 1 Vehicle | 16 (44.4%) | 0 (0.0%) |
| 2 Vehicles | 9 (25.0%) | 0 (0.0%) |
| 3 or more Vehicles | 11 (30.6%) | 0 (0.0%) |
| Total | 36 (100.0%) | 0 (0.0%) |
Real Estate & Mortgages in Mooresville
Real Estate and Mortgage Overview in Mooresville
| Characteristic | Without Mortgage | With Mortgage |
| Housing Units | 3 | 33 |
| Median Property Value | - | - |
| Median Household Income | $250,001 | $16 |
| Monthly Housing Costs | - | - |
| Real Estate Taxes | - | - |
Property Value by Mortgage Status in Mooresville
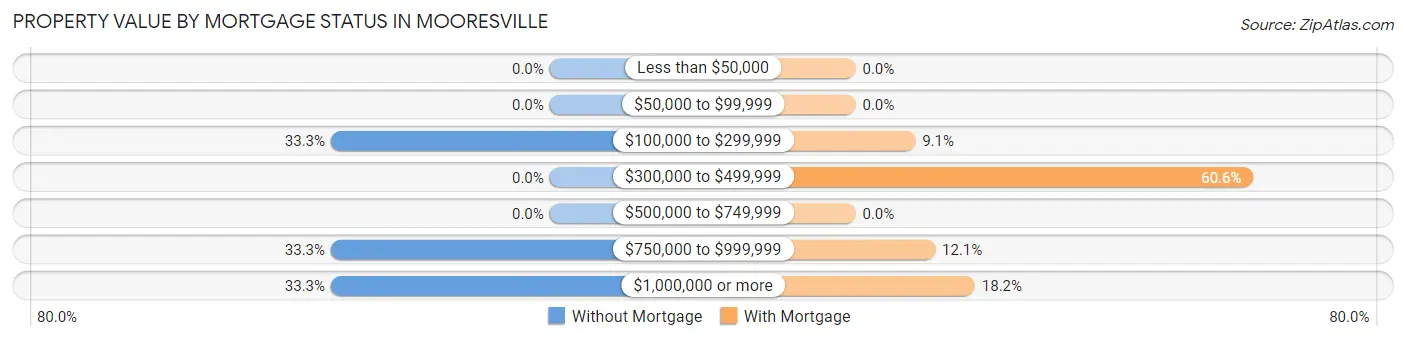
| Property Value | Without Mortgage | With Mortgage |
| Less than $50,000 | 0 (0.0%) | 0 (0.0%) |
| $50,000 to $99,999 | 0 (0.0%) | 0 (0.0%) |
| $100,000 to $299,999 | 1 (33.3%) | 3 (9.1%) |
| $300,000 to $499,999 | 0 (0.0%) | 20 (60.6%) |
| $500,000 to $749,999 | 0 (0.0%) | 0 (0.0%) |
| $750,000 to $999,999 | 1 (33.3%) | 4 (12.1%) |
| $1,000,000 or more | 1 (33.3%) | 6 (18.2%) |
| Total | 3 (100.0%) | 33 (100.0%) |
Household Income by Mortgage Status in Mooresville
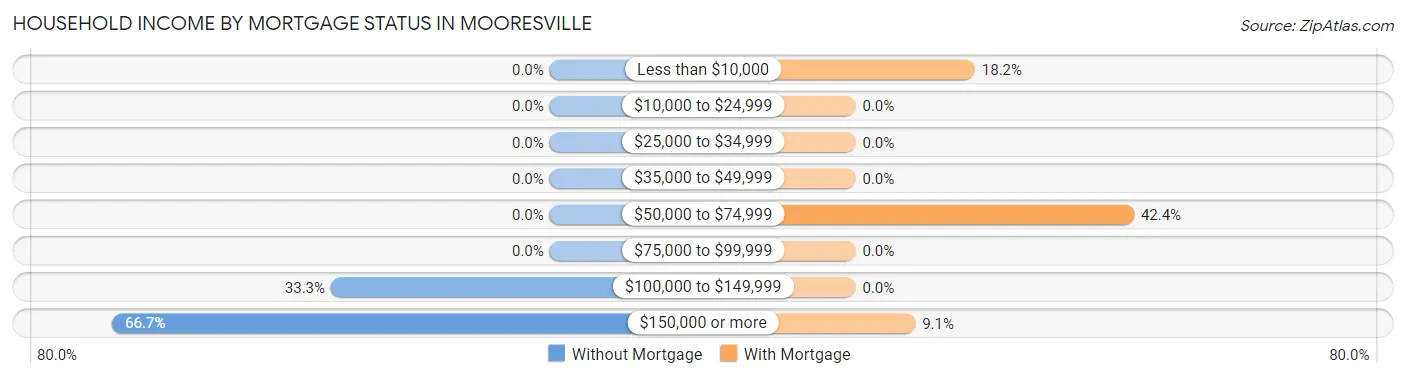
| Household Income | Without Mortgage | With Mortgage |
| Less than $10,000 | 0 (0.0%) | 6 (18.2%) |
| $10,000 to $24,999 | 0 (0.0%) | 0 (0.0%) |
| $25,000 to $34,999 | 0 (0.0%) | 0 (0.0%) |
| $35,000 to $49,999 | 0 (0.0%) | 0 (0.0%) |
| $50,000 to $74,999 | 0 (0.0%) | 14 (42.4%) |
| $75,000 to $99,999 | 0 (0.0%) | 0 (0.0%) |
| $100,000 to $149,999 | 1 (33.3%) | 0 (0.0%) |
| $150,000 or more | 2 (66.7%) | 3 (9.1%) |
| Total | 3 (100.0%) | 33 (100.0%) |
Property Value to Household Income Ratio in Mooresville
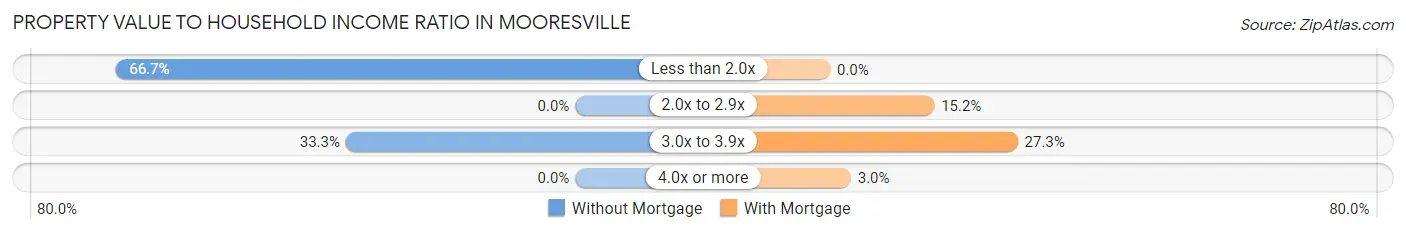
| Value-to-Income Ratio | Without Mortgage | With Mortgage |
| Less than 2.0x | 2 (66.7%) | 0 (0.0%) |
| 2.0x to 2.9x | 0 (0.0%) | 5 (15.1%) |
| 3.0x to 3.9x | 1 (33.3%) | 9 (27.3%) |
| 4.0x or more | 0 (0.0%) | 1 (3.0%) |
| Total | 3 (100.0%) | 33 (100.0%) |
Real Estate Taxes by Mortgage Status in Mooresville
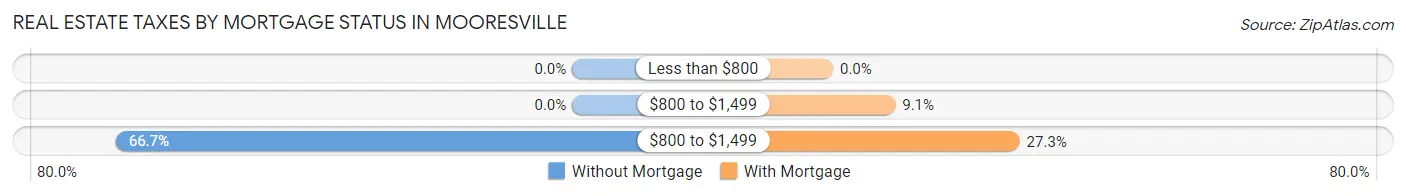
| Property Taxes | Without Mortgage | With Mortgage |
| Less than $800 | 0 (0.0%) | 0 (0.0%) |
| $800 to $1,499 | 0 (0.0%) | 3 (9.1%) |
| $800 to $1,499 | 2 (66.7%) | 9 (27.3%) |
| Total | 3 (100.0%) | 33 (100.0%) |
Health & Disability in Mooresville
Health Insurance Coverage by Age in Mooresville
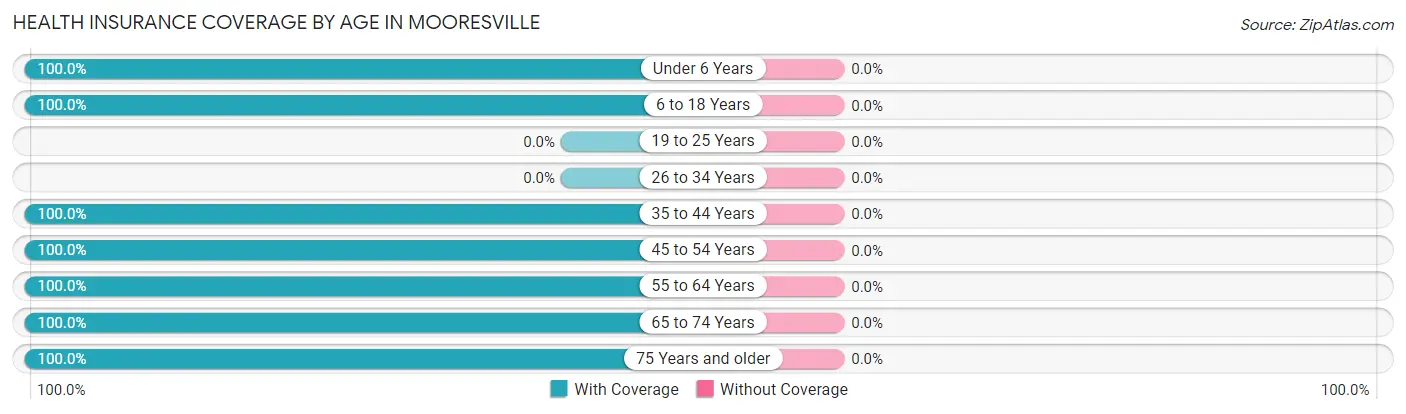
| Age Bracket | With Coverage | Without Coverage |
| Under 6 Years | 3 (100.0%) | 0 (0.0%) |
| 6 to 18 Years | 16 (100.0%) | 0 (0.0%) |
| 19 to 25 Years | 0 (0.0%) | 0 (0.0%) |
| 26 to 34 Years | 0 (0.0%) | 0 (0.0%) |
| 35 to 44 Years | 10 (100.0%) | 0 (0.0%) |
| 45 to 54 Years | 13 (100.0%) | 0 (0.0%) |
| 55 to 64 Years | 30 (100.0%) | 0 (0.0%) |
| 65 to 74 Years | 7 (100.0%) | 0 (0.0%) |
| 75 Years and older | 14 (100.0%) | 0 (0.0%) |
| Total | 93 (100.0%) | 0 (0.0%) |
Health Insurance Coverage by Citizenship Status in Mooresville
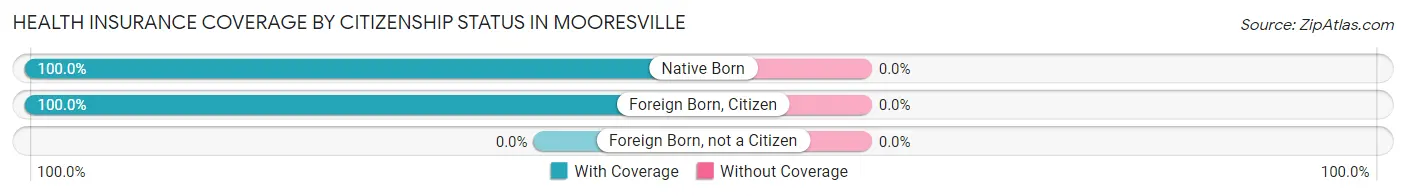
| Citizenship Status | With Coverage | Without Coverage |
| Native Born | 3 (100.0%) | 0 (0.0%) |
| Foreign Born, Citizen | 16 (100.0%) | 0 (0.0%) |
| Foreign Born, not a Citizen | 0 (0.0%) | 0 (0.0%) |
Health Insurance Coverage by Household Income in Mooresville
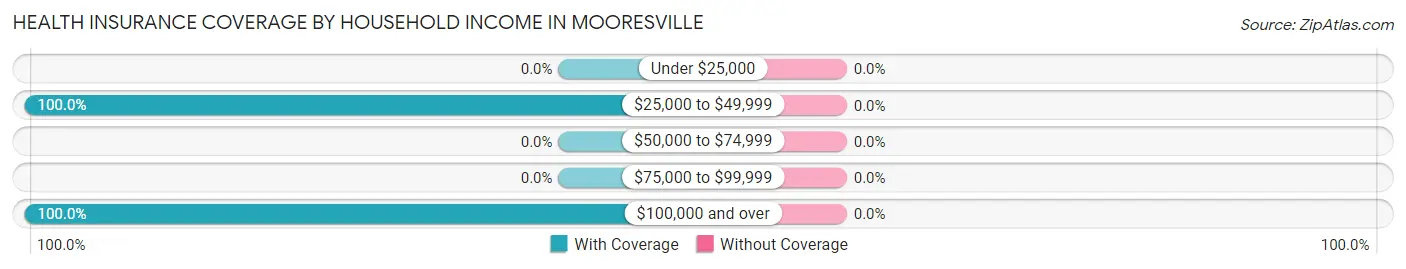
| Household Income | With Coverage | Without Coverage |
| Under $25,000 | 0 (0.0%) | 0 (0.0%) |
| $25,000 to $49,999 | 33 (100.0%) | 0 (0.0%) |
| $50,000 to $74,999 | 0 (0.0%) | 0 (0.0%) |
| $75,000 to $99,999 | 0 (0.0%) | 0 (0.0%) |
| $100,000 and over | 60 (100.0%) | 0 (0.0%) |
Public vs Private Health Insurance Coverage by Age in Mooresville
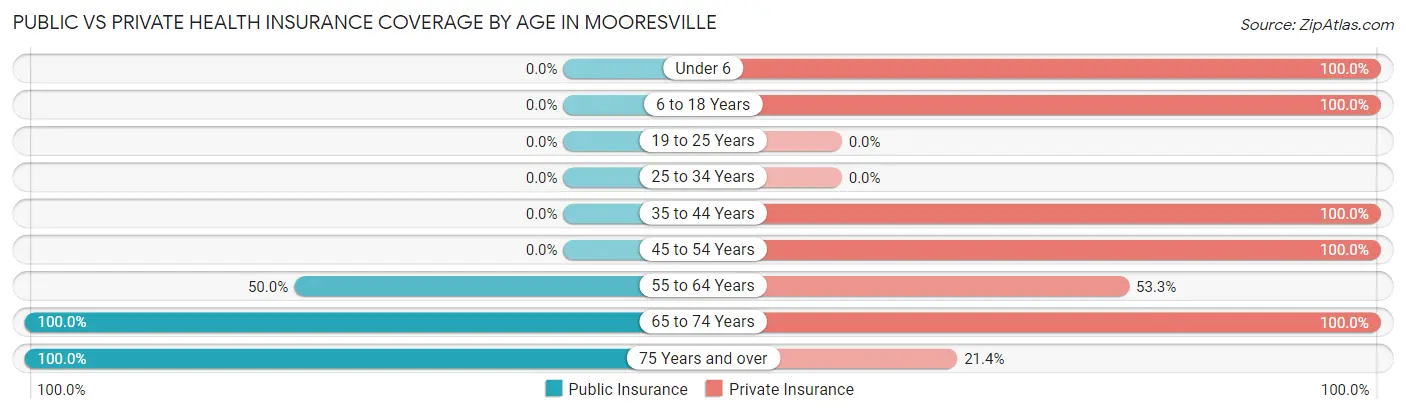
| Age Bracket | Public Insurance | Private Insurance |
| Under 6 | 0 (0.0%) | 3 (100.0%) |
| 6 to 18 Years | 0 (0.0%) | 16 (100.0%) |
| 19 to 25 Years | 0 (0.0%) | 0 (0.0%) |
| 25 to 34 Years | 0 (0.0%) | 0 (0.0%) |
| 35 to 44 Years | 0 (0.0%) | 10 (100.0%) |
| 45 to 54 Years | 0 (0.0%) | 13 (100.0%) |
| 55 to 64 Years | 15 (50.0%) | 16 (53.3%) |
| 65 to 74 Years | 7 (100.0%) | 7 (100.0%) |
| 75 Years and over | 14 (100.0%) | 3 (21.4%) |
| Total | 36 (38.7%) | 68 (73.1%) |
Disability Status by Sex by Age in Mooresville
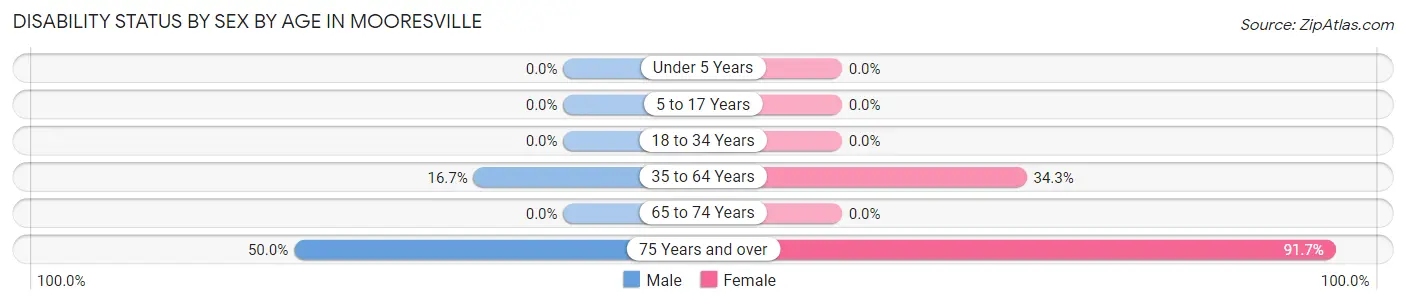
| Age Bracket | Male | Female |
| Under 5 Years | 0 (0.0%) | 0 (0.0%) |
| 5 to 17 Years | 0 (0.0%) | 0 (0.0%) |
| 18 to 34 Years | 0 (0.0%) | 0 (0.0%) |
| 35 to 64 Years | 3 (16.7%) | 12 (34.3%) |
| 65 to 74 Years | 0 (0.0%) | 0 (0.0%) |
| 75 Years and over | 1 (50.0%) | 11 (91.7%) |
Disability Class by Sex by Age in Mooresville
Disability Class: Hearing Difficulty
| Age Bracket | Male | Female |
| Under 5 Years | 0 (0.0%) | 0 (0.0%) |
| 5 to 17 Years | 0 (0.0%) | 0 (0.0%) |
| 18 to 34 Years | 0 (0.0%) | 0 (0.0%) |
| 35 to 64 Years | 0 (0.0%) | 0 (0.0%) |
| 65 to 74 Years | 0 (0.0%) | 0 (0.0%) |
| 75 Years and over | 0 (0.0%) | 0 (0.0%) |
Disability Class: Vision Difficulty
| Age Bracket | Male | Female |
| Under 5 Years | 0 (0.0%) | 0 (0.0%) |
| 5 to 17 Years | 0 (0.0%) | 0 (0.0%) |
| 18 to 34 Years | 0 (0.0%) | 0 (0.0%) |
| 35 to 64 Years | 0 (0.0%) | 0 (0.0%) |
| 65 to 74 Years | 0 (0.0%) | 0 (0.0%) |
| 75 Years and over | 0 (0.0%) | 0 (0.0%) |
Disability Class: Cognitive Difficulty
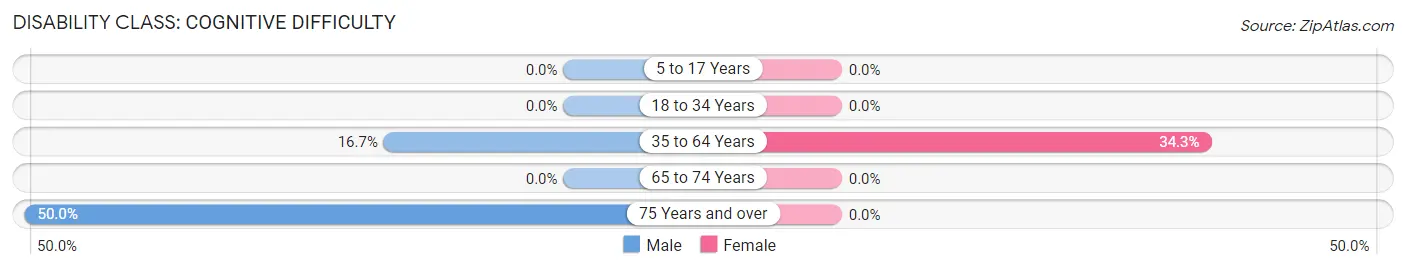
| Age Bracket | Male | Female |
| 5 to 17 Years | 0 (0.0%) | 0 (0.0%) |
| 18 to 34 Years | 0 (0.0%) | 0 (0.0%) |
| 35 to 64 Years | 3 (16.7%) | 12 (34.3%) |
| 65 to 74 Years | 0 (0.0%) | 0 (0.0%) |
| 75 Years and over | 1 (50.0%) | 0 (0.0%) |
Disability Class: Ambulatory Difficulty
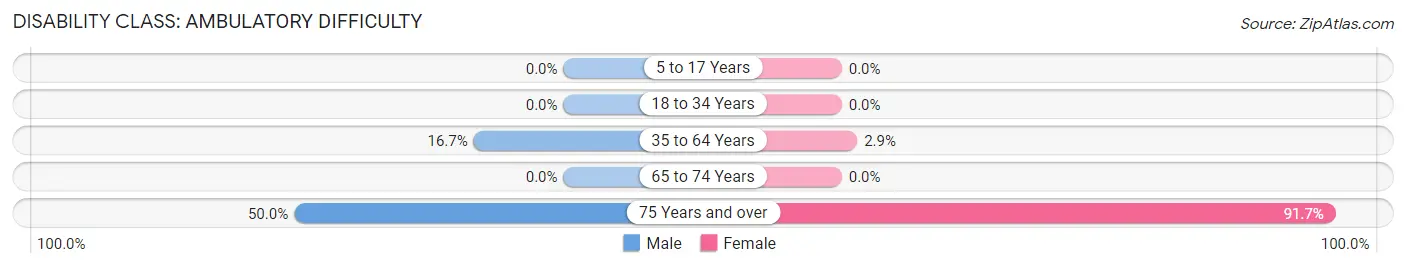
| Age Bracket | Male | Female |
| 5 to 17 Years | 0 (0.0%) | 0 (0.0%) |
| 18 to 34 Years | 0 (0.0%) | 0 (0.0%) |
| 35 to 64 Years | 3 (16.7%) | 1 (2.9%) |
| 65 to 74 Years | 0 (0.0%) | 0 (0.0%) |
| 75 Years and over | 1 (50.0%) | 11 (91.7%) |
Disability Class: Self-Care Difficulty
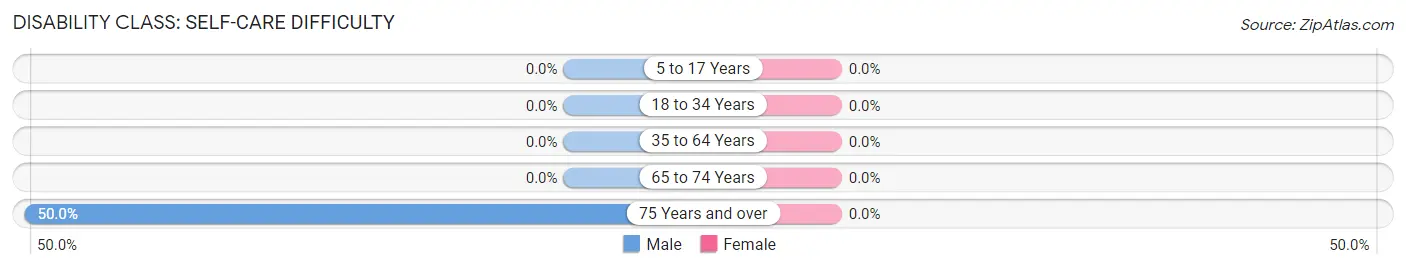
| Age Bracket | Male | Female |
| 5 to 17 Years | 0 (0.0%) | 0 (0.0%) |
| 18 to 34 Years | 0 (0.0%) | 0 (0.0%) |
| 35 to 64 Years | 0 (0.0%) | 0 (0.0%) |
| 65 to 74 Years | 0 (0.0%) | 0 (0.0%) |
| 75 Years and over | 1 (50.0%) | 0 (0.0%) |
Technology Access in Mooresville
Computing Device Access in Mooresville

| Device Type | # Households | % Households |
| Desktop or Laptop | 35 | 97.2% |
| Smartphone | 34 | 94.4% |
| Tablet | 36 | 100.0% |
| No Computing Device | 0 | 0.0% |
| Total | 36 | 100.0% |
Internet Access in Mooresville
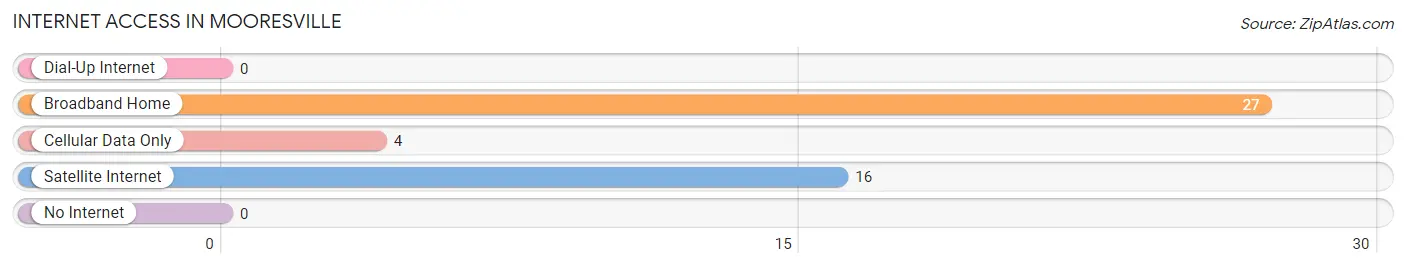
| Internet Type | # Households | % Households |
| Dial-Up Internet | 0 | 0.0% |
| Broadband Home | 27 | 75.0% |
| Cellular Data Only | 4 | 11.1% |
| Satellite Internet | 16 | 44.4% |
| No Internet | 0 | 0.0% |
| Total | 36 | 100.0% |
Mooresville Summary
Mooresville, Alabama is a small town located in Limestone County, Alabama. It is situated on the banks of the Tennessee River, about 20 miles north of Huntsville. The town was founded in 1818 and is the oldest town in Limestone County. The population of Mooresville was 1,845 at the 2010 census.
History
Mooresville was founded in 1818 by William Moore, a Revolutionary War veteran. He purchased the land from the Chickasaw Indians and named the town after himself. The town was incorporated in 1821 and was the first town in Limestone County.
In the early days, Mooresville was a bustling river port. It was a major stop on the Tennessee River for steamboats and barges. The town was also a major trading center for cotton, tobacco, and other goods.
In the late 1800s, Mooresville was a major railroad hub. The town was served by the Nashville, Chattanooga, and St. Louis Railway, the Louisville and Nashville Railroad, and the Alabama Great Southern Railroad.
Geography
Mooresville is located in Limestone County, Alabama. It is situated on the banks of the Tennessee River, about 20 miles north of Huntsville. The town is located at 34°45'N 86°45'W.
The town has a total area of 1.2 square miles, all of which is land. The terrain is mostly flat with some rolling hills. The climate is humid subtropical, with hot summers and mild winters.
Economy
The economy of Mooresville is largely based on agriculture. The town is home to several farms, including cattle, poultry, and vegetable farms. The town is also home to several small businesses, including restaurants, retail stores, and service providers.
The town is also home to several manufacturing companies, including a furniture factory, a plastics factory, and a paper mill. The town is also home to several government offices, including the Limestone County Courthouse and the Limestone County Sheriff's Office.
Demographics
As of the 2010 census, the population of Mooresville was 1,845. The racial makeup of the town was 95.3% White, 2.2% African American, 0.3% Native American, 0.2% Asian, 0.1% Pacific Islander, 0.7% from other races, and 1.2% from two or more races. Hispanic or Latino of any race were 1.7% of the population.
The median income for a household in Mooresville was $37,500, and the median income for a family was $45,000. The per capita income for the town was $19,000. About 11.2% of families and 14.2% of the population were below the poverty line, including 18.2% of those under age 18 and 8.3% of those age 65 or over.
Common Questions
What is Per Capita Income in Mooresville?
Per Capita income in Mooresville is $80,180.
What is Income or Wage Gap in Mooresville?
Income or Wage Gap in Mooresville is 0.8%.
Women in Mooresville earn 99.2 cents for every dollar earned by a man.
What is Inequality or Gini Index in Mooresville?
Inequality or Gini Index in Mooresville is 0.49.
What is the Total Population of Mooresville?
Total Population of Mooresville is 93.
What is the Total Male Population of Mooresville?
Total Male Population of Mooresville is 30.
What is the Total Female Population of Mooresville?
Total Female Population of Mooresville is 63.
What is the Ratio of Males per 100 Females in Mooresville?
There are 47.62 Males per 100 Females in Mooresville.
What is the Ratio of Females per 100 Males in Mooresville?
There are 210.00 Females per 100 Males in Mooresville.
What is the Median Population Age in Mooresville?
Median Population Age in Mooresville is 56.3 Years.
What is the Average Family Size in Mooresville
Average Family Size in Mooresville is 2.7 People.
What is the Average Household Size in Mooresville
Average Household Size in Mooresville is 2.6 People.
How Large is the Labor Force in Mooresville?
There are 35 People in the Labor Forcein in Mooresville.
What is the Percentage of People in the Labor Force in Mooresville?
43.2% of People are in the Labor Force in Mooresville.