Cities with the Highest Percentage of Owner-Occupied Units in Alabama
RELATED REPORTS & OPTIONS
Highest Owner-Occupied
Alabama
Compare Cities
Map of Cities with the Highest Percentage of Owner-Occupied Units in Alabama
0.0%
100.0%
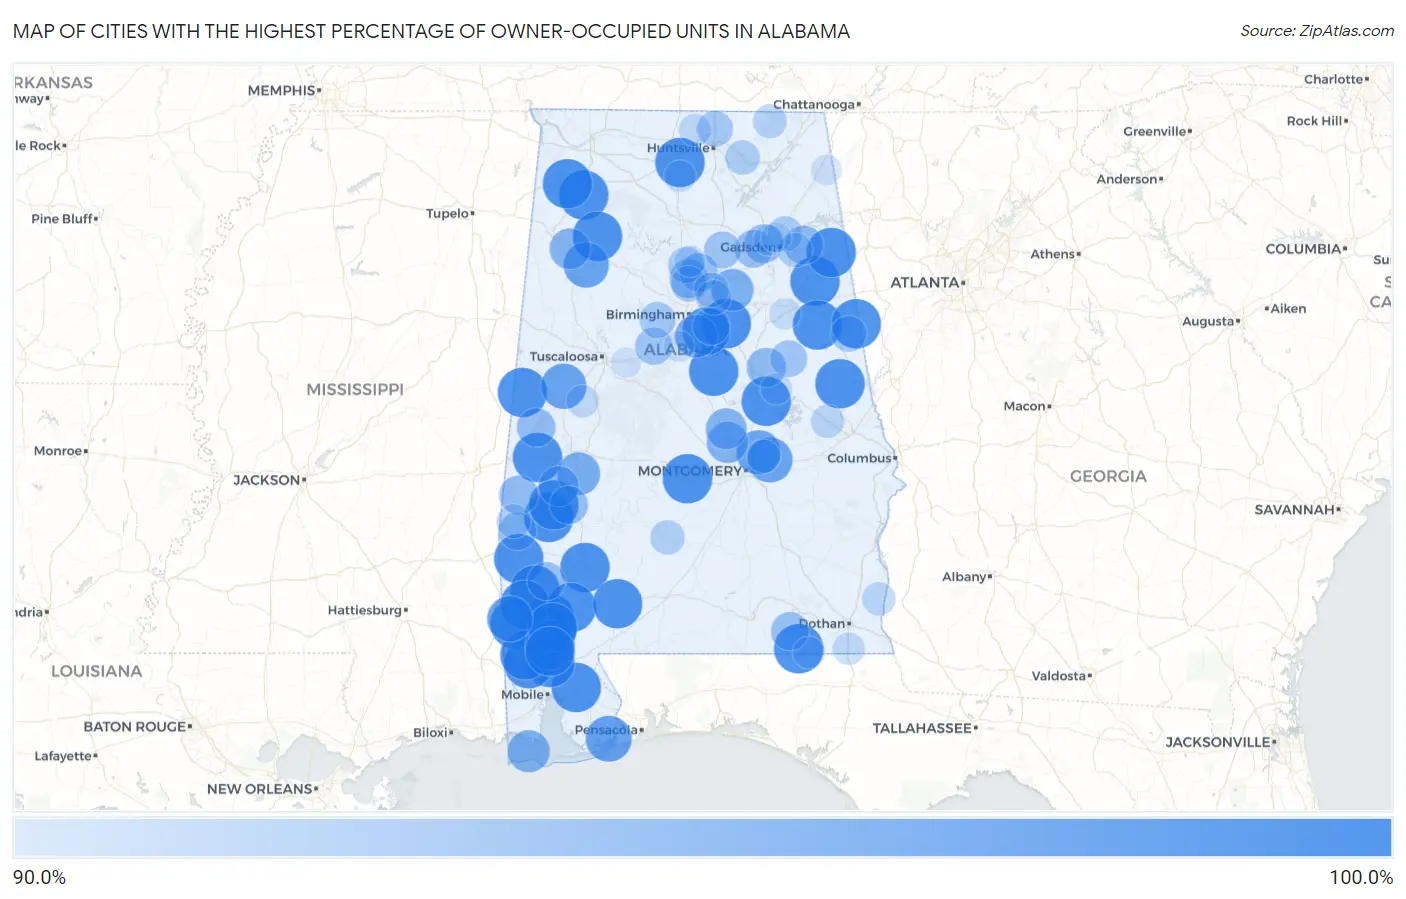
Cities with the Highest Percentage of Owner-Occupied Units in Alabama
| City | % Owner-Occupied | vs State | vs National | |
| 1. | Stapleton | 100.0% | 69.7% (+30.3)#1 | 64.8% (+35.2)#13 |
| 2. | White Plains | 100.0% | 69.7% (+30.3)#2 | 64.8% (+35.2)#130 |
| 3. | Shelby | 100.0% | 69.7% (+30.3)#3 | 64.8% (+35.2)#135 |
| 4. | Sterrett | 100.0% | 69.7% (+30.3)#4 | 64.8% (+35.2)#150 |
| 5. | Abanda | 100.0% | 69.7% (+30.3)#5 | 64.8% (+35.2)#420 |
| 6. | Mcintosh | 100.0% | 69.7% (+30.3)#6 | 64.8% (+35.2)#454 |
| 7. | Axis | 100.0% | 69.7% (+30.3)#7 | 64.8% (+35.2)#525 |
| 8. | Cullomburg | 100.0% | 69.7% (+30.3)#8 | 64.8% (+35.2)#597 |
| 9. | Whatley | 100.0% | 69.7% (+30.3)#9 | 64.8% (+35.2)#668 |
| 10. | Fairford | 100.0% | 69.7% (+30.3)#10 | 64.8% (+35.2)#756 |
| 11. | Chunchula | 100.0% | 69.7% (+30.3)#11 | 64.8% (+35.2)#903 |
| 12. | Spring Garden | 100.0% | 69.7% (+30.3)#12 | 64.8% (+35.2)#971 |
| 13. | Hobson | 100.0% | 69.7% (+30.3)#13 | 64.8% (+35.2)#1,027 |
| 14. | Delta | 100.0% | 69.7% (+30.3)#14 | 64.8% (+35.2)#1,045 |
| 15. | Eunola | 100.0% | 69.7% (+30.3)#15 | 64.8% (+35.2)#1,057 |
| 16. | Hissop | 100.0% | 69.7% (+30.3)#16 | 64.8% (+35.2)#1,118 |
| 17. | Bellamy | 100.0% | 69.7% (+30.3)#17 | 64.8% (+35.2)#1,176 |
| 18. | Spruce Pine | 100.0% | 69.7% (+30.3)#18 | 64.8% (+35.2)#1,203 |
| 19. | Mooresville | 100.0% | 69.7% (+30.3)#19 | 64.8% (+35.2)#1,325 |
| 20. | Panola | 100.0% | 69.7% (+30.3)#20 | 64.8% (+35.2)#1,397 |
| 21. | Deer Park | 100.0% | 69.7% (+30.3)#21 | 64.8% (+35.2)#1,422 |
| 22. | Calvert | 100.0% | 69.7% (+30.3)#22 | 64.8% (+35.2)#1,555 |
| 23. | Tibbie | 100.0% | 69.7% (+30.3)#23 | 64.8% (+35.2)#1,556 |
| 24. | Graham | 100.0% | 69.7% (+30.3)#24 | 64.8% (+35.2)#1,589 |
| 25. | Penton | 100.0% | 69.7% (+30.3)#25 | 64.8% (+35.2)#1,603 |
| 26. | Putnam | 100.0% | 69.7% (+30.3)#26 | 64.8% (+35.2)#1,650 |
| 27. | Gulfcrest | 100.0% | 69.7% (+30.3)#27 | 64.8% (+35.2)#1,689 |
| 28. | Carlton | 100.0% | 69.7% (+30.3)#28 | 64.8% (+35.2)#1,696 |
| 29. | Movico | 100.0% | 69.7% (+30.3)#29 | 64.8% (+35.2)#1,838 |
| 30. | Malcolm | 100.0% | 69.7% (+30.3)#30 | 64.8% (+35.2)#1,881 |
| 31. | Belgreen | 100.0% | 69.7% (+30.3)#31 | 64.8% (+35.2)#2,120 |
| 32. | Benton | 100.0% | 69.7% (+30.3)#32 | 64.8% (+35.2)#2,179 |
| 33. | Nanafalia | 100.0% | 69.7% (+30.3)#33 | 64.8% (+35.2)#2,252 |
| 34. | Natural Bridge | 100.0% | 69.7% (+30.3)#34 | 64.8% (+35.2)#2,296 |
| 35. | Bucks | 100.0% | 69.7% (+30.3)#35 | 64.8% (+35.2)#2,299 |
| 36. | Megargel | 100.0% | 69.7% (+30.3)#36 | 64.8% (+35.2)#2,589 |
| 37. | Highland Lakes | 99.2% | 69.7% (+29.5)#37 | 64.8% (+34.4)#2,681 |
| 38. | Perdido Beach | 98.2% | 69.7% (+28.5)#38 | 64.8% (+33.4)#2,809 |
| 39. | Vinegar Bend | 98.1% | 69.7% (+28.4)#39 | 64.8% (+33.3)#2,830 |
| 40. | Eagle Point | 98.1% | 69.7% (+28.4)#40 | 64.8% (+33.3)#2,836 |
| 41. | Union | 98.0% | 69.7% (+28.3)#41 | 64.8% (+33.2)#2,856 |
| 42. | Glen Allen | 98.0% | 69.7% (+28.3)#42 | 64.8% (+33.2)#2,862 |
| 43. | Emerald Mountain | 97.9% | 69.7% (+28.2)#43 | 64.8% (+33.1)#2,882 |
| 44. | Blue Ridge | 97.6% | 69.7% (+27.9)#44 | 64.8% (+32.8)#2,945 |
| 45. | Providence | 96.8% | 69.7% (+27.1)#45 | 64.8% (+32.0)#3,205 |
| 46. | Indian Springs Village | 96.7% | 69.7% (+27.0)#46 | 64.8% (+31.9)#3,251 |
| 47. | Dauphin Island | 96.4% | 69.7% (+26.7)#47 | 64.8% (+31.6)#3,334 |
| 48. | Odenville | 96.4% | 69.7% (+26.7)#48 | 64.8% (+31.6)#3,335 |
| 49. | Pine Level | 96.0% | 69.7% (+26.3)#49 | 64.8% (+31.2)#3,477 |
| 50. | Marbury | 95.9% | 69.7% (+26.1)#50 | 64.8% (+31.0)#3,520 |
| 51. | Twin | 95.8% | 69.7% (+26.1)#51 | 64.8% (+31.0)#3,541 |
| 52. | Myrtlewood | 95.5% | 69.7% (+25.7)#52 | 64.8% (+30.6)#3,670 |
| 53. | Hollins | 95.1% | 69.7% (+25.4)#53 | 64.8% (+30.3)#3,828 |
| 54. | Lisman | 95.0% | 69.7% (+25.2)#54 | 64.8% (+30.1)#3,883 |
| 55. | Ballplay | 94.9% | 69.7% (+25.2)#55 | 64.8% (+30.1)#3,901 |
| 56. | Ivalee | 94.8% | 69.7% (+25.0)#56 | 64.8% (+29.9)#3,955 |
| 57. | Epes | 94.7% | 69.7% (+25.0)#57 | 64.8% (+29.9)#3,960 |
| 58. | Kimberly | 94.7% | 69.7% (+25.0)#58 | 64.8% (+29.9)#3,990 |
| 59. | Mount Olive Cdp Jefferson County | 94.7% | 69.7% (+24.9)#59 | 64.8% (+29.8)#4,003 |
| 60. | County Line | 94.6% | 69.7% (+24.9)#60 | 64.8% (+29.8)#4,015 |
| 61. | Sweet Water | 94.6% | 69.7% (+24.9)#61 | 64.8% (+29.8)#4,016 |
| 62. | Coffee Springs | 94.5% | 69.7% (+24.8)#62 | 64.8% (+29.7)#4,073 |
| 63. | St Stephens | 94.5% | 69.7% (+24.8)#63 | 64.8% (+29.7)#4,081 |
| 64. | Gallant | 94.5% | 69.7% (+24.7)#64 | 64.8% (+29.6)#4,089 |
| 65. | Toxey | 94.3% | 69.7% (+24.6)#65 | 64.8% (+29.5)#4,154 |
| 66. | Shoal Creek | 94.1% | 69.7% (+24.4)#66 | 64.8% (+29.3)#4,214 |
| 67. | Lake View | 94.1% | 69.7% (+24.4)#67 | 64.8% (+29.3)#4,220 |
| 68. | Rosa | 94.0% | 69.7% (+24.2)#68 | 64.8% (+29.2)#4,293 |
| 69. | Millerville | 93.9% | 69.7% (+24.2)#69 | 64.8% (+29.1)#4,330 |
| 70. | Smoke Rise | 93.6% | 69.7% (+23.9)#70 | 64.8% (+28.8)#4,449 |
| 71. | Rock Creek | 93.6% | 69.7% (+23.9)#71 | 64.8% (+28.8)#4,458 |
| 72. | Meridianville | 93.5% | 69.7% (+23.8)#72 | 64.8% (+28.7)#4,493 |
| 73. | Woodland | 93.5% | 69.7% (+23.7)#73 | 64.8% (+28.6)#4,504 |
| 74. | Morris | 93.4% | 69.7% (+23.7)#74 | 64.8% (+28.6)#4,533 |
| 75. | Lookout Mountain | 93.1% | 69.7% (+23.4)#75 | 64.8% (+28.3)#4,658 |
| 76. | Mount Olive Cdp Coosa County | 93.1% | 69.7% (+23.3)#76 | 64.8% (+28.3)#4,661 |
| 77. | Clay | 93.0% | 69.7% (+23.3)#77 | 64.8% (+28.2)#4,703 |
| 78. | Trussville | 92.9% | 69.7% (+23.2)#78 | 64.8% (+28.1)#4,726 |
| 79. | Paint Rock | 92.9% | 69.7% (+23.1)#79 | 64.8% (+28.0)#4,768 |
| 80. | Hokes Bluff | 92.8% | 69.7% (+23.1)#80 | 64.8% (+28.0)#4,790 |
| 81. | Pine Apple | 92.8% | 69.7% (+23.1)#81 | 64.8% (+28.0)#4,812 |
| 82. | Needham | 92.6% | 69.7% (+22.9)#82 | 64.8% (+27.8)#4,900 |
| 83. | Hytop | 92.5% | 69.7% (+22.8)#83 | 64.8% (+27.7)#4,930 |
| 84. | Mccalla | 92.3% | 69.7% (+22.6)#84 | 64.8% (+27.5)#5,013 |
| 85. | Redland | 92.3% | 69.7% (+22.5)#85 | 64.8% (+27.5)#5,063 |
| 86. | Haleburg | 92.2% | 69.7% (+22.5)#86 | 64.8% (+27.4)#5,104 |
| 87. | Waverly | 92.2% | 69.7% (+22.4)#87 | 64.8% (+27.3)#5,111 |
| 88. | Akron | 91.9% | 69.7% (+22.1)#88 | 64.8% (+27.0)#5,246 |
| 89. | Harvest | 91.8% | 69.7% (+22.1)#89 | 64.8% (+27.0)#5,265 |
| 90. | Madrid | 91.8% | 69.7% (+22.0)#90 | 64.8% (+26.9)#5,297 |
| 91. | Black | 91.5% | 69.7% (+21.8)#91 | 64.8% (+26.7)#5,395 |
| 92. | Priceville | 91.5% | 69.7% (+21.7)#92 | 64.8% (+26.6)#5,433 |
| 93. | Kellyton | 91.4% | 69.7% (+21.7)#93 | 64.8% (+26.6)#5,469 |
| 94. | Munford | 91.4% | 69.7% (+21.7)#94 | 64.8% (+26.6)#5,474 |
| 95. | Hayden | 91.3% | 69.7% (+21.6)#95 | 64.8% (+26.5)#5,499 |
| 96. | Ridgeville | 91.2% | 69.7% (+21.5)#96 | 64.8% (+26.4)#5,586 |
| 97. | Helena | 91.0% | 69.7% (+21.3)#97 | 64.8% (+26.2)#5,678 |
| 98. | Mentone | 91.0% | 69.7% (+21.2)#98 | 64.8% (+26.1)#5,712 |
| 99. | Coaling | 90.8% | 69.7% (+21.1)#99 | 64.8% (+26.0)#5,804 |
| 100. | Reece City | 90.8% | 69.7% (+21.1)#100 | 64.8% (+26.0)#5,818 |
Common Questions
What are the Top 10 Cities with the Highest Percentage of Owner-Occupied Units in Alabama?
Top 10 Cities with the Highest Percentage of Owner-Occupied Units in Alabama are:
#1
100.0%
#2
100.0%
#3
100.0%
#4
100.0%
#5
100.0%
#6
100.0%
#7
100.0%
#8
100.0%
#9
100.0%
#10
100.0%
What city has the Highest Percentage of Owner-Occupied Units in Alabama?
Stapleton has the Highest Percentage of Owner-Occupied Units in Alabama with 100.0%.
What is the Percentage of Owner-Occupied Units in the State of Alabama?
Percentage of Owner-Occupied Units in Alabama is 69.7%.
What is the Percentage of Owner-Occupied Units in the United States?
Percentage of Owner-Occupied Units in the United States is 64.8%.