Triana, AL Map & Demographics
Triana Map
Triana Overview
$61,842
PER CAPITA INCOME
$102,656
AVG FAMILY INCOME
$89,531
AVG HOUSEHOLD INCOME
34.9%
WAGE / INCOME GAP [ % ]
65.1¢/ $1
WAGE / INCOME GAP [ $ ]
0.55
INEQUALITY / GINI INDEX
3,114
TOTAL POPULATION
1,665
MALE POPULATION
1,449
FEMALE POPULATION
114.91
MALES / 100 FEMALES
87.03
FEMALES / 100 MALES
34.4
MEDIAN AGE
3.0
AVG FAMILY SIZE
2.6
AVG HOUSEHOLD SIZE
1,632
LABOR FORCE [ PEOPLE ]
70.0%
PERCENT IN LABOR FORCE
12.2%
UNEMPLOYMENT RATE
Triana Area Codes
Income in Triana
Income Overview in Triana
Per Capita Income in Triana is $61,842, while median incomes of families and households are $102,656 and $89,531 respectively.
| Characteristic | Number | Measure |
| Per Capita Income | 3,114 | $61,842 |
| Median Family Income | 885 | $102,656 |
| Mean Family Income | 885 | $192,532 |
| Median Household Income | 1,189 | $89,531 |
| Mean Household Income | 1,189 | $159,879 |
| Income Deficit | 885 | $0 |
| Wage / Income Gap (%) | 3,114 | 34.91% |
| Wage / Income Gap ($) | 3,114 | 65.09¢ per $1 |
| Gini / Inequality Index | 3,114 | 0.55 |
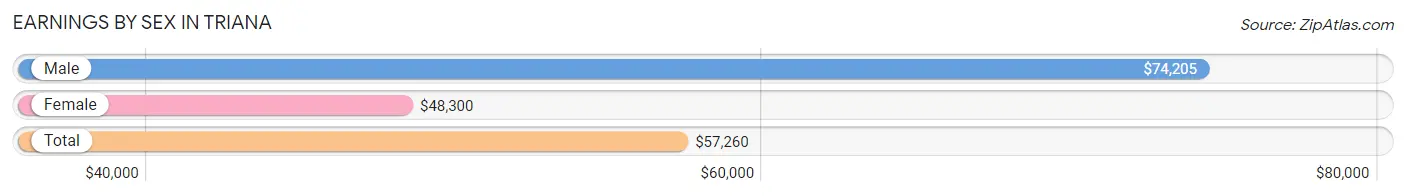
Earnings by Sex in Triana
Average Earnings in Triana are $57,260, $74,205 for men and $48,300 for women, a difference of 34.9%.
| Sex | Number | Average Earnings |
| Male | 890 (57.8%) | $74,205 |
| Female | 650 (42.2%) | $48,300 |
| Total | 1,540 (100.0%) | $57,260 |
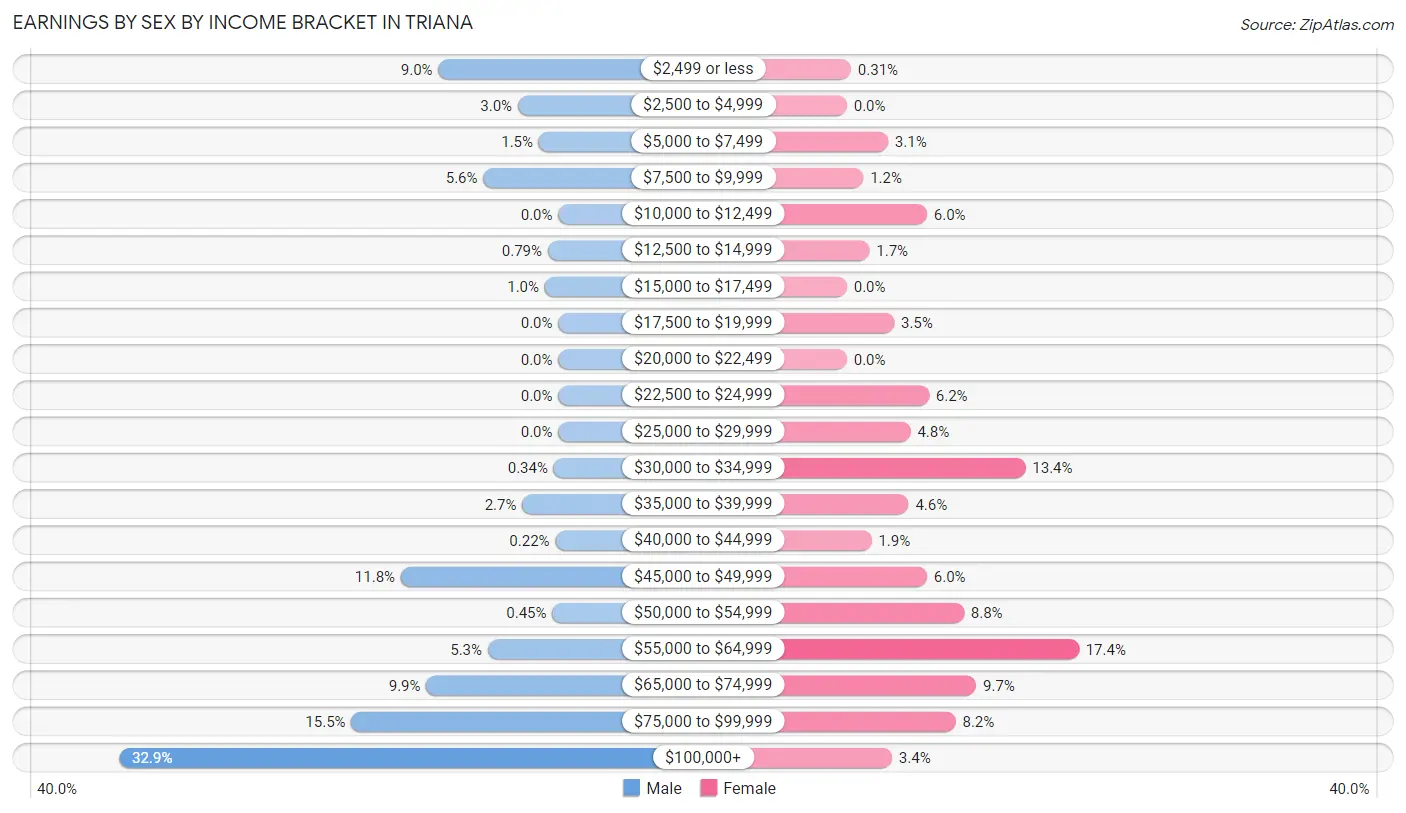
Earnings by Sex by Income Bracket in Triana
The most common earnings brackets in Triana are $100,000+ for men (293 | 32.9%) and $55,000 to $64,999 for women (113 | 17.4%).
| Income | Male | Female |
| $2,499 or less | 80 (9.0%) | 2 (0.3%) |
| $2,500 to $4,999 | 27 (3.0%) | 0 (0.0%) |
| $5,000 to $7,499 | 13 (1.5%) | 20 (3.1%) |
| $7,500 to $9,999 | 50 (5.6%) | 8 (1.2%) |
| $10,000 to $12,499 | 0 (0.0%) | 39 (6.0%) |
| $12,500 to $14,999 | 7 (0.8%) | 11 (1.7%) |
| $15,000 to $17,499 | 9 (1.0%) | 0 (0.0%) |
| $17,500 to $19,999 | 0 (0.0%) | 23 (3.5%) |
| $20,000 to $22,499 | 0 (0.0%) | 0 (0.0%) |
| $22,500 to $24,999 | 0 (0.0%) | 40 (6.1%) |
| $25,000 to $29,999 | 0 (0.0%) | 31 (4.8%) |
| $30,000 to $34,999 | 3 (0.3%) | 87 (13.4%) |
| $35,000 to $39,999 | 24 (2.7%) | 30 (4.6%) |
| $40,000 to $44,999 | 2 (0.2%) | 12 (1.8%) |
| $45,000 to $49,999 | 105 (11.8%) | 39 (6.0%) |
| $50,000 to $54,999 | 4 (0.4%) | 57 (8.8%) |
| $55,000 to $64,999 | 47 (5.3%) | 113 (17.4%) |
| $65,000 to $74,999 | 88 (9.9%) | 63 (9.7%) |
| $75,000 to $99,999 | 138 (15.5%) | 53 (8.2%) |
| $100,000+ | 293 (32.9%) | 22 (3.4%) |
| Total | 890 (100.0%) | 650 (100.0%) |
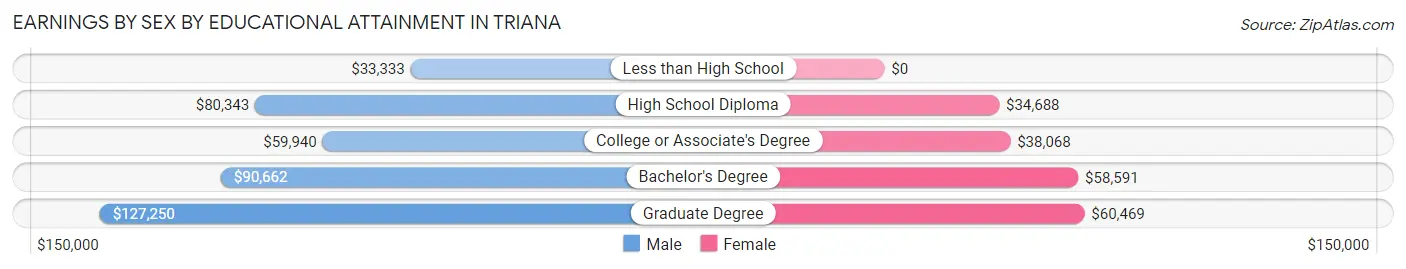
Earnings by Sex by Educational Attainment in Triana
Average earnings in Triana are $77,500 for men and $52,636 for women, a difference of 32.1%. Men with an educational attainment of graduate degree enjoy the highest average annual earnings of $127,250, while those with less than high school education earn the least with $33,333. Women with an educational attainment of graduate degree earn the most with the average annual earnings of $60,469, while those with high school diploma education have the smallest earnings of $34,688.
| Educational Attainment | Male Income | Female Income |
| Less than High School | $33,333 | $0 |
| High School Diploma | $80,343 | $34,688 |
| College or Associate's Degree | $59,940 | $38,068 |
| Bachelor's Degree | $90,662 | $58,591 |
| Graduate Degree | $127,250 | $60,469 |
| Total | $77,500 | $52,636 |
Family Income in Triana
Family Income Brackets in Triana
According to the Triana family income data, there are 239 families falling into the $100,000 to $149,999 income range, which is the most common income bracket and makes up 27.0% of all families.
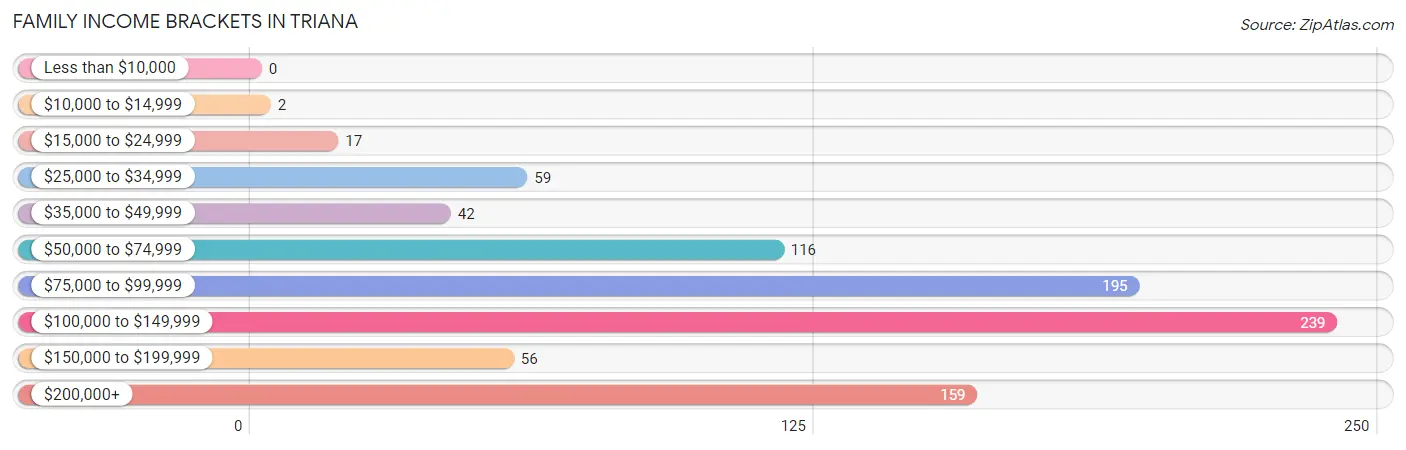
| Income Bracket | # Families | % Families |
| Less than $10,000 | 0 | 0.0% |
| $10,000 to $14,999 | 2 | 0.2% |
| $15,000 to $24,999 | 17 | 1.9% |
| $25,000 to $34,999 | 59 | 6.7% |
| $35,000 to $49,999 | 42 | 4.7% |
| $50,000 to $74,999 | 116 | 13.1% |
| $75,000 to $99,999 | 195 | 22.0% |
| $100,000 to $149,999 | 239 | 27.0% |
| $150,000 to $199,999 | 56 | 6.3% |
| $200,000+ | 159 | 18.0% |
Family Income by Famaliy Size in Triana
5-person families (79 | 8.9%) account for the highest median family income in Triana with $250,001 per family, while 5-person families (79 | 8.9%) have the highest median income of $50,000 per family member.
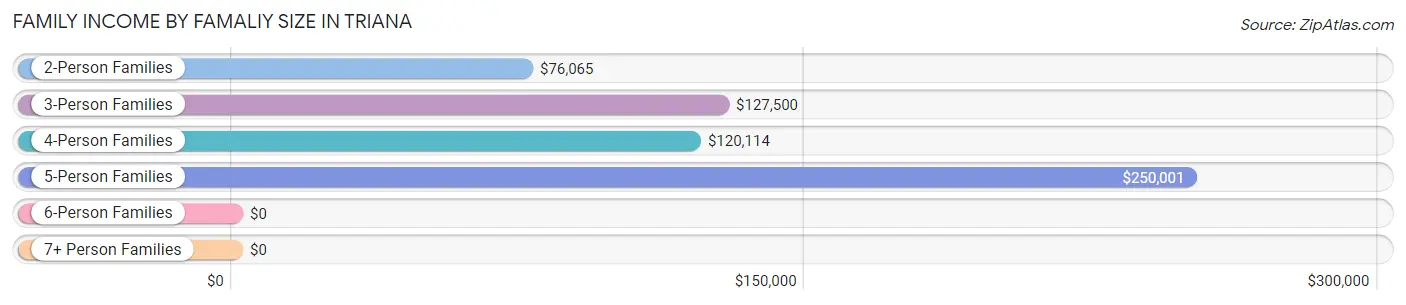
| Income Bracket | # Families | Median Income |
| 2-Person Families | 359 (40.6%) | $76,065 |
| 3-Person Families | 290 (32.8%) | $127,500 |
| 4-Person Families | 152 (17.2%) | $120,114 |
| 5-Person Families | 79 (8.9%) | $250,001 |
| 6-Person Families | 5 (0.6%) | $0 |
| 7+ Person Families | 0 (0.0%) | $0 |
| Total | 885 (100.0%) | $102,656 |
Family Income by Number of Earners in Triana
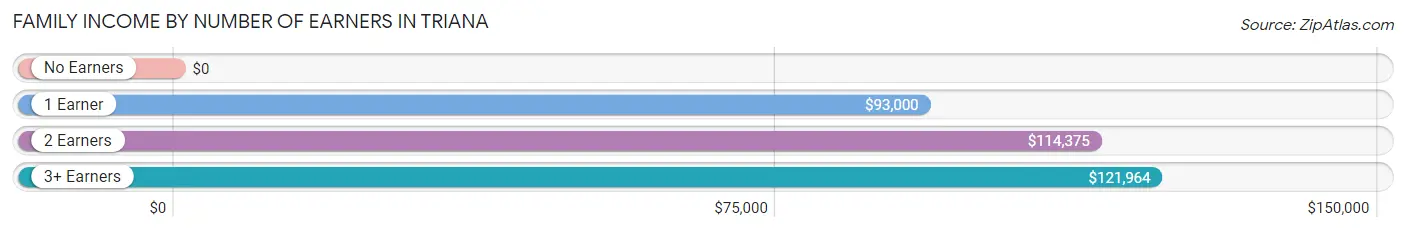
| Number of Earners | # Families | Median Income |
| No Earners | 55 (6.2%) | $0 |
| 1 Earner | 468 (52.9%) | $93,000 |
| 2 Earners | 327 (36.9%) | $114,375 |
| 3+ Earners | 35 (4.0%) | $121,964 |
| Total | 885 (100.0%) | $102,656 |
Household Income in Triana
Household Income Brackets in Triana
With 278 households falling in the category, the $100,000 to $149,999 income range is the most frequent in Triana, accounting for 23.4% of all households. In contrast, only 4 households (0.3%) fall into the less than $10,000 income bracket, making it the least populous group.
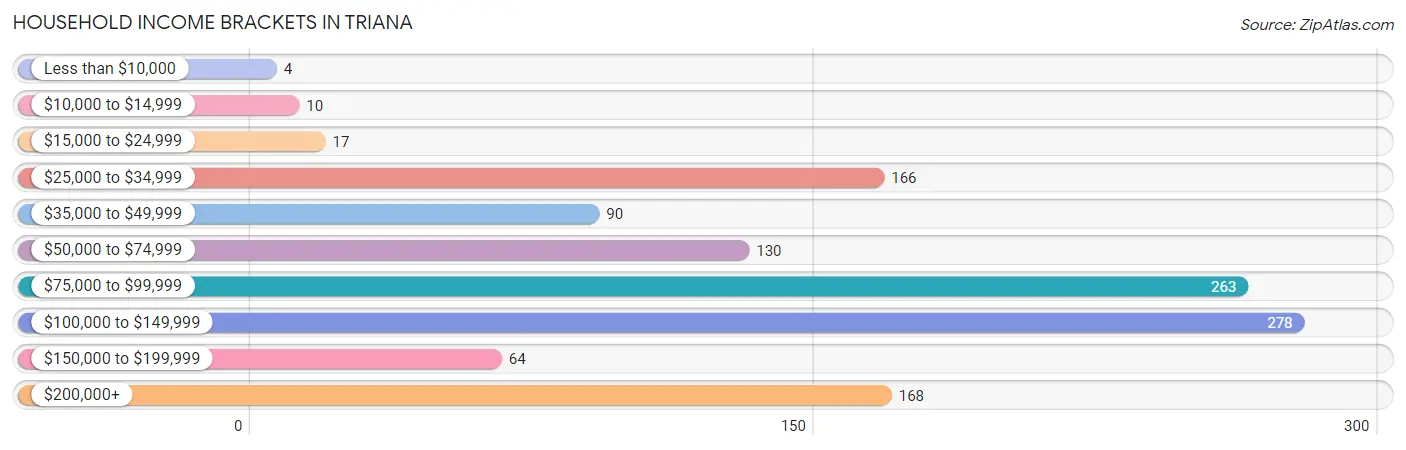
| Income Bracket | # Households | % Households |
| Less than $10,000 | 4 | 0.3% |
| $10,000 to $14,999 | 10 | 0.8% |
| $15,000 to $24,999 | 17 | 1.4% |
| $25,000 to $34,999 | 166 | 14.0% |
| $35,000 to $49,999 | 90 | 7.6% |
| $50,000 to $74,999 | 130 | 10.9% |
| $75,000 to $99,999 | 263 | 22.1% |
| $100,000 to $149,999 | 278 | 23.4% |
| $150,000 to $199,999 | 64 | 5.4% |
| $200,000+ | 168 | 14.1% |
Household Income by Householder Age in Triana
The median household income in Triana is $89,531, with the highest median household income of $102,102 found in the 45 to 64 years age bracket for the primary householder. A total of 293 households (24.6%) fall into this category. Meanwhile, the 15 to 24 years age bracket for the primary householder has the lowest median household income of $0, with 22 households (1.8%) in this group.
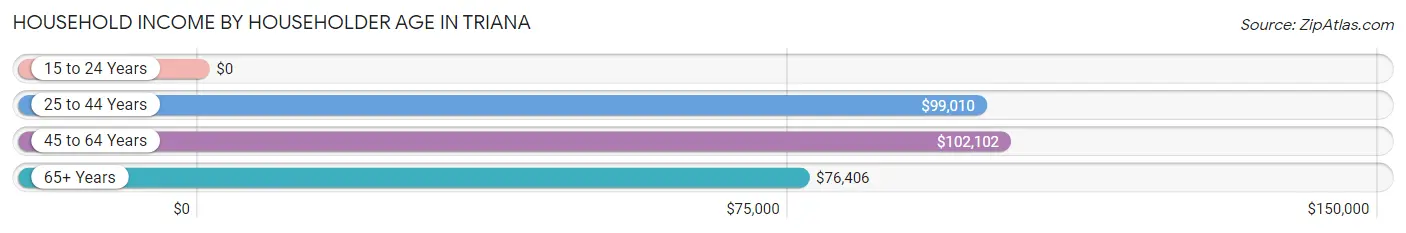
| Income Bracket | # Households | Median Income |
| 15 to 24 Years | 22 (1.8%) | $0 |
| 25 to 44 Years | 635 (53.4%) | $99,010 |
| 45 to 64 Years | 293 (24.6%) | $102,102 |
| 65+ Years | 239 (20.1%) | $76,406 |
| Total | 1,189 (100.0%) | $89,531 |
Poverty in Triana
Income Below Poverty by Sex and Age in Triana
With 4.0% poverty level for males and 2.5% for females among the residents of Triana, 55 to 64 year old males and 5 year old females are the most vulnerable to poverty, with 36 males (15.2%) and 4 females (18.2%) in their respective age groups living below the poverty level.
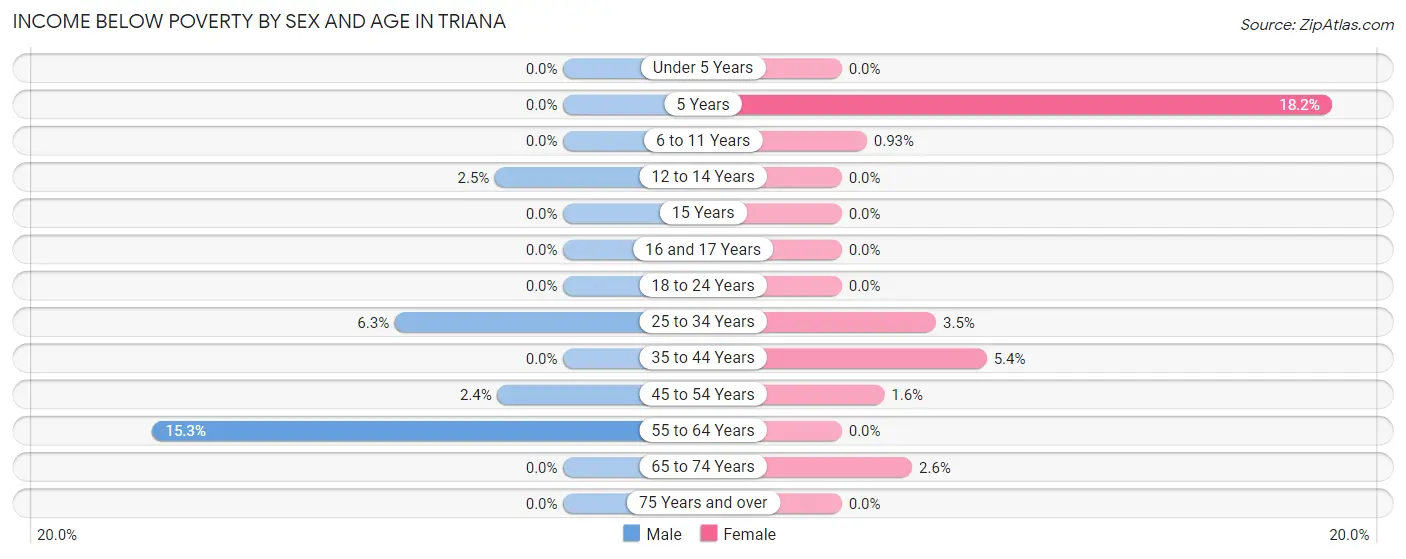
| Age Bracket | Male | Female |
| Under 5 Years | 0 (0.0%) | 0 (0.0%) |
| 5 Years | 0 (0.0%) | 4 (18.2%) |
| 6 to 11 Years | 0 (0.0%) | 2 (0.9%) |
| 12 to 14 Years | 2 (2.5%) | 0 (0.0%) |
| 15 Years | 0 (0.0%) | 0 (0.0%) |
| 16 and 17 Years | 0 (0.0%) | 0 (0.0%) |
| 18 to 24 Years | 0 (0.0%) | 0 (0.0%) |
| 25 to 34 Years | 24 (6.2%) | 10 (3.5%) |
| 35 to 44 Years | 0 (0.0%) | 14 (5.4%) |
| 45 to 54 Years | 4 (2.4%) | 3 (1.6%) |
| 55 to 64 Years | 36 (15.2%) | 0 (0.0%) |
| 65 to 74 Years | 0 (0.0%) | 3 (2.6%) |
| 75 Years and over | 0 (0.0%) | 0 (0.0%) |
| Total | 66 (4.0%) | 36 (2.5%) |
Income Above Poverty by Sex and Age in Triana
According to the poverty statistics in Triana, males aged under 5 years and females aged under 5 years are the age groups that are most secure financially, with 100.0% of males and 100.0% of females in these age groups living above the poverty line.
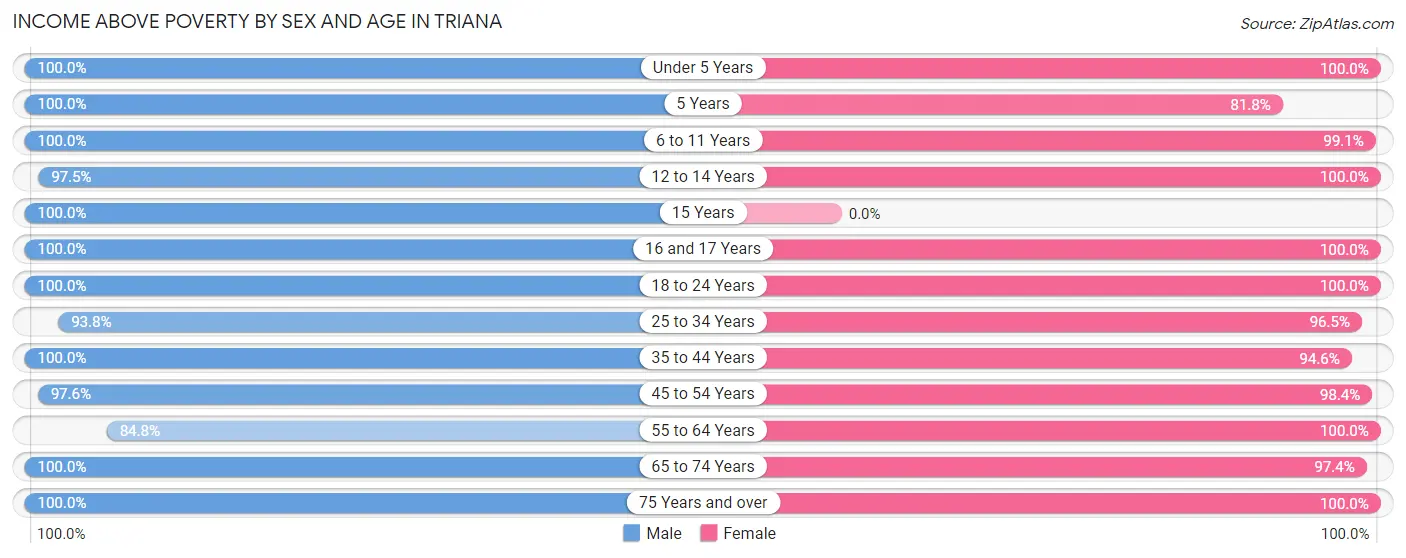
| Age Bracket | Male | Female |
| Under 5 Years | 186 (100.0%) | 116 (100.0%) |
| 5 Years | 22 (100.0%) | 18 (81.8%) |
| 6 to 11 Years | 83 (100.0%) | 213 (99.1%) |
| 12 to 14 Years | 77 (97.5%) | 31 (100.0%) |
| 15 Years | 28 (100.0%) | 0 (0.0%) |
| 16 and 17 Years | 28 (100.0%) | 34 (100.0%) |
| 18 to 24 Years | 26 (100.0%) | 64 (100.0%) |
| 25 to 34 Years | 360 (93.8%) | 276 (96.5%) |
| 35 to 44 Years | 245 (100.0%) | 246 (94.6%) |
| 45 to 54 Years | 160 (97.6%) | 187 (98.4%) |
| 55 to 64 Years | 200 (84.8%) | 70 (100.0%) |
| 65 to 74 Years | 67 (100.0%) | 112 (97.4%) |
| 75 Years and over | 117 (100.0%) | 46 (100.0%) |
| Total | 1,599 (96.0%) | 1,413 (97.5%) |
Income Below Poverty Among Married-Couple Families in Triana
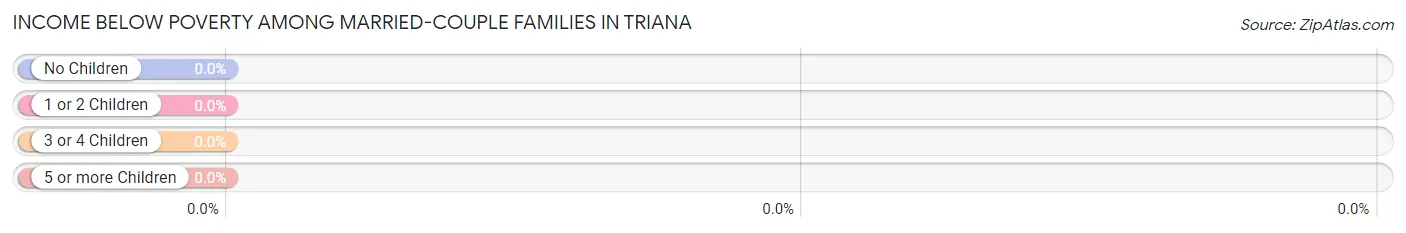
| Children | Above Poverty | Below Poverty |
| No Children | 204 (100.0%) | 0 (0.0%) |
| 1 or 2 Children | 358 (100.0%) | 0 (0.0%) |
| 3 or 4 Children | 76 (100.0%) | 0 (0.0%) |
| 5 or more Children | 0 (0.0%) | 0 (0.0%) |
| Total | 638 (100.0%) | 0 (0.0%) |
Income Below Poverty Among Single-Parent Households in Triana
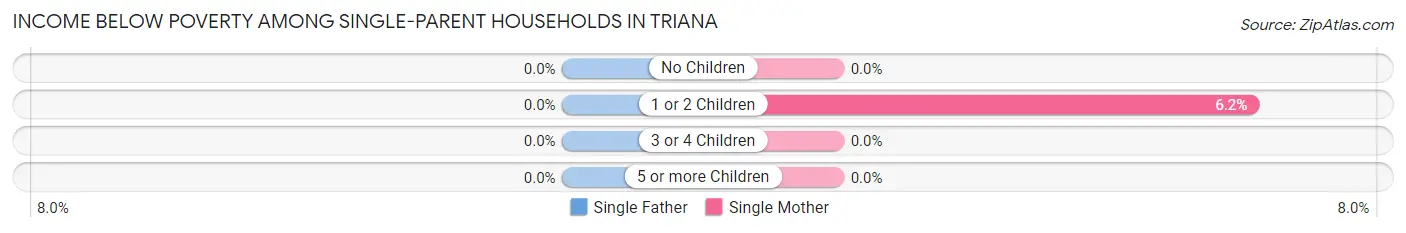
| Children | Single Father | Single Mother |
| No Children | 0 (0.0%) | 0 (0.0%) |
| 1 or 2 Children | 0 (0.0%) | 6 (6.2%) |
| 3 or 4 Children | 0 (0.0%) | 0 (0.0%) |
| 5 or more Children | 0 (0.0%) | 0 (0.0%) |
| Total | 0 (0.0%) | 6 (2.9%) |
Income Below Poverty Among Married-Couple vs Single-Parent Households in Triana
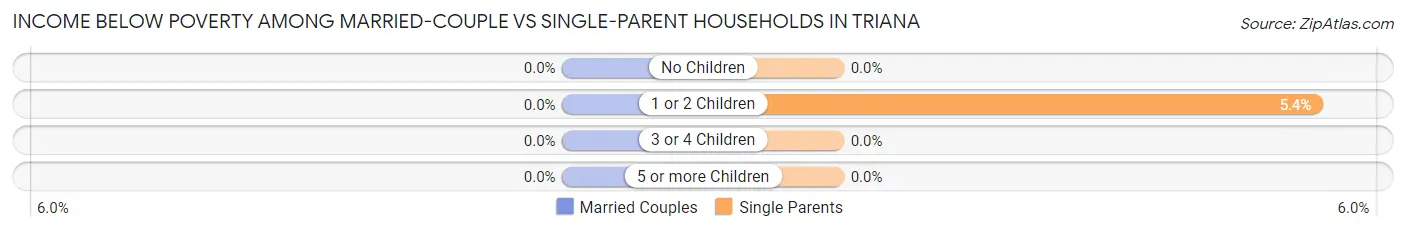
| Children | Married-Couple Families | Single-Parent Households |
| No Children | 0 (0.0%) | 0 (0.0%) |
| 1 or 2 Children | 0 (0.0%) | 6 (5.4%) |
| 3 or 4 Children | 0 (0.0%) | 0 (0.0%) |
| 5 or more Children | 0 (0.0%) | 0 (0.0%) |
| Total | 0 (0.0%) | 6 (2.4%) |
Race in Triana
The most populous races in Triana are Black / African American (1,486 | 47.7%), White / Caucasian (1,415 | 45.4%), and Asian (121 | 3.9%).
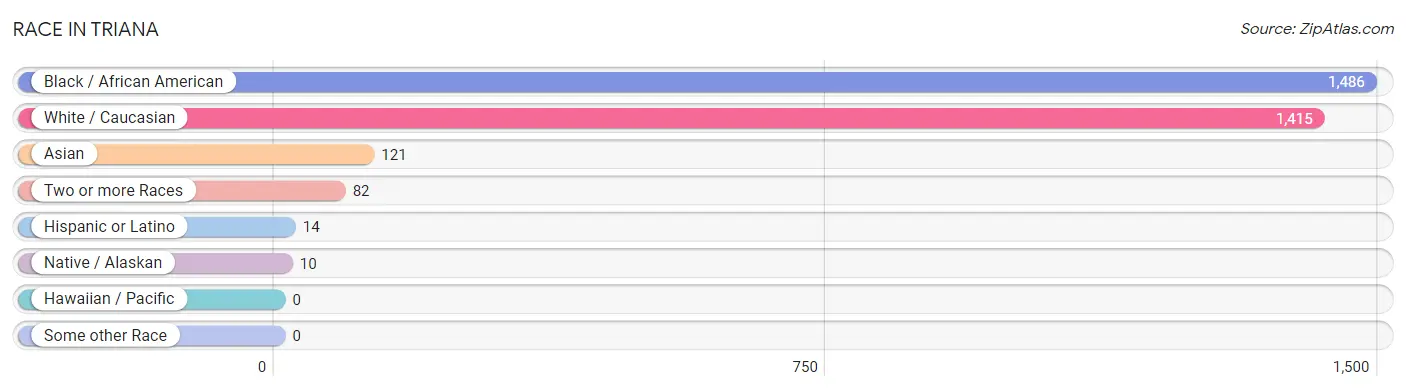
| Race | # Population | % Population |
| Asian | 121 | 3.9% |
| Black / African American | 1,486 | 47.7% |
| Hawaiian / Pacific | 0 | 0.0% |
| Hispanic or Latino | 14 | 0.4% |
| Native / Alaskan | 10 | 0.3% |
| White / Caucasian | 1,415 | 45.4% |
| Two or more Races | 82 | 2.6% |
| Some other Race | 0 | 0.0% |
| Total | 3,114 | 100.0% |
Ancestry in Triana
The most populous ancestries reported in Triana are Irish (234 | 7.5%), German (209 | 6.7%), English (183 | 5.9%), Arab (168 | 5.4%), and European (146 | 4.7%), together accounting for 30.2% of all Triana residents.
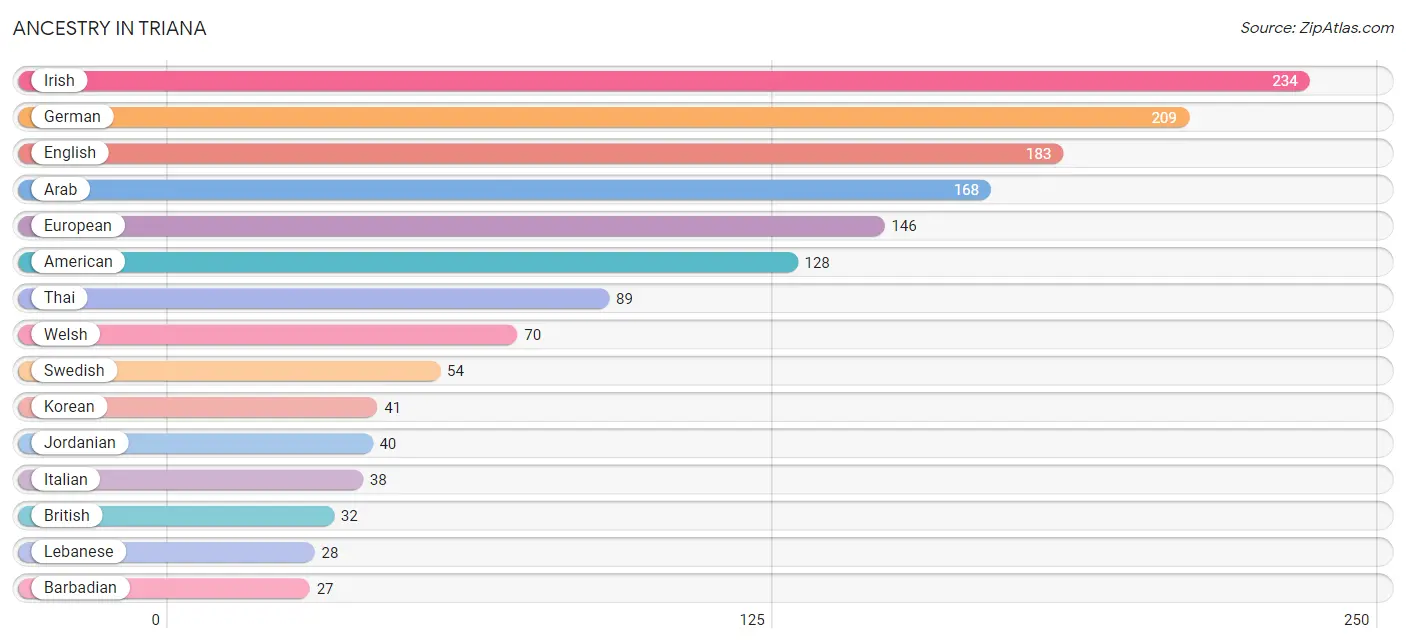
| Ancestry | # Population | % Population |
| American | 128 | 4.1% |
| Arab | 168 | 5.4% |
| Austrian | 3 | 0.1% |
| Barbadian | 27 | 0.9% |
| British | 32 | 1.0% |
| Burmese | 6 | 0.2% |
| Cherokee | 18 | 0.6% |
| Dutch | 3 | 0.1% |
| Ecuadorian | 2 | 0.1% |
| English | 183 | 5.9% |
| European | 146 | 4.7% |
| Finnish | 7 | 0.2% |
| French | 2 | 0.1% |
| German | 209 | 6.7% |
| Greek | 4 | 0.1% |
| Irish | 234 | 7.5% |
| Italian | 38 | 1.2% |
| Jordanian | 40 | 1.3% |
| Korean | 41 | 1.3% |
| Lebanese | 28 | 0.9% |
| Mexican | 3 | 0.1% |
| Scotch-Irish | 19 | 0.6% |
| Scottish | 14 | 0.4% |
| South American | 2 | 0.1% |
| Subsaharan African | 2 | 0.1% |
| Swedish | 54 | 1.7% |
| Thai | 89 | 2.9% |
| Welsh | 70 | 2.2% |
| West Indian | 24 | 0.8% | View All 29 Rows |
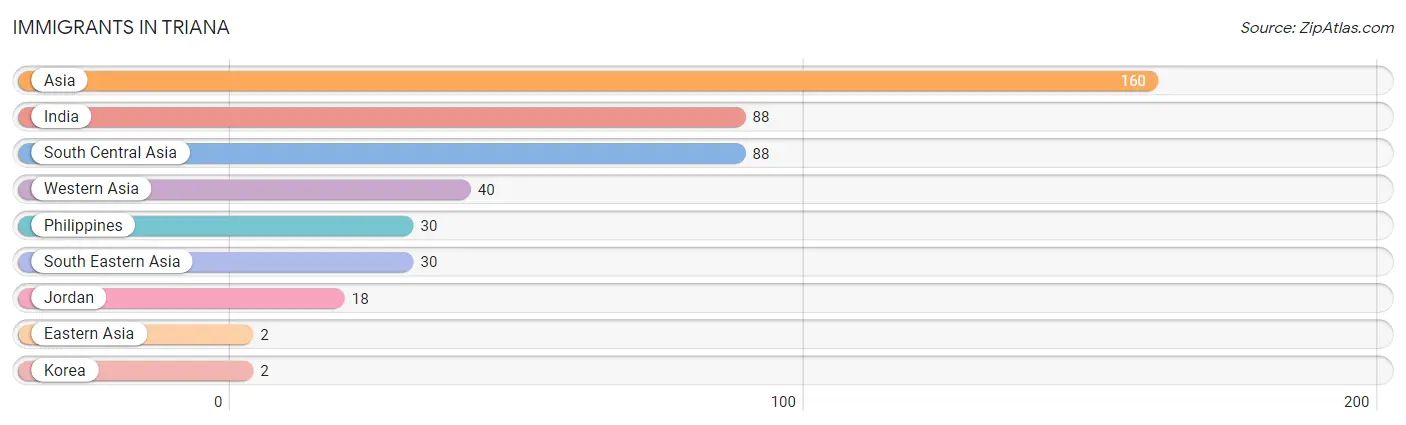
Immigrants in Triana
The most numerous immigrant groups reported in Triana came from Asia (160 | 5.1%), India (88 | 2.8%), South Central Asia (88 | 2.8%), Western Asia (40 | 1.3%), and Philippines (30 | 1.0%), together accounting for 13.0% of all Triana residents.
| Immigration Origin | # Population | % Population |
| Asia | 160 | 5.1% |
| Eastern Asia | 2 | 0.1% |
| India | 88 | 2.8% |
| Jordan | 18 | 0.6% |
| Korea | 2 | 0.1% |
| Philippines | 30 | 1.0% |
| South Central Asia | 88 | 2.8% |
| South Eastern Asia | 30 | 1.0% |
| Western Asia | 40 | 1.3% | View All 9 Rows |
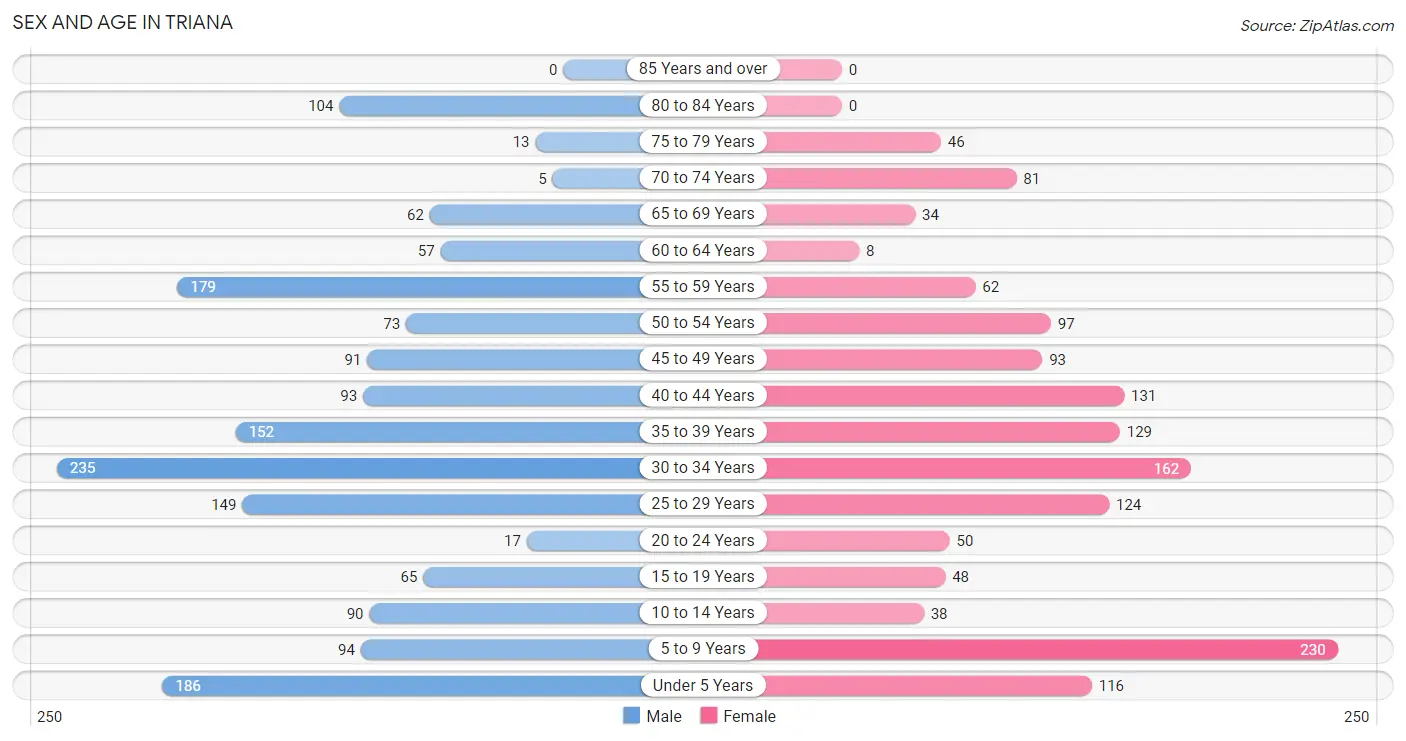
Sex and Age in Triana
Sex and Age in Triana
The most populous age groups in Triana are 30 to 34 Years (235 | 14.1%) for men and 5 to 9 Years (230 | 15.9%) for women.
| Age Bracket | Male | Female |
| Under 5 Years | 186 (11.2%) | 116 (8.0%) |
| 5 to 9 Years | 94 (5.7%) | 230 (15.9%) |
| 10 to 14 Years | 90 (5.4%) | 38 (2.6%) |
| 15 to 19 Years | 65 (3.9%) | 48 (3.3%) |
| 20 to 24 Years | 17 (1.0%) | 50 (3.5%) |
| 25 to 29 Years | 149 (8.9%) | 124 (8.6%) |
| 30 to 34 Years | 235 (14.1%) | 162 (11.2%) |
| 35 to 39 Years | 152 (9.1%) | 129 (8.9%) |
| 40 to 44 Years | 93 (5.6%) | 131 (9.0%) |
| 45 to 49 Years | 91 (5.5%) | 93 (6.4%) |
| 50 to 54 Years | 73 (4.4%) | 97 (6.7%) |
| 55 to 59 Years | 179 (10.7%) | 62 (4.3%) |
| 60 to 64 Years | 57 (3.4%) | 8 (0.5%) |
| 65 to 69 Years | 62 (3.7%) | 34 (2.4%) |
| 70 to 74 Years | 5 (0.3%) | 81 (5.6%) |
| 75 to 79 Years | 13 (0.8%) | 46 (3.2%) |
| 80 to 84 Years | 104 (6.2%) | 0 (0.0%) |
| 85 Years and over | 0 (0.0%) | 0 (0.0%) |
| Total | 1,665 (100.0%) | 1,449 (100.0%) |
Families and Households in Triana
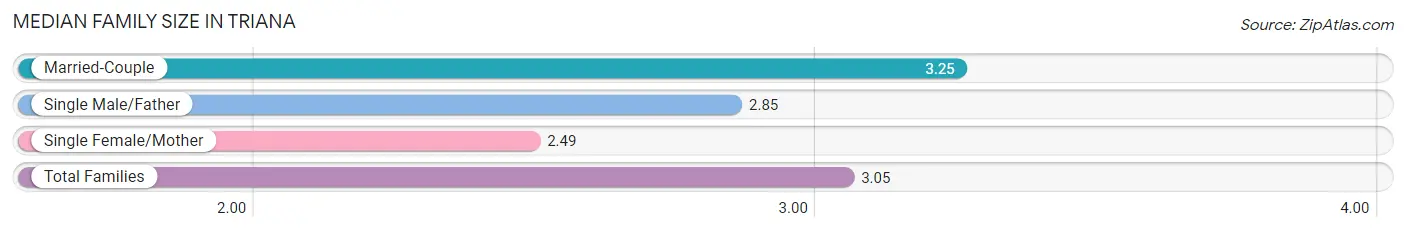
Median Family Size in Triana
The median family size in Triana is 3.05 persons per family, with married-couple families (638 | 72.1%) accounting for the largest median family size of 3.25 persons per family. On the other hand, single female/mother families (208 | 23.5%) represent the smallest median family size with 2.49 persons per family.
| Family Type | # Families | Family Size |
| Married-Couple | 638 (72.1%) | 3.25 |
| Single Male/Father | 39 (4.4%) | 2.85 |
| Single Female/Mother | 208 (23.5%) | 2.49 |
| Total Families | 885 (100.0%) | 3.05 |
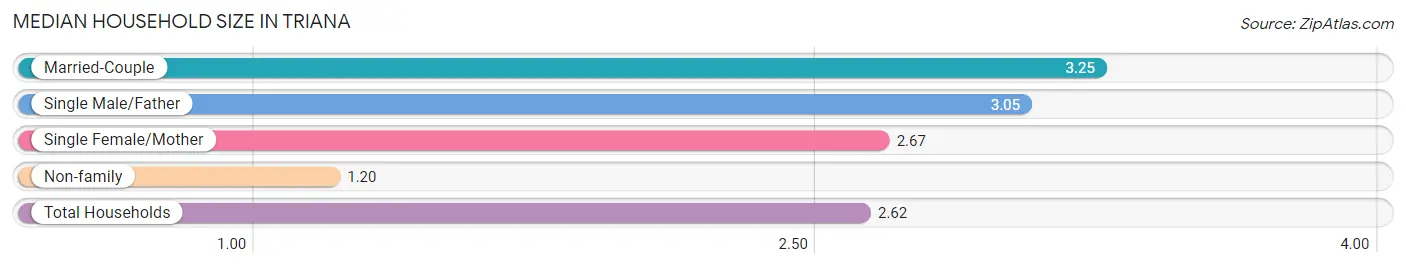
Median Household Size in Triana
The median household size in Triana is 2.62 persons per household, with married-couple households (638 | 53.7%) accounting for the largest median household size of 3.25 persons per household. non-family households (304 | 25.6%) represent the smallest median household size with 1.20 persons per household.
| Household Type | # Households | Household Size |
| Married-Couple | 638 (53.7%) | 3.25 |
| Single Male/Father | 39 (3.3%) | 3.05 |
| Single Female/Mother | 208 (17.5%) | 2.67 |
| Non-family | 304 (25.6%) | 1.20 |
| Total Households | 1,189 (100.0%) | 2.62 |
Household Size by Marriage Status in Triana
Out of a total of 1,189 households in Triana, 885 (74.4%) are family households, while 304 (25.6%) are nonfamily households. The most numerous type of family households are 3-person households, comprising 327, and the most common type of nonfamily households are 1-person households, comprising 253.
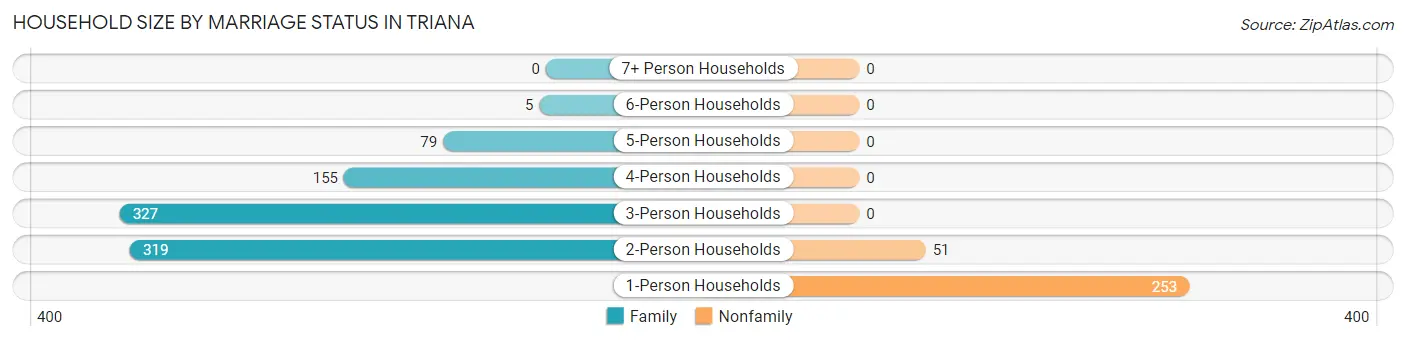
| Household Size | Family Households | Nonfamily Households |
| 1-Person Households | - | 253 (21.3%) |
| 2-Person Households | 319 (26.8%) | 51 (4.3%) |
| 3-Person Households | 327 (27.5%) | 0 (0.0%) |
| 4-Person Households | 155 (13.0%) | 0 (0.0%) |
| 5-Person Households | 79 (6.6%) | 0 (0.0%) |
| 6-Person Households | 5 (0.4%) | 0 (0.0%) |
| 7+ Person Households | 0 (0.0%) | 0 (0.0%) |
| Total | 885 (74.4%) | 304 (25.6%) |
Female Fertility in Triana
Fertility by Age in Triana
Average fertility rate in Triana is 100.0 births per 1,000 women. Women in the age bracket of 20 to 34 years have the highest fertility rate with 214.0 births per 1,000 women. Women in the age bracket of 20 to 34 years acount for 90.0% of all women with births.
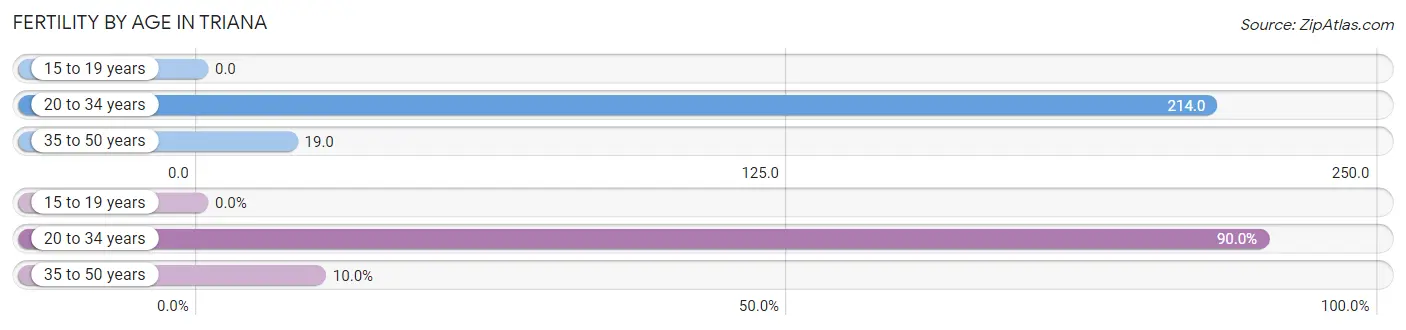
| Age Bracket | Women with Births | Births / 1,000 Women |
| 15 to 19 years | 0 (0.0%) | 0.0 |
| 20 to 34 years | 72 (90.0%) | 214.0 |
| 35 to 50 years | 8 (10.0%) | 19.0 |
| Total | 80 (100.0%) | 100.0 |
Fertility by Age by Marriage Status in Triana
78.7% of women with births (80) in Triana are married. The highest percentage of unmarried women with births falls into 35 to 50 years age bracket with 100.0% of them unmarried at the time of birth, while the lowest percentage of unmarried women with births belong to 20 to 34 years age bracket with 12.5% of them unmarried.
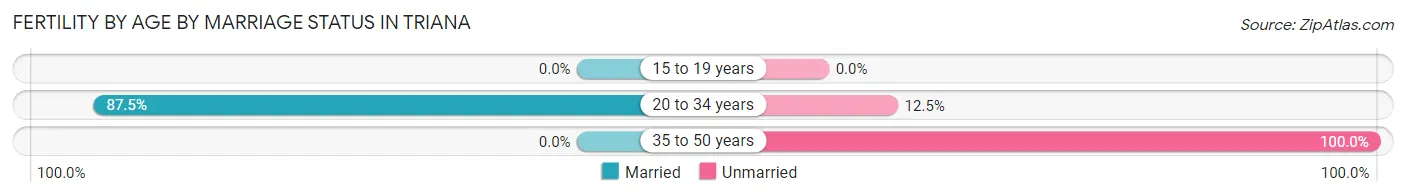
| Age Bracket | Married | Unmarried |
| 15 to 19 years | 0 (0.0%) | 0 (0.0%) |
| 20 to 34 years | 63 (87.5%) | 9 (12.5%) |
| 35 to 50 years | 0 (0.0%) | 8 (100.0%) |
| Total | 63 (78.7%) | 17 (21.2%) |
Fertility by Education in Triana
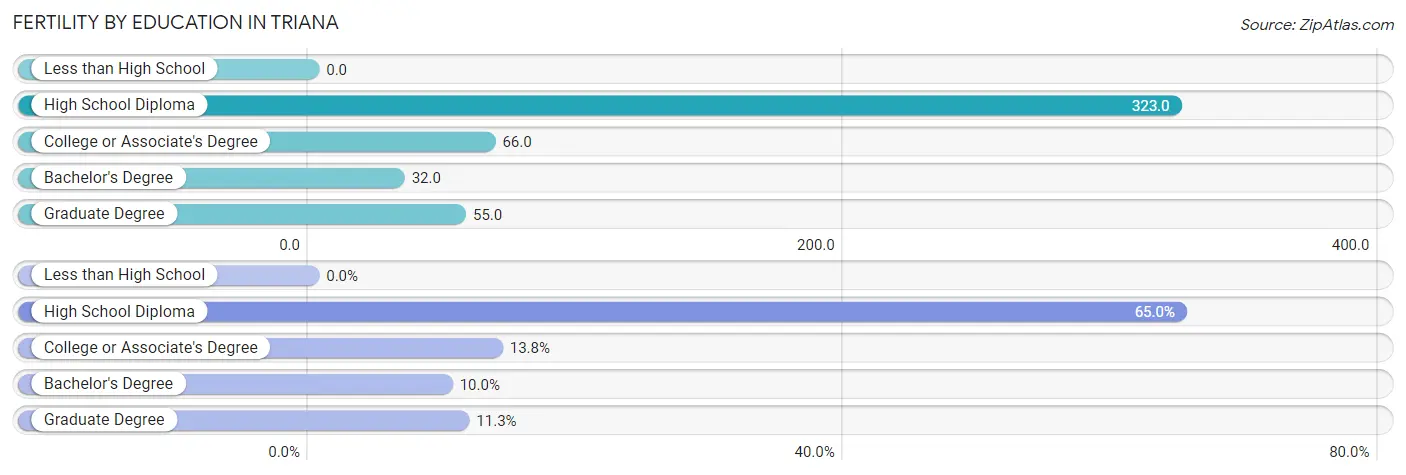
| Educational Attainment | Women with Births | Births / 1,000 Women |
| Less than High School | 0 (0.0%) | 0.0 |
| High School Diploma | 52 (65.0%) | 323.0 |
| College or Associate's Degree | 11 (13.8%) | 66.0 |
| Bachelor's Degree | 8 (10.0%) | 32.0 |
| Graduate Degree | 9 (11.3%) | 55.0 |
| Total | 80 (100.0%) | 100.0 |
Fertility by Education by Marriage Status in Triana
21.2% of women with births in Triana are unmarried. Women with the educational attainment of high school diploma are most likely to be married with 100.0% of them married at childbirth, while women with the educational attainment of bachelor's degree are least likely to be married with 100.0% of them unmarried at childbirth.
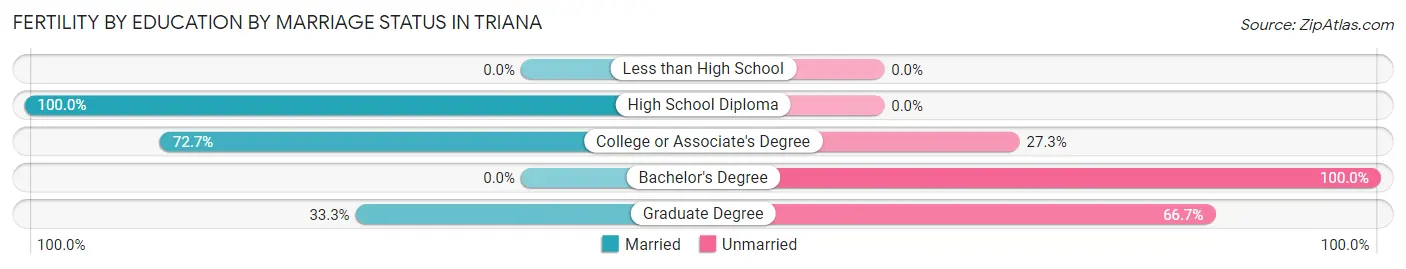
| Educational Attainment | Married | Unmarried |
| Less than High School | 0 (0.0%) | 0 (0.0%) |
| High School Diploma | 52 (100.0%) | 0 (0.0%) |
| College or Associate's Degree | 8 (72.7%) | 3 (27.3%) |
| Bachelor's Degree | 0 (0.0%) | 8 (100.0%) |
| Graduate Degree | 3 (33.3%) | 6 (66.7%) |
| Total | 63 (78.7%) | 17 (21.2%) |
Employment Characteristics in Triana
Employment by Class of Employer in Triana
Among the 1,354 employed individuals in Triana, private company employees (928 | 68.5%), federal government employees (217 | 16.0%), and not-for-profit organizations (88 | 6.5%) make up the most common classes of employment.
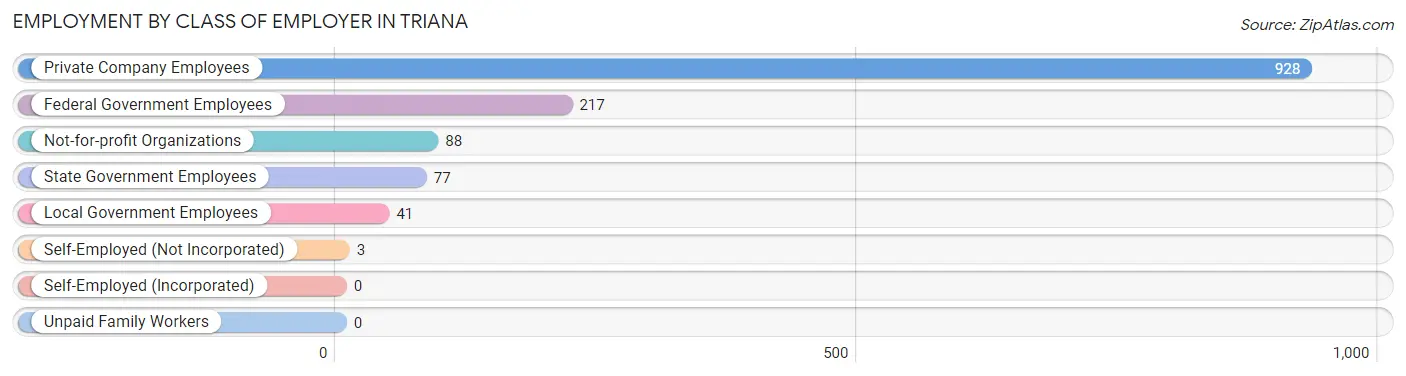
| Employer Class | # Employees | % Employees |
| Private Company Employees | 928 | 68.5% |
| Self-Employed (Incorporated) | 0 | 0.0% |
| Self-Employed (Not Incorporated) | 3 | 0.2% |
| Not-for-profit Organizations | 88 | 6.5% |
| Local Government Employees | 41 | 3.0% |
| State Government Employees | 77 | 5.7% |
| Federal Government Employees | 217 | 16.0% |
| Unpaid Family Workers | 0 | 0.0% |
| Total | 1,354 | 100.0% |
Employment Status by Age in Triana
According to the labor force statistics for Triana, out of the total population over 16 years of age (2,332), 70.0% or 1,632 individuals are in the labor force, with 12.2% or 199 of them unemployed. The age group with the highest labor force participation rate is 25 to 29 years, with 96.7% or 264 individuals in the labor force. Within the labor force, the 16 to 19 years age range has the highest percentage of unemployed individuals, with 22.0% or 9 of them being unemployed.
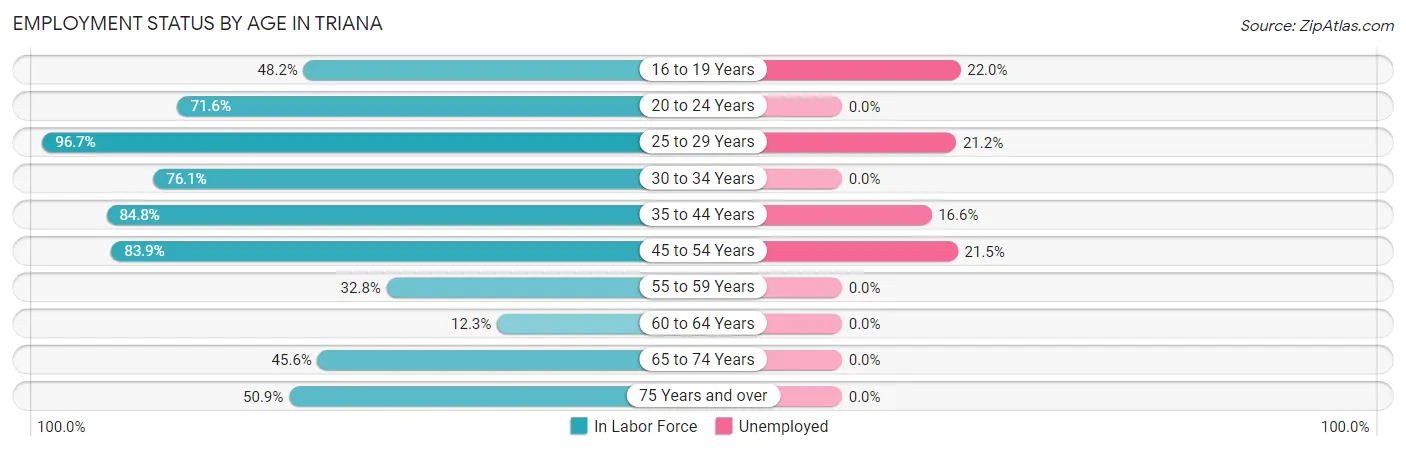
| Age Bracket | In Labor Force | Unemployed |
| 16 to 19 Years | 41 (48.2%) | 9 (22.0%) |
| 20 to 24 Years | 48 (71.6%) | 0 (0.0%) |
| 25 to 29 Years | 264 (96.7%) | 56 (21.2%) |
| 30 to 34 Years | 302 (76.1%) | 0 (0.0%) |
| 35 to 44 Years | 428 (84.8%) | 71 (16.6%) |
| 45 to 54 Years | 297 (83.9%) | 64 (21.5%) |
| 55 to 59 Years | 79 (32.8%) | 0 (0.0%) |
| 60 to 64 Years | 8 (12.3%) | 0 (0.0%) |
| 65 to 74 Years | 83 (45.6%) | 0 (0.0%) |
| 75 Years and over | 83 (50.9%) | 0 (0.0%) |
| Total | 1,632 (70.0%) | 199 (12.2%) |
Employment Status by Educational Attainment in Triana
According to labor force statistics for Triana, 75.1% of individuals (1,378) out of the total population between 25 and 64 years of age (1,835) are in the labor force, with 13.9% or 192 of them being unemployed. The group with the highest labor force participation rate are those with the educational attainment of bachelor's degree or higher, with 88.2% or 708 individuals in the labor force. Within the labor force, individuals with high school diploma education have the highest percentage of unemployment, with 33.0% or 125 of them being unemployed.
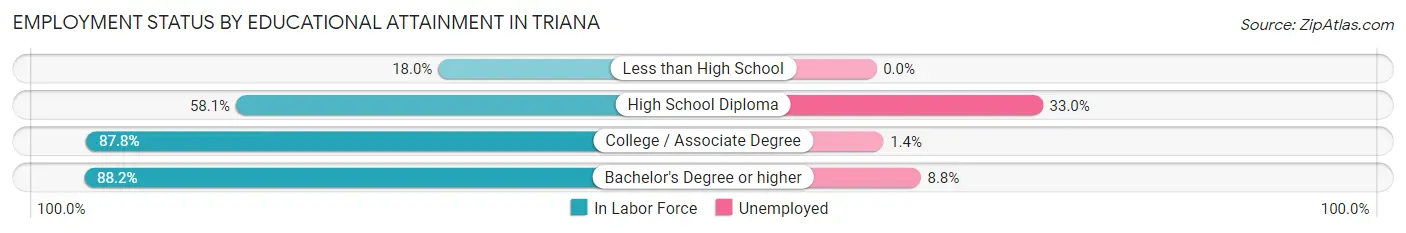
| Educational Attainment | In Labor Force | Unemployed |
| Less than High School | 11 (18.0%) | 0 (0.0%) |
| High School Diploma | 379 (58.1%) | 215 (33.0%) |
| College / Associate Degree | 280 (87.8%) | 4 (1.4%) |
| Bachelor's Degree or higher | 708 (88.2%) | 71 (8.8%) |
| Total | 1,378 (75.1%) | 255 (13.9%) |
Employment Occupations by Sex in Triana
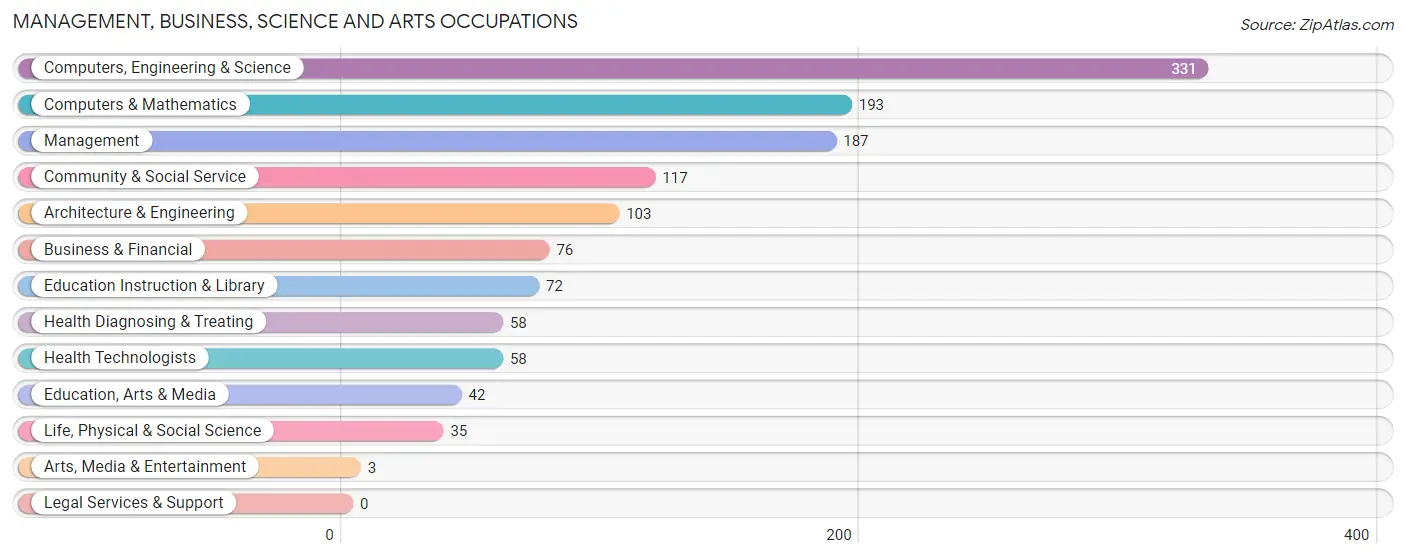
Management, Business, Science and Arts Occupations
The most common Management, Business, Science and Arts occupations in Triana are Computers, Engineering & Science (331 | 23.1%), Computers & Mathematics (193 | 13.5%), Management (187 | 13.1%), Community & Social Service (117 | 8.2%), and Architecture & Engineering (103 | 7.2%).
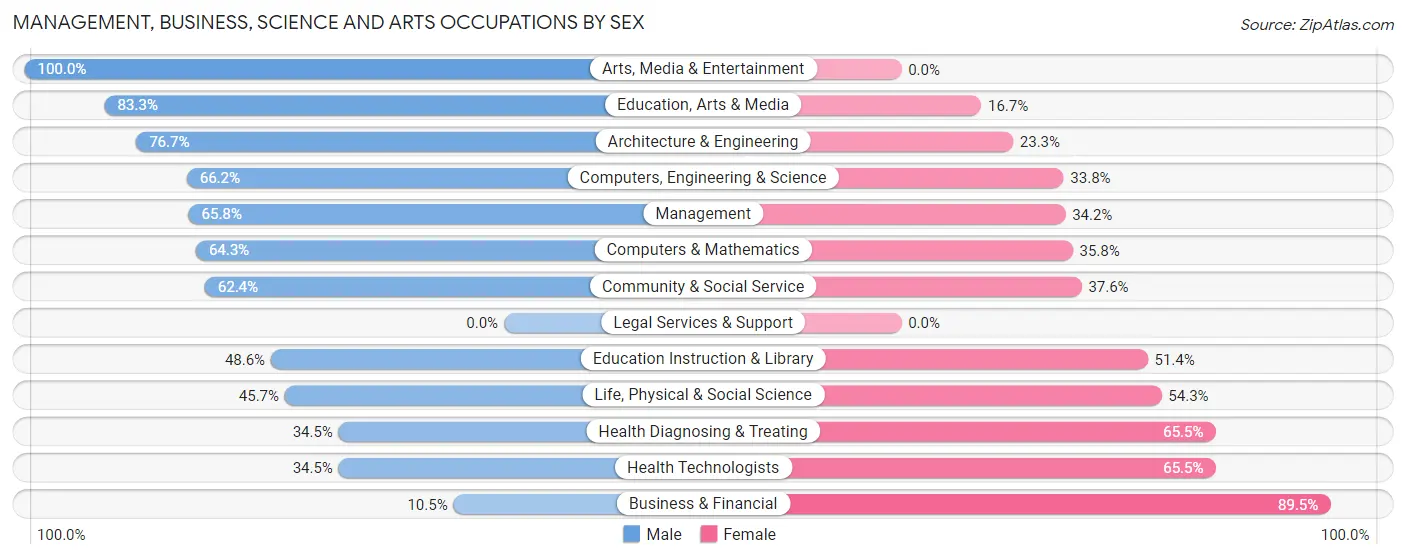
Management, Business, Science and Arts Occupations by Sex
Within the Management, Business, Science and Arts occupations in Triana, the most male-oriented occupations are Arts, Media & Entertainment (100.0%), Education, Arts & Media (83.3%), and Architecture & Engineering (76.7%), while the most female-oriented occupations are Business & Financial (89.5%), Health Diagnosing & Treating (65.5%), and Health Technologists (65.5%).
| Occupation | Male | Female |
| Management | 123 (65.8%) | 64 (34.2%) |
| Business & Financial | 8 (10.5%) | 68 (89.5%) |
| Computers, Engineering & Science | 219 (66.2%) | 112 (33.8%) |
| Computers & Mathematics | 124 (64.2%) | 69 (35.7%) |
| Architecture & Engineering | 79 (76.7%) | 24 (23.3%) |
| Life, Physical & Social Science | 16 (45.7%) | 19 (54.3%) |
| Community & Social Service | 73 (62.4%) | 44 (37.6%) |
| Education, Arts & Media | 35 (83.3%) | 7 (16.7%) |
| Legal Services & Support | 0 (0.0%) | 0 (0.0%) |
| Education Instruction & Library | 35 (48.6%) | 37 (51.4%) |
| Arts, Media & Entertainment | 3 (100.0%) | 0 (0.0%) |
| Health Diagnosing & Treating | 20 (34.5%) | 38 (65.5%) |
| Health Technologists | 20 (34.5%) | 38 (65.5%) |
| Total (Category) | 443 (57.6%) | 326 (42.4%) |
| Total (Overall) | 823 (57.4%) | 610 (42.6%) |
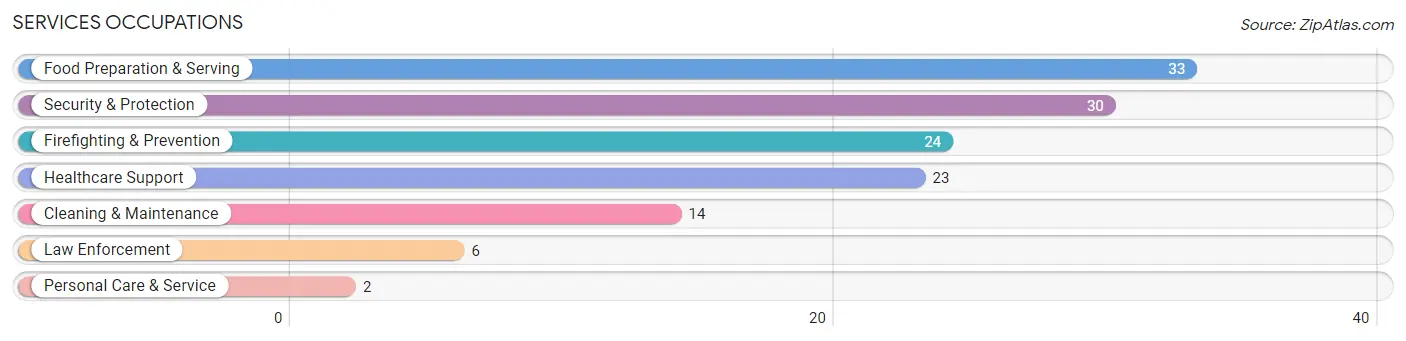
Services Occupations
The most common Services occupations in Triana are Food Preparation & Serving (33 | 2.3%), Security & Protection (30 | 2.1%), Firefighting & Prevention (24 | 1.7%), Healthcare Support (23 | 1.6%), and Cleaning & Maintenance (14 | 1.0%).
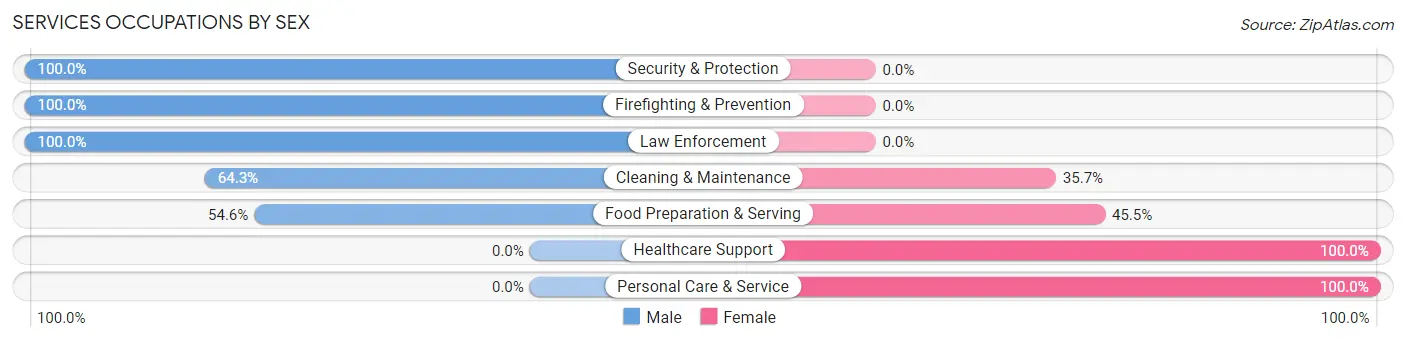
Services Occupations by Sex
Within the Services occupations in Triana, the most male-oriented occupations are Security & Protection (100.0%), Firefighting & Prevention (100.0%), and Law Enforcement (100.0%), while the most female-oriented occupations are Healthcare Support (100.0%), Personal Care & Service (100.0%), and Food Preparation & Serving (45.5%).
| Occupation | Male | Female |
| Healthcare Support | 0 (0.0%) | 23 (100.0%) |
| Security & Protection | 30 (100.0%) | 0 (0.0%) |
| Firefighting & Prevention | 24 (100.0%) | 0 (0.0%) |
| Law Enforcement | 6 (100.0%) | 0 (0.0%) |
| Food Preparation & Serving | 18 (54.5%) | 15 (45.5%) |
| Cleaning & Maintenance | 9 (64.3%) | 5 (35.7%) |
| Personal Care & Service | 0 (0.0%) | 2 (100.0%) |
| Total (Category) | 57 (55.9%) | 45 (44.1%) |
| Total (Overall) | 823 (57.4%) | 610 (42.6%) |
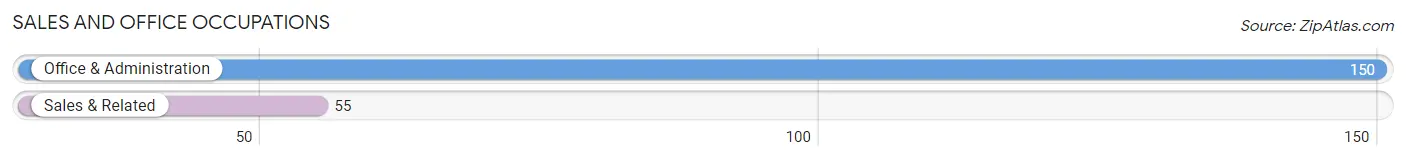
Sales and Office Occupations
The most common Sales and Office occupations in Triana are Office & Administration (150 | 10.5%), and Sales & Related (55 | 3.8%).
Sales and Office Occupations by Sex
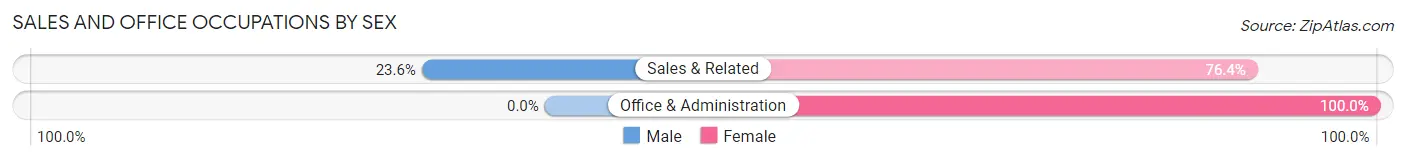
| Occupation | Male | Female |
| Sales & Related | 13 (23.6%) | 42 (76.4%) |
| Office & Administration | 0 (0.0%) | 150 (100.0%) |
| Total (Category) | 13 (6.3%) | 192 (93.7%) |
| Total (Overall) | 823 (57.4%) | 610 (42.6%) |
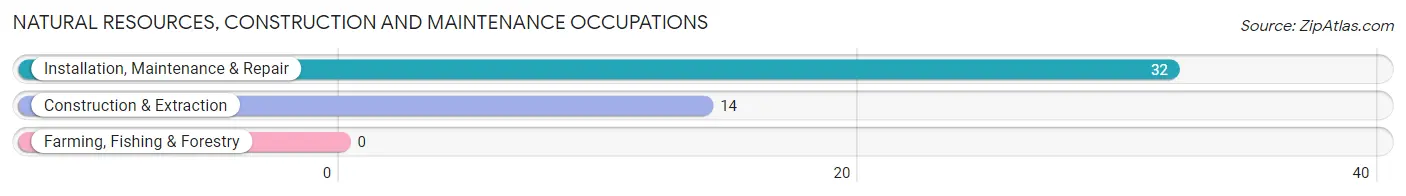
Natural Resources, Construction and Maintenance Occupations
The most common Natural Resources, Construction and Maintenance occupations in Triana are Installation, Maintenance & Repair (32 | 2.2%), and Construction & Extraction (14 | 1.0%).
Natural Resources, Construction and Maintenance Occupations by Sex
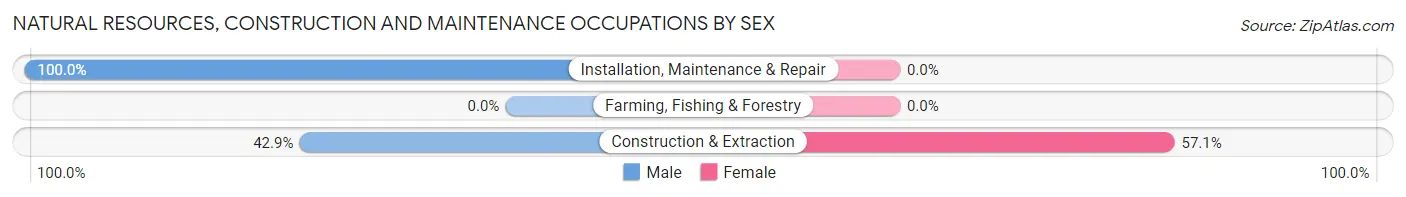
| Occupation | Male | Female |
| Farming, Fishing & Forestry | 0 (0.0%) | 0 (0.0%) |
| Construction & Extraction | 6 (42.9%) | 8 (57.1%) |
| Installation, Maintenance & Repair | 32 (100.0%) | 0 (0.0%) |
| Total (Category) | 38 (82.6%) | 8 (17.4%) |
| Total (Overall) | 823 (57.4%) | 610 (42.6%) |
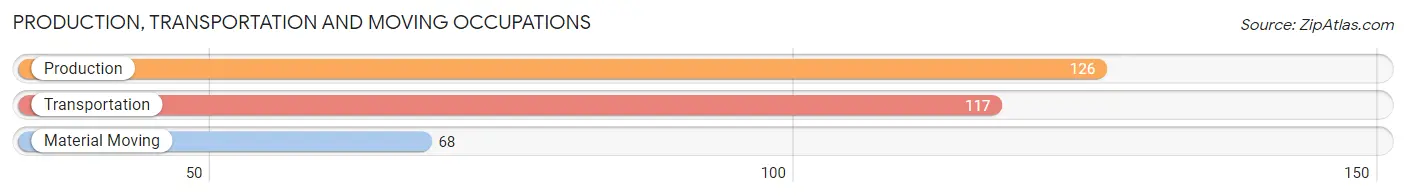
Production, Transportation and Moving Occupations
The most common Production, Transportation and Moving occupations in Triana are Production (126 | 8.8%), Transportation (117 | 8.2%), and Material Moving (68 | 4.8%).
Production, Transportation and Moving Occupations by Sex
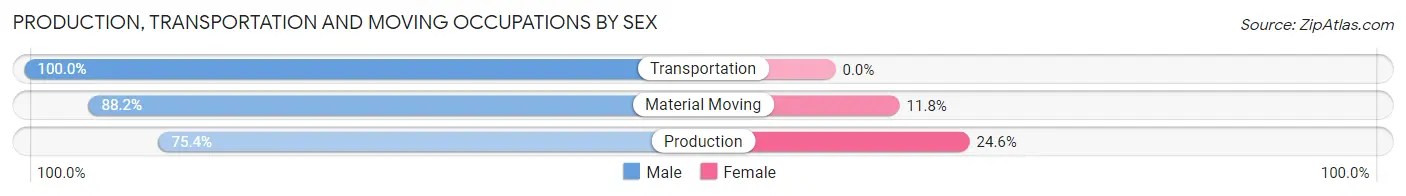
| Occupation | Male | Female |
| Production | 95 (75.4%) | 31 (24.6%) |
| Transportation | 117 (100.0%) | 0 (0.0%) |
| Material Moving | 60 (88.2%) | 8 (11.8%) |
| Total (Category) | 272 (87.5%) | 39 (12.5%) |
| Total (Overall) | 823 (57.4%) | 610 (42.6%) |
Employment Industries by Sex in Triana
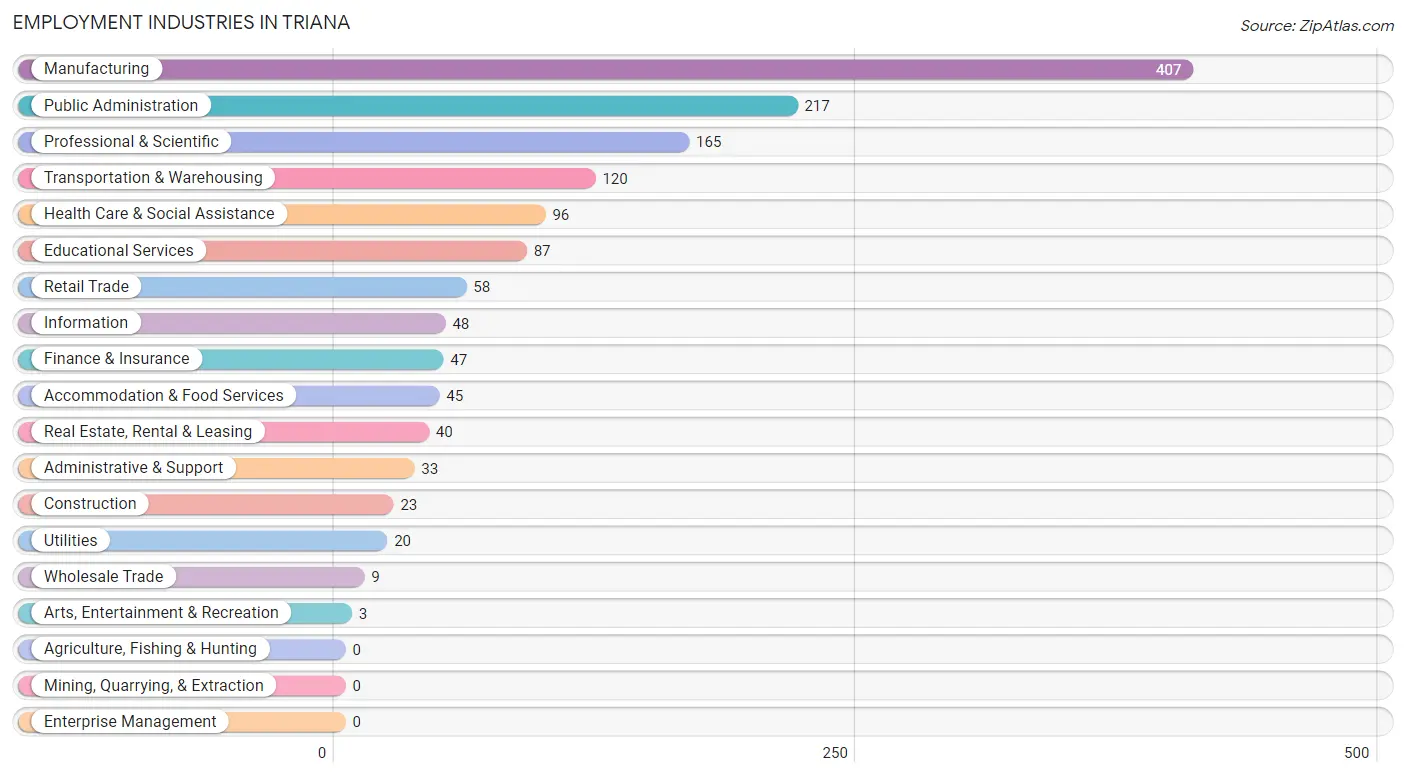
Employment Industries in Triana
The major employment industries in Triana include Manufacturing (407 | 28.4%), Public Administration (217 | 15.1%), Professional & Scientific (165 | 11.5%), Transportation & Warehousing (120 | 8.4%), and Health Care & Social Assistance (96 | 6.7%).
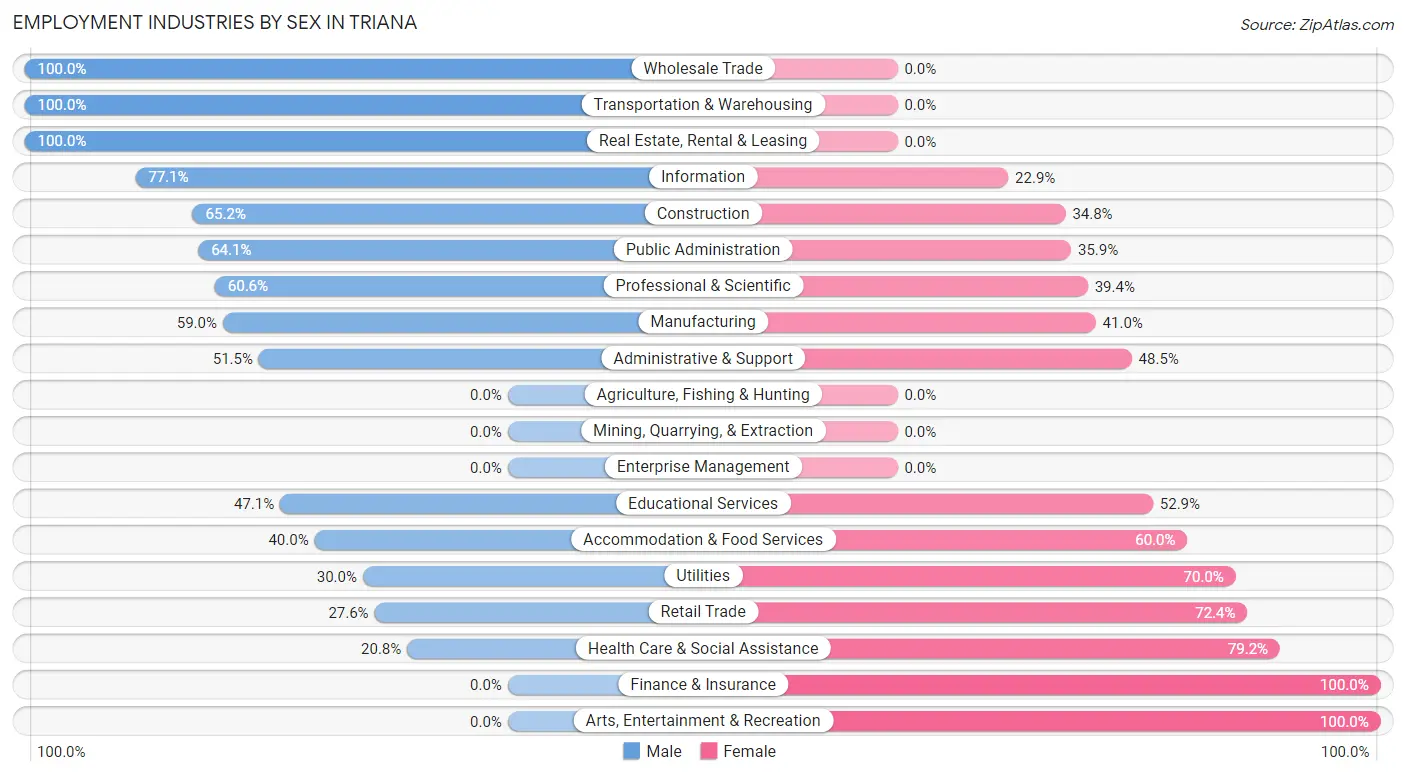
Employment Industries by Sex in Triana
The Triana industries that see more men than women are Wholesale Trade (100.0%), Transportation & Warehousing (100.0%), and Real Estate, Rental & Leasing (100.0%), whereas the industries that tend to have a higher number of women are Finance & Insurance (100.0%), Arts, Entertainment & Recreation (100.0%), and Health Care & Social Assistance (79.2%).
| Industry | Male | Female |
| Agriculture, Fishing & Hunting | 0 (0.0%) | 0 (0.0%) |
| Mining, Quarrying, & Extraction | 0 (0.0%) | 0 (0.0%) |
| Construction | 15 (65.2%) | 8 (34.8%) |
| Manufacturing | 240 (59.0%) | 167 (41.0%) |
| Wholesale Trade | 9 (100.0%) | 0 (0.0%) |
| Retail Trade | 16 (27.6%) | 42 (72.4%) |
| Transportation & Warehousing | 120 (100.0%) | 0 (0.0%) |
| Utilities | 6 (30.0%) | 14 (70.0%) |
| Information | 37 (77.1%) | 11 (22.9%) |
| Finance & Insurance | 0 (0.0%) | 47 (100.0%) |
| Real Estate, Rental & Leasing | 40 (100.0%) | 0 (0.0%) |
| Professional & Scientific | 100 (60.6%) | 65 (39.4%) |
| Enterprise Management | 0 (0.0%) | 0 (0.0%) |
| Administrative & Support | 17 (51.5%) | 16 (48.5%) |
| Educational Services | 41 (47.1%) | 46 (52.9%) |
| Health Care & Social Assistance | 20 (20.8%) | 76 (79.2%) |
| Arts, Entertainment & Recreation | 0 (0.0%) | 3 (100.0%) |
| Accommodation & Food Services | 18 (40.0%) | 27 (60.0%) |
| Public Administration | 139 (64.1%) | 78 (35.9%) |
| Total | 823 (57.4%) | 610 (42.6%) |
Education in Triana
School Enrollment in Triana
The most common levels of schooling among the 764 students in Triana are elementary school (184 | 24.1%), college / undergraduate (138 | 18.1%), and middle school (133 | 17.4%).
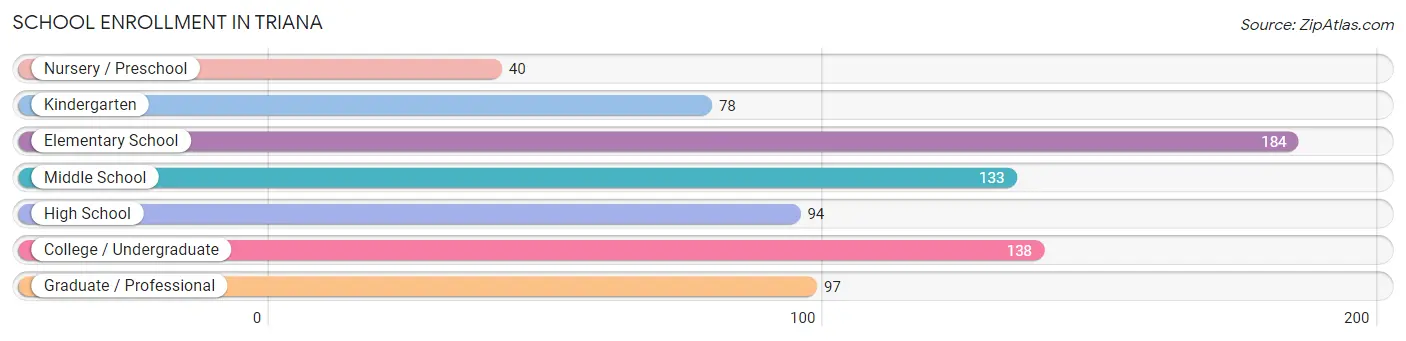
| School Level | # Students | % Students |
| Nursery / Preschool | 40 | 5.2% |
| Kindergarten | 78 | 10.2% |
| Elementary School | 184 | 24.1% |
| Middle School | 133 | 17.4% |
| High School | 94 | 12.3% |
| College / Undergraduate | 138 | 18.1% |
| Graduate / Professional | 97 | 12.7% |
| Total | 764 | 100.0% |
School Enrollment by Age by Funding Source in Triana
Out of a total of 764 students who are enrolled in schools in Triana, 94 (12.3%) attend a private institution, while the remaining 670 (87.7%) are enrolled in public schools. The age group of 3 to 4 year olds has the highest likelihood of being enrolled in private schools, with 26 (83.9% in the age bracket) enrolled. Conversely, the age group of 10 to 14 year olds has the lowest likelihood of being enrolled in a private school, with 128 (100.0% in the age bracket) attending a public institution.
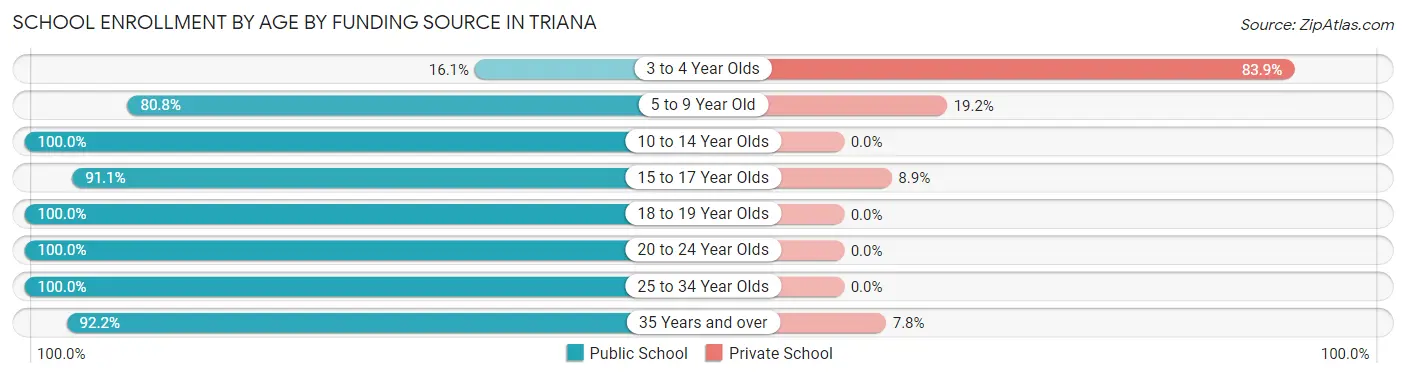
| Age Bracket | Public School | Private School |
| 3 to 4 Year Olds | 5 (16.1%) | 26 (83.9%) |
| 5 to 9 Year Old | 219 (80.8%) | 52 (19.2%) |
| 10 to 14 Year Olds | 128 (100.0%) | 0 (0.0%) |
| 15 to 17 Year Olds | 82 (91.1%) | 8 (8.9%) |
| 18 to 19 Year Olds | 9 (100.0%) | 0 (0.0%) |
| 20 to 24 Year Olds | 36 (100.0%) | 0 (0.0%) |
| 25 to 34 Year Olds | 97 (100.0%) | 0 (0.0%) |
| 35 Years and over | 94 (92.2%) | 8 (7.8%) |
| Total | 670 (87.7%) | 94 (12.3%) |
Educational Attainment by Field of Study in Triana
Business (300 | 33.3%), engineering (186 | 20.6%), computers & mathematics (143 | 15.9%), science & technology (61 | 6.8%), and bio, nature & agricultural (49 | 5.4%) are the most common fields of study among 902 individuals in Triana who have obtained a bachelor's degree or higher.
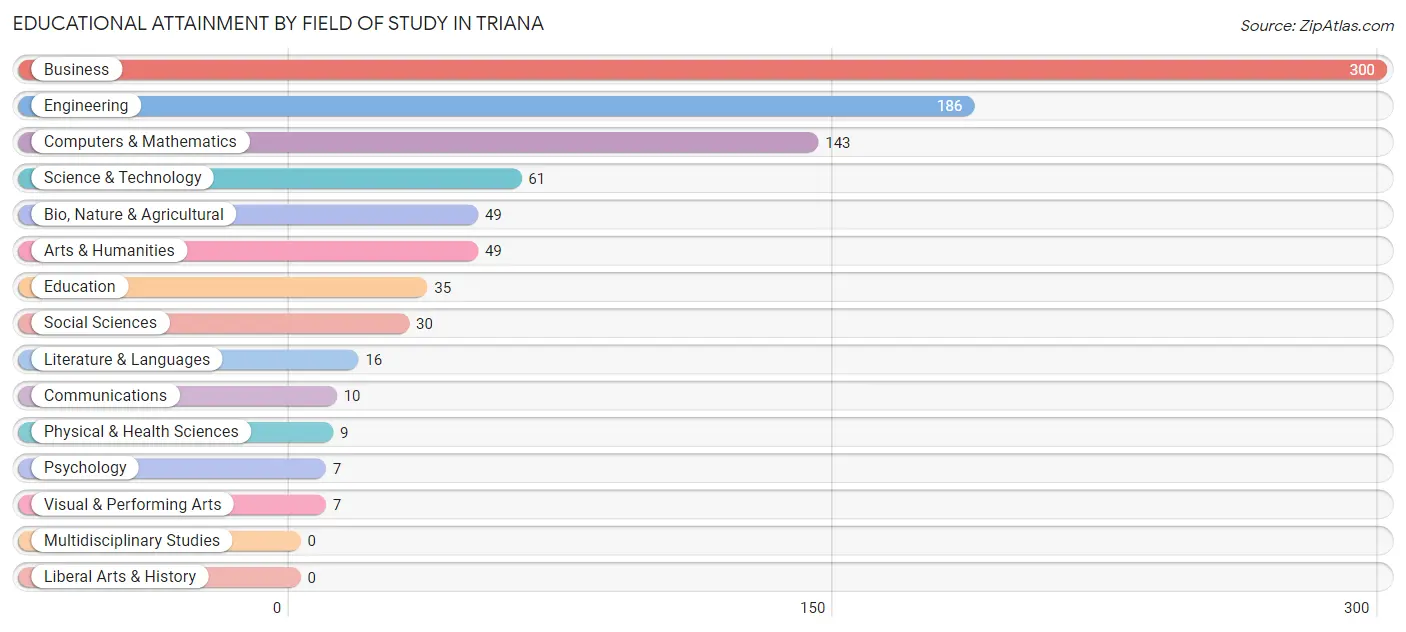
| Field of Study | # Graduates | % Graduates |
| Computers & Mathematics | 143 | 15.9% |
| Bio, Nature & Agricultural | 49 | 5.4% |
| Physical & Health Sciences | 9 | 1.0% |
| Psychology | 7 | 0.8% |
| Social Sciences | 30 | 3.3% |
| Engineering | 186 | 20.6% |
| Multidisciplinary Studies | 0 | 0.0% |
| Science & Technology | 61 | 6.8% |
| Business | 300 | 33.3% |
| Education | 35 | 3.9% |
| Literature & Languages | 16 | 1.8% |
| Liberal Arts & History | 0 | 0.0% |
| Visual & Performing Arts | 7 | 0.8% |
| Communications | 10 | 1.1% |
| Arts & Humanities | 49 | 5.4% |
| Total | 902 | 100.0% |
Transportation & Commute in Triana
Vehicle Availability by Sex in Triana
The most prevalent vehicle ownership categories in Triana are males with 2 vehicles (438, accounting for 58.9%) and females with 2 vehicles (329, making up 71.8%).
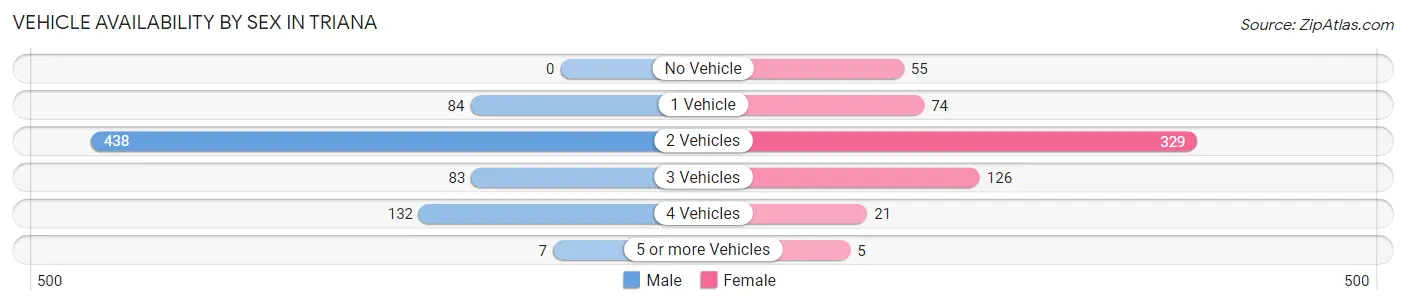
| Vehicles Available | Male | Female |
| No Vehicle | 0 (0.0%) | 55 (9.0%) |
| 1 Vehicle | 84 (11.3%) | 74 (12.1%) |
| 2 Vehicles | 438 (58.9%) | 329 (53.9%) |
| 3 Vehicles | 83 (11.2%) | 126 (20.7%) |
| 4 Vehicles | 132 (17.7%) | 21 (3.4%) |
| 5 or more Vehicles | 7 (0.9%) | 5 (0.8%) |
| Total | 744 (100.0%) | 610 (100.0%) |
Commute Time in Triana
The most frequently occuring commute durations in Triana are 15 to 19 minutes (372 commuters, 32.0%), 30 to 34 minutes (184 commuters, 15.9%), and 20 to 24 minutes (172 commuters, 14.8%).
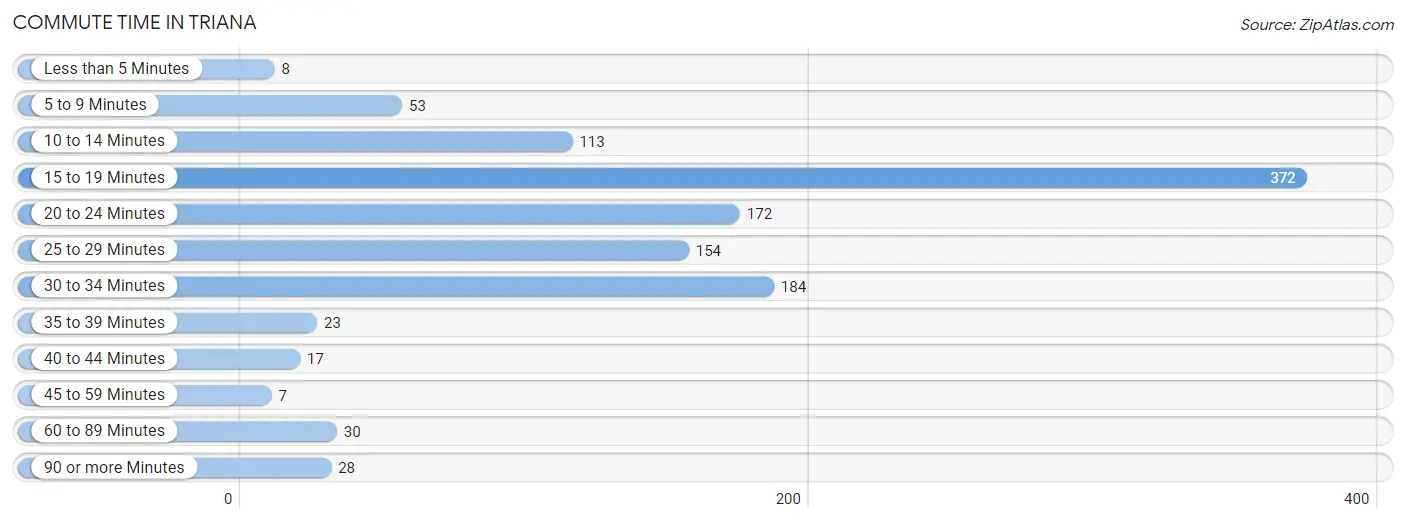
| Commute Time | # Commuters | % Commuters |
| Less than 5 Minutes | 8 | 0.7% |
| 5 to 9 Minutes | 53 | 4.6% |
| 10 to 14 Minutes | 113 | 9.7% |
| 15 to 19 Minutes | 372 | 32.0% |
| 20 to 24 Minutes | 172 | 14.8% |
| 25 to 29 Minutes | 154 | 13.3% |
| 30 to 34 Minutes | 184 | 15.9% |
| 35 to 39 Minutes | 23 | 2.0% |
| 40 to 44 Minutes | 17 | 1.5% |
| 45 to 59 Minutes | 7 | 0.6% |
| 60 to 89 Minutes | 30 | 2.6% |
| 90 or more Minutes | 28 | 2.4% |
Commute Time by Sex in Triana
The most common commute times in Triana are 15 to 19 minutes (245 commuters, 35.7%) for males and 15 to 19 minutes (127 commuters, 26.8%) for females.
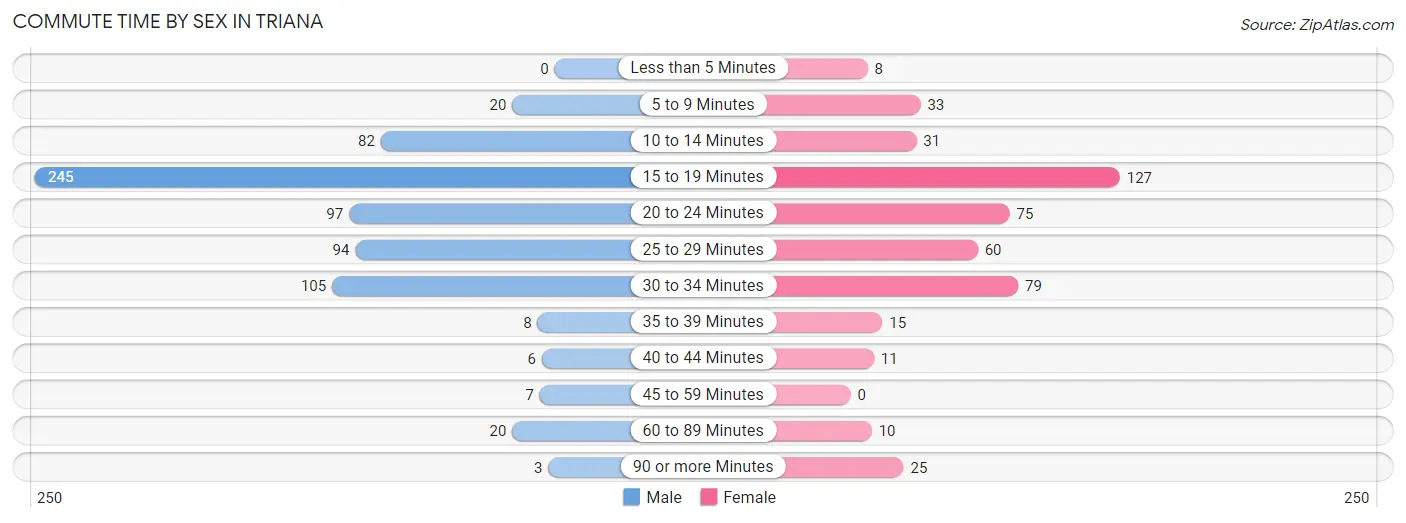
| Commute Time | Male | Female |
| Less than 5 Minutes | 0 (0.0%) | 8 (1.7%) |
| 5 to 9 Minutes | 20 (2.9%) | 33 (7.0%) |
| 10 to 14 Minutes | 82 (11.9%) | 31 (6.5%) |
| 15 to 19 Minutes | 245 (35.7%) | 127 (26.8%) |
| 20 to 24 Minutes | 97 (14.1%) | 75 (15.8%) |
| 25 to 29 Minutes | 94 (13.7%) | 60 (12.7%) |
| 30 to 34 Minutes | 105 (15.3%) | 79 (16.7%) |
| 35 to 39 Minutes | 8 (1.2%) | 15 (3.2%) |
| 40 to 44 Minutes | 6 (0.9%) | 11 (2.3%) |
| 45 to 59 Minutes | 7 (1.0%) | 0 (0.0%) |
| 60 to 89 Minutes | 20 (2.9%) | 10 (2.1%) |
| 90 or more Minutes | 3 (0.4%) | 25 (5.3%) |
Time of Departure to Work by Sex in Triana
The most frequent times of departure to work in Triana are 6:30 AM to 6:59 AM (190, 27.7%) for males and 5:00 AM to 5:29 AM (109, 23.0%) for females.
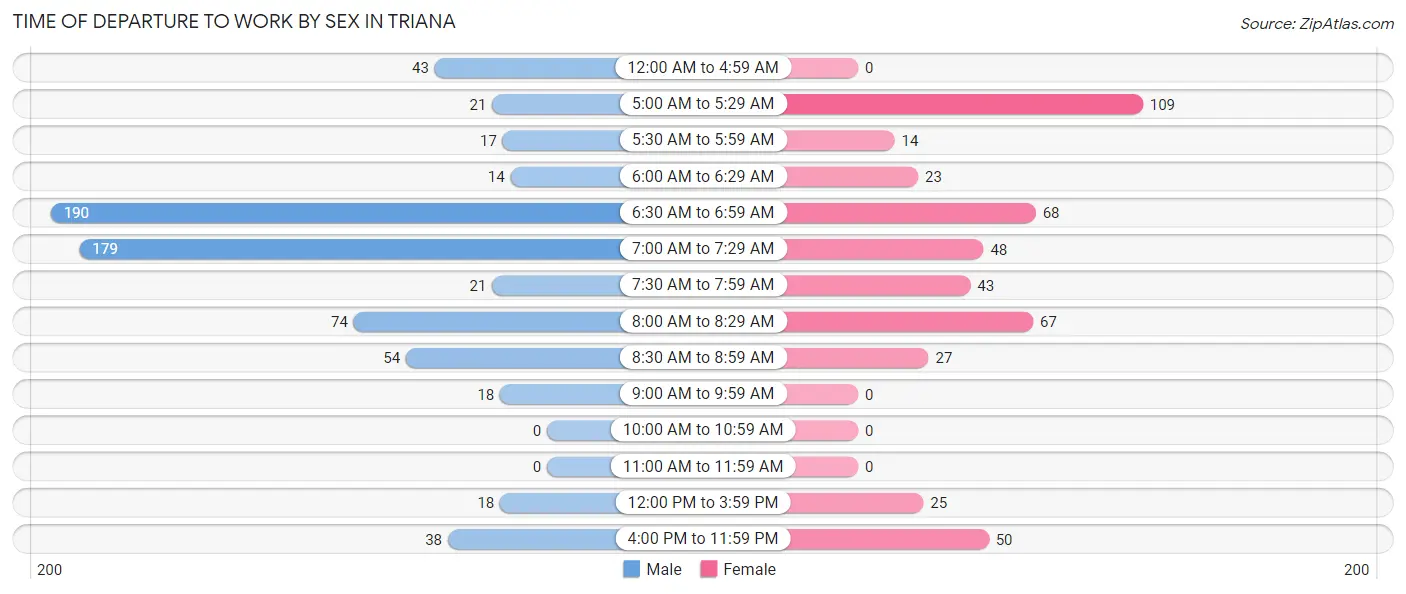
| Time of Departure | Male | Female |
| 12:00 AM to 4:59 AM | 43 (6.3%) | 0 (0.0%) |
| 5:00 AM to 5:29 AM | 21 (3.1%) | 109 (23.0%) |
| 5:30 AM to 5:59 AM | 17 (2.5%) | 14 (2.9%) |
| 6:00 AM to 6:29 AM | 14 (2.0%) | 23 (4.9%) |
| 6:30 AM to 6:59 AM | 190 (27.7%) | 68 (14.3%) |
| 7:00 AM to 7:29 AM | 179 (26.1%) | 48 (10.1%) |
| 7:30 AM to 7:59 AM | 21 (3.1%) | 43 (9.1%) |
| 8:00 AM to 8:29 AM | 74 (10.8%) | 67 (14.1%) |
| 8:30 AM to 8:59 AM | 54 (7.9%) | 27 (5.7%) |
| 9:00 AM to 9:59 AM | 18 (2.6%) | 0 (0.0%) |
| 10:00 AM to 10:59 AM | 0 (0.0%) | 0 (0.0%) |
| 11:00 AM to 11:59 AM | 0 (0.0%) | 0 (0.0%) |
| 12:00 PM to 3:59 PM | 18 (2.6%) | 25 (5.3%) |
| 4:00 PM to 11:59 PM | 38 (5.5%) | 50 (10.5%) |
| Total | 687 (100.0%) | 474 (100.0%) |
Housing Occupancy in Triana
Occupancy by Ownership in Triana
Of the total 1,189 dwellings in Triana, owner-occupied units account for 895 (75.3%), while renter-occupied units make up 294 (24.7%).
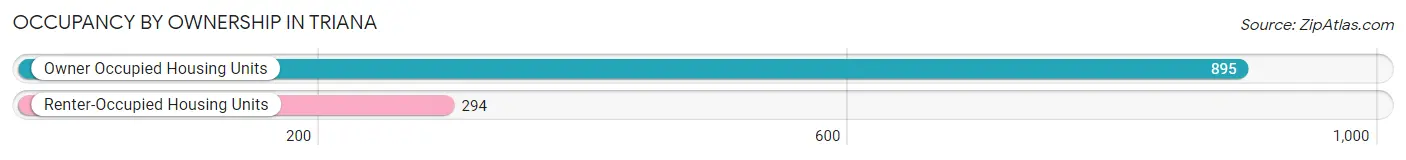
| Occupancy | # Housing Units | % Housing Units |
| Owner Occupied Housing Units | 895 | 75.3% |
| Renter-Occupied Housing Units | 294 | 24.7% |
| Total Occupied Housing Units | 1,189 | 100.0% |
Occupancy by Household Size in Triana
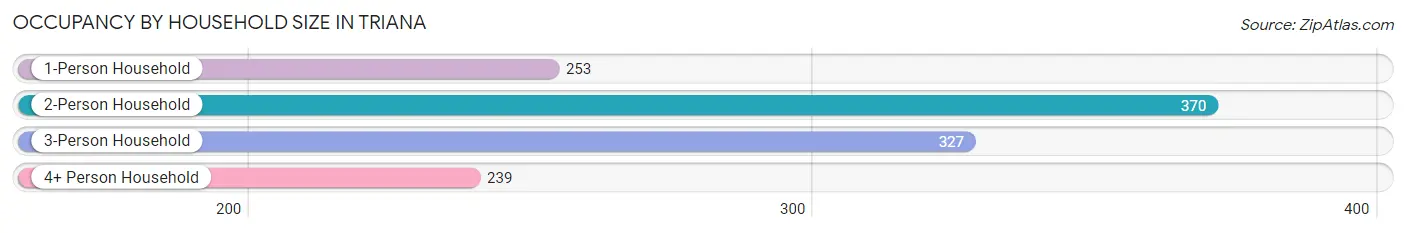
| Household Size | # Housing Units | % Housing Units |
| 1-Person Household | 253 | 21.3% |
| 2-Person Household | 370 | 31.1% |
| 3-Person Household | 327 | 27.5% |
| 4+ Person Household | 239 | 20.1% |
| Total Housing Units | 1,189 | 100.0% |
Occupancy by Ownership by Household Size in Triana
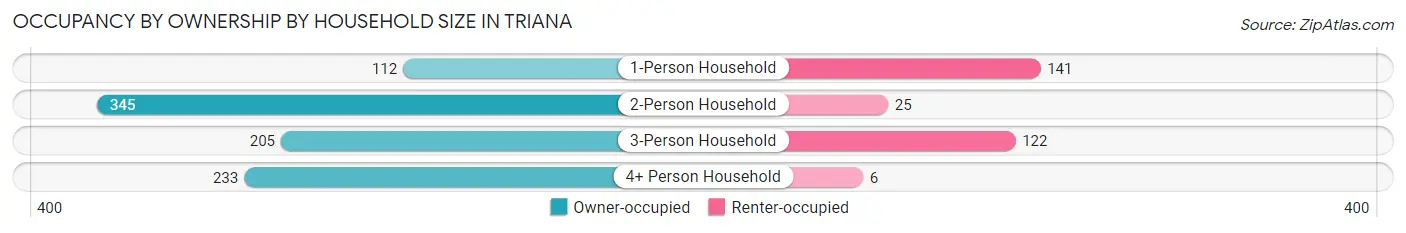
| Household Size | Owner-occupied | Renter-occupied |
| 1-Person Household | 112 (44.3%) | 141 (55.7%) |
| 2-Person Household | 345 (93.2%) | 25 (6.8%) |
| 3-Person Household | 205 (62.7%) | 122 (37.3%) |
| 4+ Person Household | 233 (97.5%) | 6 (2.5%) |
| Total Housing Units | 895 (75.3%) | 294 (24.7%) |
Occupancy by Educational Attainment in Triana
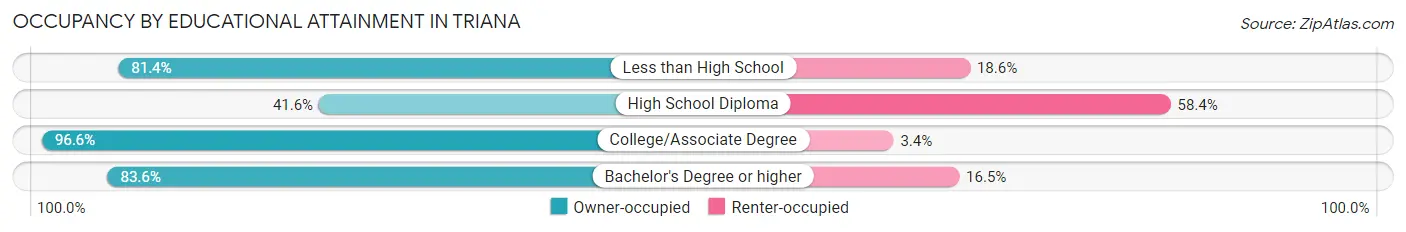
| Household Size | Owner-occupied | Renter-occupied |
| Less than High School | 35 (81.4%) | 8 (18.6%) |
| High School Diploma | 127 (41.6%) | 178 (58.4%) |
| College/Associate Degree | 225 (96.6%) | 8 (3.4%) |
| Bachelor's Degree or higher | 508 (83.6%) | 100 (16.5%) |
Occupancy by Age of Householder in Triana
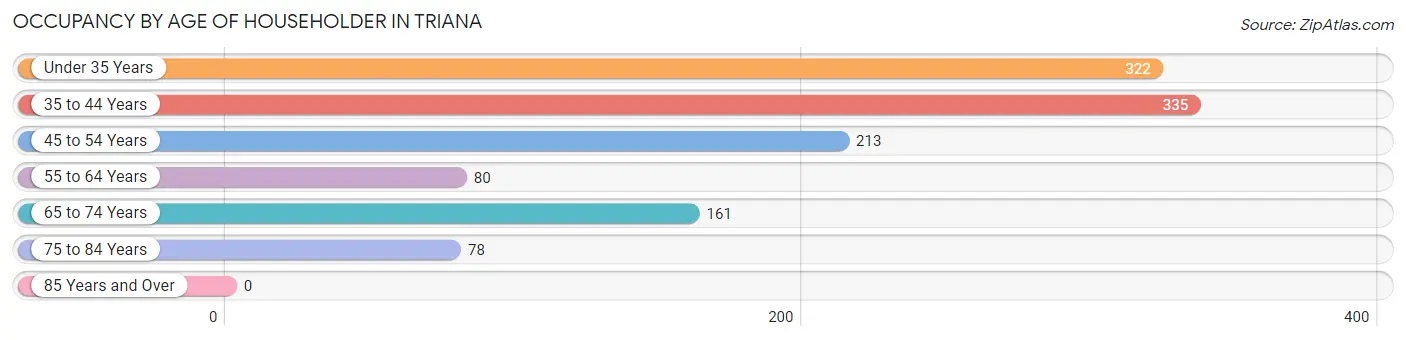
| Age Bracket | # Households | % Households |
| Under 35 Years | 322 | 27.1% |
| 35 to 44 Years | 335 | 28.2% |
| 45 to 54 Years | 213 | 17.9% |
| 55 to 64 Years | 80 | 6.7% |
| 65 to 74 Years | 161 | 13.5% |
| 75 to 84 Years | 78 | 6.6% |
| 85 Years and Over | 0 | 0.0% |
| Total | 1,189 | 100.0% |
Housing Finances in Triana
Median Income by Occupancy in Triana
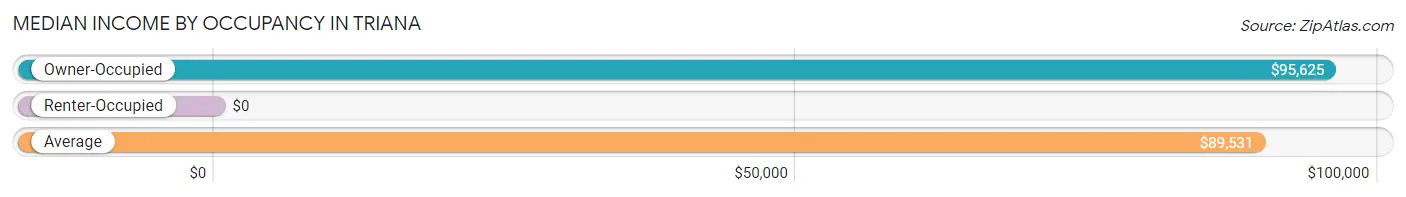
| Occupancy Type | # Households | Median Income |
| Owner-Occupied | 895 (75.3%) | $95,625 |
| Renter-Occupied | 294 (24.7%) | $0 |
| Average | 1,189 (100.0%) | $89,531 |
Occupancy by Householder Income Bracket in Triana
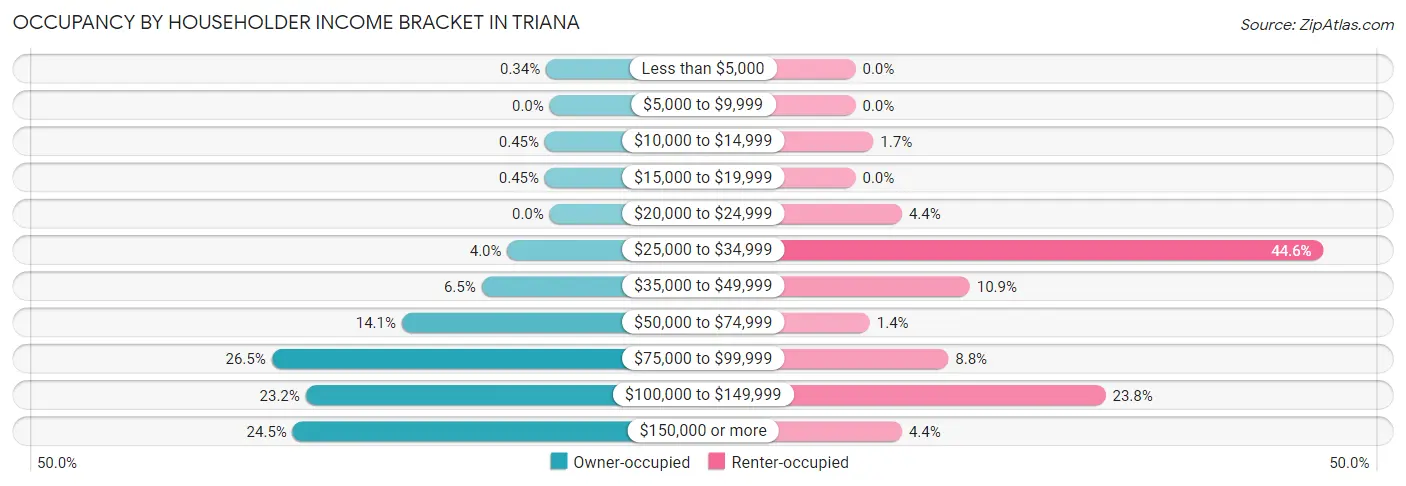
| Income Bracket | Owner-occupied | Renter-occupied |
| Less than $5,000 | 3 (0.3%) | 0 (0.0%) |
| $5,000 to $9,999 | 0 (0.0%) | 0 (0.0%) |
| $10,000 to $14,999 | 4 (0.4%) | 5 (1.7%) |
| $15,000 to $19,999 | 4 (0.4%) | 0 (0.0%) |
| $20,000 to $24,999 | 0 (0.0%) | 13 (4.4%) |
| $25,000 to $34,999 | 36 (4.0%) | 131 (44.6%) |
| $35,000 to $49,999 | 58 (6.5%) | 32 (10.9%) |
| $50,000 to $74,999 | 126 (14.1%) | 4 (1.4%) |
| $75,000 to $99,999 | 237 (26.5%) | 26 (8.8%) |
| $100,000 to $149,999 | 208 (23.2%) | 70 (23.8%) |
| $150,000 or more | 219 (24.5%) | 13 (4.4%) |
| Total | 895 (100.0%) | 294 (100.0%) |
Monthly Housing Cost Tiers in Triana
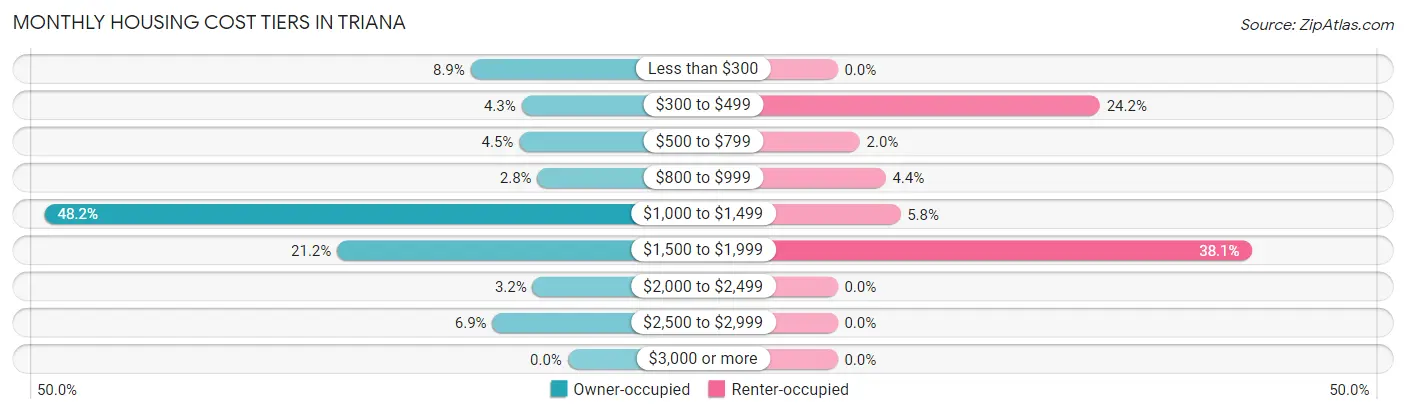
| Monthly Cost | Owner-occupied | Renter-occupied |
| Less than $300 | 80 (8.9%) | 0 (0.0%) |
| $300 to $499 | 38 (4.3%) | 71 (24.1%) |
| $500 to $799 | 40 (4.5%) | 6 (2.0%) |
| $800 to $999 | 25 (2.8%) | 13 (4.4%) |
| $1,000 to $1,499 | 431 (48.2%) | 17 (5.8%) |
| $1,500 to $1,999 | 190 (21.2%) | 112 (38.1%) |
| $2,000 to $2,499 | 29 (3.2%) | 0 (0.0%) |
| $2,500 to $2,999 | 62 (6.9%) | 0 (0.0%) |
| $3,000 or more | 0 (0.0%) | 0 (0.0%) |
| Total | 895 (100.0%) | 294 (100.0%) |
Physical Housing Characteristics in Triana
Housing Structures in Triana
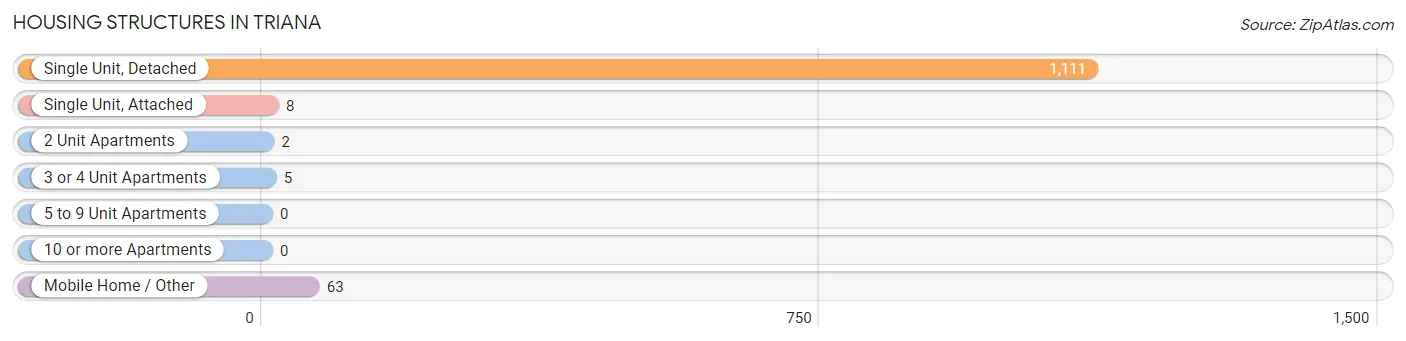
| Structure Type | # Housing Units | % Housing Units |
| Single Unit, Detached | 1,111 | 93.4% |
| Single Unit, Attached | 8 | 0.7% |
| 2 Unit Apartments | 2 | 0.2% |
| 3 or 4 Unit Apartments | 5 | 0.4% |
| 5 to 9 Unit Apartments | 0 | 0.0% |
| 10 or more Apartments | 0 | 0.0% |
| Mobile Home / Other | 63 | 5.3% |
| Total | 1,189 | 100.0% |
Housing Structures by Occupancy in Triana
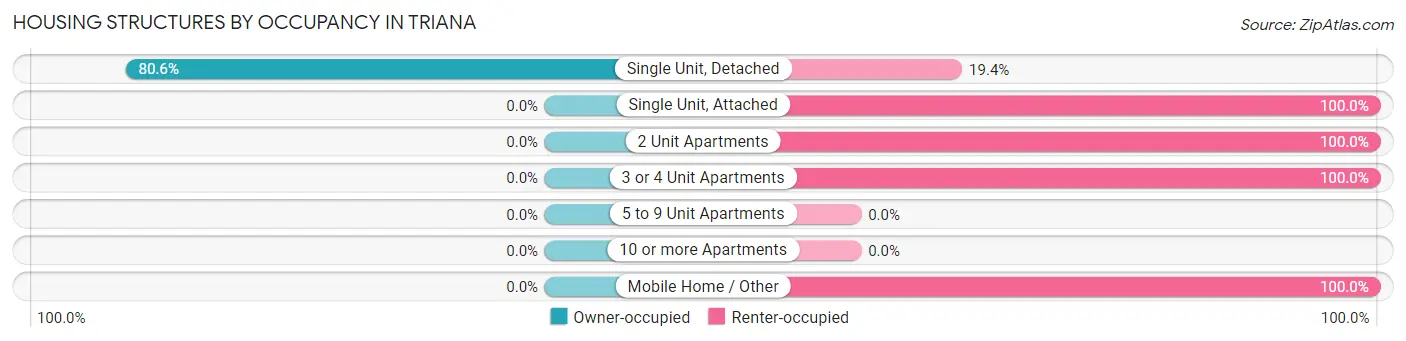
| Structure Type | Owner-occupied | Renter-occupied |
| Single Unit, Detached | 895 (80.6%) | 216 (19.4%) |
| Single Unit, Attached | 0 (0.0%) | 8 (100.0%) |
| 2 Unit Apartments | 0 (0.0%) | 2 (100.0%) |
| 3 or 4 Unit Apartments | 0 (0.0%) | 5 (100.0%) |
| 5 to 9 Unit Apartments | 0 (0.0%) | 0 (0.0%) |
| 10 or more Apartments | 0 (0.0%) | 0 (0.0%) |
| Mobile Home / Other | 0 (0.0%) | 63 (100.0%) |
| Total | 895 (75.3%) | 294 (24.7%) |
Housing Structures by Number of Rooms in Triana
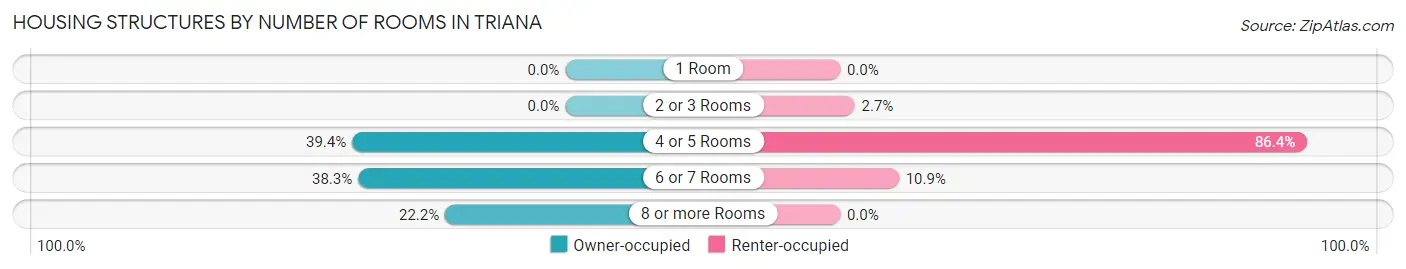
| Number of Rooms | Owner-occupied | Renter-occupied |
| 1 Room | 0 (0.0%) | 0 (0.0%) |
| 2 or 3 Rooms | 0 (0.0%) | 8 (2.7%) |
| 4 or 5 Rooms | 353 (39.4%) | 254 (86.4%) |
| 6 or 7 Rooms | 343 (38.3%) | 32 (10.9%) |
| 8 or more Rooms | 199 (22.2%) | 0 (0.0%) |
| Total | 895 (100.0%) | 294 (100.0%) |
Housing Structure by Heating Type in Triana
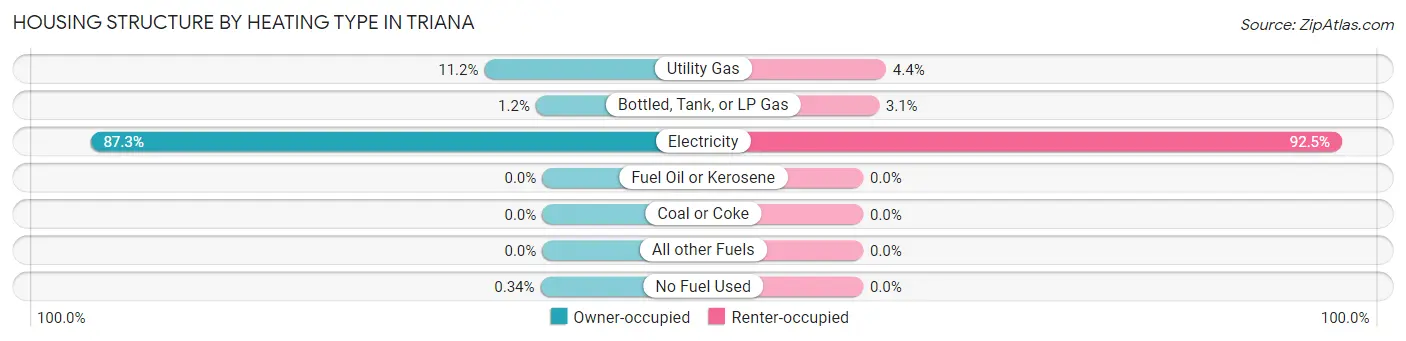
| Heating Type | Owner-occupied | Renter-occupied |
| Utility Gas | 100 (11.2%) | 13 (4.4%) |
| Bottled, Tank, or LP Gas | 11 (1.2%) | 9 (3.1%) |
| Electricity | 781 (87.3%) | 272 (92.5%) |
| Fuel Oil or Kerosene | 0 (0.0%) | 0 (0.0%) |
| Coal or Coke | 0 (0.0%) | 0 (0.0%) |
| All other Fuels | 0 (0.0%) | 0 (0.0%) |
| No Fuel Used | 3 (0.3%) | 0 (0.0%) |
| Total | 895 (100.0%) | 294 (100.0%) |
Household Vehicle Usage in Triana
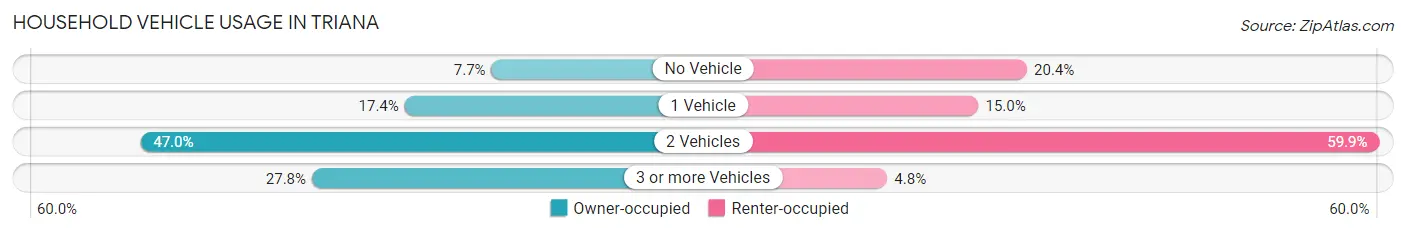
| Vehicles per Household | Owner-occupied | Renter-occupied |
| No Vehicle | 69 (7.7%) | 60 (20.4%) |
| 1 Vehicle | 156 (17.4%) | 44 (15.0%) |
| 2 Vehicles | 421 (47.0%) | 176 (59.9%) |
| 3 or more Vehicles | 249 (27.8%) | 14 (4.8%) |
| Total | 895 (100.0%) | 294 (100.0%) |
Real Estate & Mortgages in Triana
Real Estate and Mortgage Overview in Triana
| Characteristic | Without Mortgage | With Mortgage |
| Housing Units | 125 | 770 |
| Median Property Value | - | - |
| Median Household Income | $93,250 | $191 |
| Monthly Housing Costs | $288 | $0 |
| Real Estate Taxes | $841 | $27 |
Property Value by Mortgage Status in Triana
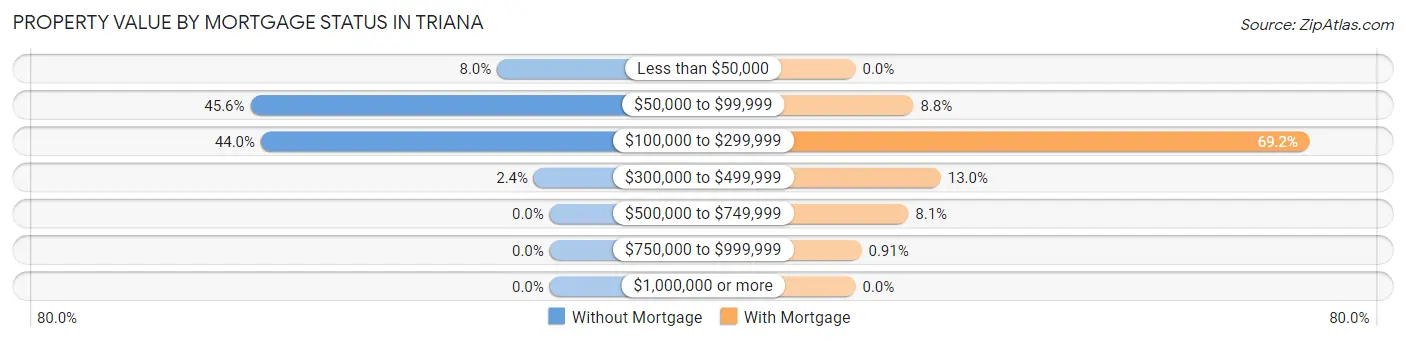
| Property Value | Without Mortgage | With Mortgage |
| Less than $50,000 | 10 (8.0%) | 0 (0.0%) |
| $50,000 to $99,999 | 57 (45.6%) | 68 (8.8%) |
| $100,000 to $299,999 | 55 (44.0%) | 533 (69.2%) |
| $300,000 to $499,999 | 3 (2.4%) | 100 (13.0%) |
| $500,000 to $749,999 | 0 (0.0%) | 62 (8.1%) |
| $750,000 to $999,999 | 0 (0.0%) | 7 (0.9%) |
| $1,000,000 or more | 0 (0.0%) | 0 (0.0%) |
| Total | 125 (100.0%) | 770 (100.0%) |
Household Income by Mortgage Status in Triana
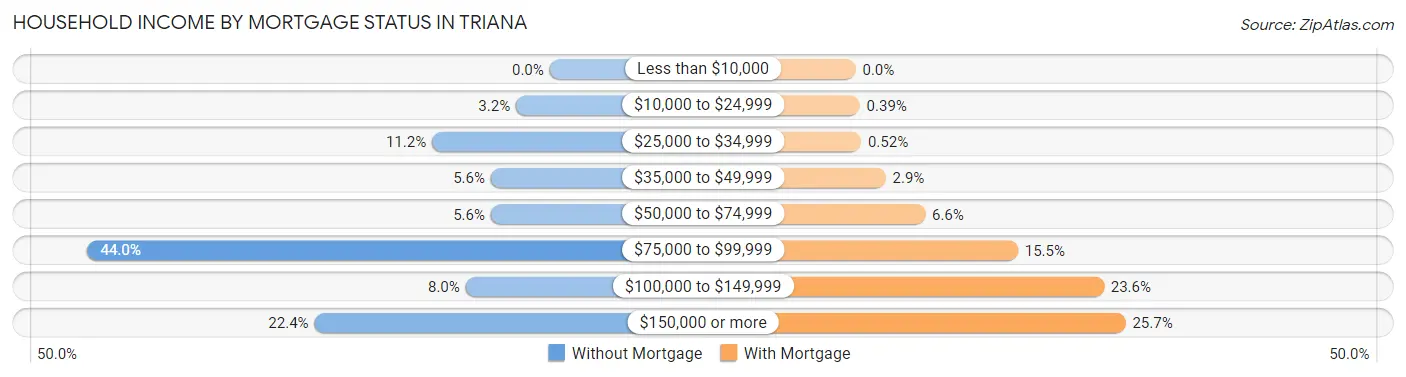
| Household Income | Without Mortgage | With Mortgage |
| Less than $10,000 | 0 (0.0%) | 0 (0.0%) |
| $10,000 to $24,999 | 4 (3.2%) | 3 (0.4%) |
| $25,000 to $34,999 | 14 (11.2%) | 4 (0.5%) |
| $35,000 to $49,999 | 7 (5.6%) | 22 (2.9%) |
| $50,000 to $74,999 | 7 (5.6%) | 51 (6.6%) |
| $75,000 to $99,999 | 55 (44.0%) | 119 (15.4%) |
| $100,000 to $149,999 | 10 (8.0%) | 182 (23.6%) |
| $150,000 or more | 28 (22.4%) | 198 (25.7%) |
| Total | 125 (100.0%) | 770 (100.0%) |
Property Value to Household Income Ratio in Triana
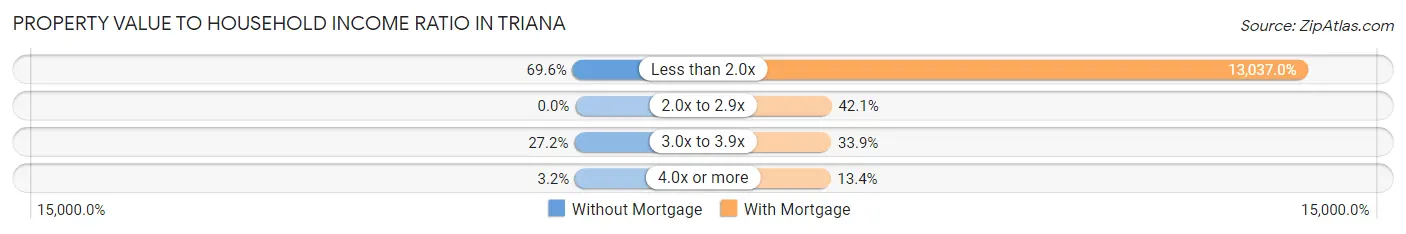
| Value-to-Income Ratio | Without Mortgage | With Mortgage |
| Less than 2.0x | 87 (69.6%) | 100,385 (13,037.0%) |
| 2.0x to 2.9x | 0 (0.0%) | 324 (42.1%) |
| 3.0x to 3.9x | 34 (27.2%) | 261 (33.9%) |
| 4.0x or more | 4 (3.2%) | 103 (13.4%) |
| Total | 125 (100.0%) | 770 (100.0%) |
Real Estate Taxes by Mortgage Status in Triana
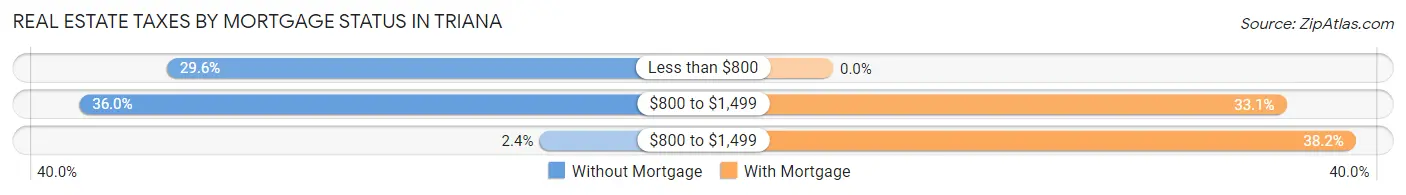
| Property Taxes | Without Mortgage | With Mortgage |
| Less than $800 | 37 (29.6%) | 0 (0.0%) |
| $800 to $1,499 | 45 (36.0%) | 255 (33.1%) |
| $800 to $1,499 | 3 (2.4%) | 294 (38.2%) |
| Total | 125 (100.0%) | 770 (100.0%) |
Health & Disability in Triana
Health Insurance Coverage by Age in Triana
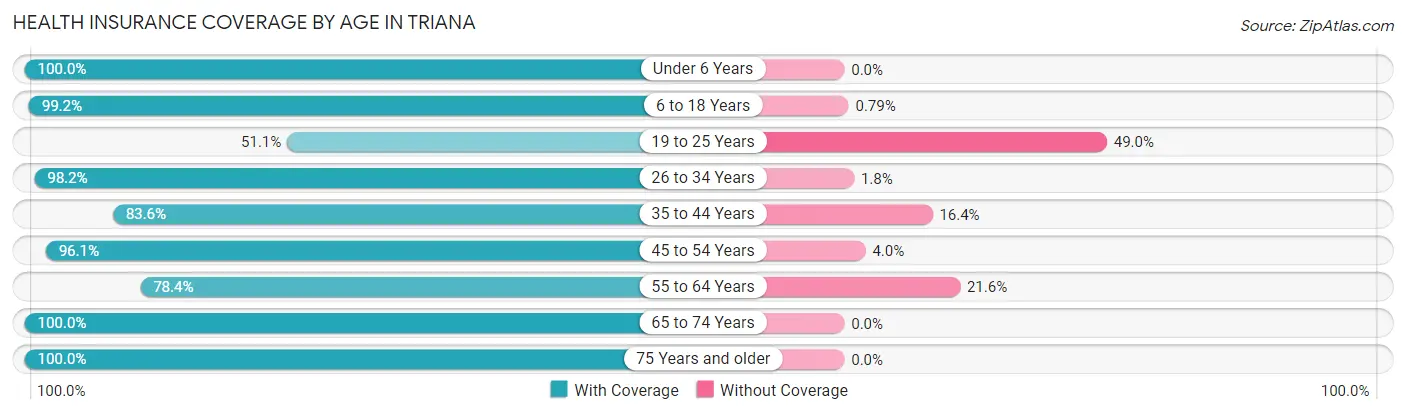
| Age Bracket | With Coverage | Without Coverage |
| Under 6 Years | 346 (100.0%) | 0 (0.0%) |
| 6 to 18 Years | 503 (99.2%) | 4 (0.8%) |
| 19 to 25 Years | 73 (51.0%) | 70 (48.9%) |
| 26 to 34 Years | 597 (98.2%) | 11 (1.8%) |
| 35 to 44 Years | 422 (83.6%) | 83 (16.4%) |
| 45 to 54 Years | 340 (96.1%) | 14 (4.0%) |
| 55 to 64 Years | 240 (78.4%) | 66 (21.6%) |
| 65 to 74 Years | 182 (100.0%) | 0 (0.0%) |
| 75 Years and older | 163 (100.0%) | 0 (0.0%) |
| Total | 2,866 (92.0%) | 248 (8.0%) |
Health Insurance Coverage by Citizenship Status in Triana
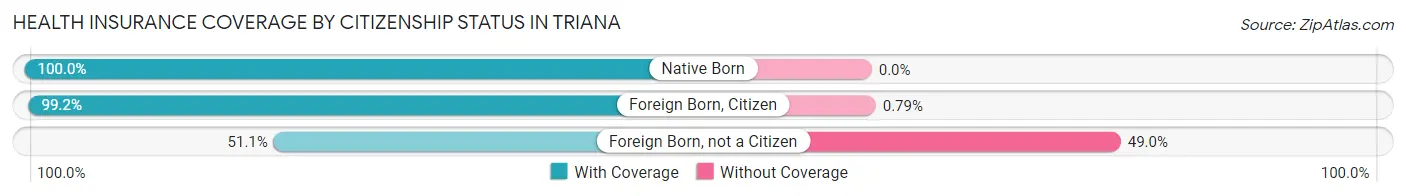
| Citizenship Status | With Coverage | Without Coverage |
| Native Born | 346 (100.0%) | 0 (0.0%) |
| Foreign Born, Citizen | 503 (99.2%) | 4 (0.8%) |
| Foreign Born, not a Citizen | 73 (51.0%) | 70 (48.9%) |
Health Insurance Coverage by Household Income in Triana
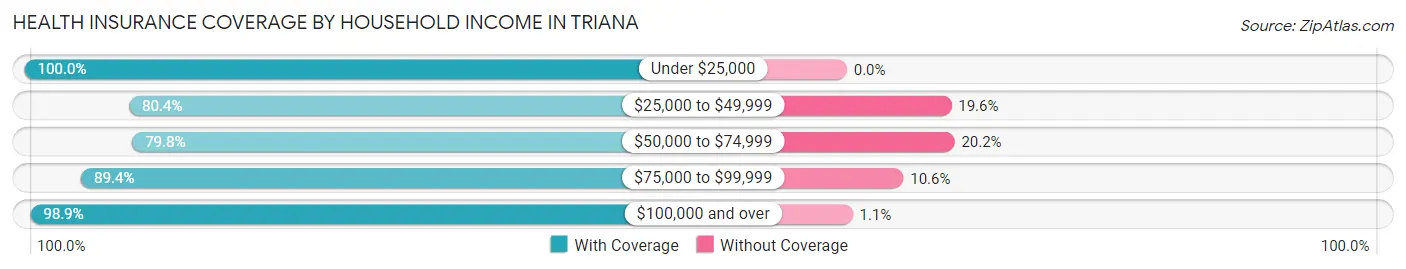
| Household Income | With Coverage | Without Coverage |
| Under $25,000 | 66 (100.0%) | 0 (0.0%) |
| $25,000 to $49,999 | 374 (80.4%) | 91 (19.6%) |
| $50,000 to $74,999 | 277 (79.8%) | 70 (20.2%) |
| $75,000 to $99,999 | 591 (89.4%) | 70 (10.6%) |
| $100,000 and over | 1,558 (98.9%) | 17 (1.1%) |
Public vs Private Health Insurance Coverage by Age in Triana
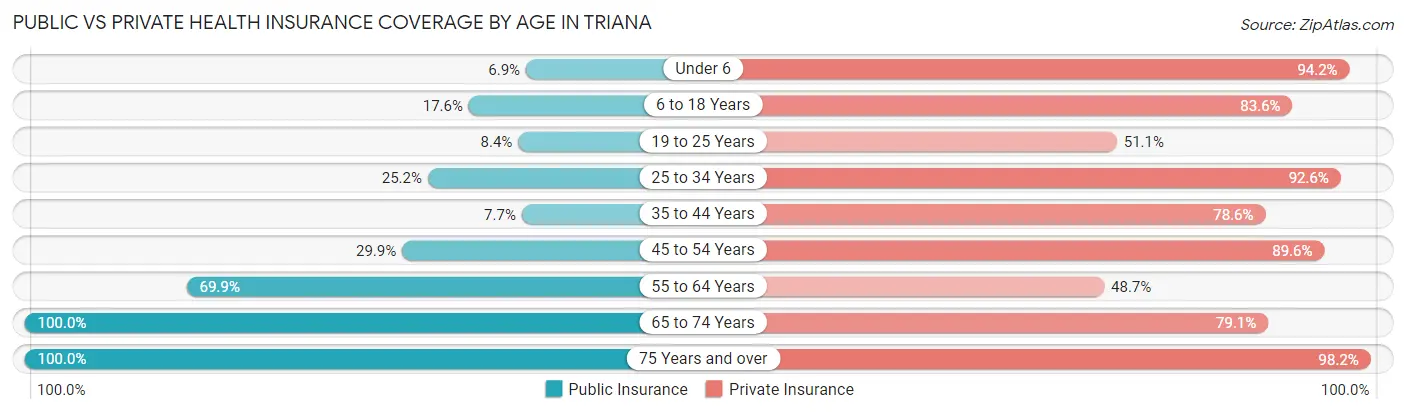
| Age Bracket | Public Insurance | Private Insurance |
| Under 6 | 24 (6.9%) | 326 (94.2%) |
| 6 to 18 Years | 89 (17.5%) | 424 (83.6%) |
| 19 to 25 Years | 12 (8.4%) | 73 (51.0%) |
| 25 to 34 Years | 153 (25.2%) | 563 (92.6%) |
| 35 to 44 Years | 39 (7.7%) | 397 (78.6%) |
| 45 to 54 Years | 106 (29.9%) | 317 (89.5%) |
| 55 to 64 Years | 214 (69.9%) | 149 (48.7%) |
| 65 to 74 Years | 182 (100.0%) | 144 (79.1%) |
| 75 Years and over | 163 (100.0%) | 160 (98.2%) |
| Total | 982 (31.5%) | 2,553 (82.0%) |
Disability Status by Sex by Age in Triana
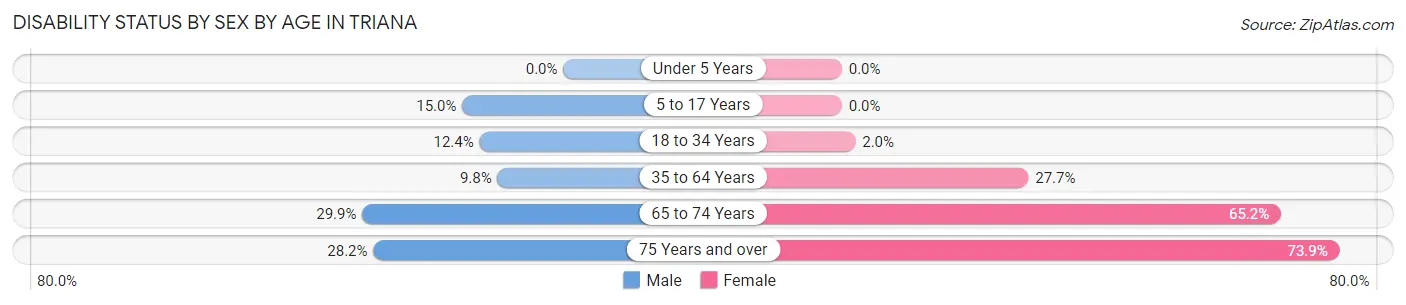
| Age Bracket | Male | Female |
| Under 5 Years | 0 (0.0%) | 0 (0.0%) |
| 5 to 17 Years | 36 (15.0%) | 0 (0.0%) |
| 18 to 34 Years | 51 (12.4%) | 7 (2.0%) |
| 35 to 64 Years | 63 (9.8%) | 144 (27.7%) |
| 65 to 74 Years | 20 (29.8%) | 75 (65.2%) |
| 75 Years and over | 33 (28.2%) | 34 (73.9%) |
Disability Class by Sex by Age in Triana
Disability Class: Hearing Difficulty
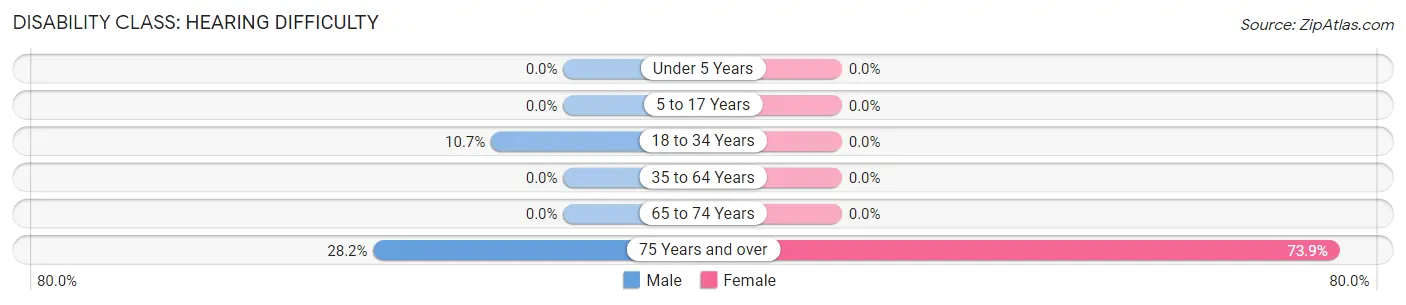
| Age Bracket | Male | Female |
| Under 5 Years | 0 (0.0%) | 0 (0.0%) |
| 5 to 17 Years | 0 (0.0%) | 0 (0.0%) |
| 18 to 34 Years | 44 (10.7%) | 0 (0.0%) |
| 35 to 64 Years | 0 (0.0%) | 0 (0.0%) |
| 65 to 74 Years | 0 (0.0%) | 0 (0.0%) |
| 75 Years and over | 33 (28.2%) | 34 (73.9%) |
Disability Class: Vision Difficulty
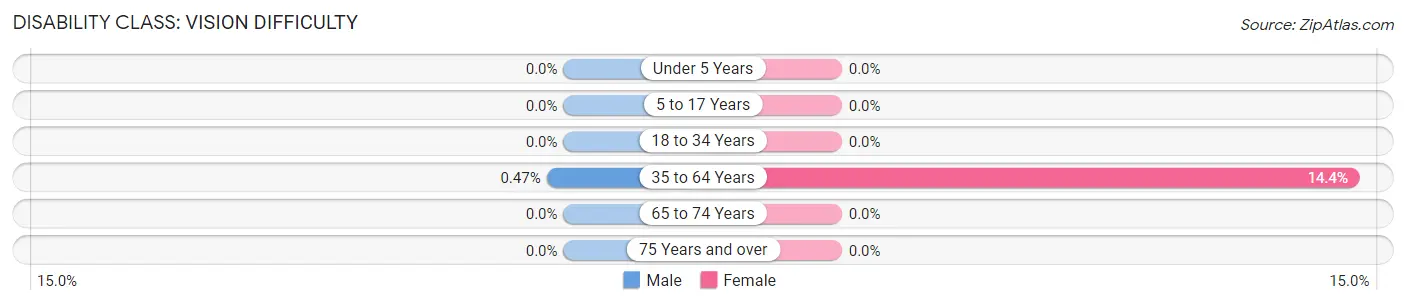
| Age Bracket | Male | Female |
| Under 5 Years | 0 (0.0%) | 0 (0.0%) |
| 5 to 17 Years | 0 (0.0%) | 0 (0.0%) |
| 18 to 34 Years | 0 (0.0%) | 0 (0.0%) |
| 35 to 64 Years | 3 (0.5%) | 75 (14.4%) |
| 65 to 74 Years | 0 (0.0%) | 0 (0.0%) |
| 75 Years and over | 0 (0.0%) | 0 (0.0%) |
Disability Class: Cognitive Difficulty
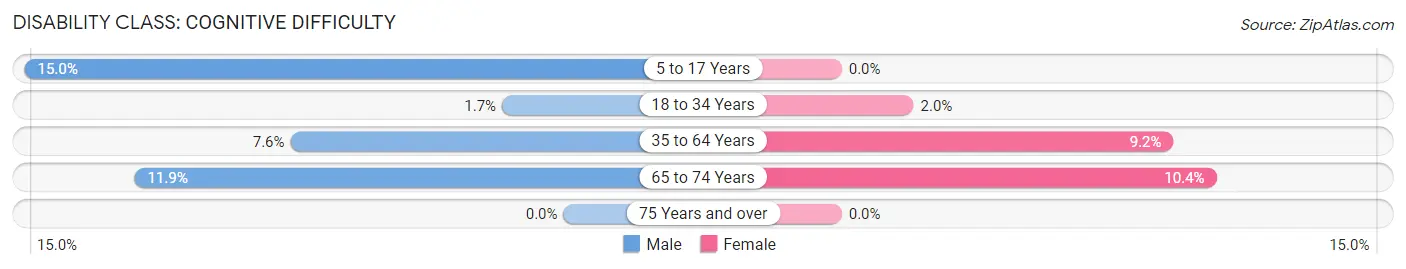
| Age Bracket | Male | Female |
| 5 to 17 Years | 36 (15.0%) | 0 (0.0%) |
| 18 to 34 Years | 7 (1.7%) | 7 (2.0%) |
| 35 to 64 Years | 49 (7.6%) | 48 (9.2%) |
| 65 to 74 Years | 8 (11.9%) | 12 (10.4%) |
| 75 Years and over | 0 (0.0%) | 0 (0.0%) |
Disability Class: Ambulatory Difficulty
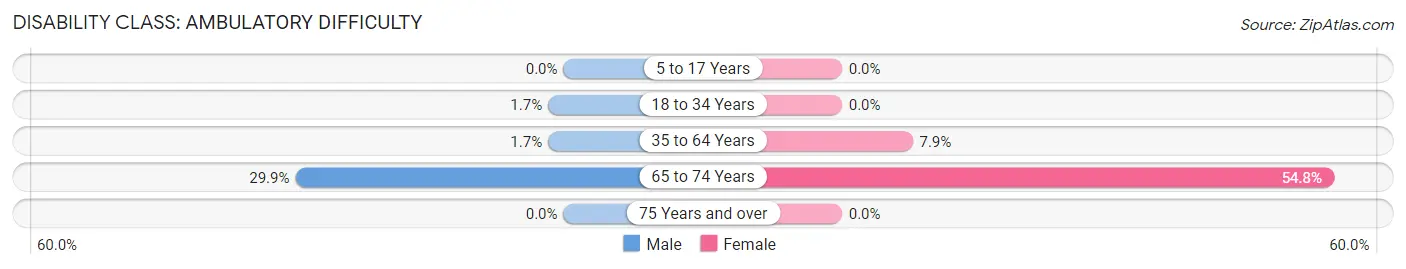
| Age Bracket | Male | Female |
| 5 to 17 Years | 0 (0.0%) | 0 (0.0%) |
| 18 to 34 Years | 7 (1.7%) | 0 (0.0%) |
| 35 to 64 Years | 11 (1.7%) | 41 (7.9%) |
| 65 to 74 Years | 20 (29.8%) | 63 (54.8%) |
| 75 Years and over | 0 (0.0%) | 0 (0.0%) |
Disability Class: Self-Care Difficulty
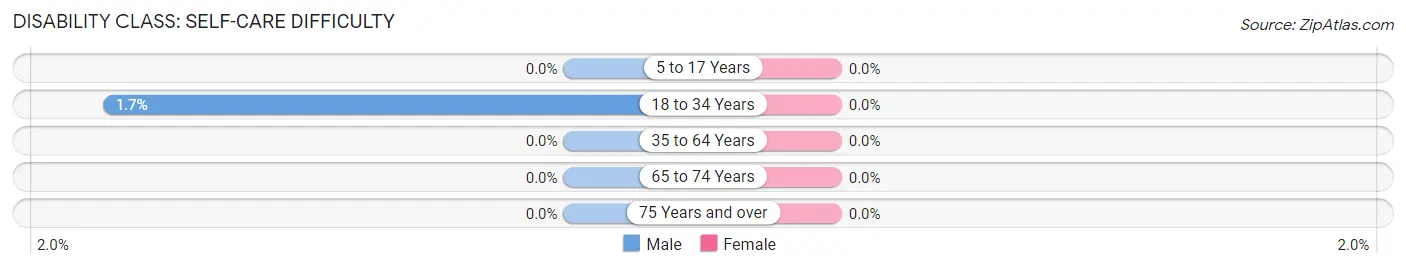
| Age Bracket | Male | Female |
| 5 to 17 Years | 0 (0.0%) | 0 (0.0%) |
| 18 to 34 Years | 7 (1.7%) | 0 (0.0%) |
| 35 to 64 Years | 0 (0.0%) | 0 (0.0%) |
| 65 to 74 Years | 0 (0.0%) | 0 (0.0%) |
| 75 Years and over | 0 (0.0%) | 0 (0.0%) |
Technology Access in Triana
Computing Device Access in Triana
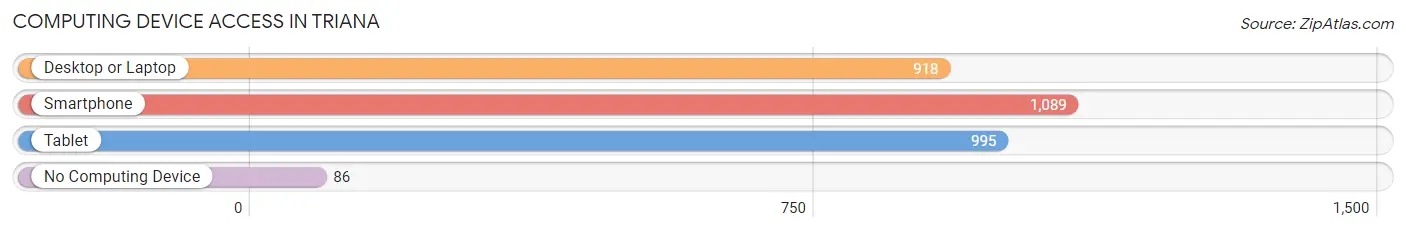
| Device Type | # Households | % Households |
| Desktop or Laptop | 918 | 77.2% |
| Smartphone | 1,089 | 91.6% |
| Tablet | 995 | 83.7% |
| No Computing Device | 86 | 7.2% |
| Total | 1,189 | 100.0% |
Internet Access in Triana
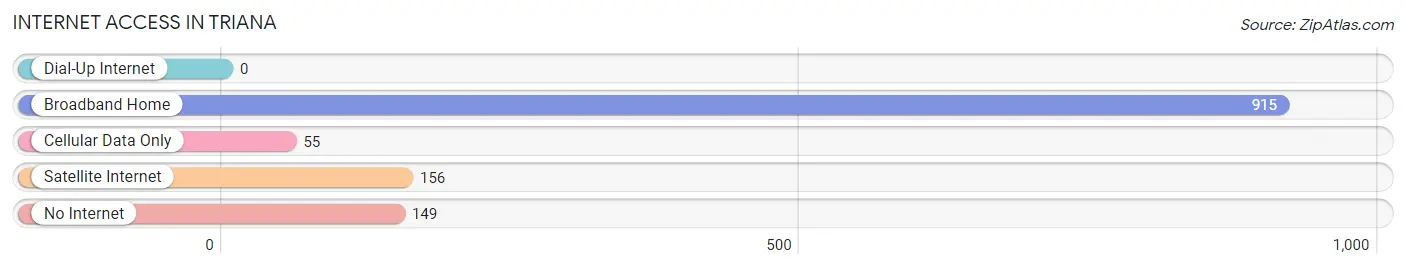
| Internet Type | # Households | % Households |
| Dial-Up Internet | 0 | 0.0% |
| Broadband Home | 915 | 77.0% |
| Cellular Data Only | 55 | 4.6% |
| Satellite Internet | 156 | 13.1% |
| No Internet | 149 | 12.5% |
| Total | 1,189 | 100.0% |
Triana Summary
Triana, Alabama is a small town located in Madison County, Alabama. It is situated on the banks of the Tennessee River, just north of Huntsville. The town was founded in 1818 and is named after the Spanish explorer, Hernando de Soto's daughter, Doña Luisa de Triana. The town has a population of approximately 1,500 people and is part of the Huntsville-Decatur Combined Statistical Area.
Geography
Triana is located in the northern part of Madison County, Alabama. It is situated on the banks of the Tennessee River, just north of Huntsville. The town is located at 34.7°N 86.6°W and has an elevation of 645 feet. The town is surrounded by the Limestone County to the north, the City of Huntsville to the south, and the City of Madison to the east. The town is located in the Tennessee Valley and is part of the Appalachian Mountains.
The climate in Triana is humid subtropical, with hot summers and mild winters. The average annual temperature is 64°F, with an average high of 87°F in the summer and an average low of 41°F in the winter. The average annual precipitation is 51.2 inches, with an average of 4.3 inches of snowfall per year.
Economy
The economy of Triana is largely based on agriculture and manufacturing. The town is home to several small businesses, including a grocery store, a hardware store, and a few restaurants. The town also has a few small manufacturing plants, including a paper mill and a plastics factory.
The town is also home to several farms, which produce a variety of crops, including corn, soybeans, cotton, and hay. The town also has a few small vineyards, which produce wine and other alcoholic beverages.
Demographics
As of the 2010 census, the population of Triana was 1,500 people. The racial makeup of the town was 94.7% White, 2.7% African American, 0.3% Native American, 0.3% Asian, 0.7% from other races, and 1.3% from two or more races. Hispanic or Latino of any race were 1.7% of the population.
The median income for a household in Triana was $37,500, and the median income for a family was $45,000. The per capita income for the town was $19,000. About 11.7% of families and 14.3% of the population were below the poverty line, including 18.2% of those under age 18 and 8.3% of those age 65 or over.
Conclusion
Triana, Alabama is a small town located in Madison County, Alabama. It is situated on the banks of the Tennessee River, just north of Huntsville. The town was founded in 1818 and is named after the Spanish explorer, Hernando de Soto's daughter, Doña Luisa de Triana. The town has a population of approximately 1,500 people and is part of the Huntsville-Decatur Combined Statistical Area. The economy of Triana is largely based on agriculture and manufacturing, and the town is home to several small businesses, farms, and manufacturing plants. The racial makeup of the town is 94.7% White, 2.7% African American, 0.3% Native American, 0.3% Asian, 0.7% from other races, and 1.3% from two or more races. The median income for a household in Triana was $37,500, and the median income for a family was $45,000. The per capita income for the town was $19,000.
Common Questions
What is Per Capita Income in Triana?
Per Capita income in Triana is $61,842.
What is the Median Family Income in Triana?
Median Family Income in Triana is $102,656.
What is the Median Household income in Triana?
Median Household Income in Triana is $89,531.
What is Income or Wage Gap in Triana?
Income or Wage Gap in Triana is 34.9%.
Women in Triana earn 65.1 cents for every dollar earned by a man.
What is Inequality or Gini Index in Triana?
Inequality or Gini Index in Triana is 0.55.
What is the Total Population of Triana?
Total Population of Triana is 3,114.
What is the Total Male Population of Triana?
Total Male Population of Triana is 1,665.
What is the Total Female Population of Triana?
Total Female Population of Triana is 1,449.
What is the Ratio of Males per 100 Females in Triana?
There are 114.91 Males per 100 Females in Triana.
What is the Ratio of Females per 100 Males in Triana?
There are 87.03 Females per 100 Males in Triana.
What is the Median Population Age in Triana?
Median Population Age in Triana is 34.4 Years.
What is the Average Family Size in Triana
Average Family Size in Triana is 3.0 People.
What is the Average Household Size in Triana
Average Household Size in Triana is 2.6 People.
How Large is the Labor Force in Triana?
There are 1,632 People in the Labor Forcein in Triana.
What is the Percentage of People in the Labor Force in Triana?
70.0% of People are in the Labor Force in Triana.
What is the Unemployment Rate in Triana?
Unemployment Rate in Triana is 12.2%.