Nutter Fort, WV Map & Demographics
Nutter Fort Map
Nutter Fort Overview
$32,741
PER CAPITA INCOME
$81,875
AVG FAMILY INCOME
$56,125
AVG HOUSEHOLD INCOME
14.3%
WAGE / INCOME GAP [ % ]
85.7¢/ $1
WAGE / INCOME GAP [ $ ]
0.42
INEQUALITY / GINI INDEX
1,700
TOTAL POPULATION
866
MALE POPULATION
834
FEMALE POPULATION
103.84
MALES / 100 FEMALES
96.30
FEMALES / 100 MALES
38.4
MEDIAN AGE
3.3
AVG FAMILY SIZE
2.5
AVG HOUSEHOLD SIZE
881
LABOR FORCE [ PEOPLE ]
64.6%
PERCENT IN LABOR FORCE
5.9%
UNEMPLOYMENT RATE
Income in Nutter Fort
Income Overview in Nutter Fort
Per Capita Income in Nutter Fort is $32,741, while median incomes of families and households are $81,875 and $56,125 respectively.
| Characteristic | Number | Measure |
| Per Capita Income | 1,700 | $32,741 |
| Median Family Income | 390 | $81,875 |
| Mean Family Income | 390 | $90,422 |
| Median Household Income | 688 | $56,125 |
| Mean Household Income | 688 | $72,987 |
| Income Deficit | 390 | $0 |
| Wage / Income Gap (%) | 1,700 | 14.29% |
| Wage / Income Gap ($) | 1,700 | 85.71¢ per $1 |
| Gini / Inequality Index | 1,700 | 0.42 |
Earnings by Sex in Nutter Fort
Average Earnings in Nutter Fort are $34,450, $35,000 for men and $30,000 for women, a difference of 14.3%.
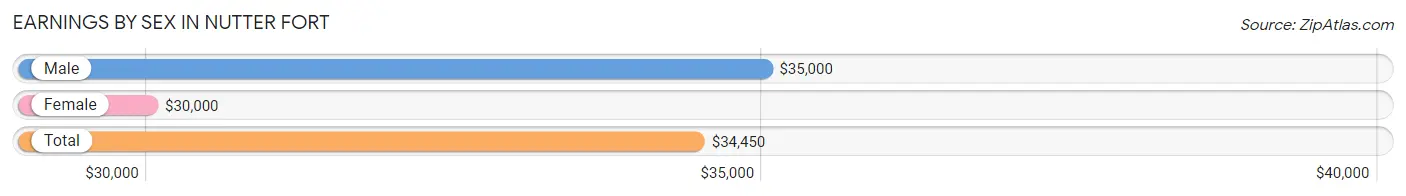
| Sex | Number | Average Earnings |
| Male | 480 (53.7%) | $35,000 |
| Female | 414 (46.3%) | $30,000 |
| Total | 894 (100.0%) | $34,450 |
Earnings by Sex by Income Bracket in Nutter Fort
The most common earnings brackets in Nutter Fort are $75,000 to $99,999 for men (73 | 15.2%) and $2,499 or less for women (50 | 12.1%).
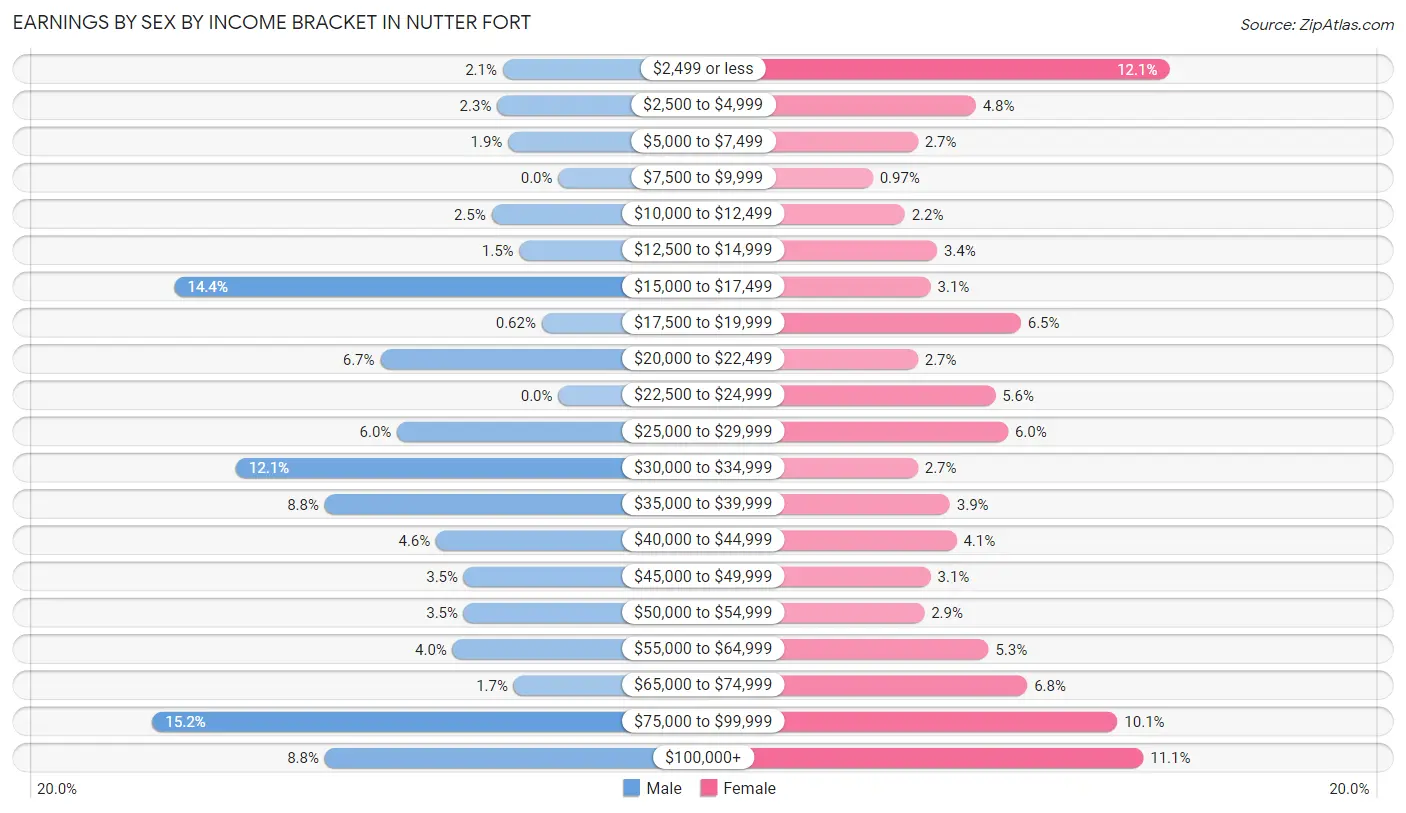
| Income | Male | Female |
| $2,499 or less | 10 (2.1%) | 50 (12.1%) |
| $2,500 to $4,999 | 11 (2.3%) | 20 (4.8%) |
| $5,000 to $7,499 | 9 (1.9%) | 11 (2.7%) |
| $7,500 to $9,999 | 0 (0.0%) | 4 (1.0%) |
| $10,000 to $12,499 | 12 (2.5%) | 9 (2.2%) |
| $12,500 to $14,999 | 7 (1.5%) | 14 (3.4%) |
| $15,000 to $17,499 | 69 (14.4%) | 13 (3.1%) |
| $17,500 to $19,999 | 3 (0.6%) | 27 (6.5%) |
| $20,000 to $22,499 | 32 (6.7%) | 11 (2.7%) |
| $22,500 to $24,999 | 0 (0.0%) | 23 (5.6%) |
| $25,000 to $29,999 | 29 (6.0%) | 25 (6.0%) |
| $30,000 to $34,999 | 58 (12.1%) | 11 (2.7%) |
| $35,000 to $39,999 | 42 (8.7%) | 16 (3.9%) |
| $40,000 to $44,999 | 22 (4.6%) | 17 (4.1%) |
| $45,000 to $49,999 | 17 (3.5%) | 13 (3.1%) |
| $50,000 to $54,999 | 17 (3.5%) | 12 (2.9%) |
| $55,000 to $64,999 | 19 (4.0%) | 22 (5.3%) |
| $65,000 to $74,999 | 8 (1.7%) | 28 (6.8%) |
| $75,000 to $99,999 | 73 (15.2%) | 42 (10.1%) |
| $100,000+ | 42 (8.7%) | 46 (11.1%) |
| Total | 480 (100.0%) | 414 (100.0%) |
Earnings by Sex by Educational Attainment in Nutter Fort
Average earnings in Nutter Fort are $41,875 for men and $47,188 for women, a difference of 11.3%. Men with an educational attainment of graduate degree enjoy the highest average annual earnings of $115,938, while those with college or associate's degree education earn the least with $32,708. Women with an educational attainment of college or associate's degree earn the most with the average annual earnings of $62,500, while those with high school diploma education have the smallest earnings of $24,583.
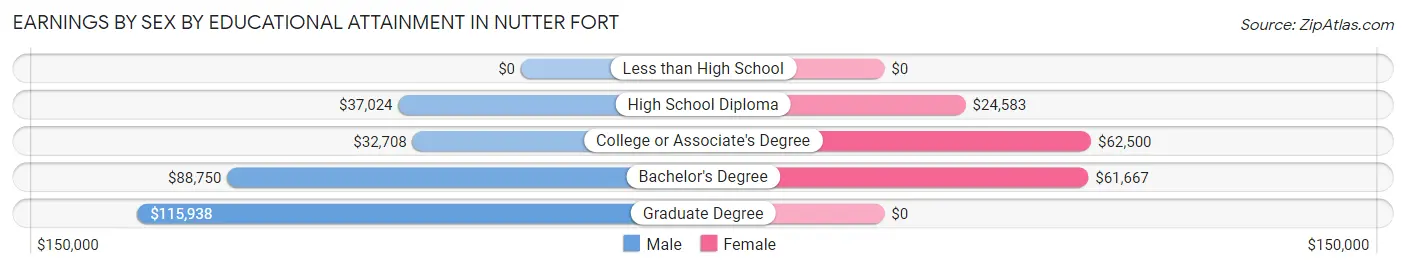
| Educational Attainment | Male Income | Female Income |
| Less than High School | - | - |
| High School Diploma | $37,024 | $24,583 |
| College or Associate's Degree | $32,708 | $62,500 |
| Bachelor's Degree | $88,750 | $61,667 |
| Graduate Degree | $115,938 | $0 |
| Total | $41,875 | $47,188 |
Family Income in Nutter Fort
Family Income Brackets in Nutter Fort
According to the Nutter Fort family income data, there are 85 families falling into the $50,000 to $74,999 income range, which is the most common income bracket and makes up 21.8% of all families.
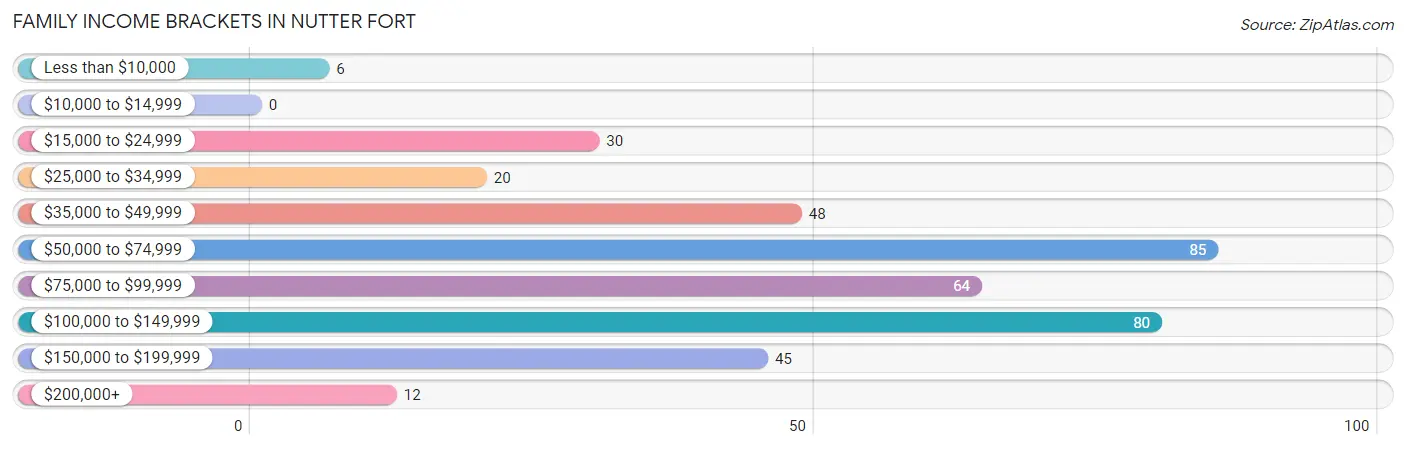
| Income Bracket | # Families | % Families |
| Less than $10,000 | 6 | 1.5% |
| $10,000 to $14,999 | 0 | 0.0% |
| $15,000 to $24,999 | 30 | 7.7% |
| $25,000 to $34,999 | 20 | 5.1% |
| $35,000 to $49,999 | 48 | 12.3% |
| $50,000 to $74,999 | 85 | 21.8% |
| $75,000 to $99,999 | 64 | 16.4% |
| $100,000 to $149,999 | 80 | 20.5% |
| $150,000 to $199,999 | 45 | 11.5% |
| $200,000+ | 12 | 3.1% |
Family Income by Famaliy Size in Nutter Fort
3-person families (60 | 15.4%) account for the highest median family income in Nutter Fort with $116,250 per family, while 3-person families (60 | 15.4%) have the highest median income of $38,750 per family member.
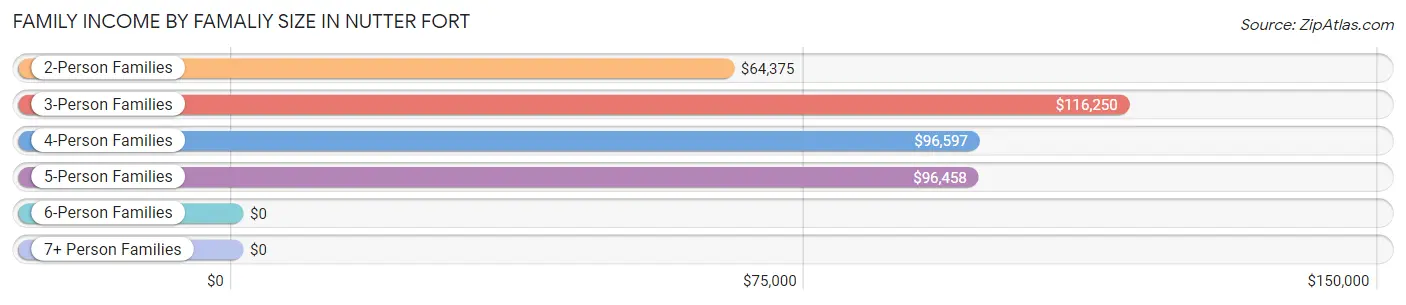
| Income Bracket | # Families | Median Income |
| 2-Person Families | 212 (54.4%) | $64,375 |
| 3-Person Families | 60 (15.4%) | $116,250 |
| 4-Person Families | 99 (25.4%) | $96,597 |
| 5-Person Families | 13 (3.3%) | $96,458 |
| 6-Person Families | 6 (1.5%) | $0 |
| 7+ Person Families | 0 (0.0%) | $0 |
| Total | 390 (100.0%) | $81,875 |
Family Income by Number of Earners in Nutter Fort
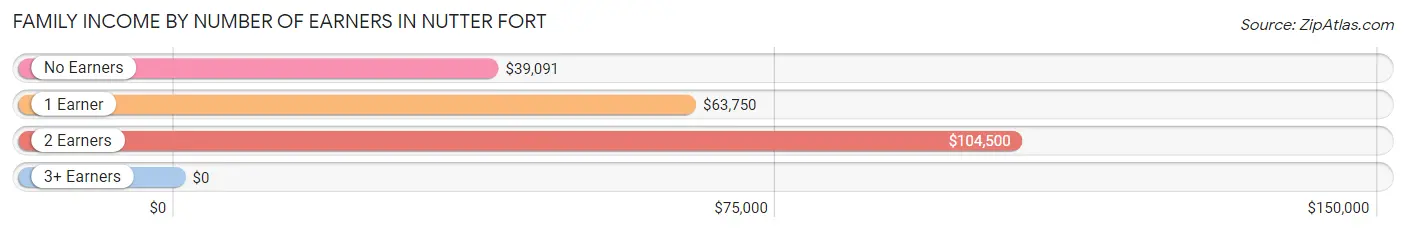
| Number of Earners | # Families | Median Income |
| No Earners | 64 (16.4%) | $39,091 |
| 1 Earner | 130 (33.3%) | $63,750 |
| 2 Earners | 138 (35.4%) | $104,500 |
| 3+ Earners | 58 (14.9%) | $0 |
| Total | 390 (100.0%) | $81,875 |
Household Income in Nutter Fort
Household Income Brackets in Nutter Fort
With 134 households falling in the category, the $50,000 to $74,999 income range is the most frequent in Nutter Fort, accounting for 19.5% of all households. In contrast, only 14 households (2.0%) fall into the $200,000+ income bracket, making it the least populous group.
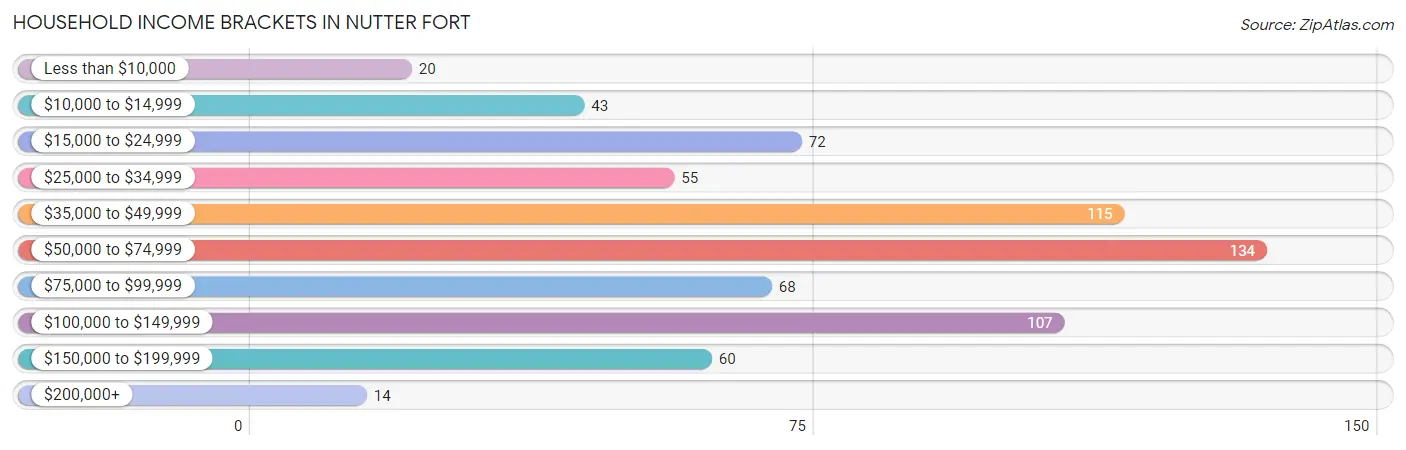
| Income Bracket | # Households | % Households |
| Less than $10,000 | 20 | 2.9% |
| $10,000 to $14,999 | 43 | 6.3% |
| $15,000 to $24,999 | 72 | 10.5% |
| $25,000 to $34,999 | 55 | 8.0% |
| $35,000 to $49,999 | 115 | 16.7% |
| $50,000 to $74,999 | 134 | 19.5% |
| $75,000 to $99,999 | 68 | 9.9% |
| $100,000 to $149,999 | 107 | 15.6% |
| $150,000 to $199,999 | 60 | 8.7% |
| $200,000+ | 14 | 2.0% |
Household Income by Householder Age in Nutter Fort
The median household income in Nutter Fort is $56,125, with the highest median household income of $81,250 found in the 45 to 64 years age bracket for the primary householder. A total of 237 households (34.4%) fall into this category. Meanwhile, the 65+ years age bracket for the primary householder has the lowest median household income of $43,214, with 216 households (31.4%) in this group.
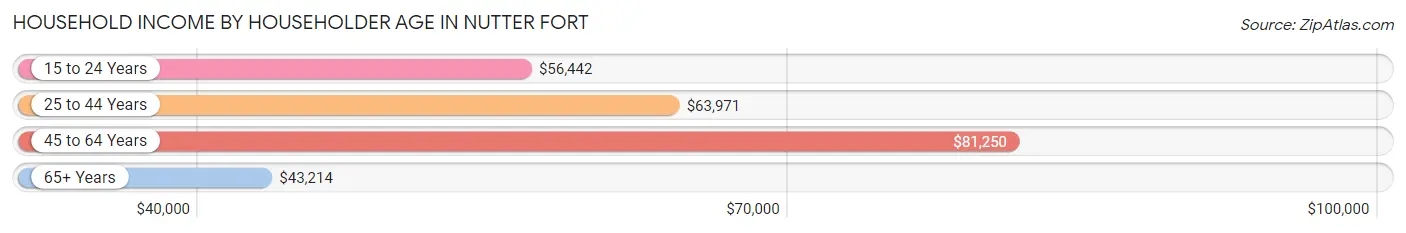
| Income Bracket | # Households | Median Income |
| 15 to 24 Years | 41 (6.0%) | $56,442 |
| 25 to 44 Years | 194 (28.2%) | $63,971 |
| 45 to 64 Years | 237 (34.4%) | $81,250 |
| 65+ Years | 216 (31.4%) | $43,214 |
| Total | 688 (100.0%) | $56,125 |
Poverty in Nutter Fort
Income Below Poverty by Sex and Age in Nutter Fort
With 10.7% poverty level for males and 13.0% for females among the residents of Nutter Fort, 16 and 17 year old males and 55 to 64 year old females are the most vulnerable to poverty, with 10 males (100.0%) and 41 females (48.8%) in their respective age groups living below the poverty level.
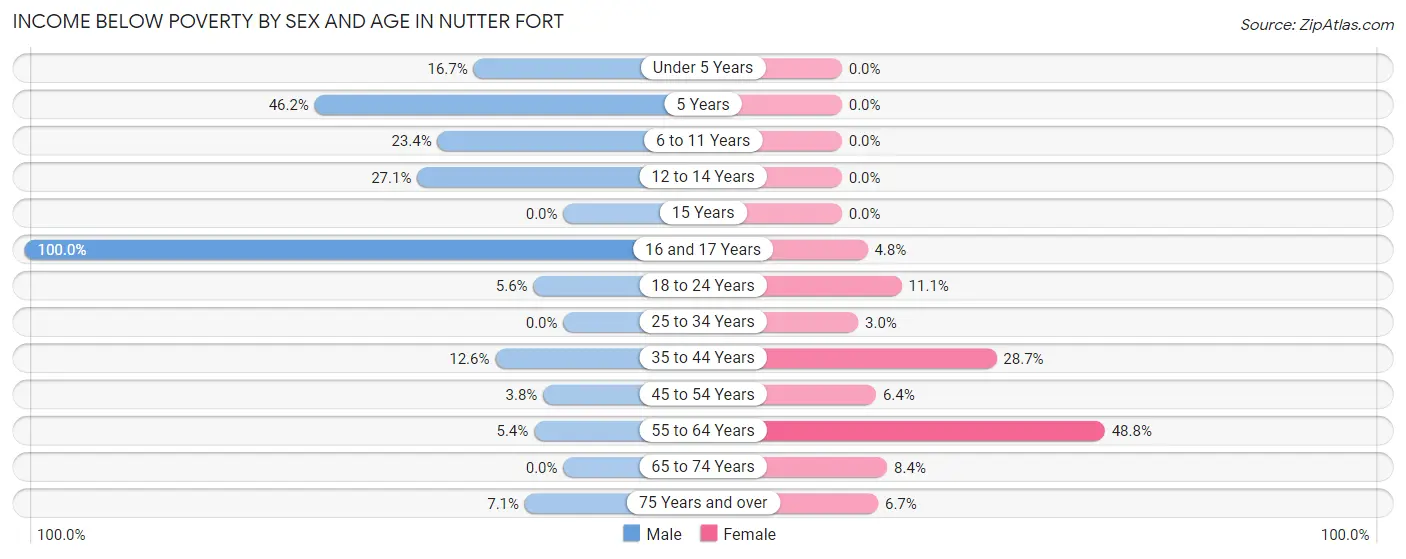
| Age Bracket | Male | Female |
| Under 5 Years | 6 (16.7%) | 0 (0.0%) |
| 5 Years | 6 (46.2%) | 0 (0.0%) |
| 6 to 11 Years | 25 (23.4%) | 0 (0.0%) |
| 12 to 14 Years | 16 (27.1%) | 0 (0.0%) |
| 15 Years | 0 (0.0%) | 0 (0.0%) |
| 16 and 17 Years | 10 (100.0%) | 2 (4.8%) |
| 18 to 24 Years | 7 (5.6%) | 8 (11.1%) |
| 25 to 34 Years | 0 (0.0%) | 3 (3.0%) |
| 35 to 44 Years | 12 (12.6%) | 31 (28.7%) |
| 45 to 54 Years | 3 (3.7%) | 8 (6.4%) |
| 55 to 64 Years | 5 (5.4%) | 41 (48.8%) |
| 65 to 74 Years | 0 (0.0%) | 8 (8.4%) |
| 75 Years and over | 3 (7.1%) | 7 (6.7%) |
| Total | 93 (10.7%) | 108 (13.0%) |
Income Above Poverty by Sex and Age in Nutter Fort
According to the poverty statistics in Nutter Fort, males aged 15 years and females aged under 5 years are the age groups that are most secure financially, with 100.0% of males and 100.0% of females in these age groups living above the poverty line.
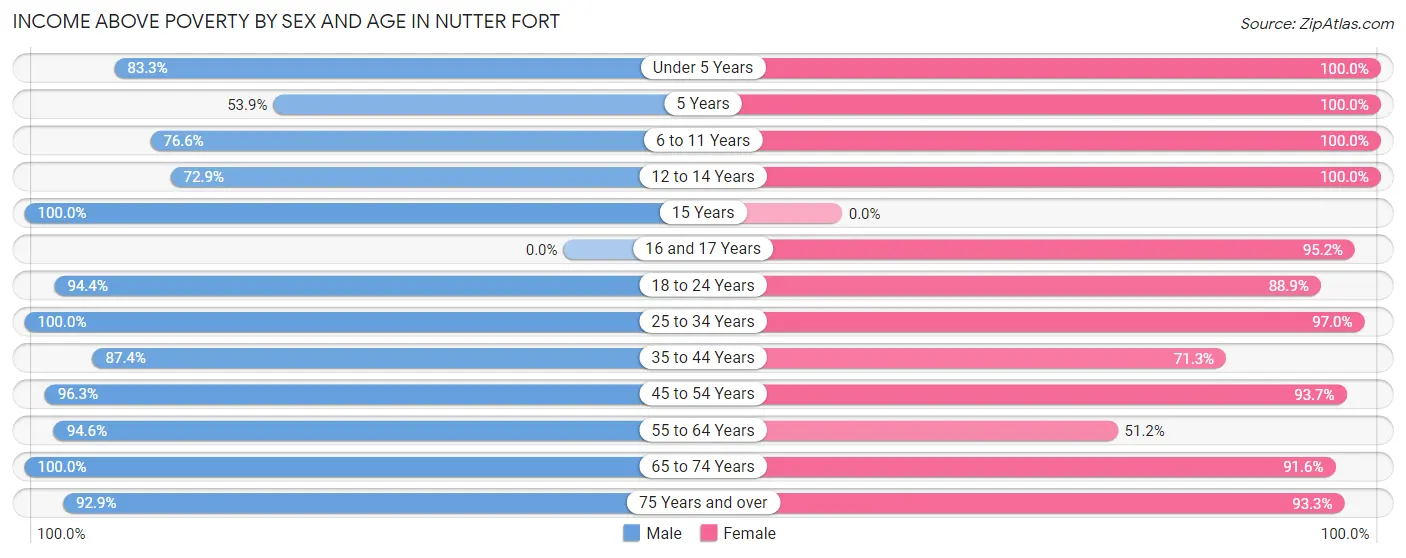
| Age Bracket | Male | Female |
| Under 5 Years | 30 (83.3%) | 18 (100.0%) |
| 5 Years | 7 (53.8%) | 8 (100.0%) |
| 6 to 11 Years | 82 (76.6%) | 34 (100.0%) |
| 12 to 14 Years | 43 (72.9%) | 44 (100.0%) |
| 15 Years | 17 (100.0%) | 0 (0.0%) |
| 16 and 17 Years | 0 (0.0%) | 40 (95.2%) |
| 18 to 24 Years | 119 (94.4%) | 64 (88.9%) |
| 25 to 34 Years | 114 (100.0%) | 96 (97.0%) |
| 35 to 44 Years | 83 (87.4%) | 77 (71.3%) |
| 45 to 54 Years | 77 (96.3%) | 118 (93.6%) |
| 55 to 64 Years | 87 (94.6%) | 43 (51.2%) |
| 65 to 74 Years | 75 (100.0%) | 87 (91.6%) |
| 75 Years and over | 39 (92.9%) | 97 (93.3%) |
| Total | 773 (89.3%) | 726 (87.1%) |
Income Below Poverty Among Married-Couple Families in Nutter Fort
The poverty statistics for married-couple families in Nutter Fort show that 3.6% or 9 of the total 251 families live below the poverty line. Families with 1 or 2 children have the highest poverty rate of 9.9%, comprising of 9 families. On the other hand, families with no children have the lowest poverty rate of 0.0%, which includes 0 families.
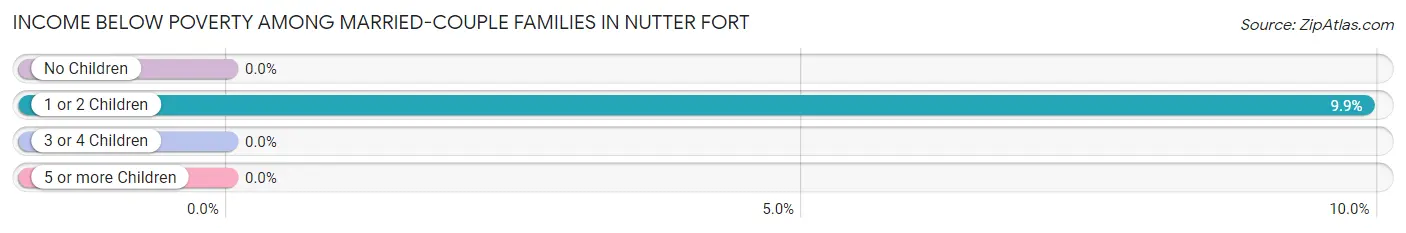
| Children | Above Poverty | Below Poverty |
| No Children | 151 (100.0%) | 0 (0.0%) |
| 1 or 2 Children | 82 (90.1%) | 9 (9.9%) |
| 3 or 4 Children | 9 (100.0%) | 0 (0.0%) |
| 5 or more Children | 0 (0.0%) | 0 (0.0%) |
| Total | 242 (96.4%) | 9 (3.6%) |
Income Below Poverty Among Single-Parent Households in Nutter Fort
According to the poverty data in Nutter Fort, 7.3% or 3 single-father households and 11.2% or 11 single-mother households are living below the poverty line. Among single-father households, those with no children have the highest poverty rate, with 3 households (15.8%) experiencing poverty. Likewise, among single-mother households, those with 3 or 4 children have the highest poverty rate, with 3 households (33.3%) falling below the poverty line.
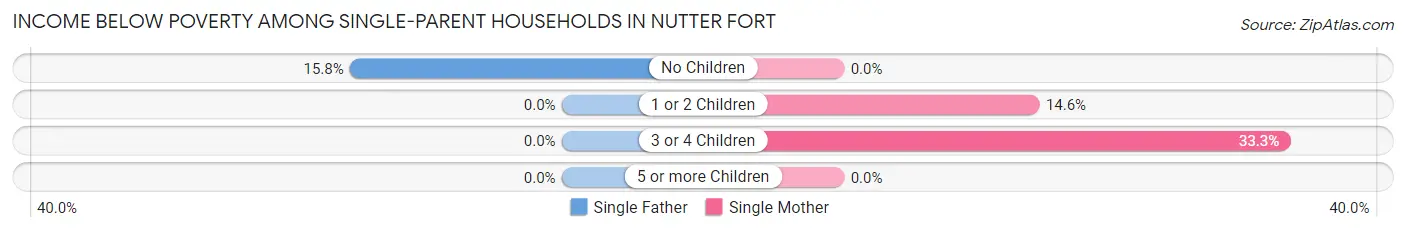
| Children | Single Father | Single Mother |
| No Children | 3 (15.8%) | 0 (0.0%) |
| 1 or 2 Children | 0 (0.0%) | 8 (14.5%) |
| 3 or 4 Children | 0 (0.0%) | 3 (33.3%) |
| 5 or more Children | 0 (0.0%) | 0 (0.0%) |
| Total | 3 (7.3%) | 11 (11.2%) |
Income Below Poverty Among Married-Couple vs Single-Parent Households in Nutter Fort
The poverty data for Nutter Fort shows that 9 of the married-couple family households (3.6%) and 14 of the single-parent households (10.1%) are living below the poverty level. Within the married-couple family households, those with 1 or 2 children have the highest poverty rate, with 9 households (9.9%) falling below the poverty line. Among the single-parent households, those with 3 or 4 children have the highest poverty rate, with 3 household (33.3%) living below poverty.
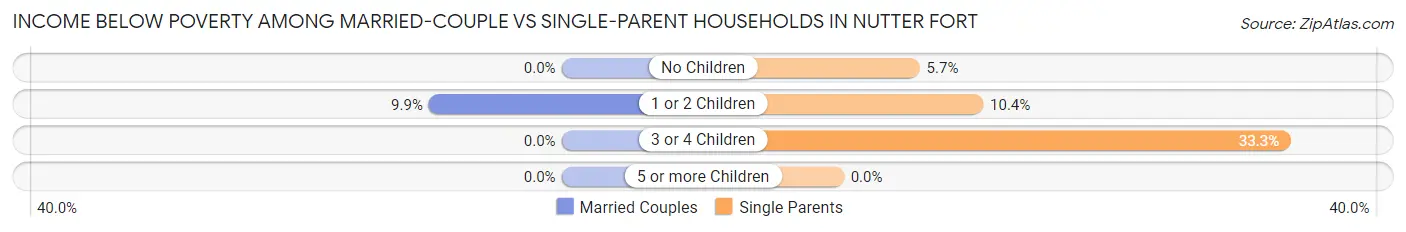
| Children | Married-Couple Families | Single-Parent Households |
| No Children | 0 (0.0%) | 3 (5.7%) |
| 1 or 2 Children | 9 (9.9%) | 8 (10.4%) |
| 3 or 4 Children | 0 (0.0%) | 3 (33.3%) |
| 5 or more Children | 0 (0.0%) | 0 (0.0%) |
| Total | 9 (3.6%) | 14 (10.1%) |
Race in Nutter Fort
The most populous races in Nutter Fort are White / Caucasian (1,614 | 94.9%), Two or more Races (79 | 4.6%), and Hispanic or Latino (13 | 0.8%).
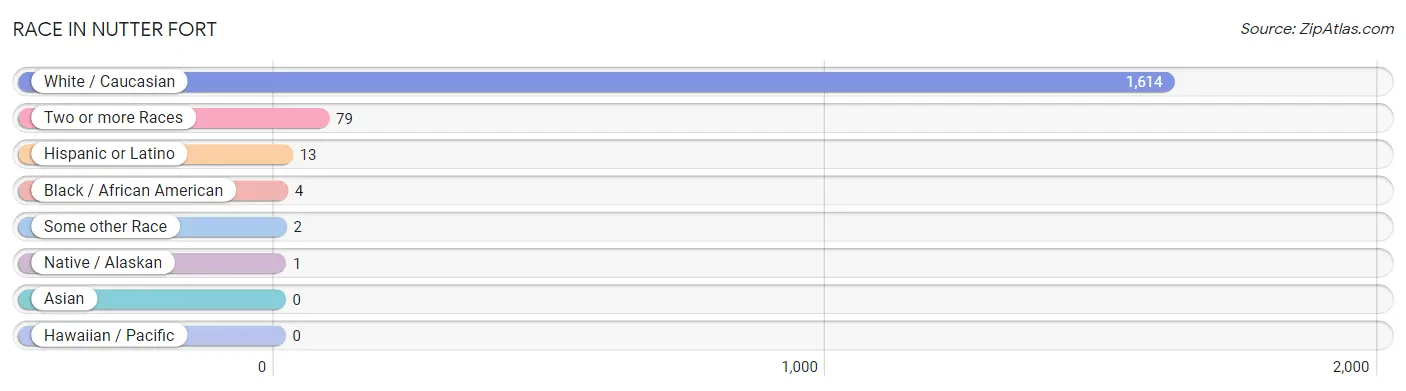
| Race | # Population | % Population |
| Asian | 0 | 0.0% |
| Black / African American | 4 | 0.2% |
| Hawaiian / Pacific | 0 | 0.0% |
| Hispanic or Latino | 13 | 0.8% |
| Native / Alaskan | 1 | 0.1% |
| White / Caucasian | 1,614 | 94.9% |
| Two or more Races | 79 | 4.6% |
| Some other Race | 2 | 0.1% |
| Total | 1,700 | 100.0% |
Ancestry in Nutter Fort
The most populous ancestries reported in Nutter Fort are Irish (521 | 30.6%), German (453 | 26.7%), Italian (301 | 17.7%), American (118 | 6.9%), and English (118 | 6.9%), together accounting for 88.9% of all Nutter Fort residents.
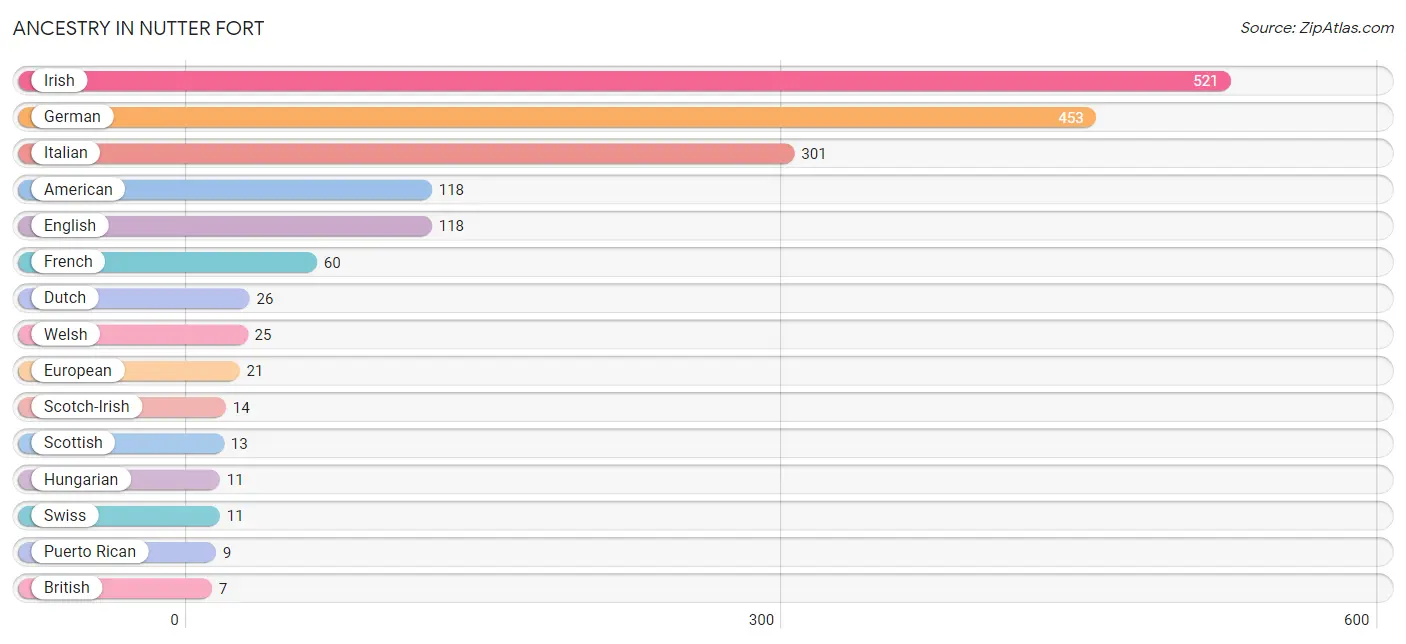
| Ancestry | # Population | % Population |
| American | 118 | 6.9% |
| Arab | 2 | 0.1% |
| Belgian | 4 | 0.2% |
| British | 7 | 0.4% |
| Chippewa | 1 | 0.1% |
| Creek | 2 | 0.1% |
| Dutch | 26 | 1.5% |
| English | 118 | 6.9% |
| European | 21 | 1.2% |
| French | 60 | 3.5% |
| German | 453 | 26.7% |
| Greek | 3 | 0.2% |
| Hungarian | 11 | 0.6% |
| Irish | 521 | 30.6% |
| Italian | 301 | 17.7% |
| Lebanese | 2 | 0.1% |
| Mexican | 4 | 0.2% |
| Norwegian | 3 | 0.2% |
| Polish | 4 | 0.2% |
| Puerto Rican | 9 | 0.5% |
| Scandinavian | 3 | 0.2% |
| Scotch-Irish | 14 | 0.8% |
| Scottish | 13 | 0.8% |
| Slovak | 4 | 0.2% |
| Swiss | 11 | 0.6% |
| Welsh | 25 | 1.5% | View All 26 Rows |
Immigrants in Nutter Fort

| Immigration Origin | # Population | % Population | View All 0 Rows |
Sex and Age in Nutter Fort
Sex and Age in Nutter Fort
The most populous age groups in Nutter Fort are 10 to 14 Years (127 | 14.7%) for men and 35 to 39 Years (69 | 8.3%) for women.
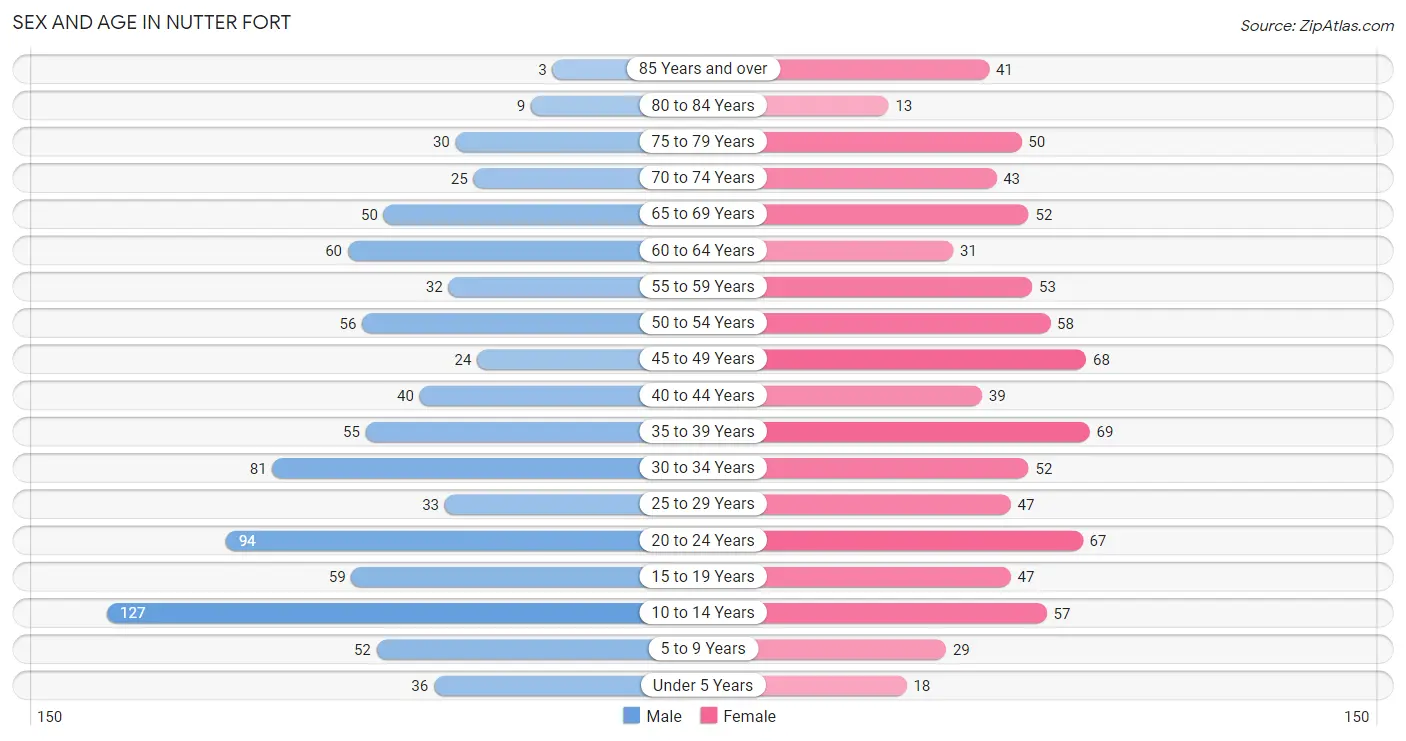
| Age Bracket | Male | Female |
| Under 5 Years | 36 (4.2%) | 18 (2.2%) |
| 5 to 9 Years | 52 (6.0%) | 29 (3.5%) |
| 10 to 14 Years | 127 (14.7%) | 57 (6.8%) |
| 15 to 19 Years | 59 (6.8%) | 47 (5.6%) |
| 20 to 24 Years | 94 (10.8%) | 67 (8.0%) |
| 25 to 29 Years | 33 (3.8%) | 47 (5.6%) |
| 30 to 34 Years | 81 (9.3%) | 52 (6.2%) |
| 35 to 39 Years | 55 (6.4%) | 69 (8.3%) |
| 40 to 44 Years | 40 (4.6%) | 39 (4.7%) |
| 45 to 49 Years | 24 (2.8%) | 68 (8.2%) |
| 50 to 54 Years | 56 (6.5%) | 58 (7.0%) |
| 55 to 59 Years | 32 (3.7%) | 53 (6.4%) |
| 60 to 64 Years | 60 (6.9%) | 31 (3.7%) |
| 65 to 69 Years | 50 (5.8%) | 52 (6.2%) |
| 70 to 74 Years | 25 (2.9%) | 43 (5.2%) |
| 75 to 79 Years | 30 (3.5%) | 50 (6.0%) |
| 80 to 84 Years | 9 (1.0%) | 13 (1.6%) |
| 85 Years and over | 3 (0.4%) | 41 (4.9%) |
| Total | 866 (100.0%) | 834 (100.0%) |
Families and Households in Nutter Fort
Median Family Size in Nutter Fort
The median family size in Nutter Fort is 3.34 persons per family, with single male/father families (41 | 10.5%) accounting for the largest median family size of 5.05 persons per family. On the other hand, single female/mother families (98 | 25.1%) represent the smallest median family size with 2.99 persons per family.
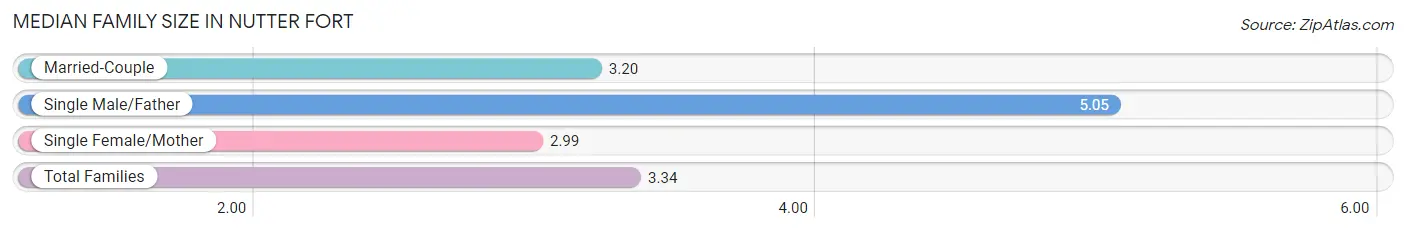
| Family Type | # Families | Family Size |
| Married-Couple | 251 (64.4%) | 3.20 |
| Single Male/Father | 41 (10.5%) | 5.05 |
| Single Female/Mother | 98 (25.1%) | 2.99 |
| Total Families | 390 (100.0%) | 3.34 |
Median Household Size in Nutter Fort
The median household size in Nutter Fort is 2.45 persons per household, with single male/father households (41 | 6.0%) accounting for the largest median household size of 5.12 persons per household. non-family households (298 | 43.3%) represent the smallest median household size with 1.26 persons per household.
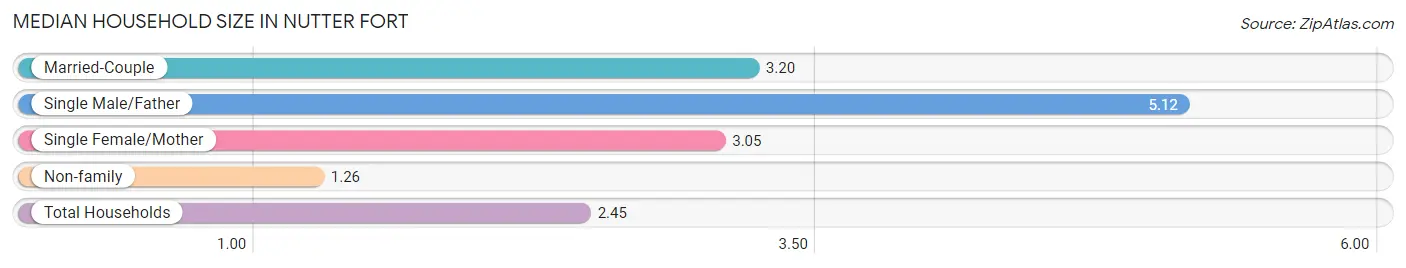
| Household Type | # Households | Household Size |
| Married-Couple | 251 (36.5%) | 3.20 |
| Single Male/Father | 41 (6.0%) | 5.12 |
| Single Female/Mother | 98 (14.2%) | 3.05 |
| Non-family | 298 (43.3%) | 1.26 |
| Total Households | 688 (100.0%) | 2.45 |
Household Size by Marriage Status in Nutter Fort
Out of a total of 688 households in Nutter Fort, 390 (56.7%) are family households, while 298 (43.3%) are nonfamily households. The most numerous type of family households are 2-person households, comprising 206, and the most common type of nonfamily households are 1-person households, comprising 252.
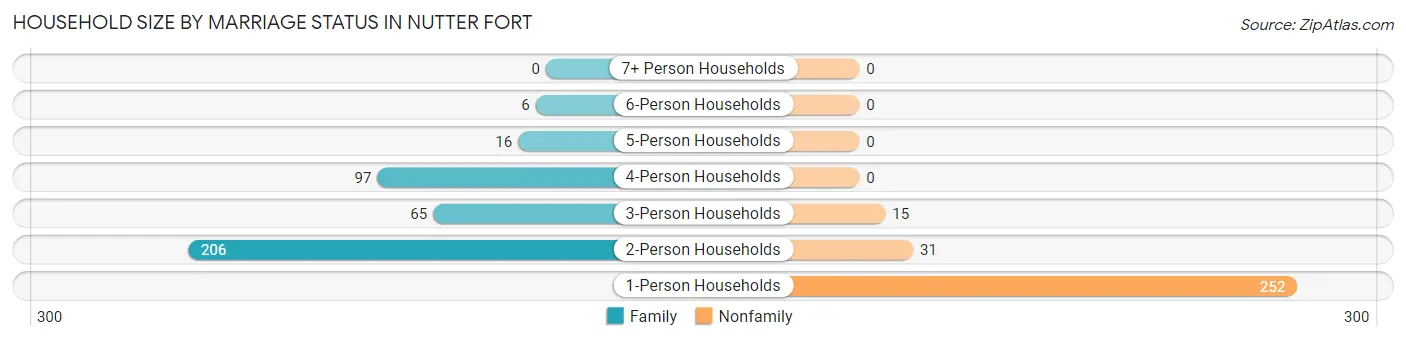
| Household Size | Family Households | Nonfamily Households |
| 1-Person Households | - | 252 (36.6%) |
| 2-Person Households | 206 (29.9%) | 31 (4.5%) |
| 3-Person Households | 65 (9.5%) | 15 (2.2%) |
| 4-Person Households | 97 (14.1%) | 0 (0.0%) |
| 5-Person Households | 16 (2.3%) | 0 (0.0%) |
| 6-Person Households | 6 (0.9%) | 0 (0.0%) |
| 7+ Person Households | 0 (0.0%) | 0 (0.0%) |
| Total | 390 (56.7%) | 298 (43.3%) |
Female Fertility in Nutter Fort
Fertility by Age in Nutter Fort
Average fertility rate in Nutter Fort is 14.0 births per 1,000 women. Women in the age bracket of 20 to 34 years have the highest fertility rate with 36.0 births per 1,000 women. Women in the age bracket of 20 to 34 years acount for 100.0% of all women with births.
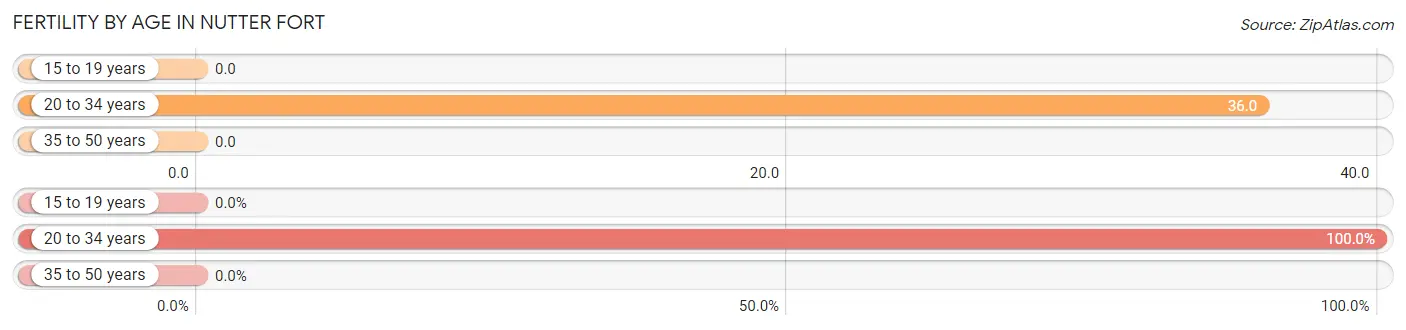
| Age Bracket | Women with Births | Births / 1,000 Women |
| 15 to 19 years | 0 (0.0%) | 0.0 |
| 20 to 34 years | 6 (100.0%) | 36.0 |
| 35 to 50 years | 0 (0.0%) | 0.0 |
| Total | 6 (100.0%) | 14.0 |
Fertility by Age by Marriage Status in Nutter Fort
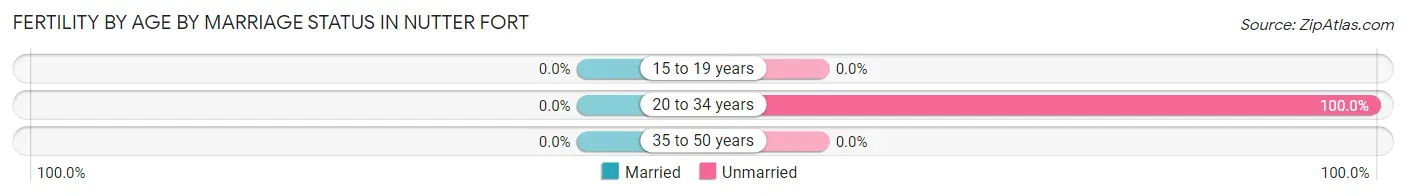
| Age Bracket | Married | Unmarried |
| 15 to 19 years | 0 (0.0%) | 0 (0.0%) |
| 20 to 34 years | 0 (0.0%) | 6 (100.0%) |
| 35 to 50 years | 0 (0.0%) | 0 (0.0%) |
| Total | 0 (0.0%) | 6 (100.0%) |
Fertility by Education in Nutter Fort
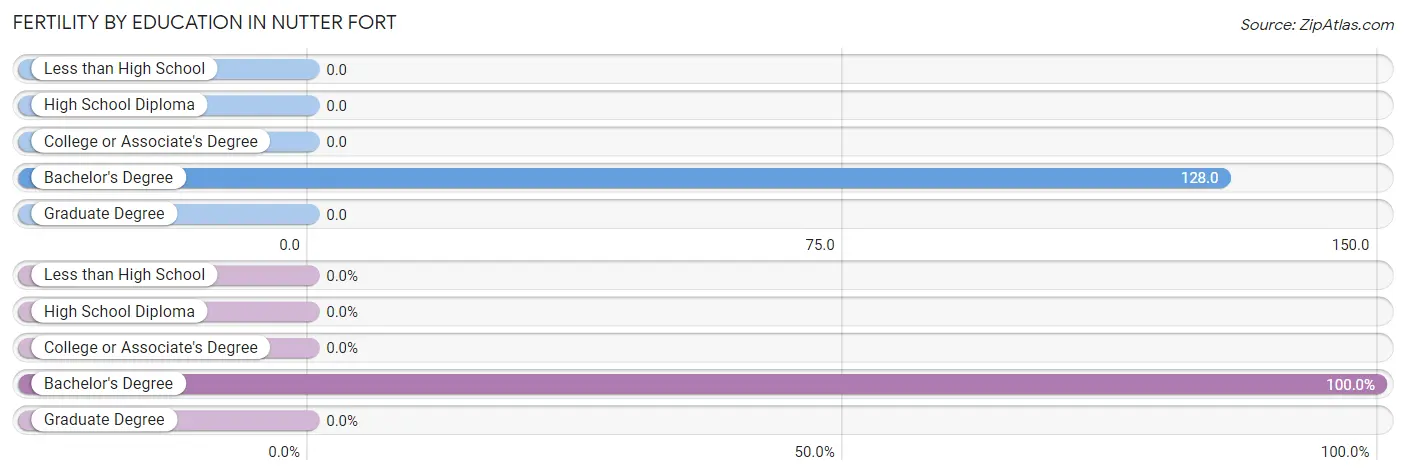
| Educational Attainment | Women with Births | Births / 1,000 Women |
| Less than High School | 0 (0.0%) | 0.0 |
| High School Diploma | 0 (0.0%) | 0.0 |
| College or Associate's Degree | 0 (0.0%) | 0.0 |
| Bachelor's Degree | 6 (100.0%) | 128.0 |
| Graduate Degree | 0 (0.0%) | 0.0 |
| Total | 6 (100.0%) | 14.0 |
Fertility by Education by Marriage Status in Nutter Fort
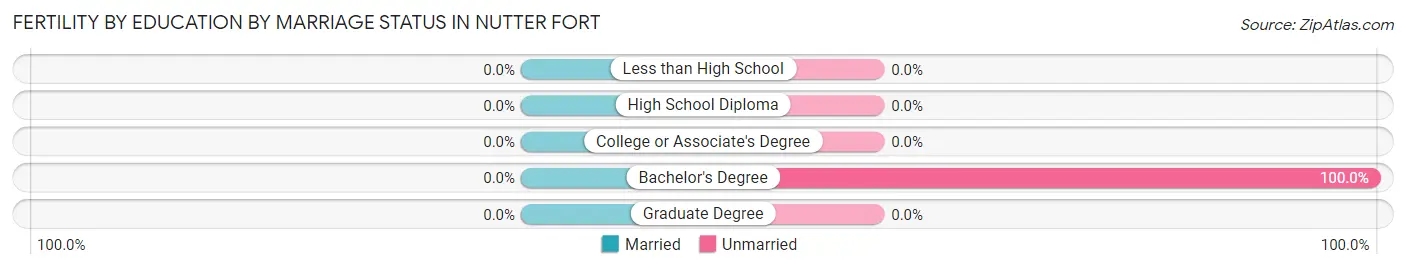
| Educational Attainment | Married | Unmarried |
| Less than High School | 0 (0.0%) | 0 (0.0%) |
| High School Diploma | 0 (0.0%) | 0 (0.0%) |
| College or Associate's Degree | 0 (0.0%) | 0 (0.0%) |
| Bachelor's Degree | 0 (0.0%) | 6 (100.0%) |
| Graduate Degree | 0 (0.0%) | 0 (0.0%) |
| Total | 0 (0.0%) | 6 (100.0%) |
Employment Characteristics in Nutter Fort
Employment by Class of Employer in Nutter Fort
Among the 791 employed individuals in Nutter Fort, private company employees (499 | 63.1%), not-for-profit organizations (102 | 12.9%), and local government employees (55 | 7.0%) make up the most common classes of employment.
| Employer Class | # Employees | % Employees |
| Private Company Employees | 499 | 63.1% |
| Self-Employed (Incorporated) | 25 | 3.2% |
| Self-Employed (Not Incorporated) | 20 | 2.5% |
| Not-for-profit Organizations | 102 | 12.9% |
| Local Government Employees | 55 | 7.0% |
| State Government Employees | 50 | 6.3% |
| Federal Government Employees | 40 | 5.1% |
| Unpaid Family Workers | 0 | 0.0% |
| Total | 791 | 100.0% |
Employment Status by Age in Nutter Fort
According to the labor force statistics for Nutter Fort, out of the total population over 16 years of age (1,364), 64.6% or 881 individuals are in the labor force, with 5.9% or 52 of them unemployed. The age group with the highest labor force participation rate is 20 to 24 years, with 96.3% or 155 individuals in the labor force. Within the labor force, the 16 to 19 years age range has the highest percentage of unemployed individuals, with 14.5% or 10 of them being unemployed.
| Age Bracket | In Labor Force | Unemployed |
| 16 to 19 Years | 69 (77.5%) | 10 (14.5%) |
| 20 to 24 Years | 155 (96.3%) | 22 (14.2%) |
| 25 to 29 Years | 58 (72.5%) | 0 (0.0%) |
| 30 to 34 Years | 105 (78.9%) | 4 (3.8%) |
| 35 to 44 Years | 156 (76.8%) | 9 (5.8%) |
| 45 to 54 Years | 193 (93.7%) | 4 (2.1%) |
| 55 to 59 Years | 26 (30.6%) | 0 (0.0%) |
| 60 to 64 Years | 56 (61.5%) | 0 (0.0%) |
| 65 to 74 Years | 44 (25.9%) | 3 (6.8%) |
| 75 Years and over | 19 (13.0%) | 0 (0.0%) |
| Total | 881 (64.6%) | 52 (5.9%) |
Employment Status by Educational Attainment in Nutter Fort
According to labor force statistics for Nutter Fort, 74.4% of individuals (594) out of the total population between 25 and 64 years of age (798) are in the labor force, with 2.9% or 17 of them being unemployed. The group with the highest labor force participation rate are those with the educational attainment of bachelor's degree or higher, with 91.2% or 177 individuals in the labor force. Within the labor force, individuals with less than high school education have the highest percentage of unemployment, with 17.6% or 9 of them being unemployed.
| Educational Attainment | In Labor Force | Unemployed |
| Less than High School | 51 (48.1%) | 19 (17.6%) |
| High School Diploma | 186 (76.5%) | 5 (2.2%) |
| College / Associate Degree | 180 (70.6%) | 6 (2.2%) |
| Bachelor's Degree or higher | 177 (91.2%) | 0 (0.0%) |
| Total | 594 (74.4%) | 23 (2.9%) |
Employment Occupations by Sex in Nutter Fort
Management, Business, Science and Arts Occupations
The most common Management, Business, Science and Arts occupations in Nutter Fort are Health Diagnosing & Treating (121 | 14.6%), Health Technologists (87 | 10.5%), Community & Social Service (60 | 7.2%), Computers, Engineering & Science (48 | 5.8%), and Education Instruction & Library (33 | 4.0%).
Management, Business, Science and Arts Occupations by Sex
Within the Management, Business, Science and Arts occupations in Nutter Fort, the most male-oriented occupations are Architecture & Engineering (100.0%), Computers, Engineering & Science (81.2%), and Computers & Mathematics (75.0%), while the most female-oriented occupations are Life, Physical & Social Science (100.0%), Legal Services & Support (100.0%), and Education Instruction & Library (90.9%).
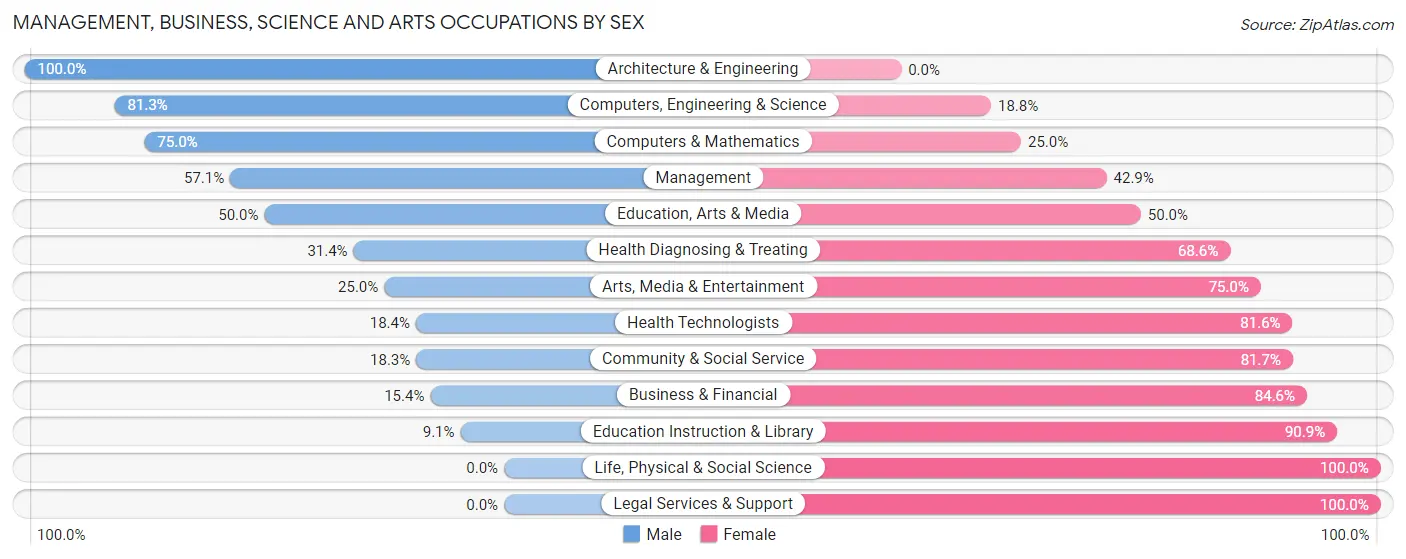
| Occupation | Male | Female |
| Management | 16 (57.1%) | 12 (42.9%) |
| Business & Financial | 2 (15.4%) | 11 (84.6%) |
| Computers, Engineering & Science | 39 (81.2%) | 9 (18.8%) |
| Computers & Mathematics | 9 (75.0%) | 3 (25.0%) |
| Architecture & Engineering | 30 (100.0%) | 0 (0.0%) |
| Life, Physical & Social Science | 0 (0.0%) | 6 (100.0%) |
| Community & Social Service | 11 (18.3%) | 49 (81.7%) |
| Education, Arts & Media | 5 (50.0%) | 5 (50.0%) |
| Legal Services & Support | 0 (0.0%) | 5 (100.0%) |
| Education Instruction & Library | 3 (9.1%) | 30 (90.9%) |
| Arts, Media & Entertainment | 3 (25.0%) | 9 (75.0%) |
| Health Diagnosing & Treating | 38 (31.4%) | 83 (68.6%) |
| Health Technologists | 16 (18.4%) | 71 (81.6%) |
| Total (Category) | 106 (39.3%) | 164 (60.7%) |
| Total (Overall) | 451 (54.4%) | 378 (45.6%) |
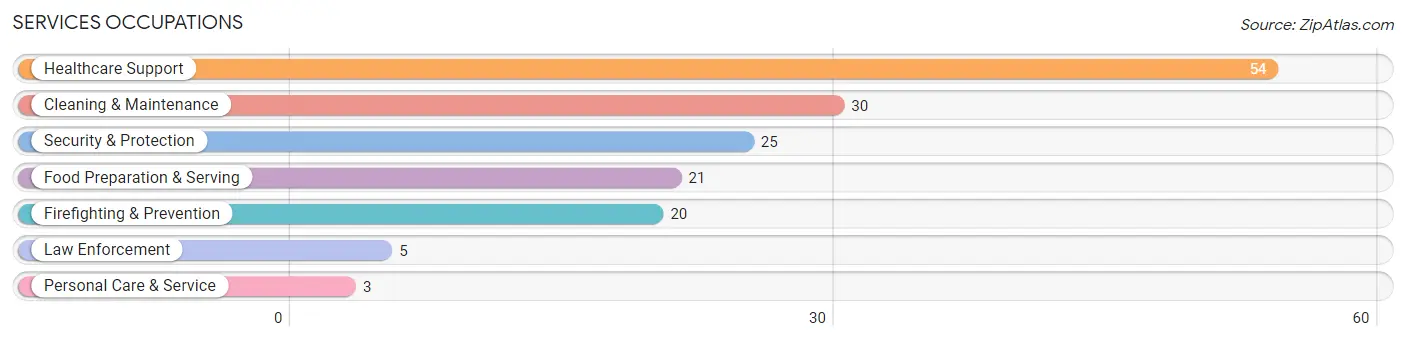
Services Occupations
The most common Services occupations in Nutter Fort are Healthcare Support (54 | 6.5%), Cleaning & Maintenance (30 | 3.6%), Security & Protection (25 | 3.0%), Food Preparation & Serving (21 | 2.5%), and Firefighting & Prevention (20 | 2.4%).
Services Occupations by Sex
Within the Services occupations in Nutter Fort, the most male-oriented occupations are Law Enforcement (100.0%), Personal Care & Service (100.0%), and Security & Protection (68.0%), while the most female-oriented occupations are Food Preparation & Serving (80.9%), Healthcare Support (66.7%), and Cleaning & Maintenance (63.3%).
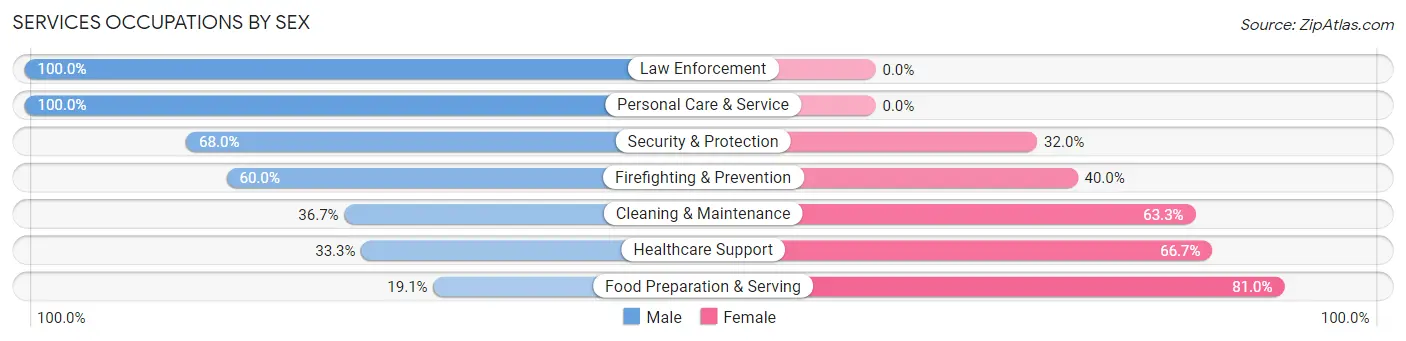
| Occupation | Male | Female |
| Healthcare Support | 18 (33.3%) | 36 (66.7%) |
| Security & Protection | 17 (68.0%) | 8 (32.0%) |
| Firefighting & Prevention | 12 (60.0%) | 8 (40.0%) |
| Law Enforcement | 5 (100.0%) | 0 (0.0%) |
| Food Preparation & Serving | 4 (19.1%) | 17 (80.9%) |
| Cleaning & Maintenance | 11 (36.7%) | 19 (63.3%) |
| Personal Care & Service | 3 (100.0%) | 0 (0.0%) |
| Total (Category) | 53 (39.9%) | 80 (60.2%) |
| Total (Overall) | 451 (54.4%) | 378 (45.6%) |
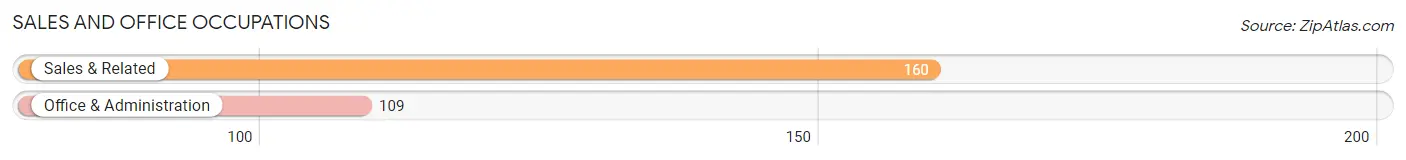
Sales and Office Occupations
The most common Sales and Office occupations in Nutter Fort are Sales & Related (160 | 19.3%), and Office & Administration (109 | 13.2%).
Sales and Office Occupations by Sex
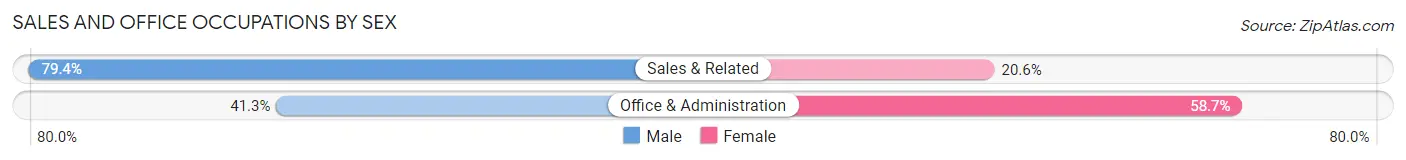
| Occupation | Male | Female |
| Sales & Related | 127 (79.4%) | 33 (20.6%) |
| Office & Administration | 45 (41.3%) | 64 (58.7%) |
| Total (Category) | 172 (63.9%) | 97 (36.1%) |
| Total (Overall) | 451 (54.4%) | 378 (45.6%) |
Natural Resources, Construction and Maintenance Occupations
The most common Natural Resources, Construction and Maintenance occupations in Nutter Fort are Construction & Extraction (20 | 2.4%), and Farming, Fishing & Forestry (4 | 0.5%).
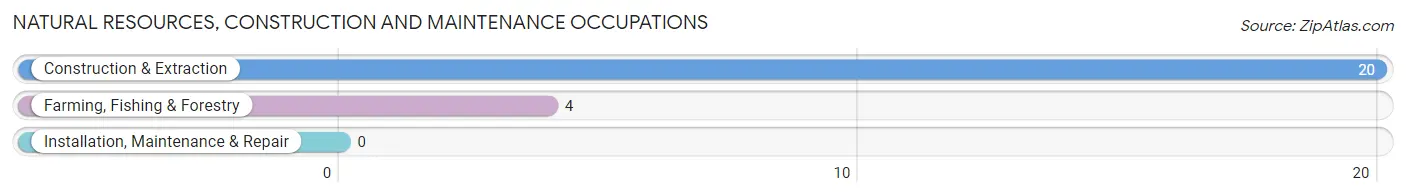
Natural Resources, Construction and Maintenance Occupations by Sex
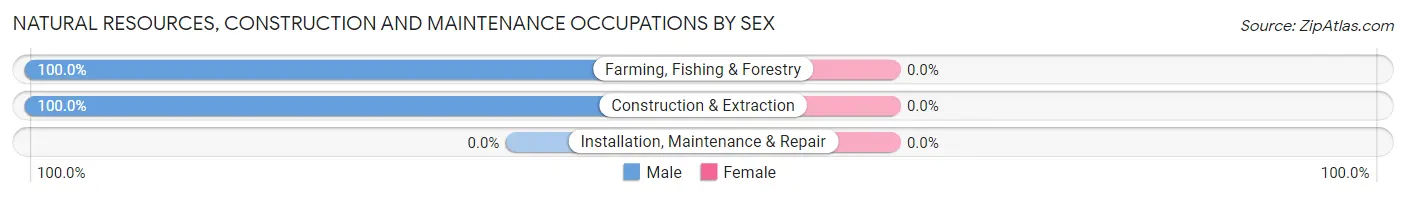
| Occupation | Male | Female |
| Farming, Fishing & Forestry | 4 (100.0%) | 0 (0.0%) |
| Construction & Extraction | 20 (100.0%) | 0 (0.0%) |
| Installation, Maintenance & Repair | 0 (0.0%) | 0 (0.0%) |
| Total (Category) | 24 (100.0%) | 0 (0.0%) |
| Total (Overall) | 451 (54.4%) | 378 (45.6%) |
Production, Transportation and Moving Occupations
The most common Production, Transportation and Moving occupations in Nutter Fort are Production (65 | 7.8%), Transportation (49 | 5.9%), and Material Moving (19 | 2.3%).
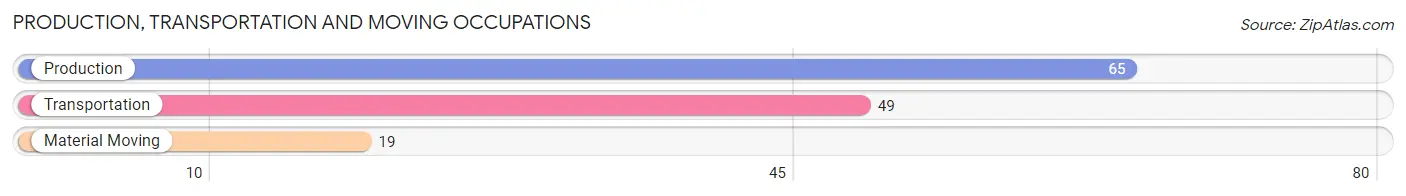
Production, Transportation and Moving Occupations by Sex
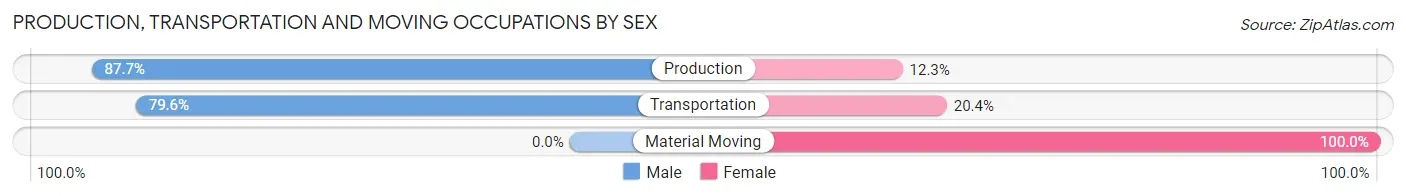
| Occupation | Male | Female |
| Production | 57 (87.7%) | 8 (12.3%) |
| Transportation | 39 (79.6%) | 10 (20.4%) |
| Material Moving | 0 (0.0%) | 19 (100.0%) |
| Total (Category) | 96 (72.2%) | 37 (27.8%) |
| Total (Overall) | 451 (54.4%) | 378 (45.6%) |
Employment Industries by Sex in Nutter Fort
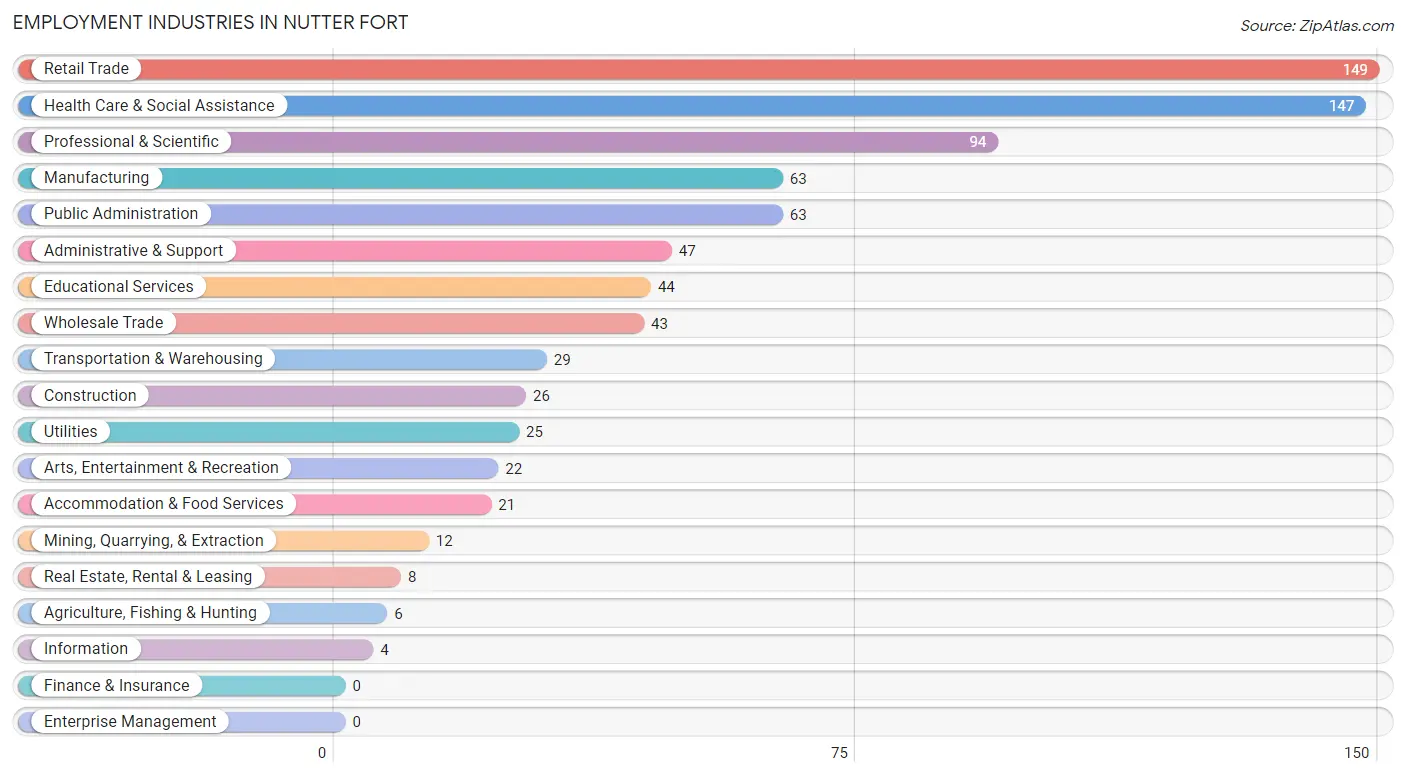
Employment Industries in Nutter Fort
The major employment industries in Nutter Fort include Retail Trade (149 | 18.0%), Health Care & Social Assistance (147 | 17.7%), Professional & Scientific (94 | 11.3%), Manufacturing (63 | 7.6%), and Public Administration (63 | 7.6%).
Employment Industries by Sex in Nutter Fort
The Nutter Fort industries that see more men than women are Mining, Quarrying, & Extraction (100.0%), Construction (100.0%), and Utilities (100.0%), whereas the industries that tend to have a higher number of women are Administrative & Support (93.6%), Educational Services (86.4%), and Accommodation & Food Services (80.9%).
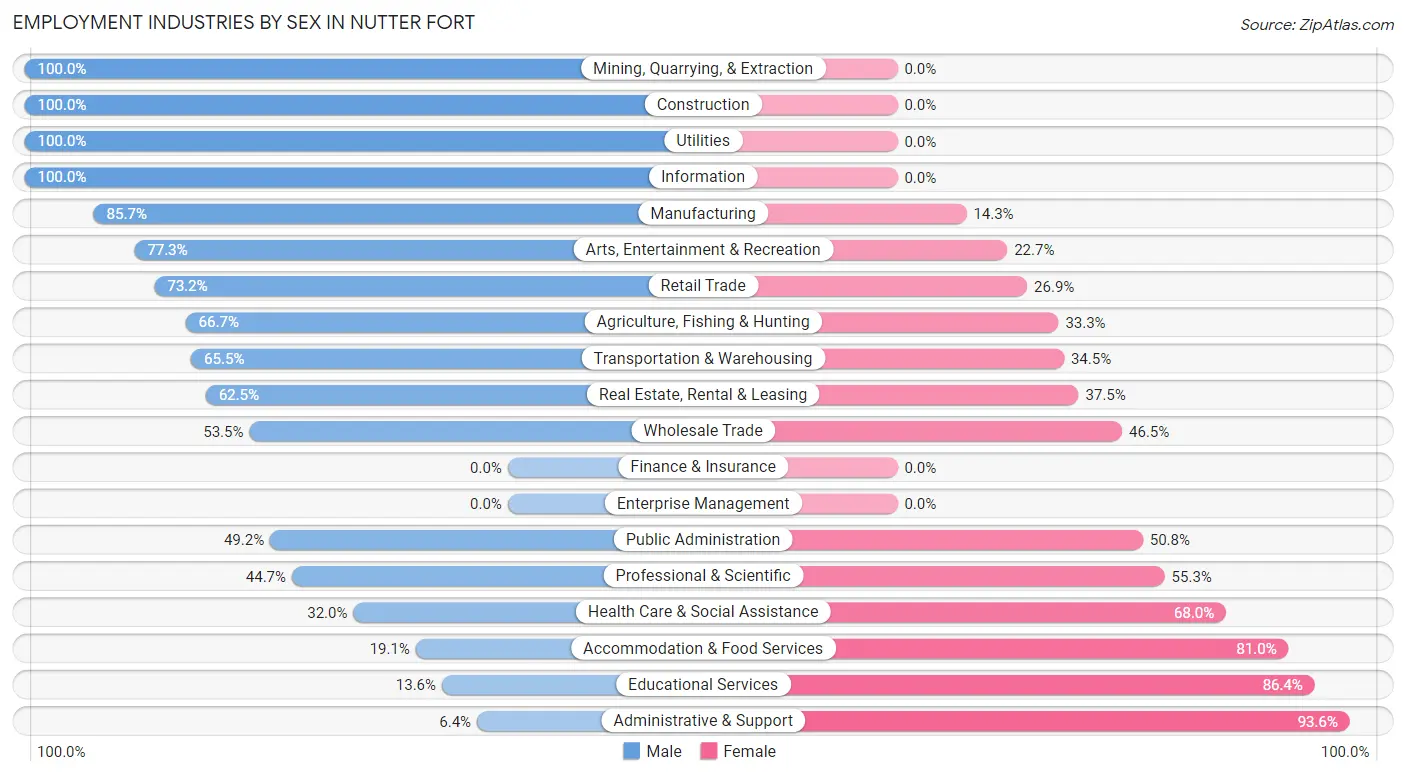
| Industry | Male | Female |
| Agriculture, Fishing & Hunting | 4 (66.7%) | 2 (33.3%) |
| Mining, Quarrying, & Extraction | 12 (100.0%) | 0 (0.0%) |
| Construction | 26 (100.0%) | 0 (0.0%) |
| Manufacturing | 54 (85.7%) | 9 (14.3%) |
| Wholesale Trade | 23 (53.5%) | 20 (46.5%) |
| Retail Trade | 109 (73.2%) | 40 (26.9%) |
| Transportation & Warehousing | 19 (65.5%) | 10 (34.5%) |
| Utilities | 25 (100.0%) | 0 (0.0%) |
| Information | 4 (100.0%) | 0 (0.0%) |
| Finance & Insurance | 0 (0.0%) | 0 (0.0%) |
| Real Estate, Rental & Leasing | 5 (62.5%) | 3 (37.5%) |
| Professional & Scientific | 42 (44.7%) | 52 (55.3%) |
| Enterprise Management | 0 (0.0%) | 0 (0.0%) |
| Administrative & Support | 3 (6.4%) | 44 (93.6%) |
| Educational Services | 6 (13.6%) | 38 (86.4%) |
| Health Care & Social Assistance | 47 (32.0%) | 100 (68.0%) |
| Arts, Entertainment & Recreation | 17 (77.3%) | 5 (22.7%) |
| Accommodation & Food Services | 4 (19.1%) | 17 (80.9%) |
| Public Administration | 31 (49.2%) | 32 (50.8%) |
| Total | 451 (54.4%) | 378 (45.6%) |
Education in Nutter Fort
School Enrollment in Nutter Fort
The most common levels of schooling among the 387 students in Nutter Fort are middle school (108 | 27.9%), college / undergraduate (93 | 24.0%), and high school (60 | 15.5%).
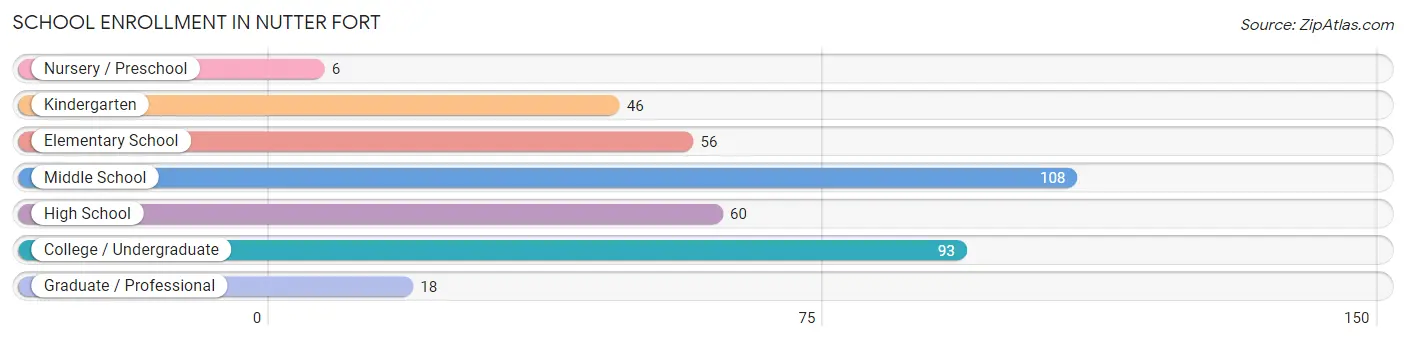
| School Level | # Students | % Students |
| Nursery / Preschool | 6 | 1.5% |
| Kindergarten | 46 | 11.9% |
| Elementary School | 56 | 14.5% |
| Middle School | 108 | 27.9% |
| High School | 60 | 15.5% |
| College / Undergraduate | 93 | 24.0% |
| Graduate / Professional | 18 | 4.6% |
| Total | 387 | 100.0% |
School Enrollment by Age by Funding Source in Nutter Fort
Out of a total of 387 students who are enrolled in schools in Nutter Fort, 56 (14.5%) attend a private institution, while the remaining 331 (85.5%) are enrolled in public schools. The age group of 35 years and over has the highest likelihood of being enrolled in private schools, with 6 (54.5% in the age bracket) enrolled. Conversely, the age group of 3 to 4 year olds has the lowest likelihood of being enrolled in a private school, with 6 (100.0% in the age bracket) attending a public institution.
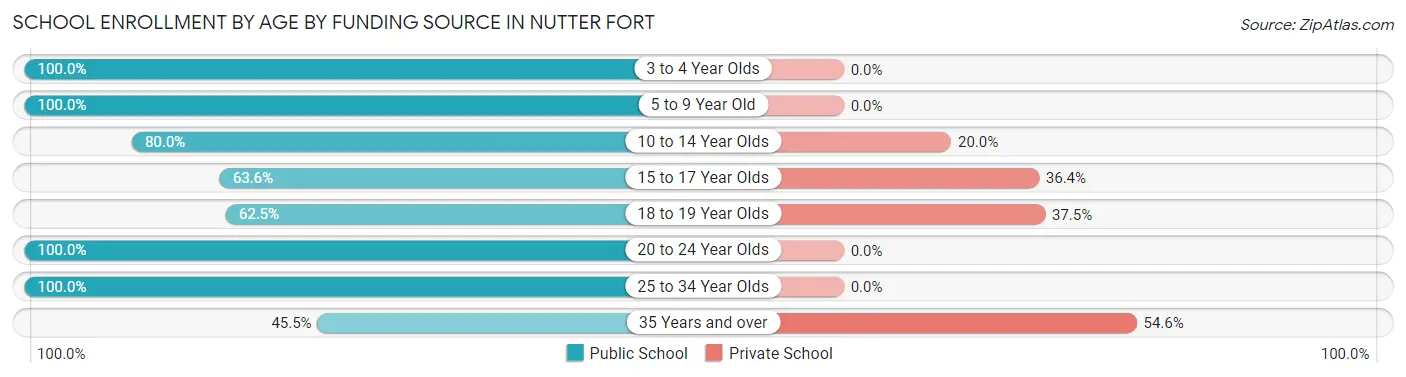
| Age Bracket | Public School | Private School |
| 3 to 4 Year Olds | 6 (100.0%) | 0 (0.0%) |
| 5 to 9 Year Old | 80 (100.0%) | 0 (0.0%) |
| 10 to 14 Year Olds | 108 (80.0%) | 27 (20.0%) |
| 15 to 17 Year Olds | 35 (63.6%) | 20 (36.4%) |
| 18 to 19 Year Olds | 5 (62.5%) | 3 (37.5%) |
| 20 to 24 Year Olds | 67 (100.0%) | 0 (0.0%) |
| 25 to 34 Year Olds | 25 (100.0%) | 0 (0.0%) |
| 35 Years and over | 5 (45.5%) | 6 (54.5%) |
| Total | 331 (85.5%) | 56 (14.5%) |
Educational Attainment by Field of Study in Nutter Fort
Bio, nature & agricultural (40 | 15.7%), business (34 | 13.3%), science & technology (32 | 12.6%), education (32 | 12.6%), and computers & mathematics (28 | 11.0%) are the most common fields of study among 255 individuals in Nutter Fort who have obtained a bachelor's degree or higher.
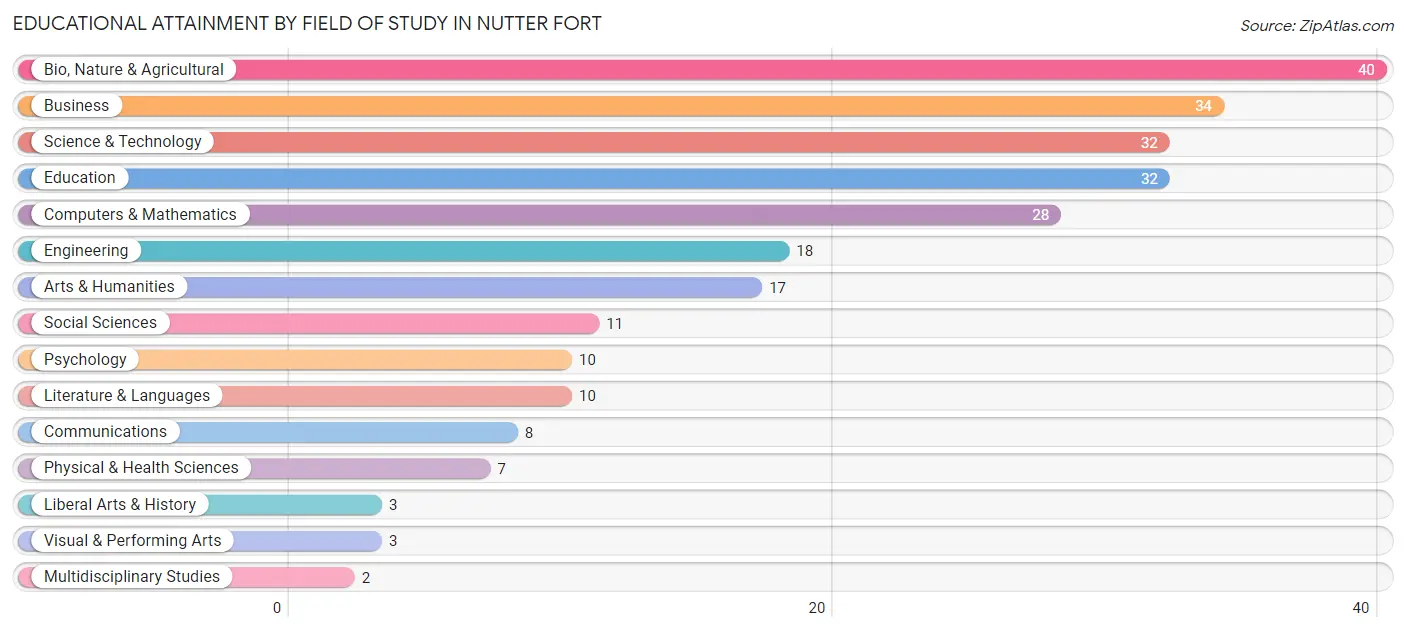
| Field of Study | # Graduates | % Graduates |
| Computers & Mathematics | 28 | 11.0% |
| Bio, Nature & Agricultural | 40 | 15.7% |
| Physical & Health Sciences | 7 | 2.8% |
| Psychology | 10 | 3.9% |
| Social Sciences | 11 | 4.3% |
| Engineering | 18 | 7.1% |
| Multidisciplinary Studies | 2 | 0.8% |
| Science & Technology | 32 | 12.6% |
| Business | 34 | 13.3% |
| Education | 32 | 12.6% |
| Literature & Languages | 10 | 3.9% |
| Liberal Arts & History | 3 | 1.2% |
| Visual & Performing Arts | 3 | 1.2% |
| Communications | 8 | 3.1% |
| Arts & Humanities | 17 | 6.7% |
| Total | 255 | 100.0% |
Transportation & Commute in Nutter Fort
Vehicle Availability by Sex in Nutter Fort
The most prevalent vehicle ownership categories in Nutter Fort are males with 2 vehicles (246, accounting for 54.8%) and females with 2 vehicles (196, making up 72.4%).
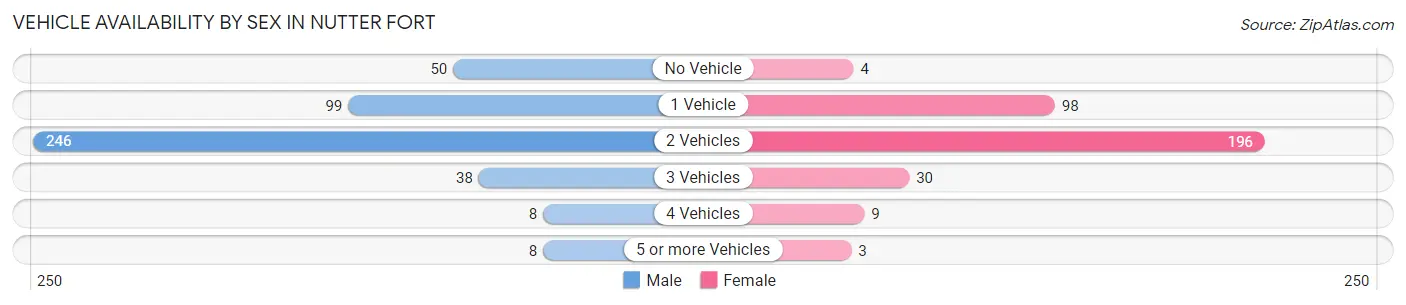
| Vehicles Available | Male | Female |
| No Vehicle | 50 (11.1%) | 4 (1.2%) |
| 1 Vehicle | 99 (22.1%) | 98 (28.8%) |
| 2 Vehicles | 246 (54.8%) | 196 (57.7%) |
| 3 Vehicles | 38 (8.5%) | 30 (8.8%) |
| 4 Vehicles | 8 (1.8%) | 9 (2.6%) |
| 5 or more Vehicles | 8 (1.8%) | 3 (0.9%) |
| Total | 449 (100.0%) | 340 (100.0%) |
Commute Time in Nutter Fort
The most frequently occuring commute durations in Nutter Fort are 15 to 19 minutes (203 commuters, 26.6%), 5 to 9 minutes (170 commuters, 22.3%), and 10 to 14 minutes (120 commuters, 15.8%).
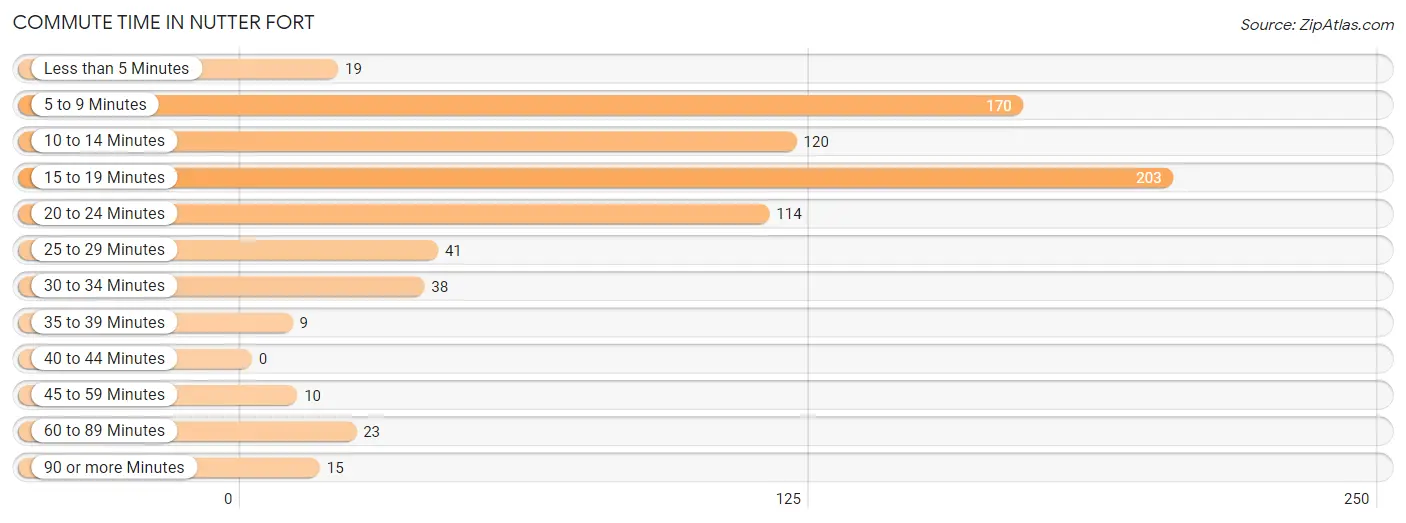
| Commute Time | # Commuters | % Commuters |
| Less than 5 Minutes | 19 | 2.5% |
| 5 to 9 Minutes | 170 | 22.3% |
| 10 to 14 Minutes | 120 | 15.8% |
| 15 to 19 Minutes | 203 | 26.6% |
| 20 to 24 Minutes | 114 | 15.0% |
| 25 to 29 Minutes | 41 | 5.4% |
| 30 to 34 Minutes | 38 | 5.0% |
| 35 to 39 Minutes | 9 | 1.2% |
| 40 to 44 Minutes | 0 | 0.0% |
| 45 to 59 Minutes | 10 | 1.3% |
| 60 to 89 Minutes | 23 | 3.0% |
| 90 or more Minutes | 15 | 2.0% |
Commute Time by Sex in Nutter Fort
The most common commute times in Nutter Fort are 15 to 19 minutes (147 commuters, 33.4%) for males and 5 to 9 minutes (80 commuters, 24.8%) for females.
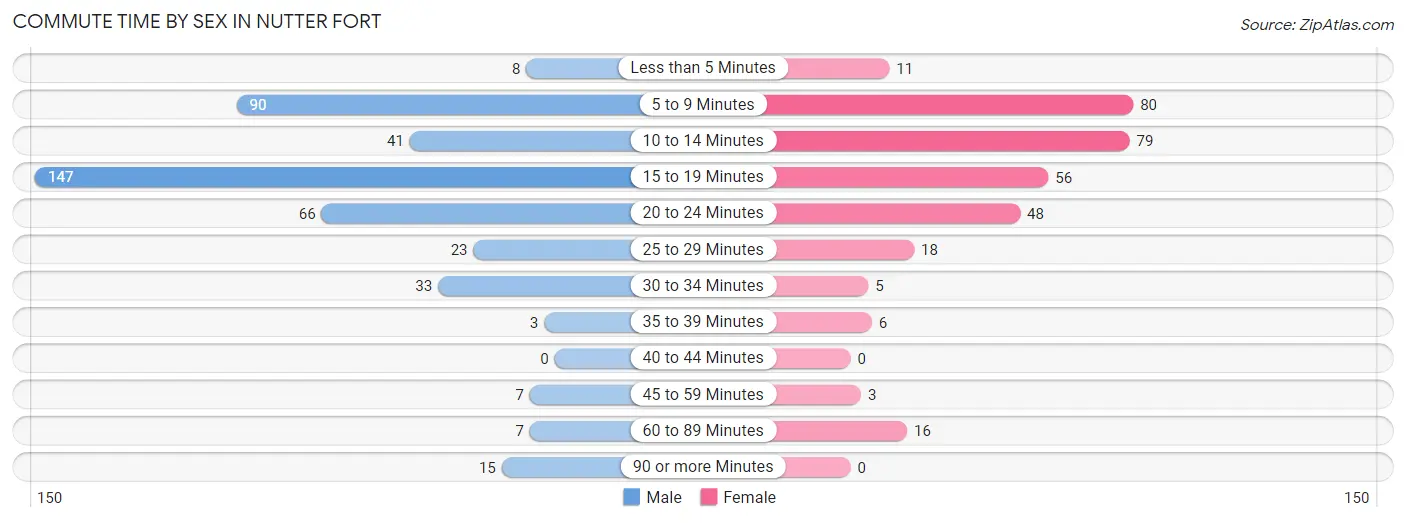
| Commute Time | Male | Female |
| Less than 5 Minutes | 8 (1.8%) | 11 (3.4%) |
| 5 to 9 Minutes | 90 (20.4%) | 80 (24.8%) |
| 10 to 14 Minutes | 41 (9.3%) | 79 (24.5%) |
| 15 to 19 Minutes | 147 (33.4%) | 56 (17.4%) |
| 20 to 24 Minutes | 66 (15.0%) | 48 (14.9%) |
| 25 to 29 Minutes | 23 (5.2%) | 18 (5.6%) |
| 30 to 34 Minutes | 33 (7.5%) | 5 (1.5%) |
| 35 to 39 Minutes | 3 (0.7%) | 6 (1.9%) |
| 40 to 44 Minutes | 0 (0.0%) | 0 (0.0%) |
| 45 to 59 Minutes | 7 (1.6%) | 3 (0.9%) |
| 60 to 89 Minutes | 7 (1.6%) | 16 (5.0%) |
| 90 or more Minutes | 15 (3.4%) | 0 (0.0%) |
Time of Departure to Work by Sex in Nutter Fort
The most frequent times of departure to work in Nutter Fort are 7:30 AM to 7:59 AM (101, 23.0%) for males and 7:30 AM to 7:59 AM (49, 15.2%) for females.
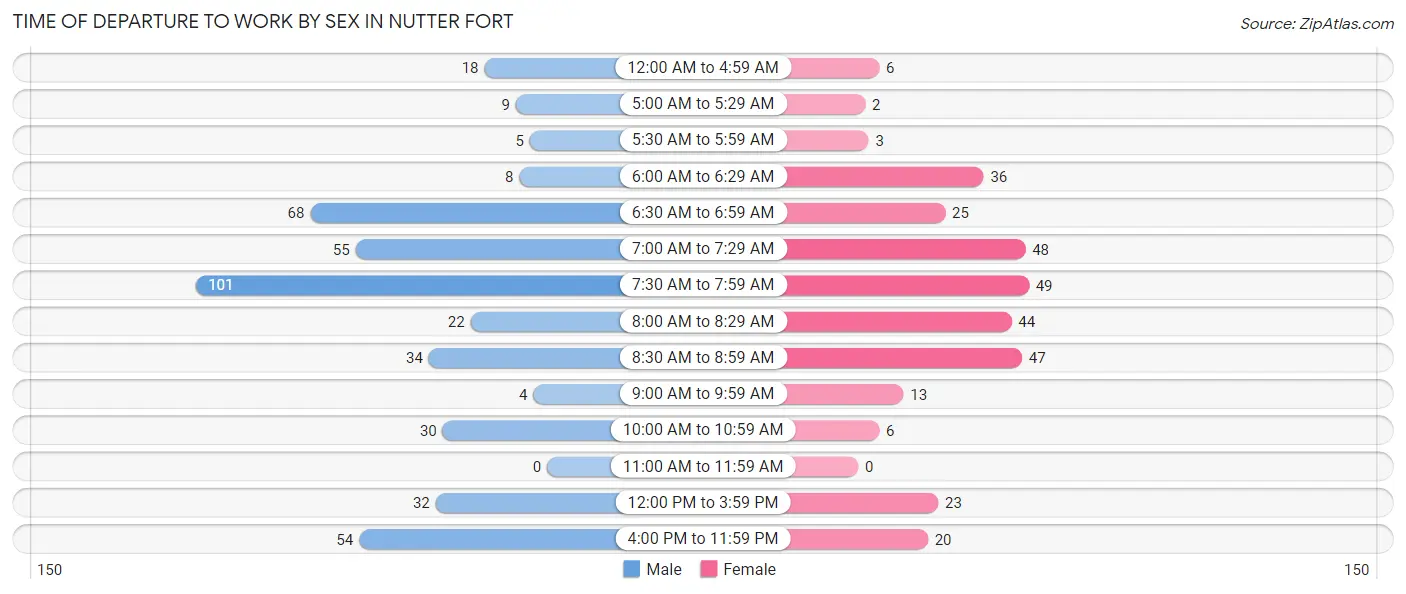
| Time of Departure | Male | Female |
| 12:00 AM to 4:59 AM | 18 (4.1%) | 6 (1.9%) |
| 5:00 AM to 5:29 AM | 9 (2.1%) | 2 (0.6%) |
| 5:30 AM to 5:59 AM | 5 (1.1%) | 3 (0.9%) |
| 6:00 AM to 6:29 AM | 8 (1.8%) | 36 (11.2%) |
| 6:30 AM to 6:59 AM | 68 (15.4%) | 25 (7.8%) |
| 7:00 AM to 7:29 AM | 55 (12.5%) | 48 (14.9%) |
| 7:30 AM to 7:59 AM | 101 (23.0%) | 49 (15.2%) |
| 8:00 AM to 8:29 AM | 22 (5.0%) | 44 (13.7%) |
| 8:30 AM to 8:59 AM | 34 (7.7%) | 47 (14.6%) |
| 9:00 AM to 9:59 AM | 4 (0.9%) | 13 (4.0%) |
| 10:00 AM to 10:59 AM | 30 (6.8%) | 6 (1.9%) |
| 11:00 AM to 11:59 AM | 0 (0.0%) | 0 (0.0%) |
| 12:00 PM to 3:59 PM | 32 (7.3%) | 23 (7.1%) |
| 4:00 PM to 11:59 PM | 54 (12.3%) | 20 (6.2%) |
| Total | 440 (100.0%) | 322 (100.0%) |
Housing Occupancy in Nutter Fort
Occupancy by Ownership in Nutter Fort
Of the total 688 dwellings in Nutter Fort, owner-occupied units account for 484 (70.4%), while renter-occupied units make up 204 (29.6%).
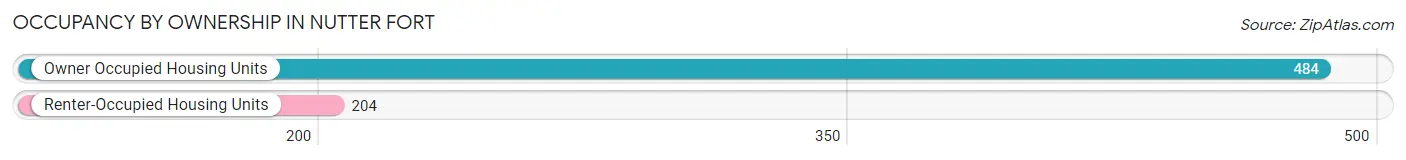
| Occupancy | # Housing Units | % Housing Units |
| Owner Occupied Housing Units | 484 | 70.4% |
| Renter-Occupied Housing Units | 204 | 29.6% |
| Total Occupied Housing Units | 688 | 100.0% |
Occupancy by Household Size in Nutter Fort
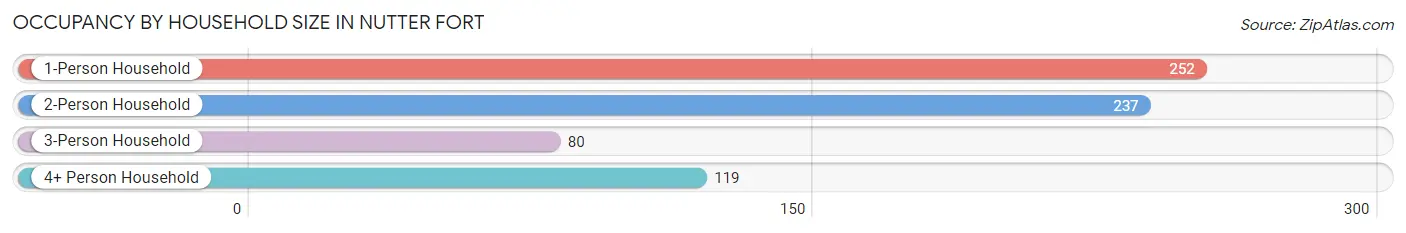
| Household Size | # Housing Units | % Housing Units |
| 1-Person Household | 252 | 36.6% |
| 2-Person Household | 237 | 34.4% |
| 3-Person Household | 80 | 11.6% |
| 4+ Person Household | 119 | 17.3% |
| Total Housing Units | 688 | 100.0% |
Occupancy by Ownership by Household Size in Nutter Fort
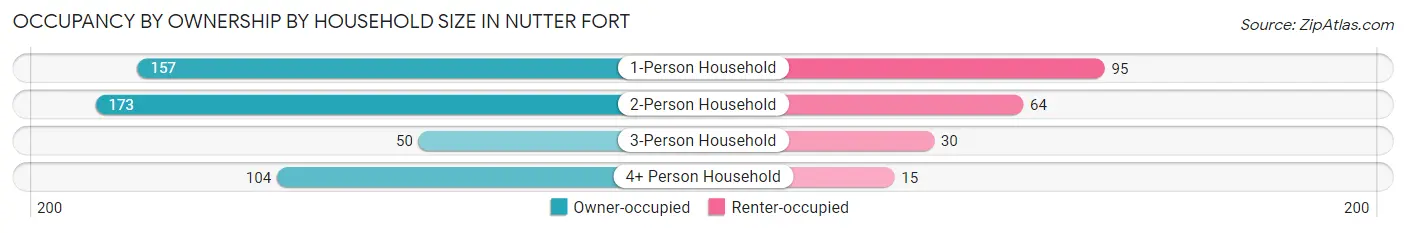
| Household Size | Owner-occupied | Renter-occupied |
| 1-Person Household | 157 (62.3%) | 95 (37.7%) |
| 2-Person Household | 173 (73.0%) | 64 (27.0%) |
| 3-Person Household | 50 (62.5%) | 30 (37.5%) |
| 4+ Person Household | 104 (87.4%) | 15 (12.6%) |
| Total Housing Units | 484 (70.4%) | 204 (29.6%) |
Occupancy by Educational Attainment in Nutter Fort
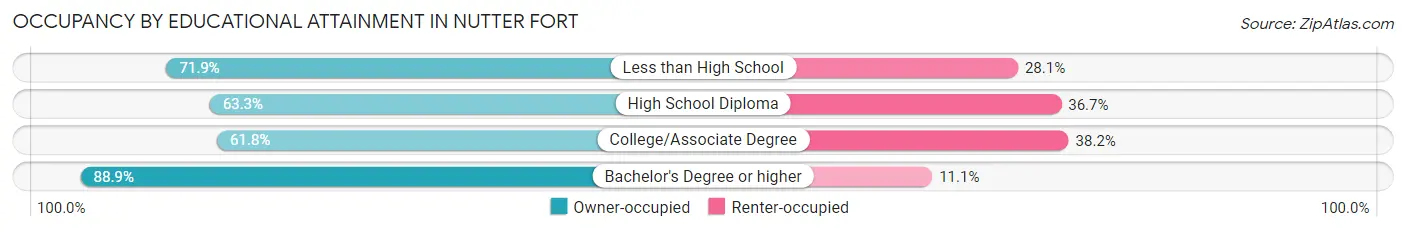
| Household Size | Owner-occupied | Renter-occupied |
| Less than High School | 46 (71.9%) | 18 (28.1%) |
| High School Diploma | 150 (63.3%) | 87 (36.7%) |
| College/Associate Degree | 128 (61.8%) | 79 (38.2%) |
| Bachelor's Degree or higher | 160 (88.9%) | 20 (11.1%) |
Occupancy by Age of Householder in Nutter Fort
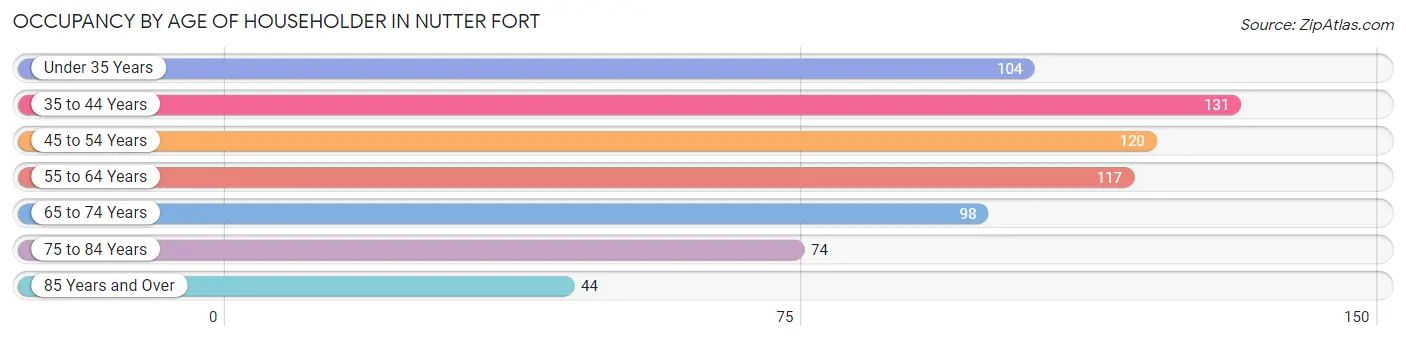
| Age Bracket | # Households | % Households |
| Under 35 Years | 104 | 15.1% |
| 35 to 44 Years | 131 | 19.0% |
| 45 to 54 Years | 120 | 17.4% |
| 55 to 64 Years | 117 | 17.0% |
| 65 to 74 Years | 98 | 14.2% |
| 75 to 84 Years | 74 | 10.8% |
| 85 Years and Over | 44 | 6.4% |
| Total | 688 | 100.0% |
Housing Finances in Nutter Fort
Median Income by Occupancy in Nutter Fort
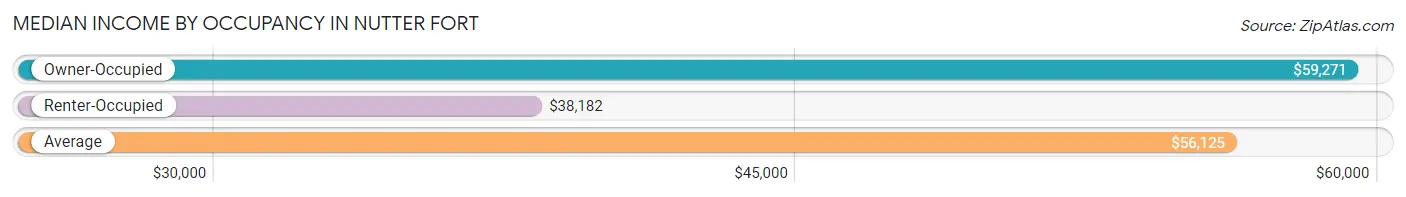
| Occupancy Type | # Households | Median Income |
| Owner-Occupied | 484 (70.4%) | $59,271 |
| Renter-Occupied | 204 (29.6%) | $38,182 |
| Average | 688 (100.0%) | $56,125 |
Occupancy by Householder Income Bracket in Nutter Fort
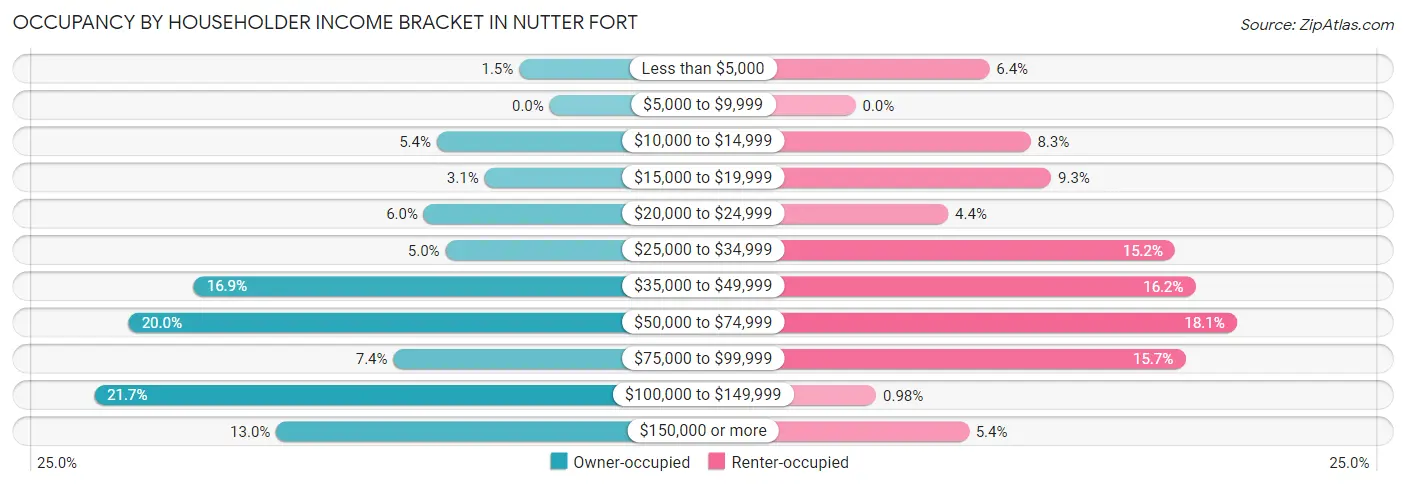
| Income Bracket | Owner-occupied | Renter-occupied |
| Less than $5,000 | 7 (1.5%) | 13 (6.4%) |
| $5,000 to $9,999 | 0 (0.0%) | 0 (0.0%) |
| $10,000 to $14,999 | 26 (5.4%) | 17 (8.3%) |
| $15,000 to $19,999 | 15 (3.1%) | 19 (9.3%) |
| $20,000 to $24,999 | 29 (6.0%) | 9 (4.4%) |
| $25,000 to $34,999 | 24 (5.0%) | 31 (15.2%) |
| $35,000 to $49,999 | 82 (16.9%) | 33 (16.2%) |
| $50,000 to $74,999 | 97 (20.0%) | 37 (18.1%) |
| $75,000 to $99,999 | 36 (7.4%) | 32 (15.7%) |
| $100,000 to $149,999 | 105 (21.7%) | 2 (1.0%) |
| $150,000 or more | 63 (13.0%) | 11 (5.4%) |
| Total | 484 (100.0%) | 204 (100.0%) |
Monthly Housing Cost Tiers in Nutter Fort
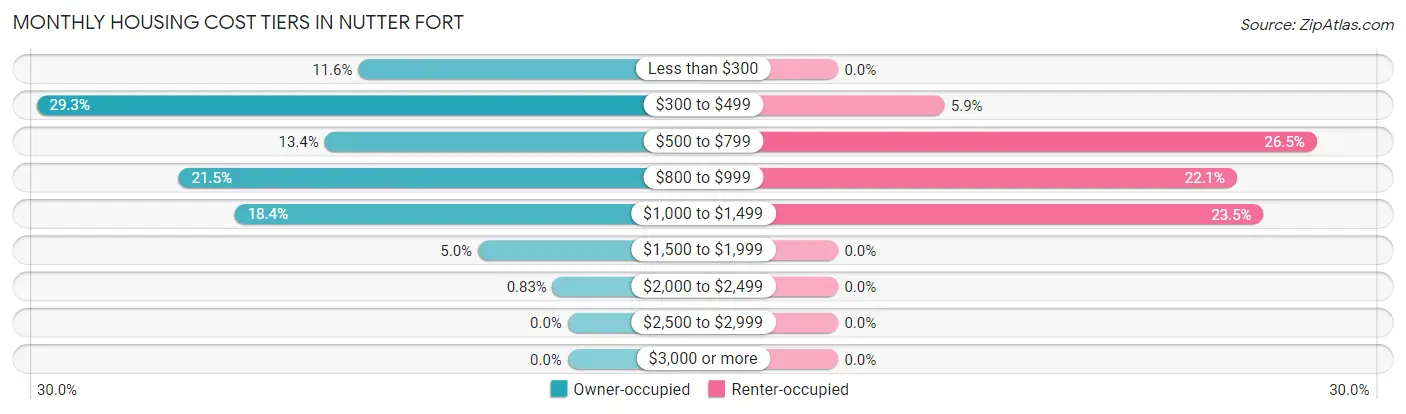
| Monthly Cost | Owner-occupied | Renter-occupied |
| Less than $300 | 56 (11.6%) | 0 (0.0%) |
| $300 to $499 | 142 (29.3%) | 12 (5.9%) |
| $500 to $799 | 65 (13.4%) | 54 (26.5%) |
| $800 to $999 | 104 (21.5%) | 45 (22.1%) |
| $1,000 to $1,499 | 89 (18.4%) | 48 (23.5%) |
| $1,500 to $1,999 | 24 (5.0%) | 0 (0.0%) |
| $2,000 to $2,499 | 4 (0.8%) | 0 (0.0%) |
| $2,500 to $2,999 | 0 (0.0%) | 0 (0.0%) |
| $3,000 or more | 0 (0.0%) | 0 (0.0%) |
| Total | 484 (100.0%) | 204 (100.0%) |
Physical Housing Characteristics in Nutter Fort
Housing Structures in Nutter Fort
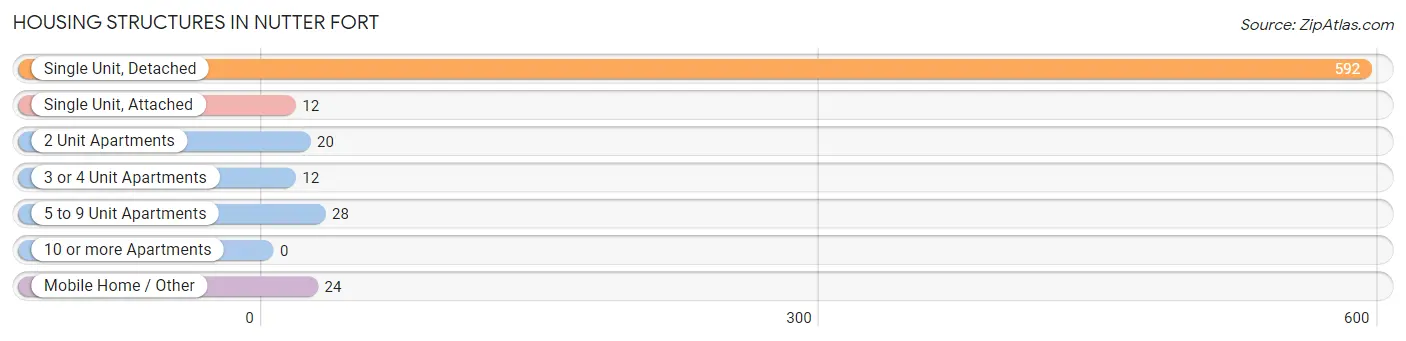
| Structure Type | # Housing Units | % Housing Units |
| Single Unit, Detached | 592 | 86.1% |
| Single Unit, Attached | 12 | 1.7% |
| 2 Unit Apartments | 20 | 2.9% |
| 3 or 4 Unit Apartments | 12 | 1.7% |
| 5 to 9 Unit Apartments | 28 | 4.1% |
| 10 or more Apartments | 0 | 0.0% |
| Mobile Home / Other | 24 | 3.5% |
| Total | 688 | 100.0% |
Housing Structures by Occupancy in Nutter Fort
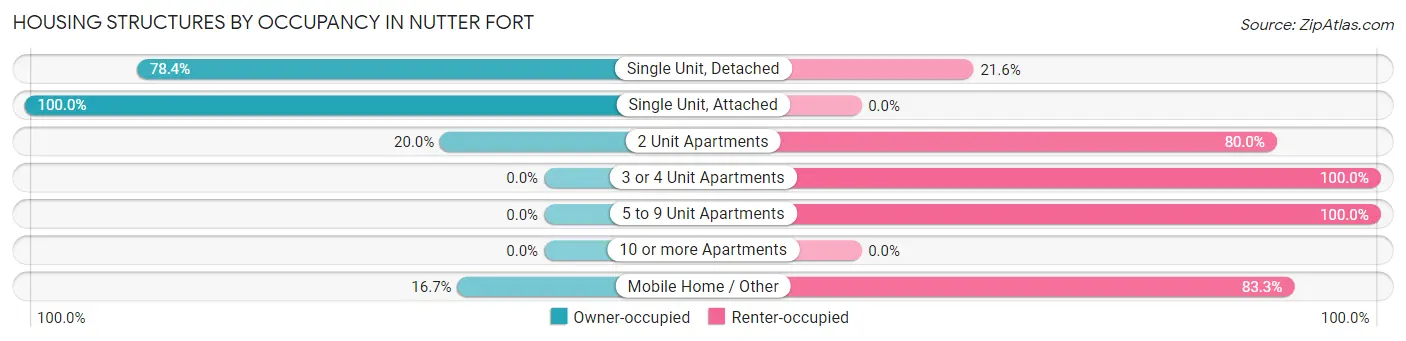
| Structure Type | Owner-occupied | Renter-occupied |
| Single Unit, Detached | 464 (78.4%) | 128 (21.6%) |
| Single Unit, Attached | 12 (100.0%) | 0 (0.0%) |
| 2 Unit Apartments | 4 (20.0%) | 16 (80.0%) |
| 3 or 4 Unit Apartments | 0 (0.0%) | 12 (100.0%) |
| 5 to 9 Unit Apartments | 0 (0.0%) | 28 (100.0%) |
| 10 or more Apartments | 0 (0.0%) | 0 (0.0%) |
| Mobile Home / Other | 4 (16.7%) | 20 (83.3%) |
| Total | 484 (70.4%) | 204 (29.6%) |
Housing Structures by Number of Rooms in Nutter Fort
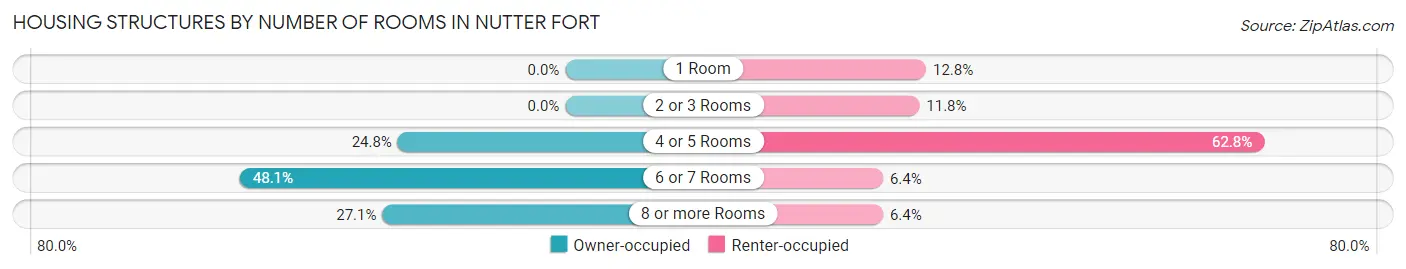
| Number of Rooms | Owner-occupied | Renter-occupied |
| 1 Room | 0 (0.0%) | 26 (12.8%) |
| 2 or 3 Rooms | 0 (0.0%) | 24 (11.8%) |
| 4 or 5 Rooms | 120 (24.8%) | 128 (62.7%) |
| 6 or 7 Rooms | 233 (48.1%) | 13 (6.4%) |
| 8 or more Rooms | 131 (27.1%) | 13 (6.4%) |
| Total | 484 (100.0%) | 204 (100.0%) |
Housing Structure by Heating Type in Nutter Fort
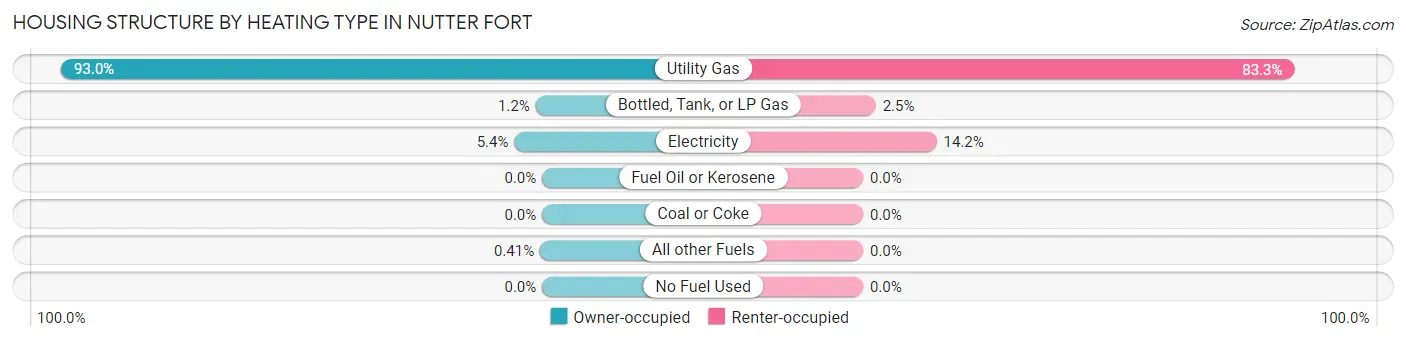
| Heating Type | Owner-occupied | Renter-occupied |
| Utility Gas | 450 (93.0%) | 170 (83.3%) |
| Bottled, Tank, or LP Gas | 6 (1.2%) | 5 (2.5%) |
| Electricity | 26 (5.4%) | 29 (14.2%) |
| Fuel Oil or Kerosene | 0 (0.0%) | 0 (0.0%) |
| Coal or Coke | 0 (0.0%) | 0 (0.0%) |
| All other Fuels | 2 (0.4%) | 0 (0.0%) |
| No Fuel Used | 0 (0.0%) | 0 (0.0%) |
| Total | 484 (100.0%) | 204 (100.0%) |
Household Vehicle Usage in Nutter Fort
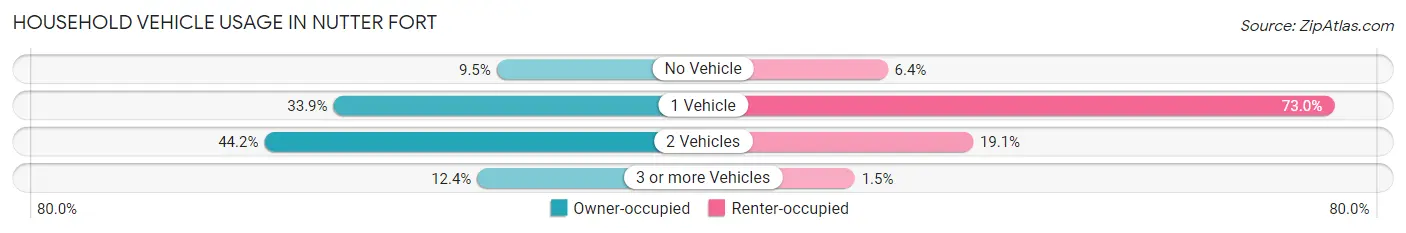
| Vehicles per Household | Owner-occupied | Renter-occupied |
| No Vehicle | 46 (9.5%) | 13 (6.4%) |
| 1 Vehicle | 164 (33.9%) | 149 (73.0%) |
| 2 Vehicles | 214 (44.2%) | 39 (19.1%) |
| 3 or more Vehicles | 60 (12.4%) | 3 (1.5%) |
| Total | 484 (100.0%) | 204 (100.0%) |
Real Estate & Mortgages in Nutter Fort
Real Estate and Mortgage Overview in Nutter Fort
| Characteristic | Without Mortgage | With Mortgage |
| Housing Units | 208 | 276 |
| Median Property Value | $98,600 | $122,900 |
| Median Household Income | $44,286 | $43 |
| Monthly Housing Costs | $366 | $0 |
| Real Estate Taxes | $557 | $3 |
Property Value by Mortgage Status in Nutter Fort
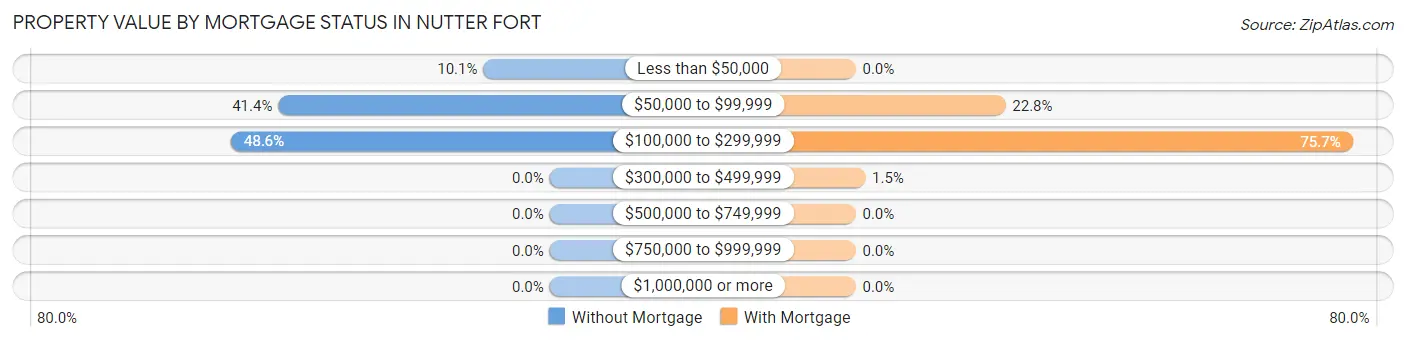
| Property Value | Without Mortgage | With Mortgage |
| Less than $50,000 | 21 (10.1%) | 0 (0.0%) |
| $50,000 to $99,999 | 86 (41.3%) | 63 (22.8%) |
| $100,000 to $299,999 | 101 (48.6%) | 209 (75.7%) |
| $300,000 to $499,999 | 0 (0.0%) | 4 (1.5%) |
| $500,000 to $749,999 | 0 (0.0%) | 0 (0.0%) |
| $750,000 to $999,999 | 0 (0.0%) | 0 (0.0%) |
| $1,000,000 or more | 0 (0.0%) | 0 (0.0%) |
| Total | 208 (100.0%) | 276 (100.0%) |
Household Income by Mortgage Status in Nutter Fort
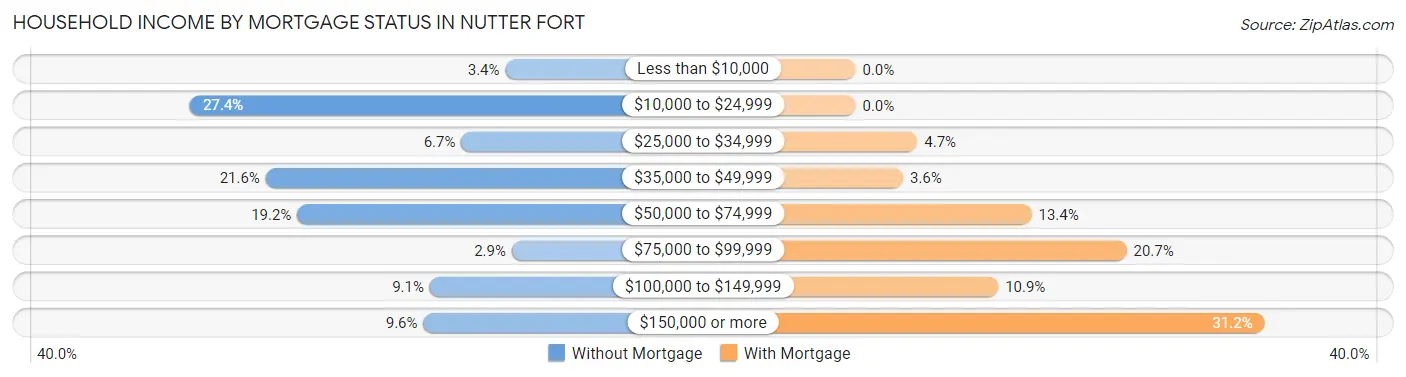
| Household Income | Without Mortgage | With Mortgage |
| Less than $10,000 | 7 (3.4%) | 0 (0.0%) |
| $10,000 to $24,999 | 57 (27.4%) | 0 (0.0%) |
| $25,000 to $34,999 | 14 (6.7%) | 13 (4.7%) |
| $35,000 to $49,999 | 45 (21.6%) | 10 (3.6%) |
| $50,000 to $74,999 | 40 (19.2%) | 37 (13.4%) |
| $75,000 to $99,999 | 6 (2.9%) | 57 (20.6%) |
| $100,000 to $149,999 | 19 (9.1%) | 30 (10.9%) |
| $150,000 or more | 20 (9.6%) | 86 (31.2%) |
| Total | 208 (100.0%) | 276 (100.0%) |
Property Value to Household Income Ratio in Nutter Fort
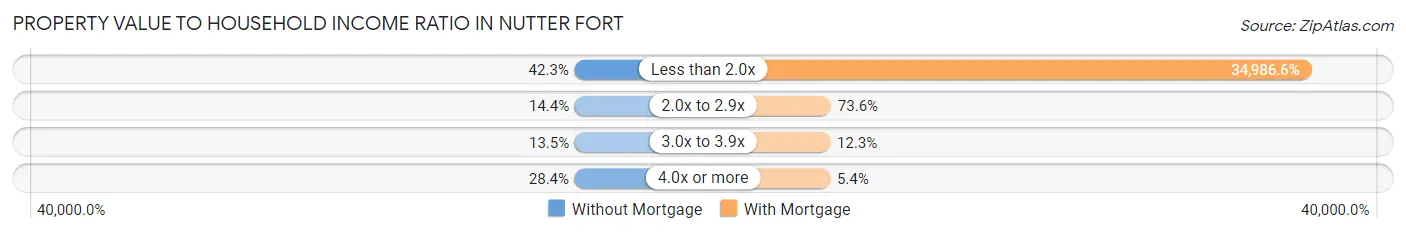
| Value-to-Income Ratio | Without Mortgage | With Mortgage |
| Less than 2.0x | 88 (42.3%) | 96,563 (34,986.6%) |
| 2.0x to 2.9x | 30 (14.4%) | 203 (73.6%) |
| 3.0x to 3.9x | 28 (13.5%) | 34 (12.3%) |
| 4.0x or more | 59 (28.4%) | 15 (5.4%) |
| Total | 208 (100.0%) | 276 (100.0%) |
Real Estate Taxes by Mortgage Status in Nutter Fort
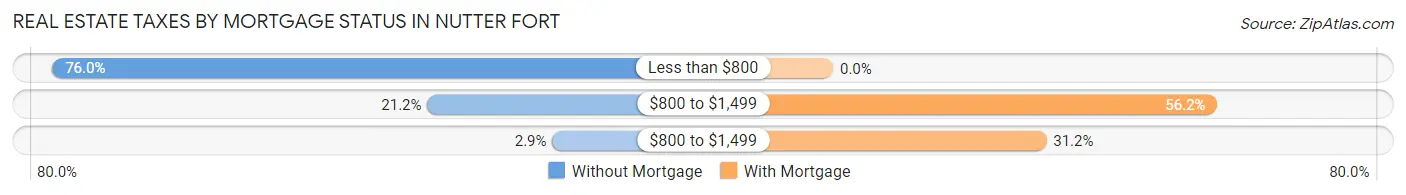
| Property Taxes | Without Mortgage | With Mortgage |
| Less than $800 | 158 (76.0%) | 0 (0.0%) |
| $800 to $1,499 | 44 (21.1%) | 155 (56.2%) |
| $800 to $1,499 | 6 (2.9%) | 86 (31.2%) |
| Total | 208 (100.0%) | 276 (100.0%) |
Health & Disability in Nutter Fort
Health Insurance Coverage by Age in Nutter Fort
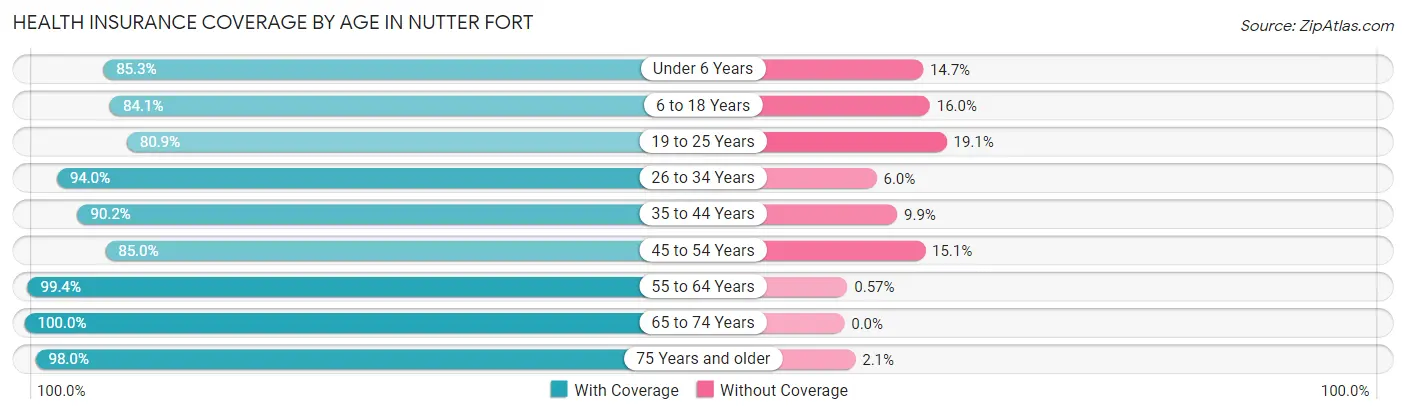
| Age Bracket | With Coverage | Without Coverage |
| Under 6 Years | 64 (85.3%) | 11 (14.7%) |
| 6 to 18 Years | 274 (84.1%) | 52 (16.0%) |
| 19 to 25 Years | 174 (80.9%) | 41 (19.1%) |
| 26 to 34 Years | 172 (94.0%) | 11 (6.0%) |
| 35 to 44 Years | 183 (90.1%) | 20 (9.9%) |
| 45 to 54 Years | 175 (85.0%) | 31 (15.0%) |
| 55 to 64 Years | 175 (99.4%) | 1 (0.6%) |
| 65 to 74 Years | 170 (100.0%) | 0 (0.0%) |
| 75 Years and older | 143 (98.0%) | 3 (2.1%) |
| Total | 1,530 (90.0%) | 170 (10.0%) |
Health Insurance Coverage by Citizenship Status in Nutter Fort
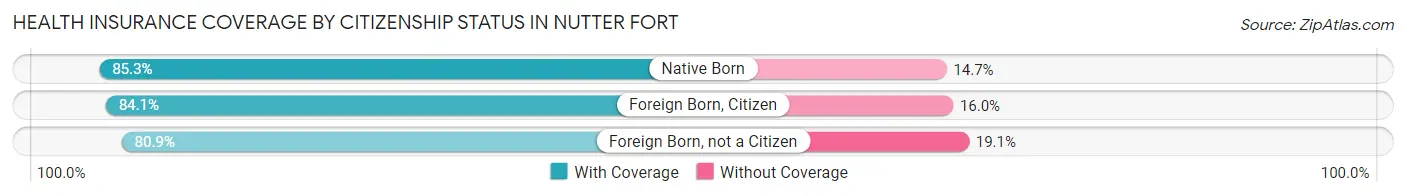
| Citizenship Status | With Coverage | Without Coverage |
| Native Born | 64 (85.3%) | 11 (14.7%) |
| Foreign Born, Citizen | 274 (84.1%) | 52 (16.0%) |
| Foreign Born, not a Citizen | 174 (80.9%) | 41 (19.1%) |
Health Insurance Coverage by Household Income in Nutter Fort
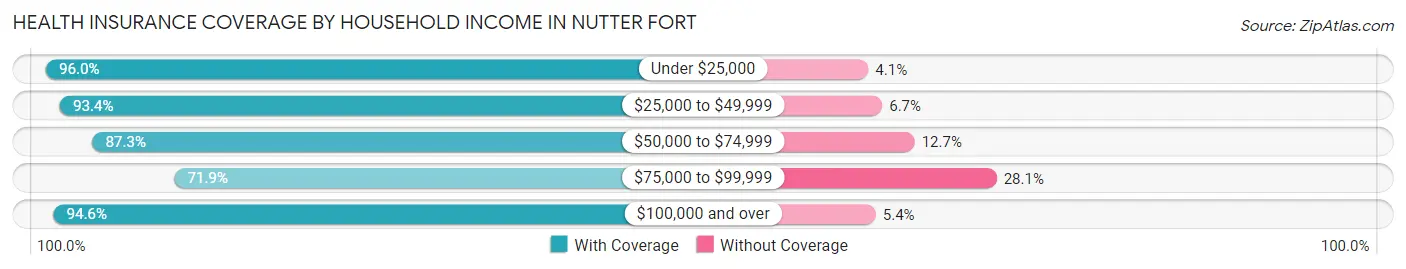
| Household Income | With Coverage | Without Coverage |
| Under $25,000 | 213 (96.0%) | 9 (4.1%) |
| $25,000 to $49,999 | 351 (93.3%) | 25 (6.7%) |
| $50,000 to $74,999 | 281 (87.3%) | 41 (12.7%) |
| $75,000 to $99,999 | 169 (71.9%) | 66 (28.1%) |
| $100,000 and over | 504 (94.6%) | 29 (5.4%) |
Public vs Private Health Insurance Coverage by Age in Nutter Fort
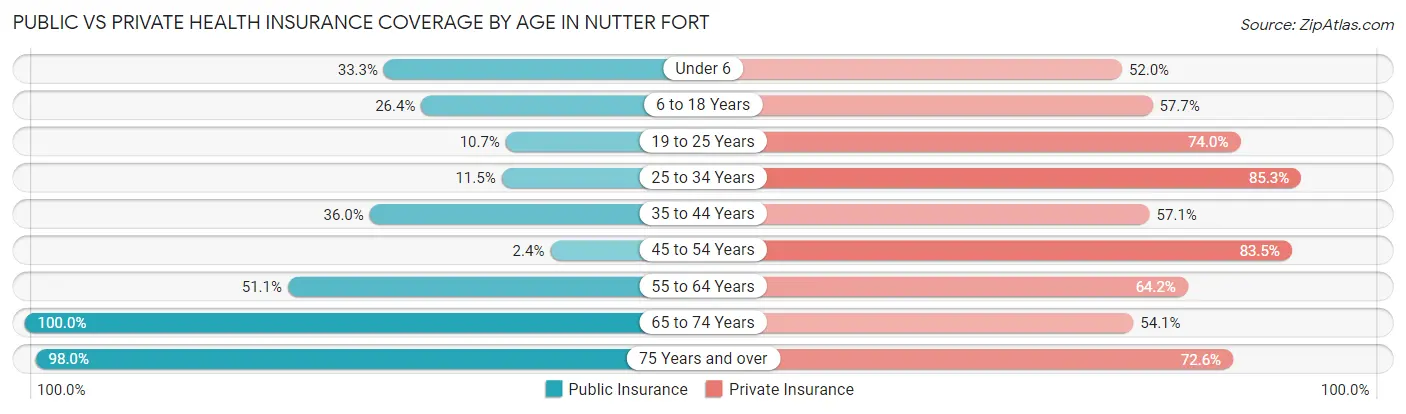
| Age Bracket | Public Insurance | Private Insurance |
| Under 6 | 25 (33.3%) | 39 (52.0%) |
| 6 to 18 Years | 86 (26.4%) | 188 (57.7%) |
| 19 to 25 Years | 23 (10.7%) | 159 (74.0%) |
| 25 to 34 Years | 21 (11.5%) | 156 (85.3%) |
| 35 to 44 Years | 73 (36.0%) | 116 (57.1%) |
| 45 to 54 Years | 5 (2.4%) | 172 (83.5%) |
| 55 to 64 Years | 90 (51.1%) | 113 (64.2%) |
| 65 to 74 Years | 170 (100.0%) | 92 (54.1%) |
| 75 Years and over | 143 (98.0%) | 106 (72.6%) |
| Total | 636 (37.4%) | 1,141 (67.1%) |
Disability Status by Sex by Age in Nutter Fort
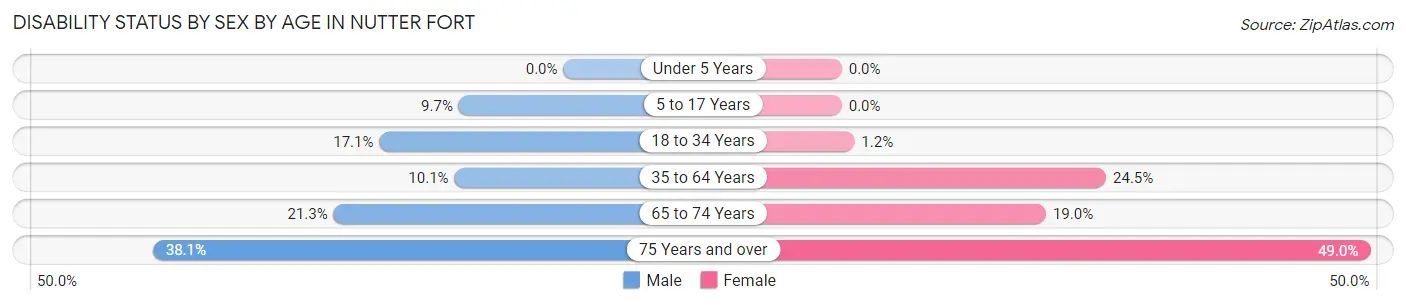
| Age Bracket | Male | Female |
| Under 5 Years | 0 (0.0%) | 0 (0.0%) |
| 5 to 17 Years | 20 (9.7%) | 0 (0.0%) |
| 18 to 34 Years | 41 (17.1%) | 2 (1.2%) |
| 35 to 64 Years | 27 (10.1%) | 78 (24.5%) |
| 65 to 74 Years | 16 (21.3%) | 18 (19.0%) |
| 75 Years and over | 16 (38.1%) | 51 (49.0%) |
Disability Class by Sex by Age in Nutter Fort
Disability Class: Hearing Difficulty
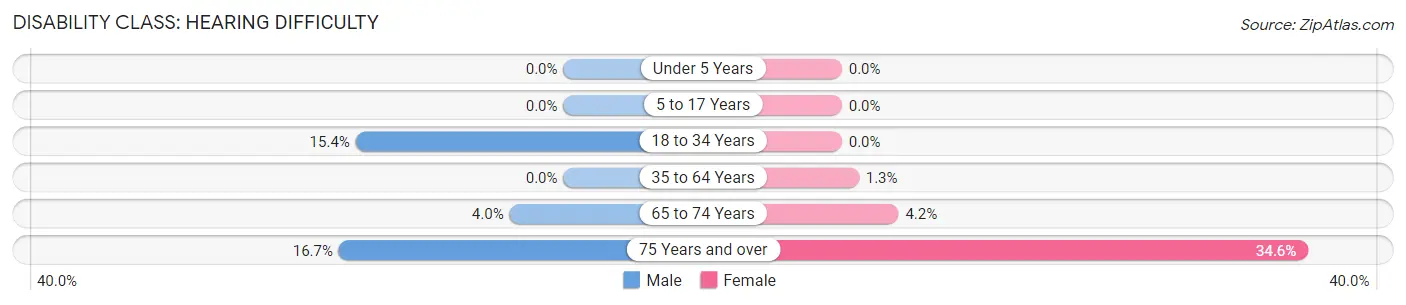
| Age Bracket | Male | Female |
| Under 5 Years | 0 (0.0%) | 0 (0.0%) |
| 5 to 17 Years | 0 (0.0%) | 0 (0.0%) |
| 18 to 34 Years | 37 (15.4%) | 0 (0.0%) |
| 35 to 64 Years | 0 (0.0%) | 4 (1.3%) |
| 65 to 74 Years | 3 (4.0%) | 4 (4.2%) |
| 75 Years and over | 7 (16.7%) | 36 (34.6%) |
Disability Class: Vision Difficulty
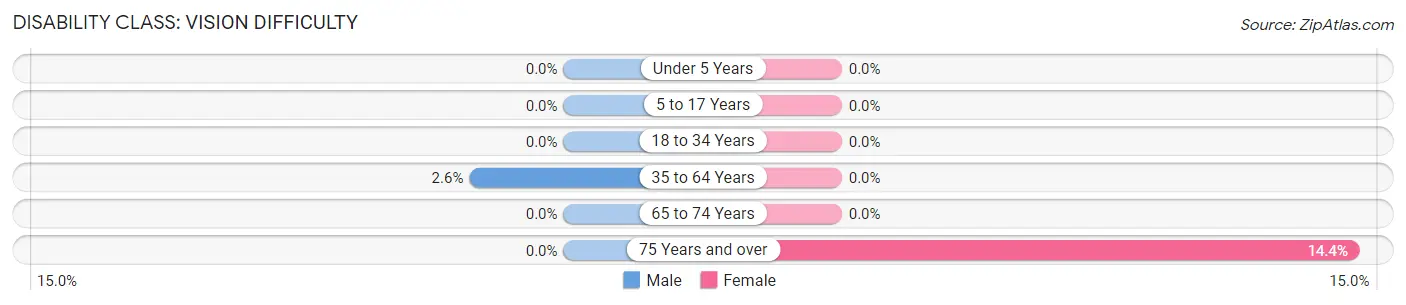
| Age Bracket | Male | Female |
| Under 5 Years | 0 (0.0%) | 0 (0.0%) |
| 5 to 17 Years | 0 (0.0%) | 0 (0.0%) |
| 18 to 34 Years | 0 (0.0%) | 0 (0.0%) |
| 35 to 64 Years | 7 (2.6%) | 0 (0.0%) |
| 65 to 74 Years | 0 (0.0%) | 0 (0.0%) |
| 75 Years and over | 0 (0.0%) | 15 (14.4%) |
Disability Class: Cognitive Difficulty
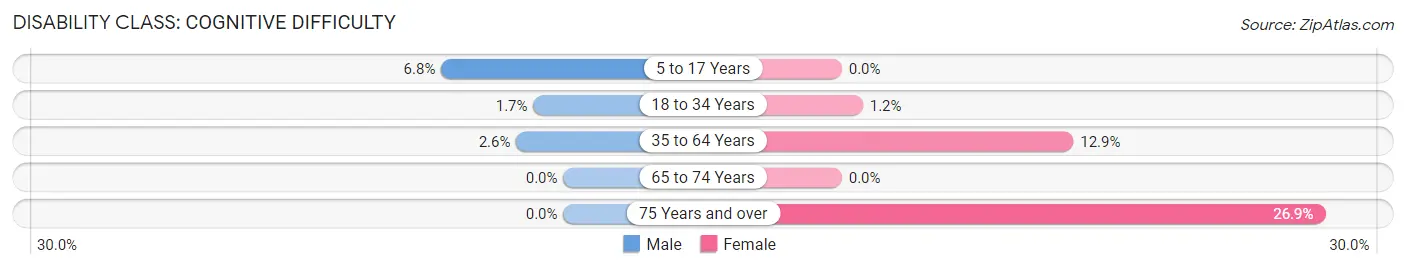
| Age Bracket | Male | Female |
| 5 to 17 Years | 14 (6.8%) | 0 (0.0%) |
| 18 to 34 Years | 4 (1.7%) | 2 (1.2%) |
| 35 to 64 Years | 7 (2.6%) | 41 (12.9%) |
| 65 to 74 Years | 0 (0.0%) | 0 (0.0%) |
| 75 Years and over | 0 (0.0%) | 28 (26.9%) |
Disability Class: Ambulatory Difficulty
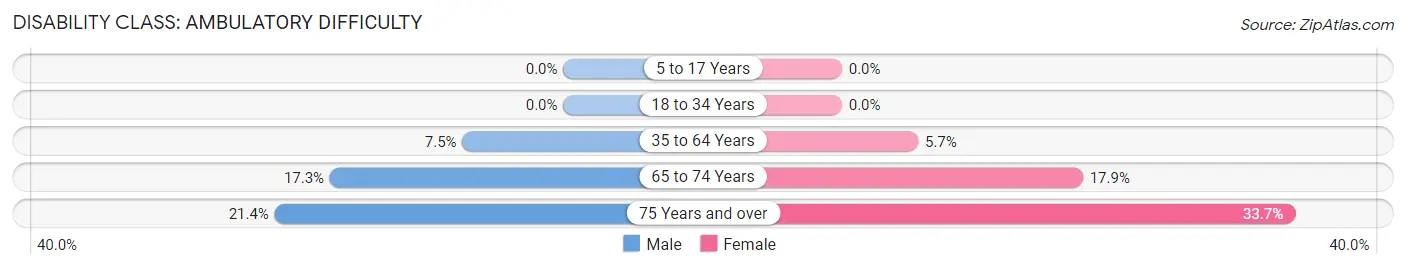
| Age Bracket | Male | Female |
| 5 to 17 Years | 0 (0.0%) | 0 (0.0%) |
| 18 to 34 Years | 0 (0.0%) | 0 (0.0%) |
| 35 to 64 Years | 20 (7.5%) | 18 (5.7%) |
| 65 to 74 Years | 13 (17.3%) | 17 (17.9%) |
| 75 Years and over | 9 (21.4%) | 35 (33.7%) |
Disability Class: Self-Care Difficulty
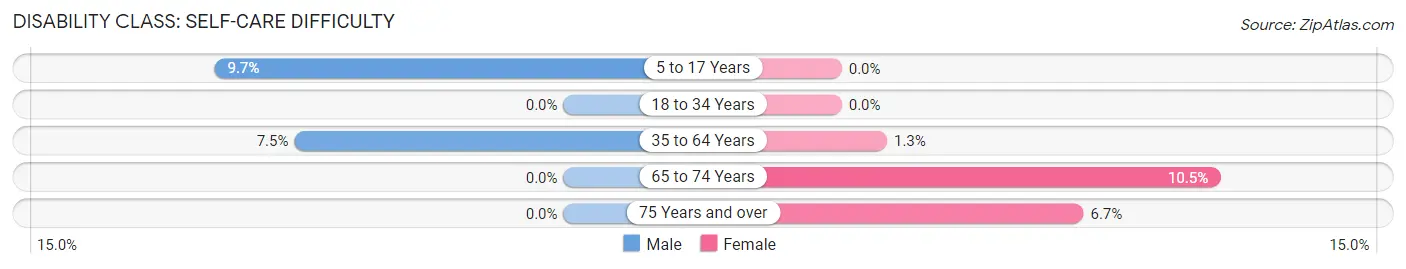
| Age Bracket | Male | Female |
| 5 to 17 Years | 20 (9.7%) | 0 (0.0%) |
| 18 to 34 Years | 0 (0.0%) | 0 (0.0%) |
| 35 to 64 Years | 20 (7.5%) | 4 (1.3%) |
| 65 to 74 Years | 0 (0.0%) | 10 (10.5%) |
| 75 Years and over | 0 (0.0%) | 7 (6.7%) |
Technology Access in Nutter Fort
Computing Device Access in Nutter Fort
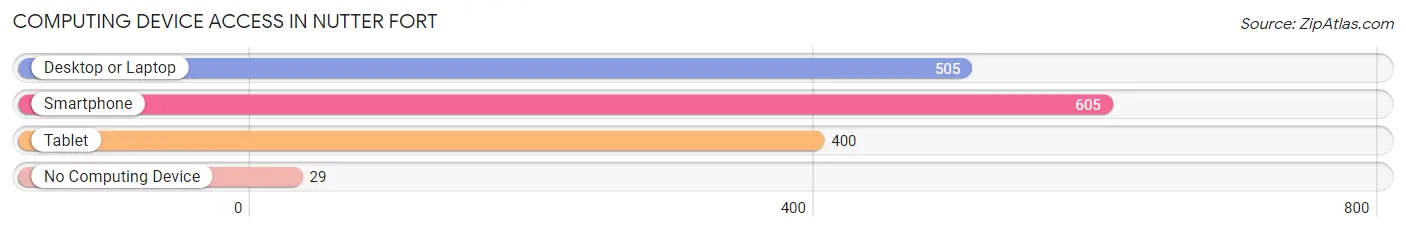
| Device Type | # Households | % Households |
| Desktop or Laptop | 505 | 73.4% |
| Smartphone | 605 | 87.9% |
| Tablet | 400 | 58.1% |
| No Computing Device | 29 | 4.2% |
| Total | 688 | 100.0% |
Internet Access in Nutter Fort
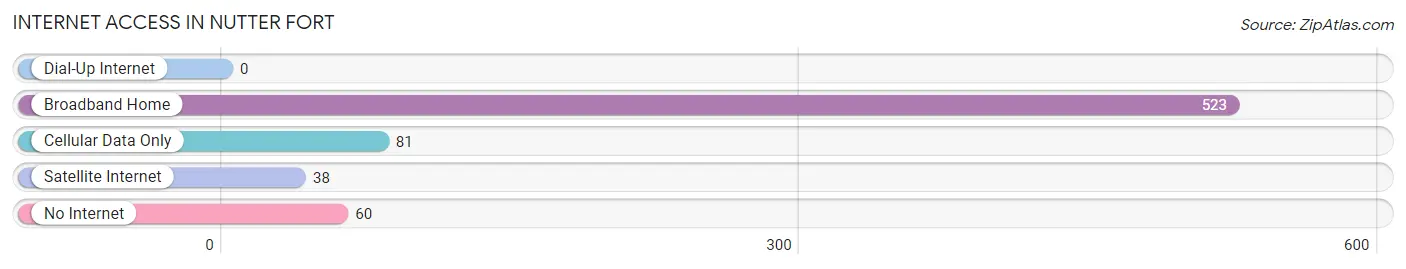
| Internet Type | # Households | % Households |
| Dial-Up Internet | 0 | 0.0% |
| Broadband Home | 523 | 76.0% |
| Cellular Data Only | 81 | 11.8% |
| Satellite Internet | 38 | 5.5% |
| No Internet | 60 | 8.7% |
| Total | 688 | 100.0% |
Nutter Fort Summary
Nutter Fort is a small town located in Harrison County, West Virginia. It is situated along the West Fork River, approximately five miles south of Clarksburg. The town was founded in 1817 by William Nutter, a Revolutionary War veteran, and was named after him.
Geography
Nutter Fort is located in the Appalachian Mountains of West Virginia. The town is situated along the West Fork River, which is a tributary of the Monongahela River. The town is surrounded by rolling hills and forests, and is located at an elevation of 1,000 feet. The climate in Nutter Fort is humid continental, with hot summers and cold winters.
Economy
The economy of Nutter Fort is largely based on agriculture and tourism. The town is home to several small farms, which produce a variety of crops, including corn, soybeans, and hay. The town also has several small businesses, including a grocery store, a hardware store, and a restaurant. Tourism is also an important part of the local economy, as the town is located near several popular attractions, including the West Fork River, the Monongahela National Forest, and the West Virginia State Capitol.
Demographics
As of the 2010 census, the population of Nutter Fort was 1,845. The town is predominantly white, with a small African American population. The median household income in Nutter Fort is $37,000, and the median home value is $90,000. The town has a high rate of poverty, with nearly one-third of the population living below the poverty line.
History
Nutter Fort was founded in 1817 by William Nutter, a Revolutionary War veteran. The town was named after him, and was originally a small farming community. In the late 19th century, the town began to grow, and several businesses were established, including a grocery store, a hardware store, and a restaurant. The town was also home to several churches, including the Nutter Fort United Methodist Church, which was founded in 1883.
In the early 20th century, the town began to decline, as many of its residents moved away in search of better economic opportunities. The town was also affected by the Great Depression, and many of its businesses closed. In the late 20th century, the town began to experience a resurgence, as new businesses opened and the population began to grow.
Today, Nutter Fort is a small, rural town with a population of 1,845. The town is home to several small businesses, and is a popular tourist destination due to its proximity to the West Fork River, the Monongahela National Forest, and the West Virginia State Capitol. The town is also home to several churches, including the Nutter Fort United Methodist Church, which was founded in 1883.
Common Questions
What is Per Capita Income in Nutter Fort?
Per Capita income in Nutter Fort is $32,741.
What is the Median Family Income in Nutter Fort?
Median Family Income in Nutter Fort is $81,875.
What is the Median Household income in Nutter Fort?
Median Household Income in Nutter Fort is $56,125.
What is Income or Wage Gap in Nutter Fort?
Income or Wage Gap in Nutter Fort is 14.3%.
Women in Nutter Fort earn 85.7 cents for every dollar earned by a man.
What is Inequality or Gini Index in Nutter Fort?
Inequality or Gini Index in Nutter Fort is 0.42.
What is the Total Population of Nutter Fort?
Total Population of Nutter Fort is 1,700.
What is the Total Male Population of Nutter Fort?
Total Male Population of Nutter Fort is 866.
What is the Total Female Population of Nutter Fort?
Total Female Population of Nutter Fort is 834.
What is the Ratio of Males per 100 Females in Nutter Fort?
There are 103.84 Males per 100 Females in Nutter Fort.
What is the Ratio of Females per 100 Males in Nutter Fort?
There are 96.30 Females per 100 Males in Nutter Fort.
What is the Median Population Age in Nutter Fort?
Median Population Age in Nutter Fort is 38.4 Years.
What is the Average Family Size in Nutter Fort
Average Family Size in Nutter Fort is 3.3 People.
What is the Average Household Size in Nutter Fort
Average Household Size in Nutter Fort is 2.5 People.
How Large is the Labor Force in Nutter Fort?
There are 881 People in the Labor Forcein in Nutter Fort.
What is the Percentage of People in the Labor Force in Nutter Fort?
64.6% of People are in the Labor Force in Nutter Fort.
What is the Unemployment Rate in Nutter Fort?
Unemployment Rate in Nutter Fort is 5.9%.