Cairo, WV Map & Demographics
Cairo Map
Cairo Overview
$23,072
PER CAPITA INCOME
$46,875
AVG FAMILY INCOME
$27,300
AVG HOUSEHOLD INCOME
27.4%
WAGE / INCOME GAP [ % ]
72.6¢/ $1
WAGE / INCOME GAP [ $ ]
0.41
INEQUALITY / GINI INDEX
164
TOTAL POPULATION
88
MALE POPULATION
76
FEMALE POPULATION
115.79
MALES / 100 FEMALES
86.36
FEMALES / 100 MALES
59.2
MEDIAN AGE
3.0
AVG FAMILY SIZE
2.0
AVG HOUSEHOLD SIZE
50
LABOR FORCE [ PEOPLE ]
32.5%
PERCENT IN LABOR FORCE
Cairo Zip Codes
Income in Cairo
Income Overview in Cairo
Per Capita Income in Cairo is $23,072, while median incomes of families and households are $46,875 and $27,300 respectively.
| Characteristic | Number | Measure |
| Per Capita Income | 164 | $23,072 |
| Median Family Income | 34 | $46,875 |
| Mean Family Income | 34 | $63,488 |
| Median Household Income | 80 | $27,300 |
| Mean Household Income | 80 | $42,179 |
| Income Deficit | 34 | $0 |
| Wage / Income Gap (%) | 164 | 27.39% |
| Wage / Income Gap ($) | 164 | 72.61¢ per $1 |
| Gini / Inequality Index | 164 | 0.41 |
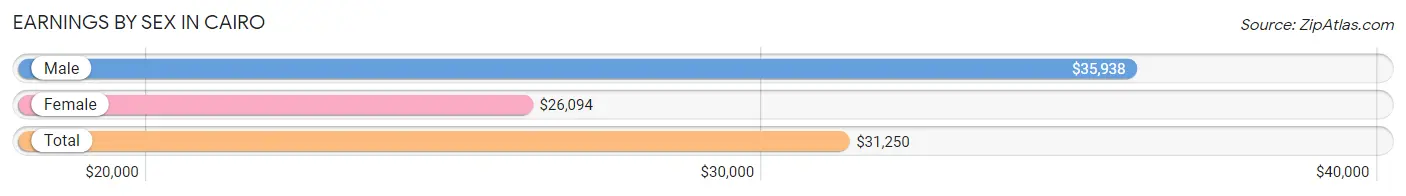
Earnings by Sex in Cairo
Average Earnings in Cairo are $31,250, $35,938 for men and $26,094 for women, a difference of 27.4%.
| Sex | Number | Average Earnings |
| Male | 31 (59.6%) | $35,938 |
| Female | 21 (40.4%) | $26,094 |
| Total | 52 (100.0%) | $31,250 |
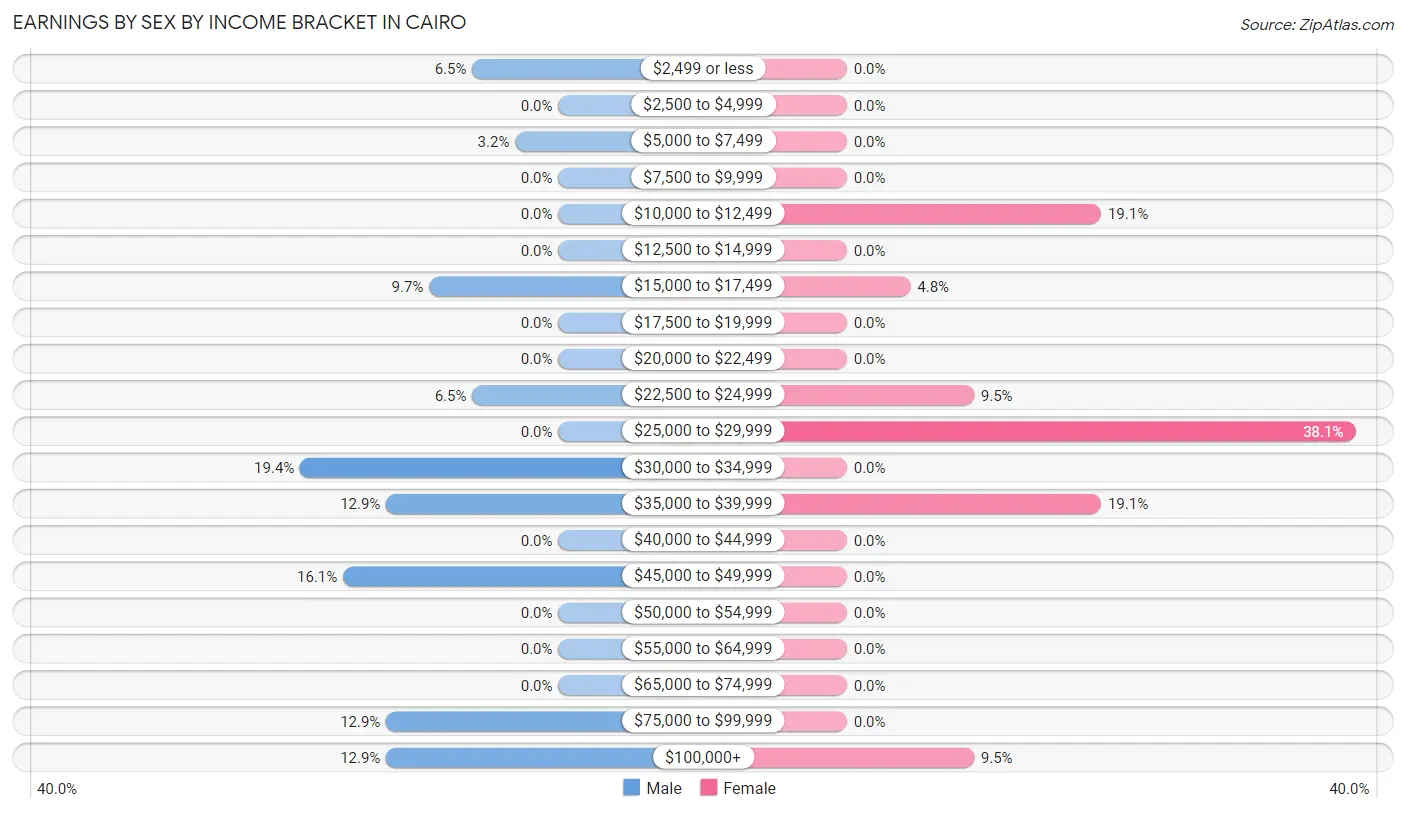
Earnings by Sex by Income Bracket in Cairo
The most common earnings brackets in Cairo are $30,000 to $34,999 for men (6 | 19.4%) and $25,000 to $29,999 for women (8 | 38.1%).
| Income | Male | Female |
| $2,499 or less | 2 (6.5%) | 0 (0.0%) |
| $2,500 to $4,999 | 0 (0.0%) | 0 (0.0%) |
| $5,000 to $7,499 | 1 (3.2%) | 0 (0.0%) |
| $7,500 to $9,999 | 0 (0.0%) | 0 (0.0%) |
| $10,000 to $12,499 | 0 (0.0%) | 4 (19.1%) |
| $12,500 to $14,999 | 0 (0.0%) | 0 (0.0%) |
| $15,000 to $17,499 | 3 (9.7%) | 1 (4.8%) |
| $17,500 to $19,999 | 0 (0.0%) | 0 (0.0%) |
| $20,000 to $22,499 | 0 (0.0%) | 0 (0.0%) |
| $22,500 to $24,999 | 2 (6.5%) | 2 (9.5%) |
| $25,000 to $29,999 | 0 (0.0%) | 8 (38.1%) |
| $30,000 to $34,999 | 6 (19.4%) | 0 (0.0%) |
| $35,000 to $39,999 | 4 (12.9%) | 4 (19.1%) |
| $40,000 to $44,999 | 0 (0.0%) | 0 (0.0%) |
| $45,000 to $49,999 | 5 (16.1%) | 0 (0.0%) |
| $50,000 to $54,999 | 0 (0.0%) | 0 (0.0%) |
| $55,000 to $64,999 | 0 (0.0%) | 0 (0.0%) |
| $65,000 to $74,999 | 0 (0.0%) | 0 (0.0%) |
| $75,000 to $99,999 | 4 (12.9%) | 0 (0.0%) |
| $100,000+ | 4 (12.9%) | 2 (9.5%) |
| Total | 31 (100.0%) | 21 (100.0%) |
Earnings by Sex by Educational Attainment in Cairo
| Educational Attainment | Male Income | Female Income |
| Less than High School | - | - |
| High School Diploma | - | - |
| College or Associate's Degree | - | - |
| Bachelor's Degree | - | - |
| Graduate Degree | - | - |
| Total | - | - |
Family Income in Cairo
Family Income Brackets in Cairo
According to the Cairo family income data, there are 9 families falling into the $50,000 to $74,999 income range, which is the most common income bracket and makes up 26.5% of all families.
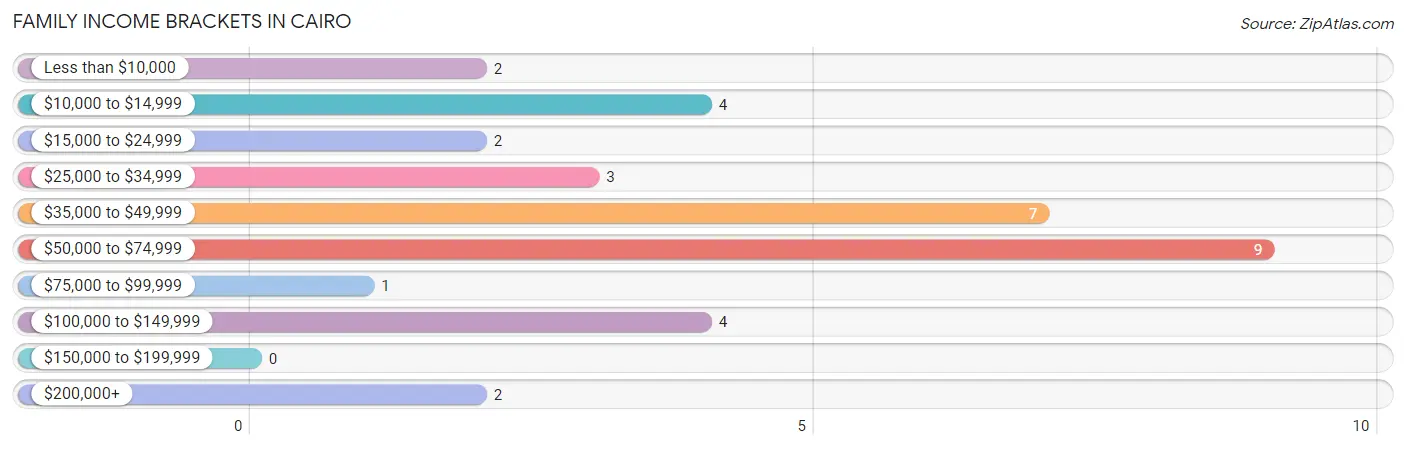
| Income Bracket | # Families | % Families |
| Less than $10,000 | 2 | 5.9% |
| $10,000 to $14,999 | 4 | 11.8% |
| $15,000 to $24,999 | 2 | 5.9% |
| $25,000 to $34,999 | 3 | 8.8% |
| $35,000 to $49,999 | 7 | 20.6% |
| $50,000 to $74,999 | 9 | 26.5% |
| $75,000 to $99,999 | 1 | 2.9% |
| $100,000 to $149,999 | 4 | 11.8% |
| $150,000 to $199,999 | 0 | 0.0% |
| $200,000+ | 2 | 5.9% |
Family Income by Famaliy Size in Cairo
2-person families (23 | 67.6%) account for the highest median family income in Cairo with $47,188 per family, while 2-person families (23 | 67.6%) have the highest median income of $23,594 per family member.
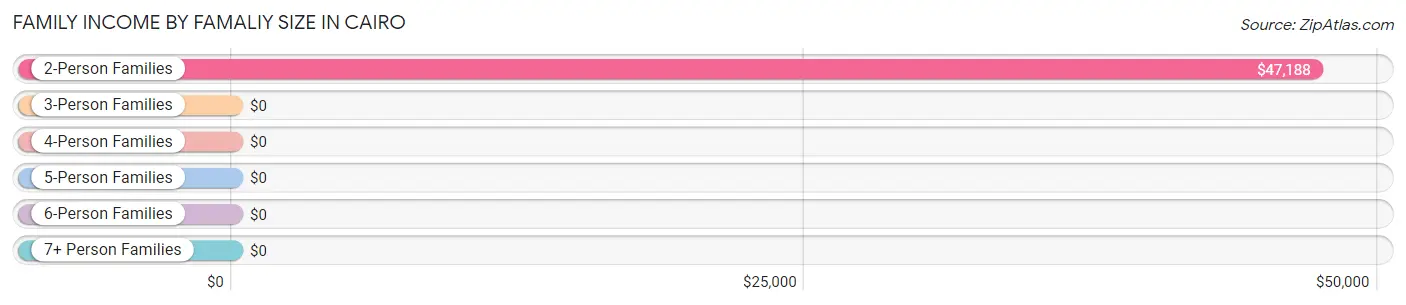
| Income Bracket | # Families | Median Income |
| 2-Person Families | 23 (67.6%) | $47,188 |
| 3-Person Families | 3 (8.8%) | $0 |
| 4-Person Families | 8 (23.5%) | $0 |
| 5-Person Families | 0 (0.0%) | $0 |
| 6-Person Families | 0 (0.0%) | $0 |
| 7+ Person Families | 0 (0.0%) | $0 |
| Total | 34 (100.0%) | $46,875 |
Family Income by Number of Earners in Cairo
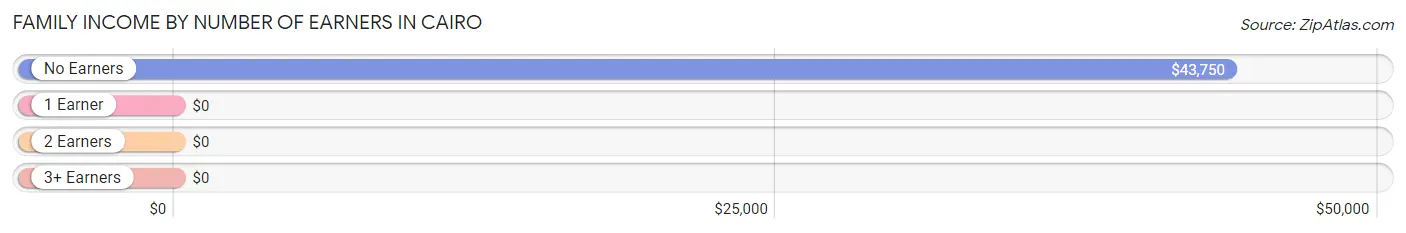
| Number of Earners | # Families | Median Income |
| No Earners | 6 (17.6%) | $43,750 |
| 1 Earner | 24 (70.6%) | $0 |
| 2 Earners | 3 (8.8%) | $0 |
| 3+ Earners | 1 (2.9%) | $0 |
| Total | 34 (100.0%) | $46,875 |
Household Income in Cairo
Household Income Brackets in Cairo
With 36 households falling in the category, the $25,000 to $34,999 income range is the most frequent in Cairo, accounting for 45.0% of all households.
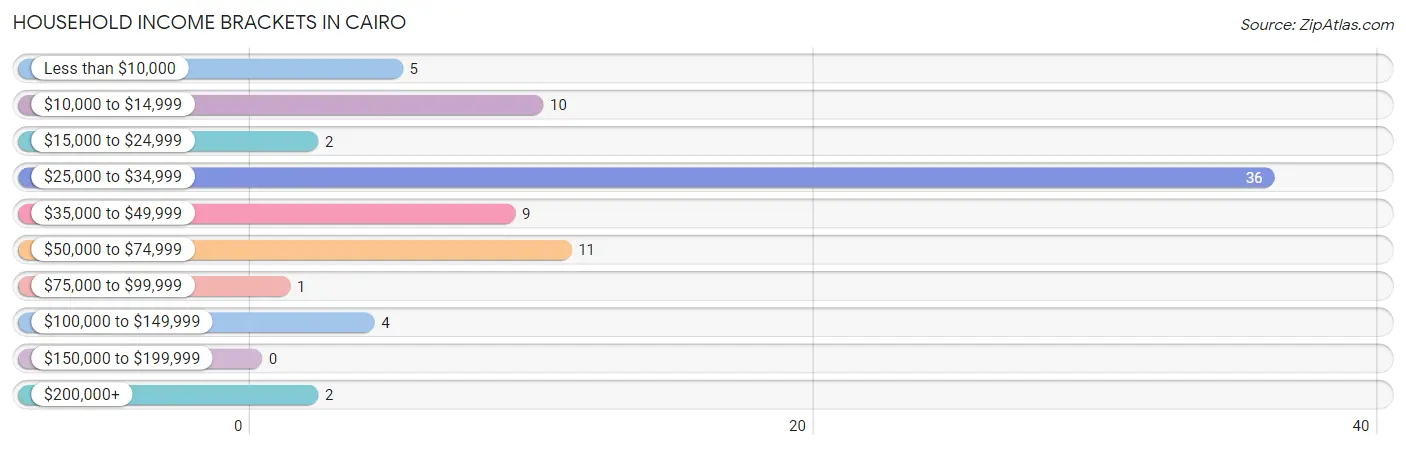
| Income Bracket | # Households | % Households |
| Less than $10,000 | 5 | 6.3% |
| $10,000 to $14,999 | 10 | 12.5% |
| $15,000 to $24,999 | 2 | 2.5% |
| $25,000 to $34,999 | 36 | 45.0% |
| $35,000 to $49,999 | 9 | 11.3% |
| $50,000 to $74,999 | 11 | 13.8% |
| $75,000 to $99,999 | 1 | 1.3% |
| $100,000 to $149,999 | 4 | 5.0% |
| $150,000 to $199,999 | 0 | 0.0% |
| $200,000+ | 2 | 2.5% |
Household Income by Householder Age in Cairo
The median household income in Cairo is $27,300, with the highest median household income of $33,750 found in the 65+ years age bracket for the primary householder. A total of 22 households (27.5%) fall into this category. Meanwhile, the 15 to 24 years age bracket for the primary householder has the lowest median household income of $0, with 2 households (2.5%) in this group.
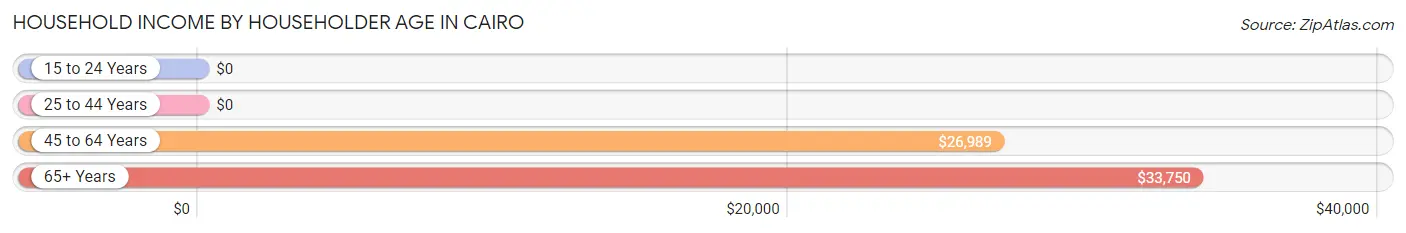
| Income Bracket | # Households | Median Income |
| 15 to 24 Years | 2 (2.5%) | $0 |
| 25 to 44 Years | 15 (18.8%) | $0 |
| 45 to 64 Years | 41 (51.2%) | $26,989 |
| 65+ Years | 22 (27.5%) | $33,750 |
| Total | 80 (100.0%) | $27,300 |
Poverty in Cairo
Income Below Poverty by Sex and Age in Cairo
With 38.6% poverty level for males and 35.5% for females among the residents of Cairo, 6 to 11 year old males and 5 year old females are the most vulnerable to poverty, with 3 males (100.0%) and 4 females (100.0%) in their respective age groups living below the poverty level.
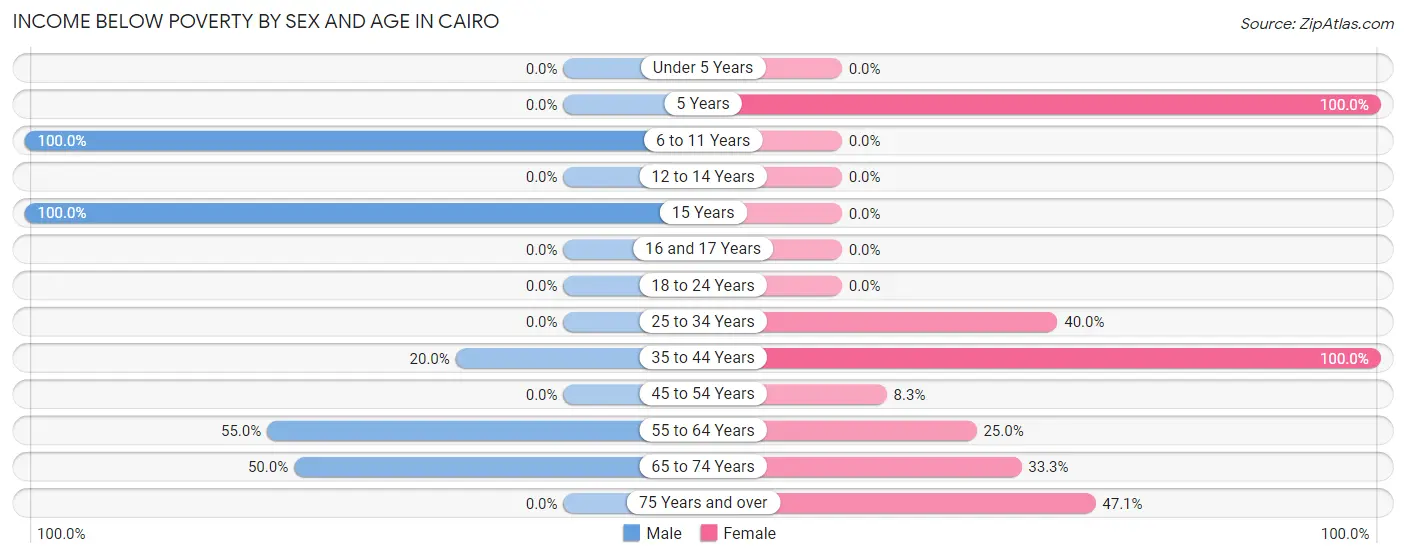
| Age Bracket | Male | Female |
| Under 5 Years | 0 (0.0%) | 0 (0.0%) |
| 5 Years | 0 (0.0%) | 4 (100.0%) |
| 6 to 11 Years | 3 (100.0%) | 0 (0.0%) |
| 12 to 14 Years | 0 (0.0%) | 0 (0.0%) |
| 15 Years | 3 (100.0%) | 0 (0.0%) |
| 16 and 17 Years | 0 (0.0%) | 0 (0.0%) |
| 18 to 24 Years | 0 (0.0%) | 0 (0.0%) |
| 25 to 34 Years | 0 (0.0%) | 2 (40.0%) |
| 35 to 44 Years | 1 (20.0%) | 4 (100.0%) |
| 45 to 54 Years | 0 (0.0%) | 1 (8.3%) |
| 55 to 64 Years | 22 (55.0%) | 5 (25.0%) |
| 65 to 74 Years | 5 (50.0%) | 3 (33.3%) |
| 75 Years and over | 0 (0.0%) | 8 (47.1%) |
| Total | 34 (38.6%) | 27 (35.5%) |
Income Above Poverty by Sex and Age in Cairo
According to the poverty statistics in Cairo, males aged 16 and 17 years and females aged 18 to 24 years are the age groups that are most secure financially, with 100.0% of males and 100.0% of females in these age groups living above the poverty line.
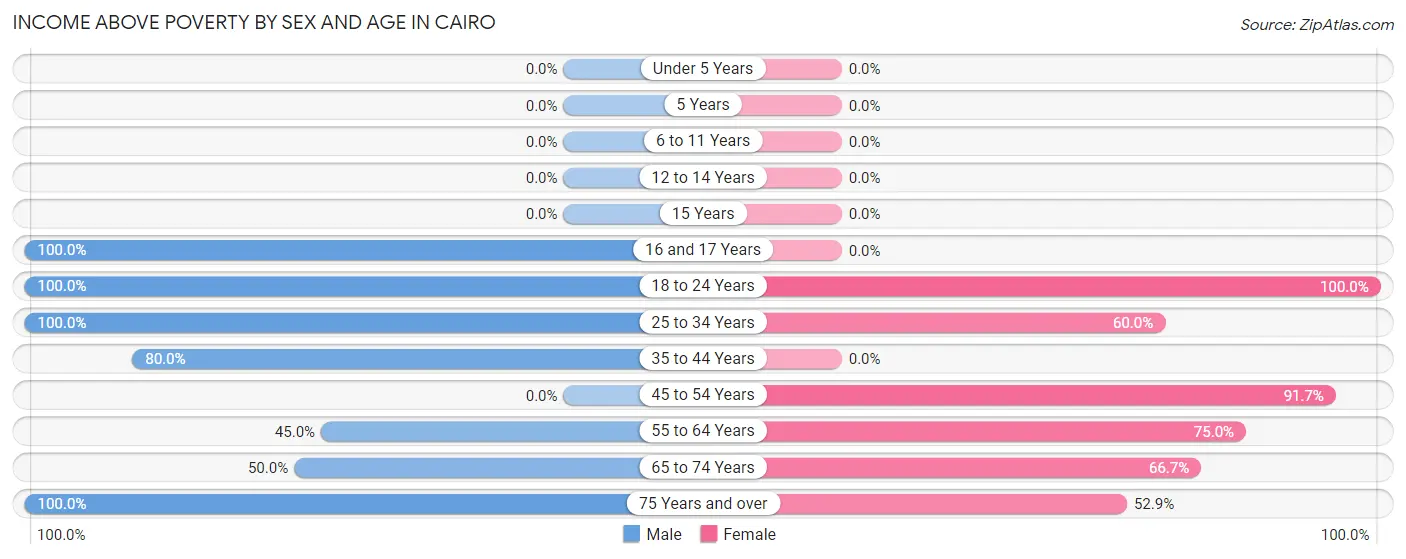
| Age Bracket | Male | Female |
| Under 5 Years | 0 (0.0%) | 0 (0.0%) |
| 5 Years | 0 (0.0%) | 0 (0.0%) |
| 6 to 11 Years | 0 (0.0%) | 0 (0.0%) |
| 12 to 14 Years | 0 (0.0%) | 0 (0.0%) |
| 15 Years | 0 (0.0%) | 0 (0.0%) |
| 16 and 17 Years | 8 (100.0%) | 0 (0.0%) |
| 18 to 24 Years | 4 (100.0%) | 5 (100.0%) |
| 25 to 34 Years | 9 (100.0%) | 3 (60.0%) |
| 35 to 44 Years | 4 (80.0%) | 0 (0.0%) |
| 45 to 54 Years | 0 (0.0%) | 11 (91.7%) |
| 55 to 64 Years | 18 (45.0%) | 15 (75.0%) |
| 65 to 74 Years | 5 (50.0%) | 6 (66.7%) |
| 75 Years and over | 6 (100.0%) | 9 (52.9%) |
| Total | 54 (61.4%) | 49 (64.5%) |
Income Below Poverty Among Married-Couple Families in Cairo
The poverty statistics for married-couple families in Cairo show that 10.5% or 2 of the total 19 families live below the poverty line. Families with no children have the highest poverty rate of 13.3%, comprising of 2 families. On the other hand, families with 1 or 2 children have the lowest poverty rate of 0.0%, which includes 0 families.
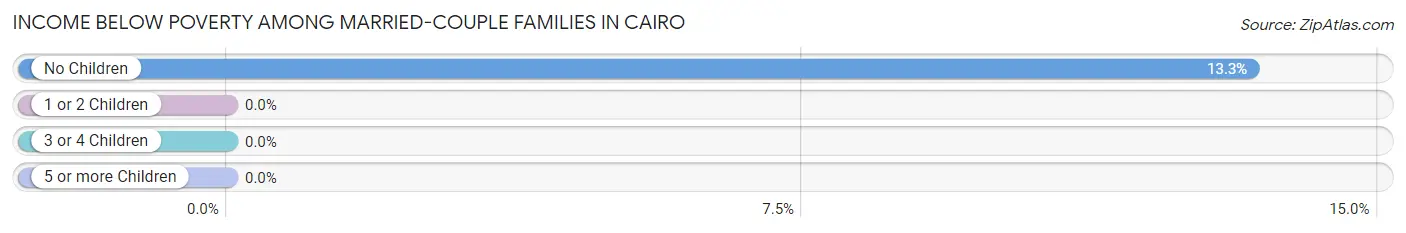
| Children | Above Poverty | Below Poverty |
| No Children | 13 (86.7%) | 2 (13.3%) |
| 1 or 2 Children | 4 (100.0%) | 0 (0.0%) |
| 3 or 4 Children | 0 (0.0%) | 0 (0.0%) |
| 5 or more Children | 0 (0.0%) | 0 (0.0%) |
| Total | 17 (89.5%) | 2 (10.5%) |
Income Below Poverty Among Single-Parent Households in Cairo
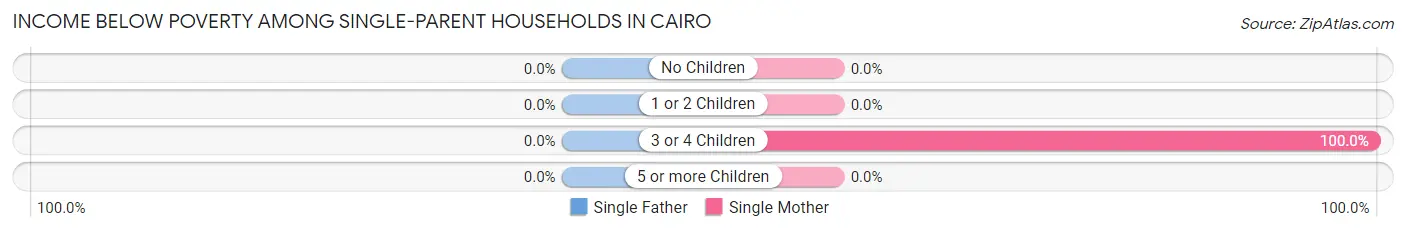
| Children | Single Father | Single Mother |
| No Children | 0 (0.0%) | 0 (0.0%) |
| 1 or 2 Children | 0 (0.0%) | 0 (0.0%) |
| 3 or 4 Children | 0 (0.0%) | 4 (100.0%) |
| 5 or more Children | 0 (0.0%) | 0 (0.0%) |
| Total | 0 (0.0%) | 4 (36.4%) |
Income Below Poverty Among Married-Couple vs Single-Parent Households in Cairo
The poverty data for Cairo shows that 2 of the married-couple family households (10.5%) and 4 of the single-parent households (26.7%) are living below the poverty level. Within the married-couple family households, those with no children have the highest poverty rate, with 2 households (13.3%) falling below the poverty line. Among the single-parent households, those with 3 or 4 children have the highest poverty rate, with 4 household (100.0%) living below poverty.
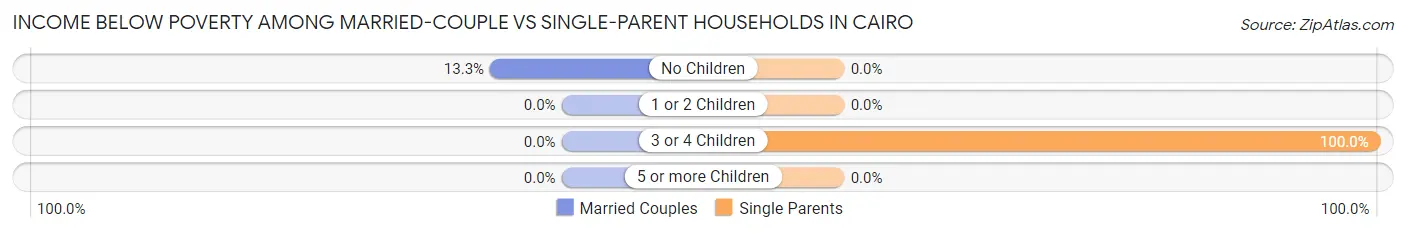
| Children | Married-Couple Families | Single-Parent Households |
| No Children | 2 (13.3%) | 0 (0.0%) |
| 1 or 2 Children | 0 (0.0%) | 0 (0.0%) |
| 3 or 4 Children | 0 (0.0%) | 4 (100.0%) |
| 5 or more Children | 0 (0.0%) | 0 (0.0%) |
| Total | 2 (10.5%) | 4 (26.7%) |
Race in Cairo
The most populous races in Cairo are White / Caucasian (155 | 94.5%), and Two or more Races (9 | 5.5%).
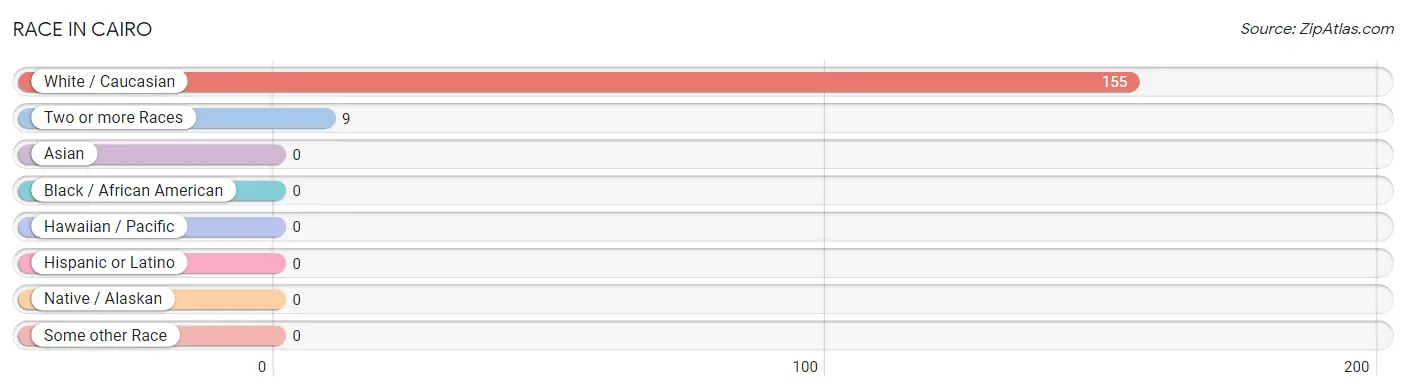
| Race | # Population | % Population |
| Asian | 0 | 0.0% |
| Black / African American | 0 | 0.0% |
| Hawaiian / Pacific | 0 | 0.0% |
| Hispanic or Latino | 0 | 0.0% |
| Native / Alaskan | 0 | 0.0% |
| White / Caucasian | 155 | 94.5% |
| Two or more Races | 9 | 5.5% |
| Some other Race | 0 | 0.0% |
| Total | 164 | 100.0% |
Ancestry in Cairo
The most populous ancestries reported in Cairo are Irish (32 | 19.5%), German (28 | 17.1%), American (25 | 15.2%), Albanian (11 | 6.7%), and Yugoslavian (11 | 6.7%), together accounting for 65.2% of all Cairo residents.
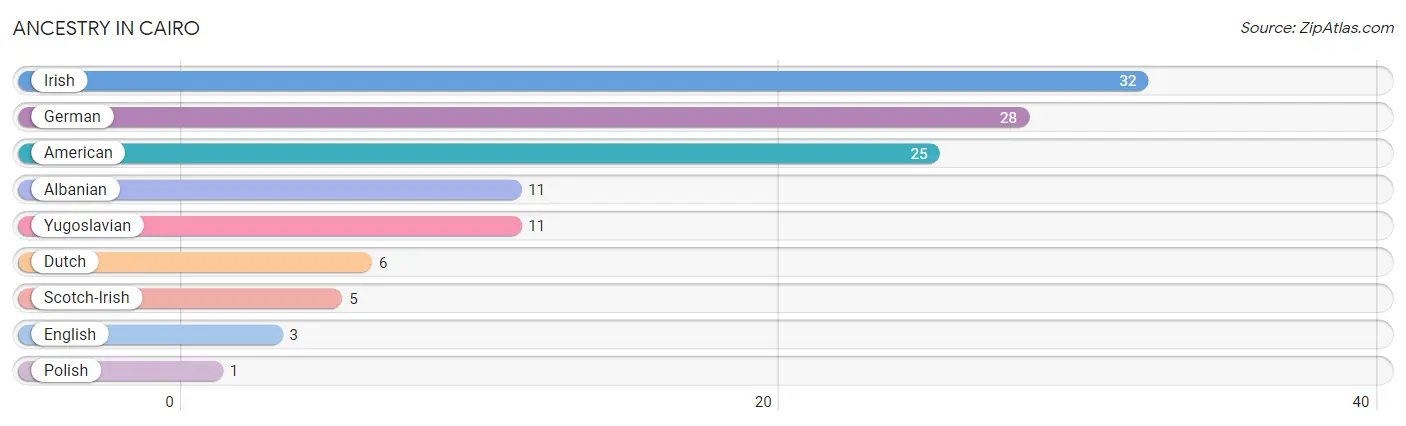
| Ancestry | # Population | % Population |
| Albanian | 11 | 6.7% |
| American | 25 | 15.2% |
| Dutch | 6 | 3.7% |
| English | 3 | 1.8% |
| German | 28 | 17.1% |
| Irish | 32 | 19.5% |
| Polish | 1 | 0.6% |
| Scotch-Irish | 5 | 3.0% |
| Yugoslavian | 11 | 6.7% | View All 9 Rows |
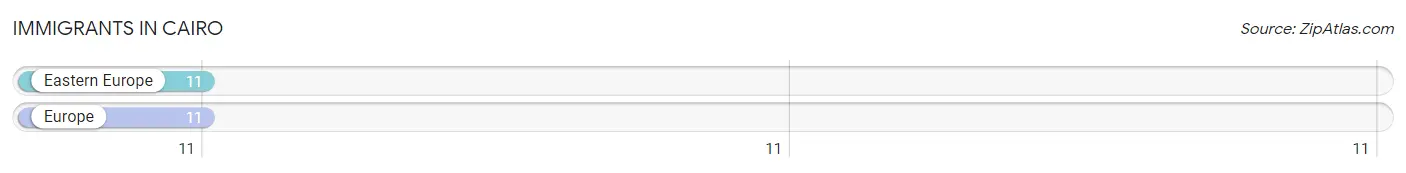
Immigrants in Cairo
The most numerous immigrant groups reported in Cairo came from Eastern Europe (11 | 6.7%), and Europe (11 | 6.7%), together accounting for 13.4% of all Cairo residents.
| Immigration Origin | # Population | % Population |
| Eastern Europe | 11 | 6.7% |
| Europe | 11 | 6.7% | View All 2 Rows |
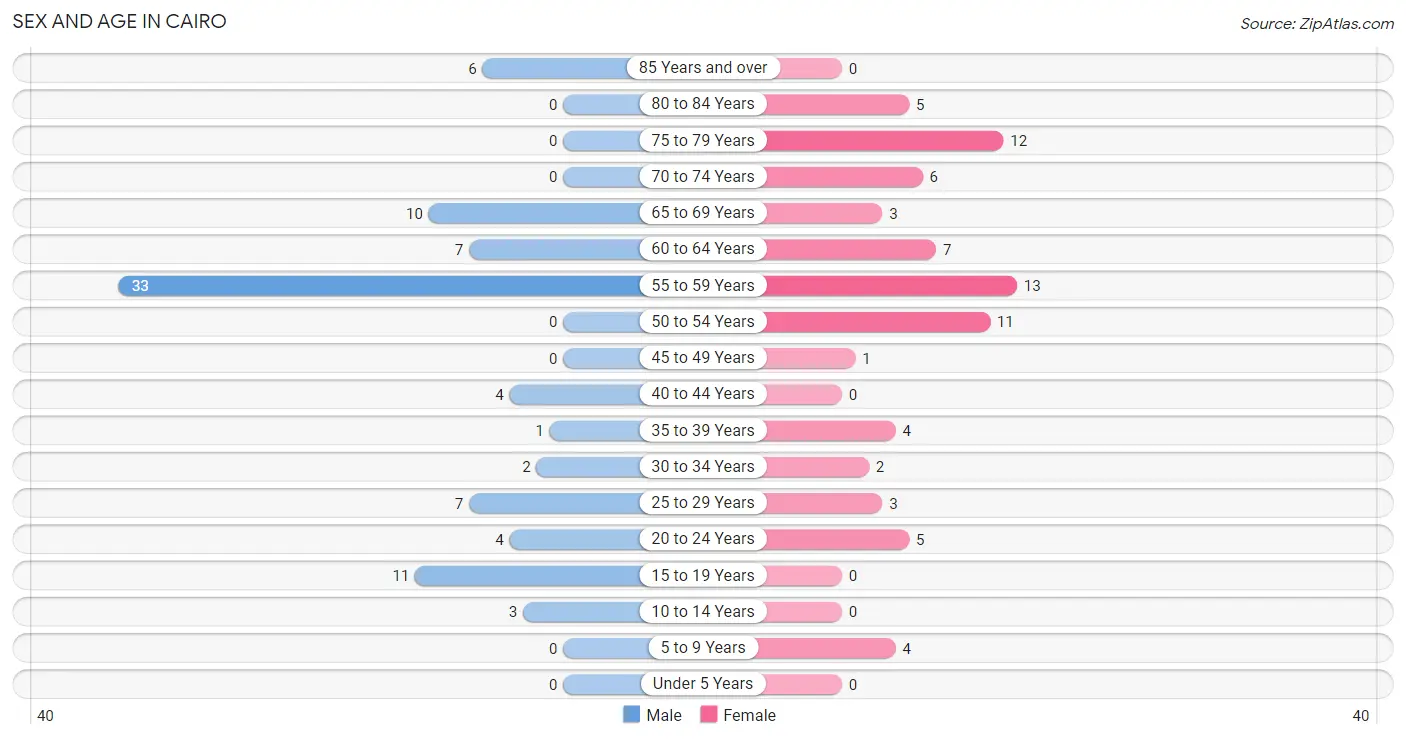
Sex and Age in Cairo
Sex and Age in Cairo
The most populous age groups in Cairo are 55 to 59 Years (33 | 37.5%) for men and 55 to 59 Years (13 | 17.1%) for women.
| Age Bracket | Male | Female |
| Under 5 Years | 0 (0.0%) | 0 (0.0%) |
| 5 to 9 Years | 0 (0.0%) | 4 (5.3%) |
| 10 to 14 Years | 3 (3.4%) | 0 (0.0%) |
| 15 to 19 Years | 11 (12.5%) | 0 (0.0%) |
| 20 to 24 Years | 4 (4.5%) | 5 (6.6%) |
| 25 to 29 Years | 7 (8.0%) | 3 (4.0%) |
| 30 to 34 Years | 2 (2.3%) | 2 (2.6%) |
| 35 to 39 Years | 1 (1.1%) | 4 (5.3%) |
| 40 to 44 Years | 4 (4.5%) | 0 (0.0%) |
| 45 to 49 Years | 0 (0.0%) | 1 (1.3%) |
| 50 to 54 Years | 0 (0.0%) | 11 (14.5%) |
| 55 to 59 Years | 33 (37.5%) | 13 (17.1%) |
| 60 to 64 Years | 7 (8.0%) | 7 (9.2%) |
| 65 to 69 Years | 10 (11.4%) | 3 (4.0%) |
| 70 to 74 Years | 0 (0.0%) | 6 (7.9%) |
| 75 to 79 Years | 0 (0.0%) | 12 (15.8%) |
| 80 to 84 Years | 0 (0.0%) | 5 (6.6%) |
| 85 Years and over | 6 (6.8%) | 0 (0.0%) |
| Total | 88 (100.0%) | 76 (100.0%) |
Families and Households in Cairo
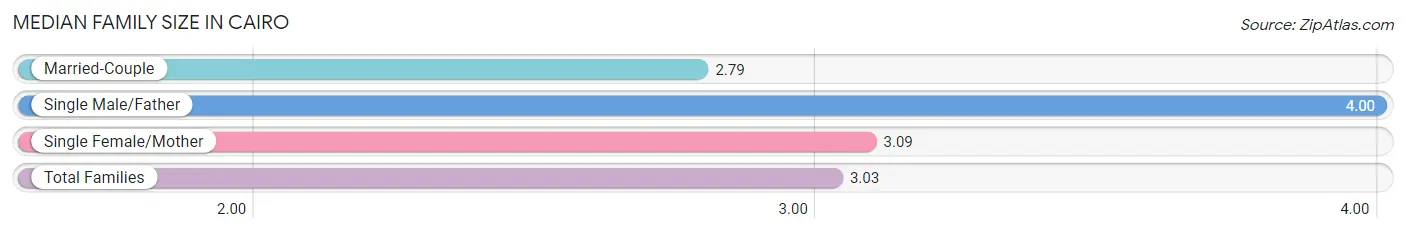
Median Family Size in Cairo
The median family size in Cairo is 3.03 persons per family, with single male/father families (4 | 11.8%) accounting for the largest median family size of 4 persons per family. On the other hand, married-couple families (19 | 55.9%) represent the smallest median family size with 2.79 persons per family.
| Family Type | # Families | Family Size |
| Married-Couple | 19 (55.9%) | 2.79 |
| Single Male/Father | 4 (11.8%) | 4.00 |
| Single Female/Mother | 11 (32.4%) | 3.09 |
| Total Families | 34 (100.0%) | 3.03 |
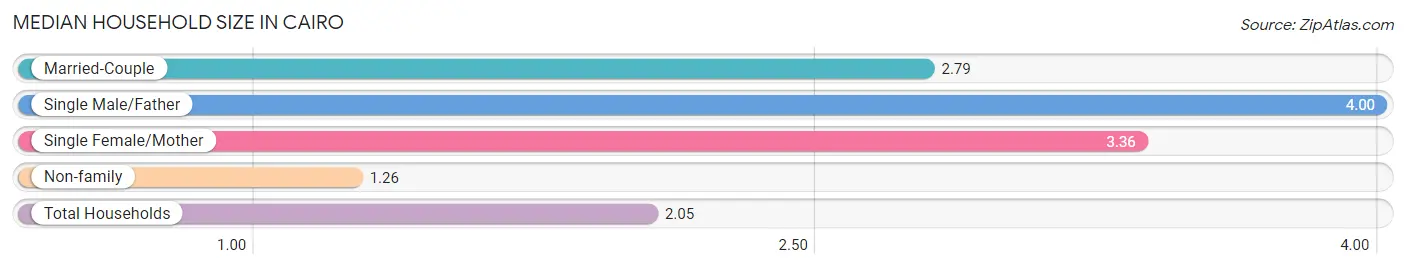
Median Household Size in Cairo
The median household size in Cairo is 2.05 persons per household, with single male/father households (4 | 5.0%) accounting for the largest median household size of 4 persons per household. non-family households (46 | 57.5%) represent the smallest median household size with 1.26 persons per household.
| Household Type | # Households | Household Size |
| Married-Couple | 19 (23.7%) | 2.79 |
| Single Male/Father | 4 (5.0%) | 4.00 |
| Single Female/Mother | 11 (13.8%) | 3.36 |
| Non-family | 46 (57.5%) | 1.26 |
| Total Households | 80 (100.0%) | 2.05 |
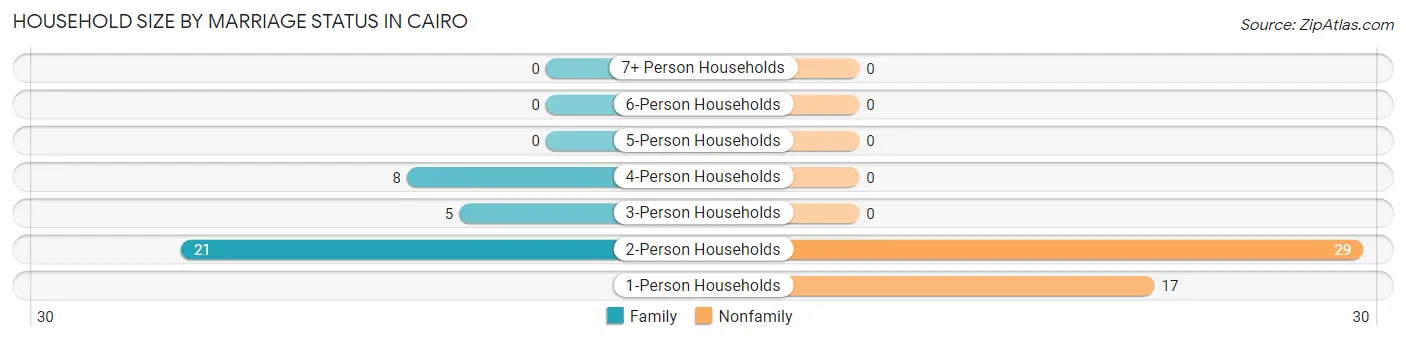
Household Size by Marriage Status in Cairo
Out of a total of 80 households in Cairo, 34 (42.5%) are family households, while 46 (57.5%) are nonfamily households. The most numerous type of family households are 2-person households, comprising 21, and the most common type of nonfamily households are 2-person households, comprising 29.
| Household Size | Family Households | Nonfamily Households |
| 1-Person Households | - | 17 (21.2%) |
| 2-Person Households | 21 (26.3%) | 29 (36.2%) |
| 3-Person Households | 5 (6.2%) | 0 (0.0%) |
| 4-Person Households | 8 (10.0%) | 0 (0.0%) |
| 5-Person Households | 0 (0.0%) | 0 (0.0%) |
| 6-Person Households | 0 (0.0%) | 0 (0.0%) |
| 7+ Person Households | 0 (0.0%) | 0 (0.0%) |
| Total | 34 (42.5%) | 46 (57.5%) |
Female Fertility in Cairo
Fertility by Age in Cairo
| Age Bracket | Women with Births | Births / 1,000 Women |
| 15 to 19 years | 0 (0.0%) | 0.0 |
| 20 to 34 years | 0 (0.0%) | 0.0 |
| 35 to 50 years | 0 (0.0%) | 0.0 |
| Total | 0 (0.0%) | 0.0 |
Fertility by Age by Marriage Status in Cairo
| Age Bracket | Married | Unmarried |
| 15 to 19 years | 0 (0.0%) | 0 (0.0%) |
| 20 to 34 years | 0 (0.0%) | 0 (0.0%) |
| 35 to 50 years | 0 (0.0%) | 0 (0.0%) |
| Total | 0 (0.0%) | 0 (0.0%) |
Fertility by Education in Cairo
| Educational Attainment | Women with Births | Births / 1,000 Women |
| Less than High School | 0 (0.0%) | 0.0 |
| High School Diploma | 0 (0.0%) | 0.0 |
| College or Associate's Degree | 0 (0.0%) | 0.0 |
| Bachelor's Degree | 0 (0.0%) | 0.0 |
| Graduate Degree | 0 (0.0%) | 0.0 |
| Total | 0 (0.0%) | 0.0 |
Fertility by Education by Marriage Status in Cairo
| Educational Attainment | Married | Unmarried |
| Less than High School | 0 (0.0%) | 0 (0.0%) |
| High School Diploma | 0 (0.0%) | 0 (0.0%) |
| College or Associate's Degree | 0 (0.0%) | 0 (0.0%) |
| Bachelor's Degree | 0 (0.0%) | 0 (0.0%) |
| Graduate Degree | 0 (0.0%) | 0 (0.0%) |
| Total | 0 (0.0%) | 0 (0.0%) |
Employment Characteristics in Cairo
Employment by Class of Employer in Cairo
Among the 50 employed individuals in Cairo, private company employees (31 | 62.0%), state government employees (10 | 20.0%), and not-for-profit organizations (6 | 12.0%) make up the most common classes of employment.
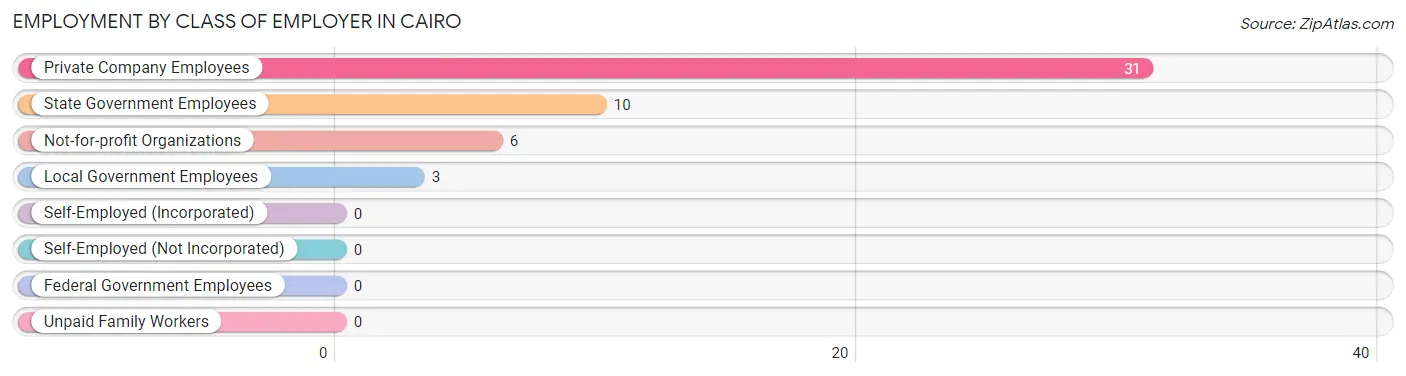
| Employer Class | # Employees | % Employees |
| Private Company Employees | 31 | 62.0% |
| Self-Employed (Incorporated) | 0 | 0.0% |
| Self-Employed (Not Incorporated) | 0 | 0.0% |
| Not-for-profit Organizations | 6 | 12.0% |
| Local Government Employees | 3 | 6.0% |
| State Government Employees | 10 | 20.0% |
| Federal Government Employees | 0 | 0.0% |
| Unpaid Family Workers | 0 | 0.0% |
| Total | 50 | 100.0% |
Employment Status by Age in Cairo
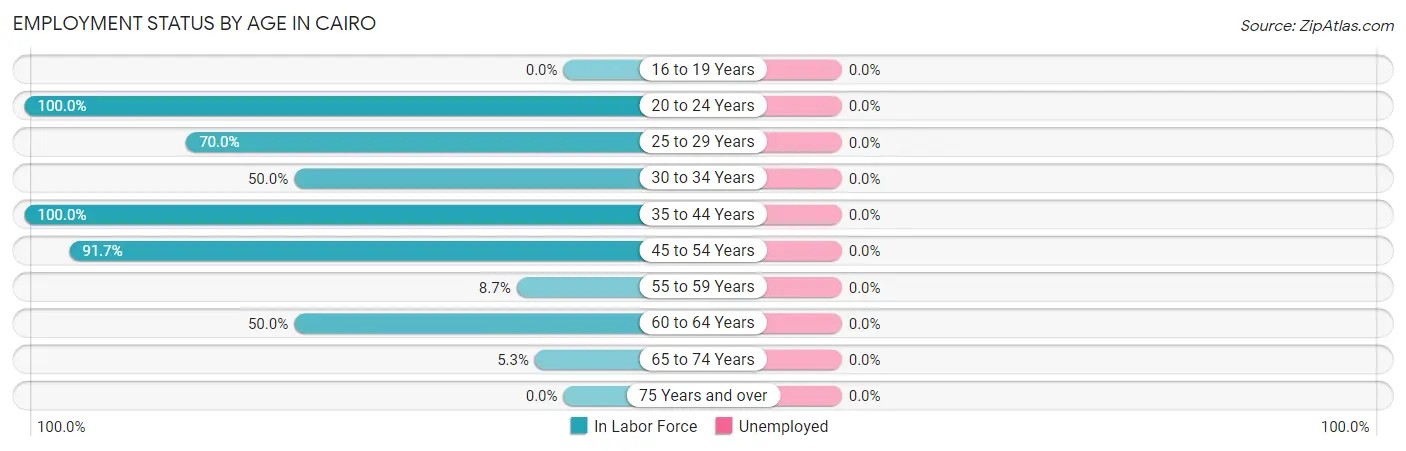
| Age Bracket | In Labor Force | Unemployed |
| 16 to 19 Years | 0 (0.0%) | 0 (0.0%) |
| 20 to 24 Years | 9 (100.0%) | 0 (0.0%) |
| 25 to 29 Years | 7 (70.0%) | 0 (0.0%) |
| 30 to 34 Years | 2 (50.0%) | 0 (0.0%) |
| 35 to 44 Years | 9 (100.0%) | 0 (0.0%) |
| 45 to 54 Years | 11 (91.7%) | 0 (0.0%) |
| 55 to 59 Years | 4 (8.7%) | 0 (0.0%) |
| 60 to 64 Years | 7 (50.0%) | 0 (0.0%) |
| 65 to 74 Years | 1 (5.3%) | 0 (0.0%) |
| 75 Years and over | 0 (0.0%) | 0 (0.0%) |
| Total | 50 (32.5%) | 0 (0.0%) |
Employment Status by Educational Attainment in Cairo
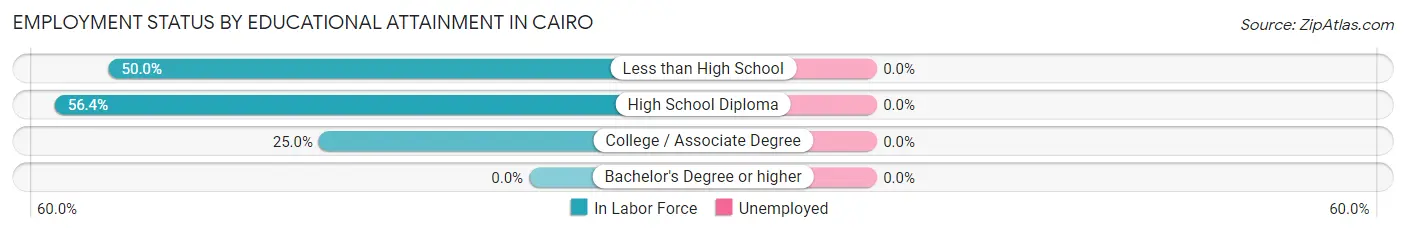
| Educational Attainment | In Labor Force | Unemployed |
| Less than High School | 8 (50.0%) | 0 (0.0%) |
| High School Diploma | 22 (56.4%) | 0 (0.0%) |
| College / Associate Degree | 10 (25.0%) | 0 (0.0%) |
| Bachelor's Degree or higher | 0 (0.0%) | 0 (0.0%) |
| Total | 40 (42.1%) | 0 (0.0%) |
Employment Occupations by Sex in Cairo
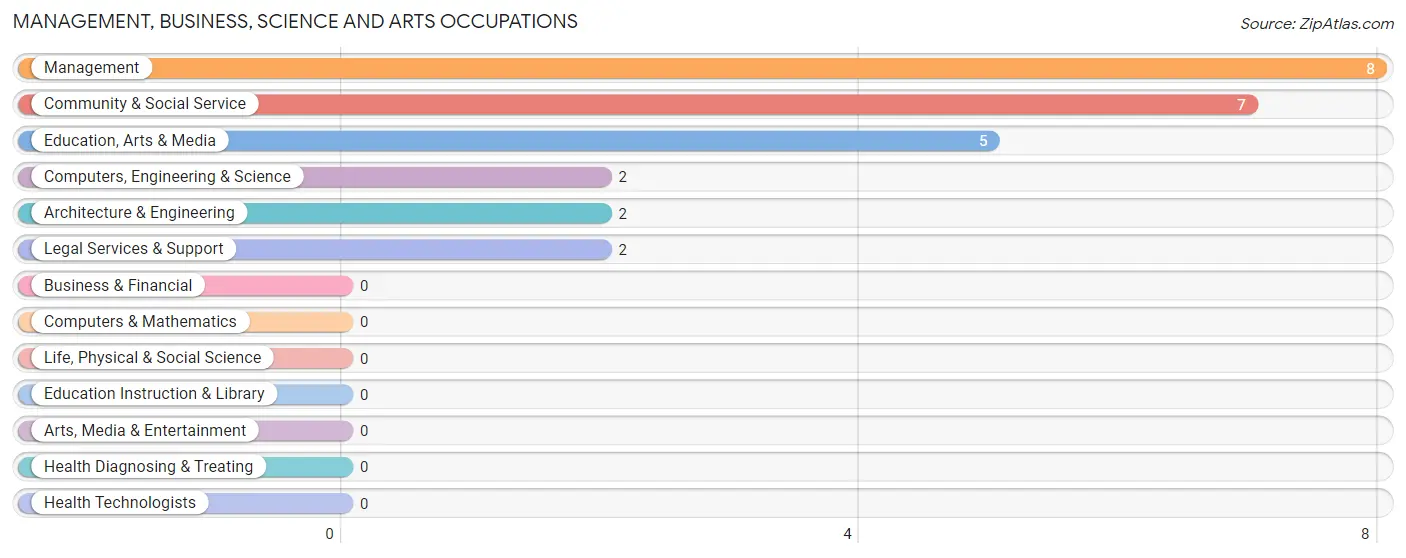
Management, Business, Science and Arts Occupations
The most common Management, Business, Science and Arts occupations in Cairo are Management (8 | 16.0%), Community & Social Service (7 | 14.0%), Education, Arts & Media (5 | 10.0%), Computers, Engineering & Science (2 | 4.0%), and Architecture & Engineering (2 | 4.0%).
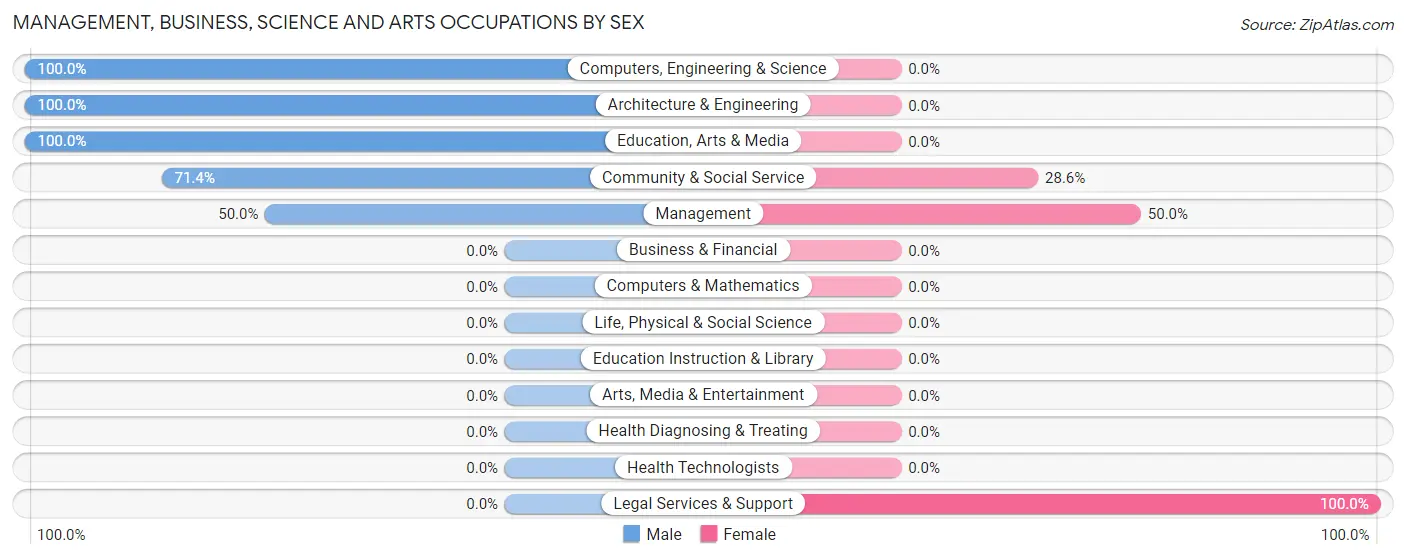
Management, Business, Science and Arts Occupations by Sex
Within the Management, Business, Science and Arts occupations in Cairo, the most male-oriented occupations are Computers, Engineering & Science (100.0%), Architecture & Engineering (100.0%), and Education, Arts & Media (100.0%), while the most female-oriented occupations are Legal Services & Support (100.0%), Management (50.0%), and Community & Social Service (28.6%).
| Occupation | Male | Female |
| Management | 4 (50.0%) | 4 (50.0%) |
| Business & Financial | 0 (0.0%) | 0 (0.0%) |
| Computers, Engineering & Science | 2 (100.0%) | 0 (0.0%) |
| Computers & Mathematics | 0 (0.0%) | 0 (0.0%) |
| Architecture & Engineering | 2 (100.0%) | 0 (0.0%) |
| Life, Physical & Social Science | 0 (0.0%) | 0 (0.0%) |
| Community & Social Service | 5 (71.4%) | 2 (28.6%) |
| Education, Arts & Media | 5 (100.0%) | 0 (0.0%) |
| Legal Services & Support | 0 (0.0%) | 2 (100.0%) |
| Education Instruction & Library | 0 (0.0%) | 0 (0.0%) |
| Arts, Media & Entertainment | 0 (0.0%) | 0 (0.0%) |
| Health Diagnosing & Treating | 0 (0.0%) | 0 (0.0%) |
| Health Technologists | 0 (0.0%) | 0 (0.0%) |
| Total (Category) | 11 (64.7%) | 6 (35.3%) |
| Total (Overall) | 29 (58.0%) | 21 (42.0%) |
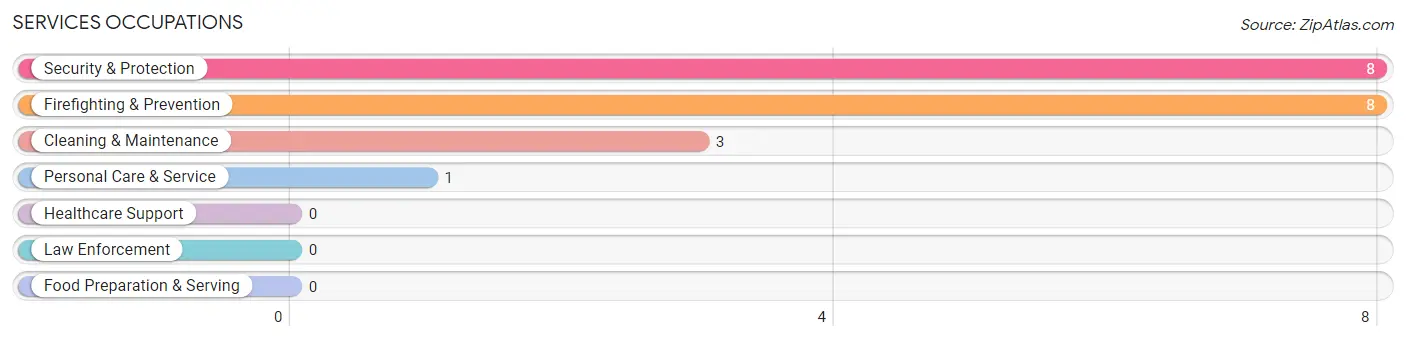
Services Occupations
The most common Services occupations in Cairo are Security & Protection (8 | 16.0%), Firefighting & Prevention (8 | 16.0%), Cleaning & Maintenance (3 | 6.0%), and Personal Care & Service (1 | 2.0%).
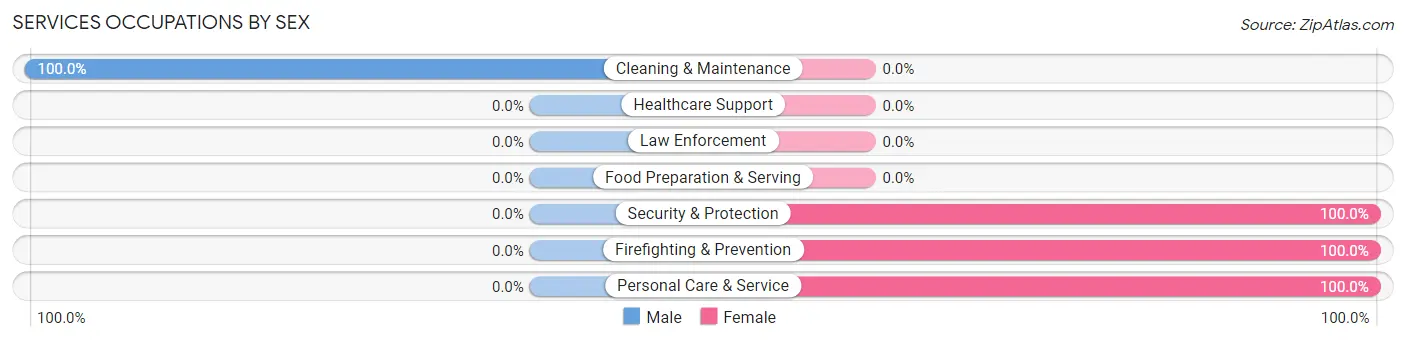
Services Occupations by Sex
| Occupation | Male | Female |
| Healthcare Support | 0 (0.0%) | 0 (0.0%) |
| Security & Protection | 0 (0.0%) | 8 (100.0%) |
| Firefighting & Prevention | 0 (0.0%) | 8 (100.0%) |
| Law Enforcement | 0 (0.0%) | 0 (0.0%) |
| Food Preparation & Serving | 0 (0.0%) | 0 (0.0%) |
| Cleaning & Maintenance | 3 (100.0%) | 0 (0.0%) |
| Personal Care & Service | 0 (0.0%) | 1 (100.0%) |
| Total (Category) | 3 (25.0%) | 9 (75.0%) |
| Total (Overall) | 29 (58.0%) | 21 (42.0%) |
Sales and Office Occupations
The most common Sales and Office occupations in Cairo are , and Office & Administration (6 | 12.0%).
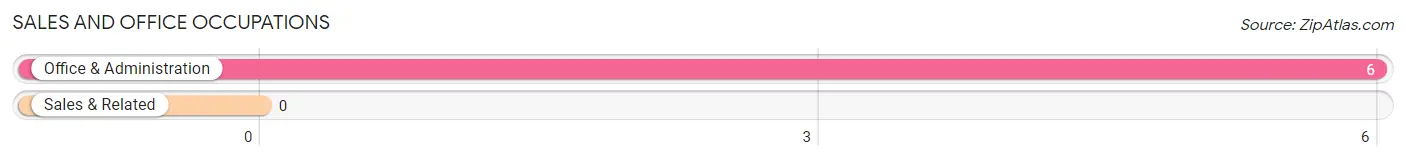
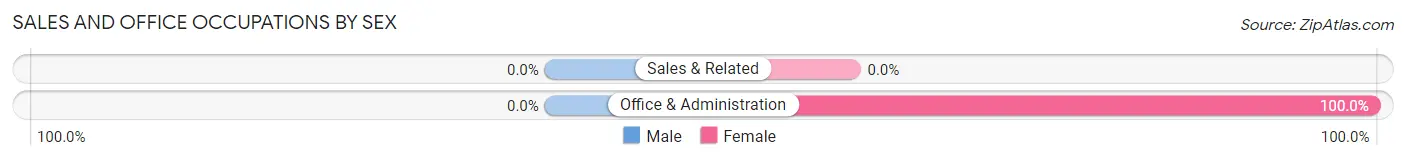
Sales and Office Occupations by Sex
| Occupation | Male | Female |
| Sales & Related | 0 (0.0%) | 0 (0.0%) |
| Office & Administration | 0 (0.0%) | 6 (100.0%) |
| Total (Category) | 0 (0.0%) | 6 (100.0%) |
| Total (Overall) | 29 (58.0%) | 21 (42.0%) |
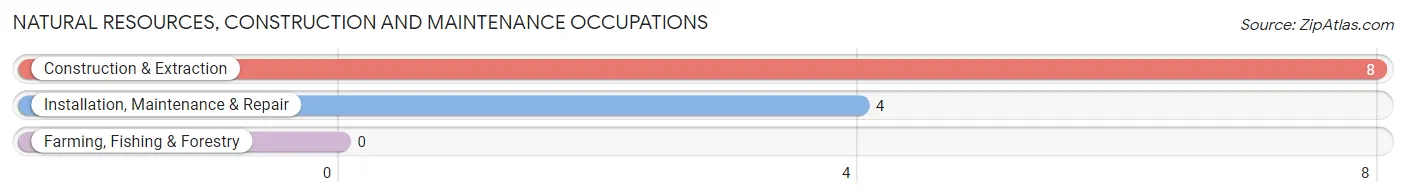
Natural Resources, Construction and Maintenance Occupations
The most common Natural Resources, Construction and Maintenance occupations in Cairo are Construction & Extraction (8 | 16.0%), and Installation, Maintenance & Repair (4 | 8.0%).
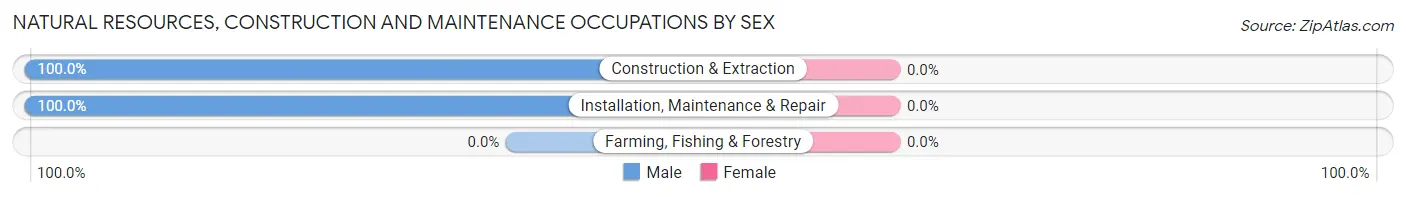
Natural Resources, Construction and Maintenance Occupations by Sex
| Occupation | Male | Female |
| Farming, Fishing & Forestry | 0 (0.0%) | 0 (0.0%) |
| Construction & Extraction | 8 (100.0%) | 0 (0.0%) |
| Installation, Maintenance & Repair | 4 (100.0%) | 0 (0.0%) |
| Total (Category) | 12 (100.0%) | 0 (0.0%) |
| Total (Overall) | 29 (58.0%) | 21 (42.0%) |
Production, Transportation and Moving Occupations
The most common Production, Transportation and Moving occupations in Cairo are , and Material Moving (3 | 6.0%).
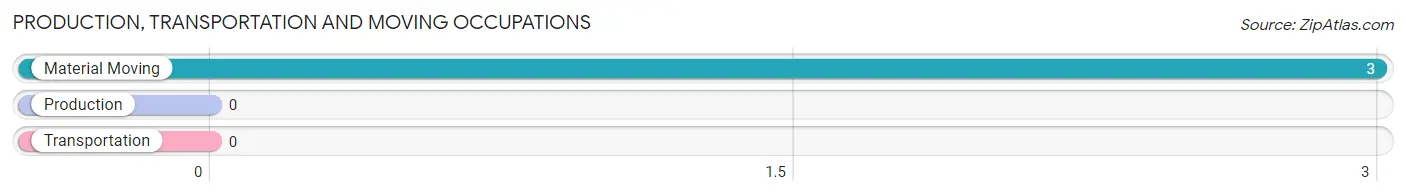
Production, Transportation and Moving Occupations by Sex
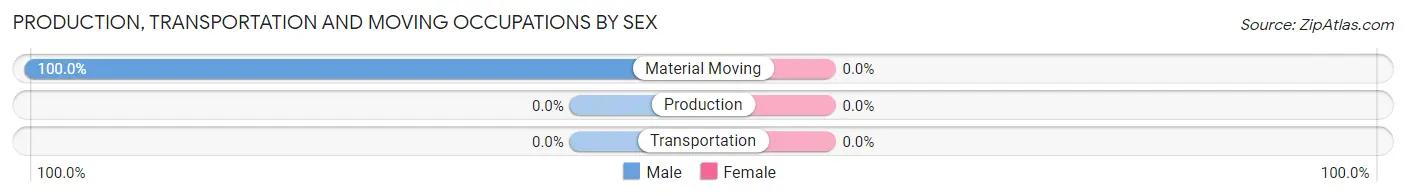
| Occupation | Male | Female |
| Production | 0 (0.0%) | 0 (0.0%) |
| Transportation | 0 (0.0%) | 0 (0.0%) |
| Material Moving | 3 (100.0%) | 0 (0.0%) |
| Total (Category) | 3 (100.0%) | 0 (0.0%) |
| Total (Overall) | 29 (58.0%) | 21 (42.0%) |
Employment Industries by Sex in Cairo
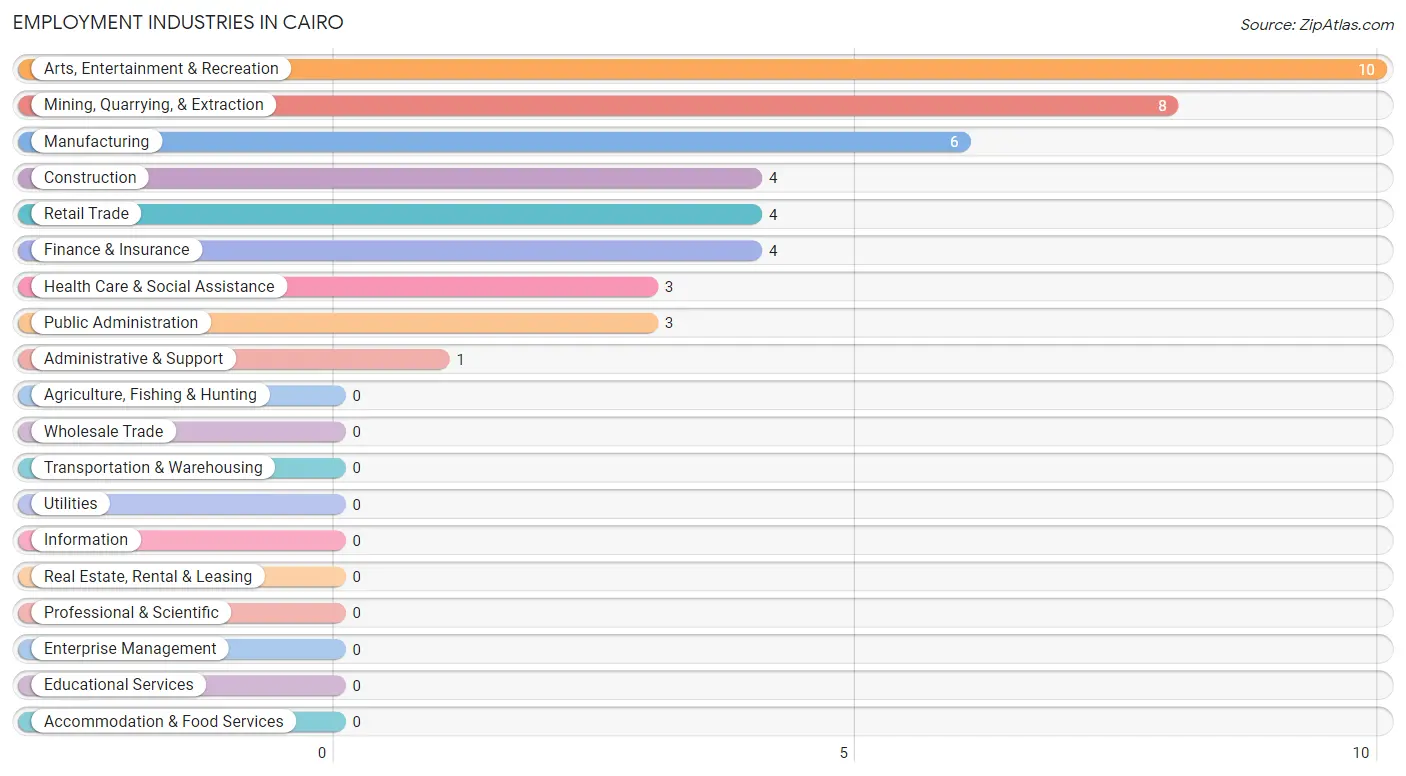
Employment Industries in Cairo
The major employment industries in Cairo include Arts, Entertainment & Recreation (10 | 20.0%), Mining, Quarrying, & Extraction (8 | 16.0%), Manufacturing (6 | 12.0%), Construction (4 | 8.0%), and Retail Trade (4 | 8.0%).
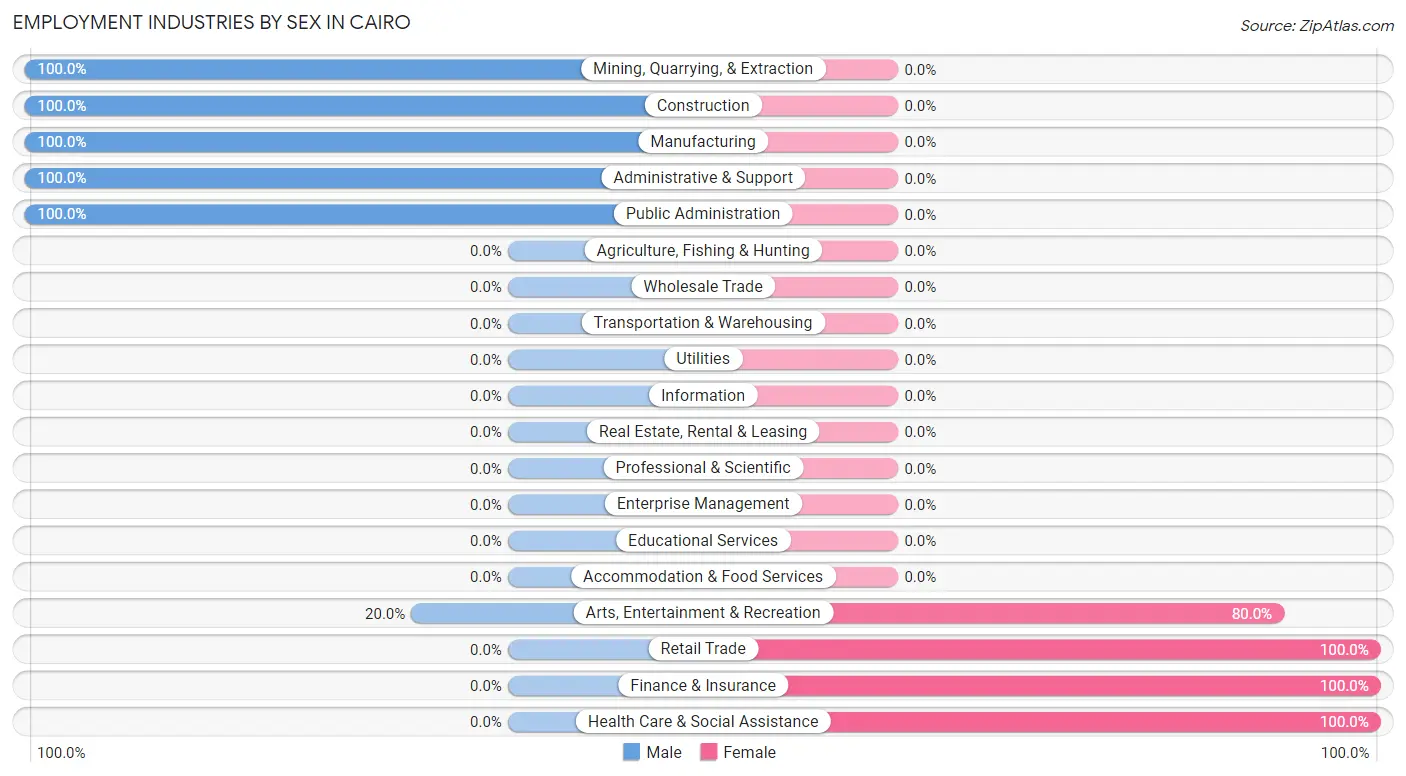
Employment Industries by Sex in Cairo
The Cairo industries that see more men than women are Mining, Quarrying, & Extraction (100.0%), Construction (100.0%), and Manufacturing (100.0%), whereas the industries that tend to have a higher number of women are Retail Trade (100.0%), Finance & Insurance (100.0%), and Health Care & Social Assistance (100.0%).
| Industry | Male | Female |
| Agriculture, Fishing & Hunting | 0 (0.0%) | 0 (0.0%) |
| Mining, Quarrying, & Extraction | 8 (100.0%) | 0 (0.0%) |
| Construction | 4 (100.0%) | 0 (0.0%) |
| Manufacturing | 6 (100.0%) | 0 (0.0%) |
| Wholesale Trade | 0 (0.0%) | 0 (0.0%) |
| Retail Trade | 0 (0.0%) | 4 (100.0%) |
| Transportation & Warehousing | 0 (0.0%) | 0 (0.0%) |
| Utilities | 0 (0.0%) | 0 (0.0%) |
| Information | 0 (0.0%) | 0 (0.0%) |
| Finance & Insurance | 0 (0.0%) | 4 (100.0%) |
| Real Estate, Rental & Leasing | 0 (0.0%) | 0 (0.0%) |
| Professional & Scientific | 0 (0.0%) | 0 (0.0%) |
| Enterprise Management | 0 (0.0%) | 0 (0.0%) |
| Administrative & Support | 1 (100.0%) | 0 (0.0%) |
| Educational Services | 0 (0.0%) | 0 (0.0%) |
| Health Care & Social Assistance | 0 (0.0%) | 3 (100.0%) |
| Arts, Entertainment & Recreation | 2 (20.0%) | 8 (80.0%) |
| Accommodation & Food Services | 0 (0.0%) | 0 (0.0%) |
| Public Administration | 3 (100.0%) | 0 (0.0%) |
| Total | 29 (58.0%) | 21 (42.0%) |
Education in Cairo
School Enrollment in Cairo
The most common levels of schooling among the 25 students in Cairo are high school (11 | 44.0%), graduate / professional (7 | 28.0%), and nursery / preschool (4 | 16.0%).
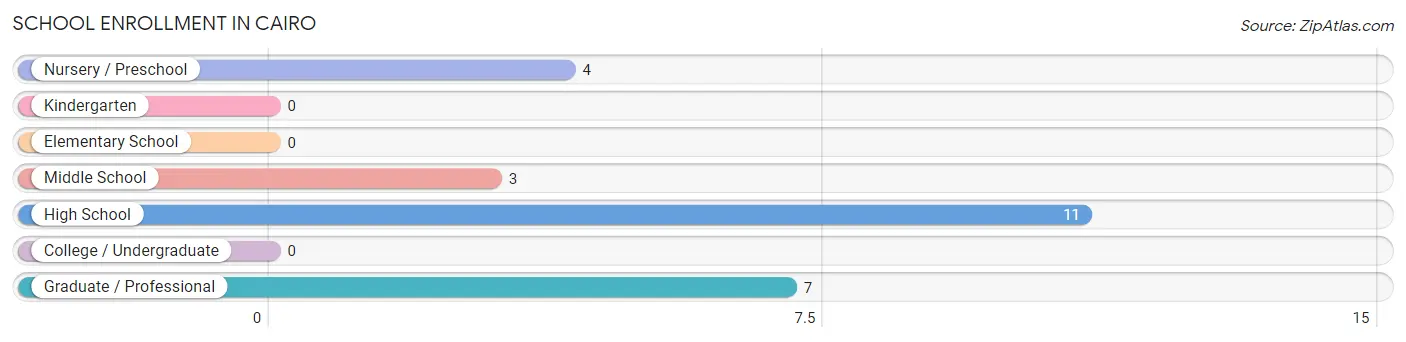
| School Level | # Students | % Students |
| Nursery / Preschool | 4 | 16.0% |
| Kindergarten | 0 | 0.0% |
| Elementary School | 0 | 0.0% |
| Middle School | 3 | 12.0% |
| High School | 11 | 44.0% |
| College / Undergraduate | 0 | 0.0% |
| Graduate / Professional | 7 | 28.0% |
| Total | 25 | 100.0% |
School Enrollment by Age by Funding Source in Cairo
Out of a total of 25 students who are enrolled in schools in Cairo, 3 (12.0%) attend a private institution, while the remaining 22 (88.0%) are enrolled in public schools. The age group of 20 to 24 year olds has the highest likelihood of being enrolled in private schools, with 3 (100.0% in the age bracket) enrolled. Conversely, the age group of 5 to 9 year old has the lowest likelihood of being enrolled in a private school, with 4 (100.0% in the age bracket) attending a public institution.
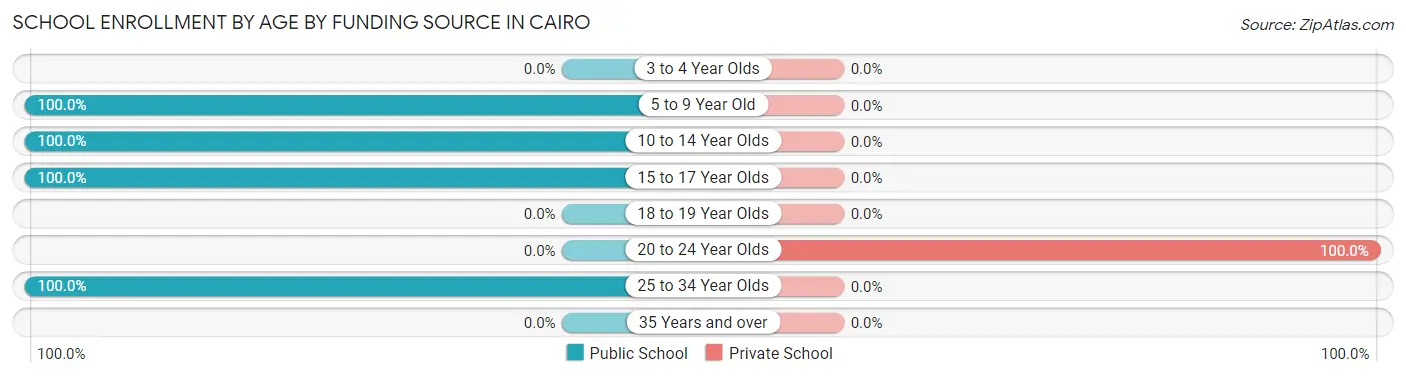
| Age Bracket | Public School | Private School |
| 3 to 4 Year Olds | 0 (0.0%) | 0 (0.0%) |
| 5 to 9 Year Old | 4 (100.0%) | 0 (0.0%) |
| 10 to 14 Year Olds | 3 (100.0%) | 0 (0.0%) |
| 15 to 17 Year Olds | 11 (100.0%) | 0 (0.0%) |
| 18 to 19 Year Olds | 0 (0.0%) | 0 (0.0%) |
| 20 to 24 Year Olds | 0 (0.0%) | 3 (100.0%) |
| 25 to 34 Year Olds | 4 (100.0%) | 0 (0.0%) |
| 35 Years and over | 0 (0.0%) | 0 (0.0%) |
| Total | 22 (88.0%) | 3 (12.0%) |
Educational Attainment by Field of Study in Cairo
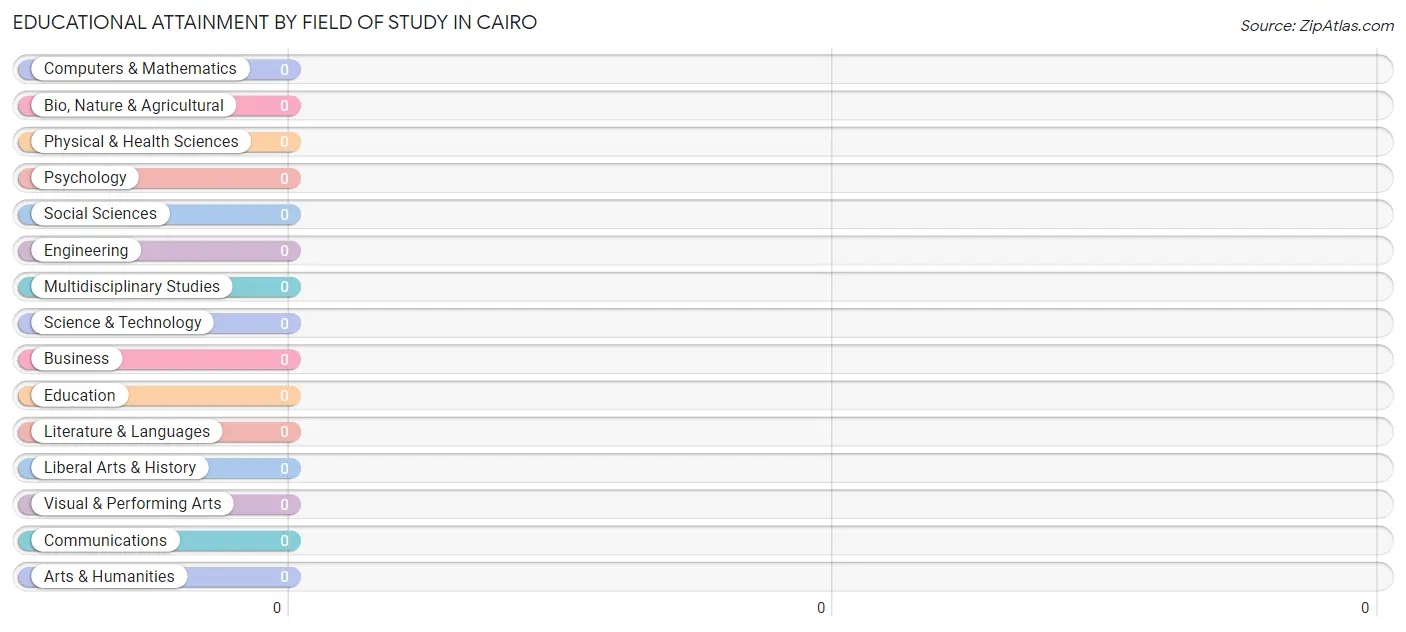
| Field of Study | # Graduates | % Graduates |
| Computers & Mathematics | 0 | 0.0% |
| Bio, Nature & Agricultural | 0 | 0.0% |
| Physical & Health Sciences | 0 | 0.0% |
| Psychology | 0 | 0.0% |
| Social Sciences | 0 | 0.0% |
| Engineering | 0 | 0.0% |
| Multidisciplinary Studies | 0 | 0.0% |
| Science & Technology | 0 | 0.0% |
| Business | 0 | 0.0% |
| Education | 0 | 0.0% |
| Literature & Languages | 0 | 0.0% |
| Liberal Arts & History | 0 | 0.0% |
| Visual & Performing Arts | 0 | 0.0% |
| Communications | 0 | 0.0% |
| Arts & Humanities | 0 | 0.0% |
| Total | 0 | 0.0% |
Transportation & Commute in Cairo
Vehicle Availability by Sex in Cairo
The most prevalent vehicle ownership categories in Cairo are males with 3 vehicles (10, accounting for 34.5%) and females with 3 vehicles (8, making up 47.6%).
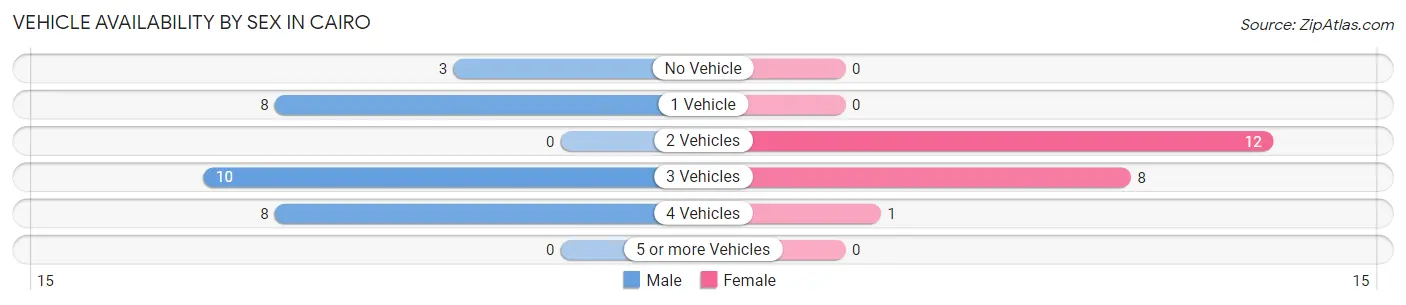
| Vehicles Available | Male | Female |
| No Vehicle | 3 (10.3%) | 0 (0.0%) |
| 1 Vehicle | 8 (27.6%) | 0 (0.0%) |
| 2 Vehicles | 0 (0.0%) | 12 (57.1%) |
| 3 Vehicles | 10 (34.5%) | 8 (38.1%) |
| 4 Vehicles | 8 (27.6%) | 1 (4.8%) |
| 5 or more Vehicles | 0 (0.0%) | 0 (0.0%) |
| Total | 29 (100.0%) | 21 (100.0%) |
Commute Time in Cairo
The most frequently occuring commute durations in Cairo are 20 to 24 minutes (13 commuters, 26.0%), 30 to 34 minutes (9 commuters, 18.0%), and 10 to 14 minutes (8 commuters, 16.0%).
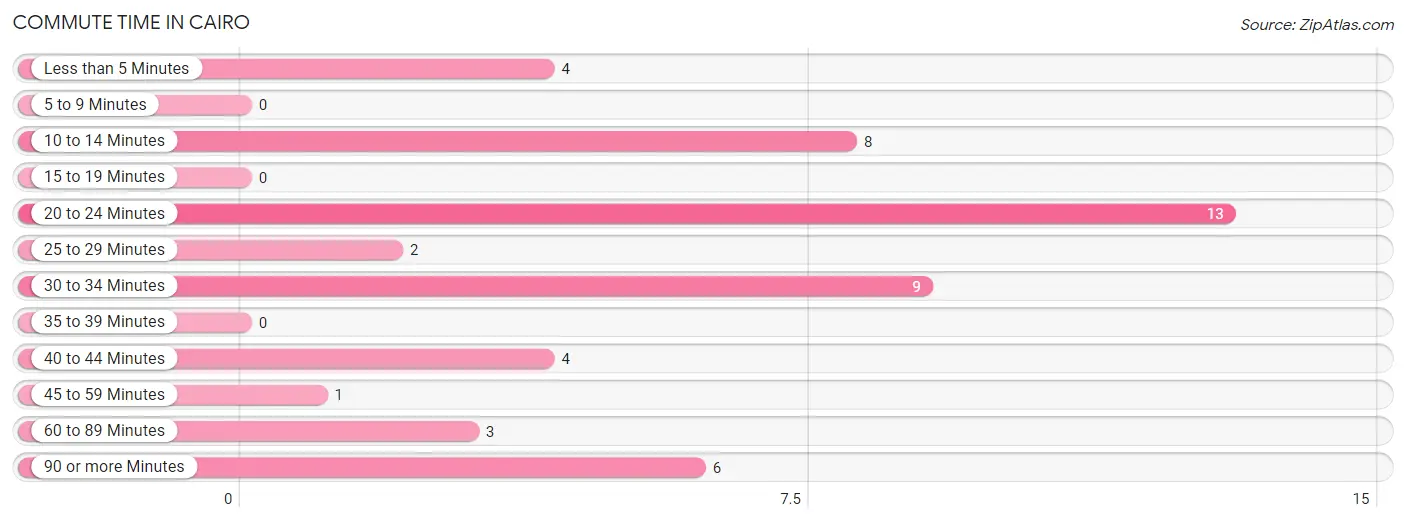
| Commute Time | # Commuters | % Commuters |
| Less than 5 Minutes | 4 | 8.0% |
| 5 to 9 Minutes | 0 | 0.0% |
| 10 to 14 Minutes | 8 | 16.0% |
| 15 to 19 Minutes | 0 | 0.0% |
| 20 to 24 Minutes | 13 | 26.0% |
| 25 to 29 Minutes | 2 | 4.0% |
| 30 to 34 Minutes | 9 | 18.0% |
| 35 to 39 Minutes | 0 | 0.0% |
| 40 to 44 Minutes | 4 | 8.0% |
| 45 to 59 Minutes | 1 | 2.0% |
| 60 to 89 Minutes | 3 | 6.0% |
| 90 or more Minutes | 6 | 12.0% |
Commute Time by Sex in Cairo
The most common commute times in Cairo are 20 to 24 minutes (10 commuters, 34.5%) for males and 10 to 14 minutes (8 commuters, 38.1%) for females.
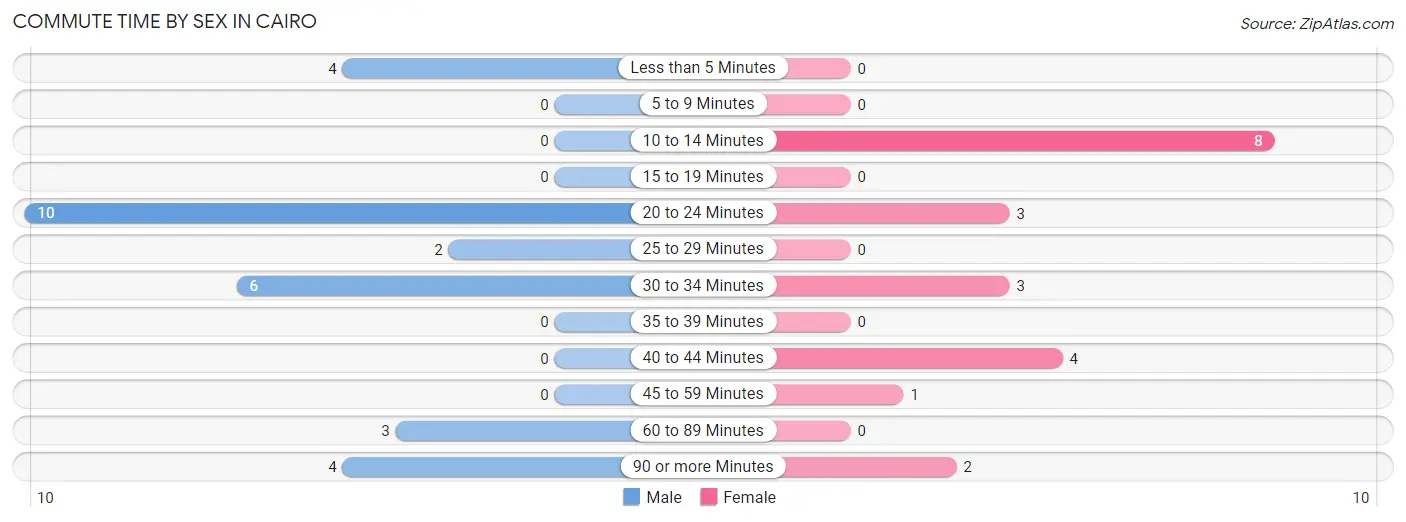
| Commute Time | Male | Female |
| Less than 5 Minutes | 4 (13.8%) | 0 (0.0%) |
| 5 to 9 Minutes | 0 (0.0%) | 0 (0.0%) |
| 10 to 14 Minutes | 0 (0.0%) | 8 (38.1%) |
| 15 to 19 Minutes | 0 (0.0%) | 0 (0.0%) |
| 20 to 24 Minutes | 10 (34.5%) | 3 (14.3%) |
| 25 to 29 Minutes | 2 (6.9%) | 0 (0.0%) |
| 30 to 34 Minutes | 6 (20.7%) | 3 (14.3%) |
| 35 to 39 Minutes | 0 (0.0%) | 0 (0.0%) |
| 40 to 44 Minutes | 0 (0.0%) | 4 (19.1%) |
| 45 to 59 Minutes | 0 (0.0%) | 1 (4.8%) |
| 60 to 89 Minutes | 3 (10.3%) | 0 (0.0%) |
| 90 or more Minutes | 4 (13.8%) | 2 (9.5%) |
Time of Departure to Work by Sex in Cairo
The most frequent times of departure to work in Cairo are 5:30 AM to 5:59 AM (14, 48.3%) for males and 7:00 AM to 7:29 AM (8, 38.1%) for females.
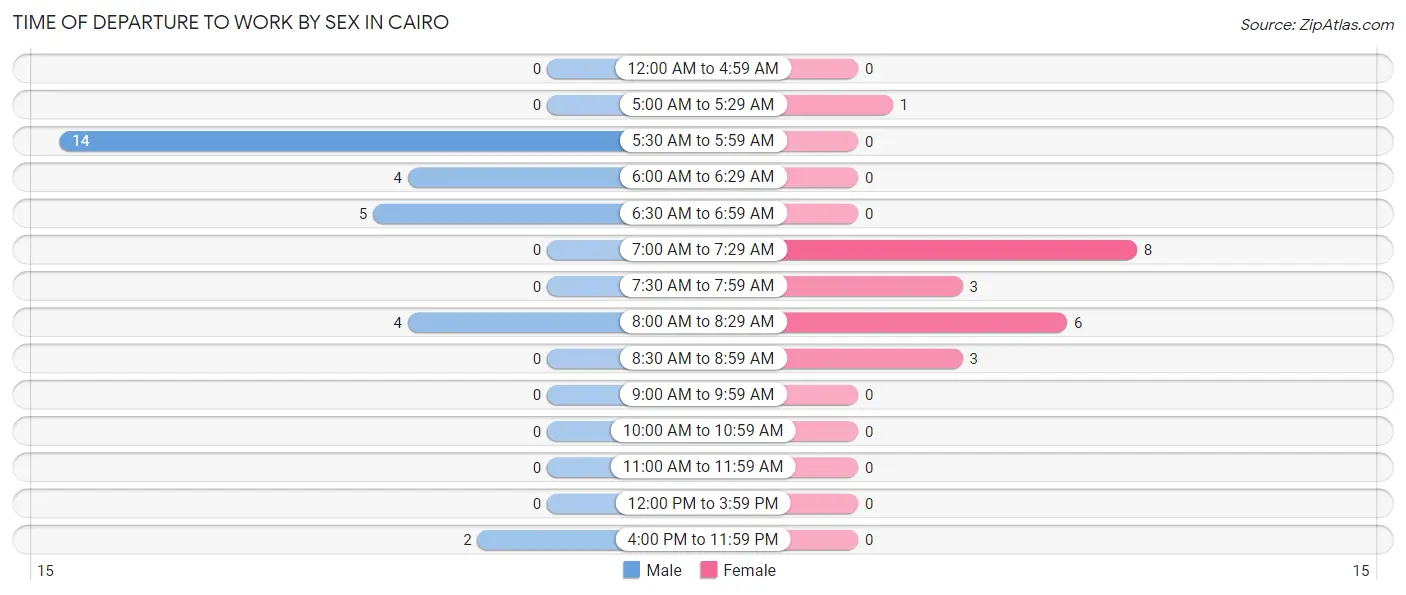
| Time of Departure | Male | Female |
| 12:00 AM to 4:59 AM | 0 (0.0%) | 0 (0.0%) |
| 5:00 AM to 5:29 AM | 0 (0.0%) | 1 (4.8%) |
| 5:30 AM to 5:59 AM | 14 (48.3%) | 0 (0.0%) |
| 6:00 AM to 6:29 AM | 4 (13.8%) | 0 (0.0%) |
| 6:30 AM to 6:59 AM | 5 (17.2%) | 0 (0.0%) |
| 7:00 AM to 7:29 AM | 0 (0.0%) | 8 (38.1%) |
| 7:30 AM to 7:59 AM | 0 (0.0%) | 3 (14.3%) |
| 8:00 AM to 8:29 AM | 4 (13.8%) | 6 (28.6%) |
| 8:30 AM to 8:59 AM | 0 (0.0%) | 3 (14.3%) |
| 9:00 AM to 9:59 AM | 0 (0.0%) | 0 (0.0%) |
| 10:00 AM to 10:59 AM | 0 (0.0%) | 0 (0.0%) |
| 11:00 AM to 11:59 AM | 0 (0.0%) | 0 (0.0%) |
| 12:00 PM to 3:59 PM | 0 (0.0%) | 0 (0.0%) |
| 4:00 PM to 11:59 PM | 2 (6.9%) | 0 (0.0%) |
| Total | 29 (100.0%) | 21 (100.0%) |
Housing Occupancy in Cairo
Occupancy by Ownership in Cairo
Of the total 80 dwellings in Cairo, owner-occupied units account for 65 (81.2%), while renter-occupied units make up 15 (18.8%).
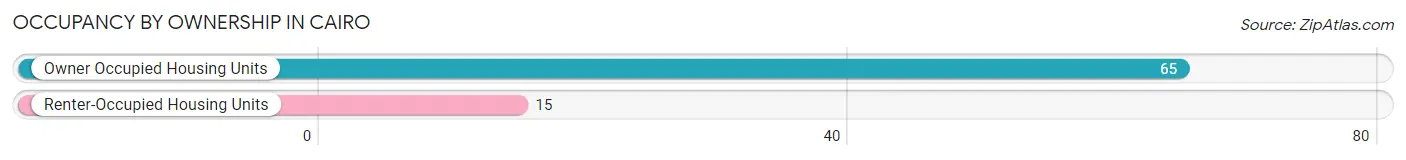
| Occupancy | # Housing Units | % Housing Units |
| Owner Occupied Housing Units | 65 | 81.2% |
| Renter-Occupied Housing Units | 15 | 18.8% |
| Total Occupied Housing Units | 80 | 100.0% |
Occupancy by Household Size in Cairo
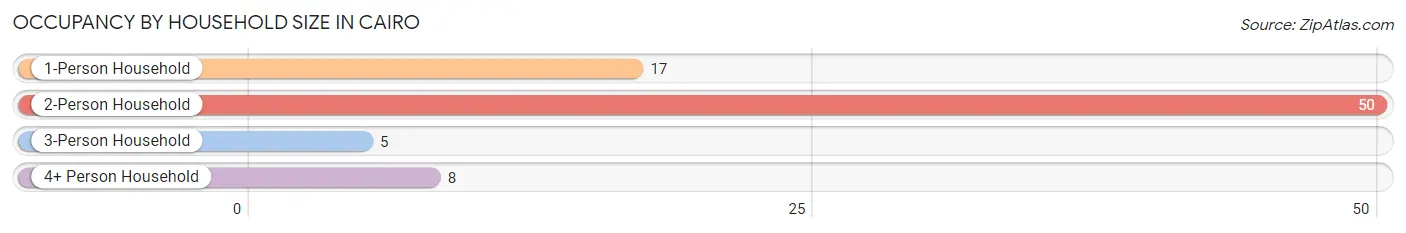
| Household Size | # Housing Units | % Housing Units |
| 1-Person Household | 17 | 21.2% |
| 2-Person Household | 50 | 62.5% |
| 3-Person Household | 5 | 6.2% |
| 4+ Person Household | 8 | 10.0% |
| Total Housing Units | 80 | 100.0% |
Occupancy by Ownership by Household Size in Cairo
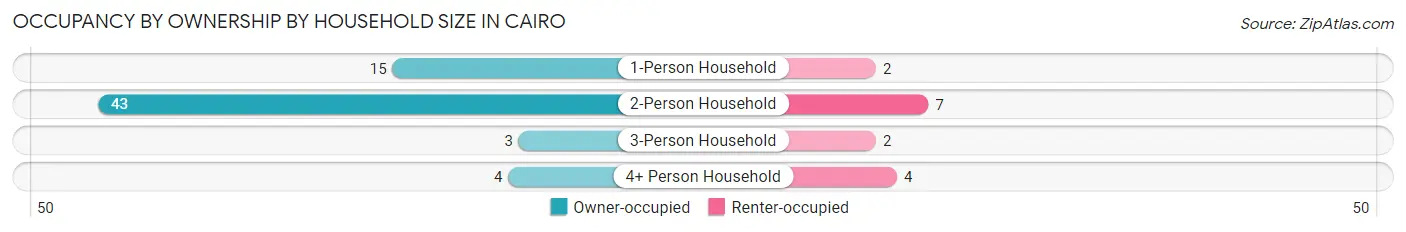
| Household Size | Owner-occupied | Renter-occupied |
| 1-Person Household | 15 (88.2%) | 2 (11.8%) |
| 2-Person Household | 43 (86.0%) | 7 (14.0%) |
| 3-Person Household | 3 (60.0%) | 2 (40.0%) |
| 4+ Person Household | 4 (50.0%) | 4 (50.0%) |
| Total Housing Units | 65 (81.2%) | 15 (18.8%) |
Occupancy by Educational Attainment in Cairo
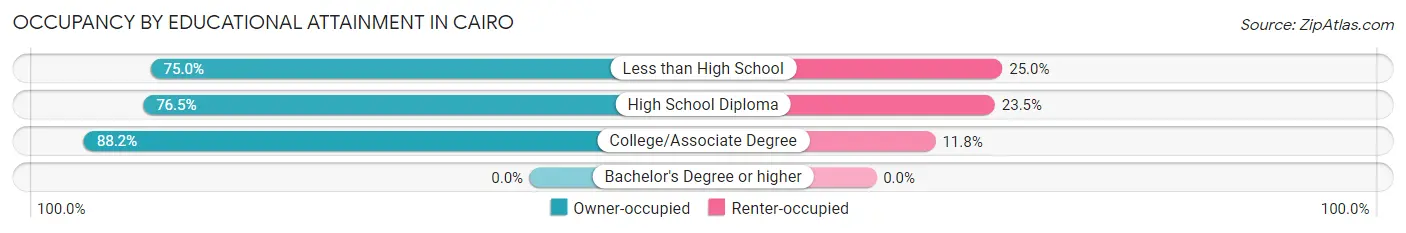
| Household Size | Owner-occupied | Renter-occupied |
| Less than High School | 9 (75.0%) | 3 (25.0%) |
| High School Diploma | 26 (76.5%) | 8 (23.5%) |
| College/Associate Degree | 30 (88.2%) | 4 (11.8%) |
| Bachelor's Degree or higher | 0 (0.0%) | 0 (0.0%) |
Occupancy by Age of Householder in Cairo
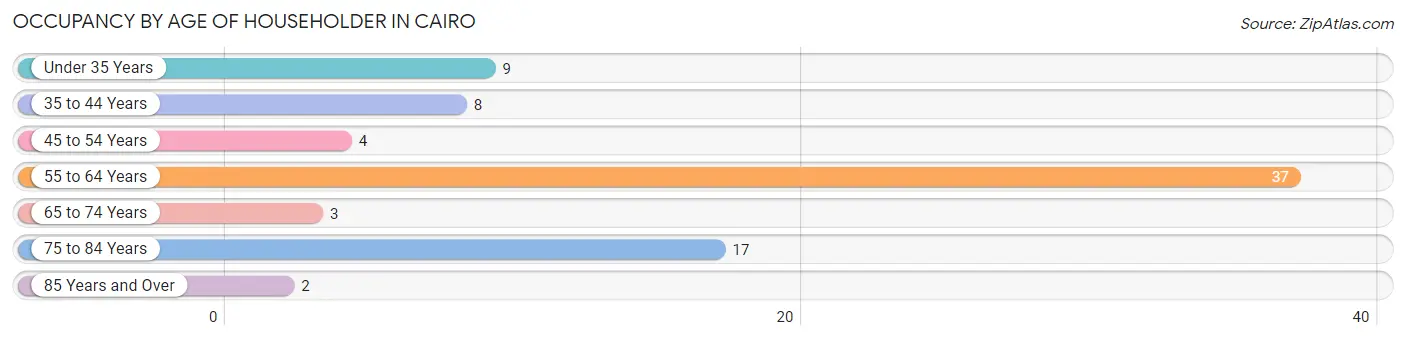
| Age Bracket | # Households | % Households |
| Under 35 Years | 9 | 11.3% |
| 35 to 44 Years | 8 | 10.0% |
| 45 to 54 Years | 4 | 5.0% |
| 55 to 64 Years | 37 | 46.3% |
| 65 to 74 Years | 3 | 3.7% |
| 75 to 84 Years | 17 | 21.2% |
| 85 Years and Over | 2 | 2.5% |
| Total | 80 | 100.0% |
Housing Finances in Cairo
Median Income by Occupancy in Cairo
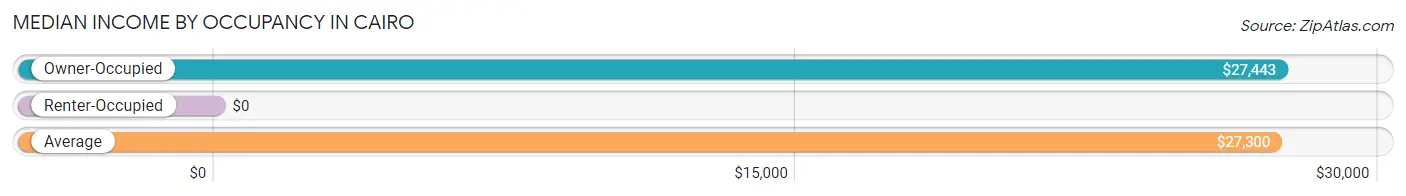
| Occupancy Type | # Households | Median Income |
| Owner-Occupied | 65 (81.2%) | $27,443 |
| Renter-Occupied | 15 (18.8%) | $0 |
| Average | 80 (100.0%) | $27,300 |
Occupancy by Householder Income Bracket in Cairo
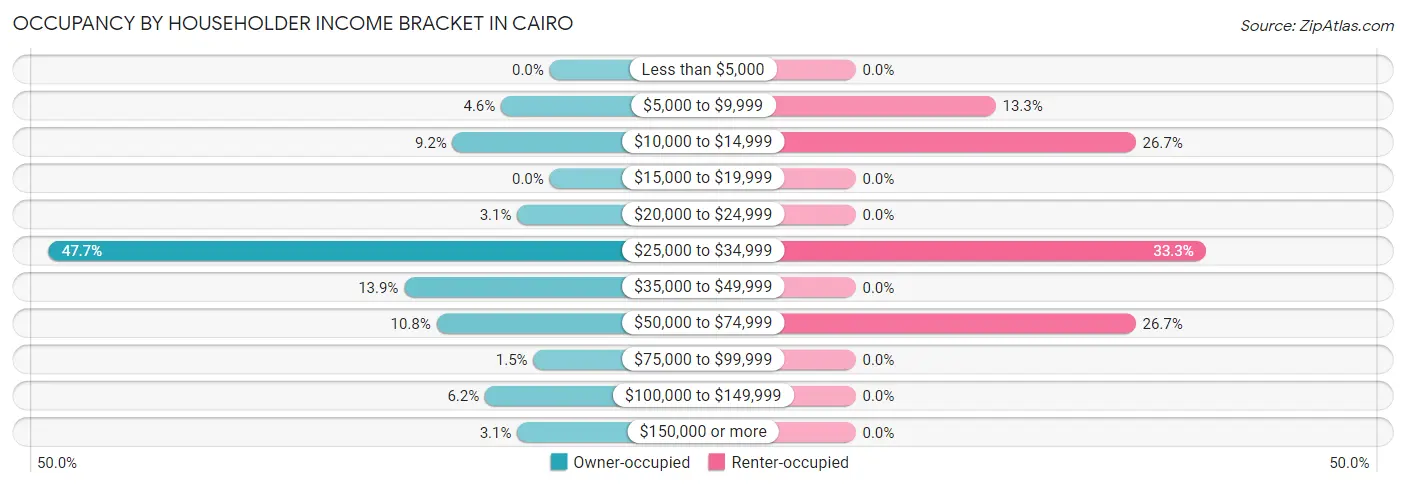
| Income Bracket | Owner-occupied | Renter-occupied |
| Less than $5,000 | 0 (0.0%) | 0 (0.0%) |
| $5,000 to $9,999 | 3 (4.6%) | 2 (13.3%) |
| $10,000 to $14,999 | 6 (9.2%) | 4 (26.7%) |
| $15,000 to $19,999 | 0 (0.0%) | 0 (0.0%) |
| $20,000 to $24,999 | 2 (3.1%) | 0 (0.0%) |
| $25,000 to $34,999 | 31 (47.7%) | 5 (33.3%) |
| $35,000 to $49,999 | 9 (13.9%) | 0 (0.0%) |
| $50,000 to $74,999 | 7 (10.8%) | 4 (26.7%) |
| $75,000 to $99,999 | 1 (1.5%) | 0 (0.0%) |
| $100,000 to $149,999 | 4 (6.1%) | 0 (0.0%) |
| $150,000 or more | 2 (3.1%) | 0 (0.0%) |
| Total | 65 (100.0%) | 15 (100.0%) |
Monthly Housing Cost Tiers in Cairo
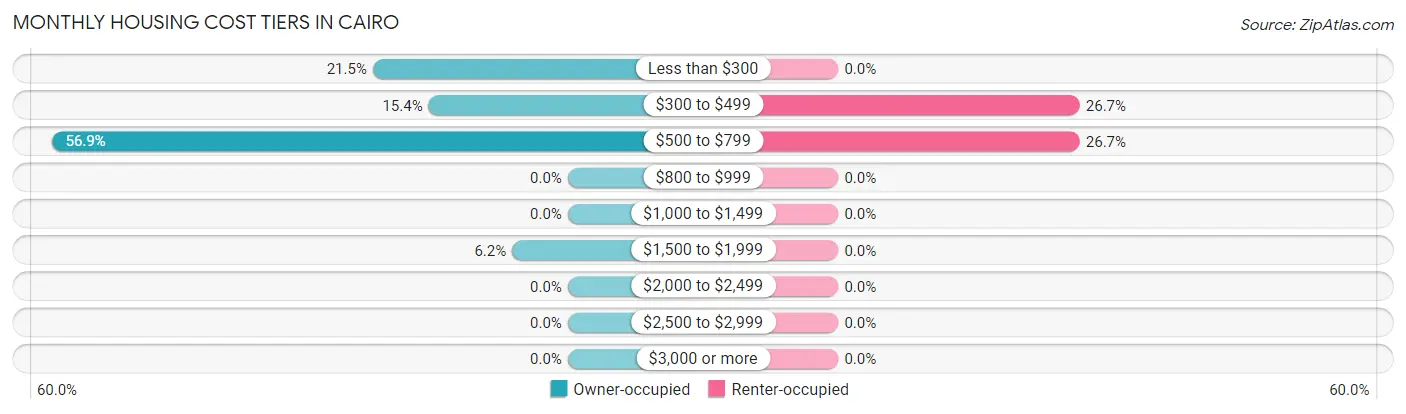
| Monthly Cost | Owner-occupied | Renter-occupied |
| Less than $300 | 14 (21.5%) | 0 (0.0%) |
| $300 to $499 | 10 (15.4%) | 4 (26.7%) |
| $500 to $799 | 37 (56.9%) | 4 (26.7%) |
| $800 to $999 | 0 (0.0%) | 0 (0.0%) |
| $1,000 to $1,499 | 0 (0.0%) | 0 (0.0%) |
| $1,500 to $1,999 | 4 (6.1%) | 0 (0.0%) |
| $2,000 to $2,499 | 0 (0.0%) | 0 (0.0%) |
| $2,500 to $2,999 | 0 (0.0%) | 0 (0.0%) |
| $3,000 or more | 0 (0.0%) | 0 (0.0%) |
| Total | 65 (100.0%) | 15 (100.0%) |
Physical Housing Characteristics in Cairo
Housing Structures in Cairo
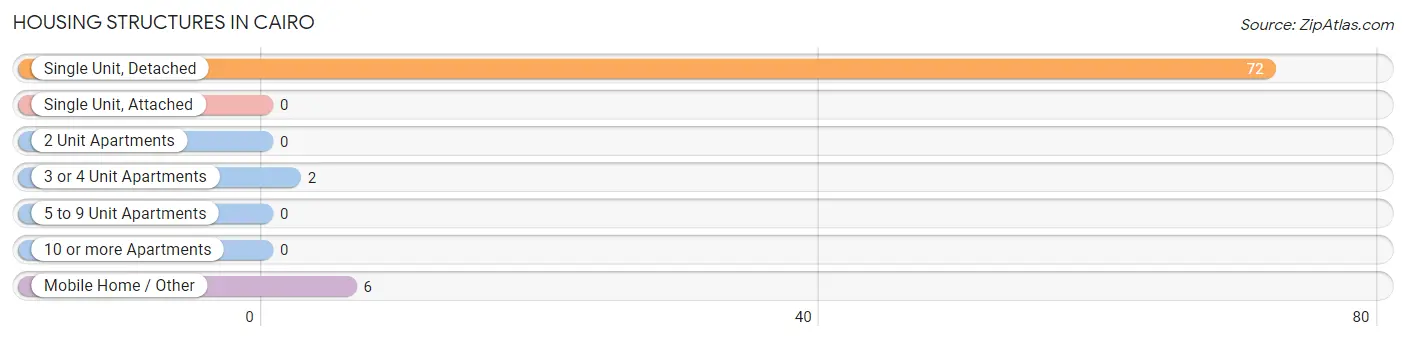
| Structure Type | # Housing Units | % Housing Units |
| Single Unit, Detached | 72 | 90.0% |
| Single Unit, Attached | 0 | 0.0% |
| 2 Unit Apartments | 0 | 0.0% |
| 3 or 4 Unit Apartments | 2 | 2.5% |
| 5 to 9 Unit Apartments | 0 | 0.0% |
| 10 or more Apartments | 0 | 0.0% |
| Mobile Home / Other | 6 | 7.5% |
| Total | 80 | 100.0% |
Housing Structures by Occupancy in Cairo
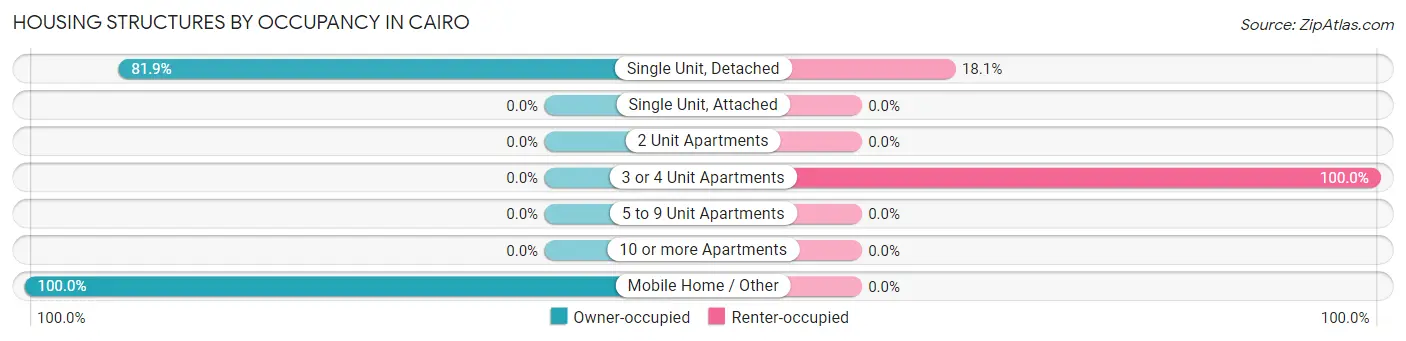
| Structure Type | Owner-occupied | Renter-occupied |
| Single Unit, Detached | 59 (81.9%) | 13 (18.1%) |
| Single Unit, Attached | 0 (0.0%) | 0 (0.0%) |
| 2 Unit Apartments | 0 (0.0%) | 0 (0.0%) |
| 3 or 4 Unit Apartments | 0 (0.0%) | 2 (100.0%) |
| 5 to 9 Unit Apartments | 0 (0.0%) | 0 (0.0%) |
| 10 or more Apartments | 0 (0.0%) | 0 (0.0%) |
| Mobile Home / Other | 6 (100.0%) | 0 (0.0%) |
| Total | 65 (81.2%) | 15 (18.8%) |
Housing Structures by Number of Rooms in Cairo
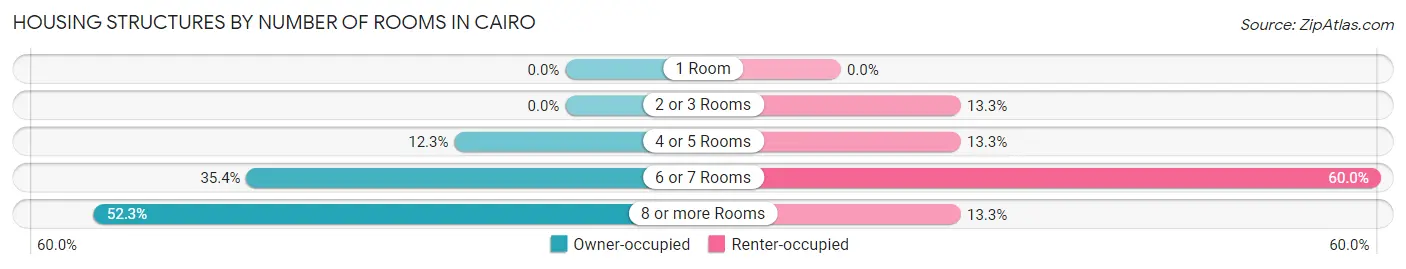
| Number of Rooms | Owner-occupied | Renter-occupied |
| 1 Room | 0 (0.0%) | 0 (0.0%) |
| 2 or 3 Rooms | 0 (0.0%) | 2 (13.3%) |
| 4 or 5 Rooms | 8 (12.3%) | 2 (13.3%) |
| 6 or 7 Rooms | 23 (35.4%) | 9 (60.0%) |
| 8 or more Rooms | 34 (52.3%) | 2 (13.3%) |
| Total | 65 (100.0%) | 15 (100.0%) |
Housing Structure by Heating Type in Cairo
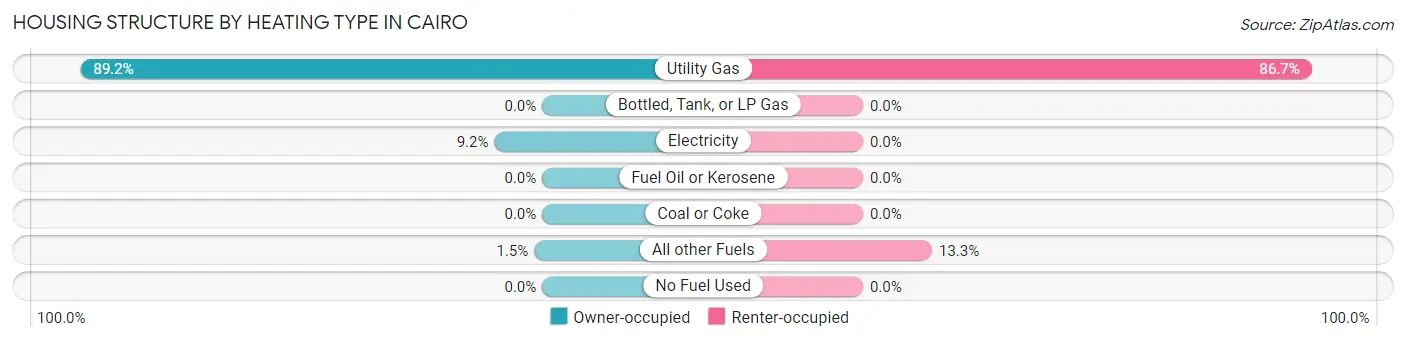
| Heating Type | Owner-occupied | Renter-occupied |
| Utility Gas | 58 (89.2%) | 13 (86.7%) |
| Bottled, Tank, or LP Gas | 0 (0.0%) | 0 (0.0%) |
| Electricity | 6 (9.2%) | 0 (0.0%) |
| Fuel Oil or Kerosene | 0 (0.0%) | 0 (0.0%) |
| Coal or Coke | 0 (0.0%) | 0 (0.0%) |
| All other Fuels | 1 (1.5%) | 2 (13.3%) |
| No Fuel Used | 0 (0.0%) | 0 (0.0%) |
| Total | 65 (100.0%) | 15 (100.0%) |
Household Vehicle Usage in Cairo
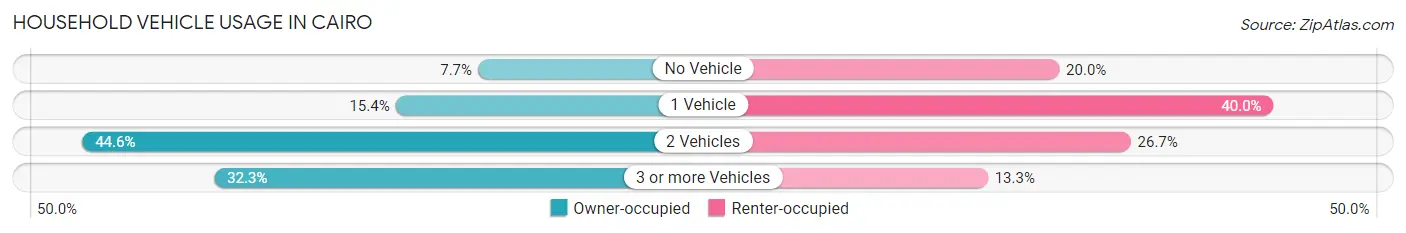
| Vehicles per Household | Owner-occupied | Renter-occupied |
| No Vehicle | 5 (7.7%) | 3 (20.0%) |
| 1 Vehicle | 10 (15.4%) | 6 (40.0%) |
| 2 Vehicles | 29 (44.6%) | 4 (26.7%) |
| 3 or more Vehicles | 21 (32.3%) | 2 (13.3%) |
| Total | 65 (100.0%) | 15 (100.0%) |
Real Estate & Mortgages in Cairo
Real Estate and Mortgage Overview in Cairo
| Characteristic | Without Mortgage | With Mortgage |
| Housing Units | 27 | 38 |
| Median Property Value | $61,700 | $63,200 |
| Median Household Income | $35,625 | $0 |
| Monthly Housing Costs | $248 | $0 |
| Real Estate Taxes | $617 | $0 |
Property Value by Mortgage Status in Cairo
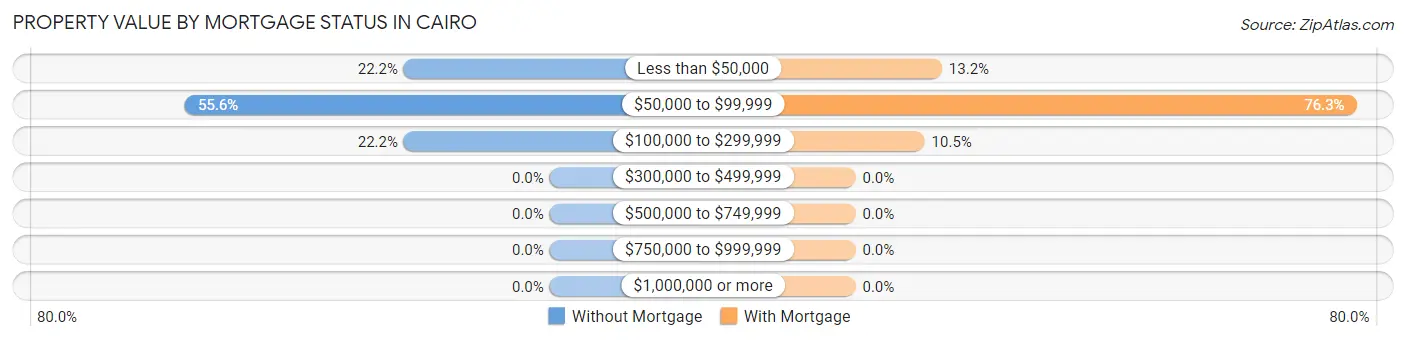
| Property Value | Without Mortgage | With Mortgage |
| Less than $50,000 | 6 (22.2%) | 5 (13.2%) |
| $50,000 to $99,999 | 15 (55.6%) | 29 (76.3%) |
| $100,000 to $299,999 | 6 (22.2%) | 4 (10.5%) |
| $300,000 to $499,999 | 0 (0.0%) | 0 (0.0%) |
| $500,000 to $749,999 | 0 (0.0%) | 0 (0.0%) |
| $750,000 to $999,999 | 0 (0.0%) | 0 (0.0%) |
| $1,000,000 or more | 0 (0.0%) | 0 (0.0%) |
| Total | 27 (100.0%) | 38 (100.0%) |
Household Income by Mortgage Status in Cairo
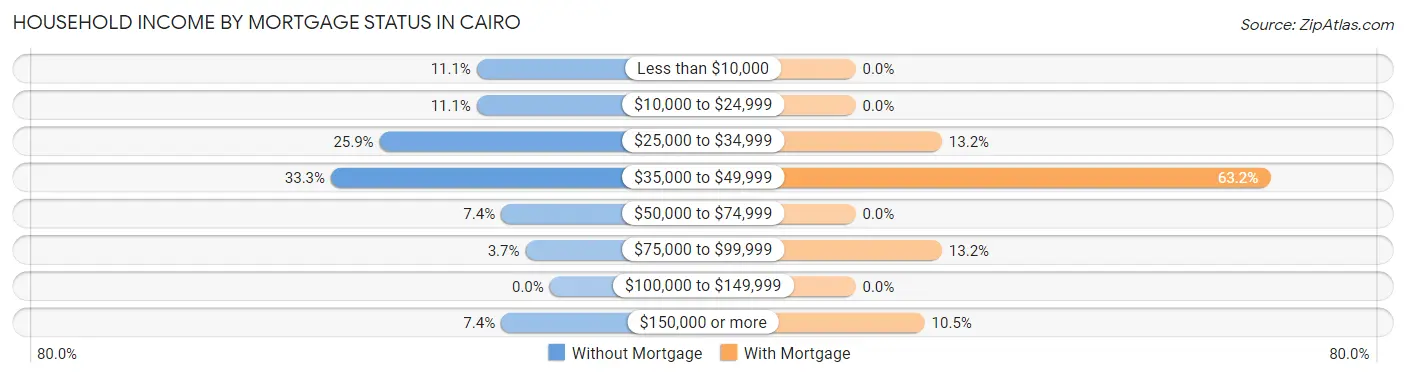
| Household Income | Without Mortgage | With Mortgage |
| Less than $10,000 | 3 (11.1%) | 0 (0.0%) |
| $10,000 to $24,999 | 3 (11.1%) | 0 (0.0%) |
| $25,000 to $34,999 | 7 (25.9%) | 5 (13.2%) |
| $35,000 to $49,999 | 9 (33.3%) | 24 (63.2%) |
| $50,000 to $74,999 | 2 (7.4%) | 0 (0.0%) |
| $75,000 to $99,999 | 1 (3.7%) | 5 (13.2%) |
| $100,000 to $149,999 | 0 (0.0%) | 0 (0.0%) |
| $150,000 or more | 2 (7.4%) | 4 (10.5%) |
| Total | 27 (100.0%) | 38 (100.0%) |
Property Value to Household Income Ratio in Cairo
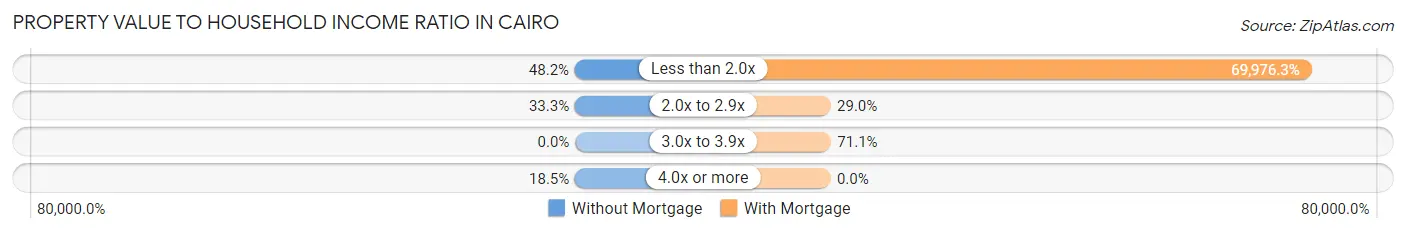
| Value-to-Income Ratio | Without Mortgage | With Mortgage |
| Less than 2.0x | 13 (48.1%) | 26,591 (69,976.3%) |
| 2.0x to 2.9x | 9 (33.3%) | 11 (28.9%) |
| 3.0x to 3.9x | 0 (0.0%) | 27 (71.1%) |
| 4.0x or more | 5 (18.5%) | 0 (0.0%) |
| Total | 27 (100.0%) | 38 (100.0%) |
Real Estate Taxes by Mortgage Status in Cairo
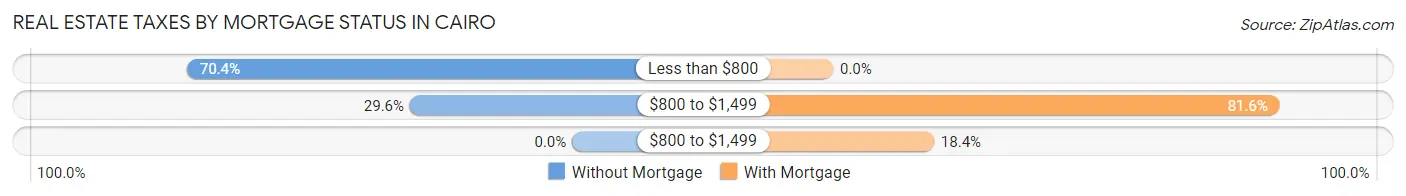
| Property Taxes | Without Mortgage | With Mortgage |
| Less than $800 | 19 (70.4%) | 0 (0.0%) |
| $800 to $1,499 | 8 (29.6%) | 31 (81.6%) |
| $800 to $1,499 | 0 (0.0%) | 7 (18.4%) |
| Total | 27 (100.0%) | 38 (100.0%) |
Health & Disability in Cairo
Health Insurance Coverage by Age in Cairo
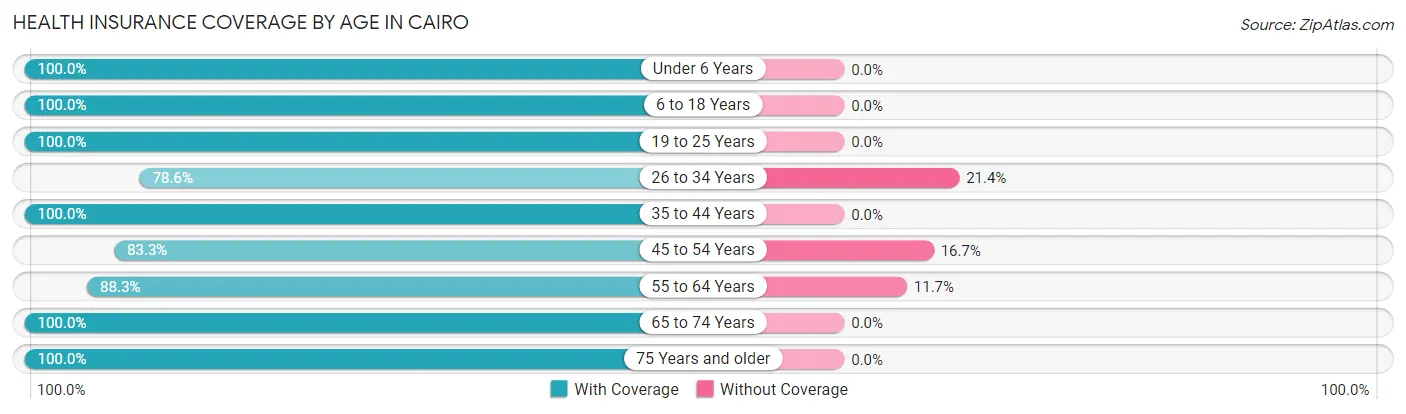
| Age Bracket | With Coverage | Without Coverage |
| Under 6 Years | 4 (100.0%) | 0 (0.0%) |
| 6 to 18 Years | 14 (100.0%) | 0 (0.0%) |
| 19 to 25 Years | 9 (100.0%) | 0 (0.0%) |
| 26 to 34 Years | 11 (78.6%) | 3 (21.4%) |
| 35 to 44 Years | 9 (100.0%) | 0 (0.0%) |
| 45 to 54 Years | 10 (83.3%) | 2 (16.7%) |
| 55 to 64 Years | 53 (88.3%) | 7 (11.7%) |
| 65 to 74 Years | 19 (100.0%) | 0 (0.0%) |
| 75 Years and older | 23 (100.0%) | 0 (0.0%) |
| Total | 152 (92.7%) | 12 (7.3%) |
Health Insurance Coverage by Citizenship Status in Cairo
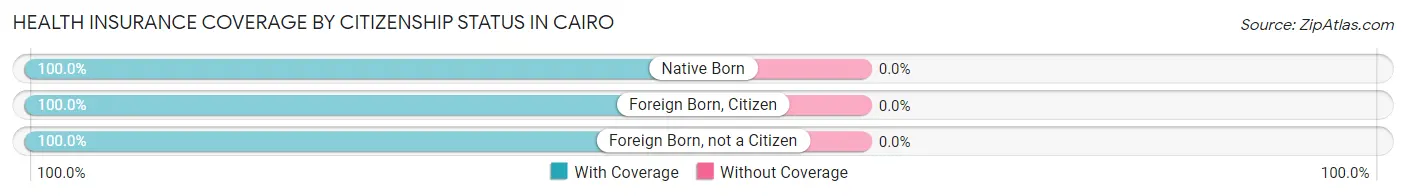
| Citizenship Status | With Coverage | Without Coverage |
| Native Born | 4 (100.0%) | 0 (0.0%) |
| Foreign Born, Citizen | 14 (100.0%) | 0 (0.0%) |
| Foreign Born, not a Citizen | 9 (100.0%) | 0 (0.0%) |
Health Insurance Coverage by Household Income in Cairo
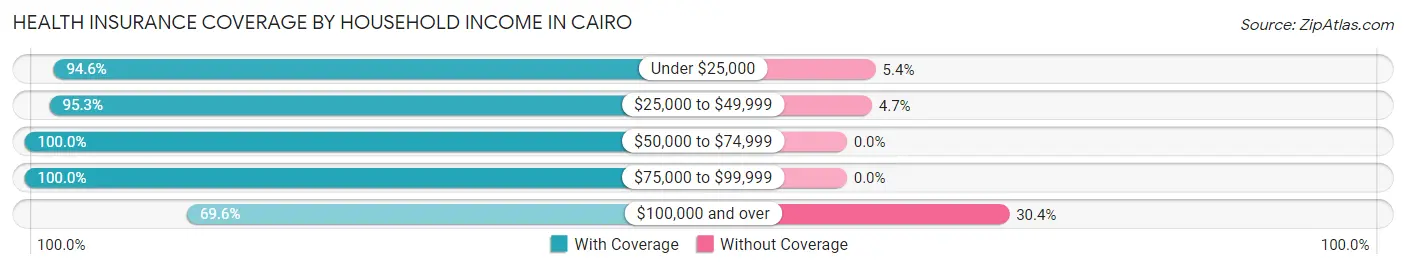
| Household Income | With Coverage | Without Coverage |
| Under $25,000 | 35 (94.6%) | 2 (5.4%) |
| $25,000 to $49,999 | 61 (95.3%) | 3 (4.7%) |
| $50,000 to $74,999 | 34 (100.0%) | 0 (0.0%) |
| $75,000 to $99,999 | 6 (100.0%) | 0 (0.0%) |
| $100,000 and over | 16 (69.6%) | 7 (30.4%) |
Public vs Private Health Insurance Coverage by Age in Cairo
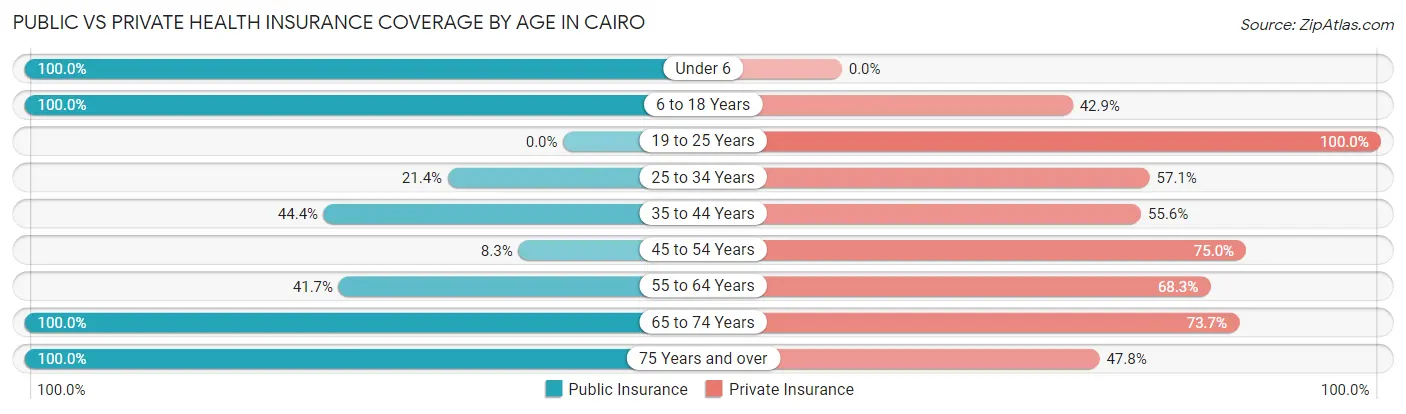
| Age Bracket | Public Insurance | Private Insurance |
| Under 6 | 4 (100.0%) | 0 (0.0%) |
| 6 to 18 Years | 14 (100.0%) | 6 (42.9%) |
| 19 to 25 Years | 0 (0.0%) | 9 (100.0%) |
| 25 to 34 Years | 3 (21.4%) | 8 (57.1%) |
| 35 to 44 Years | 4 (44.4%) | 5 (55.6%) |
| 45 to 54 Years | 1 (8.3%) | 9 (75.0%) |
| 55 to 64 Years | 25 (41.7%) | 41 (68.3%) |
| 65 to 74 Years | 19 (100.0%) | 14 (73.7%) |
| 75 Years and over | 23 (100.0%) | 11 (47.8%) |
| Total | 93 (56.7%) | 103 (62.8%) |
Disability Status by Sex by Age in Cairo
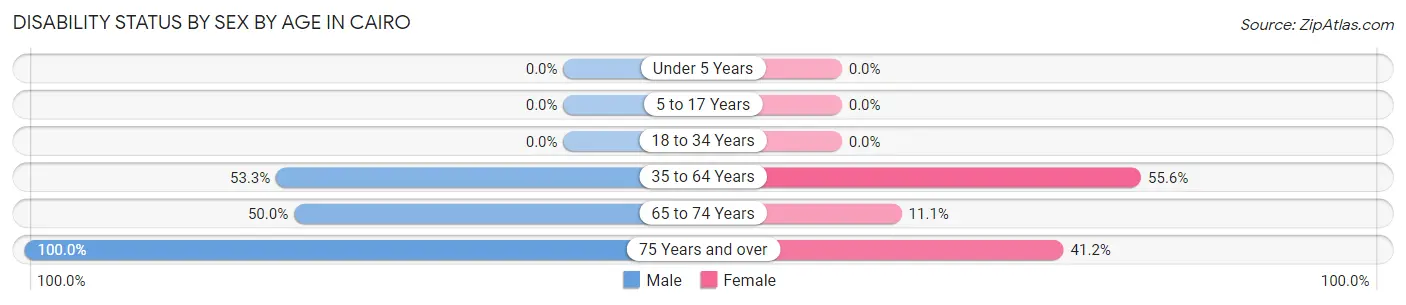
| Age Bracket | Male | Female |
| Under 5 Years | 0 (0.0%) | 0 (0.0%) |
| 5 to 17 Years | 0 (0.0%) | 0 (0.0%) |
| 18 to 34 Years | 0 (0.0%) | 0 (0.0%) |
| 35 to 64 Years | 24 (53.3%) | 20 (55.6%) |
| 65 to 74 Years | 5 (50.0%) | 1 (11.1%) |
| 75 Years and over | 6 (100.0%) | 7 (41.2%) |
Disability Class by Sex by Age in Cairo
Disability Class: Hearing Difficulty
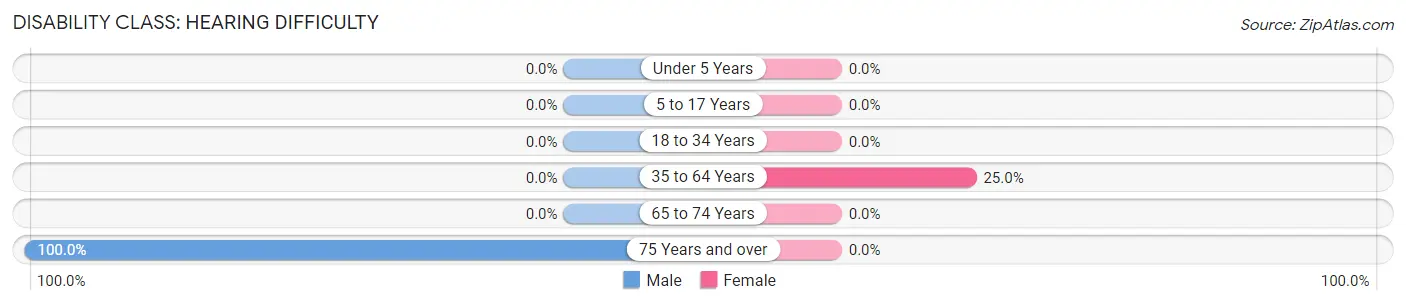
| Age Bracket | Male | Female |
| Under 5 Years | 0 (0.0%) | 0 (0.0%) |
| 5 to 17 Years | 0 (0.0%) | 0 (0.0%) |
| 18 to 34 Years | 0 (0.0%) | 0 (0.0%) |
| 35 to 64 Years | 0 (0.0%) | 9 (25.0%) |
| 65 to 74 Years | 0 (0.0%) | 0 (0.0%) |
| 75 Years and over | 6 (100.0%) | 0 (0.0%) |
Disability Class: Vision Difficulty
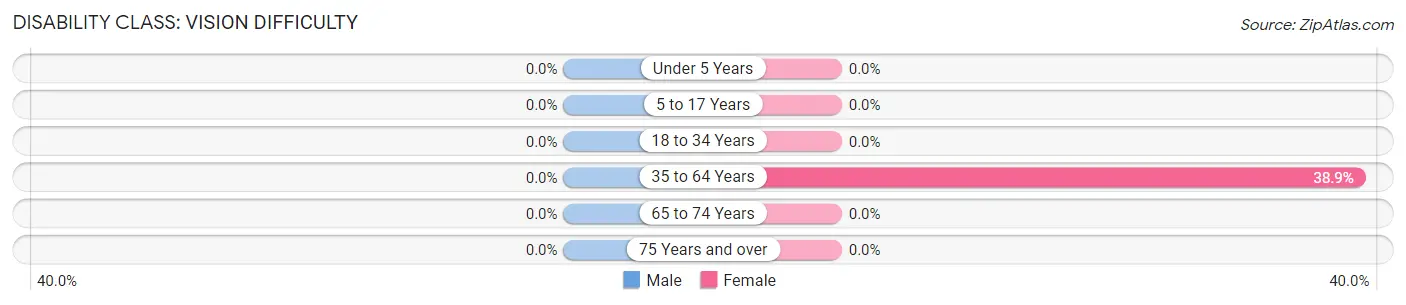
| Age Bracket | Male | Female |
| Under 5 Years | 0 (0.0%) | 0 (0.0%) |
| 5 to 17 Years | 0 (0.0%) | 0 (0.0%) |
| 18 to 34 Years | 0 (0.0%) | 0 (0.0%) |
| 35 to 64 Years | 0 (0.0%) | 14 (38.9%) |
| 65 to 74 Years | 0 (0.0%) | 0 (0.0%) |
| 75 Years and over | 0 (0.0%) | 0 (0.0%) |
Disability Class: Cognitive Difficulty
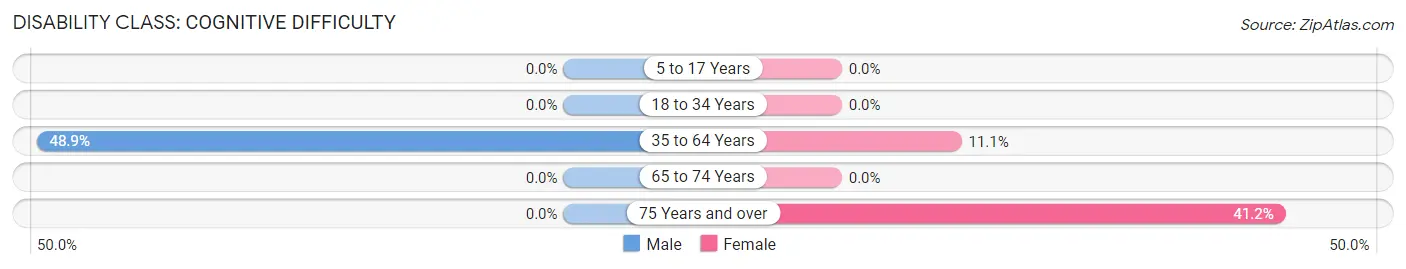
| Age Bracket | Male | Female |
| 5 to 17 Years | 0 (0.0%) | 0 (0.0%) |
| 18 to 34 Years | 0 (0.0%) | 0 (0.0%) |
| 35 to 64 Years | 22 (48.9%) | 4 (11.1%) |
| 65 to 74 Years | 0 (0.0%) | 0 (0.0%) |
| 75 Years and over | 0 (0.0%) | 7 (41.2%) |
Disability Class: Ambulatory Difficulty
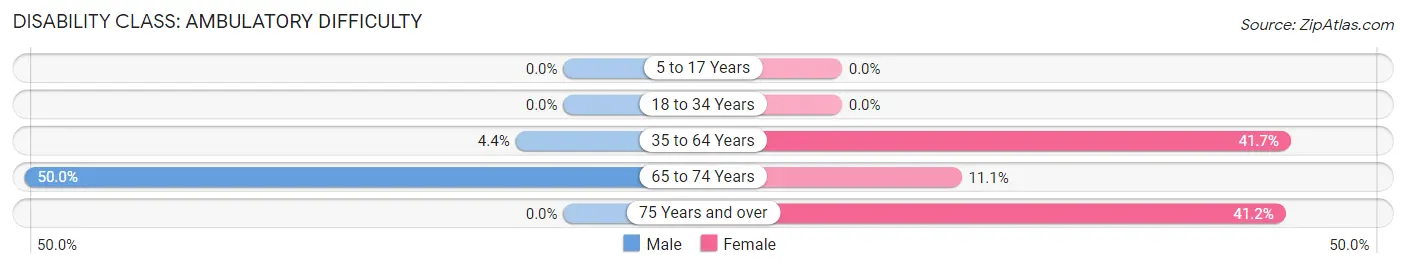
| Age Bracket | Male | Female |
| 5 to 17 Years | 0 (0.0%) | 0 (0.0%) |
| 18 to 34 Years | 0 (0.0%) | 0 (0.0%) |
| 35 to 64 Years | 2 (4.4%) | 15 (41.7%) |
| 65 to 74 Years | 5 (50.0%) | 1 (11.1%) |
| 75 Years and over | 0 (0.0%) | 7 (41.2%) |
Disability Class: Self-Care Difficulty
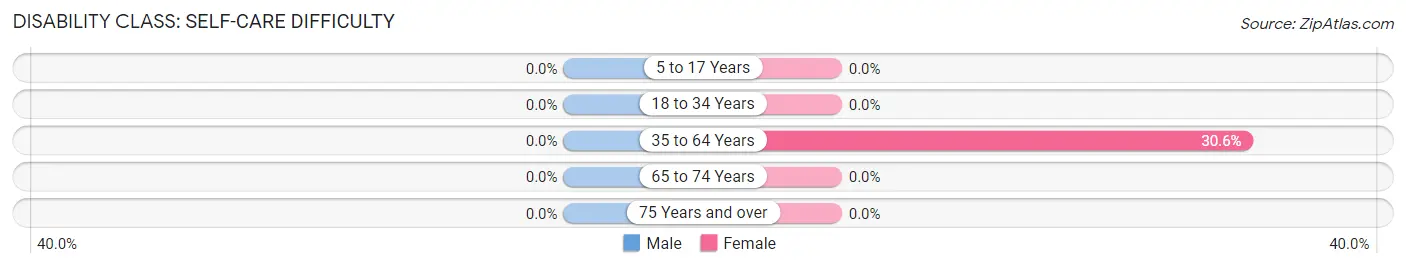
| Age Bracket | Male | Female |
| 5 to 17 Years | 0 (0.0%) | 0 (0.0%) |
| 18 to 34 Years | 0 (0.0%) | 0 (0.0%) |
| 35 to 64 Years | 0 (0.0%) | 11 (30.6%) |
| 65 to 74 Years | 0 (0.0%) | 0 (0.0%) |
| 75 Years and over | 0 (0.0%) | 0 (0.0%) |
Technology Access in Cairo
Computing Device Access in Cairo
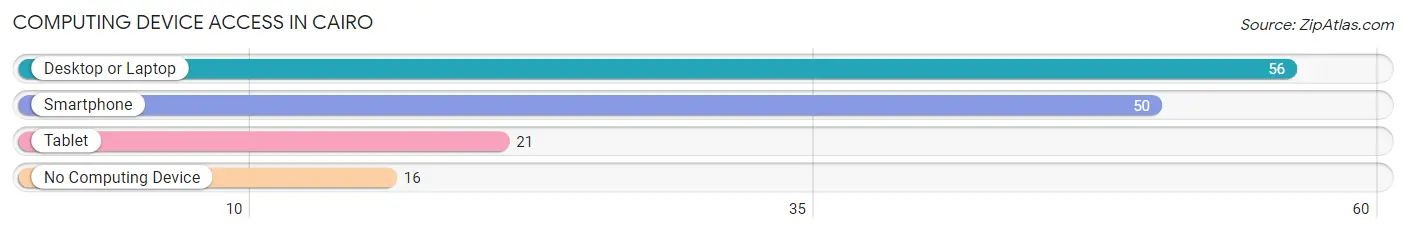
| Device Type | # Households | % Households |
| Desktop or Laptop | 56 | 70.0% |
| Smartphone | 50 | 62.5% |
| Tablet | 21 | 26.3% |
| No Computing Device | 16 | 20.0% |
| Total | 80 | 100.0% |
Internet Access in Cairo
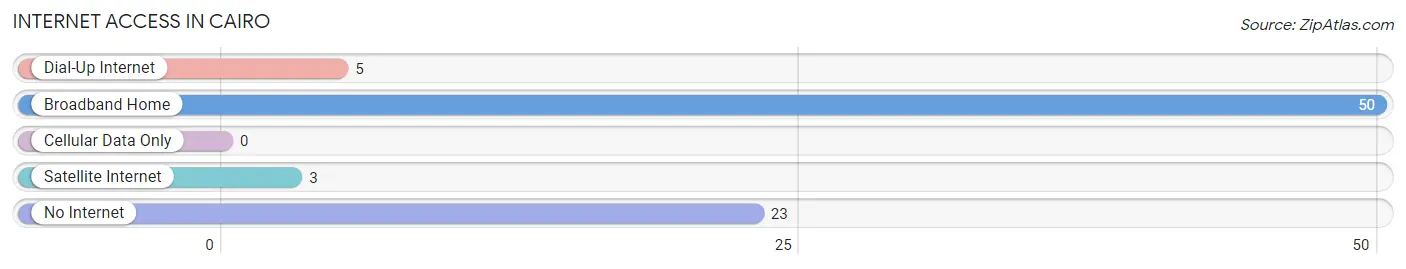
| Internet Type | # Households | % Households |
| Dial-Up Internet | 5 | 6.2% |
| Broadband Home | 50 | 62.5% |
| Cellular Data Only | 0 | 0.0% |
| Satellite Internet | 3 | 3.7% |
| No Internet | 23 | 28.7% |
| Total | 80 | 100.0% |
Cairo Summary
Cairo, West Virginia is a small town located in the northern part of the state, in Wood County. It is situated along the Ohio River, and is part of the Parkersburg-Marietta-Vienna metropolitan area. The town has a population of just over 1,000 people, and is known for its small-town charm and friendly atmosphere.
History
Cairo was founded in 1817 by a group of settlers from Pennsylvania. The town was named after Cairo, Egypt, and was originally intended to be a trading post. The town quickly grew, and by the mid-1800s, it had become a bustling river port. The town was also home to a number of industries, including a sawmill, a gristmill, and a tannery.
In the late 1800s, Cairo was a popular destination for tourists, who came to enjoy the town’s natural beauty and its many attractions. The town was also home to a number of hotels, restaurants, and other businesses.
In the early 1900s, Cairo experienced a period of decline. The town’s industries began to close, and the population began to decline. However, in the late 1900s, the town began to experience a resurgence. The town’s economy began to diversify, and new businesses began to open.
Geography
Cairo is located in the northern part of West Virginia, in Wood County. The town is situated along the Ohio River, and is part of the Parkersburg-Marietta-Vienna metropolitan area. The town is located in a rural area, and is surrounded by rolling hills and forests.
The climate in Cairo is humid continental, with hot summers and cold winters. The average annual temperature is around 50 degrees Fahrenheit. The town receives an average of 40 inches of precipitation per year.
Economy
Cairo’s economy is largely based on tourism and agriculture. The town is home to a number of tourist attractions, including the historic Cairo Hotel and the Cairo Museum. The town is also home to a number of farms, which produce a variety of crops, including corn, soybeans, and wheat.
The town is also home to a number of small businesses, including restaurants, shops, and other services. The town is also home to a number of manufacturing companies, which produce a variety of products, including furniture, clothing, and electronics.
Demographics
As of the 2010 census, the population of Cairo was 1,039. The town has a population density of 545 people per square mile. The median age in Cairo is 44.7 years, and the median household income is $37,917.
The town is predominantly white, with 92.3% of the population identifying as white. The town is also home to a small African American population, with 4.2% of the population identifying as African American. The town is also home to a small Hispanic population, with 1.3% of the population identifying as Hispanic or Latino.
Conclusion
Cairo, West Virginia is a small town located in the northern part of the state, in Wood County. It is situated along the Ohio River, and is part of the Parkersburg-Marietta-Vienna metropolitan area. The town has a population of just over 1,000 people, and is known for its small-town charm and friendly atmosphere. The town’s economy is largely based on tourism and agriculture, and the town is home to a number of tourist attractions, farms, and small businesses. The town is predominantly white, with 92.3% of the population identifying as white.
Common Questions
What is Per Capita Income in Cairo?
Per Capita income in Cairo is $23,072.
What is the Median Family Income in Cairo?
Median Family Income in Cairo is $46,875.
What is the Median Household income in Cairo?
Median Household Income in Cairo is $27,300.
What is Income or Wage Gap in Cairo?
Income or Wage Gap in Cairo is 27.4%.
Women in Cairo earn 72.6 cents for every dollar earned by a man.
What is Inequality or Gini Index in Cairo?
Inequality or Gini Index in Cairo is 0.41.
What is the Total Population of Cairo?
Total Population of Cairo is 164.
What is the Total Male Population of Cairo?
Total Male Population of Cairo is 88.
What is the Total Female Population of Cairo?
Total Female Population of Cairo is 76.
What is the Ratio of Males per 100 Females in Cairo?
There are 115.79 Males per 100 Females in Cairo.
What is the Ratio of Females per 100 Males in Cairo?
There are 86.36 Females per 100 Males in Cairo.
What is the Median Population Age in Cairo?
Median Population Age in Cairo is 59.2 Years.
What is the Average Family Size in Cairo
Average Family Size in Cairo is 3.0 People.
What is the Average Household Size in Cairo
Average Household Size in Cairo is 2.0 People.
How Large is the Labor Force in Cairo?
There are 50 People in the Labor Forcein in Cairo.
What is the Percentage of People in the Labor Force in Cairo?
32.5% of People are in the Labor Force in Cairo.