Zip Codes with the Highest Percentage of Population Employed in Architecture & Engineering in Morgantown, WV
RELATED REPORTS & OPTIONS
Architecture & Engineering
Morgantown
Compare Zip Codes
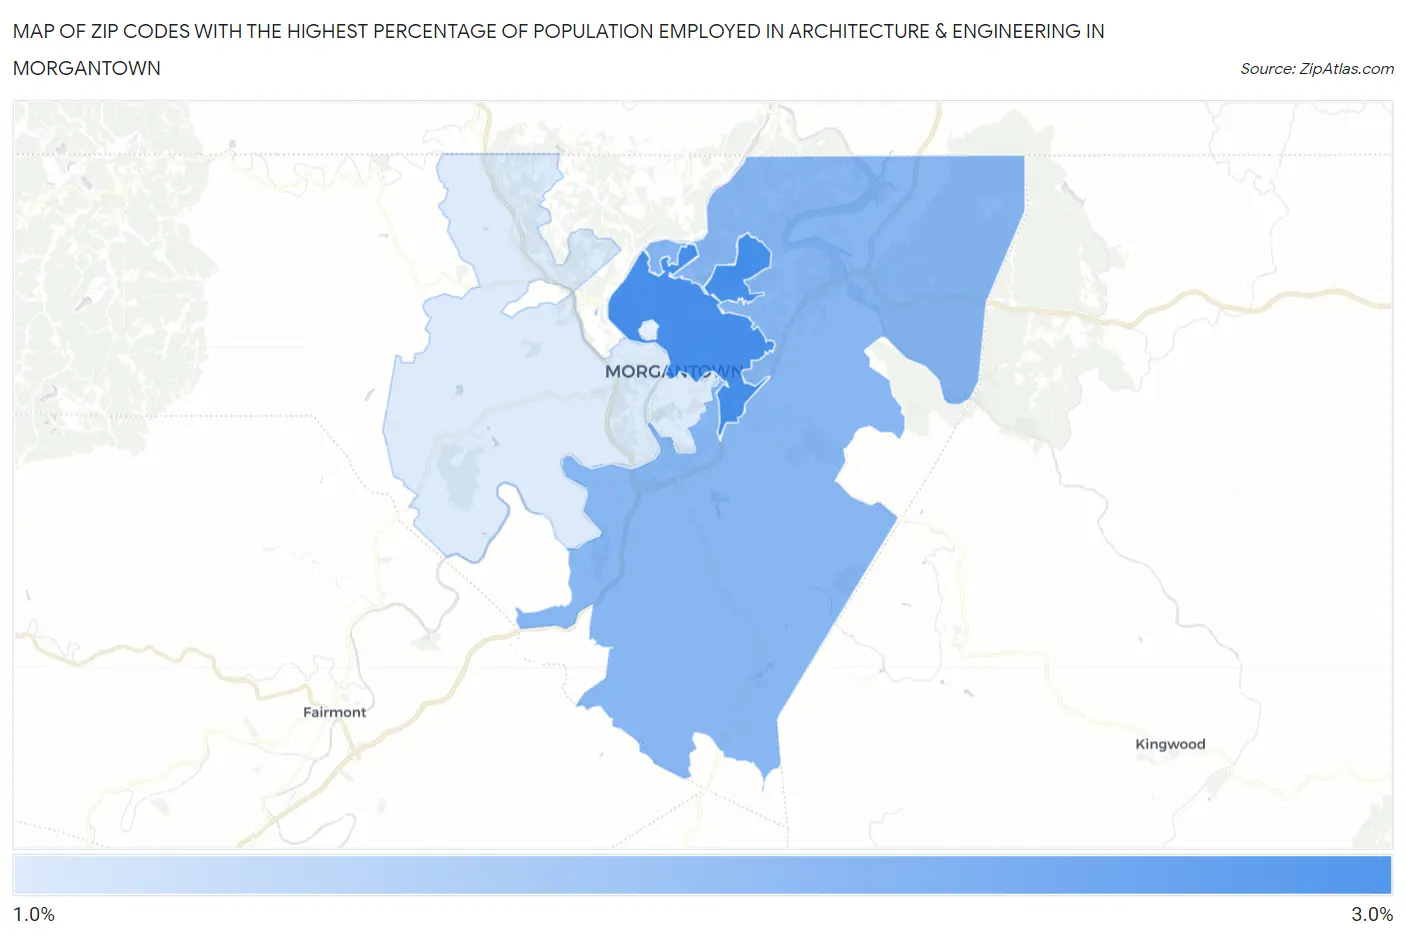
Map of Zip Codes with the Highest Percentage of Population Employed in Architecture & Engineering in Morgantown
1.1%
2.7%
Zip Codes with the Highest Percentage of Population Employed in Architecture & Engineering in Morgantown, WV
| Zip Code | % Employed | vs State | vs National | |
| 1. | 26505 | 2.7% | 1.6%(+1.17)#90 | 2.1%(+0.585)#6,022 |
| 2. | 26508 | 2.0% | 1.6%(+0.443)#122 | 2.1%(-0.146)#9,580 |
| 3. | 26501 | 1.1% | 1.6%(-0.493)#170 | 2.1%(-1.08)#16,116 |
1
Common Questions
What are the Top 3 Zip Codes with the Highest Percentage of Population Employed in Architecture & Engineering in Morgantown, WV?
Top 3 Zip Codes with the Highest Percentage of Population Employed in Architecture & Engineering in Morgantown, WV are:
What zip code has the Highest Percentage of Population Employed in Architecture & Engineering in Morgantown, WV?
26505 has the Highest Percentage of Population Employed in Architecture & Engineering in Morgantown, WV with 2.7%.
What is the Percentage of Population Employed in Architecture & Engineering in Morgantown, WV?
Percentage of Population Employed in Architecture & Engineering in Morgantown is 1.9%.
What is the Percentage of Population Employed in Architecture & Engineering in West Virginia?
Percentage of Population Employed in Architecture & Engineering in West Virginia is 1.6%.
What is the Percentage of Population Employed in Architecture & Engineering in the United States?
Percentage of Population Employed in Architecture & Engineering in the United States is 2.1%.