Pennsboro, WV Map & Demographics
Pennsboro Map
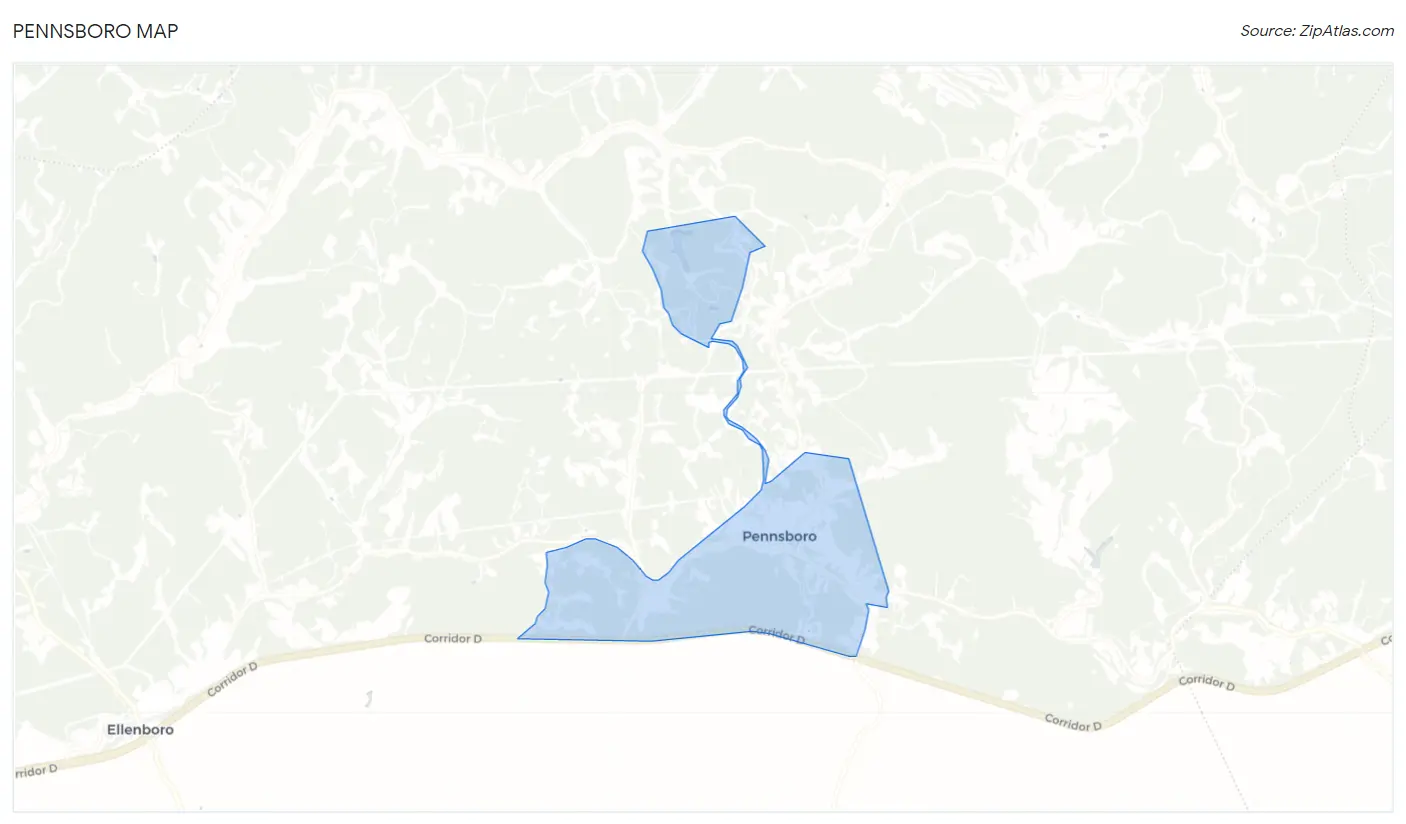
Pennsboro Overview
$23,152
PER CAPITA INCOME
$49,746
AVG FAMILY INCOME
$48,452
AVG HOUSEHOLD INCOME
45.6%
WAGE / INCOME GAP [ % ]
54.4¢/ $1
WAGE / INCOME GAP [ $ ]
0.42
INEQUALITY / GINI INDEX
1,359
TOTAL POPULATION
653
MALE POPULATION
706
FEMALE POPULATION
92.49
MALES / 100 FEMALES
108.12
FEMALES / 100 MALES
35.5
MEDIAN AGE
3.1
AVG FAMILY SIZE
2.9
AVG HOUSEHOLD SIZE
526
LABOR FORCE [ PEOPLE ]
49.9%
PERCENT IN LABOR FORCE
6.5%
UNEMPLOYMENT RATE
Pennsboro Zip Codes
Pennsboro Area Codes
Income in Pennsboro
Income Overview in Pennsboro
Per Capita Income in Pennsboro is $23,152, while median incomes of families and households are $49,746 and $48,452 respectively.
| Characteristic | Number | Measure |
| Per Capita Income | 1,359 | $23,152 |
| Median Family Income | 336 | $49,746 |
| Mean Family Income | 336 | $72,787 |
| Median Household Income | 466 | $48,452 |
| Mean Household Income | 466 | $62,841 |
| Income Deficit | 336 | $0 |
| Wage / Income Gap (%) | 1,359 | 45.58% |
| Wage / Income Gap ($) | 1,359 | 54.42¢ per $1 |
| Gini / Inequality Index | 1,359 | 0.42 |
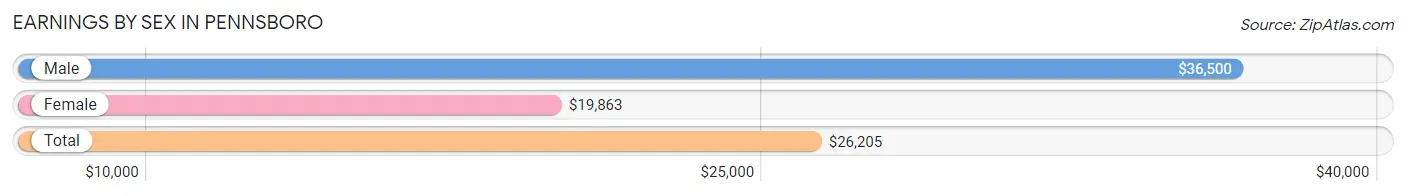
Earnings by Sex in Pennsboro
Average Earnings in Pennsboro are $26,205, $36,500 for men and $19,863 for women, a difference of 45.6%.
| Sex | Number | Average Earnings |
| Male | 330 (61.5%) | $36,500 |
| Female | 207 (38.6%) | $19,863 |
| Total | 537 (100.0%) | $26,205 |
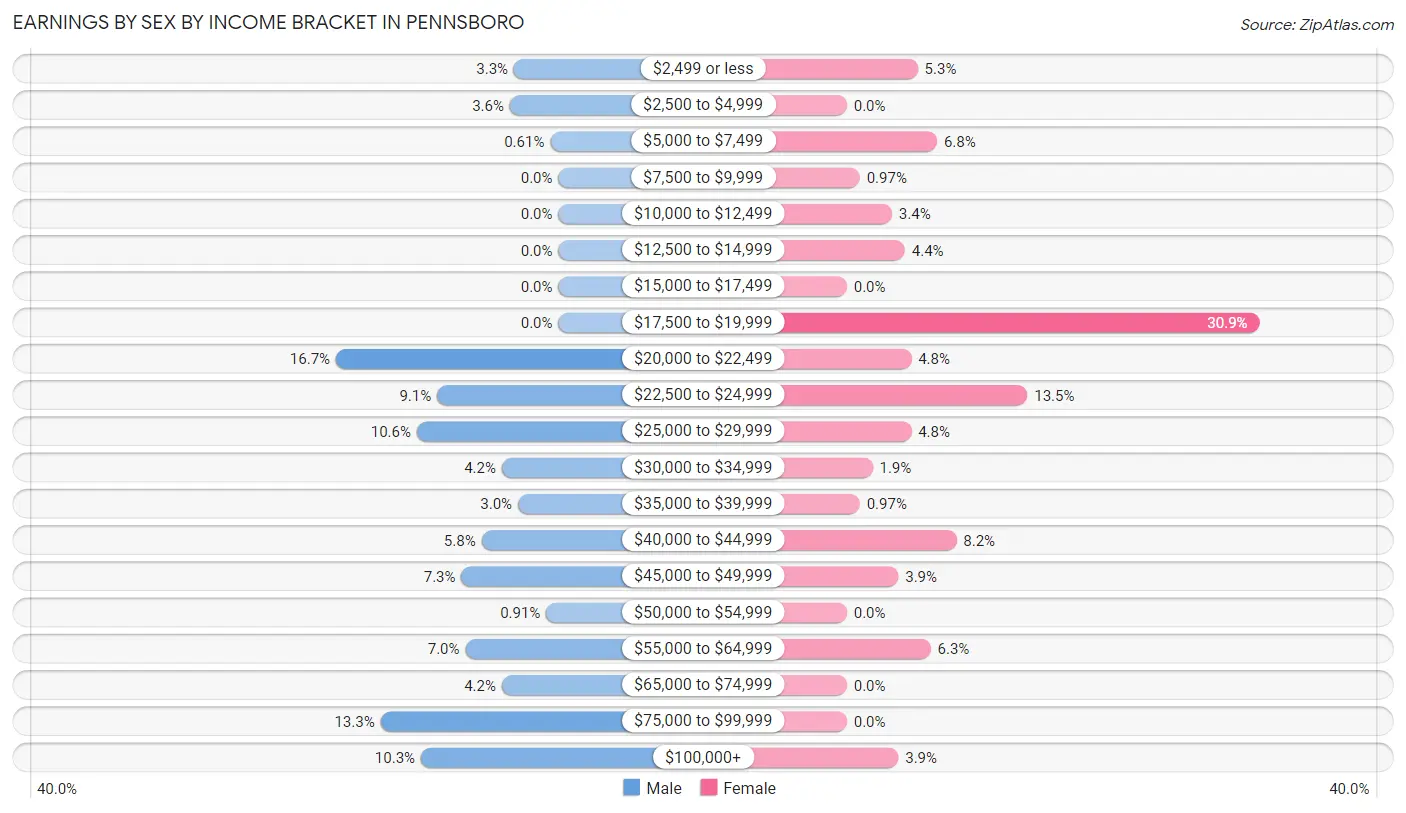
Earnings by Sex by Income Bracket in Pennsboro
The most common earnings brackets in Pennsboro are $20,000 to $22,499 for men (55 | 16.7%) and $17,500 to $19,999 for women (64 | 30.9%).
| Income | Male | Female |
| $2,499 or less | 11 (3.3%) | 11 (5.3%) |
| $2,500 to $4,999 | 12 (3.6%) | 0 (0.0%) |
| $5,000 to $7,499 | 2 (0.6%) | 14 (6.8%) |
| $7,500 to $9,999 | 0 (0.0%) | 2 (1.0%) |
| $10,000 to $12,499 | 0 (0.0%) | 7 (3.4%) |
| $12,500 to $14,999 | 0 (0.0%) | 9 (4.3%) |
| $15,000 to $17,499 | 0 (0.0%) | 0 (0.0%) |
| $17,500 to $19,999 | 0 (0.0%) | 64 (30.9%) |
| $20,000 to $22,499 | 55 (16.7%) | 10 (4.8%) |
| $22,500 to $24,999 | 30 (9.1%) | 28 (13.5%) |
| $25,000 to $29,999 | 35 (10.6%) | 10 (4.8%) |
| $30,000 to $34,999 | 14 (4.2%) | 4 (1.9%) |
| $35,000 to $39,999 | 10 (3.0%) | 2 (1.0%) |
| $40,000 to $44,999 | 19 (5.8%) | 17 (8.2%) |
| $45,000 to $49,999 | 24 (7.3%) | 8 (3.9%) |
| $50,000 to $54,999 | 3 (0.9%) | 0 (0.0%) |
| $55,000 to $64,999 | 23 (7.0%) | 13 (6.3%) |
| $65,000 to $74,999 | 14 (4.2%) | 0 (0.0%) |
| $75,000 to $99,999 | 44 (13.3%) | 0 (0.0%) |
| $100,000+ | 34 (10.3%) | 8 (3.9%) |
| Total | 330 (100.0%) | 207 (100.0%) |
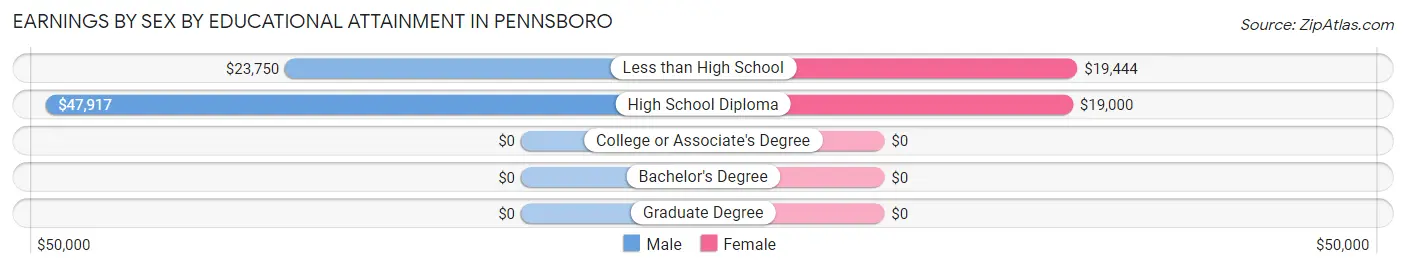
Earnings by Sex by Educational Attainment in Pennsboro
Average earnings in Pennsboro are $44,861 for men and $20,875 for women, a difference of 53.5%. Men with an educational attainment of high school diploma enjoy the highest average annual earnings of $47,917, while those with less than high school education earn the least with $23,750. Women with an educational attainment of less than high school earn the most with the average annual earnings of $19,444, while those with high school diploma education have the smallest earnings of $19,000.
| Educational Attainment | Male Income | Female Income |
| Less than High School | $23,750 | $19,444 |
| High School Diploma | $47,917 | $19,000 |
| College or Associate's Degree | - | - |
| Bachelor's Degree | - | - |
| Graduate Degree | - | - |
| Total | $44,861 | $20,875 |
Family Income in Pennsboro
Family Income Brackets in Pennsboro
According to the Pennsboro family income data, there are 91 families falling into the $35,000 to $49,999 income range, which is the most common income bracket and makes up 27.1% of all families. Conversely, the $10,000 to $14,999 income bracket is the least frequent group with only 9 families (2.7%) belonging to this category.
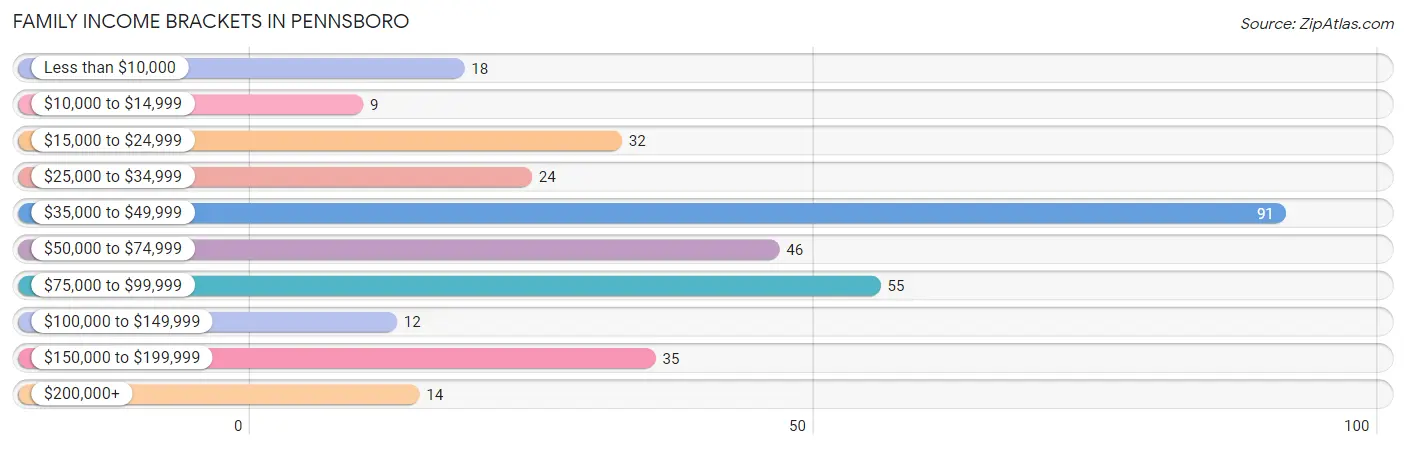
| Income Bracket | # Families | % Families |
| Less than $10,000 | 18 | 5.4% |
| $10,000 to $14,999 | 9 | 2.7% |
| $15,000 to $24,999 | 32 | 9.5% |
| $25,000 to $34,999 | 24 | 7.1% |
| $35,000 to $49,999 | 91 | 27.1% |
| $50,000 to $74,999 | 46 | 13.7% |
| $75,000 to $99,999 | 55 | 16.4% |
| $100,000 to $149,999 | 12 | 3.6% |
| $150,000 to $199,999 | 35 | 10.4% |
| $200,000+ | 14 | 4.2% |
Family Income by Famaliy Size in Pennsboro
2-person families (172 | 51.2%) account for the highest median family income in Pennsboro with $50,500 per family, while 2-person families (172 | 51.2%) have the highest median income of $25,250 per family member.
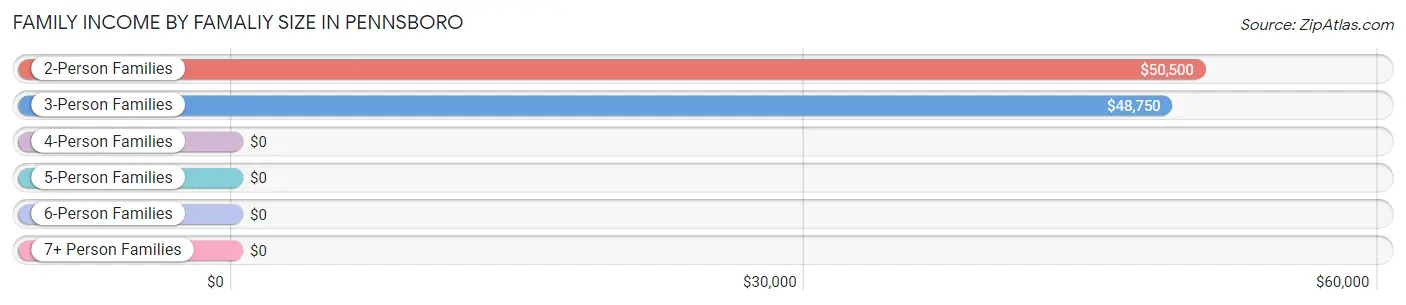
| Income Bracket | # Families | Median Income |
| 2-Person Families | 172 (51.2%) | $50,500 |
| 3-Person Families | 60 (17.9%) | $48,750 |
| 4-Person Families | 96 (28.6%) | $0 |
| 5-Person Families | 8 (2.4%) | $0 |
| 6-Person Families | 0 (0.0%) | $0 |
| 7+ Person Families | 0 (0.0%) | $0 |
| Total | 336 (100.0%) | $49,746 |
Family Income by Number of Earners in Pennsboro
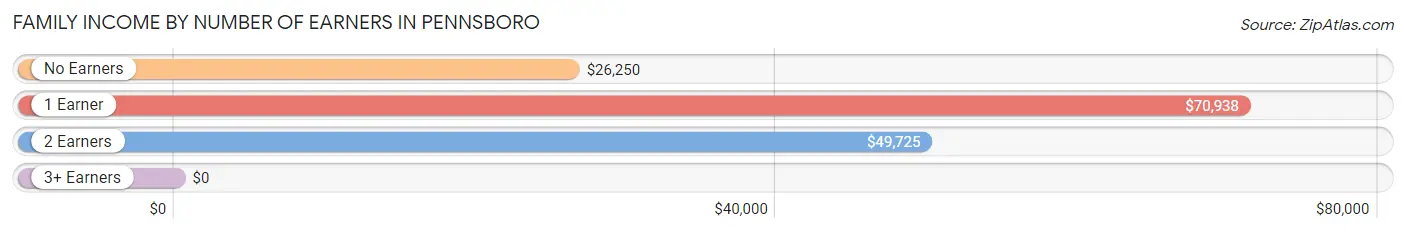
| Number of Earners | # Families | Median Income |
| No Earners | 70 (20.8%) | $26,250 |
| 1 Earner | 111 (33.0%) | $70,938 |
| 2 Earners | 145 (43.1%) | $49,725 |
| 3+ Earners | 10 (3.0%) | $0 |
| Total | 336 (100.0%) | $49,746 |
Household Income in Pennsboro
Household Income Brackets in Pennsboro
With 139 households falling in the category, the $35,000 to $49,999 income range is the most frequent in Pennsboro, accounting for 29.8% of all households. In contrast, only 12 households (2.6%) fall into the $100,000 to $149,999 income bracket, making it the least populous group.
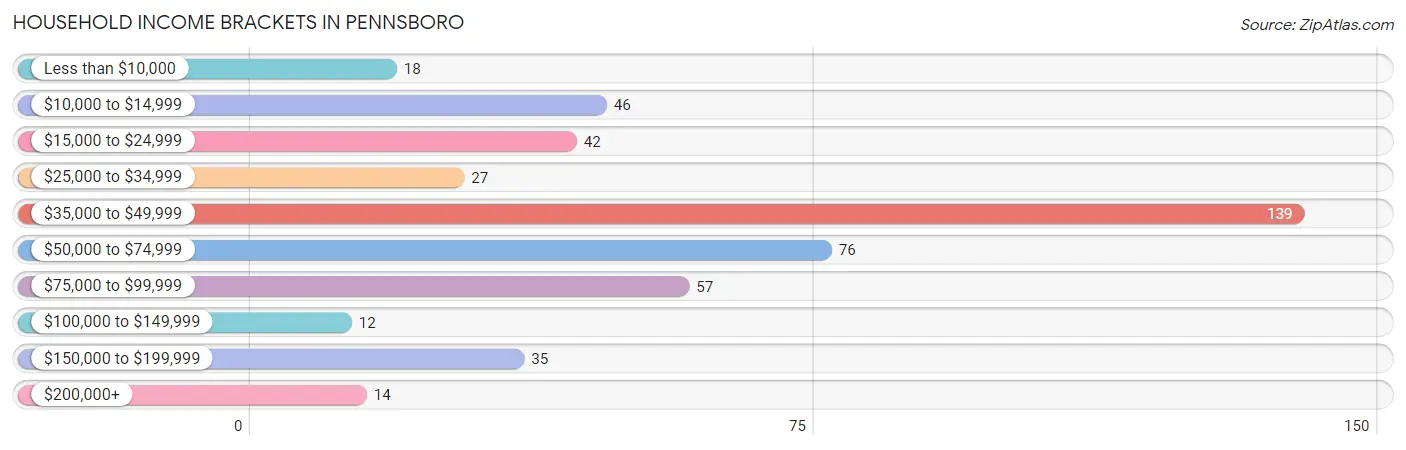
| Income Bracket | # Households | % Households |
| Less than $10,000 | 18 | 3.9% |
| $10,000 to $14,999 | 46 | 9.9% |
| $15,000 to $24,999 | 42 | 9.0% |
| $25,000 to $34,999 | 27 | 5.8% |
| $35,000 to $49,999 | 139 | 29.8% |
| $50,000 to $74,999 | 76 | 16.3% |
| $75,000 to $99,999 | 57 | 12.2% |
| $100,000 to $149,999 | 12 | 2.6% |
| $150,000 to $199,999 | 35 | 7.5% |
| $200,000+ | 14 | 3.0% |
Household Income by Householder Age in Pennsboro
The median household income in Pennsboro is $48,452, with the highest median household income of $54,000 found in the 45 to 64 years age bracket for the primary householder. A total of 154 households (33.1%) fall into this category. Meanwhile, the 15 to 24 years age bracket for the primary householder has the lowest median household income of $0, with 5 households (1.1%) in this group.
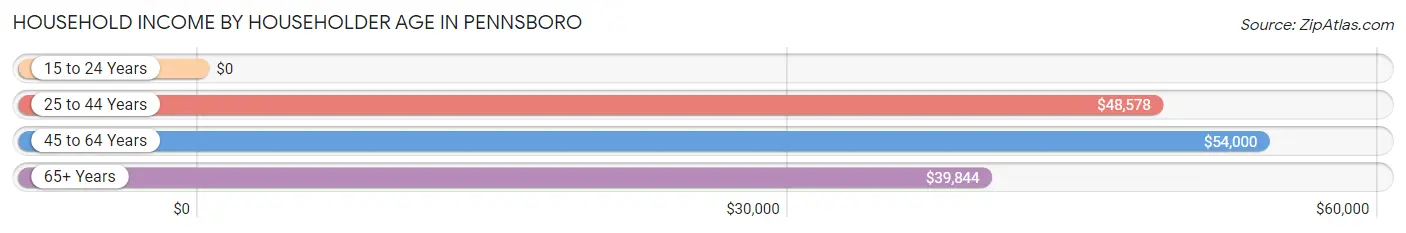
| Income Bracket | # Households | Median Income |
| 15 to 24 Years | 5 (1.1%) | $0 |
| 25 to 44 Years | 202 (43.3%) | $48,578 |
| 45 to 64 Years | 154 (33.1%) | $54,000 |
| 65+ Years | 105 (22.5%) | $39,844 |
| Total | 466 (100.0%) | $48,452 |
Poverty in Pennsboro
Income Below Poverty by Sex and Age in Pennsboro
With 12.8% poverty level for males and 19.5% for females among the residents of Pennsboro, 25 to 34 year old males and 5 year old females are the most vulnerable to poverty, with 34 males (27.9%) and 23 females (79.3%) in their respective age groups living below the poverty level.
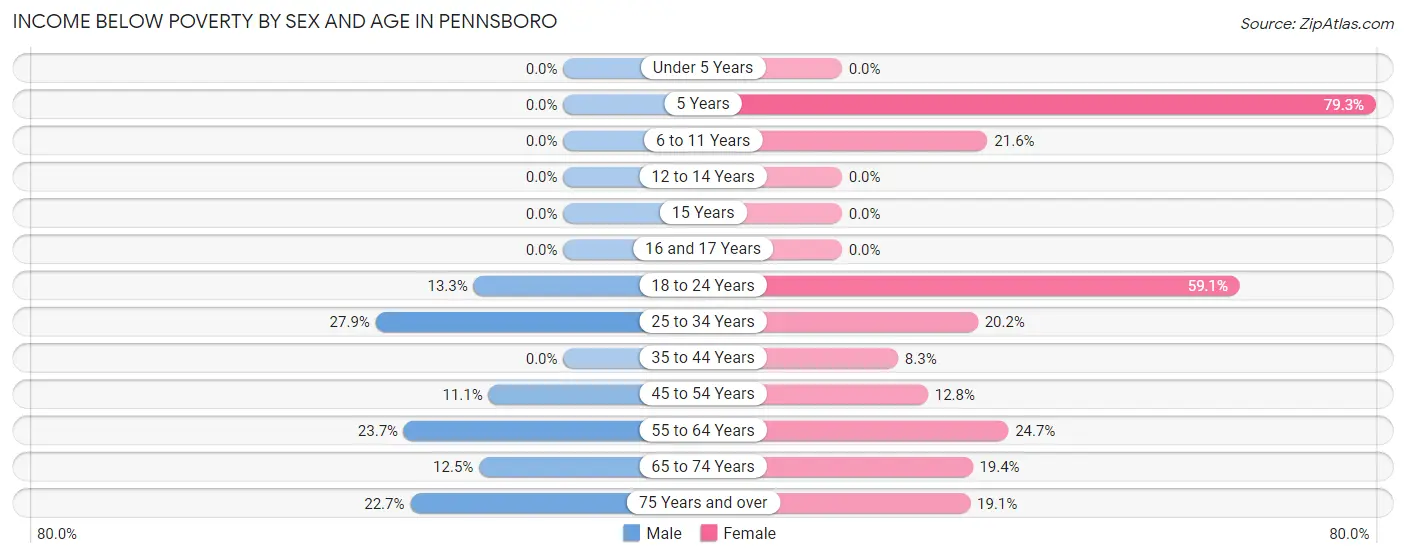
| Age Bracket | Male | Female |
| Under 5 Years | 0 (0.0%) | 0 (0.0%) |
| 5 Years | 0 (0.0%) | 23 (79.3%) |
| 6 to 11 Years | 0 (0.0%) | 8 (21.6%) |
| 12 to 14 Years | 0 (0.0%) | 0 (0.0%) |
| 15 Years | 0 (0.0%) | 0 (0.0%) |
| 16 and 17 Years | 0 (0.0%) | 0 (0.0%) |
| 18 to 24 Years | 6 (13.3%) | 13 (59.1%) |
| 25 to 34 Years | 34 (27.9%) | 22 (20.2%) |
| 35 to 44 Years | 0 (0.0%) | 7 (8.3%) |
| 45 to 54 Years | 6 (11.1%) | 6 (12.8%) |
| 55 to 64 Years | 18 (23.7%) | 21 (24.7%) |
| 65 to 74 Years | 7 (12.5%) | 13 (19.4%) |
| 75 Years and over | 5 (22.7%) | 20 (19.1%) |
| Total | 76 (12.8%) | 133 (19.5%) |
Income Above Poverty by Sex and Age in Pennsboro
According to the poverty statistics in Pennsboro, males aged under 5 years and females aged under 5 years are the age groups that are most secure financially, with 100.0% of males and 100.0% of females in these age groups living above the poverty line.
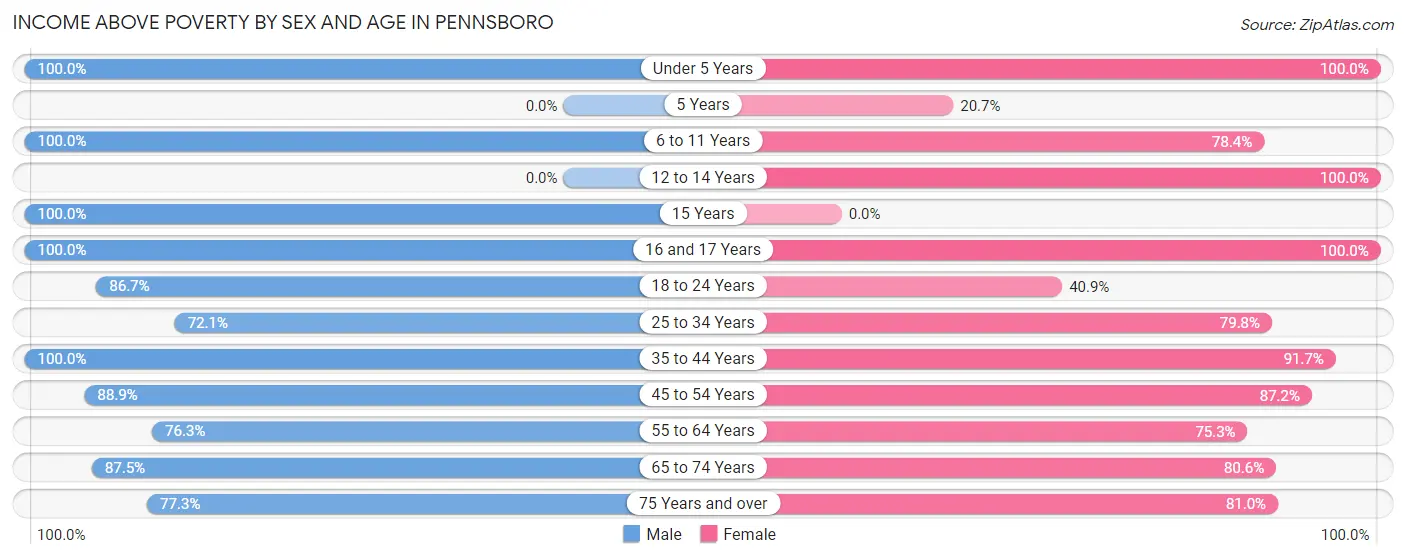
| Age Bracket | Male | Female |
| Under 5 Years | 33 (100.0%) | 42 (100.0%) |
| 5 Years | 0 (0.0%) | 6 (20.7%) |
| 6 to 11 Years | 27 (100.0%) | 29 (78.4%) |
| 12 to 14 Years | 0 (0.0%) | 7 (100.0%) |
| 15 Years | 46 (100.0%) | 0 (0.0%) |
| 16 and 17 Years | 6 (100.0%) | 47 (100.0%) |
| 18 to 24 Years | 39 (86.7%) | 9 (40.9%) |
| 25 to 34 Years | 88 (72.1%) | 87 (79.8%) |
| 35 to 44 Years | 108 (100.0%) | 77 (91.7%) |
| 45 to 54 Years | 48 (88.9%) | 41 (87.2%) |
| 55 to 64 Years | 58 (76.3%) | 64 (75.3%) |
| 65 to 74 Years | 49 (87.5%) | 54 (80.6%) |
| 75 Years and over | 17 (77.3%) | 85 (80.9%) |
| Total | 519 (87.2%) | 548 (80.5%) |
Income Below Poverty Among Married-Couple Families in Pennsboro
The poverty statistics for married-couple families in Pennsboro show that 2.9% or 7 of the total 246 families live below the poverty line. Families with no children have the highest poverty rate of 5.3%, comprising of 7 families. On the other hand, families with 1 or 2 children have the lowest poverty rate of 0.0%, which includes 0 families.
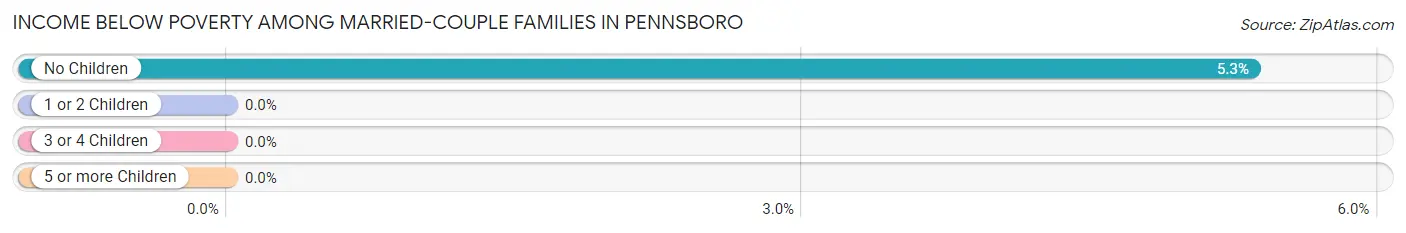
| Children | Above Poverty | Below Poverty |
| No Children | 124 (94.7%) | 7 (5.3%) |
| 1 or 2 Children | 112 (100.0%) | 0 (0.0%) |
| 3 or 4 Children | 3 (100.0%) | 0 (0.0%) |
| 5 or more Children | 0 (0.0%) | 0 (0.0%) |
| Total | 239 (97.2%) | 7 (2.9%) |
Income Below Poverty Among Single-Parent Households in Pennsboro
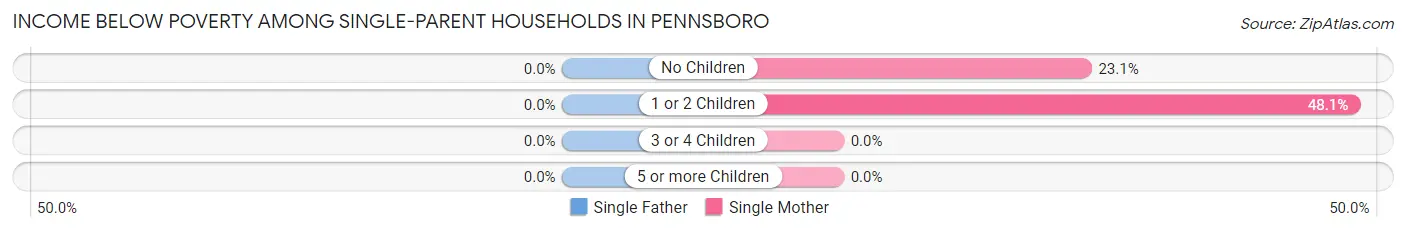
| Children | Single Father | Single Mother |
| No Children | 0 (0.0%) | 6 (23.1%) |
| 1 or 2 Children | 0 (0.0%) | 25 (48.1%) |
| 3 or 4 Children | 0 (0.0%) | 0 (0.0%) |
| 5 or more Children | 0 (0.0%) | 0 (0.0%) |
| Total | 0 (0.0%) | 31 (39.7%) |
Income Below Poverty Among Married-Couple vs Single-Parent Households in Pennsboro
The poverty data for Pennsboro shows that 7 of the married-couple family households (2.9%) and 31 of the single-parent households (34.4%) are living below the poverty level. Within the married-couple family households, those with no children have the highest poverty rate, with 7 households (5.3%) falling below the poverty line. Among the single-parent households, those with 1 or 2 children have the highest poverty rate, with 25 household (40.3%) living below poverty.
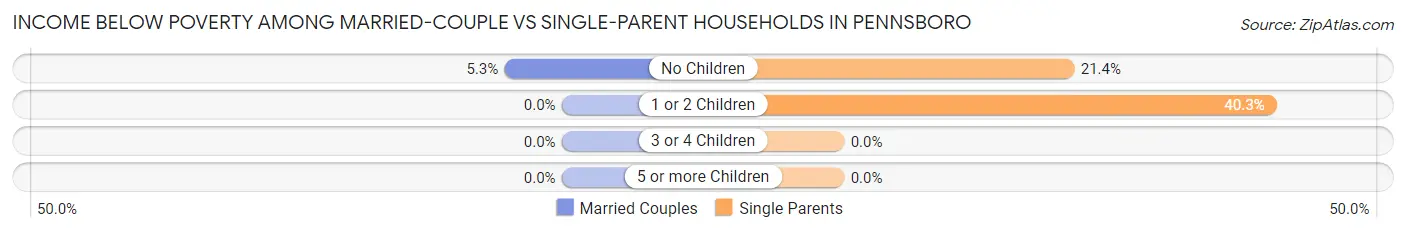
| Children | Married-Couple Families | Single-Parent Households |
| No Children | 7 (5.3%) | 6 (21.4%) |
| 1 or 2 Children | 0 (0.0%) | 25 (40.3%) |
| 3 or 4 Children | 0 (0.0%) | 0 (0.0%) |
| 5 or more Children | 0 (0.0%) | 0 (0.0%) |
| Total | 7 (2.9%) | 31 (34.4%) |
Race in Pennsboro
The most populous races in Pennsboro are White / Caucasian (1,302 | 95.8%), Black / African American (29 | 2.1%), and Two or more Races (22 | 1.6%).
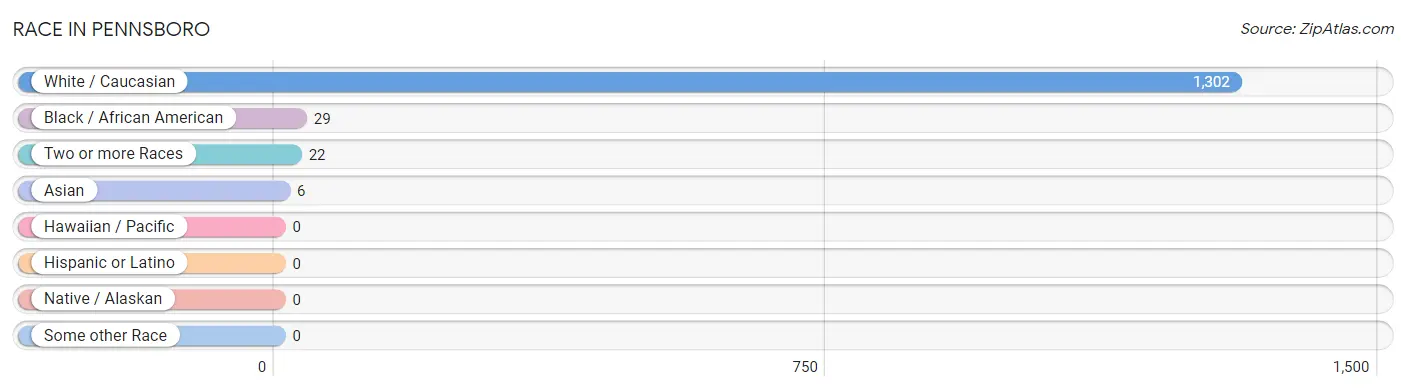
| Race | # Population | % Population |
| Asian | 6 | 0.4% |
| Black / African American | 29 | 2.1% |
| Hawaiian / Pacific | 0 | 0.0% |
| Hispanic or Latino | 0 | 0.0% |
| Native / Alaskan | 0 | 0.0% |
| White / Caucasian | 1,302 | 95.8% |
| Two or more Races | 22 | 1.6% |
| Some other Race | 0 | 0.0% |
| Total | 1,359 | 100.0% |
Ancestry in Pennsboro
The most populous ancestries reported in Pennsboro are English (142 | 10.4%), German (131 | 9.6%), American (129 | 9.5%), Irish (53 | 3.9%), and Thai (20 | 1.5%), together accounting for 34.9% of all Pennsboro residents.
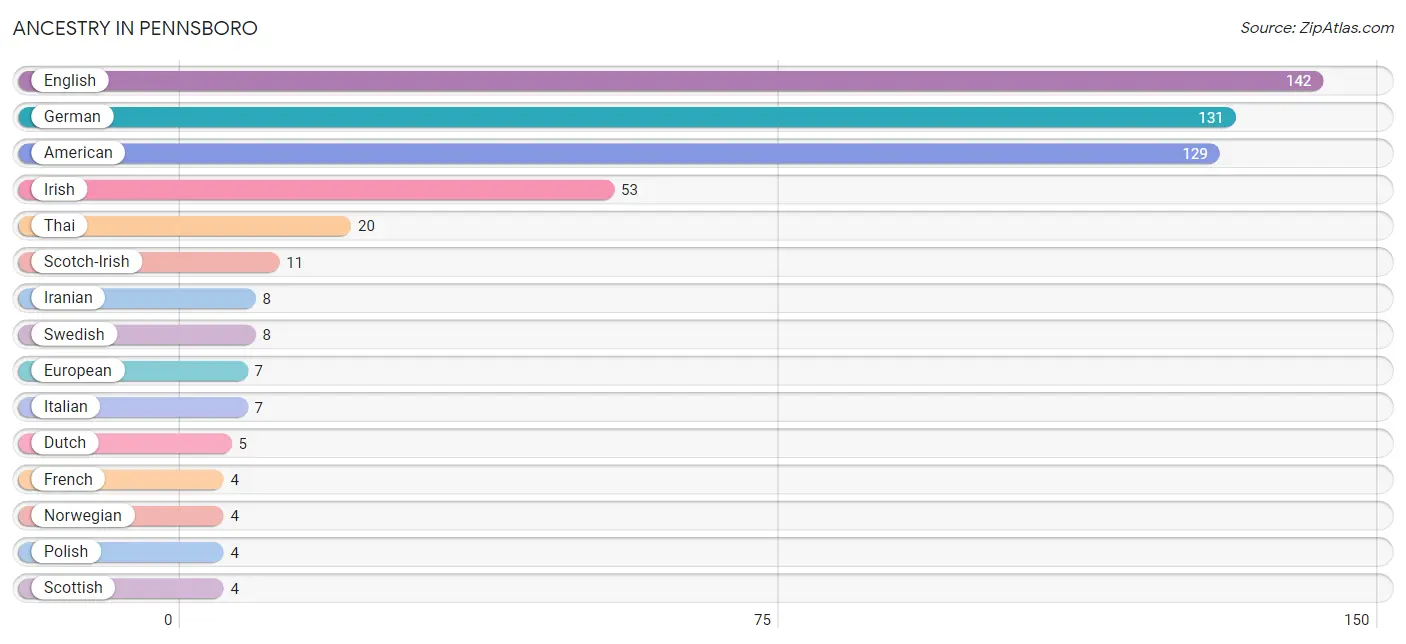
| Ancestry | # Population | % Population |
| American | 129 | 9.5% |
| Dutch | 5 | 0.4% |
| English | 142 | 10.4% |
| European | 7 | 0.5% |
| French | 4 | 0.3% |
| German | 131 | 9.6% |
| Iranian | 8 | 0.6% |
| Irish | 53 | 3.9% |
| Italian | 7 | 0.5% |
| Norwegian | 4 | 0.3% |
| Polish | 4 | 0.3% |
| Scotch-Irish | 11 | 0.8% |
| Scottish | 4 | 0.3% |
| Swedish | 8 | 0.6% |
| Thai | 20 | 1.5% | View All 15 Rows |
Immigrants in Pennsboro
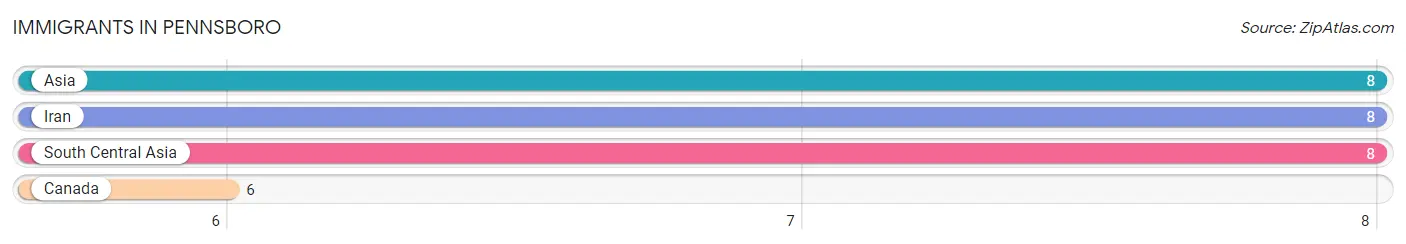
The most numerous immigrant groups reported in Pennsboro came from Asia (8 | 0.6%), Iran (8 | 0.6%), South Central Asia (8 | 0.6%), and Canada (6 | 0.4%), together accounting for 2.2% of all Pennsboro residents.
| Immigration Origin | # Population | % Population |
| Asia | 8 | 0.6% |
| Canada | 6 | 0.4% |
| Iran | 8 | 0.6% |
| South Central Asia | 8 | 0.6% | View All 4 Rows |
Sex and Age in Pennsboro
Sex and Age in Pennsboro
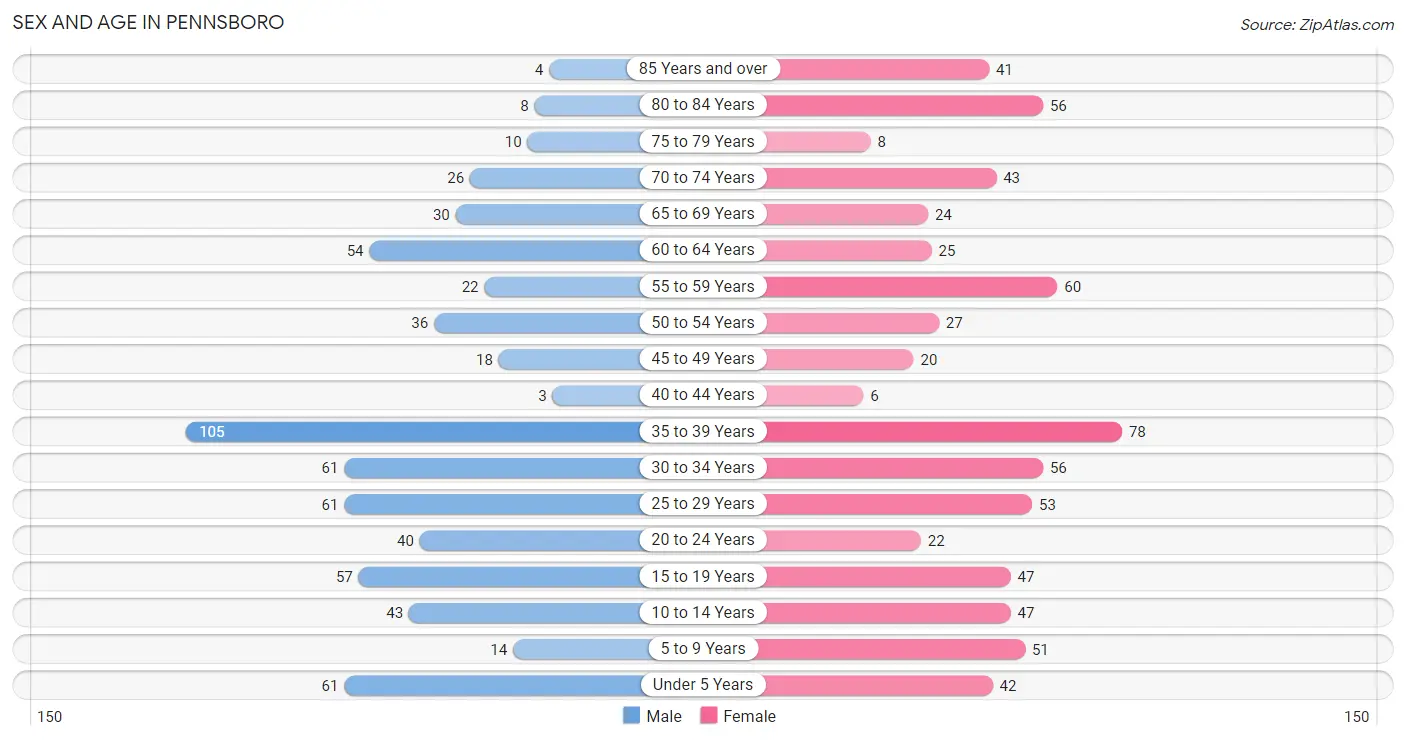
The most populous age groups in Pennsboro are 35 to 39 Years (105 | 16.1%) for men and 35 to 39 Years (78 | 11.1%) for women.
| Age Bracket | Male | Female |
| Under 5 Years | 61 (9.3%) | 42 (5.9%) |
| 5 to 9 Years | 14 (2.1%) | 51 (7.2%) |
| 10 to 14 Years | 43 (6.6%) | 47 (6.7%) |
| 15 to 19 Years | 57 (8.7%) | 47 (6.7%) |
| 20 to 24 Years | 40 (6.1%) | 22 (3.1%) |
| 25 to 29 Years | 61 (9.3%) | 53 (7.5%) |
| 30 to 34 Years | 61 (9.3%) | 56 (7.9%) |
| 35 to 39 Years | 105 (16.1%) | 78 (11.1%) |
| 40 to 44 Years | 3 (0.5%) | 6 (0.9%) |
| 45 to 49 Years | 18 (2.8%) | 20 (2.8%) |
| 50 to 54 Years | 36 (5.5%) | 27 (3.8%) |
| 55 to 59 Years | 22 (3.4%) | 60 (8.5%) |
| 60 to 64 Years | 54 (8.3%) | 25 (3.5%) |
| 65 to 69 Years | 30 (4.6%) | 24 (3.4%) |
| 70 to 74 Years | 26 (4.0%) | 43 (6.1%) |
| 75 to 79 Years | 10 (1.5%) | 8 (1.1%) |
| 80 to 84 Years | 8 (1.2%) | 56 (7.9%) |
| 85 Years and over | 4 (0.6%) | 41 (5.8%) |
| Total | 653 (100.0%) | 706 (100.0%) |
Families and Households in Pennsboro
Median Family Size in Pennsboro
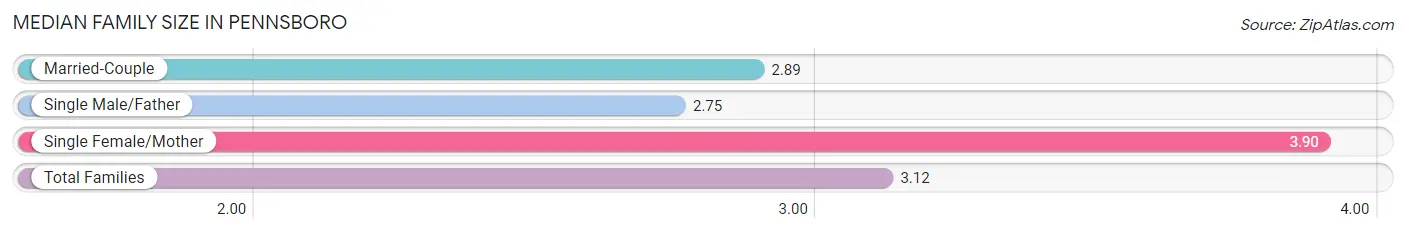
The median family size in Pennsboro is 3.12 persons per family, with single female/mother families (78 | 23.2%) accounting for the largest median family size of 3.9 persons per family. On the other hand, single male/father families (12 | 3.6%) represent the smallest median family size with 2.75 persons per family.
| Family Type | # Families | Family Size |
| Married-Couple | 246 (73.2%) | 2.89 |
| Single Male/Father | 12 (3.6%) | 2.75 |
| Single Female/Mother | 78 (23.2%) | 3.90 |
| Total Families | 336 (100.0%) | 3.12 |
Median Household Size in Pennsboro
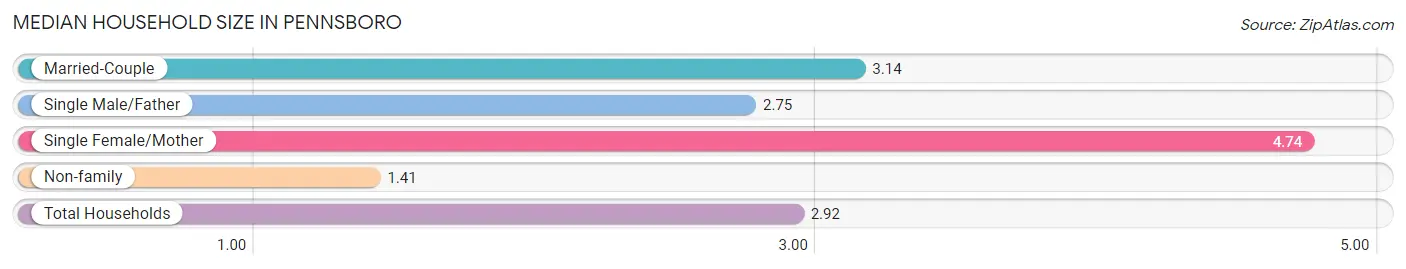
The median household size in Pennsboro is 2.92 persons per household, with single female/mother households (78 | 16.7%) accounting for the largest median household size of 4.74 persons per household. non-family households (130 | 27.9%) represent the smallest median household size with 1.41 persons per household.
| Household Type | # Households | Household Size |
| Married-Couple | 246 (52.8%) | 3.14 |
| Single Male/Father | 12 (2.6%) | 2.75 |
| Single Female/Mother | 78 (16.7%) | 4.74 |
| Non-family | 130 (27.9%) | 1.41 |
| Total Households | 466 (100.0%) | 2.92 |
Household Size by Marriage Status in Pennsboro
Out of a total of 466 households in Pennsboro, 336 (72.1%) are family households, while 130 (27.9%) are nonfamily households. The most numerous type of family households are 2-person households, comprising 107, and the most common type of nonfamily households are 1-person households, comprising 110.
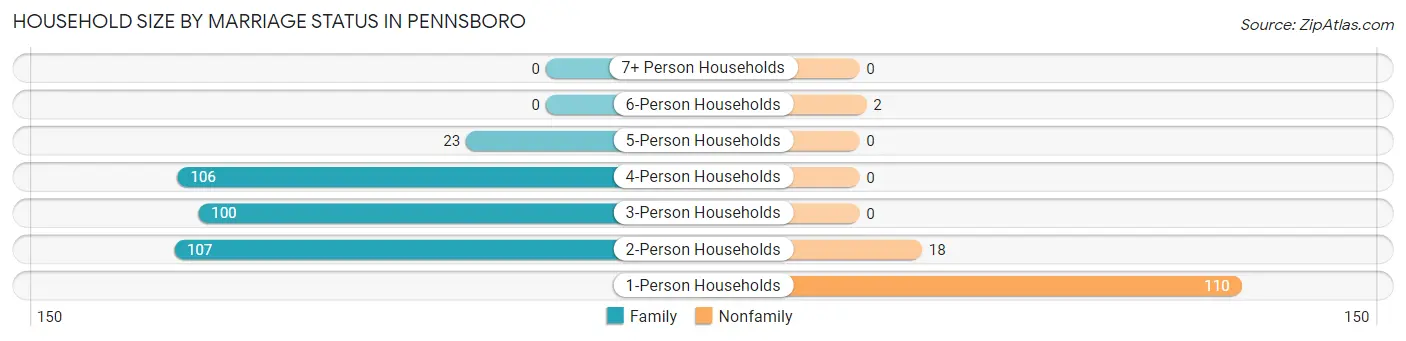
| Household Size | Family Households | Nonfamily Households |
| 1-Person Households | - | 110 (23.6%) |
| 2-Person Households | 107 (23.0%) | 18 (3.9%) |
| 3-Person Households | 100 (21.5%) | 0 (0.0%) |
| 4-Person Households | 106 (22.8%) | 0 (0.0%) |
| 5-Person Households | 23 (4.9%) | 0 (0.0%) |
| 6-Person Households | 0 (0.0%) | 2 (0.4%) |
| 7+ Person Households | 0 (0.0%) | 0 (0.0%) |
| Total | 336 (72.1%) | 130 (27.9%) |
Female Fertility in Pennsboro
Fertility by Age in Pennsboro
Average fertility rate in Pennsboro is 11.0 births per 1,000 women. Women in the age bracket of 35 to 50 years have the highest fertility rate with 29.0 births per 1,000 women. Women in the age bracket of 35 to 50 years acount for 100.0% of all women with births.
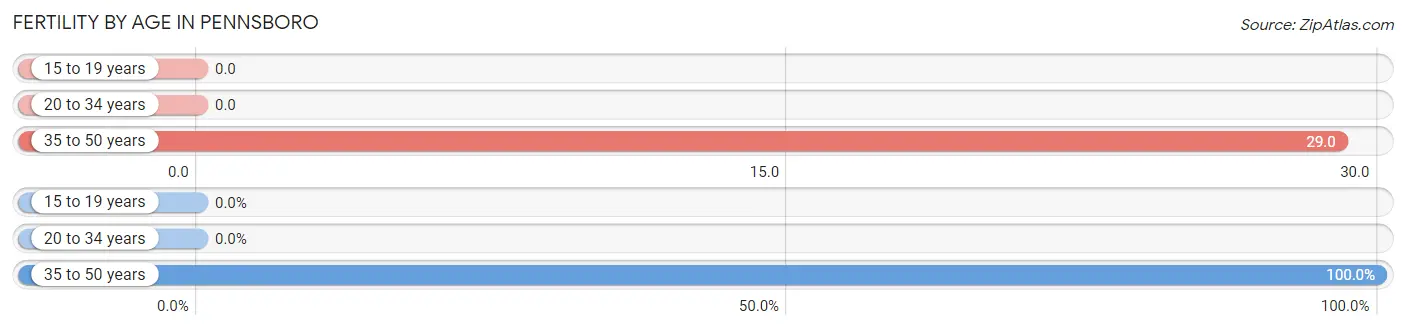
| Age Bracket | Women with Births | Births / 1,000 Women |
| 15 to 19 years | 0 (0.0%) | 0.0 |
| 20 to 34 years | 0 (0.0%) | 0.0 |
| 35 to 50 years | 3 (100.0%) | 29.0 |
| Total | 3 (100.0%) | 11.0 |
Fertility by Age by Marriage Status in Pennsboro
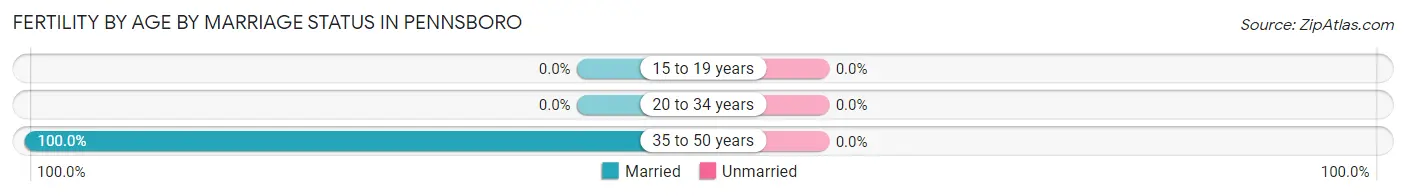
| Age Bracket | Married | Unmarried |
| 15 to 19 years | 0 (0.0%) | 0 (0.0%) |
| 20 to 34 years | 0 (0.0%) | 0 (0.0%) |
| 35 to 50 years | 3 (100.0%) | 0 (0.0%) |
| Total | 3 (100.0%) | 0 (0.0%) |
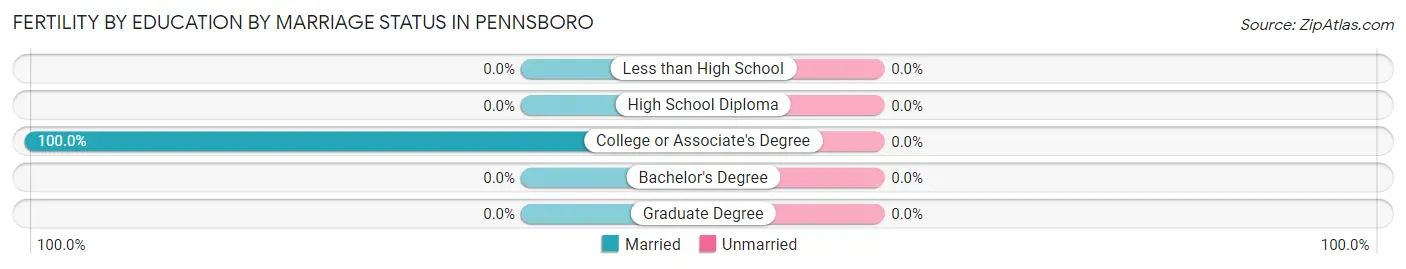
Fertility by Education in Pennsboro
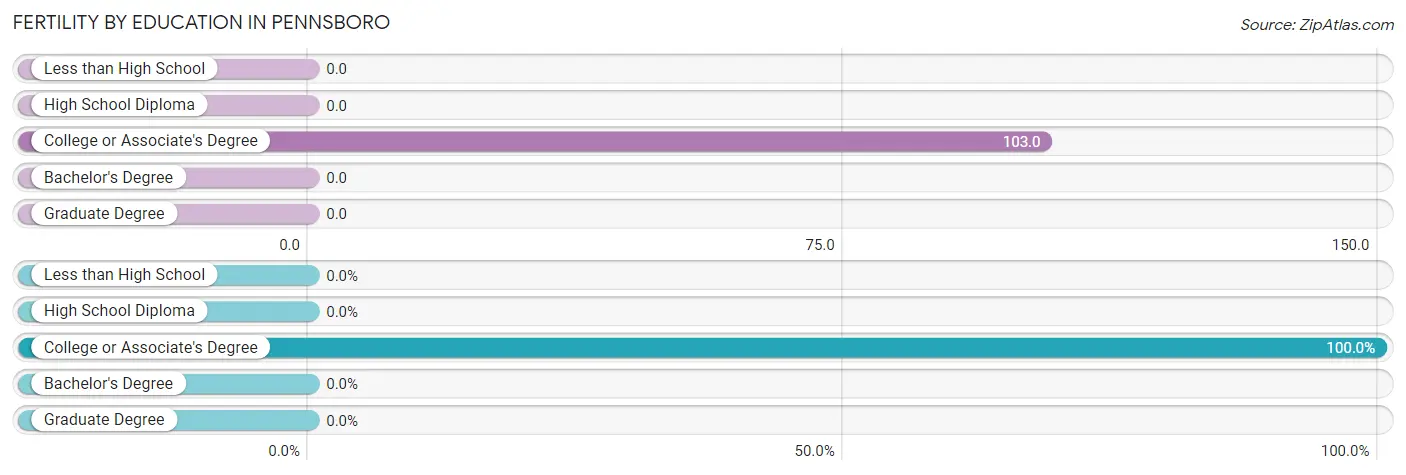
| Educational Attainment | Women with Births | Births / 1,000 Women |
| Less than High School | 0 (0.0%) | 0.0 |
| High School Diploma | 0 (0.0%) | 0.0 |
| College or Associate's Degree | 3 (100.0%) | 103.0 |
| Bachelor's Degree | 0 (0.0%) | 0.0 |
| Graduate Degree | 0 (0.0%) | 0.0 |
| Total | 3 (100.0%) | 11.0 |
Fertility by Education by Marriage Status in Pennsboro
| Educational Attainment | Married | Unmarried |
| Less than High School | 0 (0.0%) | 0 (0.0%) |
| High School Diploma | 0 (0.0%) | 0 (0.0%) |
| College or Associate's Degree | 3 (100.0%) | 0 (0.0%) |
| Bachelor's Degree | 0 (0.0%) | 0 (0.0%) |
| Graduate Degree | 0 (0.0%) | 0 (0.0%) |
| Total | 3 (100.0%) | 0 (0.0%) |
Employment Characteristics in Pennsboro
Employment by Class of Employer in Pennsboro
Among the 488 employed individuals in Pennsboro, private company employees (288 | 59.0%), state government employees (120 | 24.6%), and not-for-profit organizations (31 | 6.4%) make up the most common classes of employment.
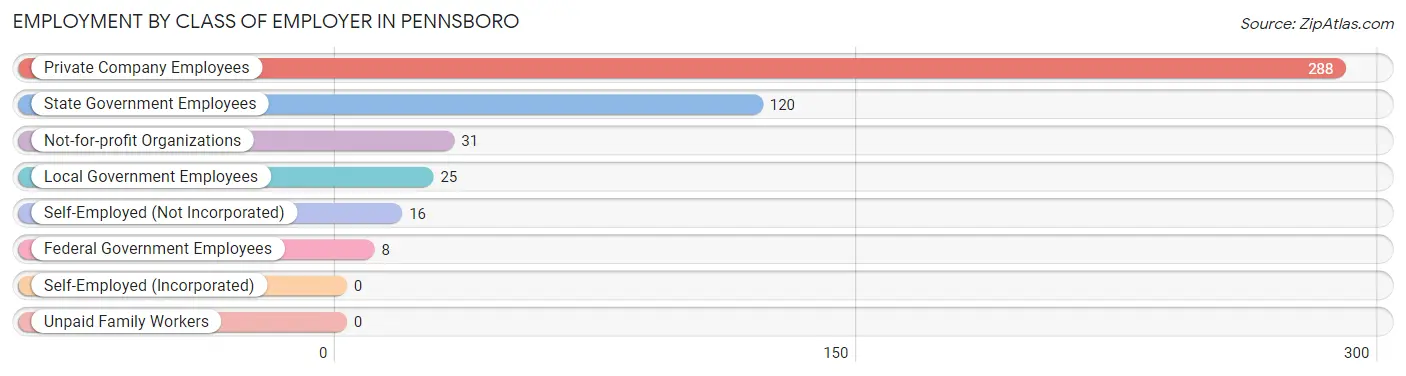
| Employer Class | # Employees | % Employees |
| Private Company Employees | 288 | 59.0% |
| Self-Employed (Incorporated) | 0 | 0.0% |
| Self-Employed (Not Incorporated) | 16 | 3.3% |
| Not-for-profit Organizations | 31 | 6.4% |
| Local Government Employees | 25 | 5.1% |
| State Government Employees | 120 | 24.6% |
| Federal Government Employees | 8 | 1.6% |
| Unpaid Family Workers | 0 | 0.0% |
| Total | 488 | 100.0% |
Employment Status by Age in Pennsboro
According to the labor force statistics for Pennsboro, out of the total population over 16 years of age (1,055), 49.9% or 526 individuals are in the labor force, with 6.5% or 34 of them unemployed. The age group with the highest labor force participation rate is 35 to 44 years, with 91.7% or 176 individuals in the labor force. Within the labor force, the 45 to 54 years age range has the highest percentage of unemployed individuals, with 28.8% or 19 of them being unemployed.
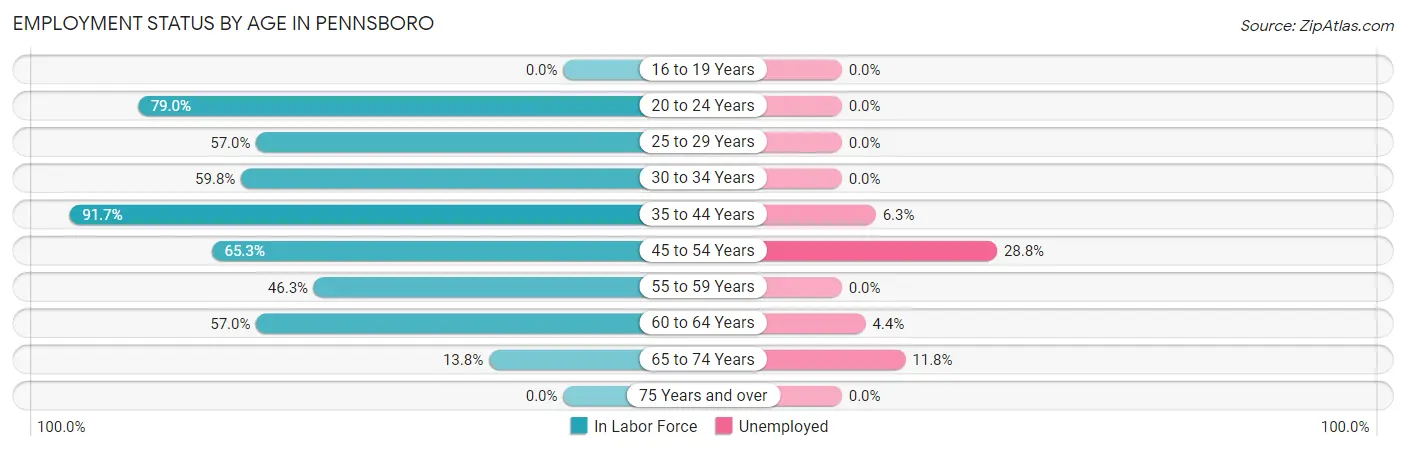
| Age Bracket | In Labor Force | Unemployed |
| 16 to 19 Years | 0 (0.0%) | 0 (0.0%) |
| 20 to 24 Years | 49 (79.0%) | 0 (0.0%) |
| 25 to 29 Years | 65 (57.0%) | 0 (0.0%) |
| 30 to 34 Years | 70 (59.8%) | 0 (0.0%) |
| 35 to 44 Years | 176 (91.7%) | 11 (6.3%) |
| 45 to 54 Years | 66 (65.3%) | 19 (28.8%) |
| 55 to 59 Years | 38 (46.3%) | 0 (0.0%) |
| 60 to 64 Years | 45 (57.0%) | 2 (4.4%) |
| 65 to 74 Years | 17 (13.8%) | 2 (11.8%) |
| 75 Years and over | 0 (0.0%) | 0 (0.0%) |
| Total | 526 (49.9%) | 34 (6.5%) |
Employment Status by Educational Attainment in Pennsboro
According to labor force statistics for Pennsboro, 67.2% of individuals (460) out of the total population between 25 and 64 years of age (685) are in the labor force, with 7.0% or 32 of them being unemployed. The group with the highest labor force participation rate are those with the educational attainment of college / associate degree, with 86.2% or 131 individuals in the labor force. Within the labor force, individuals with college / associate degree education have the highest percentage of unemployment, with 11.5% or 15 of them being unemployed.
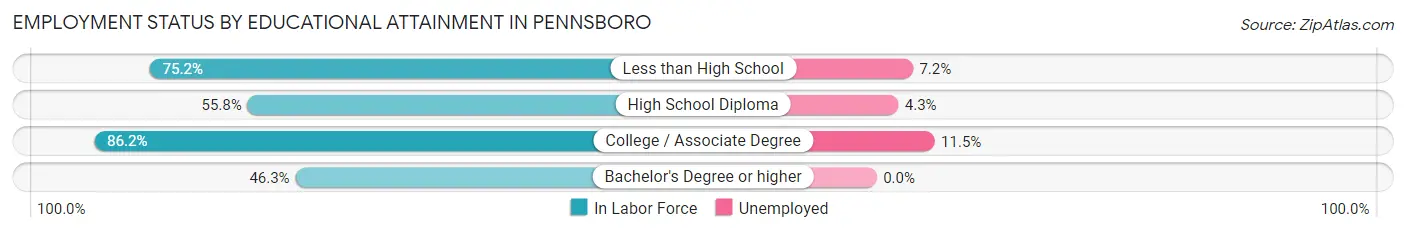
| Educational Attainment | In Labor Force | Unemployed |
| Less than High School | 152 (75.2%) | 15 (7.2%) |
| High School Diploma | 139 (55.8%) | 11 (4.3%) |
| College / Associate Degree | 131 (86.2%) | 17 (11.5%) |
| Bachelor's Degree or higher | 38 (46.3%) | 0 (0.0%) |
| Total | 460 (67.2%) | 48 (7.0%) |
Employment Occupations by Sex in Pennsboro
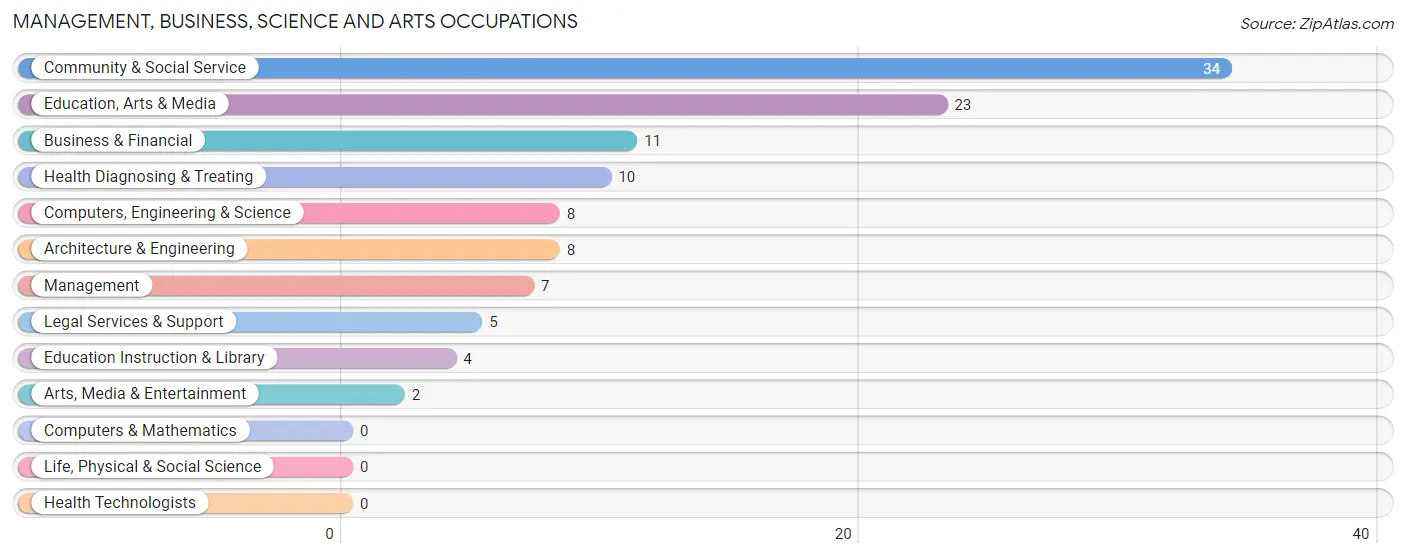
Management, Business, Science and Arts Occupations
The most common Management, Business, Science and Arts occupations in Pennsboro are Community & Social Service (34 | 6.9%), Education, Arts & Media (23 | 4.7%), Business & Financial (11 | 2.2%), Health Diagnosing & Treating (10 | 2.0%), and Computers, Engineering & Science (8 | 1.6%).
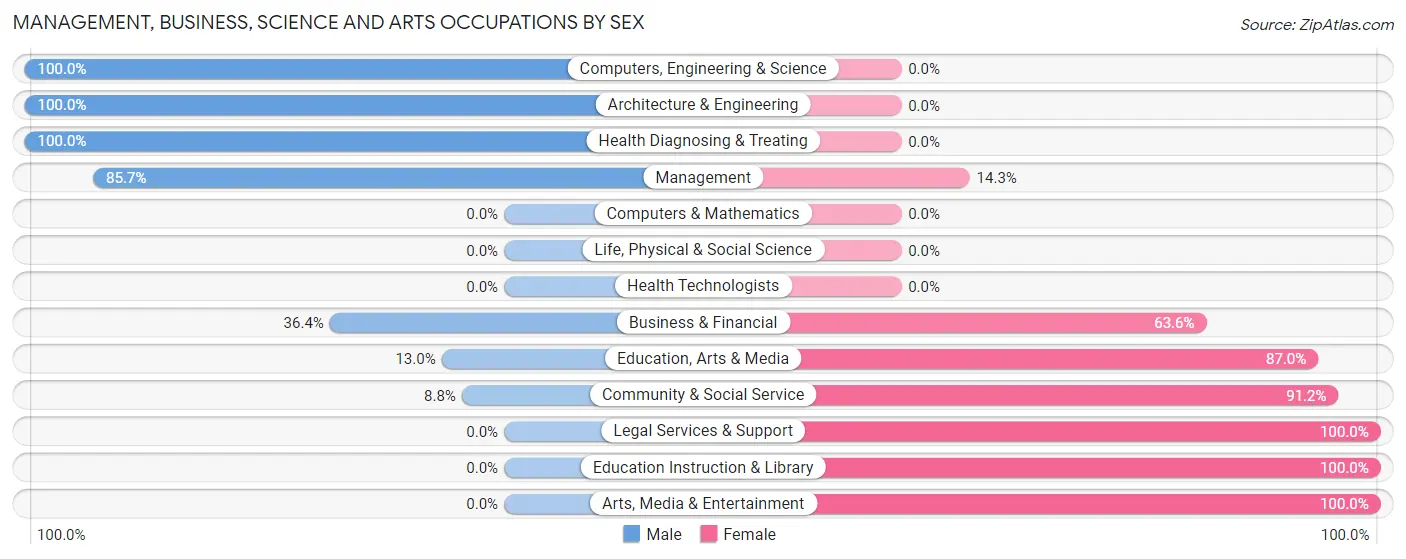
Management, Business, Science and Arts Occupations by Sex
Within the Management, Business, Science and Arts occupations in Pennsboro, the most male-oriented occupations are Computers, Engineering & Science (100.0%), Architecture & Engineering (100.0%), and Health Diagnosing & Treating (100.0%), while the most female-oriented occupations are Legal Services & Support (100.0%), Education Instruction & Library (100.0%), and Arts, Media & Entertainment (100.0%).
| Occupation | Male | Female |
| Management | 6 (85.7%) | 1 (14.3%) |
| Business & Financial | 4 (36.4%) | 7 (63.6%) |
| Computers, Engineering & Science | 8 (100.0%) | 0 (0.0%) |
| Computers & Mathematics | 0 (0.0%) | 0 (0.0%) |
| Architecture & Engineering | 8 (100.0%) | 0 (0.0%) |
| Life, Physical & Social Science | 0 (0.0%) | 0 (0.0%) |
| Community & Social Service | 3 (8.8%) | 31 (91.2%) |
| Education, Arts & Media | 3 (13.0%) | 20 (87.0%) |
| Legal Services & Support | 0 (0.0%) | 5 (100.0%) |
| Education Instruction & Library | 0 (0.0%) | 4 (100.0%) |
| Arts, Media & Entertainment | 0 (0.0%) | 2 (100.0%) |
| Health Diagnosing & Treating | 10 (100.0%) | 0 (0.0%) |
| Health Technologists | 0 (0.0%) | 0 (0.0%) |
| Total (Category) | 31 (44.3%) | 39 (55.7%) |
| Total (Overall) | 304 (61.8%) | 188 (38.2%) |
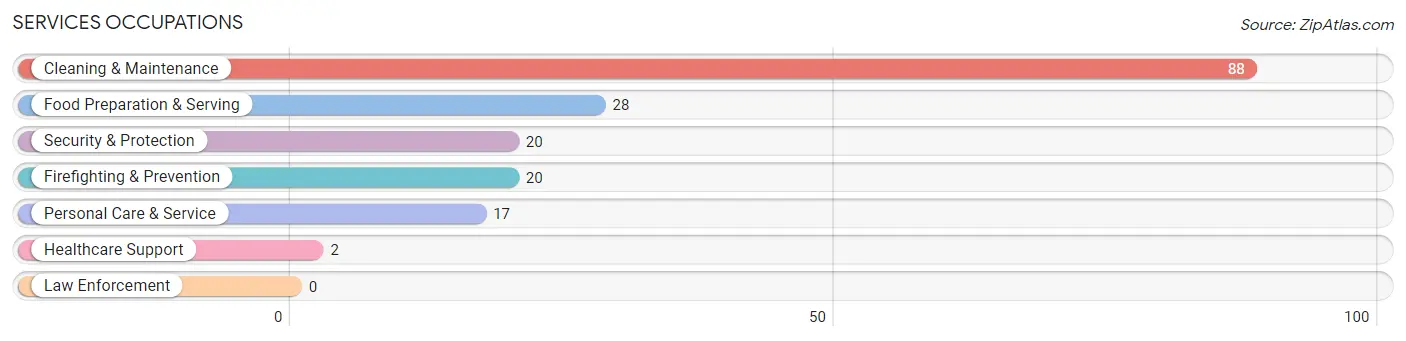
Services Occupations
The most common Services occupations in Pennsboro are Cleaning & Maintenance (88 | 17.9%), Food Preparation & Serving (28 | 5.7%), Security & Protection (20 | 4.1%), Firefighting & Prevention (20 | 4.1%), and Personal Care & Service (17 | 3.5%).
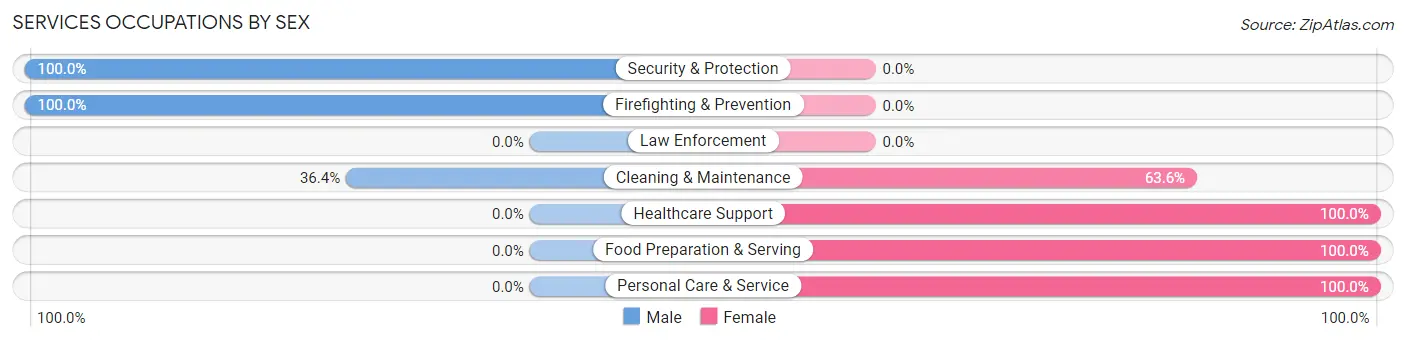
Services Occupations by Sex
Within the Services occupations in Pennsboro, the most male-oriented occupations are Security & Protection (100.0%), Firefighting & Prevention (100.0%), and Cleaning & Maintenance (36.4%), while the most female-oriented occupations are Healthcare Support (100.0%), Food Preparation & Serving (100.0%), and Personal Care & Service (100.0%).
| Occupation | Male | Female |
| Healthcare Support | 0 (0.0%) | 2 (100.0%) |
| Security & Protection | 20 (100.0%) | 0 (0.0%) |
| Firefighting & Prevention | 20 (100.0%) | 0 (0.0%) |
| Law Enforcement | 0 (0.0%) | 0 (0.0%) |
| Food Preparation & Serving | 0 (0.0%) | 28 (100.0%) |
| Cleaning & Maintenance | 32 (36.4%) | 56 (63.6%) |
| Personal Care & Service | 0 (0.0%) | 17 (100.0%) |
| Total (Category) | 52 (33.6%) | 103 (66.4%) |
| Total (Overall) | 304 (61.8%) | 188 (38.2%) |
Sales and Office Occupations
The most common Sales and Office occupations in Pennsboro are Sales & Related (31 | 6.3%), and Office & Administration (10 | 2.0%).
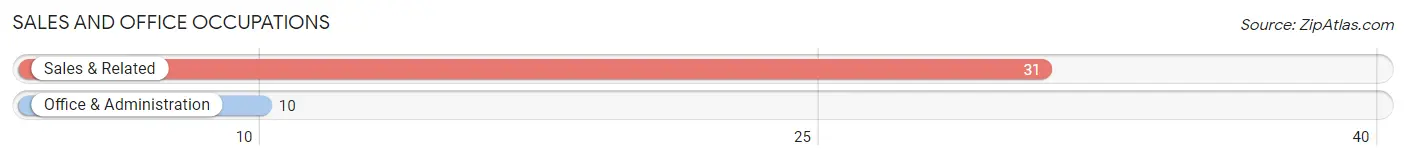
Sales and Office Occupations by Sex
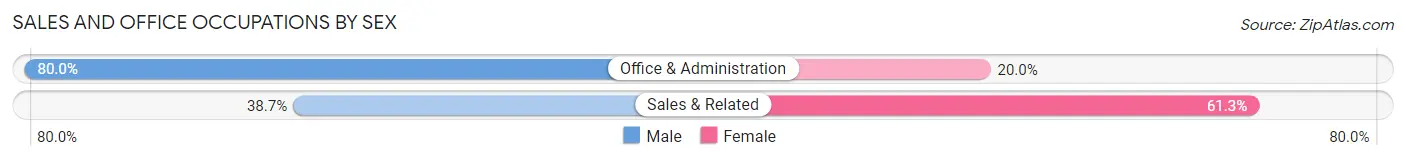
| Occupation | Male | Female |
| Sales & Related | 12 (38.7%) | 19 (61.3%) |
| Office & Administration | 8 (80.0%) | 2 (20.0%) |
| Total (Category) | 20 (48.8%) | 21 (51.2%) |
| Total (Overall) | 304 (61.8%) | 188 (38.2%) |
Natural Resources, Construction and Maintenance Occupations
The most common Natural Resources, Construction and Maintenance occupations in Pennsboro are Construction & Extraction (41 | 8.3%), and Installation, Maintenance & Repair (12 | 2.4%).
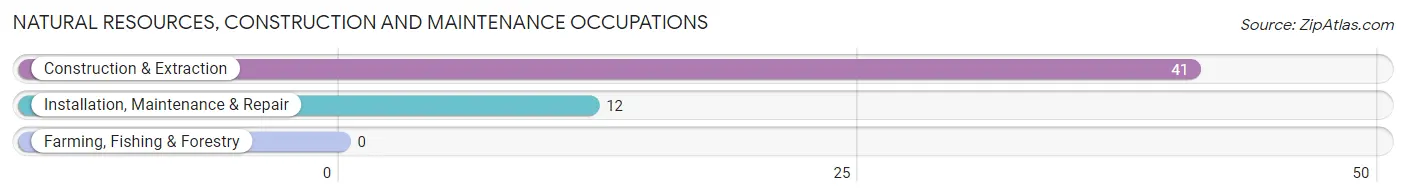
Natural Resources, Construction and Maintenance Occupations by Sex

| Occupation | Male | Female |
| Farming, Fishing & Forestry | 0 (0.0%) | 0 (0.0%) |
| Construction & Extraction | 41 (100.0%) | 0 (0.0%) |
| Installation, Maintenance & Repair | 12 (100.0%) | 0 (0.0%) |
| Total (Category) | 53 (100.0%) | 0 (0.0%) |
| Total (Overall) | 304 (61.8%) | 188 (38.2%) |
Production, Transportation and Moving Occupations
The most common Production, Transportation and Moving occupations in Pennsboro are Production (114 | 23.2%), Transportation (38 | 7.7%), and Material Moving (21 | 4.3%).
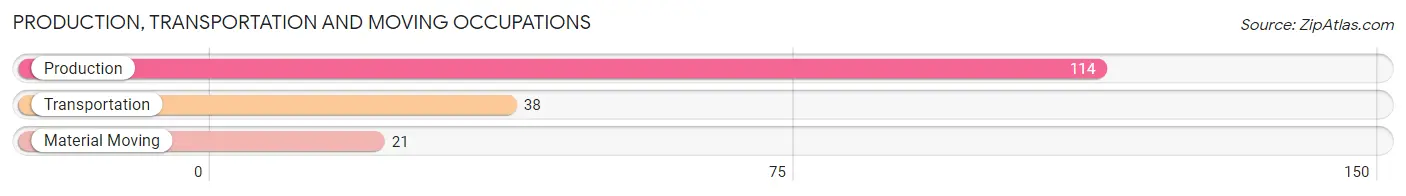
Production, Transportation and Moving Occupations by Sex
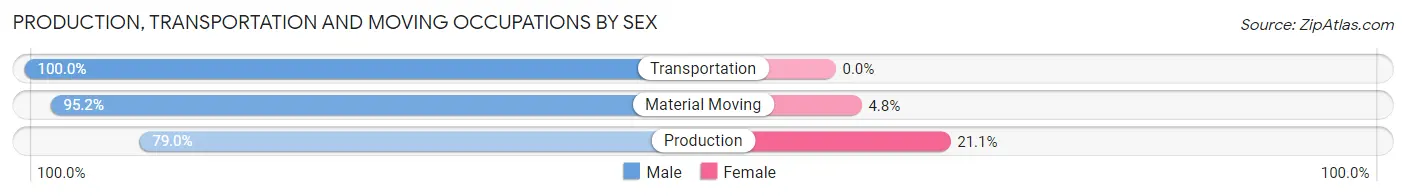
| Occupation | Male | Female |
| Production | 90 (78.9%) | 24 (21.0%) |
| Transportation | 38 (100.0%) | 0 (0.0%) |
| Material Moving | 20 (95.2%) | 1 (4.8%) |
| Total (Category) | 148 (85.6%) | 25 (14.4%) |
| Total (Overall) | 304 (61.8%) | 188 (38.2%) |
Employment Industries by Sex in Pennsboro
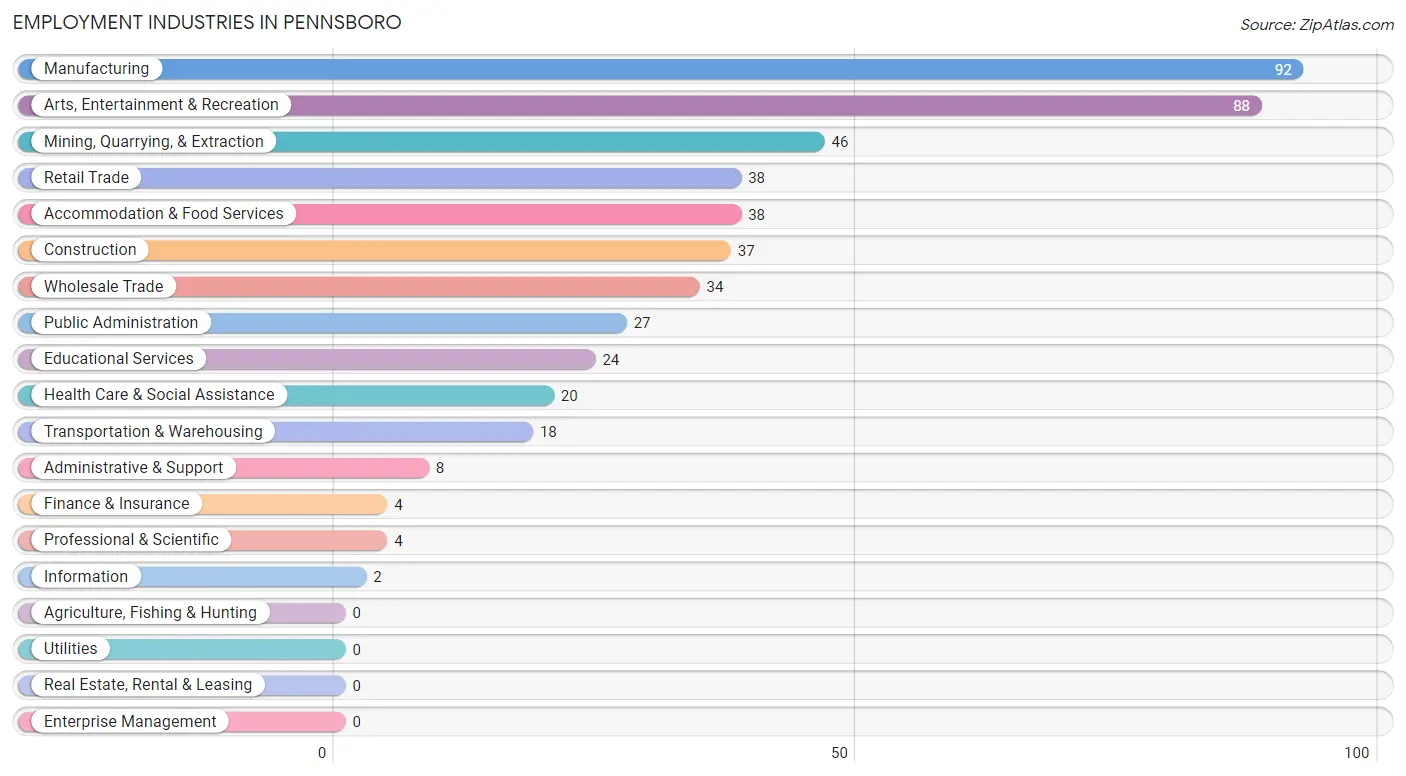
Employment Industries in Pennsboro
The major employment industries in Pennsboro include Manufacturing (92 | 18.7%), Arts, Entertainment & Recreation (88 | 17.9%), Mining, Quarrying, & Extraction (46 | 9.3%), Retail Trade (38 | 7.7%), and Accommodation & Food Services (38 | 7.7%).
Employment Industries by Sex in Pennsboro
The Pennsboro industries that see more men than women are Mining, Quarrying, & Extraction (100.0%), Construction (100.0%), and Transportation & Warehousing (100.0%), whereas the industries that tend to have a higher number of women are Finance & Insurance (100.0%), Educational Services (100.0%), and Accommodation & Food Services (100.0%).
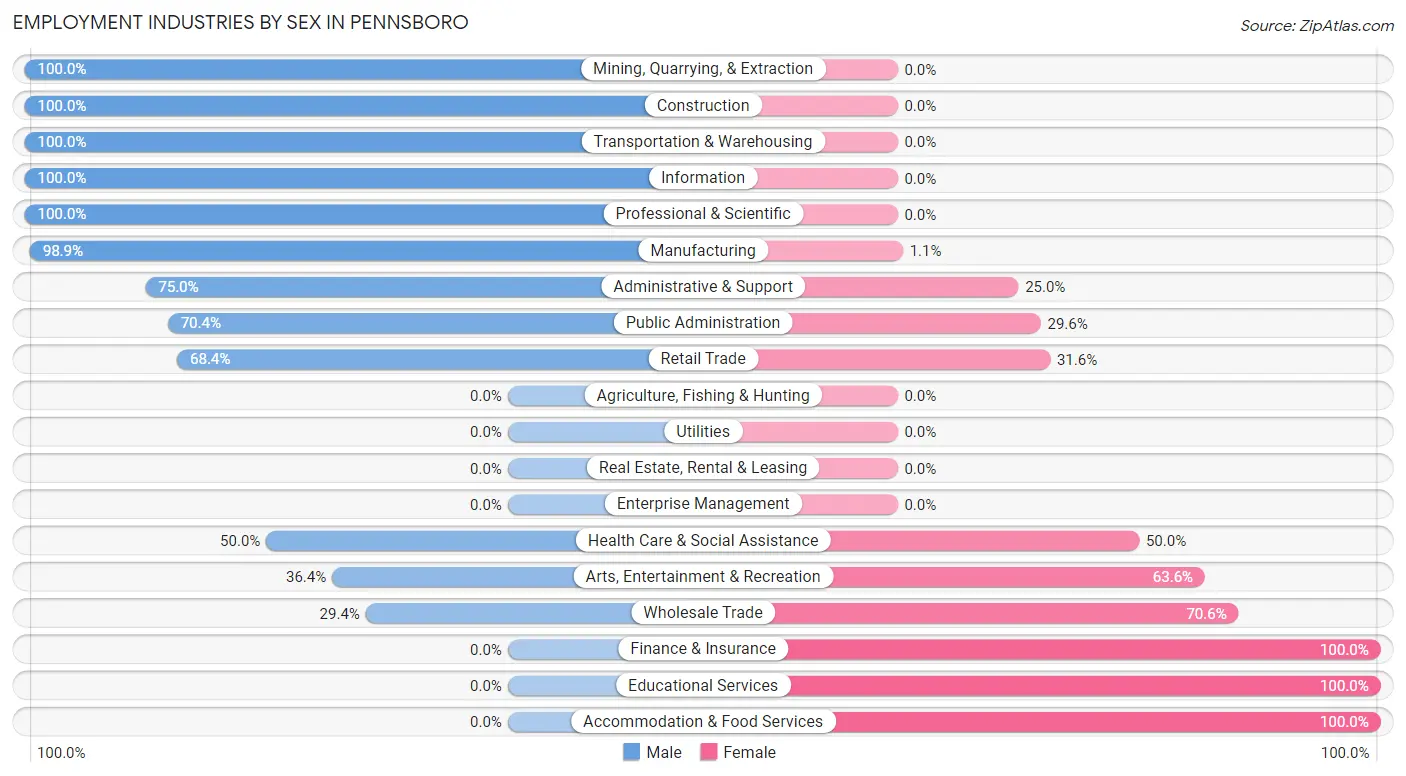
| Industry | Male | Female |
| Agriculture, Fishing & Hunting | 0 (0.0%) | 0 (0.0%) |
| Mining, Quarrying, & Extraction | 46 (100.0%) | 0 (0.0%) |
| Construction | 37 (100.0%) | 0 (0.0%) |
| Manufacturing | 91 (98.9%) | 1 (1.1%) |
| Wholesale Trade | 10 (29.4%) | 24 (70.6%) |
| Retail Trade | 26 (68.4%) | 12 (31.6%) |
| Transportation & Warehousing | 18 (100.0%) | 0 (0.0%) |
| Utilities | 0 (0.0%) | 0 (0.0%) |
| Information | 2 (100.0%) | 0 (0.0%) |
| Finance & Insurance | 0 (0.0%) | 4 (100.0%) |
| Real Estate, Rental & Leasing | 0 (0.0%) | 0 (0.0%) |
| Professional & Scientific | 4 (100.0%) | 0 (0.0%) |
| Enterprise Management | 0 (0.0%) | 0 (0.0%) |
| Administrative & Support | 6 (75.0%) | 2 (25.0%) |
| Educational Services | 0 (0.0%) | 24 (100.0%) |
| Health Care & Social Assistance | 10 (50.0%) | 10 (50.0%) |
| Arts, Entertainment & Recreation | 32 (36.4%) | 56 (63.6%) |
| Accommodation & Food Services | 0 (0.0%) | 38 (100.0%) |
| Public Administration | 19 (70.4%) | 8 (29.6%) |
| Total | 304 (61.8%) | 188 (38.2%) |
Education in Pennsboro
School Enrollment in Pennsboro
The most common levels of schooling among the 278 students in Pennsboro are high school (117 | 42.1%), middle school (60 | 21.6%), and elementary school (49 | 17.6%).
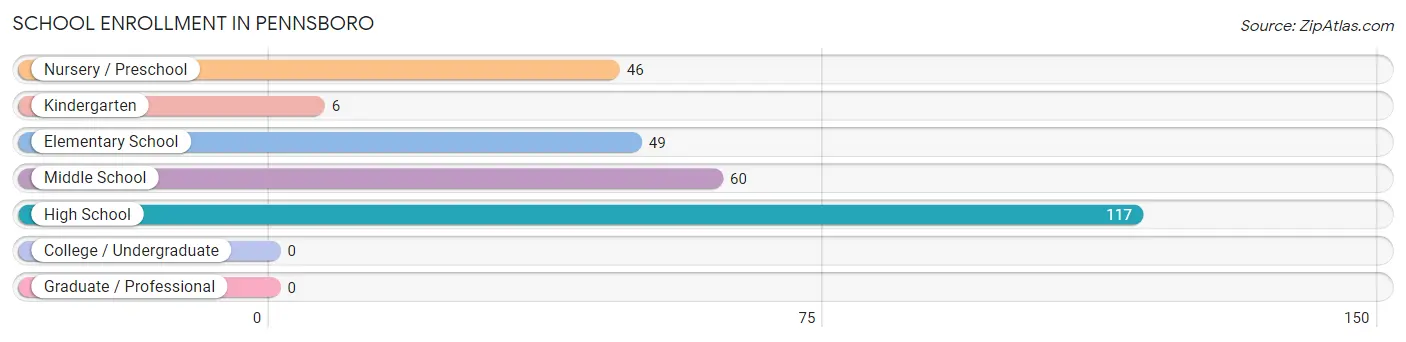
| School Level | # Students | % Students |
| Nursery / Preschool | 46 | 16.6% |
| Kindergarten | 6 | 2.2% |
| Elementary School | 49 | 17.6% |
| Middle School | 60 | 21.6% |
| High School | 117 | 42.1% |
| College / Undergraduate | 0 | 0.0% |
| Graduate / Professional | 0 | 0.0% |
| Total | 278 | 100.0% |
School Enrollment by Age by Funding Source in Pennsboro
Out of a total of 278 students who are enrolled in schools in Pennsboro, 45 (16.2%) attend a private institution, while the remaining 233 (83.8%) are enrolled in public schools. The age group of 3 to 4 year olds has the highest likelihood of being enrolled in private schools, with 23 (100.0% in the age bracket) enrolled. Conversely, the age group of 10 to 14 year olds has the lowest likelihood of being enrolled in a private school, with 90 (100.0% in the age bracket) attending a public institution.
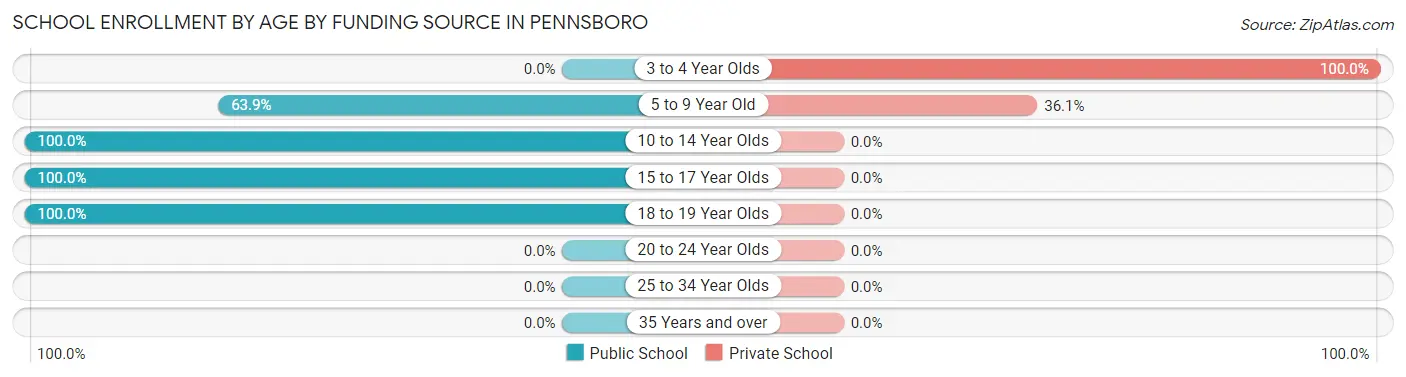
| Age Bracket | Public School | Private School |
| 3 to 4 Year Olds | 0 (0.0%) | 23 (100.0%) |
| 5 to 9 Year Old | 39 (63.9%) | 22 (36.1%) |
| 10 to 14 Year Olds | 90 (100.0%) | 0 (0.0%) |
| 15 to 17 Year Olds | 99 (100.0%) | 0 (0.0%) |
| 18 to 19 Year Olds | 5 (100.0%) | 0 (0.0%) |
| 20 to 24 Year Olds | 0 (0.0%) | 0 (0.0%) |
| 25 to 34 Year Olds | 0 (0.0%) | 0 (0.0%) |
| 35 Years and over | 0 (0.0%) | 0 (0.0%) |
| Total | 233 (83.8%) | 45 (16.2%) |
Educational Attainment by Field of Study in Pennsboro
Education (40 | 39.2%), psychology (17 | 16.7%), engineering (15 | 14.7%), business (14 | 13.7%), and science & technology (6 | 5.9%) are the most common fields of study among 102 individuals in Pennsboro who have obtained a bachelor's degree or higher.
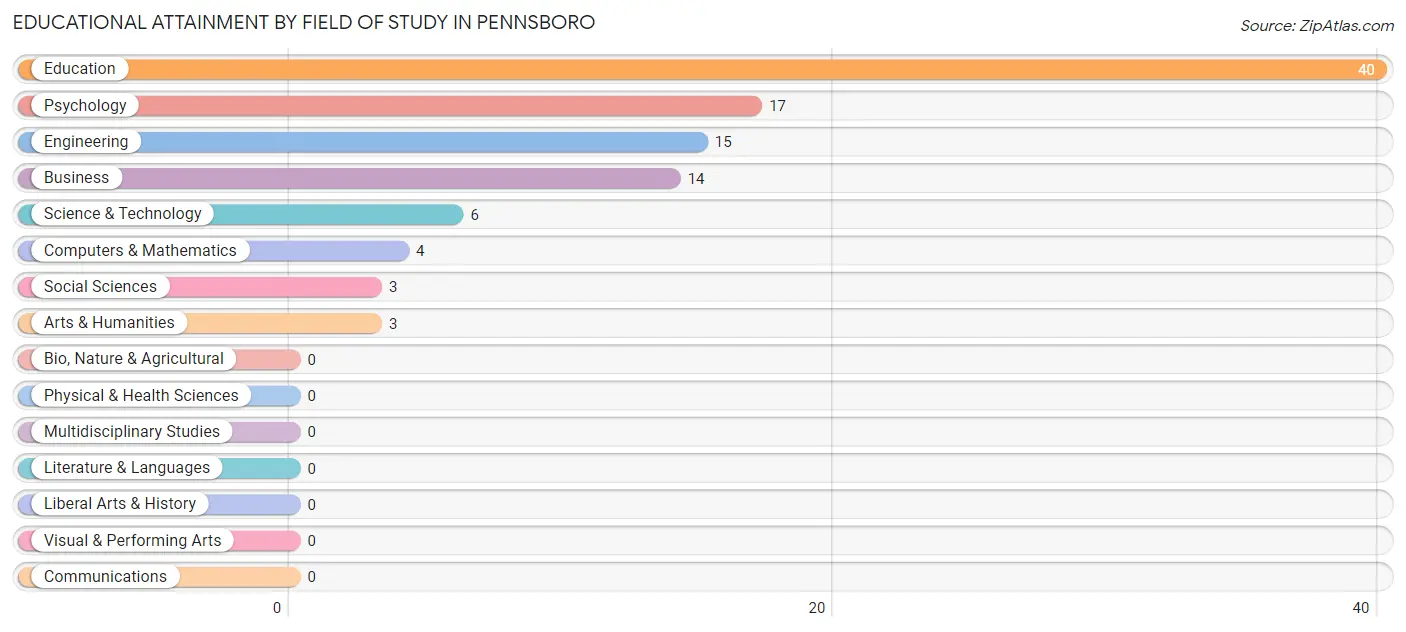
| Field of Study | # Graduates | % Graduates |
| Computers & Mathematics | 4 | 3.9% |
| Bio, Nature & Agricultural | 0 | 0.0% |
| Physical & Health Sciences | 0 | 0.0% |
| Psychology | 17 | 16.7% |
| Social Sciences | 3 | 2.9% |
| Engineering | 15 | 14.7% |
| Multidisciplinary Studies | 0 | 0.0% |
| Science & Technology | 6 | 5.9% |
| Business | 14 | 13.7% |
| Education | 40 | 39.2% |
| Literature & Languages | 0 | 0.0% |
| Liberal Arts & History | 0 | 0.0% |
| Visual & Performing Arts | 0 | 0.0% |
| Communications | 0 | 0.0% |
| Arts & Humanities | 3 | 2.9% |
| Total | 102 | 100.0% |
Transportation & Commute in Pennsboro
Vehicle Availability by Sex in Pennsboro
The most prevalent vehicle ownership categories in Pennsboro are males with 2 vehicles (137, accounting for 45.5%) and females with 2 vehicles (105, making up 73.3%).
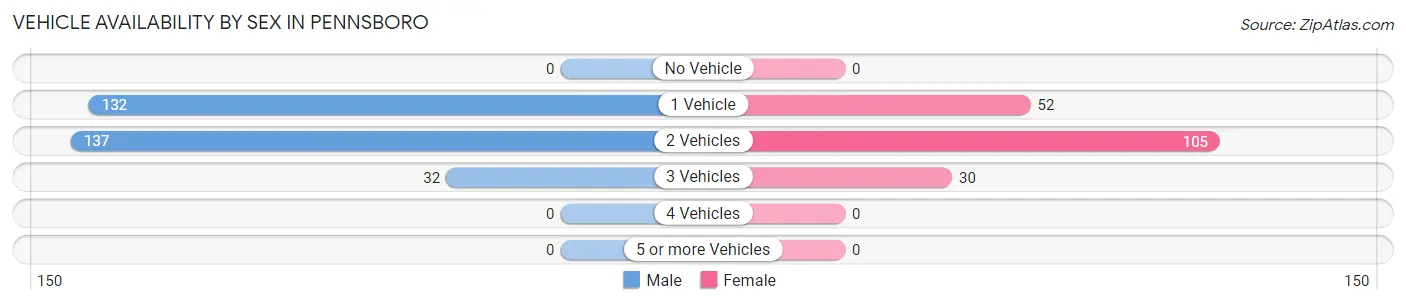
| Vehicles Available | Male | Female |
| No Vehicle | 0 (0.0%) | 0 (0.0%) |
| 1 Vehicle | 132 (43.9%) | 52 (27.8%) |
| 2 Vehicles | 137 (45.5%) | 105 (56.1%) |
| 3 Vehicles | 32 (10.6%) | 30 (16.0%) |
| 4 Vehicles | 0 (0.0%) | 0 (0.0%) |
| 5 or more Vehicles | 0 (0.0%) | 0 (0.0%) |
| Total | 301 (100.0%) | 187 (100.0%) |
Commute Time in Pennsboro
The most frequently occuring commute durations in Pennsboro are 30 to 34 minutes (105 commuters, 21.6%), 10 to 14 minutes (87 commuters, 17.9%), and 45 to 59 minutes (60 commuters, 12.4%).
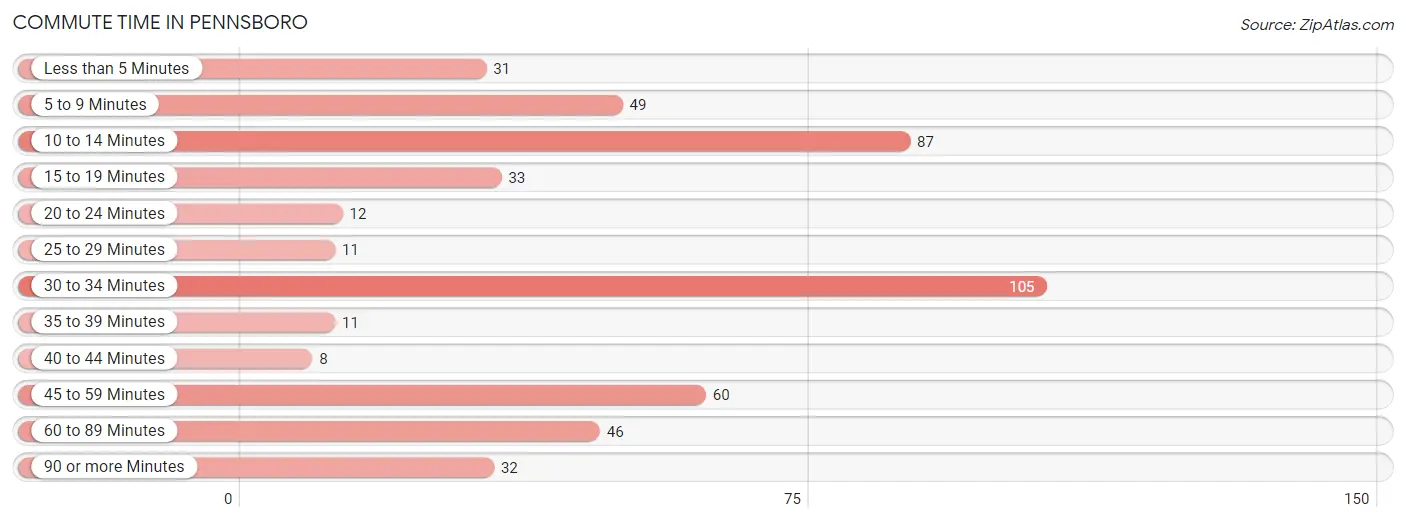
| Commute Time | # Commuters | % Commuters |
| Less than 5 Minutes | 31 | 6.4% |
| 5 to 9 Minutes | 49 | 10.1% |
| 10 to 14 Minutes | 87 | 17.9% |
| 15 to 19 Minutes | 33 | 6.8% |
| 20 to 24 Minutes | 12 | 2.5% |
| 25 to 29 Minutes | 11 | 2.3% |
| 30 to 34 Minutes | 105 | 21.6% |
| 35 to 39 Minutes | 11 | 2.3% |
| 40 to 44 Minutes | 8 | 1.7% |
| 45 to 59 Minutes | 60 | 12.4% |
| 60 to 89 Minutes | 46 | 9.5% |
| 90 or more Minutes | 32 | 6.6% |
Commute Time by Sex in Pennsboro
The most common commute times in Pennsboro are 10 to 14 minutes (55 commuters, 18.5%) for males and 30 to 34 minutes (56 commuters, 29.9%) for females.
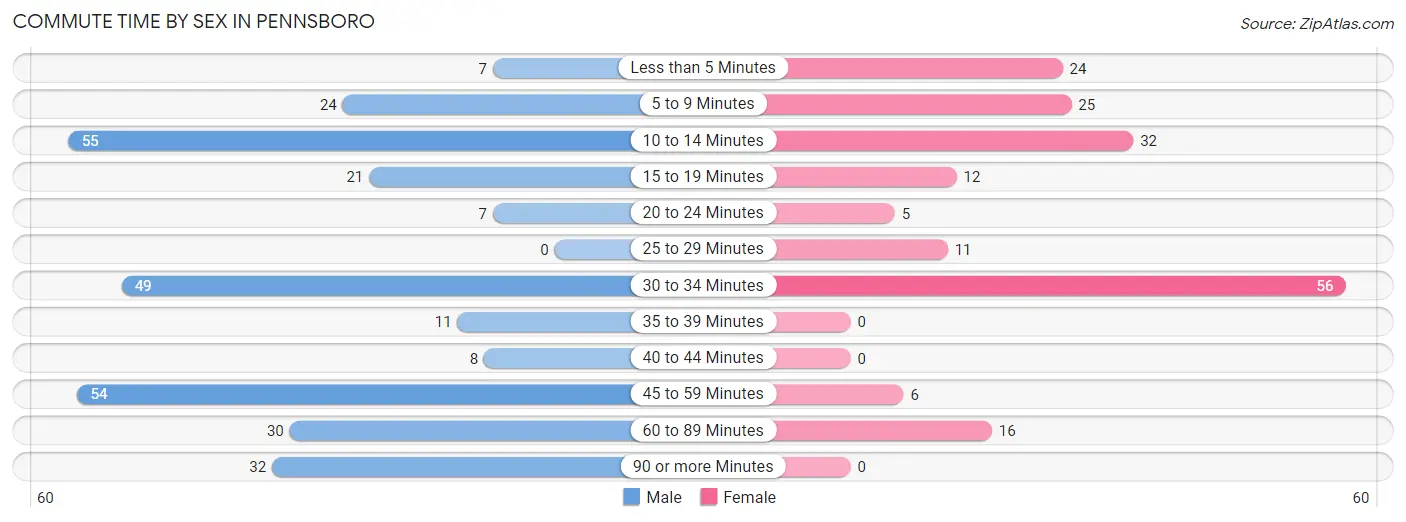
| Commute Time | Male | Female |
| Less than 5 Minutes | 7 (2.4%) | 24 (12.8%) |
| 5 to 9 Minutes | 24 (8.1%) | 25 (13.4%) |
| 10 to 14 Minutes | 55 (18.5%) | 32 (17.1%) |
| 15 to 19 Minutes | 21 (7.0%) | 12 (6.4%) |
| 20 to 24 Minutes | 7 (2.4%) | 5 (2.7%) |
| 25 to 29 Minutes | 0 (0.0%) | 11 (5.9%) |
| 30 to 34 Minutes | 49 (16.4%) | 56 (29.9%) |
| 35 to 39 Minutes | 11 (3.7%) | 0 (0.0%) |
| 40 to 44 Minutes | 8 (2.7%) | 0 (0.0%) |
| 45 to 59 Minutes | 54 (18.1%) | 6 (3.2%) |
| 60 to 89 Minutes | 30 (10.1%) | 16 (8.6%) |
| 90 or more Minutes | 32 (10.7%) | 0 (0.0%) |
Time of Departure to Work by Sex in Pennsboro
The most frequent times of departure to work in Pennsboro are 6:30 AM to 6:59 AM (63, 21.1%) for males and 6:00 AM to 6:29 AM (69, 36.9%) for females.
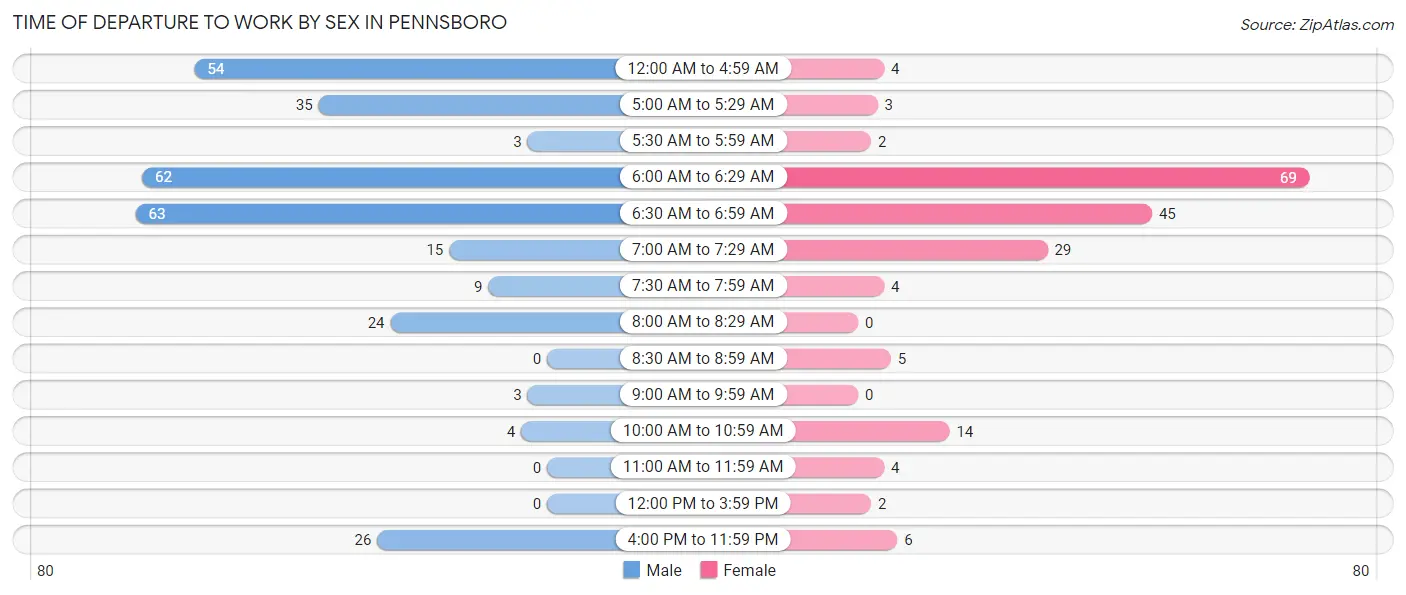
| Time of Departure | Male | Female |
| 12:00 AM to 4:59 AM | 54 (18.1%) | 4 (2.1%) |
| 5:00 AM to 5:29 AM | 35 (11.7%) | 3 (1.6%) |
| 5:30 AM to 5:59 AM | 3 (1.0%) | 2 (1.1%) |
| 6:00 AM to 6:29 AM | 62 (20.8%) | 69 (36.9%) |
| 6:30 AM to 6:59 AM | 63 (21.1%) | 45 (24.1%) |
| 7:00 AM to 7:29 AM | 15 (5.0%) | 29 (15.5%) |
| 7:30 AM to 7:59 AM | 9 (3.0%) | 4 (2.1%) |
| 8:00 AM to 8:29 AM | 24 (8.1%) | 0 (0.0%) |
| 8:30 AM to 8:59 AM | 0 (0.0%) | 5 (2.7%) |
| 9:00 AM to 9:59 AM | 3 (1.0%) | 0 (0.0%) |
| 10:00 AM to 10:59 AM | 4 (1.3%) | 14 (7.5%) |
| 11:00 AM to 11:59 AM | 0 (0.0%) | 4 (2.1%) |
| 12:00 PM to 3:59 PM | 0 (0.0%) | 2 (1.1%) |
| 4:00 PM to 11:59 PM | 26 (8.7%) | 6 (3.2%) |
| Total | 298 (100.0%) | 187 (100.0%) |
Housing Occupancy in Pennsboro
Occupancy by Ownership in Pennsboro
Of the total 466 dwellings in Pennsboro, owner-occupied units account for 371 (79.6%), while renter-occupied units make up 95 (20.4%).
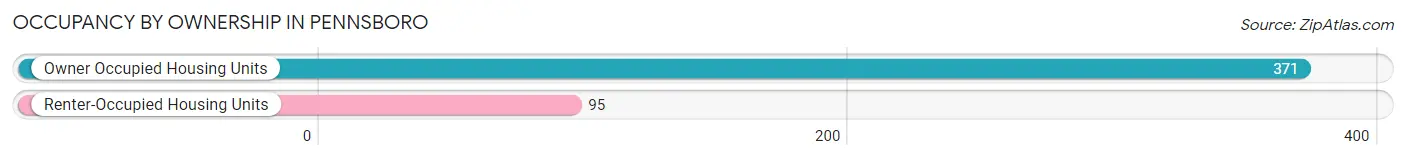
| Occupancy | # Housing Units | % Housing Units |
| Owner Occupied Housing Units | 371 | 79.6% |
| Renter-Occupied Housing Units | 95 | 20.4% |
| Total Occupied Housing Units | 466 | 100.0% |
Occupancy by Household Size in Pennsboro
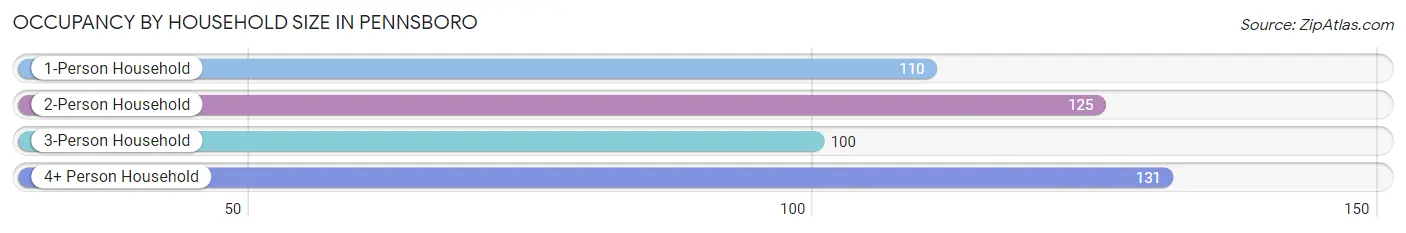
| Household Size | # Housing Units | % Housing Units |
| 1-Person Household | 110 | 23.6% |
| 2-Person Household | 125 | 26.8% |
| 3-Person Household | 100 | 21.5% |
| 4+ Person Household | 131 | 28.1% |
| Total Housing Units | 466 | 100.0% |
Occupancy by Ownership by Household Size in Pennsboro
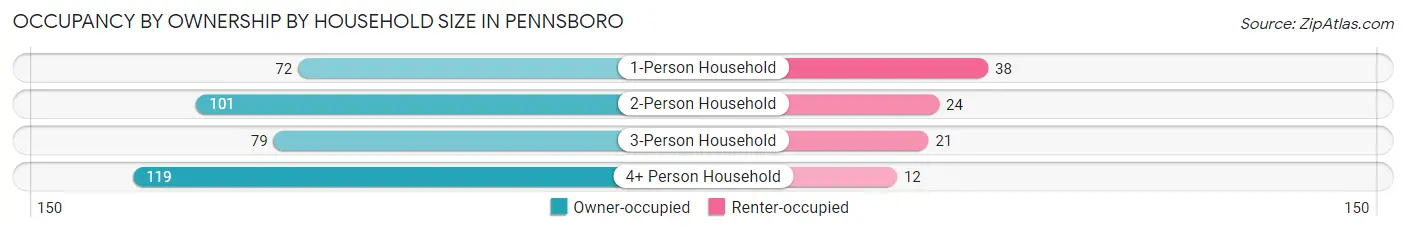
| Household Size | Owner-occupied | Renter-occupied |
| 1-Person Household | 72 (65.4%) | 38 (34.5%) |
| 2-Person Household | 101 (80.8%) | 24 (19.2%) |
| 3-Person Household | 79 (79.0%) | 21 (21.0%) |
| 4+ Person Household | 119 (90.8%) | 12 (9.2%) |
| Total Housing Units | 371 (79.6%) | 95 (20.4%) |
Occupancy by Educational Attainment in Pennsboro
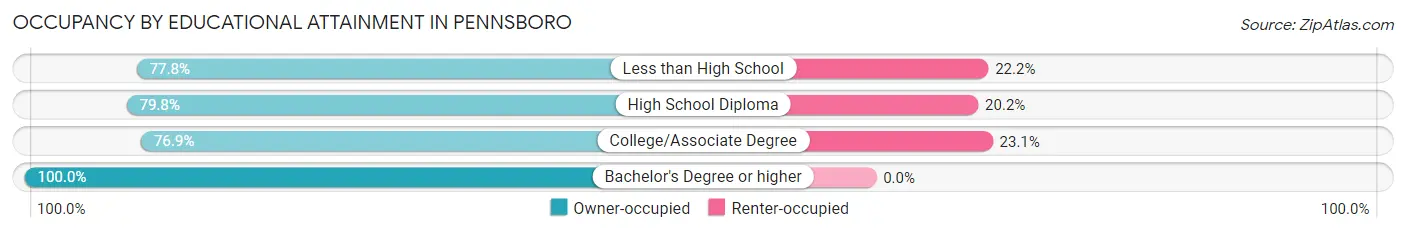
| Household Size | Owner-occupied | Renter-occupied |
| Less than High School | 112 (77.8%) | 32 (22.2%) |
| High School Diploma | 142 (79.8%) | 36 (20.2%) |
| College/Associate Degree | 90 (76.9%) | 27 (23.1%) |
| Bachelor's Degree or higher | 27 (100.0%) | 0 (0.0%) |
Occupancy by Age of Householder in Pennsboro
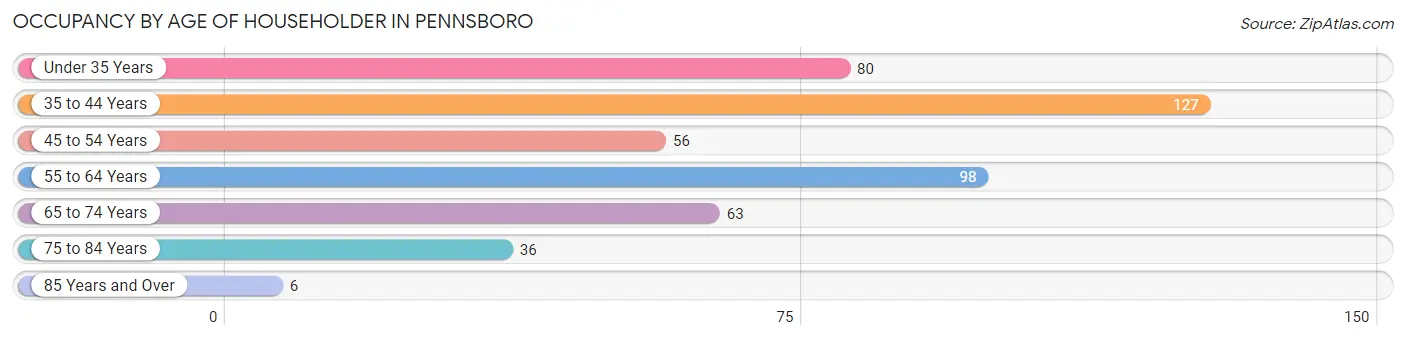
| Age Bracket | # Households | % Households |
| Under 35 Years | 80 | 17.2% |
| 35 to 44 Years | 127 | 27.3% |
| 45 to 54 Years | 56 | 12.0% |
| 55 to 64 Years | 98 | 21.0% |
| 65 to 74 Years | 63 | 13.5% |
| 75 to 84 Years | 36 | 7.7% |
| 85 Years and Over | 6 | 1.3% |
| Total | 466 | 100.0% |
Housing Finances in Pennsboro
Median Income by Occupancy in Pennsboro
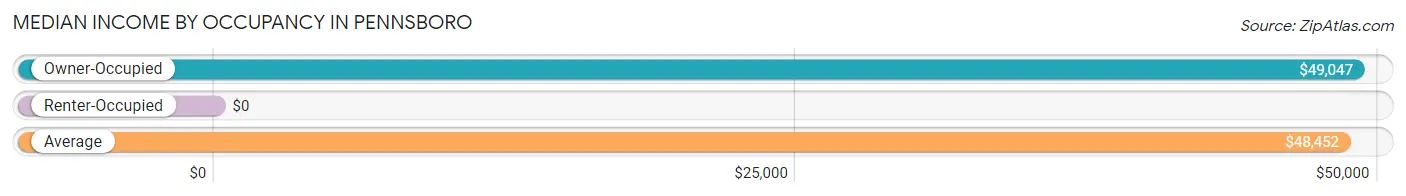
| Occupancy Type | # Households | Median Income |
| Owner-Occupied | 371 (79.6%) | $49,047 |
| Renter-Occupied | 95 (20.4%) | $0 |
| Average | 466 (100.0%) | $48,452 |
Occupancy by Householder Income Bracket in Pennsboro
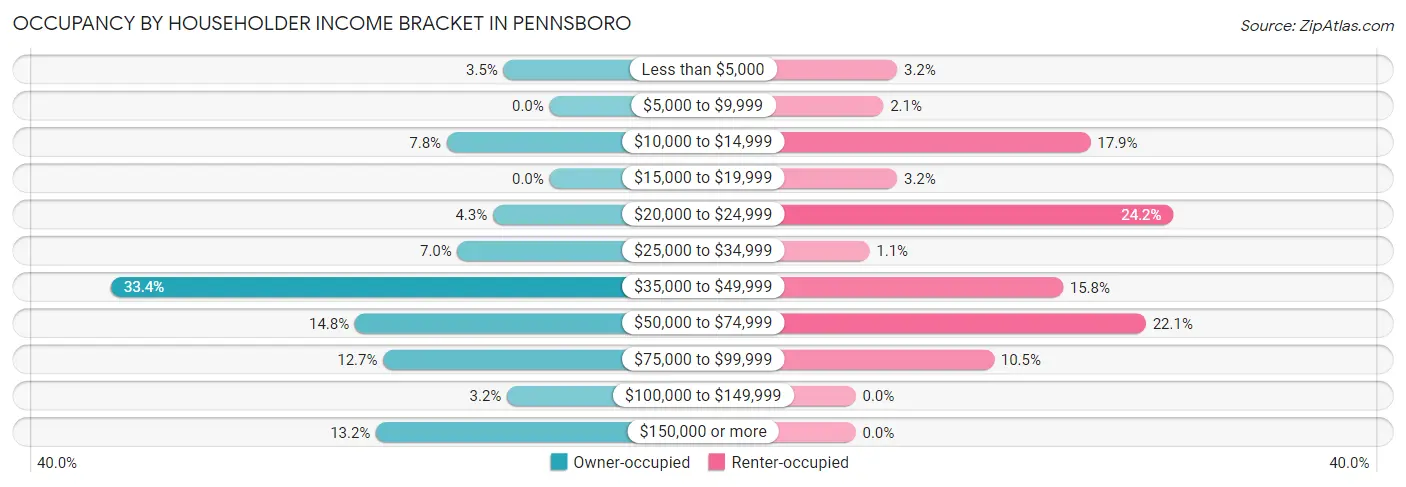
| Income Bracket | Owner-occupied | Renter-occupied |
| Less than $5,000 | 13 (3.5%) | 3 (3.2%) |
| $5,000 to $9,999 | 0 (0.0%) | 2 (2.1%) |
| $10,000 to $14,999 | 29 (7.8%) | 17 (17.9%) |
| $15,000 to $19,999 | 0 (0.0%) | 3 (3.2%) |
| $20,000 to $24,999 | 16 (4.3%) | 23 (24.2%) |
| $25,000 to $34,999 | 26 (7.0%) | 1 (1.1%) |
| $35,000 to $49,999 | 124 (33.4%) | 15 (15.8%) |
| $50,000 to $74,999 | 55 (14.8%) | 21 (22.1%) |
| $75,000 to $99,999 | 47 (12.7%) | 10 (10.5%) |
| $100,000 to $149,999 | 12 (3.2%) | 0 (0.0%) |
| $150,000 or more | 49 (13.2%) | 0 (0.0%) |
| Total | 371 (100.0%) | 95 (100.0%) |
Monthly Housing Cost Tiers in Pennsboro
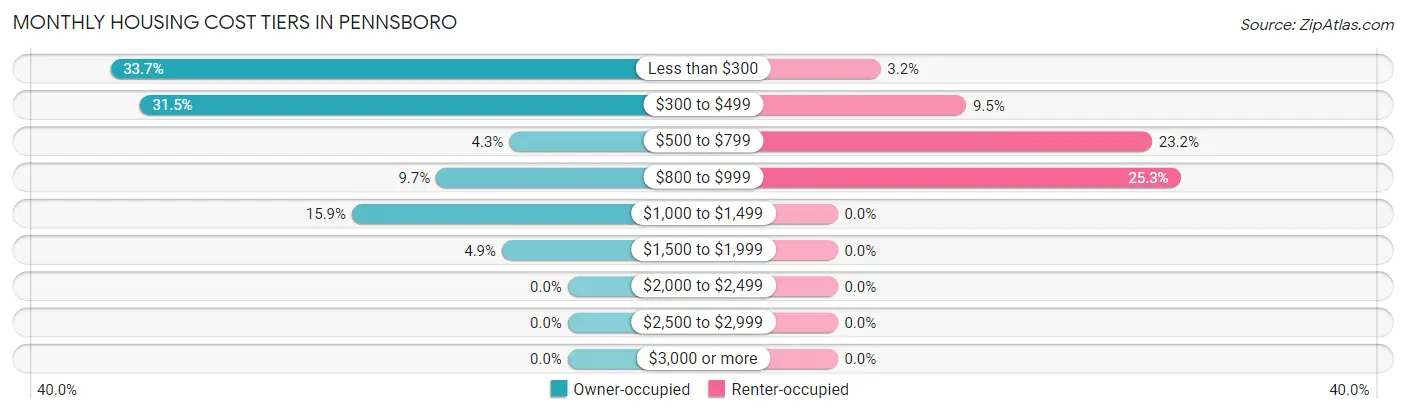
| Monthly Cost | Owner-occupied | Renter-occupied |
| Less than $300 | 125 (33.7%) | 3 (3.2%) |
| $300 to $499 | 117 (31.5%) | 9 (9.5%) |
| $500 to $799 | 16 (4.3%) | 22 (23.2%) |
| $800 to $999 | 36 (9.7%) | 24 (25.3%) |
| $1,000 to $1,499 | 59 (15.9%) | 0 (0.0%) |
| $1,500 to $1,999 | 18 (4.9%) | 0 (0.0%) |
| $2,000 to $2,499 | 0 (0.0%) | 0 (0.0%) |
| $2,500 to $2,999 | 0 (0.0%) | 0 (0.0%) |
| $3,000 or more | 0 (0.0%) | 0 (0.0%) |
| Total | 371 (100.0%) | 95 (100.0%) |
Physical Housing Characteristics in Pennsboro
Housing Structures in Pennsboro
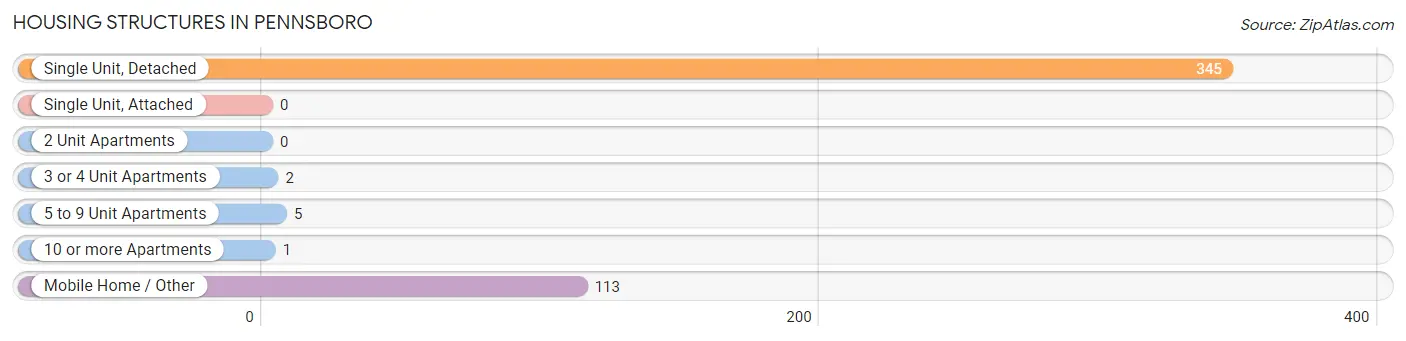
| Structure Type | # Housing Units | % Housing Units |
| Single Unit, Detached | 345 | 74.0% |
| Single Unit, Attached | 0 | 0.0% |
| 2 Unit Apartments | 0 | 0.0% |
| 3 or 4 Unit Apartments | 2 | 0.4% |
| 5 to 9 Unit Apartments | 5 | 1.1% |
| 10 or more Apartments | 1 | 0.2% |
| Mobile Home / Other | 113 | 24.2% |
| Total | 466 | 100.0% |
Housing Structures by Occupancy in Pennsboro
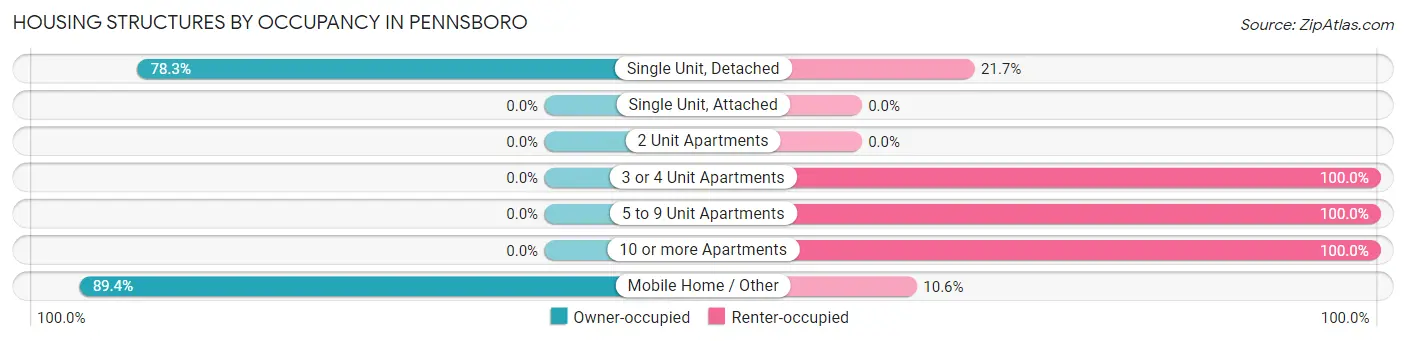
| Structure Type | Owner-occupied | Renter-occupied |
| Single Unit, Detached | 270 (78.3%) | 75 (21.7%) |
| Single Unit, Attached | 0 (0.0%) | 0 (0.0%) |
| 2 Unit Apartments | 0 (0.0%) | 0 (0.0%) |
| 3 or 4 Unit Apartments | 0 (0.0%) | 2 (100.0%) |
| 5 to 9 Unit Apartments | 0 (0.0%) | 5 (100.0%) |
| 10 or more Apartments | 0 (0.0%) | 1 (100.0%) |
| Mobile Home / Other | 101 (89.4%) | 12 (10.6%) |
| Total | 371 (79.6%) | 95 (20.4%) |
Housing Structures by Number of Rooms in Pennsboro
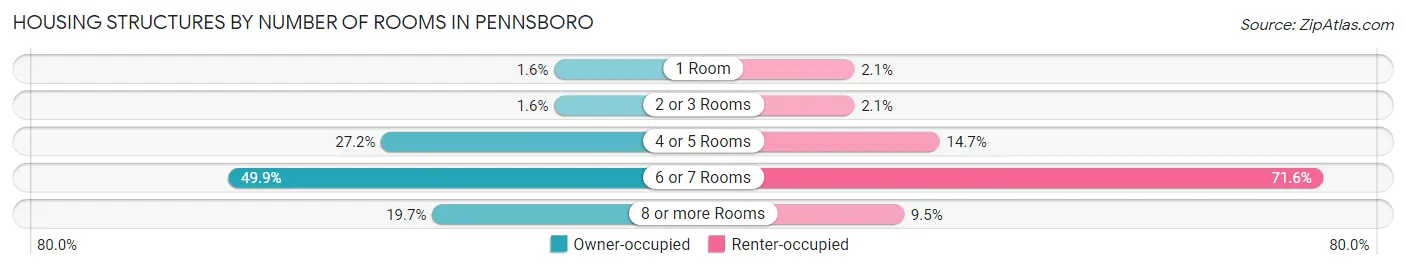
| Number of Rooms | Owner-occupied | Renter-occupied |
| 1 Room | 6 (1.6%) | 2 (2.1%) |
| 2 or 3 Rooms | 6 (1.6%) | 2 (2.1%) |
| 4 or 5 Rooms | 101 (27.2%) | 14 (14.7%) |
| 6 or 7 Rooms | 185 (49.9%) | 68 (71.6%) |
| 8 or more Rooms | 73 (19.7%) | 9 (9.5%) |
| Total | 371 (100.0%) | 95 (100.0%) |
Housing Structure by Heating Type in Pennsboro
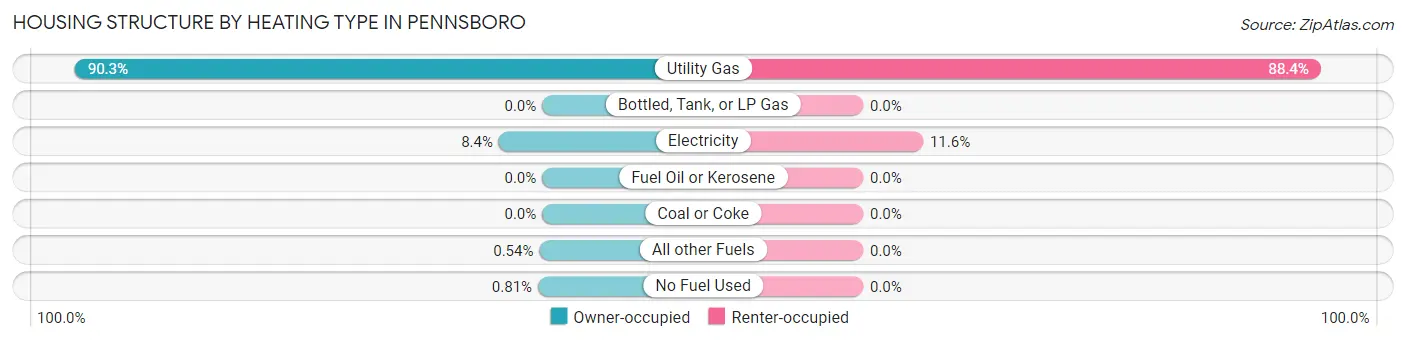
| Heating Type | Owner-occupied | Renter-occupied |
| Utility Gas | 335 (90.3%) | 84 (88.4%) |
| Bottled, Tank, or LP Gas | 0 (0.0%) | 0 (0.0%) |
| Electricity | 31 (8.4%) | 11 (11.6%) |
| Fuel Oil or Kerosene | 0 (0.0%) | 0 (0.0%) |
| Coal or Coke | 0 (0.0%) | 0 (0.0%) |
| All other Fuels | 2 (0.5%) | 0 (0.0%) |
| No Fuel Used | 3 (0.8%) | 0 (0.0%) |
| Total | 371 (100.0%) | 95 (100.0%) |
Household Vehicle Usage in Pennsboro
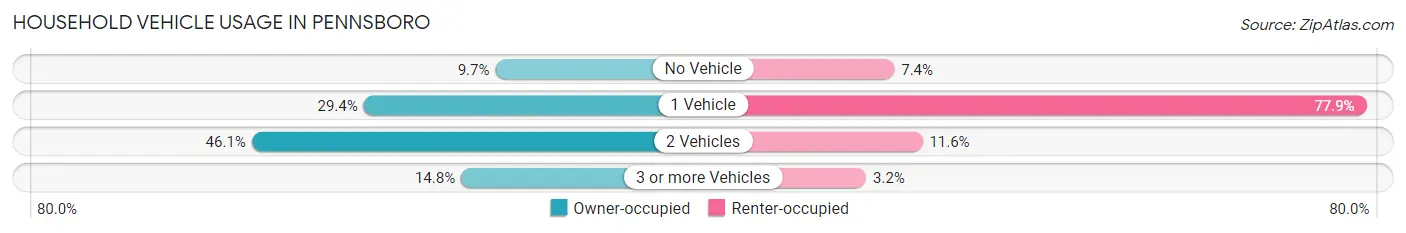
| Vehicles per Household | Owner-occupied | Renter-occupied |
| No Vehicle | 36 (9.7%) | 7 (7.4%) |
| 1 Vehicle | 109 (29.4%) | 74 (77.9%) |
| 2 Vehicles | 171 (46.1%) | 11 (11.6%) |
| 3 or more Vehicles | 55 (14.8%) | 3 (3.2%) |
| Total | 371 (100.0%) | 95 (100.0%) |
Real Estate & Mortgages in Pennsboro
Real Estate and Mortgage Overview in Pennsboro
| Characteristic | Without Mortgage | With Mortgage |
| Housing Units | 226 | 145 |
| Median Property Value | $33,800 | $86,000 |
| Median Household Income | $46,786 | $49 |
| Monthly Housing Costs | $278 | $0 |
| Real Estate Taxes | $396 | $0 |
Property Value by Mortgage Status in Pennsboro
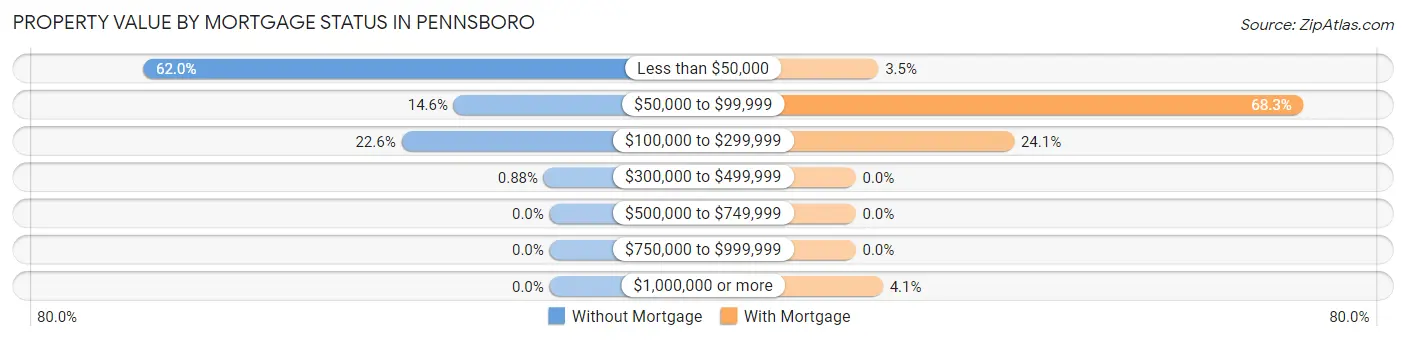
| Property Value | Without Mortgage | With Mortgage |
| Less than $50,000 | 140 (62.0%) | 5 (3.5%) |
| $50,000 to $99,999 | 33 (14.6%) | 99 (68.3%) |
| $100,000 to $299,999 | 51 (22.6%) | 35 (24.1%) |
| $300,000 to $499,999 | 2 (0.9%) | 0 (0.0%) |
| $500,000 to $749,999 | 0 (0.0%) | 0 (0.0%) |
| $750,000 to $999,999 | 0 (0.0%) | 0 (0.0%) |
| $1,000,000 or more | 0 (0.0%) | 6 (4.1%) |
| Total | 226 (100.0%) | 145 (100.0%) |
Household Income by Mortgage Status in Pennsboro
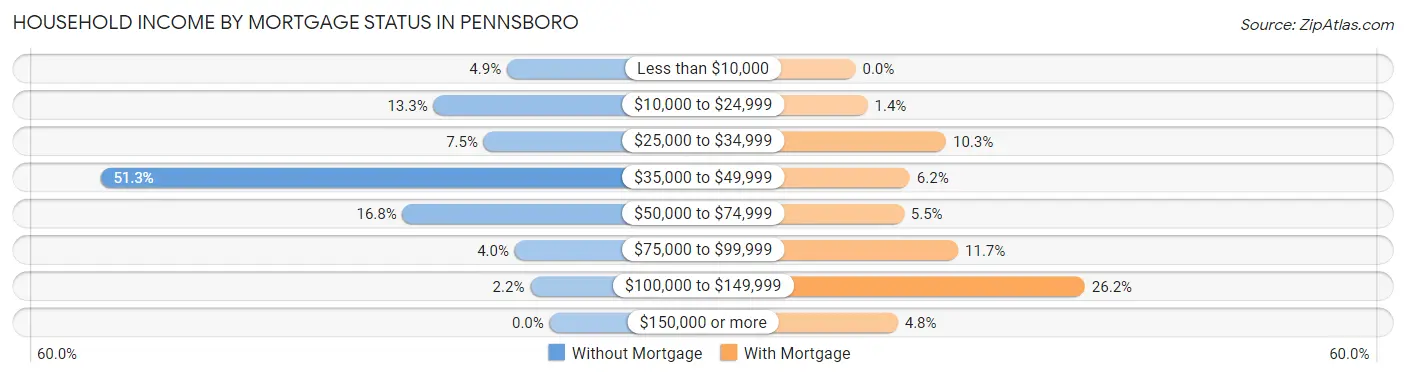
| Household Income | Without Mortgage | With Mortgage |
| Less than $10,000 | 11 (4.9%) | 0 (0.0%) |
| $10,000 to $24,999 | 30 (13.3%) | 2 (1.4%) |
| $25,000 to $34,999 | 17 (7.5%) | 15 (10.3%) |
| $35,000 to $49,999 | 116 (51.3%) | 9 (6.2%) |
| $50,000 to $74,999 | 38 (16.8%) | 8 (5.5%) |
| $75,000 to $99,999 | 9 (4.0%) | 17 (11.7%) |
| $100,000 to $149,999 | 5 (2.2%) | 38 (26.2%) |
| $150,000 or more | 0 (0.0%) | 7 (4.8%) |
| Total | 226 (100.0%) | 145 (100.0%) |
Property Value to Household Income Ratio in Pennsboro
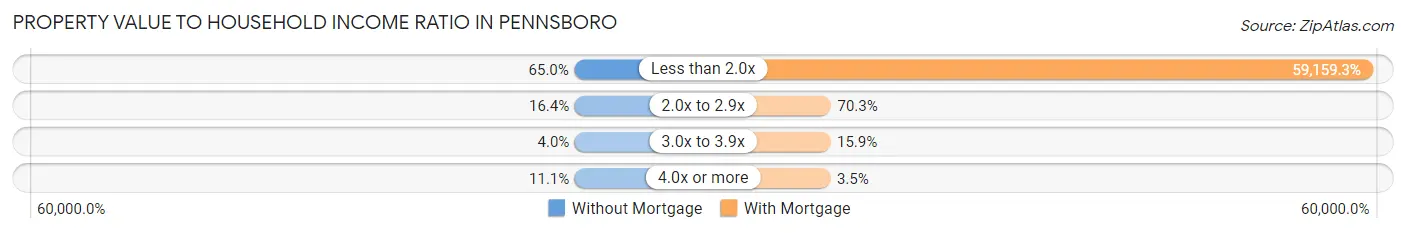
| Value-to-Income Ratio | Without Mortgage | With Mortgage |
| Less than 2.0x | 147 (65.0%) | 85,781 (59,159.3%) |
| 2.0x to 2.9x | 37 (16.4%) | 102 (70.3%) |
| 3.0x to 3.9x | 9 (4.0%) | 23 (15.9%) |
| 4.0x or more | 25 (11.1%) | 5 (3.5%) |
| Total | 226 (100.0%) | 145 (100.0%) |
Real Estate Taxes by Mortgage Status in Pennsboro
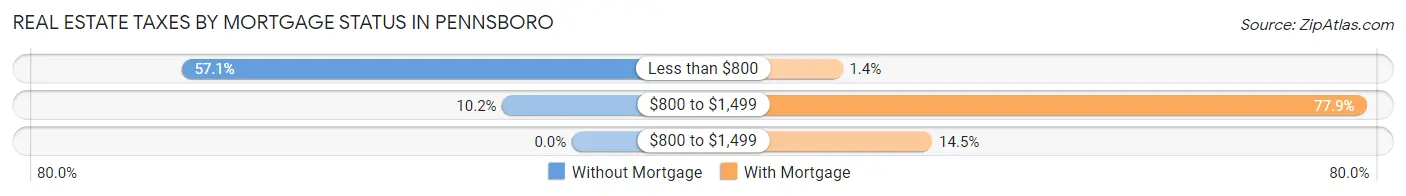
| Property Taxes | Without Mortgage | With Mortgage |
| Less than $800 | 129 (57.1%) | 2 (1.4%) |
| $800 to $1,499 | 23 (10.2%) | 113 (77.9%) |
| $800 to $1,499 | 0 (0.0%) | 21 (14.5%) |
| Total | 226 (100.0%) | 145 (100.0%) |
Health & Disability in Pennsboro
Health Insurance Coverage by Age in Pennsboro
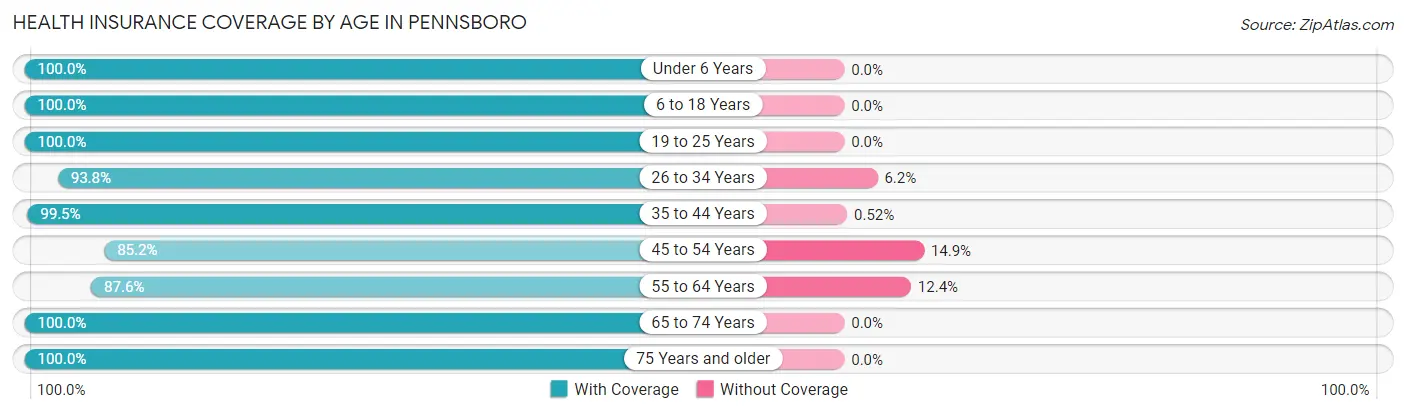
| Age Bracket | With Coverage | Without Coverage |
| Under 6 Years | 132 (100.0%) | 0 (0.0%) |
| 6 to 18 Years | 230 (100.0%) | 0 (0.0%) |
| 19 to 25 Years | 67 (100.0%) | 0 (0.0%) |
| 26 to 34 Years | 212 (93.8%) | 14 (6.2%) |
| 35 to 44 Years | 191 (99.5%) | 1 (0.5%) |
| 45 to 54 Years | 86 (85.2%) | 15 (14.8%) |
| 55 to 64 Years | 141 (87.6%) | 20 (12.4%) |
| 65 to 74 Years | 123 (100.0%) | 0 (0.0%) |
| 75 Years and older | 127 (100.0%) | 0 (0.0%) |
| Total | 1,309 (96.3%) | 50 (3.7%) |
Health Insurance Coverage by Citizenship Status in Pennsboro
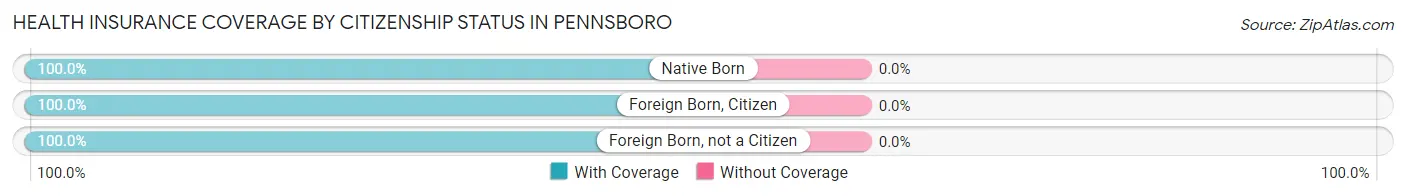
| Citizenship Status | With Coverage | Without Coverage |
| Native Born | 132 (100.0%) | 0 (0.0%) |
| Foreign Born, Citizen | 230 (100.0%) | 0 (0.0%) |
| Foreign Born, not a Citizen | 67 (100.0%) | 0 (0.0%) |
Health Insurance Coverage by Household Income in Pennsboro
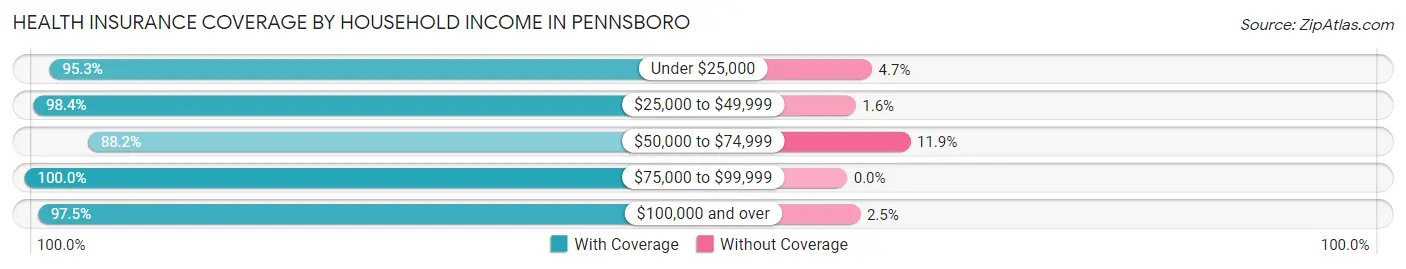
| Household Income | With Coverage | Without Coverage |
| Under $25,000 | 225 (95.3%) | 11 (4.7%) |
| $25,000 to $49,999 | 489 (98.4%) | 8 (1.6%) |
| $50,000 to $74,999 | 186 (88.1%) | 25 (11.8%) |
| $75,000 to $99,999 | 172 (100.0%) | 0 (0.0%) |
| $100,000 and over | 237 (97.5%) | 6 (2.5%) |
Public vs Private Health Insurance Coverage by Age in Pennsboro
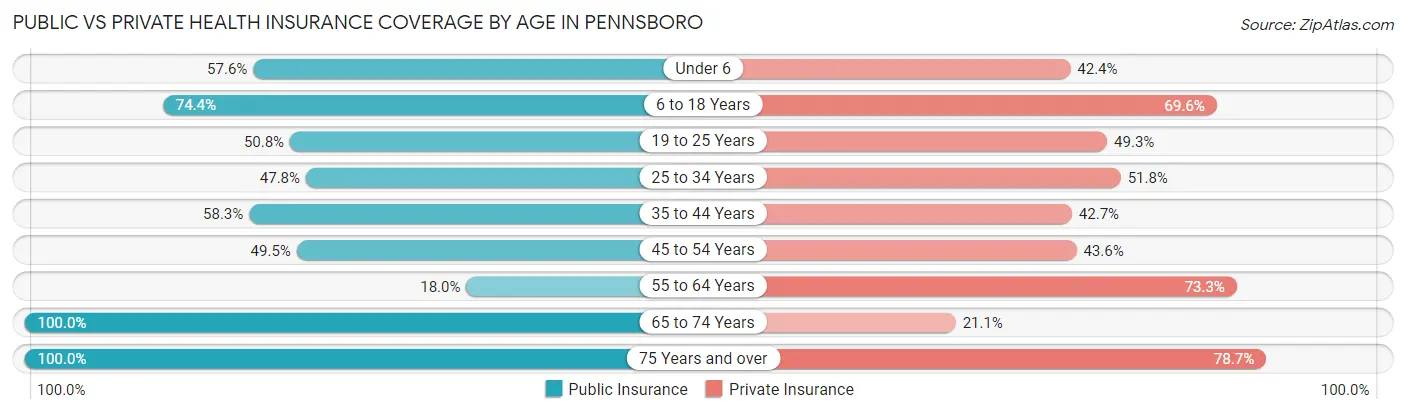
| Age Bracket | Public Insurance | Private Insurance |
| Under 6 | 76 (57.6%) | 56 (42.4%) |
| 6 to 18 Years | 171 (74.4%) | 160 (69.6%) |
| 19 to 25 Years | 34 (50.7%) | 33 (49.2%) |
| 25 to 34 Years | 108 (47.8%) | 117 (51.8%) |
| 35 to 44 Years | 112 (58.3%) | 82 (42.7%) |
| 45 to 54 Years | 50 (49.5%) | 44 (43.6%) |
| 55 to 64 Years | 29 (18.0%) | 118 (73.3%) |
| 65 to 74 Years | 123 (100.0%) | 26 (21.1%) |
| 75 Years and over | 127 (100.0%) | 100 (78.7%) |
| Total | 830 (61.1%) | 736 (54.2%) |
Disability Status by Sex by Age in Pennsboro
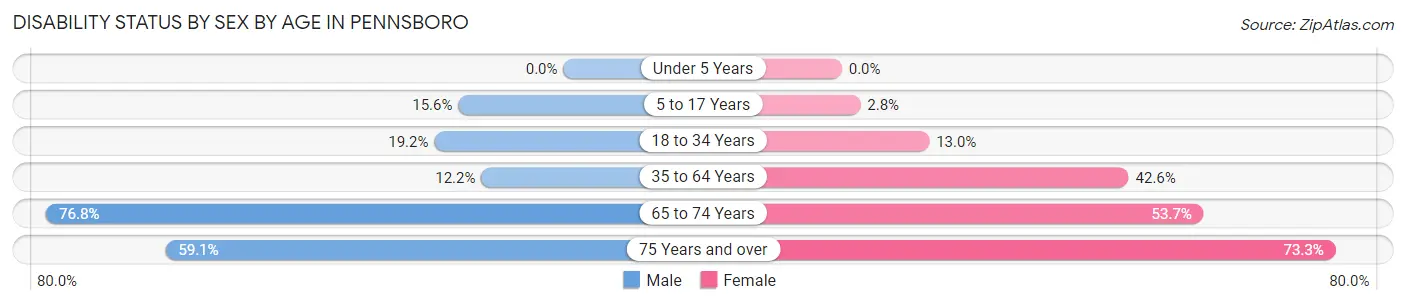
| Age Bracket | Male | Female |
| Under 5 Years | 0 (0.0%) | 0 (0.0%) |
| 5 to 17 Years | 17 (15.6%) | 4 (2.8%) |
| 18 to 34 Years | 32 (19.2%) | 17 (13.0%) |
| 35 to 64 Years | 29 (12.2%) | 92 (42.6%) |
| 65 to 74 Years | 43 (76.8%) | 36 (53.7%) |
| 75 Years and over | 13 (59.1%) | 77 (73.3%) |
Disability Class by Sex by Age in Pennsboro
Disability Class: Hearing Difficulty
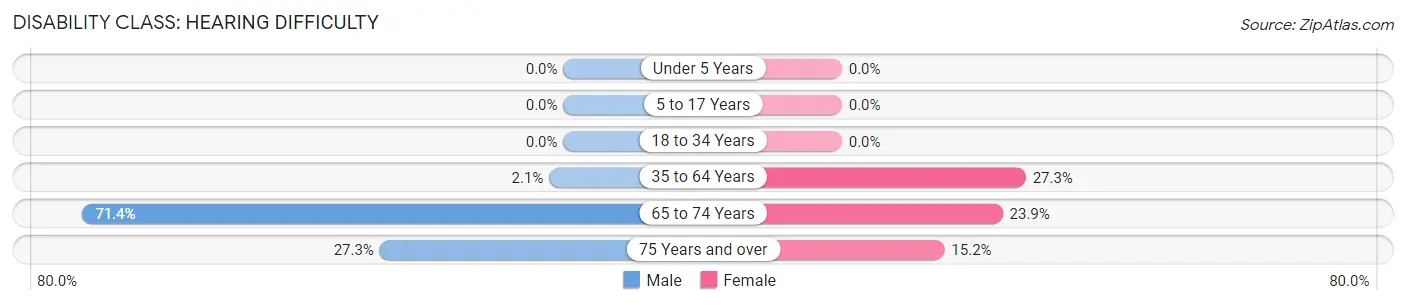
| Age Bracket | Male | Female |
| Under 5 Years | 0 (0.0%) | 0 (0.0%) |
| 5 to 17 Years | 0 (0.0%) | 0 (0.0%) |
| 18 to 34 Years | 0 (0.0%) | 0 (0.0%) |
| 35 to 64 Years | 5 (2.1%) | 59 (27.3%) |
| 65 to 74 Years | 40 (71.4%) | 16 (23.9%) |
| 75 Years and over | 6 (27.3%) | 16 (15.2%) |
Disability Class: Vision Difficulty
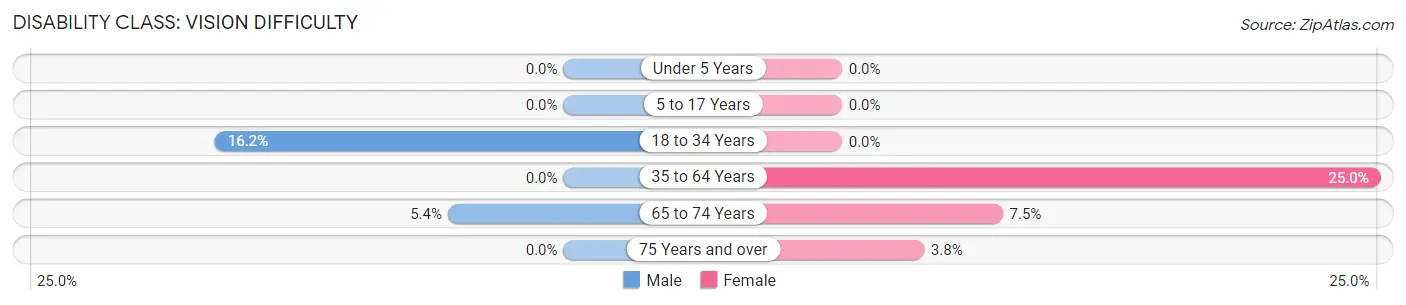
| Age Bracket | Male | Female |
| Under 5 Years | 0 (0.0%) | 0 (0.0%) |
| 5 to 17 Years | 0 (0.0%) | 0 (0.0%) |
| 18 to 34 Years | 27 (16.2%) | 0 (0.0%) |
| 35 to 64 Years | 0 (0.0%) | 54 (25.0%) |
| 65 to 74 Years | 3 (5.4%) | 5 (7.5%) |
| 75 Years and over | 0 (0.0%) | 4 (3.8%) |
Disability Class: Cognitive Difficulty
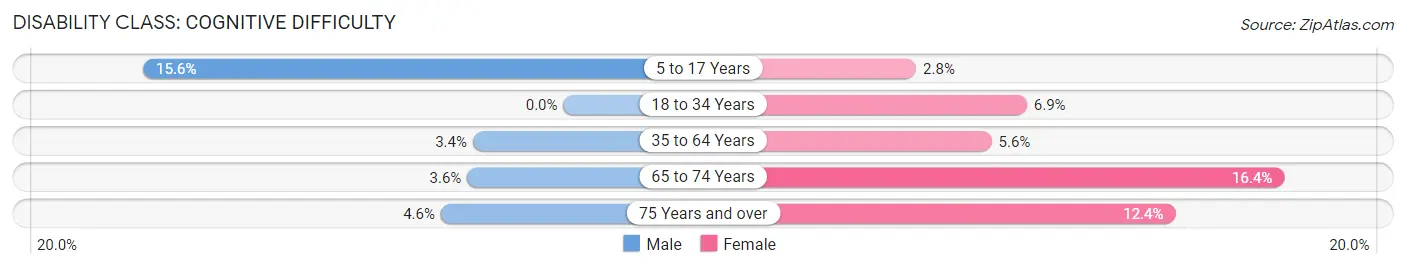
| Age Bracket | Male | Female |
| 5 to 17 Years | 17 (15.6%) | 4 (2.8%) |
| 18 to 34 Years | 0 (0.0%) | 9 (6.9%) |
| 35 to 64 Years | 8 (3.4%) | 12 (5.6%) |
| 65 to 74 Years | 2 (3.6%) | 11 (16.4%) |
| 75 Years and over | 1 (4.5%) | 13 (12.4%) |
Disability Class: Ambulatory Difficulty
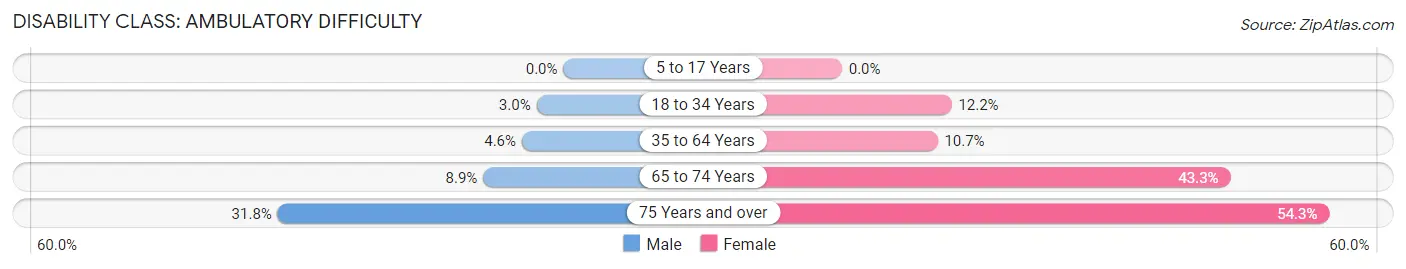
| Age Bracket | Male | Female |
| 5 to 17 Years | 0 (0.0%) | 0 (0.0%) |
| 18 to 34 Years | 5 (3.0%) | 16 (12.2%) |
| 35 to 64 Years | 11 (4.6%) | 23 (10.6%) |
| 65 to 74 Years | 5 (8.9%) | 29 (43.3%) |
| 75 Years and over | 7 (31.8%) | 57 (54.3%) |
Disability Class: Self-Care Difficulty
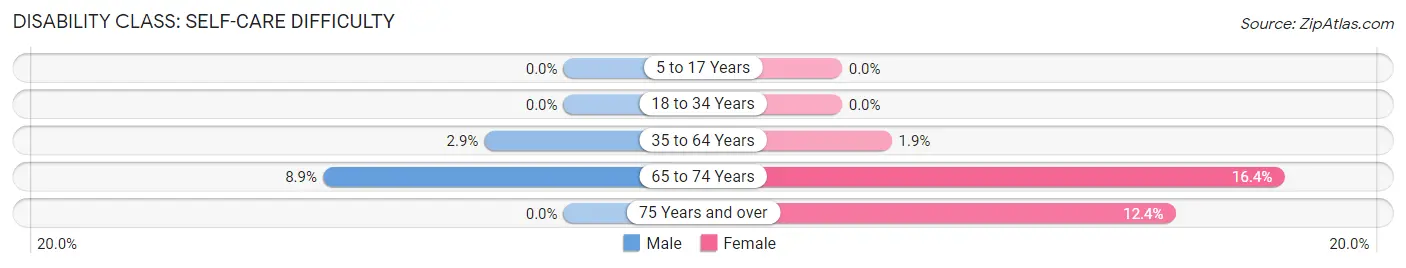
| Age Bracket | Male | Female |
| 5 to 17 Years | 0 (0.0%) | 0 (0.0%) |
| 18 to 34 Years | 0 (0.0%) | 0 (0.0%) |
| 35 to 64 Years | 7 (2.9%) | 4 (1.8%) |
| 65 to 74 Years | 5 (8.9%) | 11 (16.4%) |
| 75 Years and over | 0 (0.0%) | 13 (12.4%) |
Technology Access in Pennsboro
Computing Device Access in Pennsboro
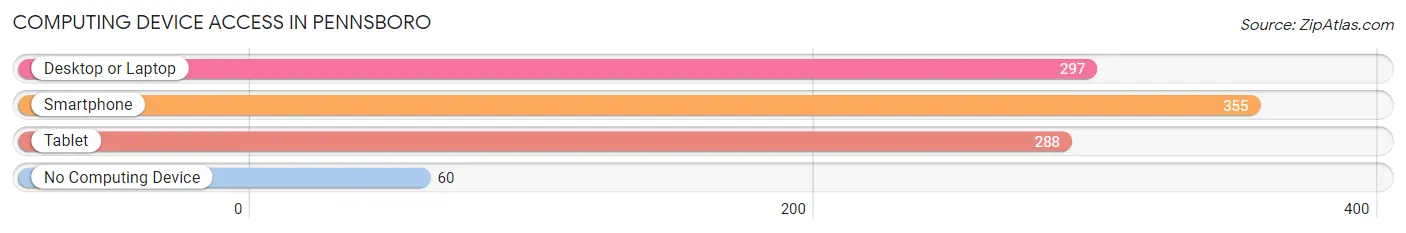
| Device Type | # Households | % Households |
| Desktop or Laptop | 297 | 63.7% |
| Smartphone | 355 | 76.2% |
| Tablet | 288 | 61.8% |
| No Computing Device | 60 | 12.9% |
| Total | 466 | 100.0% |
Internet Access in Pennsboro
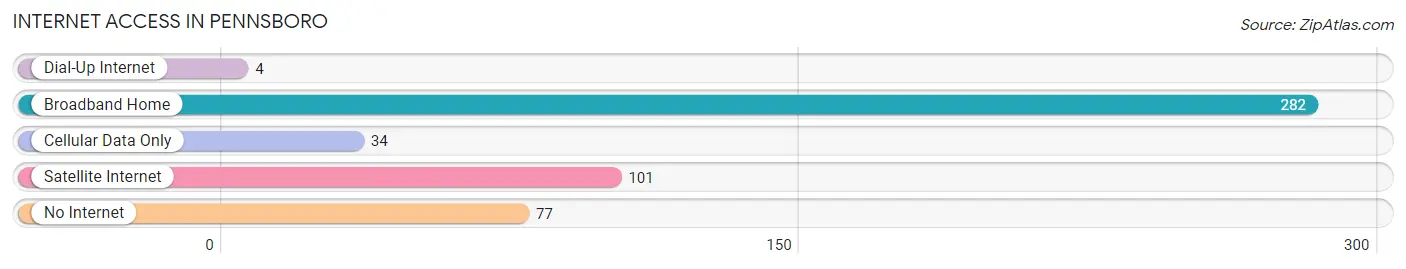
| Internet Type | # Households | % Households |
| Dial-Up Internet | 4 | 0.9% |
| Broadband Home | 282 | 60.5% |
| Cellular Data Only | 34 | 7.3% |
| Satellite Internet | 101 | 21.7% |
| No Internet | 77 | 16.5% |
| Total | 466 | 100.0% |
Pennsboro Summary
Pennsboro is a small town located in Ritchie County, West Virginia. It is situated in the Appalachian Mountains and is part of the Mid-Ohio Valley region. The town has a population of 1,845 people, according to the 2010 census.
History
Pennsboro was founded in 1817 by William Penn, a Revolutionary War veteran. The town was named after him and was originally known as Pennsborough. The town was incorporated in 1832 and was the county seat of Ritchie County until 1845.
The town was an important stop on the Northwestern Turnpike, which connected the Ohio River to the Potomac River. The turnpike was a major route for settlers heading west and for goods being transported between the two rivers.
The town was also an important stop on the Baltimore and Ohio Railroad, which connected the east coast to the Midwest. The railroad was a major factor in the growth of the town and the surrounding area.
Geography
Pennsboro is located in the Appalachian Mountains in the Mid-Ohio Valley region of West Virginia. The town is situated on the banks of the Little Kanawha River. The town is surrounded by rolling hills and forests.
The climate in Pennsboro is humid continental, with hot summers and cold winters. The average annual temperature is 54°F (12°C). The average annual precipitation is 40 inches (101 cm).
Economy
The economy of Pennsboro is largely based on agriculture and tourism. The town is home to several farms, which produce a variety of crops, including corn, soybeans, hay, and wheat.
The town is also home to several small businesses, including restaurants, shops, and services. The town is a popular destination for tourists, who come to enjoy the natural beauty of the area.
Demographics
According to the 2010 census, the population of Pennsboro was 1,845. The racial makeup of the town was 97.3% White, 0.7% African American, 0.2% Native American, 0.2% Asian, 0.1% Pacific Islander, 0.3% from other races, and 1.3% from two or more races.
The median household income in Pennsboro was $30,938, and the median family income was $37,813. The per capita income was $17,845. About 16.2% of the population was below the poverty line.
Conclusion
Pennsboro is a small town located in Ritchie County, West Virginia. It is situated in the Appalachian Mountains and is part of the Mid-Ohio Valley region. The town has a population of 1,845 people, according to the 2010 census. The economy of Pennsboro is largely based on agriculture and tourism. The town is home to several farms, which produce a variety of crops, and is a popular destination for tourists. The racial makeup of the town is 97.3% White, 0.7% African American, 0.2% Native American, 0.2% Asian, 0.1% Pacific Islander, 0.3% from other races, and 1.3% from two or more races. The median household income in Pennsboro was $30,938, and the median family income was $37,813. The per capita income was $17,845. About 16.2% of the population was below the poverty line.
Common Questions
What is Per Capita Income in Pennsboro?
Per Capita income in Pennsboro is $23,152.
What is the Median Family Income in Pennsboro?
Median Family Income in Pennsboro is $49,746.
What is the Median Household income in Pennsboro?
Median Household Income in Pennsboro is $48,452.
What is Income or Wage Gap in Pennsboro?
Income or Wage Gap in Pennsboro is 45.6%.
Women in Pennsboro earn 54.4 cents for every dollar earned by a man.
What is Inequality or Gini Index in Pennsboro?
Inequality or Gini Index in Pennsboro is 0.42.
What is the Total Population of Pennsboro?
Total Population of Pennsboro is 1,359.
What is the Total Male Population of Pennsboro?
Total Male Population of Pennsboro is 653.
What is the Total Female Population of Pennsboro?
Total Female Population of Pennsboro is 706.
What is the Ratio of Males per 100 Females in Pennsboro?
There are 92.49 Males per 100 Females in Pennsboro.
What is the Ratio of Females per 100 Males in Pennsboro?
There are 108.12 Females per 100 Males in Pennsboro.
What is the Median Population Age in Pennsboro?
Median Population Age in Pennsboro is 35.5 Years.
What is the Average Family Size in Pennsboro
Average Family Size in Pennsboro is 3.1 People.
What is the Average Household Size in Pennsboro
Average Household Size in Pennsboro is 2.9 People.
How Large is the Labor Force in Pennsboro?
There are 526 People in the Labor Forcein in Pennsboro.
What is the Percentage of People in the Labor Force in Pennsboro?
49.9% of People are in the Labor Force in Pennsboro.
What is the Unemployment Rate in Pennsboro?
Unemployment Rate in Pennsboro is 6.5%.