Beckley, WV Map & Demographics
Beckley Map
Beckley Overview
$29,877
PER CAPITA INCOME
$65,032
AVG FAMILY INCOME
$41,277
AVG HOUSEHOLD INCOME
28.8%
WAGE / INCOME GAP [ % ]
71.2¢/ $1
WAGE / INCOME GAP [ $ ]
$12,080
FAMILY INCOME DEFICIT
0.53
INEQUALITY / GINI INDEX
17,132
TOTAL POPULATION
8,507
MALE POPULATION
8,625
FEMALE POPULATION
98.63
MALES / 100 FEMALES
101.39
FEMALES / 100 MALES
40.7
MEDIAN AGE
3.0
AVG FAMILY SIZE
2.3
AVG HOUSEHOLD SIZE
7,009
LABOR FORCE [ PEOPLE ]
50.7%
PERCENT IN LABOR FORCE
4.7%
UNEMPLOYMENT RATE
Beckley Zip Codes
Income in Beckley
Income Overview in Beckley
Per Capita Income in Beckley is $29,877, while median incomes of families and households are $65,032 and $41,277 respectively.
| Characteristic | Number | Measure |
| Per Capita Income | 17,132 | $29,877 |
| Median Family Income | 4,009 | $65,032 |
| Mean Family Income | 4,009 | $85,845 |
| Median Household Income | 7,210 | $41,277 |
| Mean Household Income | 7,210 | $67,204 |
| Income Deficit | 4,009 | $12,080 |
| Wage / Income Gap (%) | 17,132 | 28.82% |
| Wage / Income Gap ($) | 17,132 | 71.18¢ per $1 |
| Gini / Inequality Index | 17,132 | 0.53 |
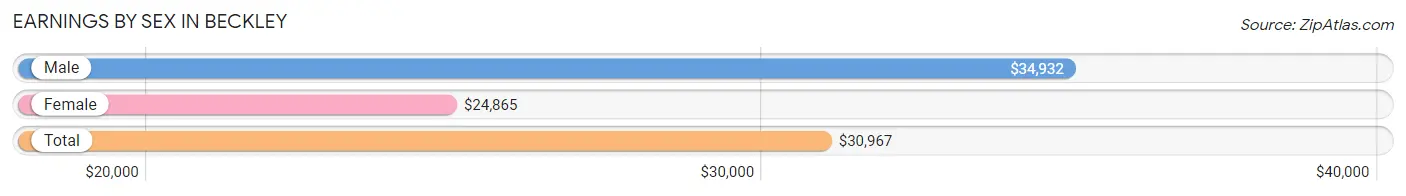
Earnings by Sex in Beckley
Average Earnings in Beckley are $30,967, $34,932 for men and $24,865 for women, a difference of 28.8%.
| Sex | Number | Average Earnings |
| Male | 3,786 (49.6%) | $34,932 |
| Female | 3,849 (50.4%) | $24,865 |
| Total | 7,635 (100.0%) | $30,967 |
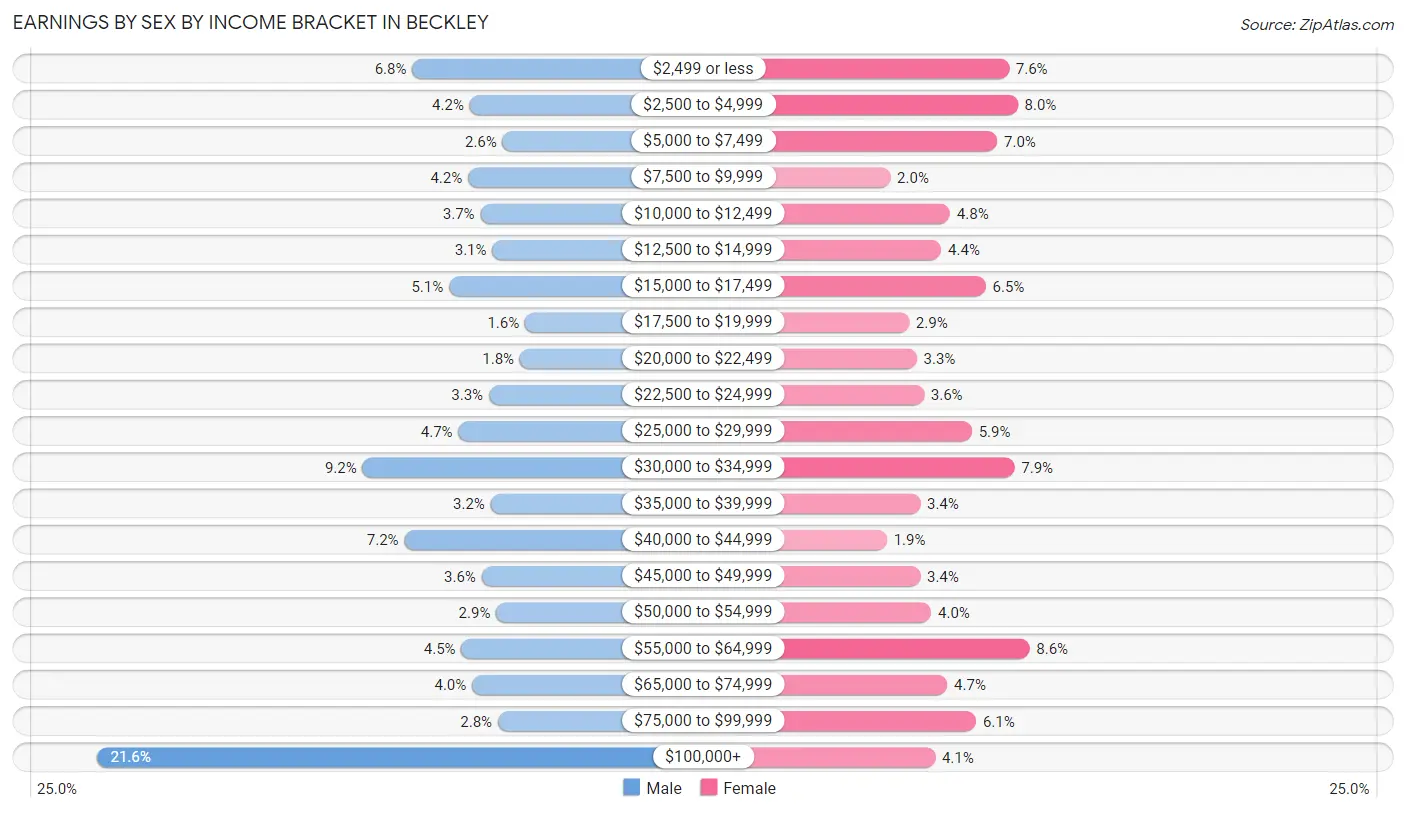
Earnings by Sex by Income Bracket in Beckley
The most common earnings brackets in Beckley are $100,000+ for men (817 | 21.6%) and $55,000 to $64,999 for women (329 | 8.6%).
| Income | Male | Female |
| $2,499 or less | 259 (6.8%) | 292 (7.6%) |
| $2,500 to $4,999 | 157 (4.2%) | 308 (8.0%) |
| $5,000 to $7,499 | 99 (2.6%) | 271 (7.0%) |
| $7,500 to $9,999 | 160 (4.2%) | 78 (2.0%) |
| $10,000 to $12,499 | 138 (3.6%) | 186 (4.8%) |
| $12,500 to $14,999 | 117 (3.1%) | 170 (4.4%) |
| $15,000 to $17,499 | 194 (5.1%) | 250 (6.5%) |
| $17,500 to $19,999 | 59 (1.6%) | 112 (2.9%) |
| $20,000 to $22,499 | 68 (1.8%) | 126 (3.3%) |
| $22,500 to $24,999 | 123 (3.3%) | 139 (3.6%) |
| $25,000 to $29,999 | 177 (4.7%) | 225 (5.9%) |
| $30,000 to $34,999 | 347 (9.2%) | 302 (7.9%) |
| $35,000 to $39,999 | 120 (3.2%) | 132 (3.4%) |
| $40,000 to $44,999 | 273 (7.2%) | 72 (1.9%) |
| $45,000 to $49,999 | 136 (3.6%) | 132 (3.4%) |
| $50,000 to $54,999 | 110 (2.9%) | 152 (4.0%) |
| $55,000 to $64,999 | 172 (4.5%) | 329 (8.6%) |
| $65,000 to $74,999 | 153 (4.0%) | 181 (4.7%) |
| $75,000 to $99,999 | 107 (2.8%) | 233 (6.0%) |
| $100,000+ | 817 (21.6%) | 159 (4.1%) |
| Total | 3,786 (100.0%) | 3,849 (100.0%) |
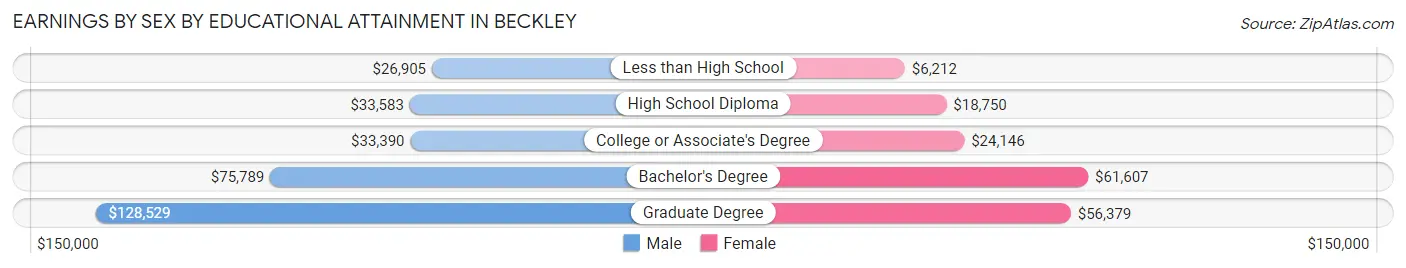
Earnings by Sex by Educational Attainment in Beckley
Average earnings in Beckley are $42,671 for men and $31,569 for women, a difference of 26.0%. Men with an educational attainment of graduate degree enjoy the highest average annual earnings of $128,529, while those with less than high school education earn the least with $26,905. Women with an educational attainment of bachelor's degree earn the most with the average annual earnings of $61,607, while those with less than high school education have the smallest earnings of $6,212.
| Educational Attainment | Male Income | Female Income |
| Less than High School | $26,905 | $6,212 |
| High School Diploma | $33,583 | $18,750 |
| College or Associate's Degree | $33,390 | $24,146 |
| Bachelor's Degree | $75,789 | $61,607 |
| Graduate Degree | $128,529 | $56,379 |
| Total | $42,671 | $31,569 |
Family Income in Beckley
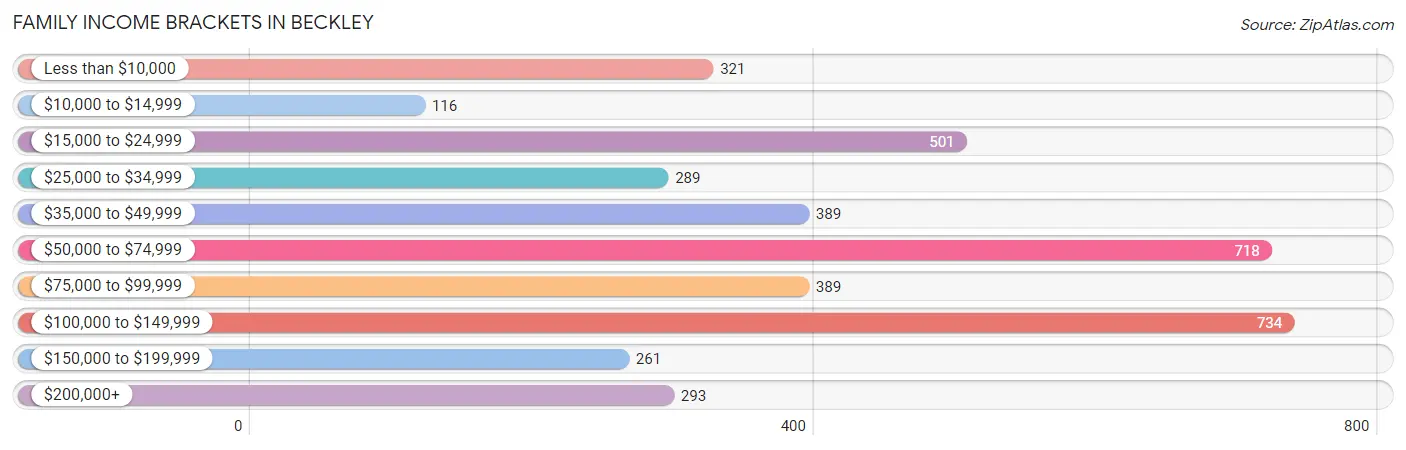
Family Income Brackets in Beckley
According to the Beckley family income data, there are 734 families falling into the $100,000 to $149,999 income range, which is the most common income bracket and makes up 18.3% of all families. Conversely, the $10,000 to $14,999 income bracket is the least frequent group with only 116 families (2.9%) belonging to this category.
| Income Bracket | # Families | % Families |
| Less than $10,000 | 321 | 8.0% |
| $10,000 to $14,999 | 116 | 2.9% |
| $15,000 to $24,999 | 501 | 12.5% |
| $25,000 to $34,999 | 289 | 7.2% |
| $35,000 to $49,999 | 389 | 9.7% |
| $50,000 to $74,999 | 718 | 17.9% |
| $75,000 to $99,999 | 389 | 9.7% |
| $100,000 to $149,999 | 734 | 18.3% |
| $150,000 to $199,999 | 261 | 6.5% |
| $200,000+ | 293 | 7.3% |
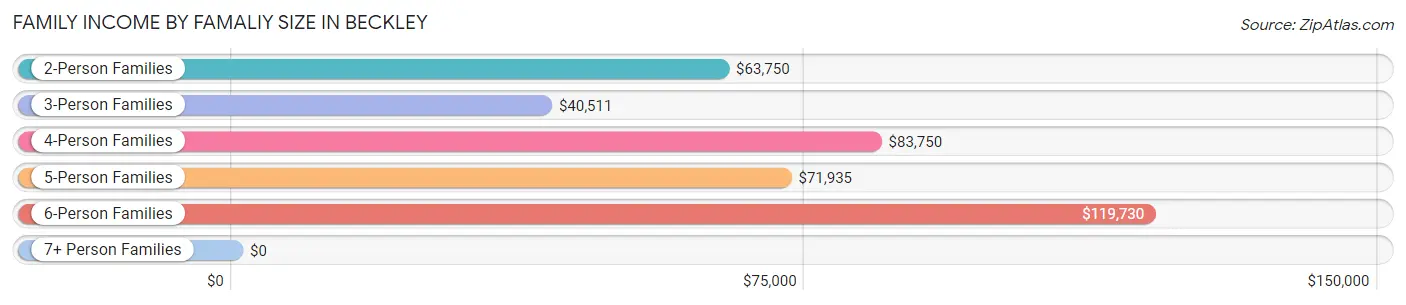
Family Income by Famaliy Size in Beckley
6-person families (97 | 2.4%) account for the highest median family income in Beckley with $119,730 per family, while 2-person families (2,019 | 50.4%) have the highest median income of $31,875 per family member.
| Income Bracket | # Families | Median Income |
| 2-Person Families | 2,019 (50.4%) | $63,750 |
| 3-Person Families | 889 (22.2%) | $40,511 |
| 4-Person Families | 795 (19.8%) | $83,750 |
| 5-Person Families | 205 (5.1%) | $71,935 |
| 6-Person Families | 97 (2.4%) | $119,730 |
| 7+ Person Families | 4 (0.1%) | $0 |
| Total | 4,009 (100.0%) | $65,032 |
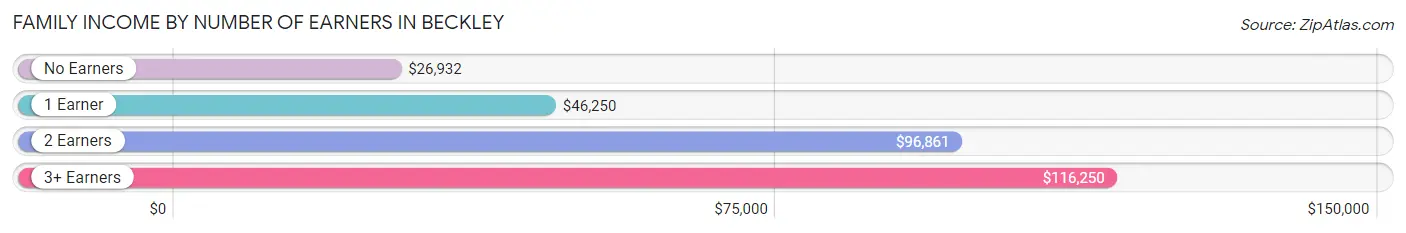
Family Income by Number of Earners in Beckley
The median family income in Beckley is $65,032, with families comprising 3+ earners (156) having the highest median family income of $116,250, while families with no earners (939) have the lowest median family income of $26,932, accounting for 3.9% and 23.4% of families, respectively.
| Number of Earners | # Families | Median Income |
| No Earners | 939 (23.4%) | $26,932 |
| 1 Earner | 1,499 (37.4%) | $46,250 |
| 2 Earners | 1,415 (35.3%) | $96,861 |
| 3+ Earners | 156 (3.9%) | $116,250 |
| Total | 4,009 (100.0%) | $65,032 |
Household Income in Beckley
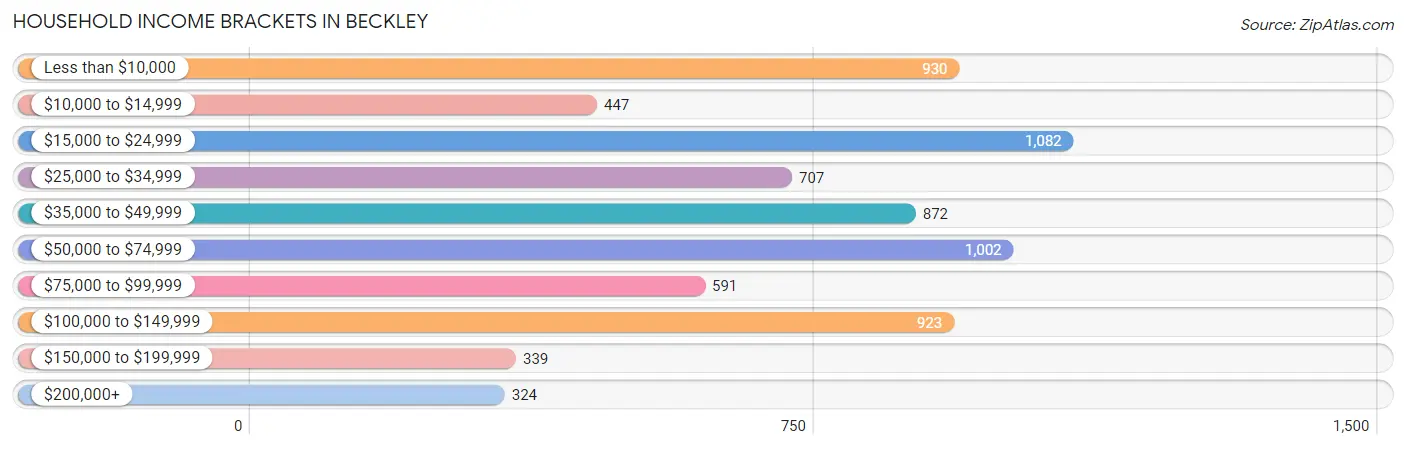
Household Income Brackets in Beckley
With 1,082 households falling in the category, the $15,000 to $24,999 income range is the most frequent in Beckley, accounting for 15.0% of all households. In contrast, only 324 households (4.5%) fall into the $200,000+ income bracket, making it the least populous group.
| Income Bracket | # Households | % Households |
| Less than $10,000 | 930 | 12.9% |
| $10,000 to $14,999 | 447 | 6.2% |
| $15,000 to $24,999 | 1,082 | 15.0% |
| $25,000 to $34,999 | 707 | 9.8% |
| $35,000 to $49,999 | 872 | 12.1% |
| $50,000 to $74,999 | 1,002 | 13.9% |
| $75,000 to $99,999 | 591 | 8.2% |
| $100,000 to $149,999 | 923 | 12.8% |
| $150,000 to $199,999 | 339 | 4.7% |
| $200,000+ | 324 | 4.5% |
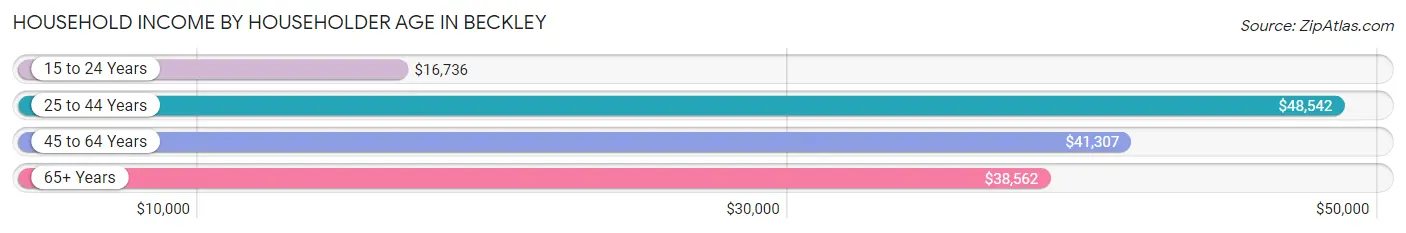
Household Income by Householder Age in Beckley
The median household income in Beckley is $41,277, with the highest median household income of $48,542 found in the 25 to 44 years age bracket for the primary householder. A total of 2,169 households (30.1%) fall into this category. Meanwhile, the 15 to 24 years age bracket for the primary householder has the lowest median household income of $16,736, with 211 households (2.9%) in this group.
| Income Bracket | # Households | Median Income |
| 15 to 24 Years | 211 (2.9%) | $16,736 |
| 25 to 44 Years | 2,169 (30.1%) | $48,542 |
| 45 to 64 Years | 2,412 (33.5%) | $41,307 |
| 65+ Years | 2,418 (33.5%) | $38,562 |
| Total | 7,210 (100.0%) | $41,277 |
Poverty in Beckley
Income Below Poverty by Sex and Age in Beckley
With 19.8% poverty level for males and 25.0% for females among the residents of Beckley, 16 and 17 year old males and 15 year old females are the most vulnerable to poverty, with 115 males (53.5%) and 141 females (86.0%) in their respective age groups living below the poverty level.
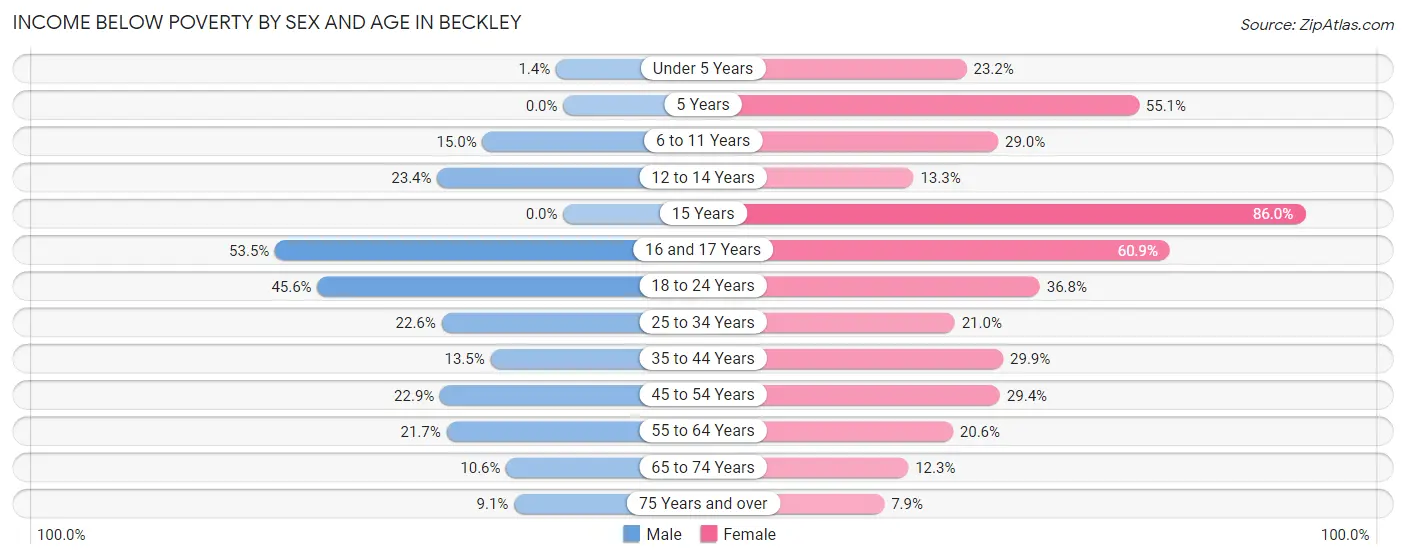
| Age Bracket | Male | Female |
| Under 5 Years | 5 (1.4%) | 91 (23.2%) |
| 5 Years | 0 (0.0%) | 59 (55.1%) |
| 6 to 11 Years | 114 (15.0%) | 156 (29.0%) |
| 12 to 14 Years | 80 (23.4%) | 33 (13.3%) |
| 15 Years | 0 (0.0%) | 141 (86.0%) |
| 16 and 17 Years | 115 (53.5%) | 126 (60.9%) |
| 18 to 24 Years | 340 (45.6%) | 226 (36.7%) |
| 25 to 34 Years | 289 (22.6%) | 174 (21.0%) |
| 35 to 44 Years | 117 (13.5%) | 356 (29.9%) |
| 45 to 54 Years | 150 (22.9%) | 263 (29.3%) |
| 55 to 64 Years | 217 (21.7%) | 261 (20.6%) |
| 65 to 74 Years | 122 (10.6%) | 152 (12.3%) |
| 75 Years and over | 41 (9.1%) | 55 (7.9%) |
| Total | 1,590 (19.8%) | 2,093 (25.0%) |
Income Above Poverty by Sex and Age in Beckley
According to the poverty statistics in Beckley, males aged 5 years and females aged 75 years and over are the age groups that are most secure financially, with 100.0% of males and 92.1% of females in these age groups living above the poverty line.
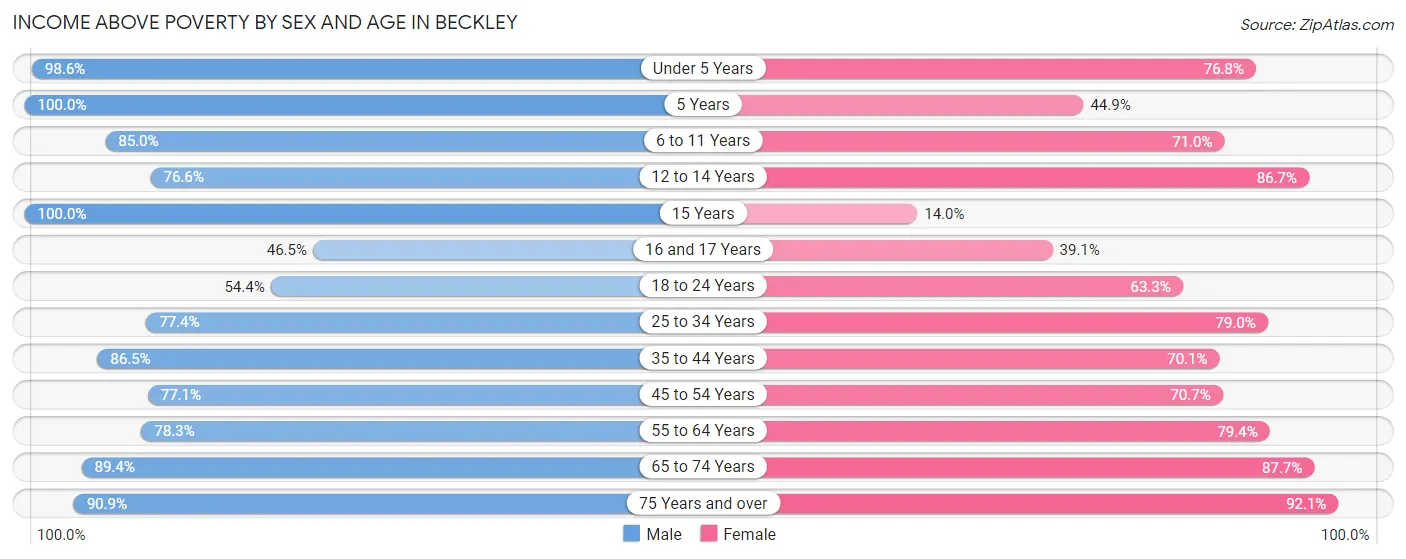
| Age Bracket | Male | Female |
| Under 5 Years | 363 (98.6%) | 302 (76.8%) |
| 5 Years | 64 (100.0%) | 48 (44.9%) |
| 6 to 11 Years | 646 (85.0%) | 382 (71.0%) |
| 12 to 14 Years | 262 (76.6%) | 215 (86.7%) |
| 15 Years | 135 (100.0%) | 23 (14.0%) |
| 16 and 17 Years | 100 (46.5%) | 81 (39.1%) |
| 18 to 24 Years | 405 (54.4%) | 389 (63.2%) |
| 25 to 34 Years | 990 (77.4%) | 656 (79.0%) |
| 35 to 44 Years | 749 (86.5%) | 833 (70.1%) |
| 45 to 54 Years | 506 (77.1%) | 633 (70.7%) |
| 55 to 64 Years | 784 (78.3%) | 1,005 (79.4%) |
| 65 to 74 Years | 1,031 (89.4%) | 1,081 (87.7%) |
| 75 Years and over | 408 (90.9%) | 644 (92.1%) |
| Total | 6,443 (80.2%) | 6,292 (75.0%) |
Income Below Poverty Among Married-Couple Families in Beckley
The poverty statistics for married-couple families in Beckley show that 2.4% or 57 of the total 2,395 families live below the poverty line. Families with no children have the highest poverty rate of 3.1%, comprising of 45 families. On the other hand, families with 3 or 4 children have the lowest poverty rate of 0.0%, which includes 0 families.
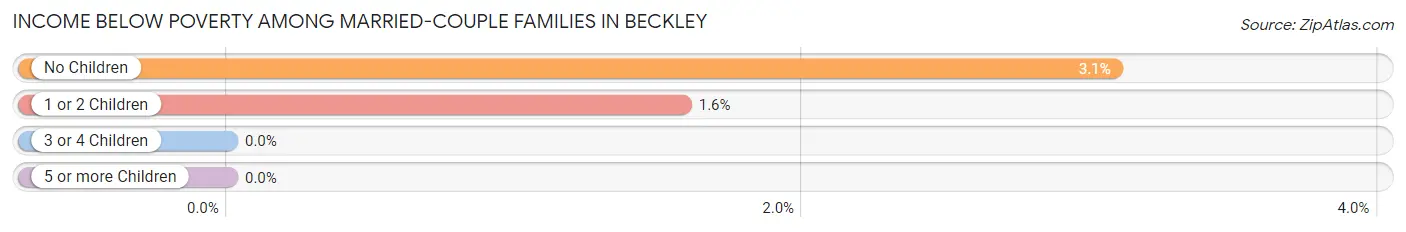
| Children | Above Poverty | Below Poverty |
| No Children | 1,417 (96.9%) | 45 (3.1%) |
| 1 or 2 Children | 746 (98.4%) | 12 (1.6%) |
| 3 or 4 Children | 175 (100.0%) | 0 (0.0%) |
| 5 or more Children | 0 (0.0%) | 0 (0.0%) |
| Total | 2,338 (97.6%) | 57 (2.4%) |
Income Below Poverty Among Single-Parent Households in Beckley
According to the poverty data in Beckley, 24.8% or 105 single-father households and 41.1% or 489 single-mother households are living below the poverty line. Among single-father households, those with 1 or 2 children have the highest poverty rate, with 99 households (49.0%) experiencing poverty. Likewise, among single-mother households, those with 1 or 2 children have the highest poverty rate, with 336 households (46.9%) falling below the poverty line.
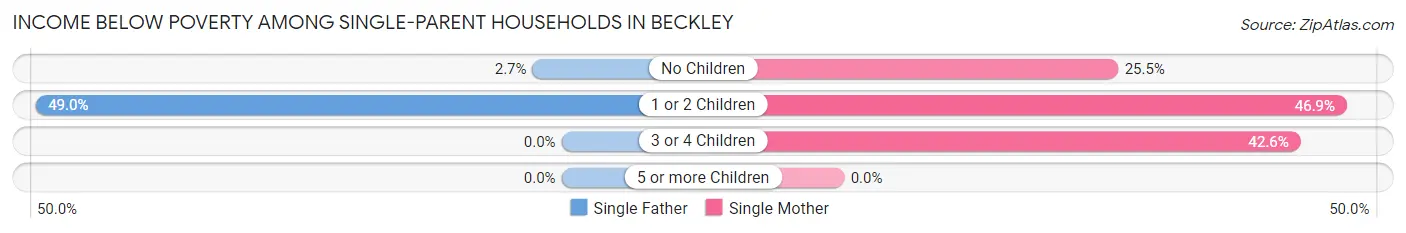
| Children | Single Father | Single Mother |
| No Children | 6 (2.7%) | 73 (25.5%) |
| 1 or 2 Children | 99 (49.0%) | 336 (46.9%) |
| 3 or 4 Children | 0 (0.0%) | 80 (42.5%) |
| 5 or more Children | 0 (0.0%) | 0 (0.0%) |
| Total | 105 (24.8%) | 489 (41.1%) |
Income Below Poverty Among Married-Couple vs Single-Parent Households in Beckley
The poverty data for Beckley shows that 57 of the married-couple family households (2.4%) and 594 of the single-parent households (36.8%) are living below the poverty level. Within the married-couple family households, those with no children have the highest poverty rate, with 45 households (3.1%) falling below the poverty line. Among the single-parent households, those with 1 or 2 children have the highest poverty rate, with 435 household (47.3%) living below poverty.
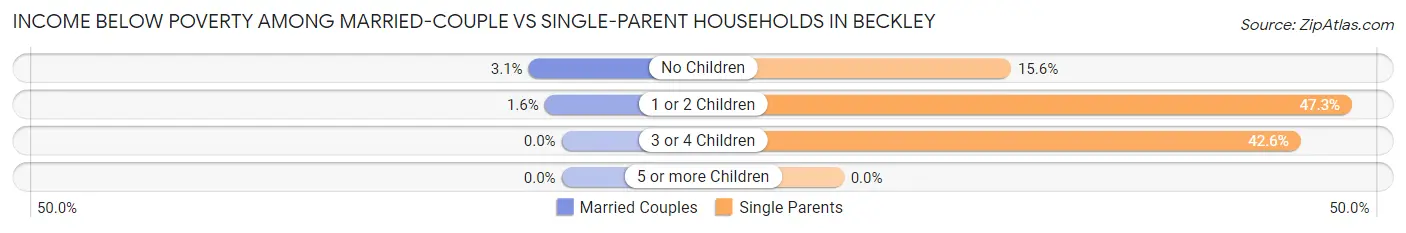
| Children | Married-Couple Families | Single-Parent Households |
| No Children | 45 (3.1%) | 79 (15.6%) |
| 1 or 2 Children | 12 (1.6%) | 435 (47.3%) |
| 3 or 4 Children | 0 (0.0%) | 80 (42.5%) |
| 5 or more Children | 0 (0.0%) | 0 (0.0%) |
| Total | 57 (2.4%) | 594 (36.8%) |
Race in Beckley
The most populous races in Beckley are White / Caucasian (12,602 | 73.6%), Black / African American (2,950 | 17.2%), and Two or more Races (1,192 | 7.0%).
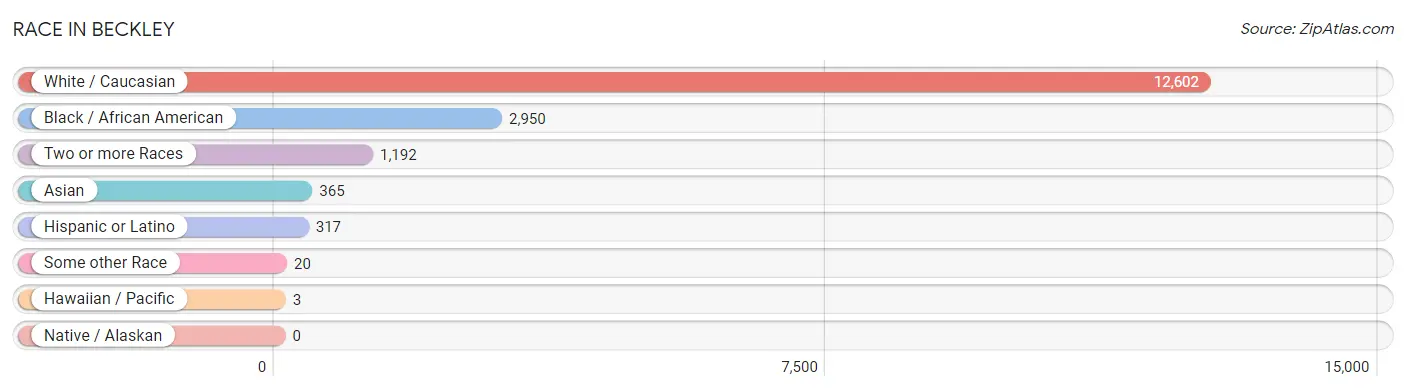
| Race | # Population | % Population |
| Asian | 365 | 2.1% |
| Black / African American | 2,950 | 17.2% |
| Hawaiian / Pacific | 3 | 0.0% |
| Hispanic or Latino | 317 | 1.8% |
| Native / Alaskan | 0 | 0.0% |
| White / Caucasian | 12,602 | 73.6% |
| Two or more Races | 1,192 | 7.0% |
| Some other Race | 20 | 0.1% |
| Total | 17,132 | 100.0% |
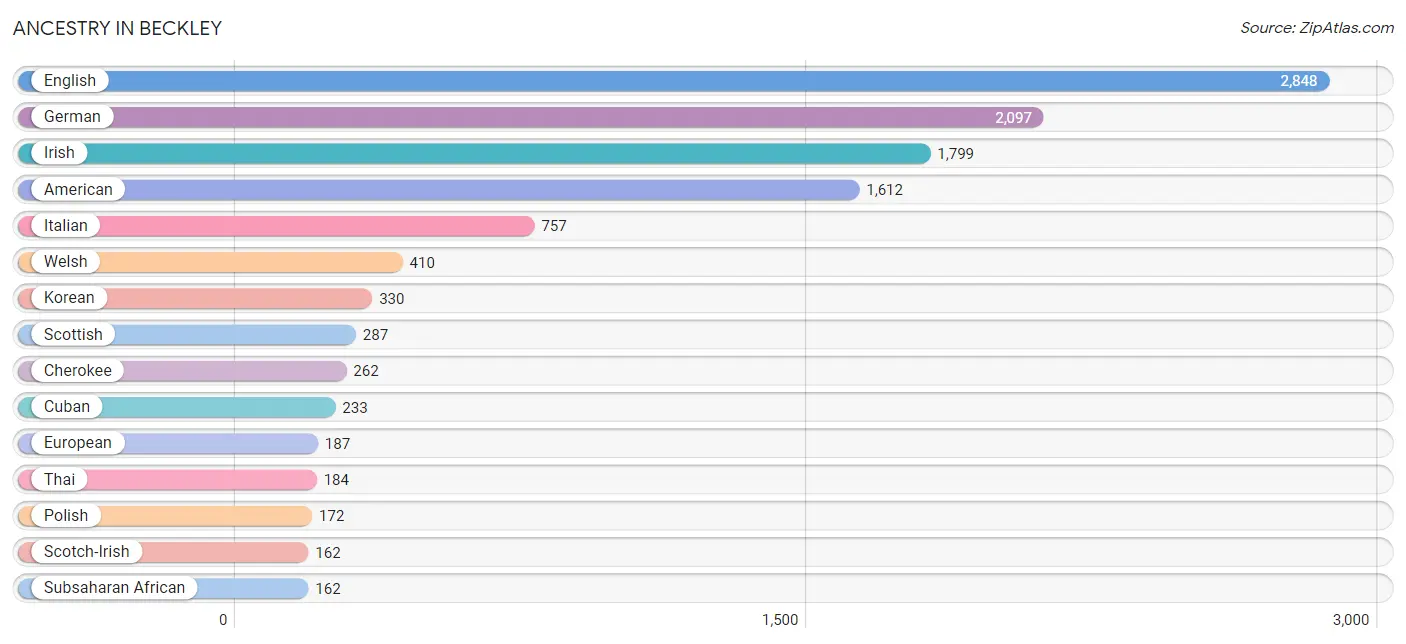
Ancestry in Beckley
The most populous ancestries reported in Beckley are English (2,848 | 16.6%), German (2,097 | 12.2%), Irish (1,799 | 10.5%), American (1,612 | 9.4%), and Italian (757 | 4.4%), together accounting for 53.2% of all Beckley residents.
| Ancestry | # Population | % Population |
| African | 147 | 0.9% |
| American | 1,612 | 9.4% |
| Arab | 66 | 0.4% |
| Australian | 31 | 0.2% |
| Belgian | 8 | 0.1% |
| Bhutanese | 52 | 0.3% |
| British | 68 | 0.4% |
| Bulgarian | 6 | 0.0% |
| Burmese | 8 | 0.1% |
| Central American | 4 | 0.0% |
| Cherokee | 262 | 1.5% |
| Colombian | 9 | 0.1% |
| Cuban | 233 | 1.4% |
| Czechoslovakian | 12 | 0.1% |
| Dutch | 75 | 0.4% |
| Eastern European | 29 | 0.2% |
| English | 2,848 | 16.6% |
| European | 187 | 1.1% |
| French | 158 | 0.9% |
| French Canadian | 11 | 0.1% |
| German | 2,097 | 12.2% |
| Greek | 8 | 0.1% |
| Guatemalan | 4 | 0.0% |
| Hungarian | 76 | 0.4% |
| Indian (Asian) | 3 | 0.0% |
| Iranian | 9 | 0.1% |
| Irish | 1,799 | 10.5% |
| Israeli | 14 | 0.1% |
| Italian | 757 | 4.4% |
| Jamaican | 3 | 0.0% |
| Korean | 330 | 1.9% |
| Lebanese | 52 | 0.3% |
| Lithuanian | 13 | 0.1% |
| Mexican | 36 | 0.2% |
| Native Hawaiian | 3 | 0.0% |
| Nigerian | 15 | 0.1% |
| Norwegian | 12 | 0.1% |
| Pakistani | 28 | 0.2% |
| Pennsylvania German | 18 | 0.1% |
| Polish | 172 | 1.0% |
| Portuguese | 4 | 0.0% |
| Russian | 11 | 0.1% |
| Scotch-Irish | 162 | 0.9% |
| Scottish | 287 | 1.7% |
| Slovak | 8 | 0.1% |
| Slovene | 13 | 0.1% |
| South American | 9 | 0.1% |
| Sri Lankan | 61 | 0.4% |
| Subsaharan African | 162 | 0.9% |
| Swedish | 9 | 0.1% |
| Thai | 184 | 1.1% |
| Welsh | 410 | 2.4% | View All 52 Rows |
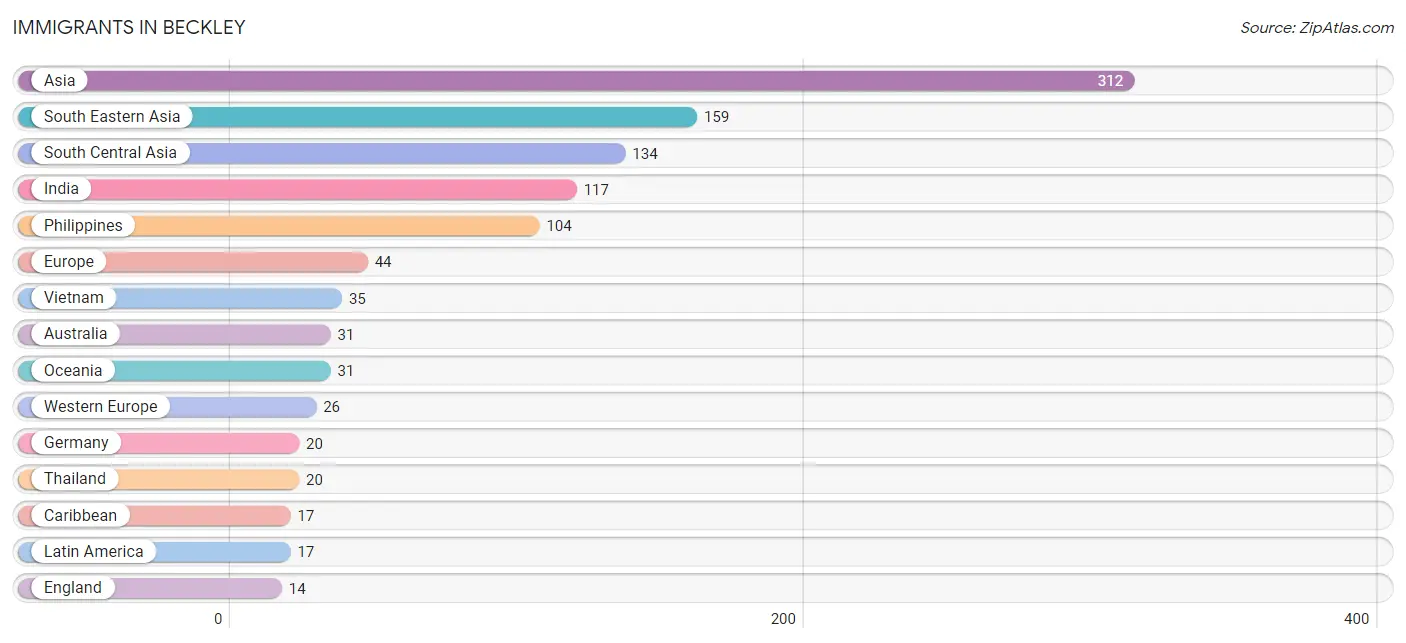
Immigrants in Beckley
The most numerous immigrant groups reported in Beckley came from Asia (312 | 1.8%), South Eastern Asia (159 | 0.9%), South Central Asia (134 | 0.8%), India (117 | 0.7%), and Philippines (104 | 0.6%), together accounting for 4.8% of all Beckley residents.
| Immigration Origin | # Population | % Population |
| Asia | 312 | 1.8% |
| Australia | 31 | 0.2% |
| Canada | 9 | 0.1% |
| Caribbean | 17 | 0.1% |
| Cuba | 6 | 0.0% |
| Eastern Asia | 5 | 0.0% |
| England | 14 | 0.1% |
| Europe | 44 | 0.3% |
| Germany | 20 | 0.1% |
| India | 117 | 0.7% |
| Iran | 9 | 0.1% |
| Italy | 4 | 0.0% |
| Jamaica | 11 | 0.1% |
| Kazakhstan | 8 | 0.1% |
| Korea | 5 | 0.0% |
| Latin America | 17 | 0.1% |
| Northern Europe | 14 | 0.1% |
| Oceania | 31 | 0.2% |
| Philippines | 104 | 0.6% |
| South Central Asia | 134 | 0.8% |
| South Eastern Asia | 159 | 0.9% |
| Southern Europe | 4 | 0.0% |
| Switzerland | 6 | 0.0% |
| Syria | 14 | 0.1% |
| Thailand | 20 | 0.1% |
| Vietnam | 35 | 0.2% |
| Western Asia | 14 | 0.1% |
| Western Europe | 26 | 0.2% | View All 28 Rows |
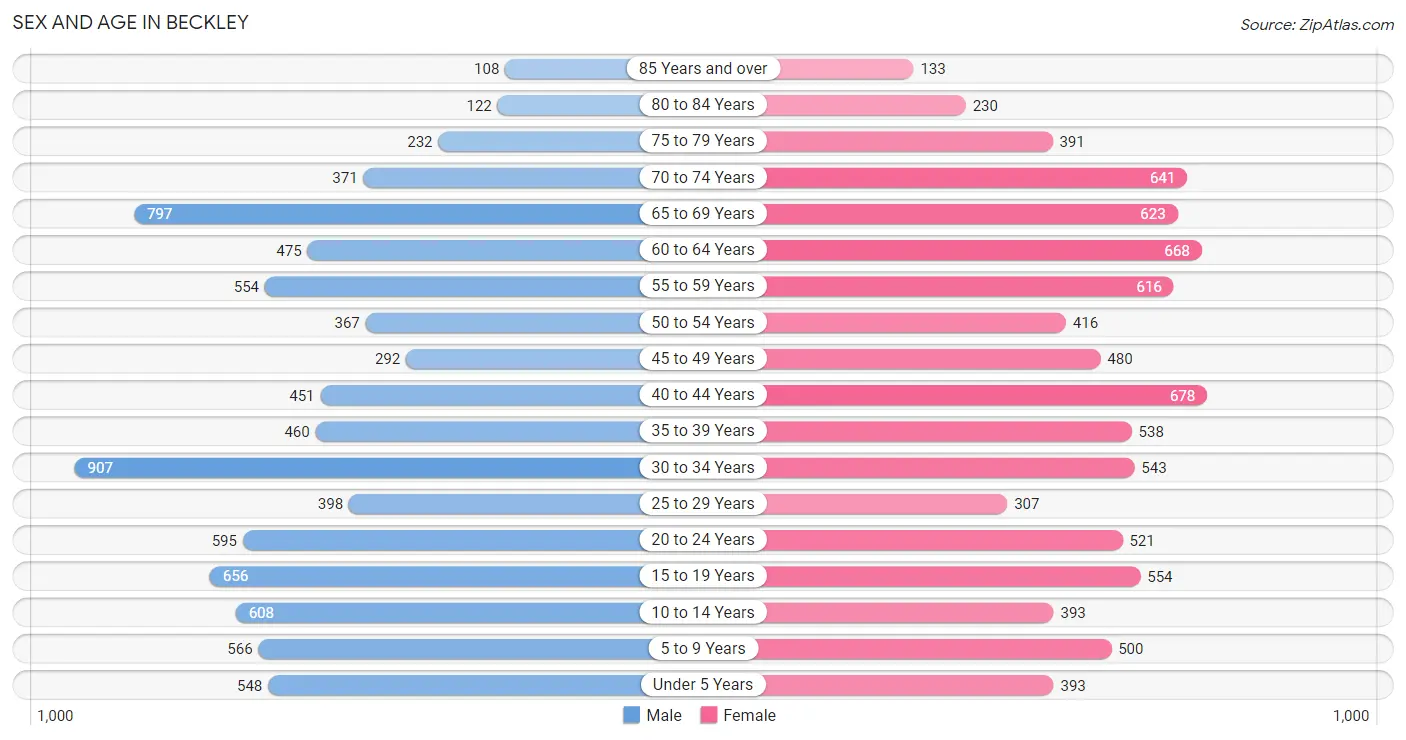
Sex and Age in Beckley
Sex and Age in Beckley
The most populous age groups in Beckley are 30 to 34 Years (907 | 10.7%) for men and 40 to 44 Years (678 | 7.9%) for women.
| Age Bracket | Male | Female |
| Under 5 Years | 548 (6.4%) | 393 (4.6%) |
| 5 to 9 Years | 566 (6.7%) | 500 (5.8%) |
| 10 to 14 Years | 608 (7.1%) | 393 (4.6%) |
| 15 to 19 Years | 656 (7.7%) | 554 (6.4%) |
| 20 to 24 Years | 595 (7.0%) | 521 (6.0%) |
| 25 to 29 Years | 398 (4.7%) | 307 (3.6%) |
| 30 to 34 Years | 907 (10.7%) | 543 (6.3%) |
| 35 to 39 Years | 460 (5.4%) | 538 (6.2%) |
| 40 to 44 Years | 451 (5.3%) | 678 (7.9%) |
| 45 to 49 Years | 292 (3.4%) | 480 (5.6%) |
| 50 to 54 Years | 367 (4.3%) | 416 (4.8%) |
| 55 to 59 Years | 554 (6.5%) | 616 (7.1%) |
| 60 to 64 Years | 475 (5.6%) | 668 (7.7%) |
| 65 to 69 Years | 797 (9.4%) | 623 (7.2%) |
| 70 to 74 Years | 371 (4.4%) | 641 (7.4%) |
| 75 to 79 Years | 232 (2.7%) | 391 (4.5%) |
| 80 to 84 Years | 122 (1.4%) | 230 (2.7%) |
| 85 Years and over | 108 (1.3%) | 133 (1.5%) |
| Total | 8,507 (100.0%) | 8,625 (100.0%) |
Families and Households in Beckley
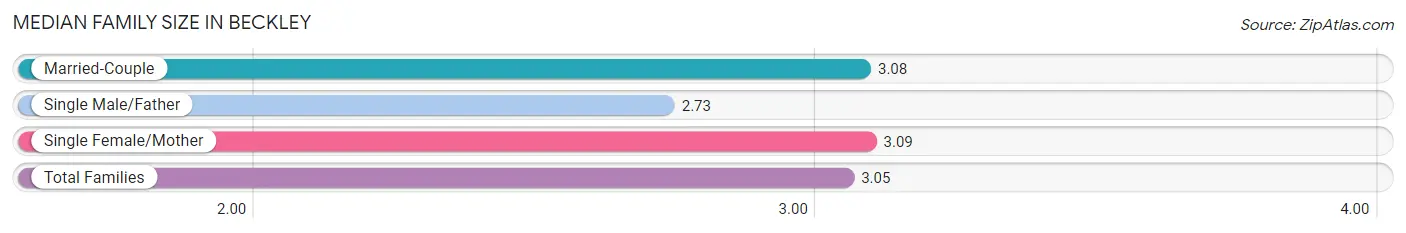
Median Family Size in Beckley
The median family size in Beckley is 3.05 persons per family, with single female/mother families (1,191 | 29.7%) accounting for the largest median family size of 3.09 persons per family. On the other hand, single male/father families (423 | 10.5%) represent the smallest median family size with 2.73 persons per family.
| Family Type | # Families | Family Size |
| Married-Couple | 2,395 (59.7%) | 3.08 |
| Single Male/Father | 423 (10.5%) | 2.73 |
| Single Female/Mother | 1,191 (29.7%) | 3.09 |
| Total Families | 4,009 (100.0%) | 3.05 |
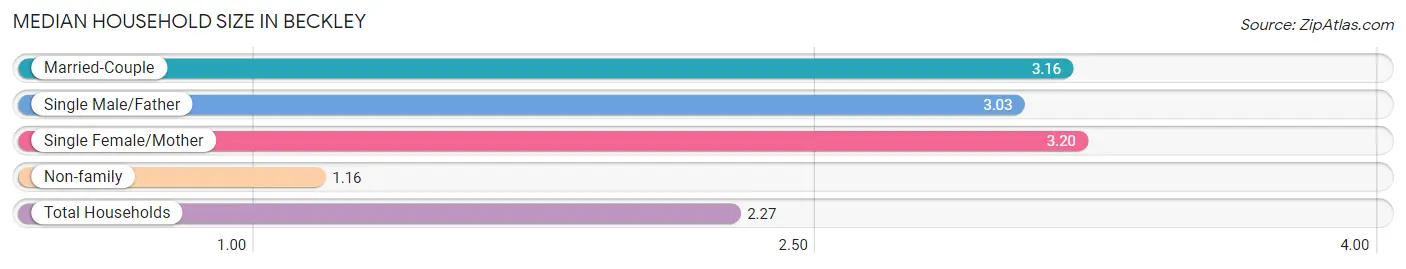
Median Household Size in Beckley
The median household size in Beckley is 2.27 persons per household, with single female/mother households (1,191 | 16.5%) accounting for the largest median household size of 3.2 persons per household. non-family households (3,201 | 44.4%) represent the smallest median household size with 1.16 persons per household.
| Household Type | # Households | Household Size |
| Married-Couple | 2,395 (33.2%) | 3.16 |
| Single Male/Father | 423 (5.9%) | 3.03 |
| Single Female/Mother | 1,191 (16.5%) | 3.20 |
| Non-family | 3,201 (44.4%) | 1.16 |
| Total Households | 7,210 (100.0%) | 2.27 |
Household Size by Marriage Status in Beckley
Out of a total of 7,210 households in Beckley, 4,009 (55.6%) are family households, while 3,201 (44.4%) are nonfamily households. The most numerous type of family households are 2-person households, comprising 1,903, and the most common type of nonfamily households are 1-person households, comprising 2,816.
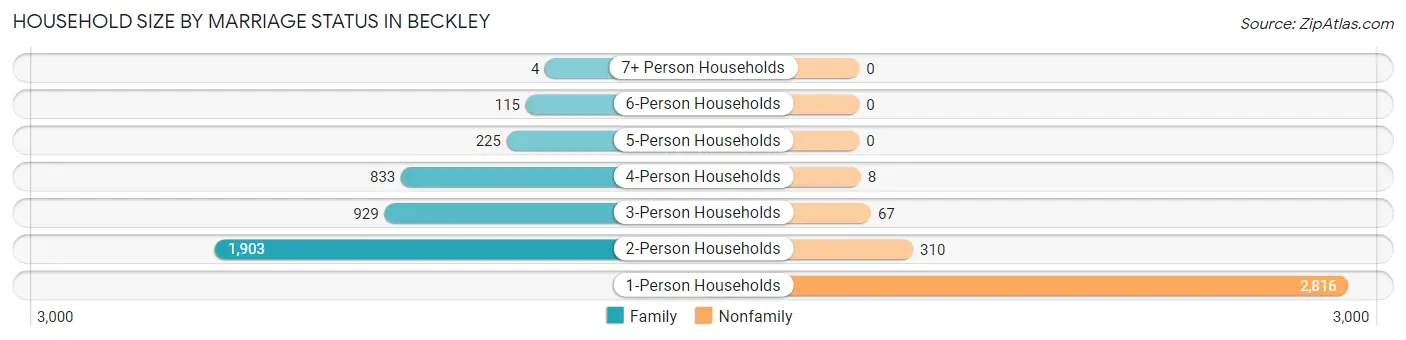
| Household Size | Family Households | Nonfamily Households |
| 1-Person Households | - | 2,816 (39.1%) |
| 2-Person Households | 1,903 (26.4%) | 310 (4.3%) |
| 3-Person Households | 929 (12.9%) | 67 (0.9%) |
| 4-Person Households | 833 (11.6%) | 8 (0.1%) |
| 5-Person Households | 225 (3.1%) | 0 (0.0%) |
| 6-Person Households | 115 (1.6%) | 0 (0.0%) |
| 7+ Person Households | 4 (0.1%) | 0 (0.0%) |
| Total | 4,009 (55.6%) | 3,201 (44.4%) |
Female Fertility in Beckley
Fertility by Age in Beckley
Average fertility rate in Beckley is 66.0 births per 1,000 women. Women in the age bracket of 20 to 34 years have the highest fertility rate with 99.0 births per 1,000 women. Women in the age bracket of 20 to 34 years acount for 56.2% of all women with births.
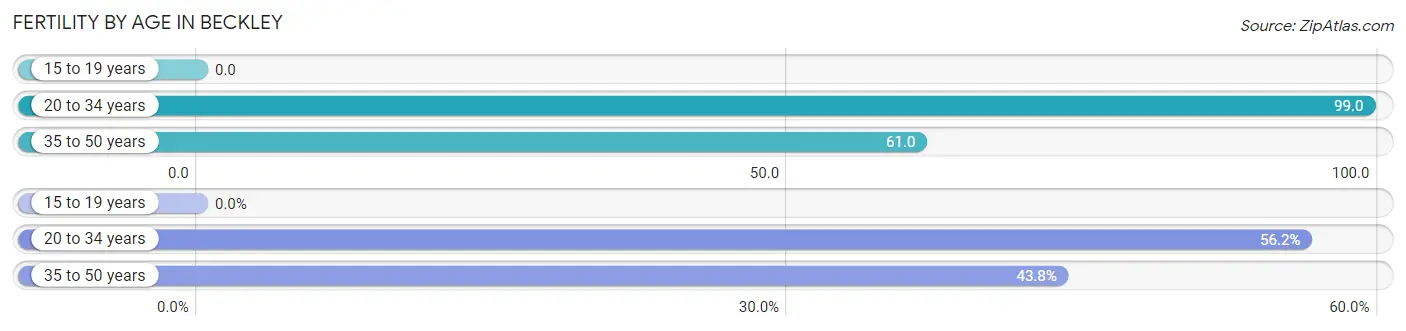
| Age Bracket | Women with Births | Births / 1,000 Women |
| 15 to 19 years | 0 (0.0%) | 0.0 |
| 20 to 34 years | 136 (56.2%) | 99.0 |
| 35 to 50 years | 106 (43.8%) | 61.0 |
| Total | 242 (100.0%) | 66.0 |
Fertility by Age by Marriage Status in Beckley
24.0% of women with births (242) in Beckley are married. The highest percentage of unmarried women with births falls into 35 to 50 years age bracket with 84.9% of them unmarried at the time of birth, while the lowest percentage of unmarried women with births belong to 20 to 34 years age bracket with 69.1% of them unmarried.
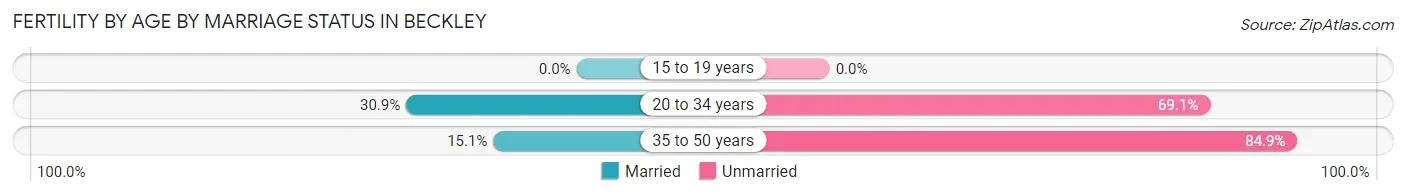
| Age Bracket | Married | Unmarried |
| 15 to 19 years | 0 (0.0%) | 0 (0.0%) |
| 20 to 34 years | 42 (30.9%) | 94 (69.1%) |
| 35 to 50 years | 16 (15.1%) | 90 (84.9%) |
| Total | 58 (24.0%) | 184 (76.0%) |
Fertility by Education in Beckley
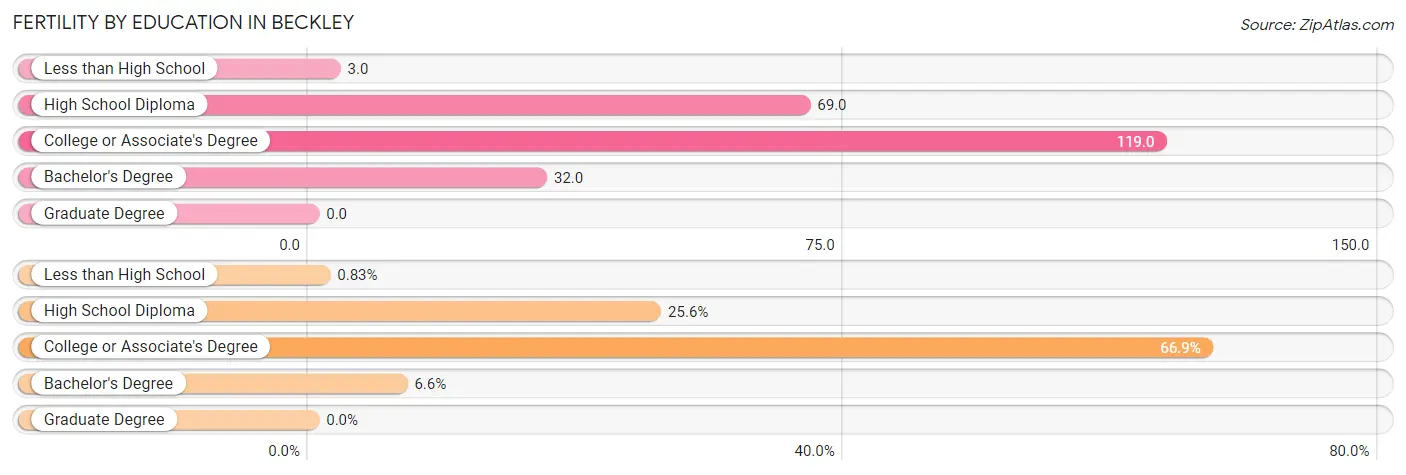
| Educational Attainment | Women with Births | Births / 1,000 Women |
| Less than High School | 2 (0.8%) | 3.0 |
| High School Diploma | 62 (25.6%) | 69.0 |
| College or Associate's Degree | 162 (66.9%) | 119.0 |
| Bachelor's Degree | 16 (6.6%) | 32.0 |
| Graduate Degree | 0 (0.0%) | 0.0 |
| Total | 242 (100.0%) | 66.0 |
Fertility by Education by Marriage Status in Beckley
76.0% of women with births in Beckley are unmarried. Women with the educational attainment of bachelor's degree are most likely to be married with 100.0% of them married at childbirth, while women with the educational attainment of less than high school are least likely to be married with 100.0% of them unmarried at childbirth.
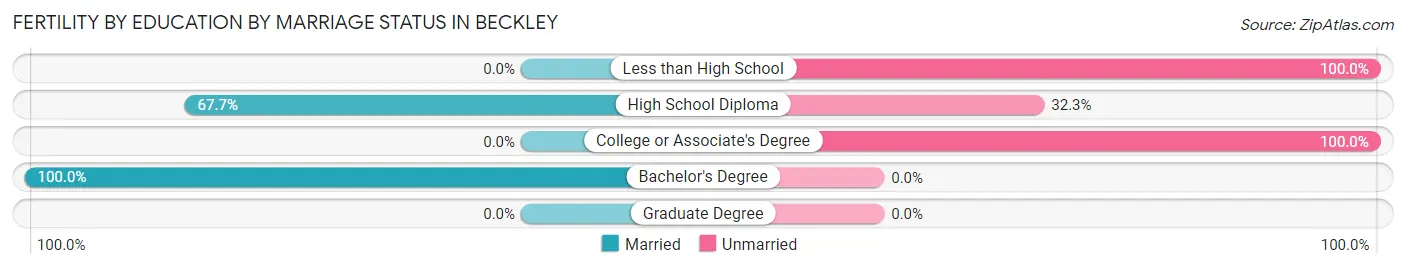
| Educational Attainment | Married | Unmarried |
| Less than High School | 0 (0.0%) | 2 (100.0%) |
| High School Diploma | 42 (67.7%) | 20 (32.3%) |
| College or Associate's Degree | 0 (0.0%) | 162 (100.0%) |
| Bachelor's Degree | 16 (100.0%) | 0 (0.0%) |
| Graduate Degree | 0 (0.0%) | 0 (0.0%) |
| Total | 58 (24.0%) | 184 (76.0%) |
Employment Characteristics in Beckley
Employment by Class of Employer in Beckley
Among the 6,421 employed individuals in Beckley, private company employees (4,027 | 62.7%), not-for-profit organizations (713 | 11.1%), and local government employees (411 | 6.4%) make up the most common classes of employment.
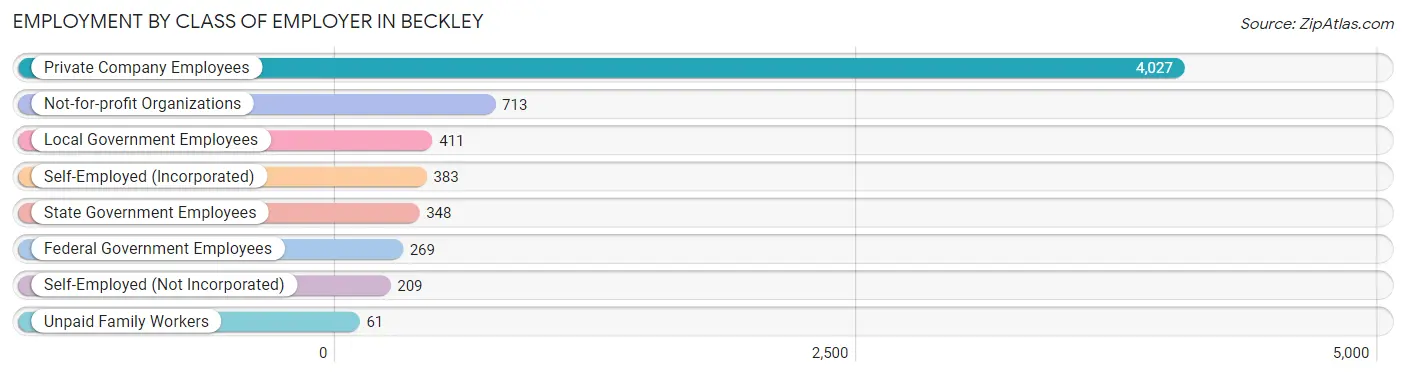
| Employer Class | # Employees | % Employees |
| Private Company Employees | 4,027 | 62.7% |
| Self-Employed (Incorporated) | 383 | 6.0% |
| Self-Employed (Not Incorporated) | 209 | 3.3% |
| Not-for-profit Organizations | 713 | 11.1% |
| Local Government Employees | 411 | 6.4% |
| State Government Employees | 348 | 5.4% |
| Federal Government Employees | 269 | 4.2% |
| Unpaid Family Workers | 61 | 0.9% |
| Total | 6,421 | 100.0% |
Employment Status by Age in Beckley
According to the labor force statistics for Beckley, out of the total population over 16 years of age (13,824), 50.7% or 7,009 individuals are in the labor force, with 4.7% or 329 of them unemployed. The age group with the highest labor force participation rate is 25 to 29 years, with 79.3% or 559 individuals in the labor force. Within the labor force, the 16 to 19 years age range has the highest percentage of unemployed individuals, with 10.3% or 28 of them being unemployed.
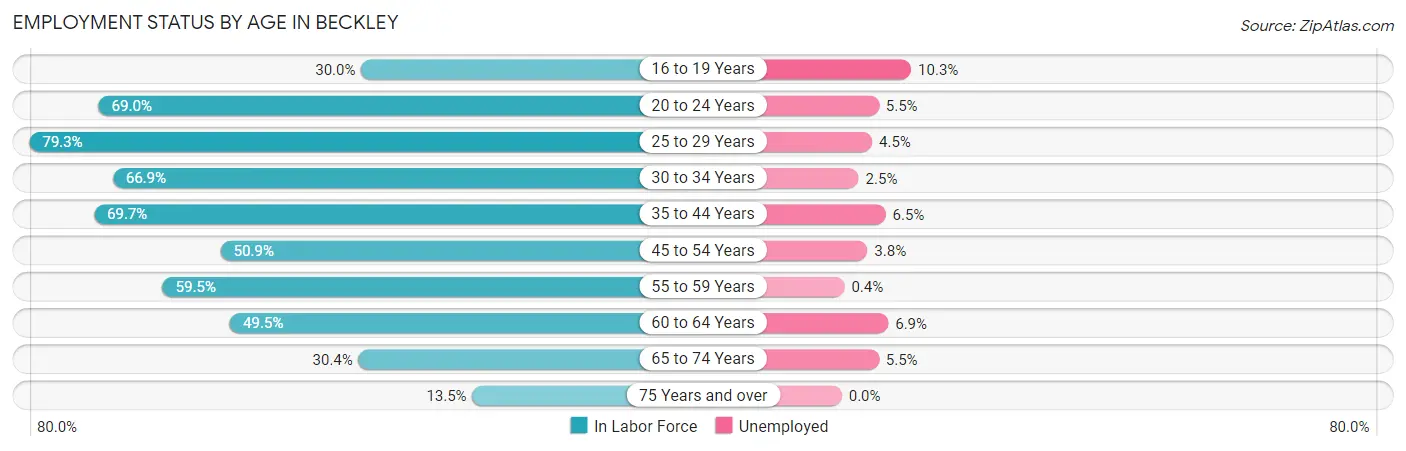
| Age Bracket | In Labor Force | Unemployed |
| 16 to 19 Years | 273 (30.0%) | 28 (10.3%) |
| 20 to 24 Years | 770 (69.0%) | 42 (5.5%) |
| 25 to 29 Years | 559 (79.3%) | 25 (4.5%) |
| 30 to 34 Years | 970 (66.9%) | 24 (2.5%) |
| 35 to 44 Years | 1,483 (69.7%) | 96 (6.5%) |
| 45 to 54 Years | 791 (50.9%) | 30 (3.8%) |
| 55 to 59 Years | 696 (59.5%) | 3 (0.4%) |
| 60 to 64 Years | 566 (49.5%) | 39 (6.9%) |
| 65 to 74 Years | 739 (30.4%) | 41 (5.5%) |
| 75 Years and over | 164 (13.5%) | 0 (0.0%) |
| Total | 7,009 (50.7%) | 329 (4.7%) |
Employment Status by Educational Attainment in Beckley
According to labor force statistics for Beckley, 62.2% of individuals (5,069) out of the total population between 25 and 64 years of age (8,150) are in the labor force, with 4.3% or 218 of them being unemployed. The group with the highest labor force participation rate are those with the educational attainment of bachelor's degree or higher, with 83.1% or 1,586 individuals in the labor force. Within the labor force, individuals with less than high school education have the highest percentage of unemployment, with 14.4% or 38 of them being unemployed.
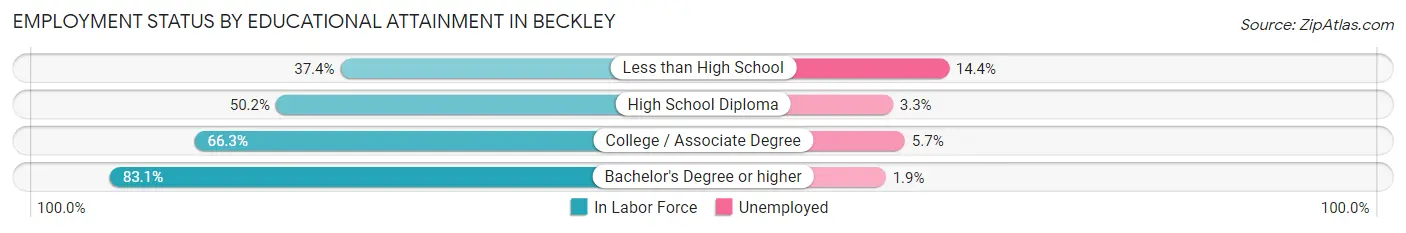
| Educational Attainment | In Labor Force | Unemployed |
| Less than High School | 264 (37.4%) | 102 (14.4%) |
| High School Diploma | 1,417 (50.2%) | 93 (3.3%) |
| College / Associate Degree | 1,799 (66.3%) | 155 (5.7%) |
| Bachelor's Degree or higher | 1,586 (83.1%) | 36 (1.9%) |
| Total | 5,069 (62.2%) | 350 (4.3%) |
Employment Occupations by Sex in Beckley
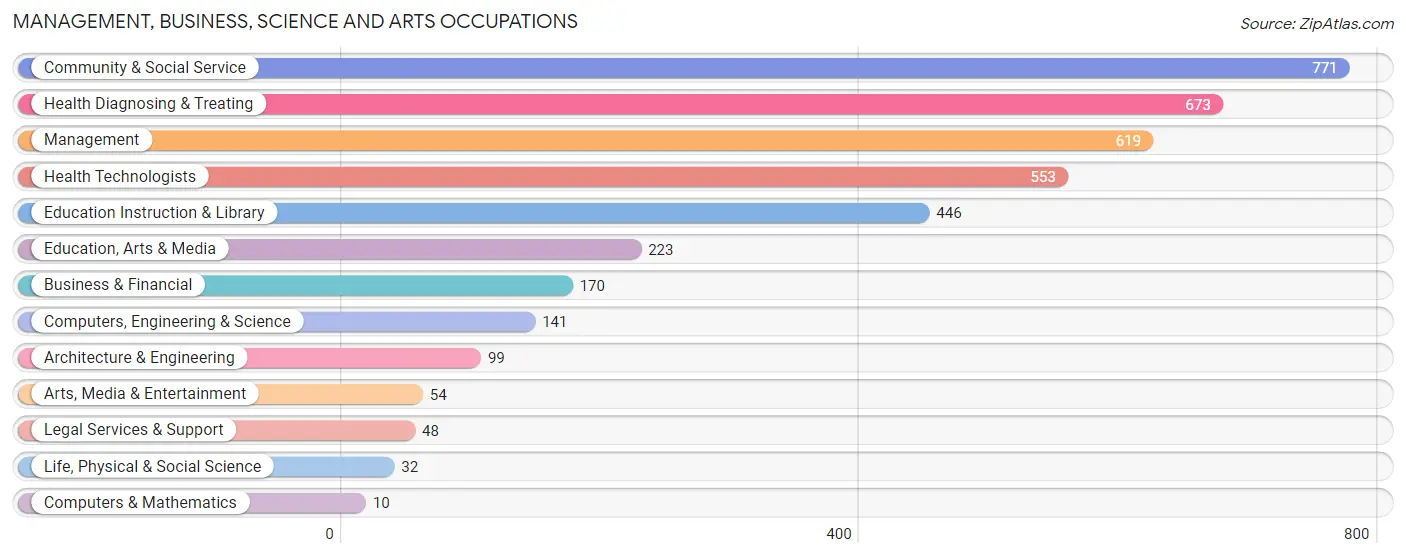
Management, Business, Science and Arts Occupations
The most common Management, Business, Science and Arts occupations in Beckley are Community & Social Service (771 | 11.5%), Health Diagnosing & Treating (673 | 10.1%), Management (619 | 9.3%), Health Technologists (553 | 8.3%), and Education Instruction & Library (446 | 6.7%).
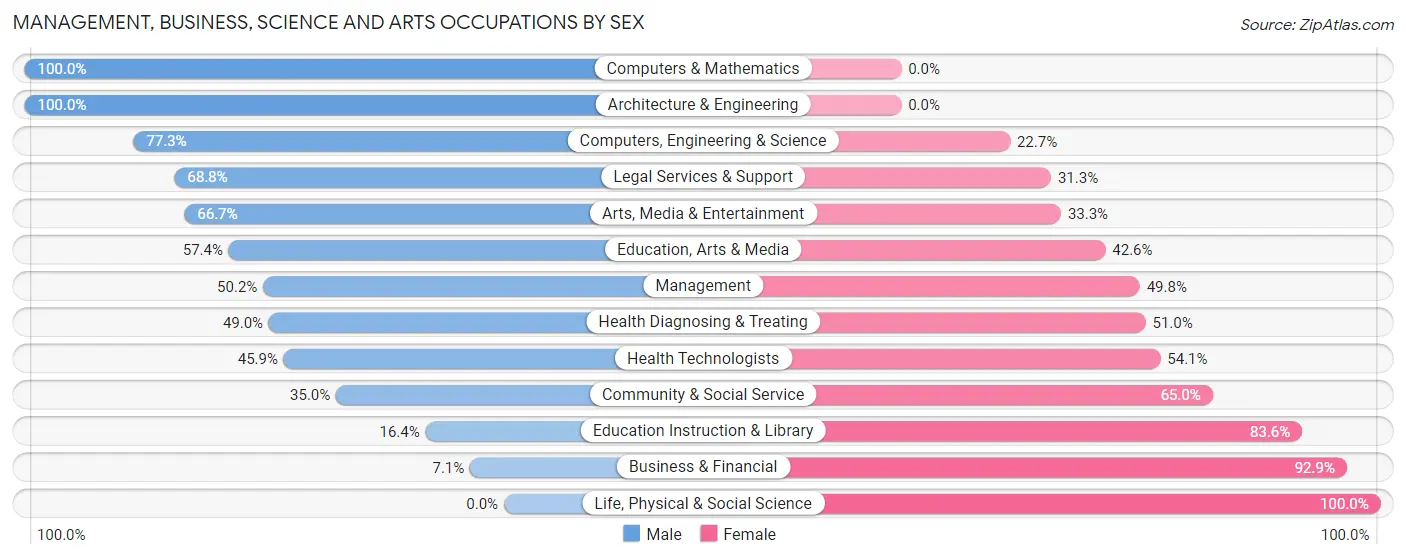
Management, Business, Science and Arts Occupations by Sex
Within the Management, Business, Science and Arts occupations in Beckley, the most male-oriented occupations are Computers & Mathematics (100.0%), Architecture & Engineering (100.0%), and Computers, Engineering & Science (77.3%), while the most female-oriented occupations are Life, Physical & Social Science (100.0%), Business & Financial (92.9%), and Education Instruction & Library (83.6%).
| Occupation | Male | Female |
| Management | 311 (50.2%) | 308 (49.8%) |
| Business & Financial | 12 (7.1%) | 158 (92.9%) |
| Computers, Engineering & Science | 109 (77.3%) | 32 (22.7%) |
| Computers & Mathematics | 10 (100.0%) | 0 (0.0%) |
| Architecture & Engineering | 99 (100.0%) | 0 (0.0%) |
| Life, Physical & Social Science | 0 (0.0%) | 32 (100.0%) |
| Community & Social Service | 270 (35.0%) | 501 (65.0%) |
| Education, Arts & Media | 128 (57.4%) | 95 (42.6%) |
| Legal Services & Support | 33 (68.8%) | 15 (31.2%) |
| Education Instruction & Library | 73 (16.4%) | 373 (83.6%) |
| Arts, Media & Entertainment | 36 (66.7%) | 18 (33.3%) |
| Health Diagnosing & Treating | 330 (49.0%) | 343 (51.0%) |
| Health Technologists | 254 (45.9%) | 299 (54.1%) |
| Total (Category) | 1,032 (43.5%) | 1,342 (56.5%) |
| Total (Overall) | 3,351 (50.1%) | 3,334 (49.9%) |
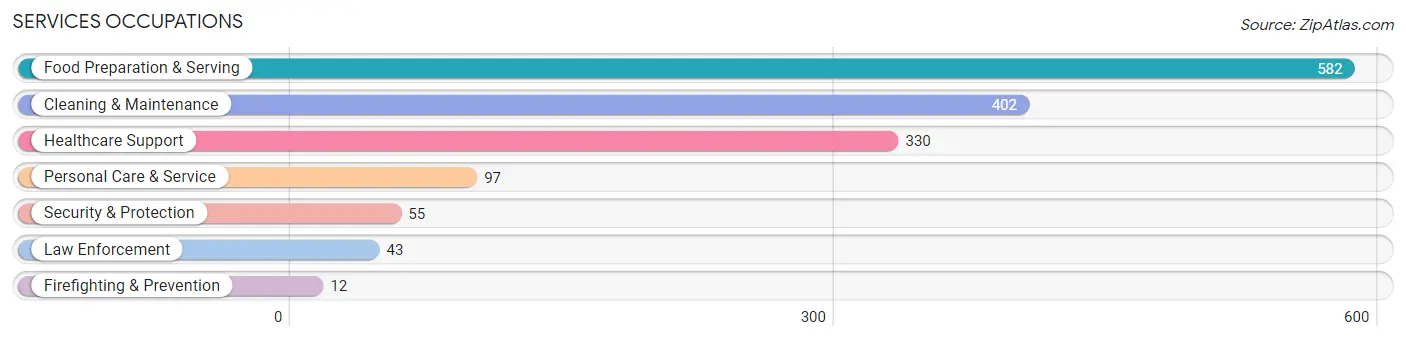
Services Occupations
The most common Services occupations in Beckley are Food Preparation & Serving (582 | 8.7%), Cleaning & Maintenance (402 | 6.0%), Healthcare Support (330 | 4.9%), Personal Care & Service (97 | 1.5%), and Security & Protection (55 | 0.8%).
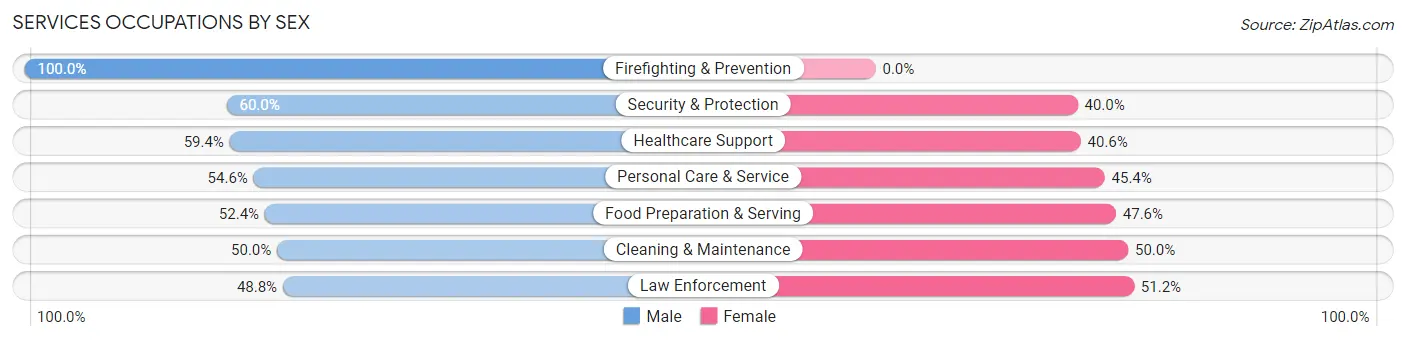
Services Occupations by Sex
Within the Services occupations in Beckley, the most male-oriented occupations are Firefighting & Prevention (100.0%), Security & Protection (60.0%), and Healthcare Support (59.4%), while the most female-oriented occupations are Law Enforcement (51.2%), Cleaning & Maintenance (50.0%), and Food Preparation & Serving (47.6%).
| Occupation | Male | Female |
| Healthcare Support | 196 (59.4%) | 134 (40.6%) |
| Security & Protection | 33 (60.0%) | 22 (40.0%) |
| Firefighting & Prevention | 12 (100.0%) | 0 (0.0%) |
| Law Enforcement | 21 (48.8%) | 22 (51.2%) |
| Food Preparation & Serving | 305 (52.4%) | 277 (47.6%) |
| Cleaning & Maintenance | 201 (50.0%) | 201 (50.0%) |
| Personal Care & Service | 53 (54.6%) | 44 (45.4%) |
| Total (Category) | 788 (53.7%) | 678 (46.3%) |
| Total (Overall) | 3,351 (50.1%) | 3,334 (49.9%) |
Sales and Office Occupations
The most common Sales and Office occupations in Beckley are Sales & Related (919 | 13.8%), and Office & Administration (874 | 13.1%).
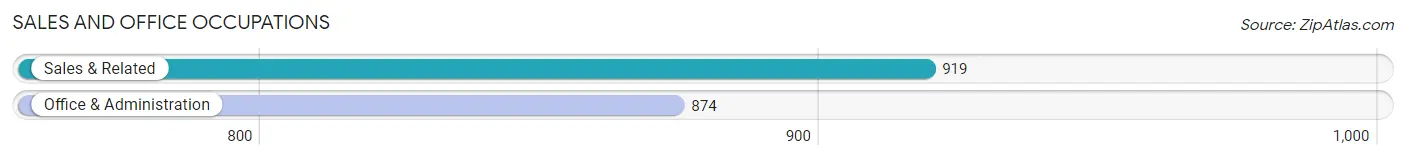
Sales and Office Occupations by Sex
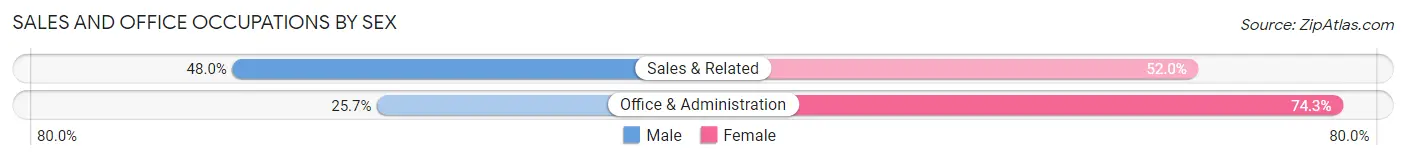
| Occupation | Male | Female |
| Sales & Related | 441 (48.0%) | 478 (52.0%) |
| Office & Administration | 225 (25.7%) | 649 (74.3%) |
| Total (Category) | 666 (37.1%) | 1,127 (62.9%) |
| Total (Overall) | 3,351 (50.1%) | 3,334 (49.9%) |
Natural Resources, Construction and Maintenance Occupations
The most common Natural Resources, Construction and Maintenance occupations in Beckley are Construction & Extraction (244 | 3.6%), and Installation, Maintenance & Repair (161 | 2.4%).
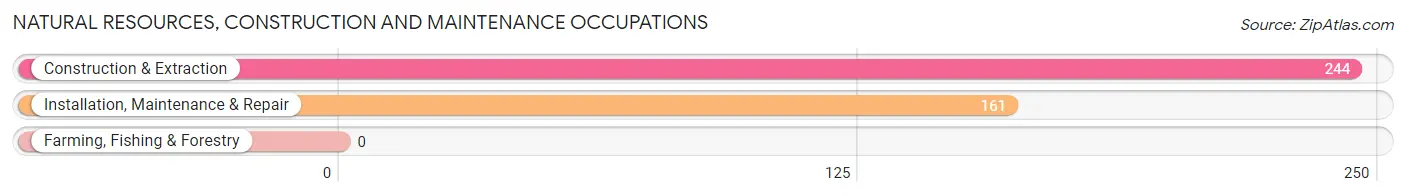
Natural Resources, Construction and Maintenance Occupations by Sex
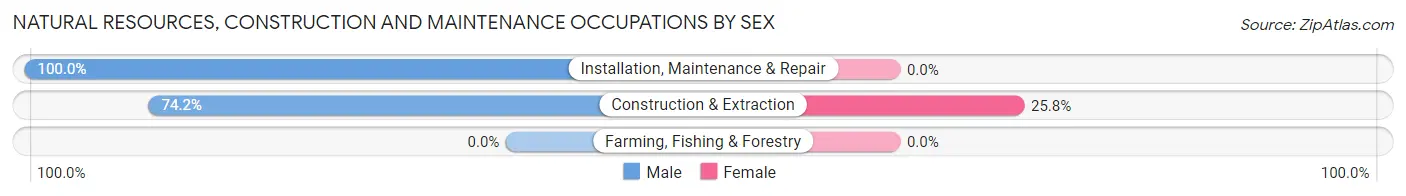
| Occupation | Male | Female |
| Farming, Fishing & Forestry | 0 (0.0%) | 0 (0.0%) |
| Construction & Extraction | 181 (74.2%) | 63 (25.8%) |
| Installation, Maintenance & Repair | 161 (100.0%) | 0 (0.0%) |
| Total (Category) | 342 (84.4%) | 63 (15.6%) |
| Total (Overall) | 3,351 (50.1%) | 3,334 (49.9%) |
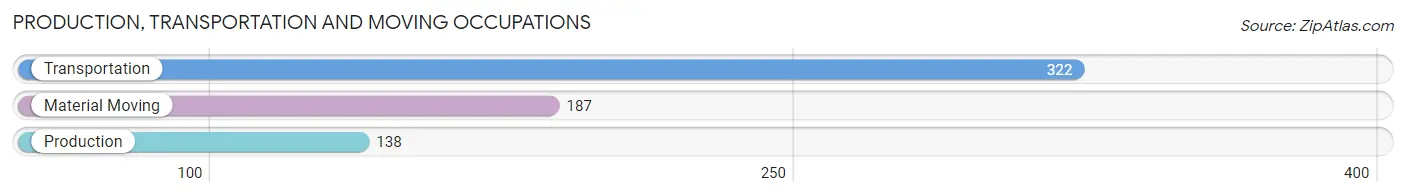
Production, Transportation and Moving Occupations
The most common Production, Transportation and Moving occupations in Beckley are Transportation (322 | 4.8%), Material Moving (187 | 2.8%), and Production (138 | 2.1%).
Production, Transportation and Moving Occupations by Sex
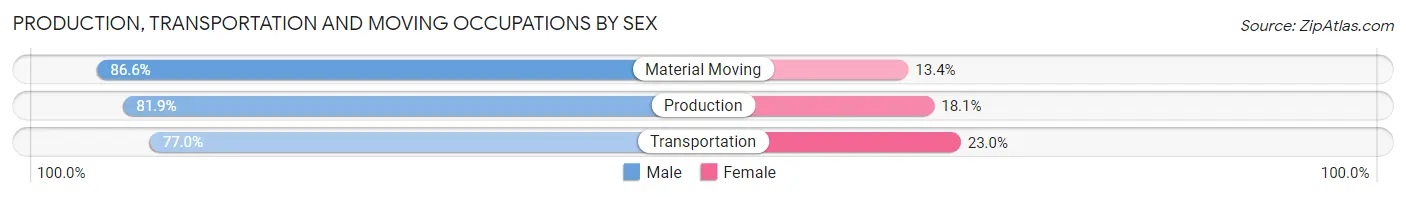
| Occupation | Male | Female |
| Production | 113 (81.9%) | 25 (18.1%) |
| Transportation | 248 (77.0%) | 74 (23.0%) |
| Material Moving | 162 (86.6%) | 25 (13.4%) |
| Total (Category) | 523 (80.8%) | 124 (19.2%) |
| Total (Overall) | 3,351 (50.1%) | 3,334 (49.9%) |
Employment Industries by Sex in Beckley
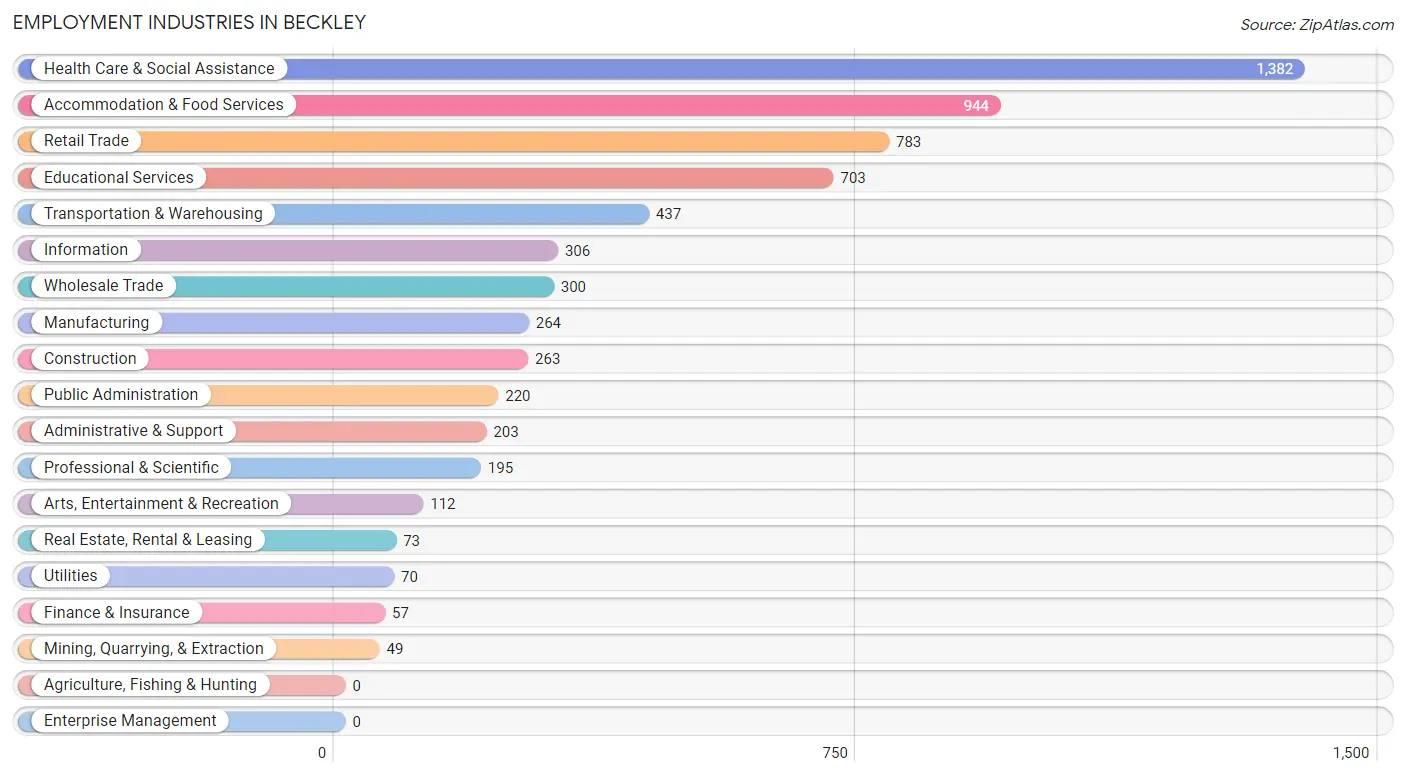
Employment Industries in Beckley
The major employment industries in Beckley include Health Care & Social Assistance (1,382 | 20.7%), Accommodation & Food Services (944 | 14.1%), Retail Trade (783 | 11.7%), Educational Services (703 | 10.5%), and Transportation & Warehousing (437 | 6.5%).
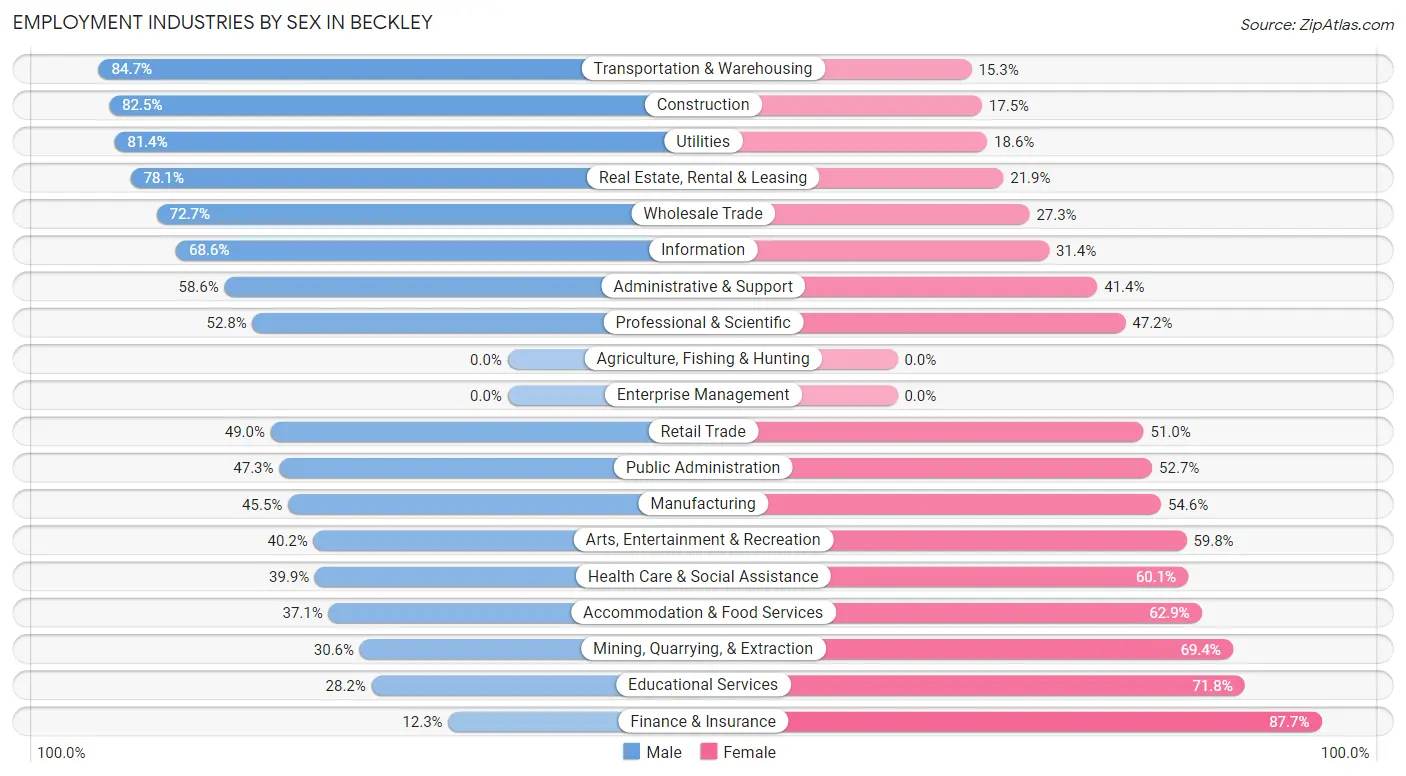
Employment Industries by Sex in Beckley
The Beckley industries that see more men than women are Transportation & Warehousing (84.7%), Construction (82.5%), and Utilities (81.4%), whereas the industries that tend to have a higher number of women are Finance & Insurance (87.7%), Educational Services (71.8%), and Mining, Quarrying, & Extraction (69.4%).
| Industry | Male | Female |
| Agriculture, Fishing & Hunting | 0 (0.0%) | 0 (0.0%) |
| Mining, Quarrying, & Extraction | 15 (30.6%) | 34 (69.4%) |
| Construction | 217 (82.5%) | 46 (17.5%) |
| Manufacturing | 120 (45.5%) | 144 (54.5%) |
| Wholesale Trade | 218 (72.7%) | 82 (27.3%) |
| Retail Trade | 384 (49.0%) | 399 (51.0%) |
| Transportation & Warehousing | 370 (84.7%) | 67 (15.3%) |
| Utilities | 57 (81.4%) | 13 (18.6%) |
| Information | 210 (68.6%) | 96 (31.4%) |
| Finance & Insurance | 7 (12.3%) | 50 (87.7%) |
| Real Estate, Rental & Leasing | 57 (78.1%) | 16 (21.9%) |
| Professional & Scientific | 103 (52.8%) | 92 (47.2%) |
| Enterprise Management | 0 (0.0%) | 0 (0.0%) |
| Administrative & Support | 119 (58.6%) | 84 (41.4%) |
| Educational Services | 198 (28.2%) | 505 (71.8%) |
| Health Care & Social Assistance | 551 (39.9%) | 831 (60.1%) |
| Arts, Entertainment & Recreation | 45 (40.2%) | 67 (59.8%) |
| Accommodation & Food Services | 350 (37.1%) | 594 (62.9%) |
| Public Administration | 104 (47.3%) | 116 (52.7%) |
| Total | 3,351 (50.1%) | 3,334 (49.9%) |
Education in Beckley
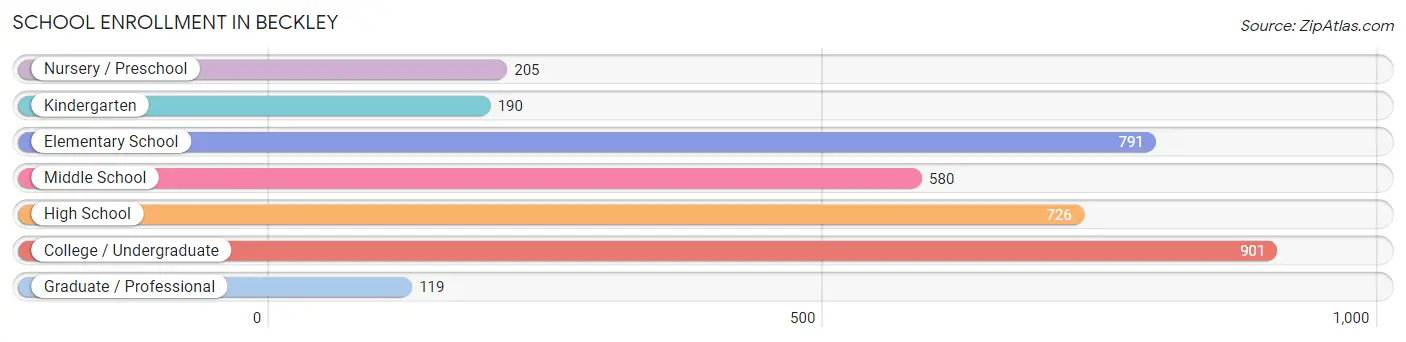
School Enrollment in Beckley
The most common levels of schooling among the 3,512 students in Beckley are college / undergraduate (901 | 25.7%), elementary school (791 | 22.5%), and high school (726 | 20.7%).
| School Level | # Students | % Students |
| Nursery / Preschool | 205 | 5.8% |
| Kindergarten | 190 | 5.4% |
| Elementary School | 791 | 22.5% |
| Middle School | 580 | 16.5% |
| High School | 726 | 20.7% |
| College / Undergraduate | 901 | 25.7% |
| Graduate / Professional | 119 | 3.4% |
| Total | 3,512 | 100.0% |
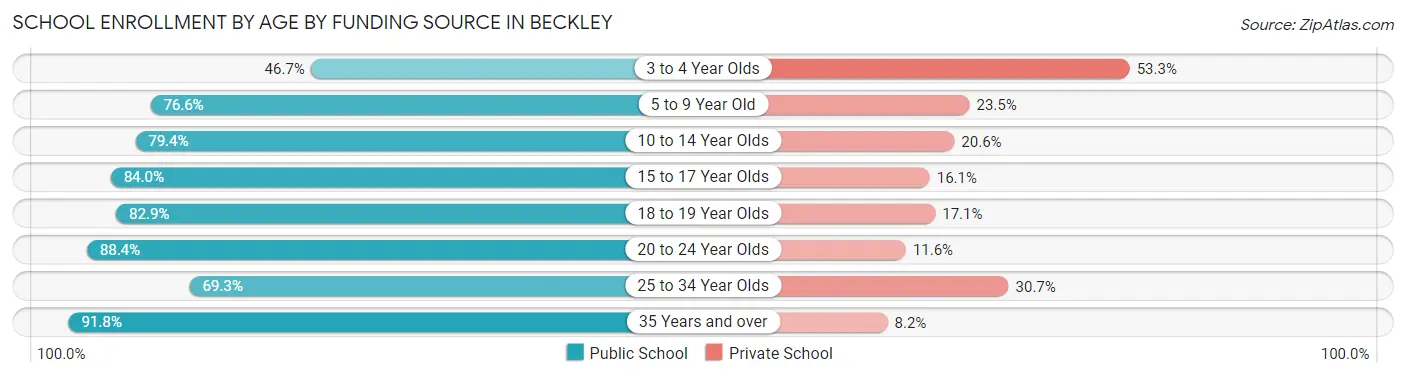
School Enrollment by Age by Funding Source in Beckley
Out of a total of 3,512 students who are enrolled in schools in Beckley, 713 (20.3%) attend a private institution, while the remaining 2,799 (79.7%) are enrolled in public schools. The age group of 3 to 4 year olds has the highest likelihood of being enrolled in private schools, with 73 (53.3% in the age bracket) enrolled. Conversely, the age group of 35 years and over has the lowest likelihood of being enrolled in a private school, with 101 (91.8% in the age bracket) attending a public institution.
| Age Bracket | Public School | Private School |
| 3 to 4 Year Olds | 64 (46.7%) | 73 (53.3%) |
| 5 to 9 Year Old | 705 (76.5%) | 216 (23.4%) |
| 10 to 14 Year Olds | 658 (79.4%) | 171 (20.6%) |
| 15 to 17 Year Olds | 476 (84.0%) | 91 (16.1%) |
| 18 to 19 Year Olds | 209 (82.9%) | 43 (17.1%) |
| 20 to 24 Year Olds | 480 (88.4%) | 63 (11.6%) |
| 25 to 34 Year Olds | 106 (69.3%) | 47 (30.7%) |
| 35 Years and over | 101 (91.8%) | 9 (8.2%) |
| Total | 2,799 (79.7%) | 713 (20.3%) |
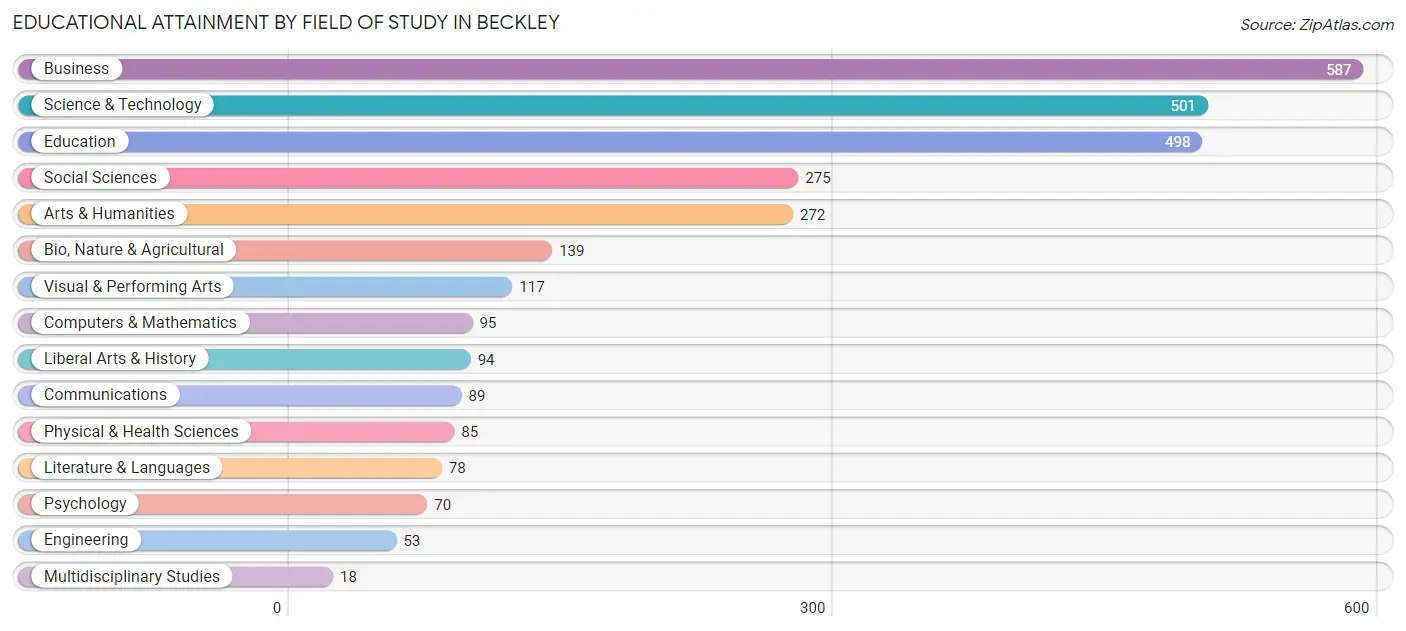
Educational Attainment by Field of Study in Beckley
Business (587 | 19.8%), science & technology (501 | 16.9%), education (498 | 16.8%), social sciences (275 | 9.3%), and arts & humanities (272 | 9.2%) are the most common fields of study among 2,971 individuals in Beckley who have obtained a bachelor's degree or higher.
| Field of Study | # Graduates | % Graduates |
| Computers & Mathematics | 95 | 3.2% |
| Bio, Nature & Agricultural | 139 | 4.7% |
| Physical & Health Sciences | 85 | 2.9% |
| Psychology | 70 | 2.4% |
| Social Sciences | 275 | 9.3% |
| Engineering | 53 | 1.8% |
| Multidisciplinary Studies | 18 | 0.6% |
| Science & Technology | 501 | 16.9% |
| Business | 587 | 19.8% |
| Education | 498 | 16.8% |
| Literature & Languages | 78 | 2.6% |
| Liberal Arts & History | 94 | 3.2% |
| Visual & Performing Arts | 117 | 3.9% |
| Communications | 89 | 3.0% |
| Arts & Humanities | 272 | 9.2% |
| Total | 2,971 | 100.0% |
Transportation & Commute in Beckley
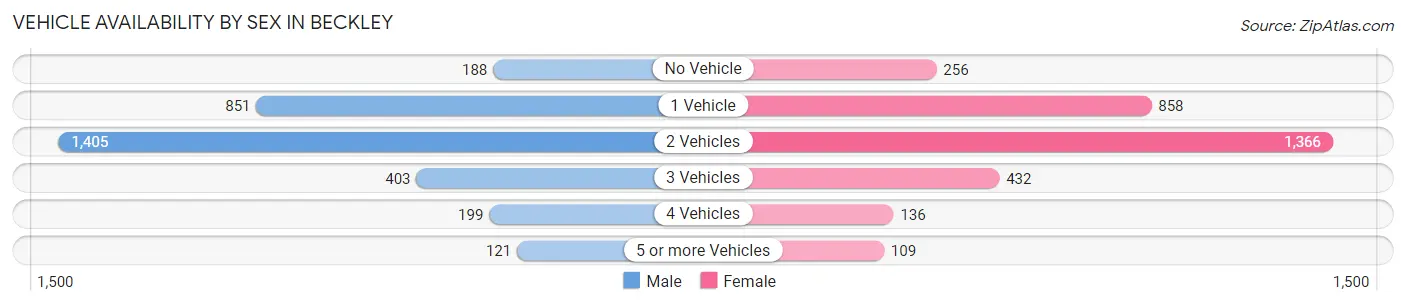
Vehicle Availability by Sex in Beckley
The most prevalent vehicle ownership categories in Beckley are males with 2 vehicles (1,405, accounting for 44.4%) and females with 2 vehicles (1,366, making up 44.5%).
| Vehicles Available | Male | Female |
| No Vehicle | 188 (5.9%) | 256 (8.1%) |
| 1 Vehicle | 851 (26.9%) | 858 (27.2%) |
| 2 Vehicles | 1,405 (44.4%) | 1,366 (43.3%) |
| 3 Vehicles | 403 (12.7%) | 432 (13.7%) |
| 4 Vehicles | 199 (6.3%) | 136 (4.3%) |
| 5 or more Vehicles | 121 (3.8%) | 109 (3.5%) |
| Total | 3,167 (100.0%) | 3,157 (100.0%) |
Commute Time in Beckley
The most frequently occuring commute durations in Beckley are 10 to 14 minutes (1,609 commuters, 25.5%), 15 to 19 minutes (1,374 commuters, 21.8%), and 5 to 9 minutes (1,196 commuters, 19.0%).
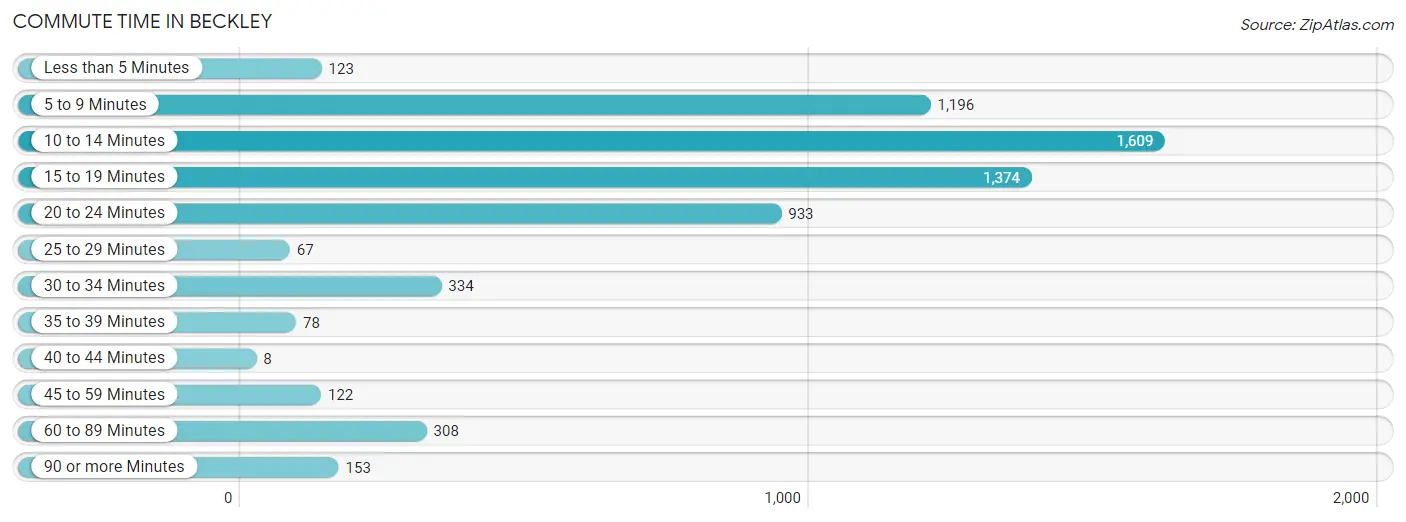
| Commute Time | # Commuters | % Commuters |
| Less than 5 Minutes | 123 | 1.9% |
| 5 to 9 Minutes | 1,196 | 19.0% |
| 10 to 14 Minutes | 1,609 | 25.5% |
| 15 to 19 Minutes | 1,374 | 21.8% |
| 20 to 24 Minutes | 933 | 14.8% |
| 25 to 29 Minutes | 67 | 1.1% |
| 30 to 34 Minutes | 334 | 5.3% |
| 35 to 39 Minutes | 78 | 1.2% |
| 40 to 44 Minutes | 8 | 0.1% |
| 45 to 59 Minutes | 122 | 1.9% |
| 60 to 89 Minutes | 308 | 4.9% |
| 90 or more Minutes | 153 | 2.4% |
Commute Time by Sex in Beckley
The most common commute times in Beckley are 10 to 14 minutes (833 commuters, 26.1%) for males and 15 to 19 minutes (881 commuters, 28.3%) for females.
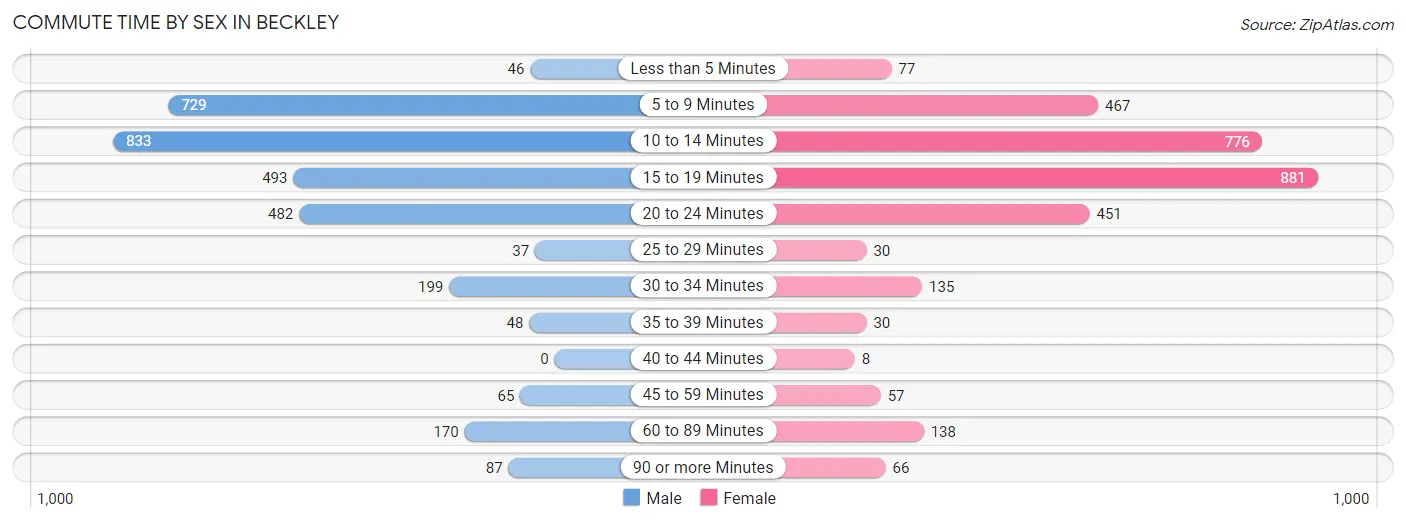
| Commute Time | Male | Female |
| Less than 5 Minutes | 46 (1.4%) | 77 (2.5%) |
| 5 to 9 Minutes | 729 (22.9%) | 467 (15.0%) |
| 10 to 14 Minutes | 833 (26.1%) | 776 (24.9%) |
| 15 to 19 Minutes | 493 (15.5%) | 881 (28.3%) |
| 20 to 24 Minutes | 482 (15.1%) | 451 (14.5%) |
| 25 to 29 Minutes | 37 (1.2%) | 30 (1.0%) |
| 30 to 34 Minutes | 199 (6.2%) | 135 (4.3%) |
| 35 to 39 Minutes | 48 (1.5%) | 30 (1.0%) |
| 40 to 44 Minutes | 0 (0.0%) | 8 (0.3%) |
| 45 to 59 Minutes | 65 (2.0%) | 57 (1.8%) |
| 60 to 89 Minutes | 170 (5.3%) | 138 (4.4%) |
| 90 or more Minutes | 87 (2.7%) | 66 (2.1%) |
Time of Departure to Work by Sex in Beckley
The most frequent times of departure to work in Beckley are 8:00 AM to 8:29 AM (578, 18.1%) for males and 6:30 AM to 6:59 AM (458, 14.7%) for females.
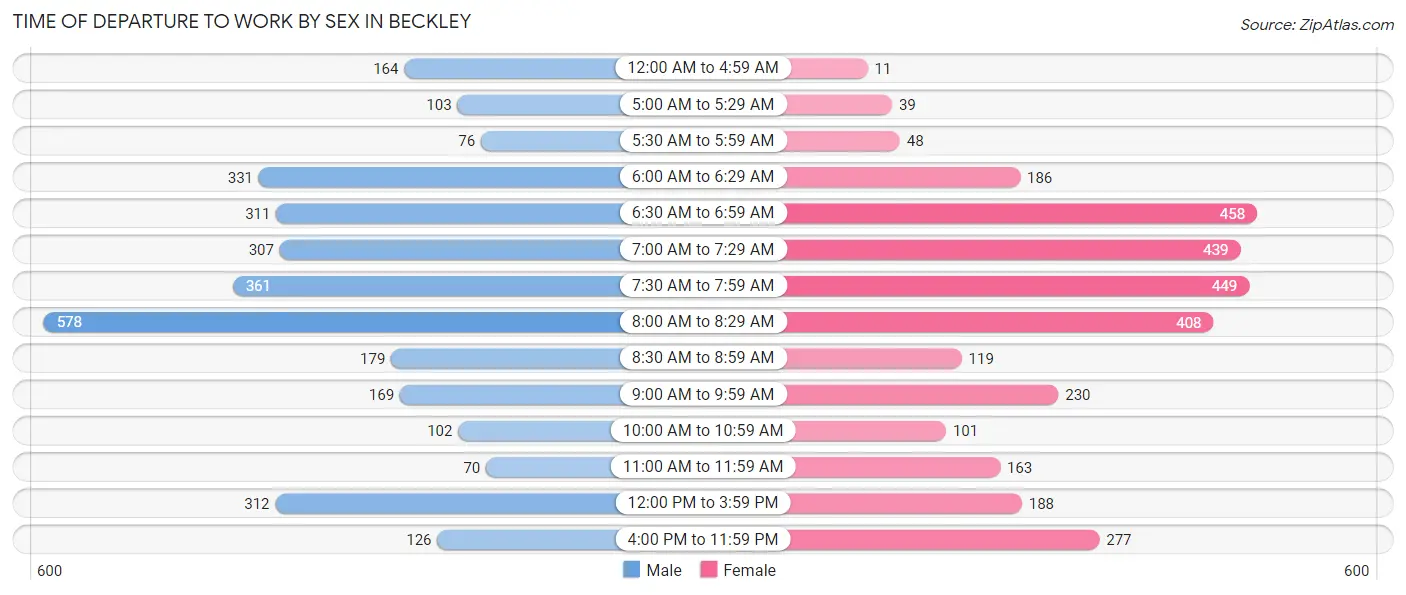
| Time of Departure | Male | Female |
| 12:00 AM to 4:59 AM | 164 (5.1%) | 11 (0.4%) |
| 5:00 AM to 5:29 AM | 103 (3.2%) | 39 (1.3%) |
| 5:30 AM to 5:59 AM | 76 (2.4%) | 48 (1.5%) |
| 6:00 AM to 6:29 AM | 331 (10.4%) | 186 (6.0%) |
| 6:30 AM to 6:59 AM | 311 (9.8%) | 458 (14.7%) |
| 7:00 AM to 7:29 AM | 307 (9.6%) | 439 (14.1%) |
| 7:30 AM to 7:59 AM | 361 (11.3%) | 449 (14.4%) |
| 8:00 AM to 8:29 AM | 578 (18.1%) | 408 (13.1%) |
| 8:30 AM to 8:59 AM | 179 (5.6%) | 119 (3.8%) |
| 9:00 AM to 9:59 AM | 169 (5.3%) | 230 (7.4%) |
| 10:00 AM to 10:59 AM | 102 (3.2%) | 101 (3.2%) |
| 11:00 AM to 11:59 AM | 70 (2.2%) | 163 (5.2%) |
| 12:00 PM to 3:59 PM | 312 (9.8%) | 188 (6.0%) |
| 4:00 PM to 11:59 PM | 126 (4.0%) | 277 (8.9%) |
| Total | 3,189 (100.0%) | 3,116 (100.0%) |
Housing Occupancy in Beckley
Occupancy by Ownership in Beckley
Of the total 7,210 dwellings in Beckley, owner-occupied units account for 4,235 (58.7%), while renter-occupied units make up 2,975 (41.3%).
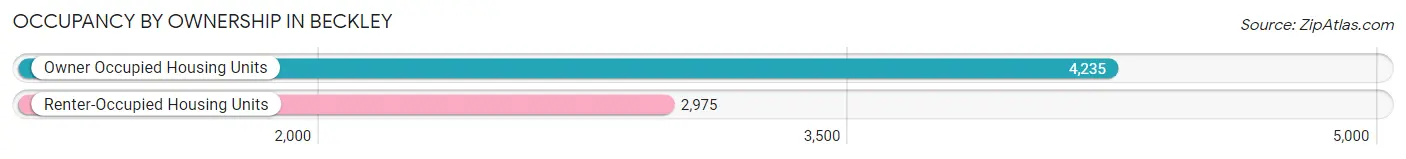
| Occupancy | # Housing Units | % Housing Units |
| Owner Occupied Housing Units | 4,235 | 58.7% |
| Renter-Occupied Housing Units | 2,975 | 41.3% |
| Total Occupied Housing Units | 7,210 | 100.0% |
Occupancy by Household Size in Beckley
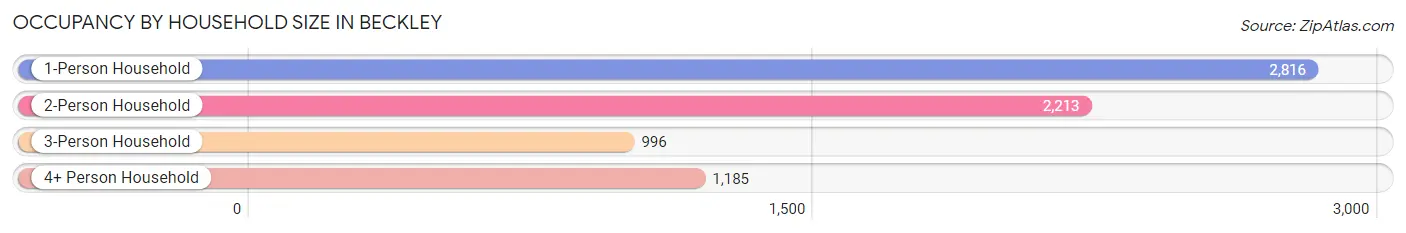
| Household Size | # Housing Units | % Housing Units |
| 1-Person Household | 2,816 | 39.1% |
| 2-Person Household | 2,213 | 30.7% |
| 3-Person Household | 996 | 13.8% |
| 4+ Person Household | 1,185 | 16.4% |
| Total Housing Units | 7,210 | 100.0% |
Occupancy by Ownership by Household Size in Beckley
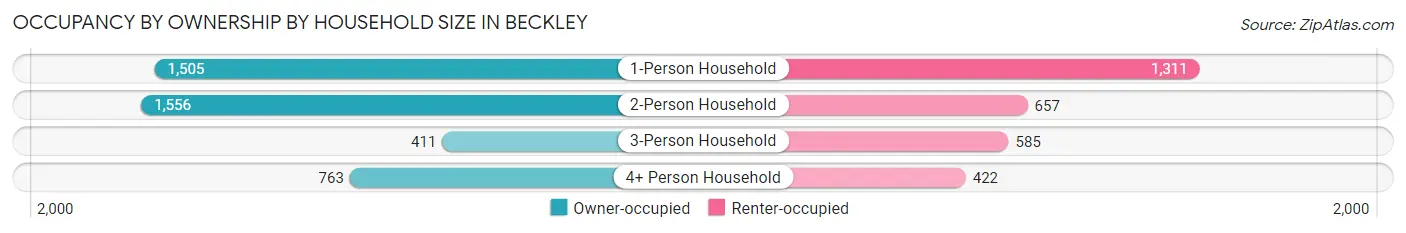
| Household Size | Owner-occupied | Renter-occupied |
| 1-Person Household | 1,505 (53.4%) | 1,311 (46.6%) |
| 2-Person Household | 1,556 (70.3%) | 657 (29.7%) |
| 3-Person Household | 411 (41.3%) | 585 (58.7%) |
| 4+ Person Household | 763 (64.4%) | 422 (35.6%) |
| Total Housing Units | 4,235 (58.7%) | 2,975 (41.3%) |
Occupancy by Educational Attainment in Beckley
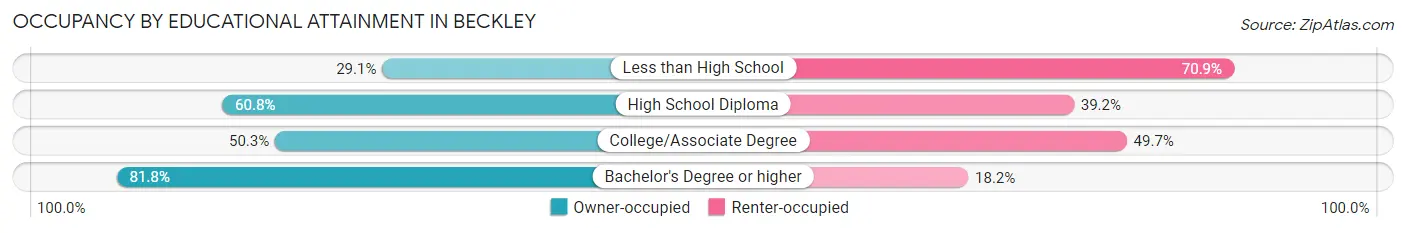
| Household Size | Owner-occupied | Renter-occupied |
| Less than High School | 231 (29.1%) | 563 (70.9%) |
| High School Diploma | 1,321 (60.8%) | 851 (39.2%) |
| College/Associate Degree | 1,261 (50.3%) | 1,244 (49.7%) |
| Bachelor's Degree or higher | 1,422 (81.8%) | 317 (18.2%) |
Occupancy by Age of Householder in Beckley
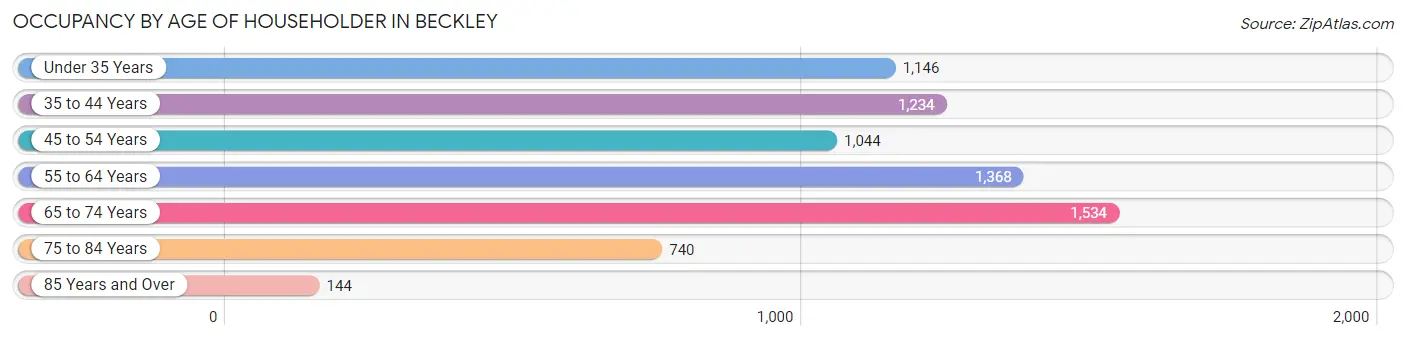
| Age Bracket | # Households | % Households |
| Under 35 Years | 1,146 | 15.9% |
| 35 to 44 Years | 1,234 | 17.1% |
| 45 to 54 Years | 1,044 | 14.5% |
| 55 to 64 Years | 1,368 | 19.0% |
| 65 to 74 Years | 1,534 | 21.3% |
| 75 to 84 Years | 740 | 10.3% |
| 85 Years and Over | 144 | 2.0% |
| Total | 7,210 | 100.0% |
Housing Finances in Beckley
Median Income by Occupancy in Beckley
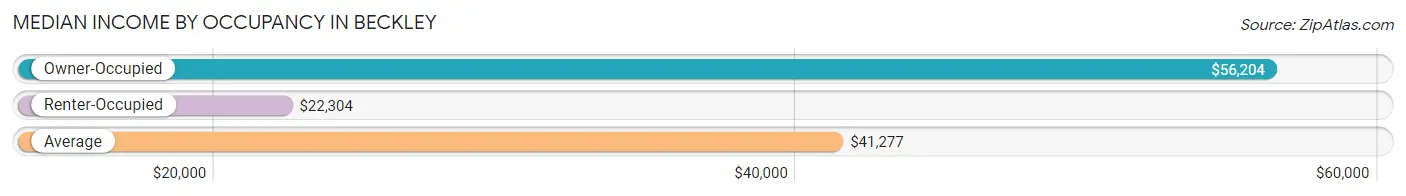
| Occupancy Type | # Households | Median Income |
| Owner-Occupied | 4,235 (58.7%) | $56,204 |
| Renter-Occupied | 2,975 (41.3%) | $22,304 |
| Average | 7,210 (100.0%) | $41,277 |
Occupancy by Householder Income Bracket in Beckley
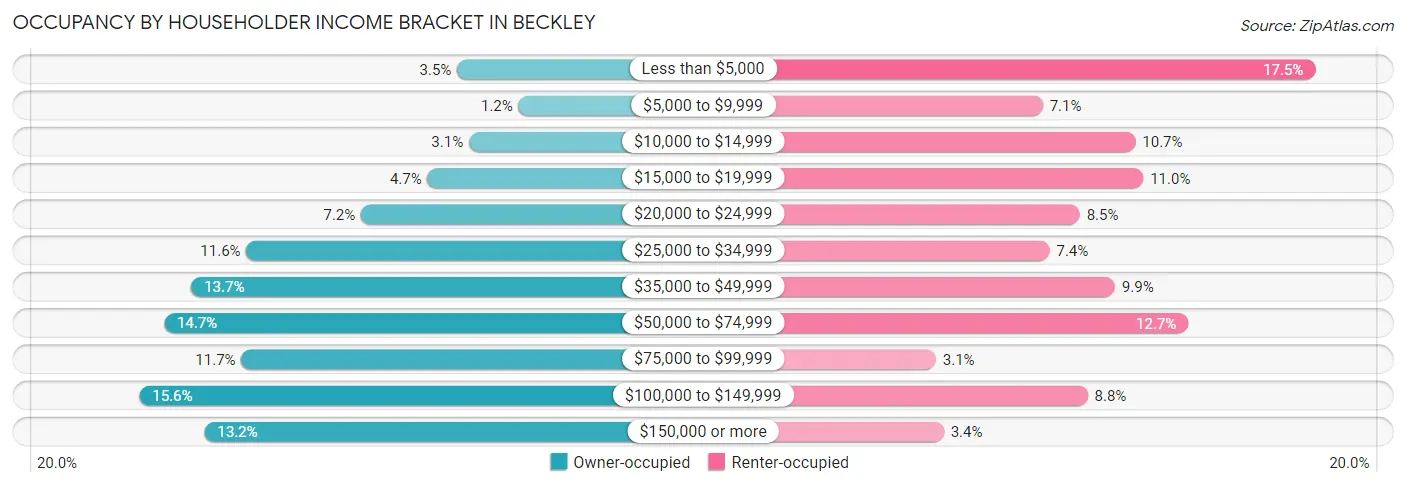
| Income Bracket | Owner-occupied | Renter-occupied |
| Less than $5,000 | 149 (3.5%) | 521 (17.5%) |
| $5,000 to $9,999 | 50 (1.2%) | 212 (7.1%) |
| $10,000 to $14,999 | 130 (3.1%) | 317 (10.7%) |
| $15,000 to $19,999 | 197 (4.6%) | 326 (11.0%) |
| $20,000 to $24,999 | 304 (7.2%) | 254 (8.5%) |
| $25,000 to $34,999 | 489 (11.6%) | 220 (7.4%) |
| $35,000 to $49,999 | 578 (13.7%) | 294 (9.9%) |
| $50,000 to $74,999 | 622 (14.7%) | 377 (12.7%) |
| $75,000 to $99,999 | 497 (11.7%) | 91 (3.1%) |
| $100,000 to $149,999 | 662 (15.6%) | 263 (8.8%) |
| $150,000 or more | 557 (13.2%) | 100 (3.4%) |
| Total | 4,235 (100.0%) | 2,975 (100.0%) |
Monthly Housing Cost Tiers in Beckley
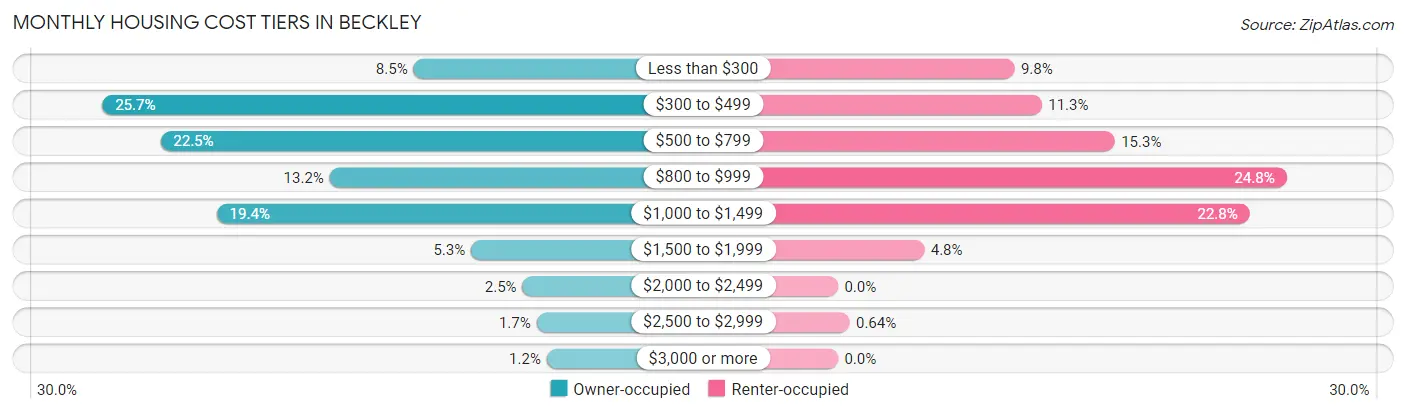
| Monthly Cost | Owner-occupied | Renter-occupied |
| Less than $300 | 361 (8.5%) | 290 (9.8%) |
| $300 to $499 | 1,089 (25.7%) | 335 (11.3%) |
| $500 to $799 | 953 (22.5%) | 455 (15.3%) |
| $800 to $999 | 557 (13.2%) | 738 (24.8%) |
| $1,000 to $1,499 | 821 (19.4%) | 677 (22.8%) |
| $1,500 to $1,999 | 226 (5.3%) | 142 (4.8%) |
| $2,000 to $2,499 | 106 (2.5%) | 0 (0.0%) |
| $2,500 to $2,999 | 73 (1.7%) | 19 (0.6%) |
| $3,000 or more | 49 (1.2%) | 0 (0.0%) |
| Total | 4,235 (100.0%) | 2,975 (100.0%) |
Physical Housing Characteristics in Beckley
Housing Structures in Beckley
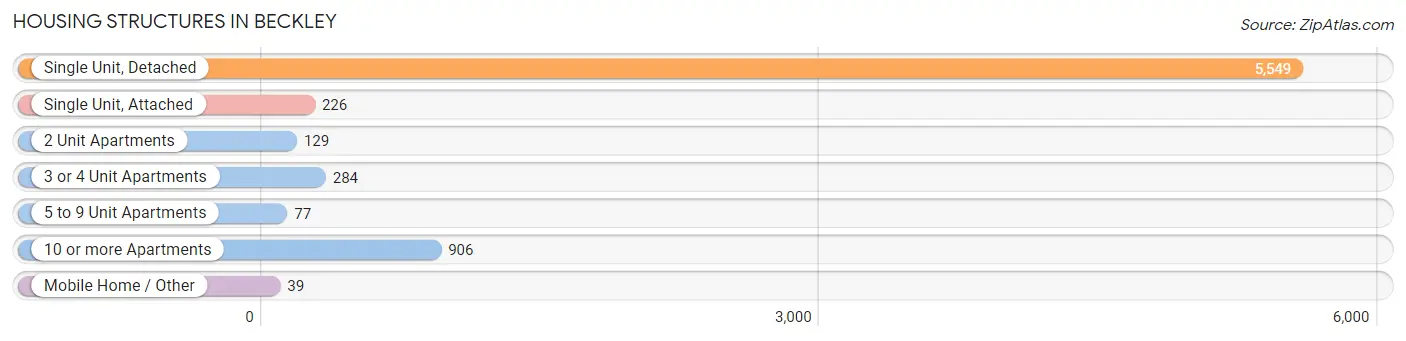
| Structure Type | # Housing Units | % Housing Units |
| Single Unit, Detached | 5,549 | 77.0% |
| Single Unit, Attached | 226 | 3.1% |
| 2 Unit Apartments | 129 | 1.8% |
| 3 or 4 Unit Apartments | 284 | 3.9% |
| 5 to 9 Unit Apartments | 77 | 1.1% |
| 10 or more Apartments | 906 | 12.6% |
| Mobile Home / Other | 39 | 0.5% |
| Total | 7,210 | 100.0% |
Housing Structures by Occupancy in Beckley
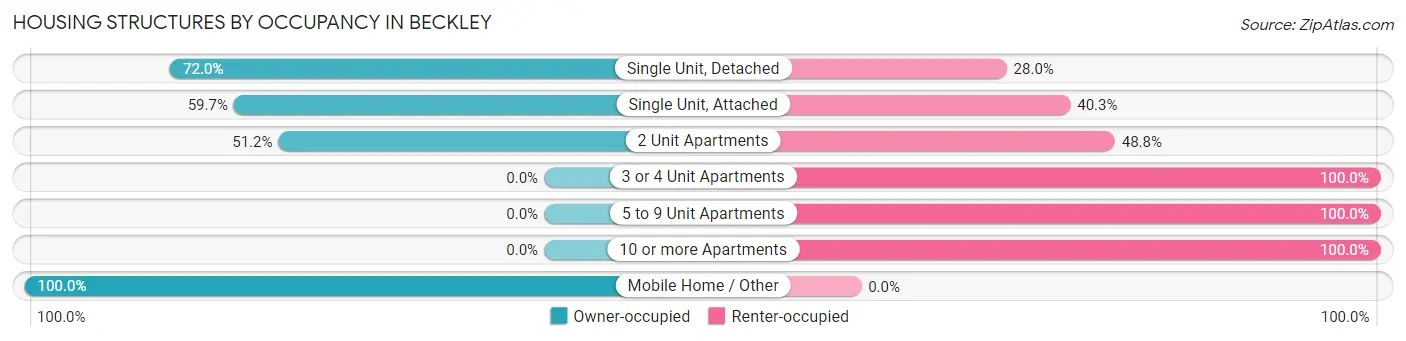
| Structure Type | Owner-occupied | Renter-occupied |
| Single Unit, Detached | 3,995 (72.0%) | 1,554 (28.0%) |
| Single Unit, Attached | 135 (59.7%) | 91 (40.3%) |
| 2 Unit Apartments | 66 (51.2%) | 63 (48.8%) |
| 3 or 4 Unit Apartments | 0 (0.0%) | 284 (100.0%) |
| 5 to 9 Unit Apartments | 0 (0.0%) | 77 (100.0%) |
| 10 or more Apartments | 0 (0.0%) | 906 (100.0%) |
| Mobile Home / Other | 39 (100.0%) | 0 (0.0%) |
| Total | 4,235 (58.7%) | 2,975 (41.3%) |
Housing Structures by Number of Rooms in Beckley
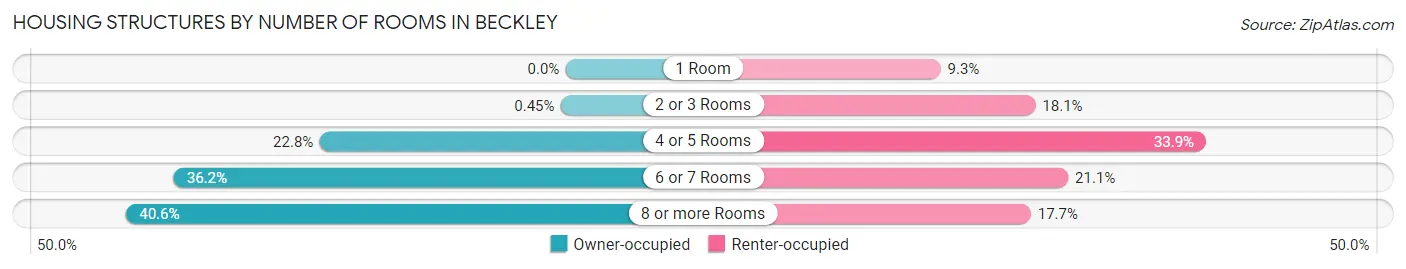
| Number of Rooms | Owner-occupied | Renter-occupied |
| 1 Room | 0 (0.0%) | 277 (9.3%) |
| 2 or 3 Rooms | 19 (0.4%) | 538 (18.1%) |
| 4 or 5 Rooms | 964 (22.8%) | 1,007 (33.9%) |
| 6 or 7 Rooms | 1,533 (36.2%) | 628 (21.1%) |
| 8 or more Rooms | 1,719 (40.6%) | 525 (17.6%) |
| Total | 4,235 (100.0%) | 2,975 (100.0%) |
Housing Structure by Heating Type in Beckley
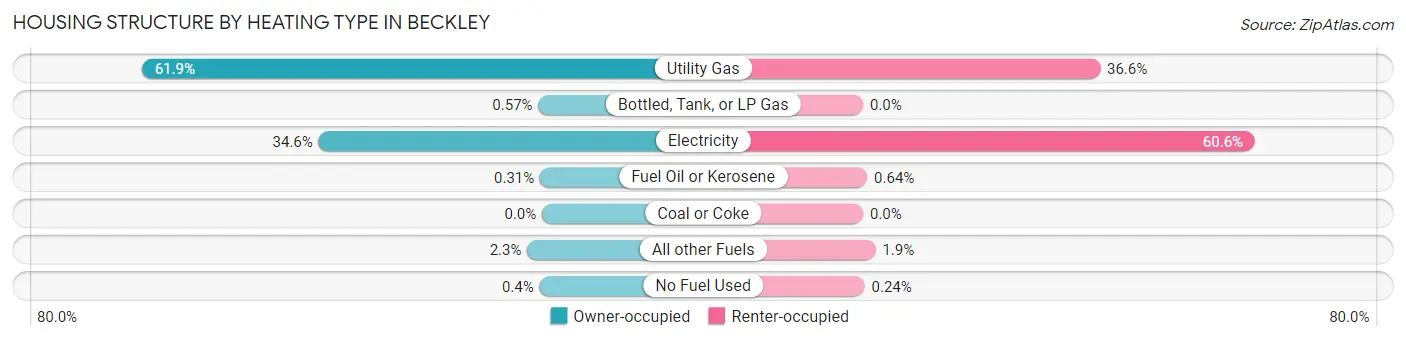
| Heating Type | Owner-occupied | Renter-occupied |
| Utility Gas | 2,621 (61.9%) | 1,090 (36.6%) |
| Bottled, Tank, or LP Gas | 24 (0.6%) | 0 (0.0%) |
| Electricity | 1,463 (34.5%) | 1,802 (60.6%) |
| Fuel Oil or Kerosene | 13 (0.3%) | 19 (0.6%) |
| Coal or Coke | 0 (0.0%) | 0 (0.0%) |
| All other Fuels | 97 (2.3%) | 57 (1.9%) |
| No Fuel Used | 17 (0.4%) | 7 (0.2%) |
| Total | 4,235 (100.0%) | 2,975 (100.0%) |
Household Vehicle Usage in Beckley
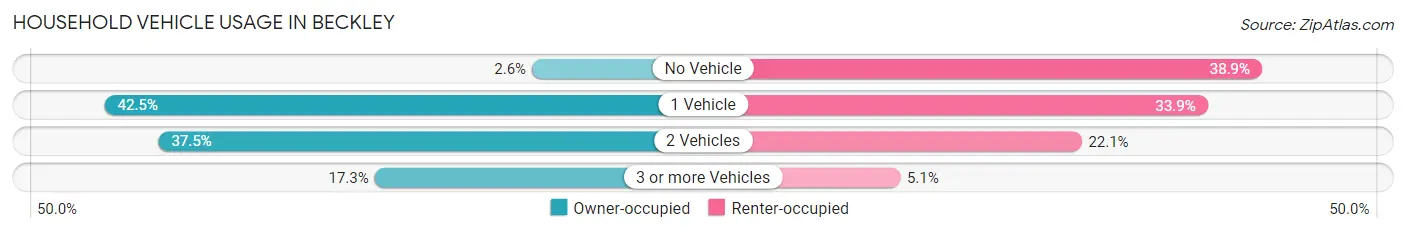
| Vehicles per Household | Owner-occupied | Renter-occupied |
| No Vehicle | 112 (2.6%) | 1,158 (38.9%) |
| 1 Vehicle | 1,801 (42.5%) | 1,007 (33.9%) |
| 2 Vehicles | 1,588 (37.5%) | 657 (22.1%) |
| 3 or more Vehicles | 734 (17.3%) | 153 (5.1%) |
| Total | 4,235 (100.0%) | 2,975 (100.0%) |
Real Estate & Mortgages in Beckley
Real Estate and Mortgage Overview in Beckley
| Characteristic | Without Mortgage | With Mortgage |
| Housing Units | 1,912 | 2,323 |
| Median Property Value | $134,000 | $135,700 |
| Median Household Income | $53,380 | $327 |
| Monthly Housing Costs | $387 | $49 |
| Real Estate Taxes | $679 | $94 |
Property Value by Mortgage Status in Beckley
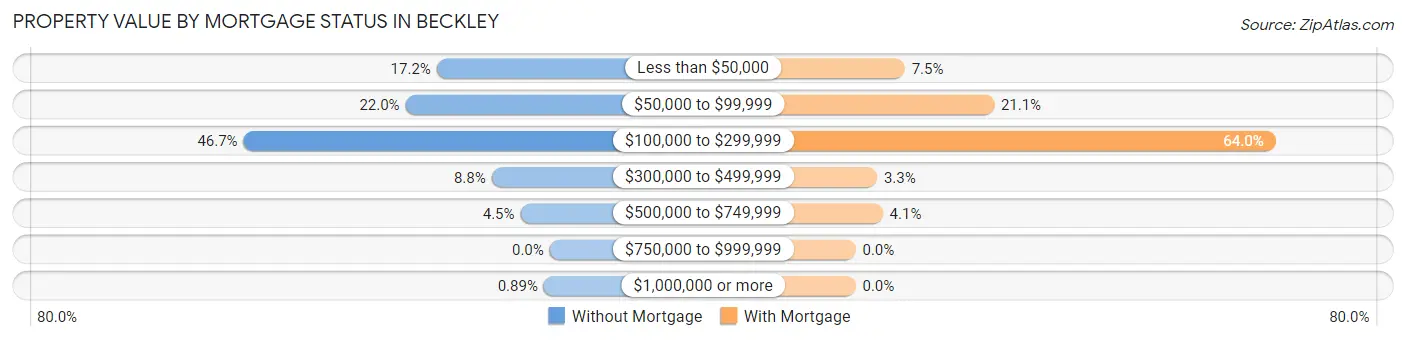
| Property Value | Without Mortgage | With Mortgage |
| Less than $50,000 | 329 (17.2%) | 174 (7.5%) |
| $50,000 to $99,999 | 420 (22.0%) | 490 (21.1%) |
| $100,000 to $299,999 | 892 (46.7%) | 1,487 (64.0%) |
| $300,000 to $499,999 | 169 (8.8%) | 76 (3.3%) |
| $500,000 to $749,999 | 85 (4.4%) | 96 (4.1%) |
| $750,000 to $999,999 | 0 (0.0%) | 0 (0.0%) |
| $1,000,000 or more | 17 (0.9%) | 0 (0.0%) |
| Total | 1,912 (100.0%) | 2,323 (100.0%) |
Household Income by Mortgage Status in Beckley
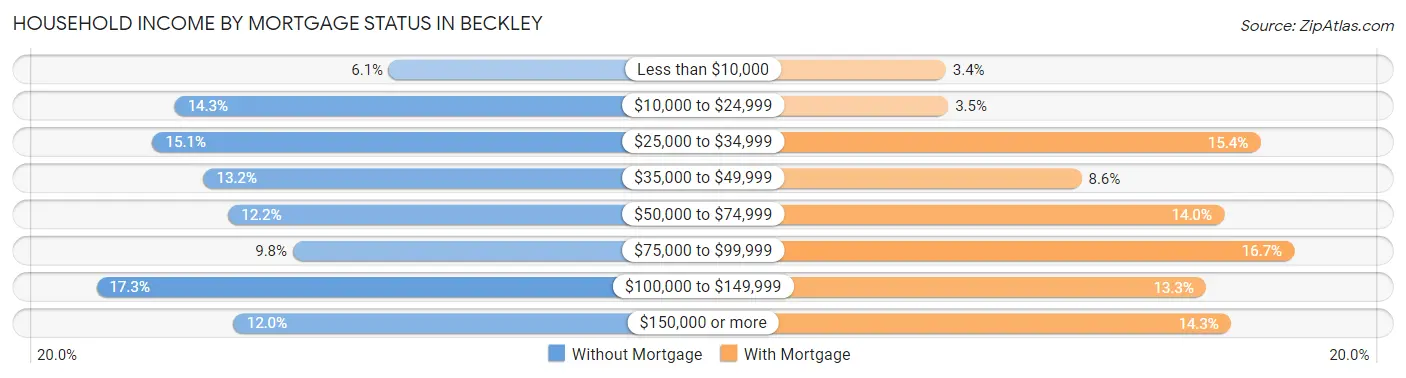
| Household Income | Without Mortgage | With Mortgage |
| Less than $10,000 | 117 (6.1%) | 80 (3.4%) |
| $10,000 to $24,999 | 273 (14.3%) | 82 (3.5%) |
| $25,000 to $34,999 | 289 (15.1%) | 358 (15.4%) |
| $35,000 to $49,999 | 252 (13.2%) | 200 (8.6%) |
| $50,000 to $74,999 | 234 (12.2%) | 326 (14.0%) |
| $75,000 to $99,999 | 187 (9.8%) | 388 (16.7%) |
| $100,000 to $149,999 | 330 (17.3%) | 310 (13.3%) |
| $150,000 or more | 230 (12.0%) | 332 (14.3%) |
| Total | 1,912 (100.0%) | 2,323 (100.0%) |
Property Value to Household Income Ratio in Beckley
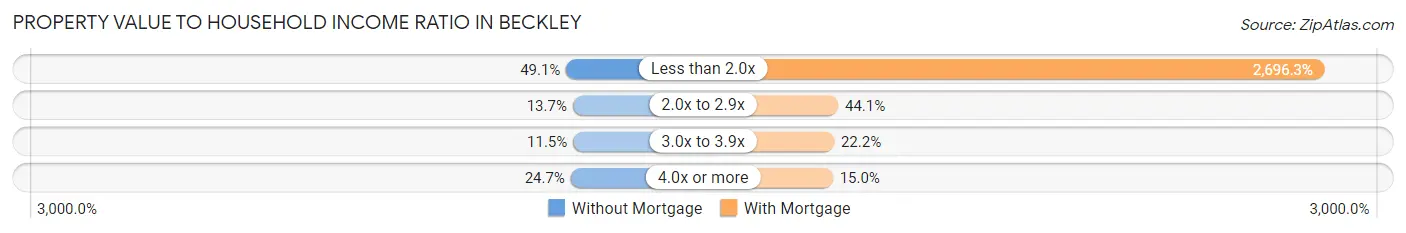
| Value-to-Income Ratio | Without Mortgage | With Mortgage |
| Less than 2.0x | 938 (49.1%) | 62,636 (2,696.3%) |
| 2.0x to 2.9x | 262 (13.7%) | 1,024 (44.1%) |
| 3.0x to 3.9x | 220 (11.5%) | 515 (22.2%) |
| 4.0x or more | 473 (24.7%) | 349 (15.0%) |
| Total | 1,912 (100.0%) | 2,323 (100.0%) |
Real Estate Taxes by Mortgage Status in Beckley
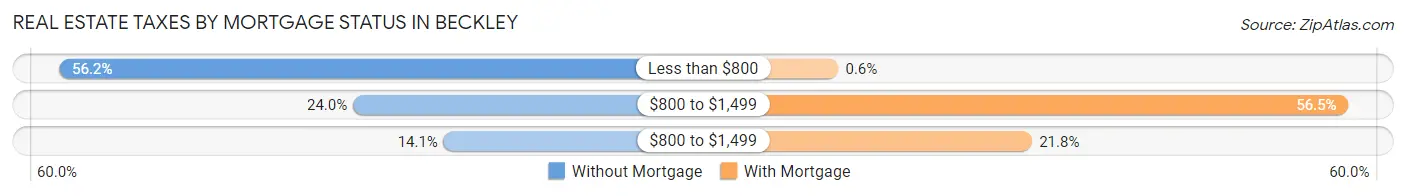
| Property Taxes | Without Mortgage | With Mortgage |
| Less than $800 | 1,075 (56.2%) | 14 (0.6%) |
| $800 to $1,499 | 459 (24.0%) | 1,312 (56.5%) |
| $800 to $1,499 | 269 (14.1%) | 507 (21.8%) |
| Total | 1,912 (100.0%) | 2,323 (100.0%) |
Health & Disability in Beckley
Health Insurance Coverage by Age in Beckley
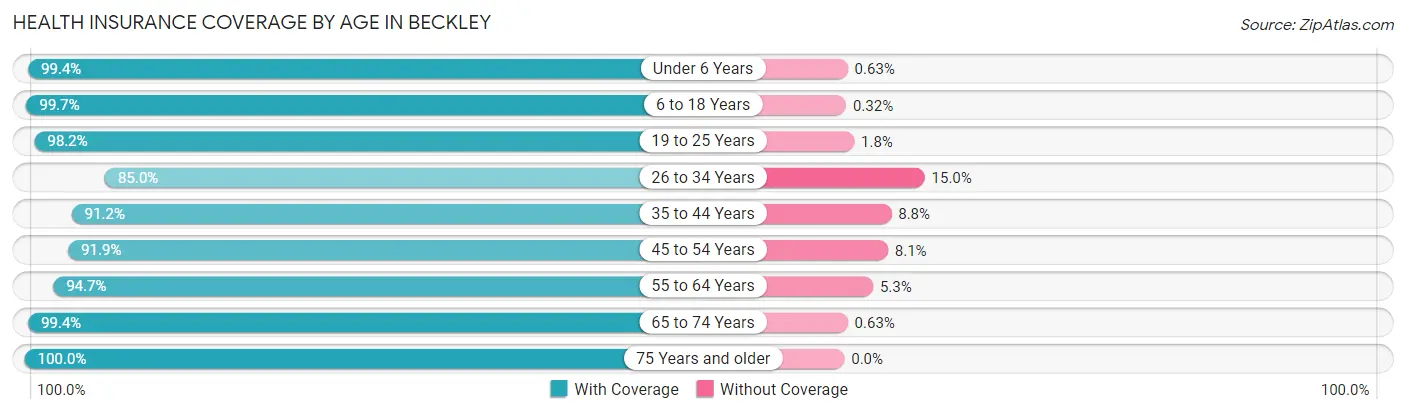
| Age Bracket | With Coverage | Without Coverage |
| Under 6 Years | 1,105 (99.4%) | 7 (0.6%) |
| 6 to 18 Years | 2,801 (99.7%) | 9 (0.3%) |
| 19 to 25 Years | 1,499 (98.2%) | 28 (1.8%) |
| 26 to 34 Years | 1,686 (85.0%) | 297 (15.0%) |
| 35 to 44 Years | 1,875 (91.2%) | 180 (8.8%) |
| 45 to 54 Years | 1,426 (91.9%) | 126 (8.1%) |
| 55 to 64 Years | 2,146 (94.7%) | 121 (5.3%) |
| 65 to 74 Years | 2,371 (99.4%) | 15 (0.6%) |
| 75 Years and older | 1,148 (100.0%) | 0 (0.0%) |
| Total | 16,057 (95.4%) | 783 (4.6%) |
Health Insurance Coverage by Citizenship Status in Beckley
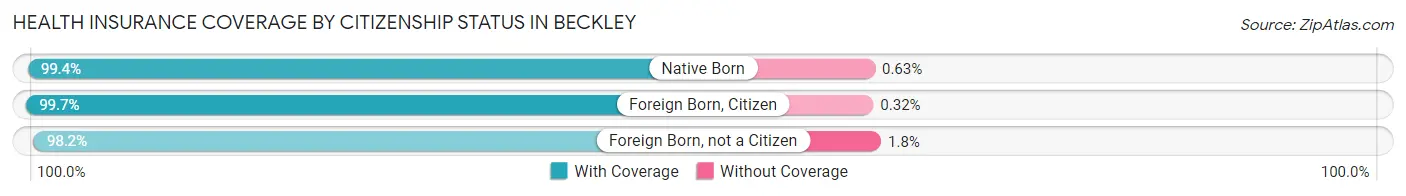
| Citizenship Status | With Coverage | Without Coverage |
| Native Born | 1,105 (99.4%) | 7 (0.6%) |
| Foreign Born, Citizen | 2,801 (99.7%) | 9 (0.3%) |
| Foreign Born, not a Citizen | 1,499 (98.2%) | 28 (1.8%) |
Health Insurance Coverage by Household Income in Beckley
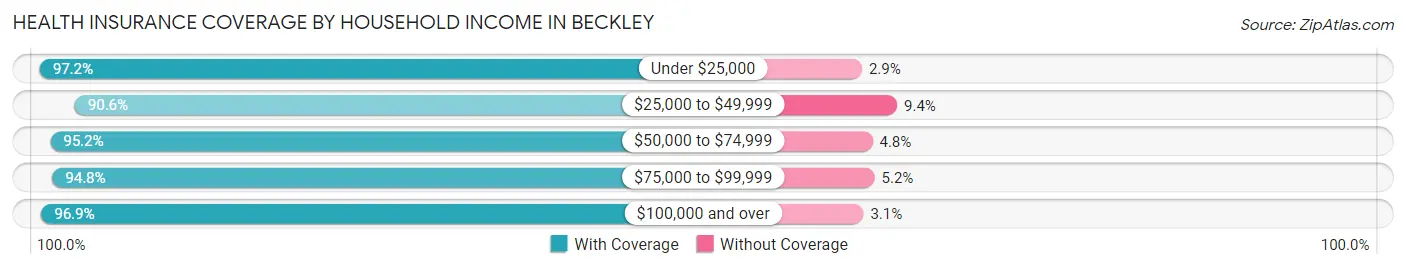
| Household Income | With Coverage | Without Coverage |
| Under $25,000 | 4,190 (97.2%) | 123 (2.9%) |
| $25,000 to $49,999 | 2,760 (90.6%) | 287 (9.4%) |
| $50,000 to $74,999 | 2,746 (95.2%) | 139 (4.8%) |
| $75,000 to $99,999 | 1,309 (94.8%) | 72 (5.2%) |
| $100,000 and over | 4,613 (96.9%) | 149 (3.1%) |
Public vs Private Health Insurance Coverage by Age in Beckley
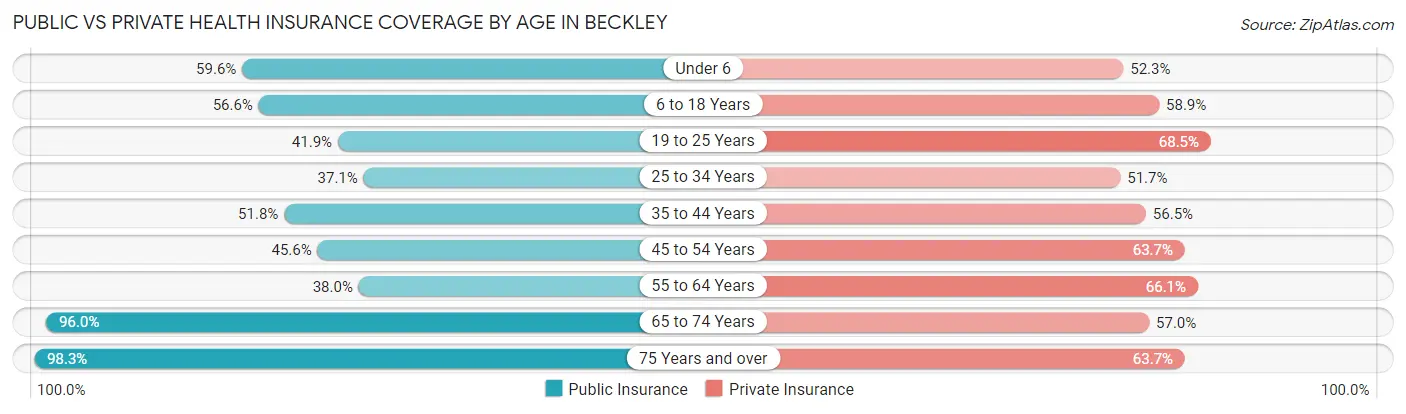
| Age Bracket | Public Insurance | Private Insurance |
| Under 6 | 663 (59.6%) | 581 (52.2%) |
| 6 to 18 Years | 1,589 (56.6%) | 1,655 (58.9%) |
| 19 to 25 Years | 639 (41.8%) | 1,046 (68.5%) |
| 25 to 34 Years | 735 (37.1%) | 1,025 (51.7%) |
| 35 to 44 Years | 1,065 (51.8%) | 1,160 (56.5%) |
| 45 to 54 Years | 708 (45.6%) | 988 (63.7%) |
| 55 to 64 Years | 861 (38.0%) | 1,498 (66.1%) |
| 65 to 74 Years | 2,291 (96.0%) | 1,361 (57.0%) |
| 75 Years and over | 1,128 (98.3%) | 731 (63.7%) |
| Total | 9,679 (57.5%) | 10,045 (59.7%) |
Disability Status by Sex by Age in Beckley
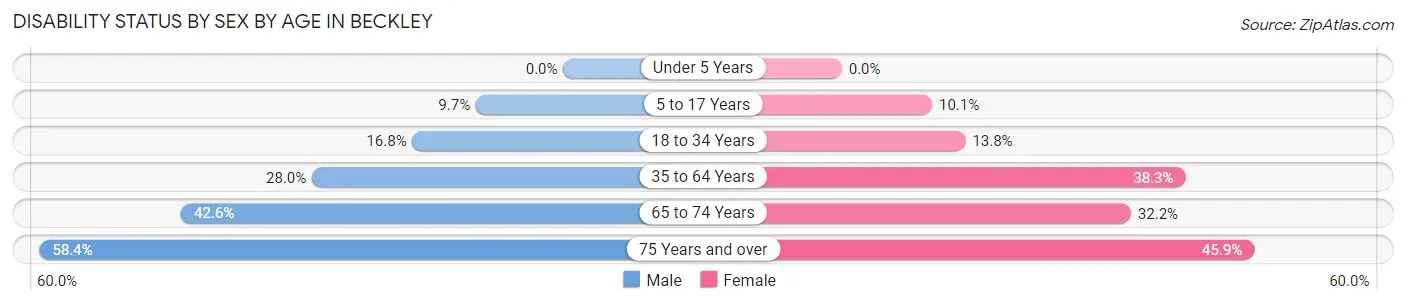
| Age Bracket | Male | Female |
| Under 5 Years | 0 (0.0%) | 0 (0.0%) |
| 5 to 17 Years | 148 (9.7%) | 128 (10.1%) |
| 18 to 34 Years | 365 (16.8%) | 210 (13.8%) |
| 35 to 64 Years | 706 (28.0%) | 1,282 (38.3%) |
| 65 to 74 Years | 491 (42.6%) | 397 (32.2%) |
| 75 Years and over | 262 (58.4%) | 321 (45.9%) |
Disability Class by Sex by Age in Beckley
Disability Class: Hearing Difficulty
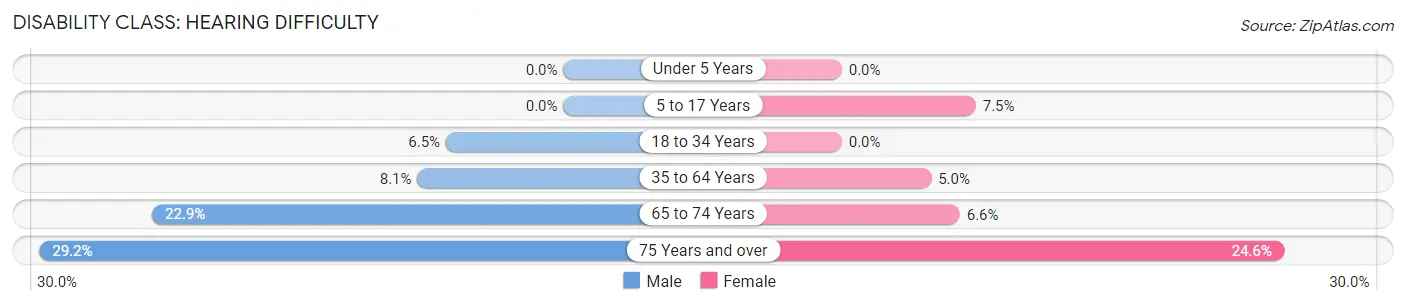
| Age Bracket | Male | Female |
| Under 5 Years | 0 (0.0%) | 0 (0.0%) |
| 5 to 17 Years | 0 (0.0%) | 95 (7.5%) |
| 18 to 34 Years | 142 (6.5%) | 0 (0.0%) |
| 35 to 64 Years | 205 (8.1%) | 167 (5.0%) |
| 65 to 74 Years | 264 (22.9%) | 81 (6.6%) |
| 75 Years and over | 131 (29.2%) | 172 (24.6%) |
Disability Class: Vision Difficulty
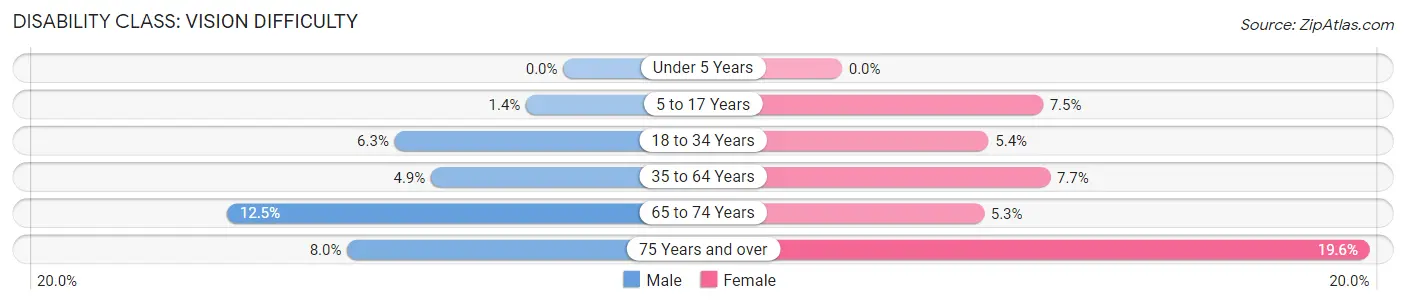
| Age Bracket | Male | Female |
| Under 5 Years | 0 (0.0%) | 0 (0.0%) |
| 5 to 17 Years | 21 (1.4%) | 95 (7.5%) |
| 18 to 34 Years | 136 (6.3%) | 83 (5.4%) |
| 35 to 64 Years | 124 (4.9%) | 259 (7.7%) |
| 65 to 74 Years | 144 (12.5%) | 65 (5.3%) |
| 75 Years and over | 36 (8.0%) | 137 (19.6%) |
Disability Class: Cognitive Difficulty
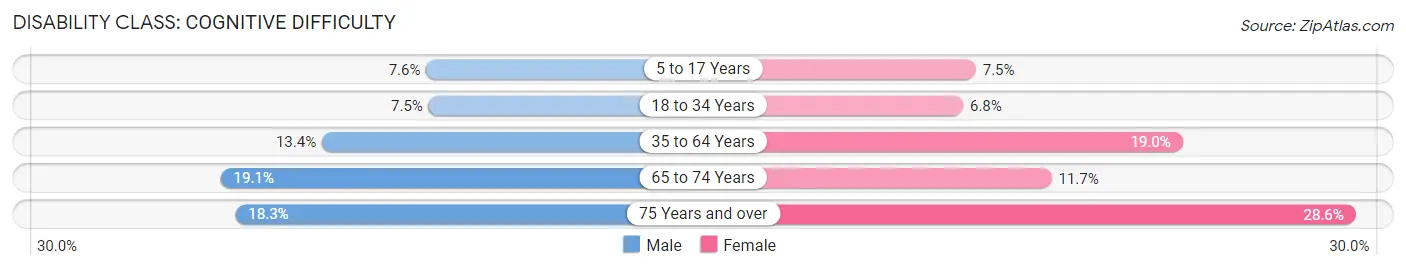
| Age Bracket | Male | Female |
| 5 to 17 Years | 116 (7.6%) | 95 (7.5%) |
| 18 to 34 Years | 163 (7.5%) | 103 (6.8%) |
| 35 to 64 Years | 339 (13.4%) | 636 (19.0%) |
| 65 to 74 Years | 220 (19.1%) | 144 (11.7%) |
| 75 Years and over | 82 (18.3%) | 200 (28.6%) |
Disability Class: Ambulatory Difficulty
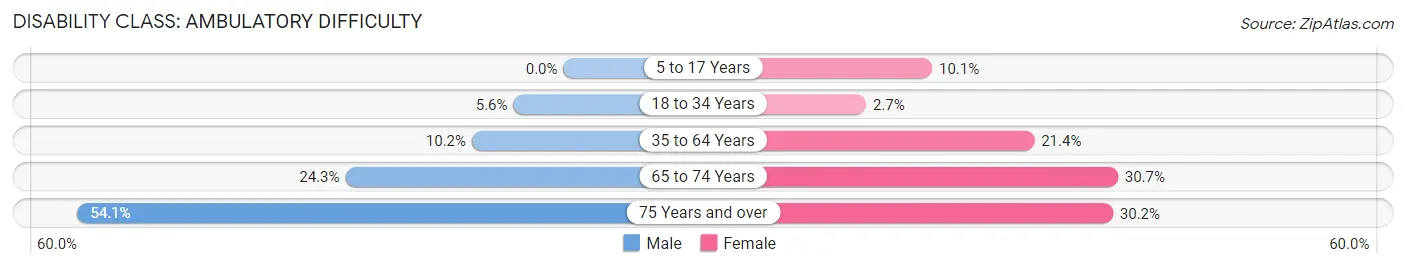
| Age Bracket | Male | Female |
| 5 to 17 Years | 0 (0.0%) | 128 (10.1%) |
| 18 to 34 Years | 121 (5.6%) | 41 (2.7%) |
| 35 to 64 Years | 257 (10.2%) | 718 (21.4%) |
| 65 to 74 Years | 280 (24.3%) | 379 (30.7%) |
| 75 Years and over | 243 (54.1%) | 211 (30.2%) |
Disability Class: Self-Care Difficulty
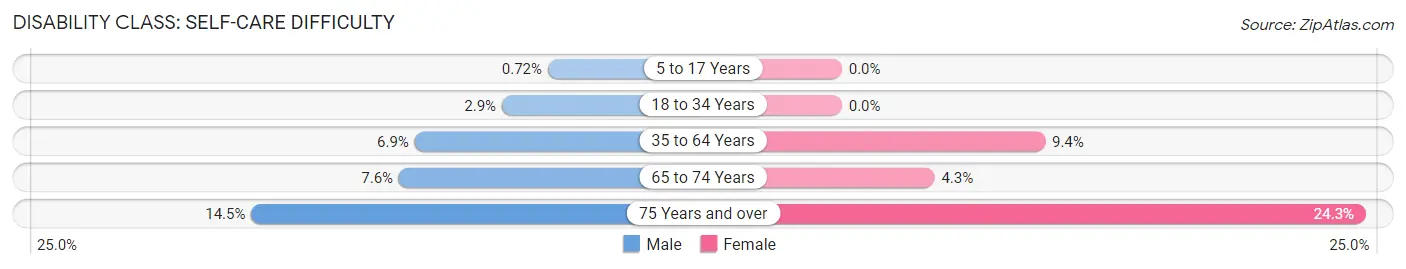
| Age Bracket | Male | Female |
| 5 to 17 Years | 11 (0.7%) | 0 (0.0%) |
| 18 to 34 Years | 62 (2.9%) | 0 (0.0%) |
| 35 to 64 Years | 174 (6.9%) | 316 (9.4%) |
| 65 to 74 Years | 88 (7.6%) | 53 (4.3%) |
| 75 Years and over | 65 (14.5%) | 170 (24.3%) |
Technology Access in Beckley
Computing Device Access in Beckley

| Device Type | # Households | % Households |
| Desktop or Laptop | 4,441 | 61.6% |
| Smartphone | 5,359 | 74.3% |
| Tablet | 3,725 | 51.7% |
| No Computing Device | 1,072 | 14.9% |
| Total | 7,210 | 100.0% |
Internet Access in Beckley
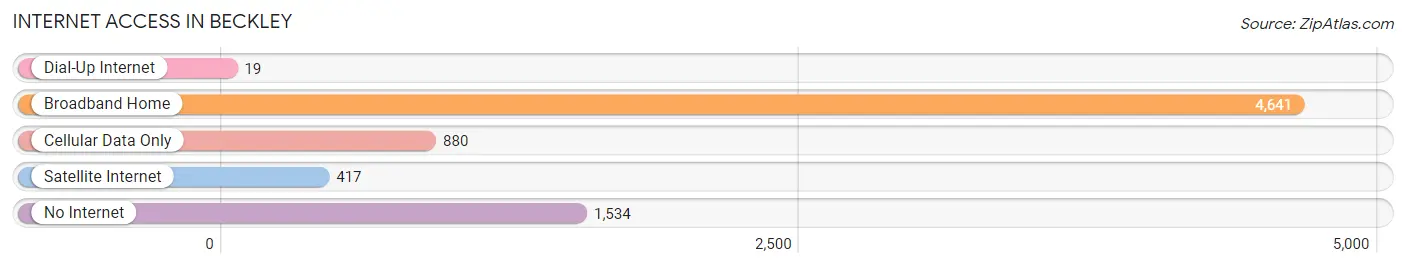
| Internet Type | # Households | % Households |
| Dial-Up Internet | 19 | 0.3% |
| Broadband Home | 4,641 | 64.4% |
| Cellular Data Only | 880 | 12.2% |
| Satellite Internet | 417 | 5.8% |
| No Internet | 1,534 | 21.3% |
| Total | 7,210 | 100.0% |
Beckley Summary
Beckley, West Virginia is a small city located in the Appalachian Mountains of southern West Virginia. It is the county seat of Raleigh County and is the largest city in the county. The city is located at the intersection of U.S. Route 19 and Interstate 64, and is approximately 130 miles south of the state capital of Charleston.
History
Beckley was founded in 1838 by Alfred Beckley, a Virginia native who had served in the War of 1812. He purchased the land from the local Native Americans and named the settlement Beckleyville. The town was incorporated in 1873 and was named after Alfred Beckley.
Beckley was an important coal mining center in the late 19th and early 20th centuries. The city was home to several coal mines, including the Raleigh County Coal Company, which was founded in 1882. The coal industry was the primary source of employment for the city's residents until the mid-20th century.
In the 1950s, Beckley began to diversify its economy. The city became a hub for the automotive industry, with several car dealerships and auto parts stores opening in the area. The city also became a center for the tourism industry, with several hotels and resorts opening in the area.
Geography
Beckley is located in the Appalachian Mountains of southern West Virginia. The city is situated at the intersection of U.S. Route 19 and Interstate 64, and is approximately 130 miles south of the state capital of Charleston. The city is located in the New River Gorge National Park, which is a popular destination for outdoor recreation.
The city has a total area of 8.3 square miles, of which 8.2 square miles is land and 0.1 square miles is water. The city is located at an elevation of 1,890 feet above sea level.
Economy
Beckley's economy is largely based on the tourism industry. The city is home to several hotels and resorts, as well as a variety of restaurants and shops. The city is also home to several car dealerships and auto parts stores.
The city is also home to several manufacturing companies, including a steel mill and a paper mill. The city is also home to several coal mines, although the coal industry is no longer the primary source of employment for the city's residents.
Demographics
As of the 2010 census, the population of Beckley was 17,614. The city has a population density of 2,097 people per square mile. The median age of the city's population is 40.7 years, and the median household income is $37,945.
The racial makeup of the city is 87.3% White, 8.2% African American, 0.3% Native American, 0.7% Asian, 0.1% Pacific Islander, 1.2% from other races, and 2.4% from two or more races. The city is home to a large number of immigrants, with 8.3% of the population being foreign-born.
Conclusion
Beckley, West Virginia is a small city located in the Appalachian Mountains of southern West Virginia. It is the county seat of Raleigh County and is the largest city in the county. The city is located at the intersection of U.S. Route 19 and Interstate 64, and is approximately 130 miles south of the state capital of Charleston. Beckley was founded in 1838 and was an important coal mining center in the late 19th and early 20th centuries. The city has since diversified its economy and is now largely based on the tourism industry. As of the 2010 census, the population of Beckley was 17,614. The city has a population density of 2,097 people per square mile and a median age of 40.7 years. The racial makeup of the city is 87.3% White, 8.2% African American, 0.3% Native American, 0.7% Asian, 0.1% Pacific Islander, 1.2% from other races, and 2.4% from two or more races. The city is home to a large number of immigrants, with 8.3% of the population being foreign-born.
Common Questions
What is Per Capita Income in Beckley?
Per Capita income in Beckley is $29,877.
What is the Median Family Income in Beckley?
Median Family Income in Beckley is $65,032.
What is the Median Household income in Beckley?
Median Household Income in Beckley is $41,277.
What is Income or Wage Gap in Beckley?
Income or Wage Gap in Beckley is 28.8%.
Women in Beckley earn 71.2 cents for every dollar earned by a man.
What is Family Income Deficit in Beckley?
Family Income Deficit in Beckley is $12,080.
Families that are below poverty line in Beckley earn $12,080 less on average than the poverty threshold level.
What is Inequality or Gini Index in Beckley?
Inequality or Gini Index in Beckley is 0.53.
What is the Total Population of Beckley?
Total Population of Beckley is 17,132.
What is the Total Male Population of Beckley?
Total Male Population of Beckley is 8,507.
What is the Total Female Population of Beckley?
Total Female Population of Beckley is 8,625.
What is the Ratio of Males per 100 Females in Beckley?
There are 98.63 Males per 100 Females in Beckley.
What is the Ratio of Females per 100 Males in Beckley?
There are 101.39 Females per 100 Males in Beckley.
What is the Median Population Age in Beckley?
Median Population Age in Beckley is 40.7 Years.
What is the Average Family Size in Beckley
Average Family Size in Beckley is 3.0 People.
What is the Average Household Size in Beckley
Average Household Size in Beckley is 2.3 People.
How Large is the Labor Force in Beckley?
There are 7,009 People in the Labor Forcein in Beckley.
What is the Percentage of People in the Labor Force in Beckley?
50.7% of People are in the Labor Force in Beckley.
What is the Unemployment Rate in Beckley?
Unemployment Rate in Beckley is 4.7%.