Craigsville, WV Map & Demographics
Craigsville Map
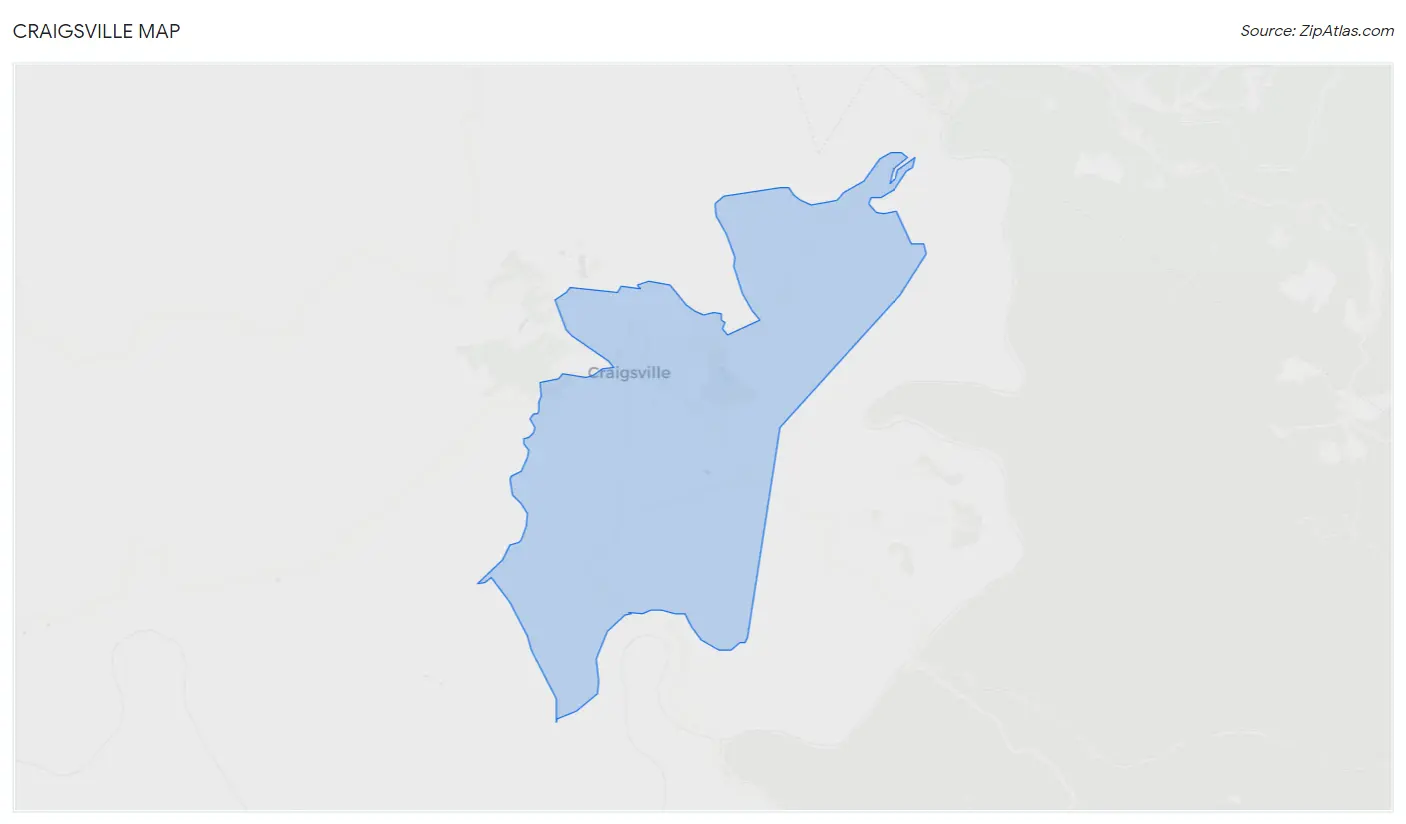
Craigsville Overview
$24,770
PER CAPITA INCOME
$56,798
AVG FAMILY INCOME
$34,375
AVG HOUSEHOLD INCOME
43.6%
WAGE / INCOME GAP [ % ]
56.4¢/ $1
WAGE / INCOME GAP [ $ ]
0.40
INEQUALITY / GINI INDEX
2,051
TOTAL POPULATION
1,132
MALE POPULATION
919
FEMALE POPULATION
123.18
MALES / 100 FEMALES
81.18
FEMALES / 100 MALES
55.4
MEDIAN AGE
2.7
AVG FAMILY SIZE
2.2
AVG HOUSEHOLD SIZE
686
LABOR FORCE [ PEOPLE ]
38.7%
PERCENT IN LABOR FORCE
Craigsville Zip Codes
Craigsville Area Codes
Income in Craigsville
Income Overview in Craigsville
Per Capita Income in Craigsville is $24,770, while median incomes of families and households are $56,798 and $34,375 respectively.
| Characteristic | Number | Measure |
| Per Capita Income | 2,051 | $24,770 |
| Median Family Income | 586 | $56,798 |
| Mean Family Income | 586 | $60,860 |
| Median Household Income | 948 | $34,375 |
| Mean Household Income | 948 | $47,003 |
| Income Deficit | 586 | $0 |
| Wage / Income Gap (%) | 2,051 | 43.59% |
| Wage / Income Gap ($) | 2,051 | 56.41¢ per $1 |
| Gini / Inequality Index | 2,051 | 0.40 |
Earnings by Sex in Craigsville
Average Earnings in Craigsville are $33,598, $46,387 for men and $26,167 for women, a difference of 43.6%.
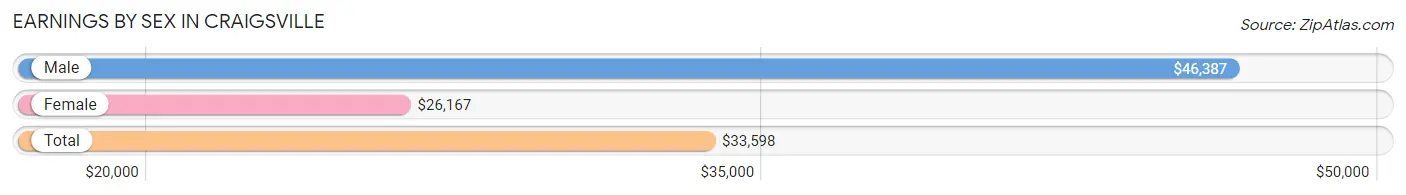
| Sex | Number | Average Earnings |
| Male | 409 (54.6%) | $46,387 |
| Female | 340 (45.4%) | $26,167 |
| Total | 749 (100.0%) | $33,598 |
Earnings by Sex by Income Bracket in Craigsville
The most common earnings brackets in Craigsville are $55,000 to $64,999 for men (98 | 24.0%) and $10,000 to $12,499 for women (62 | 18.2%).
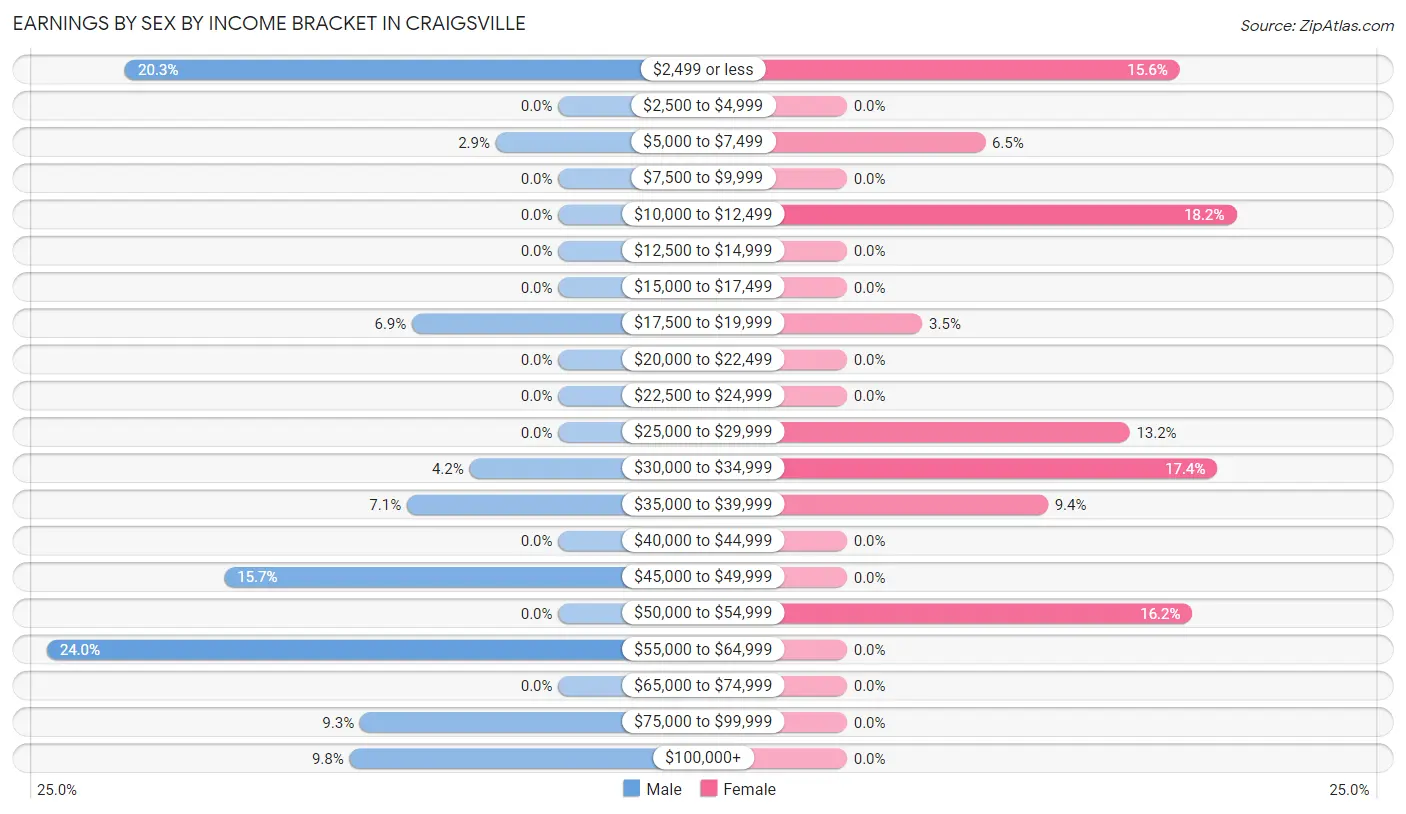
| Income | Male | Female |
| $2,499 or less | 83 (20.3%) | 53 (15.6%) |
| $2,500 to $4,999 | 0 (0.0%) | 0 (0.0%) |
| $5,000 to $7,499 | 12 (2.9%) | 22 (6.5%) |
| $7,500 to $9,999 | 0 (0.0%) | 0 (0.0%) |
| $10,000 to $12,499 | 0 (0.0%) | 62 (18.2%) |
| $12,500 to $14,999 | 0 (0.0%) | 0 (0.0%) |
| $15,000 to $17,499 | 0 (0.0%) | 0 (0.0%) |
| $17,500 to $19,999 | 28 (6.9%) | 12 (3.5%) |
| $20,000 to $22,499 | 0 (0.0%) | 0 (0.0%) |
| $22,500 to $24,999 | 0 (0.0%) | 0 (0.0%) |
| $25,000 to $29,999 | 0 (0.0%) | 45 (13.2%) |
| $30,000 to $34,999 | 17 (4.2%) | 59 (17.3%) |
| $35,000 to $39,999 | 29 (7.1%) | 32 (9.4%) |
| $40,000 to $44,999 | 0 (0.0%) | 0 (0.0%) |
| $45,000 to $49,999 | 64 (15.7%) | 0 (0.0%) |
| $50,000 to $54,999 | 0 (0.0%) | 55 (16.2%) |
| $55,000 to $64,999 | 98 (24.0%) | 0 (0.0%) |
| $65,000 to $74,999 | 0 (0.0%) | 0 (0.0%) |
| $75,000 to $99,999 | 38 (9.3%) | 0 (0.0%) |
| $100,000+ | 40 (9.8%) | 0 (0.0%) |
| Total | 409 (100.0%) | 340 (100.0%) |
Earnings by Sex by Educational Attainment in Craigsville
Average earnings in Craigsville are $55,793 for men and $30,673 for women, a difference of 45.0%. Men with an educational attainment of high school diploma enjoy the highest average annual earnings of $46,532, while those with high school diploma education earn the least with $46,532. Women with an educational attainment of high school diploma earn the most with the average annual earnings of $33,977, while those with high school diploma education have the smallest earnings of $33,977.
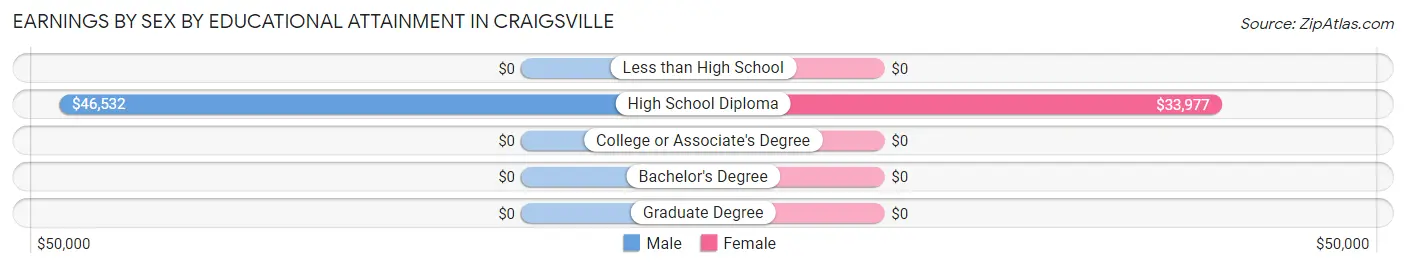
| Educational Attainment | Male Income | Female Income |
| Less than High School | - | - |
| High School Diploma | $46,532 | $33,977 |
| College or Associate's Degree | - | - |
| Bachelor's Degree | - | - |
| Graduate Degree | - | - |
| Total | $55,793 | $30,673 |
Family Income in Craigsville
Family Income Brackets in Craigsville
According to the Craigsville family income data, there are 192 families falling into the $50,000 to $74,999 income range, which is the most common income bracket and makes up 32.8% of all families.
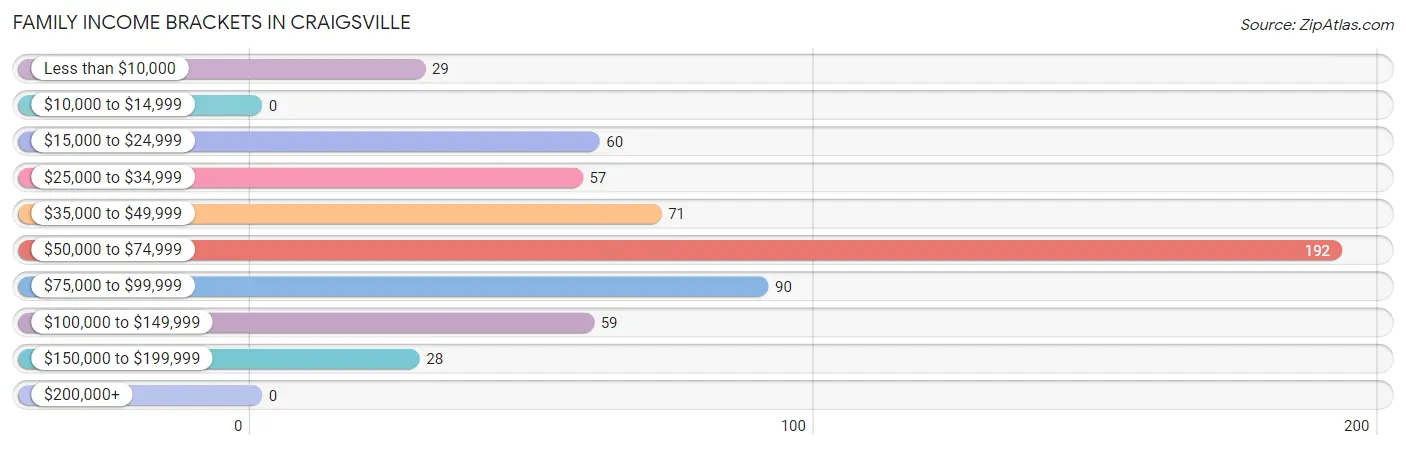
| Income Bracket | # Families | % Families |
| Less than $10,000 | 29 | 4.9% |
| $10,000 to $14,999 | 0 | 0.0% |
| $15,000 to $24,999 | 60 | 10.2% |
| $25,000 to $34,999 | 57 | 9.7% |
| $35,000 to $49,999 | 71 | 12.1% |
| $50,000 to $74,999 | 192 | 32.8% |
| $75,000 to $99,999 | 90 | 15.4% |
| $100,000 to $149,999 | 59 | 10.1% |
| $150,000 to $199,999 | 28 | 4.8% |
| $200,000+ | 0 | 0.0% |
Family Income by Famaliy Size in Craigsville
2-person families (388 | 66.2%) account for the highest median family income in Craigsville with $57,586 per family, while 2-person families (388 | 66.2%) have the highest median income of $28,793 per family member.
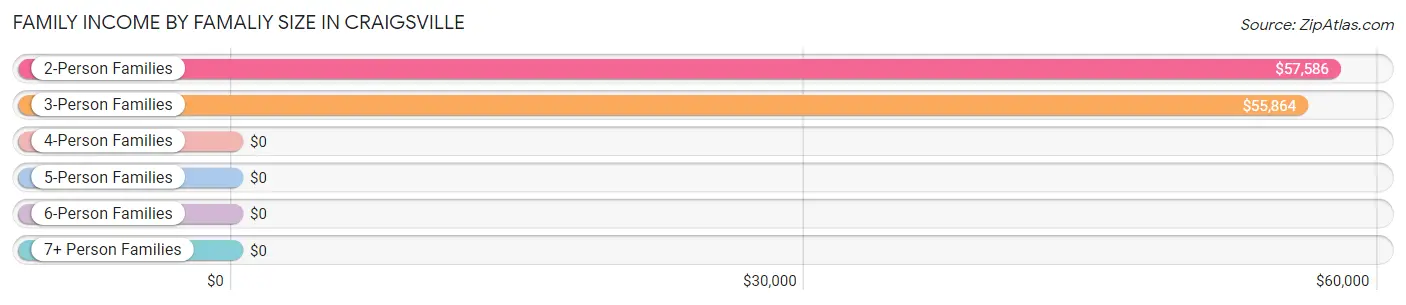
| Income Bracket | # Families | Median Income |
| 2-Person Families | 388 (66.2%) | $57,586 |
| 3-Person Families | 152 (25.9%) | $55,864 |
| 4-Person Families | 33 (5.6%) | $0 |
| 5-Person Families | 13 (2.2%) | $0 |
| 6-Person Families | 0 (0.0%) | $0 |
| 7+ Person Families | 0 (0.0%) | $0 |
| Total | 586 (100.0%) | $56,798 |
Family Income by Number of Earners in Craigsville
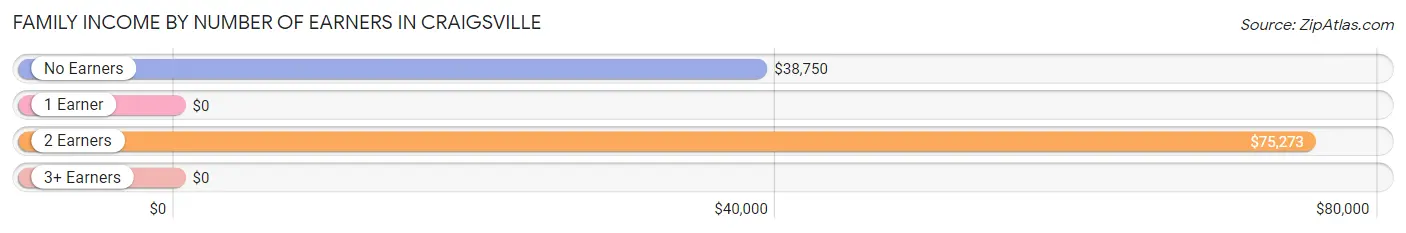
| Number of Earners | # Families | Median Income |
| No Earners | 213 (36.3%) | $38,750 |
| 1 Earner | 132 (22.5%) | $0 |
| 2 Earners | 241 (41.1%) | $75,273 |
| 3+ Earners | 0 (0.0%) | $0 |
| Total | 586 (100.0%) | $56,798 |
Household Income in Craigsville
Household Income Brackets in Craigsville
With 305 households falling in the category, the $15,000 to $24,999 income range is the most frequent in Craigsville, accounting for 32.2% of all households.
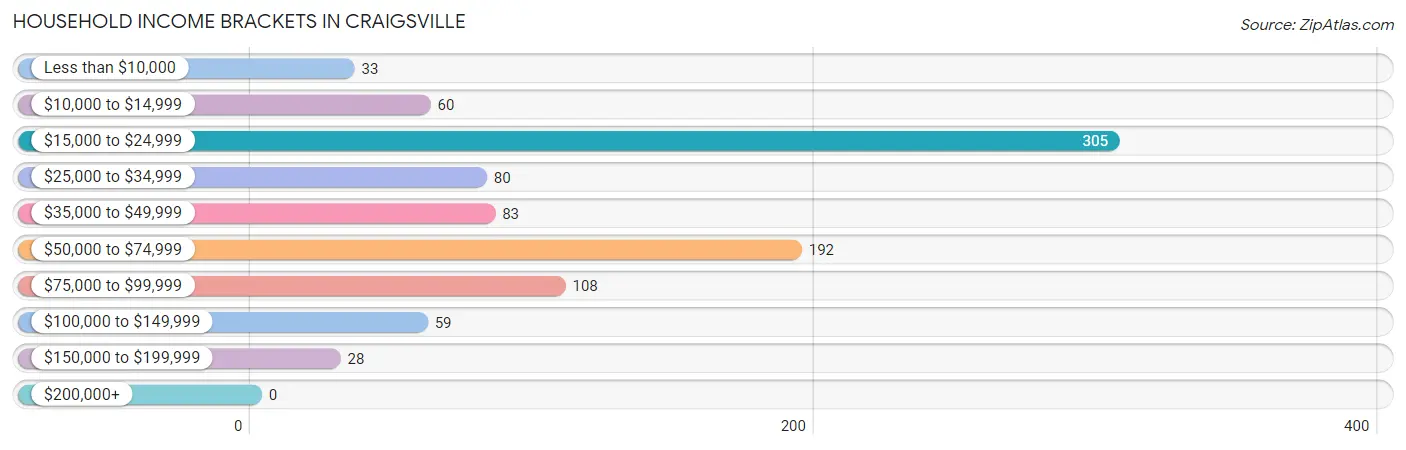
| Income Bracket | # Households | % Households |
| Less than $10,000 | 33 | 3.5% |
| $10,000 to $14,999 | 60 | 6.3% |
| $15,000 to $24,999 | 305 | 32.2% |
| $25,000 to $34,999 | 80 | 8.4% |
| $35,000 to $49,999 | 83 | 8.8% |
| $50,000 to $74,999 | 192 | 20.3% |
| $75,000 to $99,999 | 108 | 11.4% |
| $100,000 to $149,999 | 59 | 6.2% |
| $150,000 to $199,999 | 28 | 3.0% |
| $200,000+ | 0 | 0.0% |
Household Income by Householder Age in Craigsville
The median household income in Craigsville is $34,375, with the highest median household income of $56,705 found in the 25 to 44 years age bracket for the primary householder. A total of 223 households (23.5%) fall into this category.
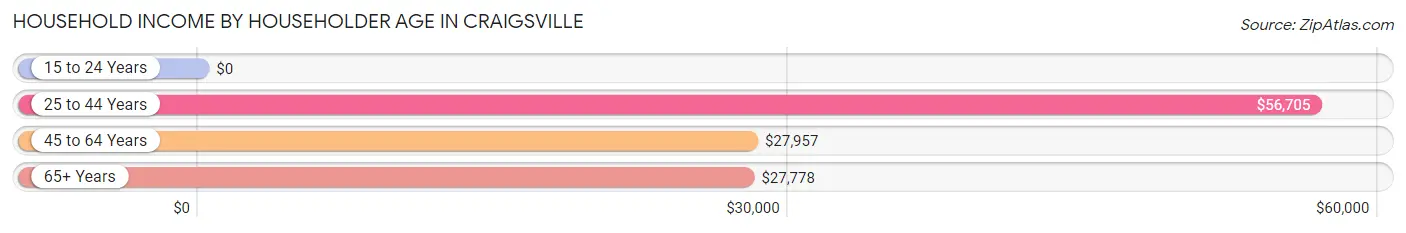
| Income Bracket | # Households | Median Income |
| 15 to 24 Years | 0 (0.0%) | $0 |
| 25 to 44 Years | 223 (23.5%) | $56,705 |
| 45 to 64 Years | 375 (39.6%) | $27,957 |
| 65+ Years | 350 (36.9%) | $27,778 |
| Total | 948 (100.0%) | $34,375 |
Poverty in Craigsville
Income Below Poverty by Sex and Age in Craigsville
With 19.8% poverty level for males and 14.7% for females among the residents of Craigsville, 12 to 14 year old males and 45 to 54 year old females are the most vulnerable to poverty, with 16 males (100.0%) and 30 females (73.2%) in their respective age groups living below the poverty level.
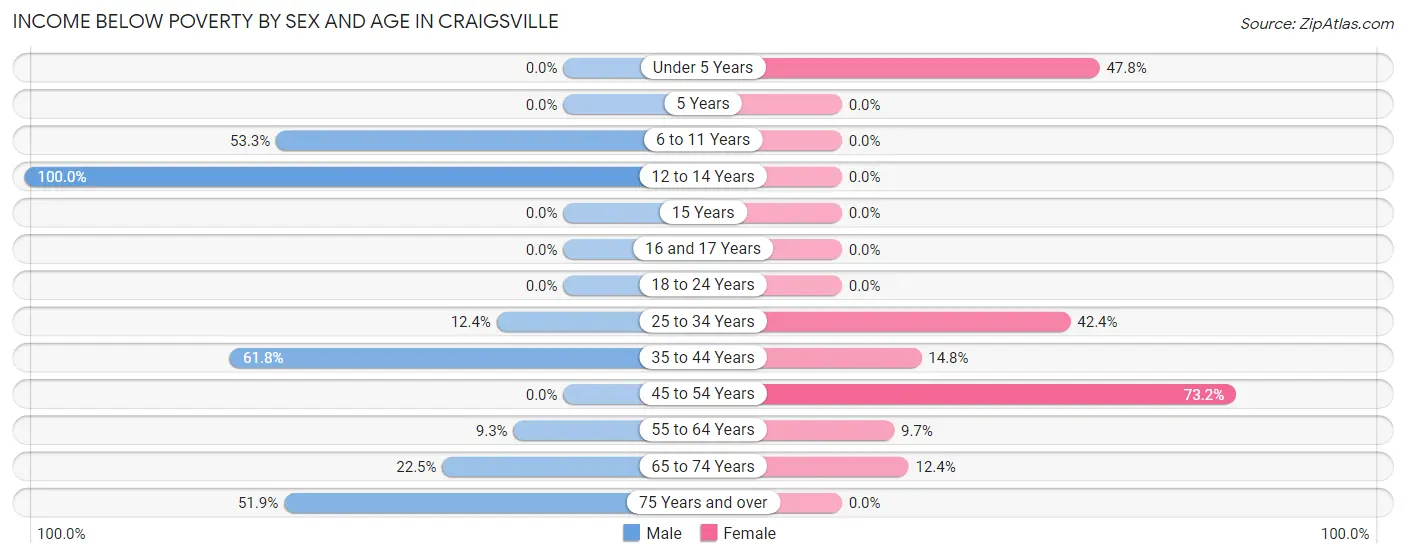
| Age Bracket | Male | Female |
| Under 5 Years | 0 (0.0%) | 11 (47.8%) |
| 5 Years | 0 (0.0%) | 0 (0.0%) |
| 6 to 11 Years | 32 (53.3%) | 0 (0.0%) |
| 12 to 14 Years | 16 (100.0%) | 0 (0.0%) |
| 15 Years | 0 (0.0%) | 0 (0.0%) |
| 16 and 17 Years | 0 (0.0%) | 0 (0.0%) |
| 18 to 24 Years | 0 (0.0%) | 0 (0.0%) |
| 25 to 34 Years | 12 (12.4%) | 28 (42.4%) |
| 35 to 44 Years | 47 (61.8%) | 22 (14.8%) |
| 45 to 54 Years | 0 (0.0%) | 30 (73.2%) |
| 55 to 64 Years | 30 (9.3%) | 16 (9.7%) |
| 65 to 74 Years | 31 (22.5%) | 28 (12.4%) |
| 75 Years and over | 56 (51.8%) | 0 (0.0%) |
| Total | 224 (19.8%) | 135 (14.7%) |
Income Above Poverty by Sex and Age in Craigsville
According to the poverty statistics in Craigsville, males aged under 5 years and females aged 12 to 14 years are the age groups that are most secure financially, with 100.0% of males and 100.0% of females in these age groups living above the poverty line.
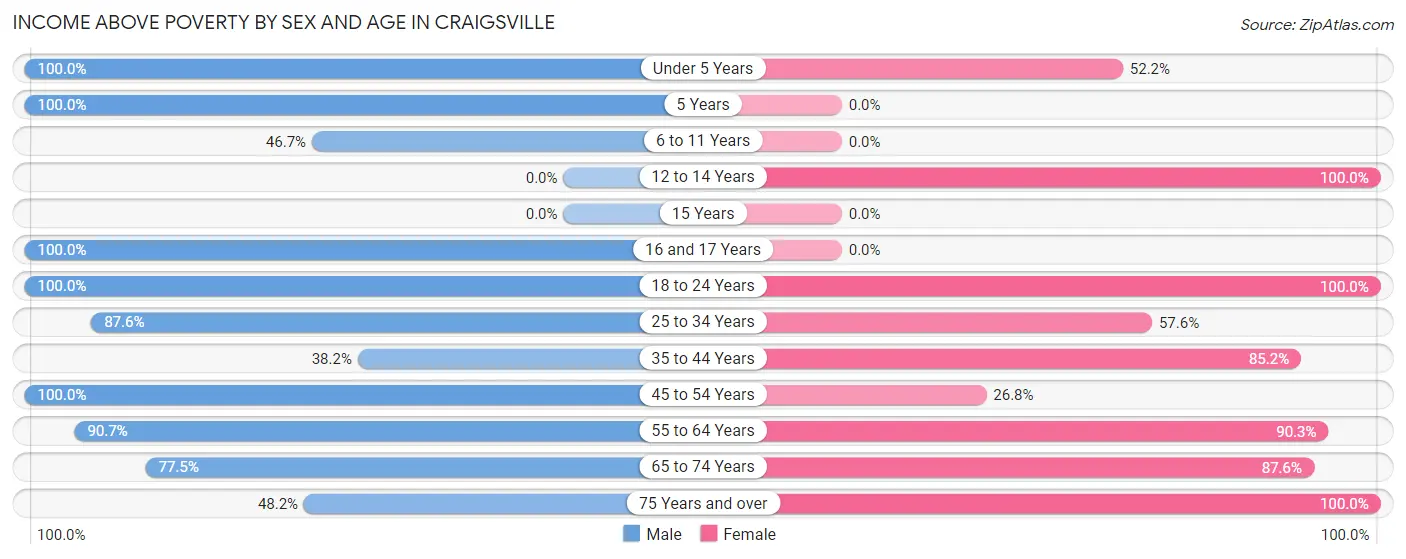
| Age Bracket | Male | Female |
| Under 5 Years | 88 (100.0%) | 12 (52.2%) |
| 5 Years | 18 (100.0%) | 0 (0.0%) |
| 6 to 11 Years | 28 (46.7%) | 0 (0.0%) |
| 12 to 14 Years | 0 (0.0%) | 74 (100.0%) |
| 15 Years | 0 (0.0%) | 0 (0.0%) |
| 16 and 17 Years | 83 (100.0%) | 0 (0.0%) |
| 18 to 24 Years | 43 (100.0%) | 98 (100.0%) |
| 25 to 34 Years | 85 (87.6%) | 38 (57.6%) |
| 35 to 44 Years | 29 (38.2%) | 127 (85.2%) |
| 45 to 54 Years | 81 (100.0%) | 11 (26.8%) |
| 55 to 64 Years | 294 (90.7%) | 149 (90.3%) |
| 65 to 74 Years | 107 (77.5%) | 198 (87.6%) |
| 75 Years and over | 52 (48.1%) | 77 (100.0%) |
| Total | 908 (80.2%) | 784 (85.3%) |
Income Below Poverty Among Married-Couple Families in Craigsville
The poverty statistics for married-couple families in Craigsville show that 13.5% or 60 of the total 445 families live below the poverty line. Families with 3 or 4 children have the highest poverty rate of 100.0%, comprising of 13 families. On the other hand, families with 1 or 2 children have the lowest poverty rate of 0.0%, which includes 0 families.
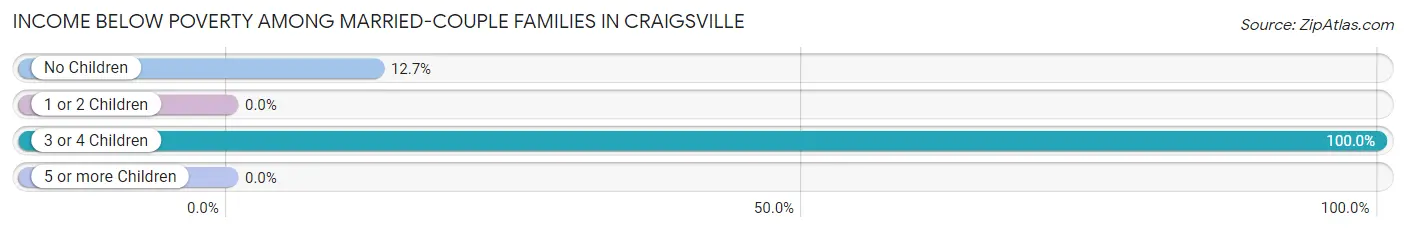
| Children | Above Poverty | Below Poverty |
| No Children | 323 (87.3%) | 47 (12.7%) |
| 1 or 2 Children | 62 (100.0%) | 0 (0.0%) |
| 3 or 4 Children | 0 (0.0%) | 13 (100.0%) |
| 5 or more Children | 0 (0.0%) | 0 (0.0%) |
| Total | 385 (86.5%) | 60 (13.5%) |
Income Below Poverty Among Single-Parent Households in Craigsville
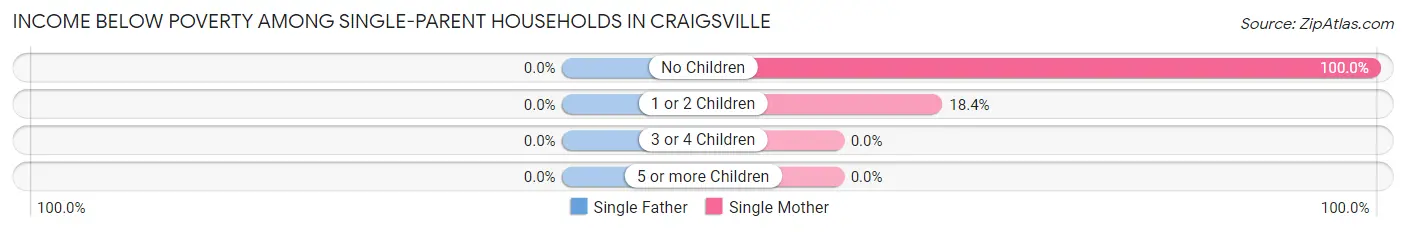
| Children | Single Father | Single Mother |
| No Children | 0 (0.0%) | 13 (100.0%) |
| 1 or 2 Children | 0 (0.0%) | 16 (18.4%) |
| 3 or 4 Children | 0 (0.0%) | 0 (0.0%) |
| 5 or more Children | 0 (0.0%) | 0 (0.0%) |
| Total | 0 (0.0%) | 29 (29.0%) |
Income Below Poverty Among Married-Couple vs Single-Parent Households in Craigsville
The poverty data for Craigsville shows that 60 of the married-couple family households (13.5%) and 29 of the single-parent households (20.6%) are living below the poverty level. Within the married-couple family households, those with 3 or 4 children have the highest poverty rate, with 13 households (100.0%) falling below the poverty line. Among the single-parent households, those with no children have the highest poverty rate, with 13 household (100.0%) living below poverty.
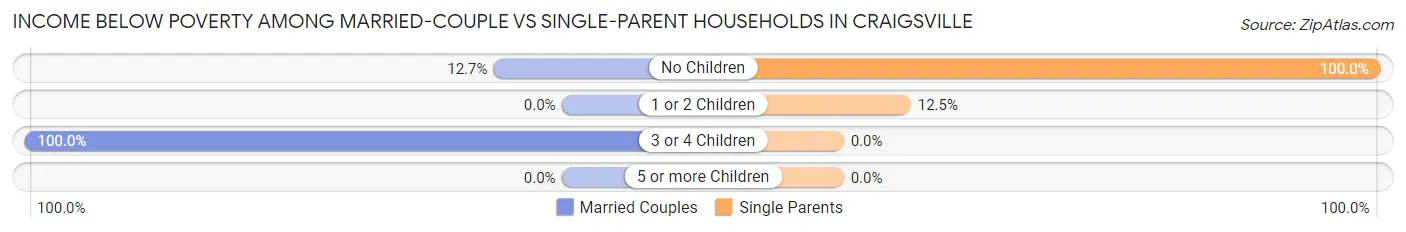
| Children | Married-Couple Families | Single-Parent Households |
| No Children | 47 (12.7%) | 13 (100.0%) |
| 1 or 2 Children | 0 (0.0%) | 16 (12.5%) |
| 3 or 4 Children | 13 (100.0%) | 0 (0.0%) |
| 5 or more Children | 0 (0.0%) | 0 (0.0%) |
| Total | 60 (13.5%) | 29 (20.6%) |
Race in Craigsville
The most populous races in Craigsville are White / Caucasian (1,932 | 94.2%), Two or more Races (90 | 4.4%), and Asian (29 | 1.4%).
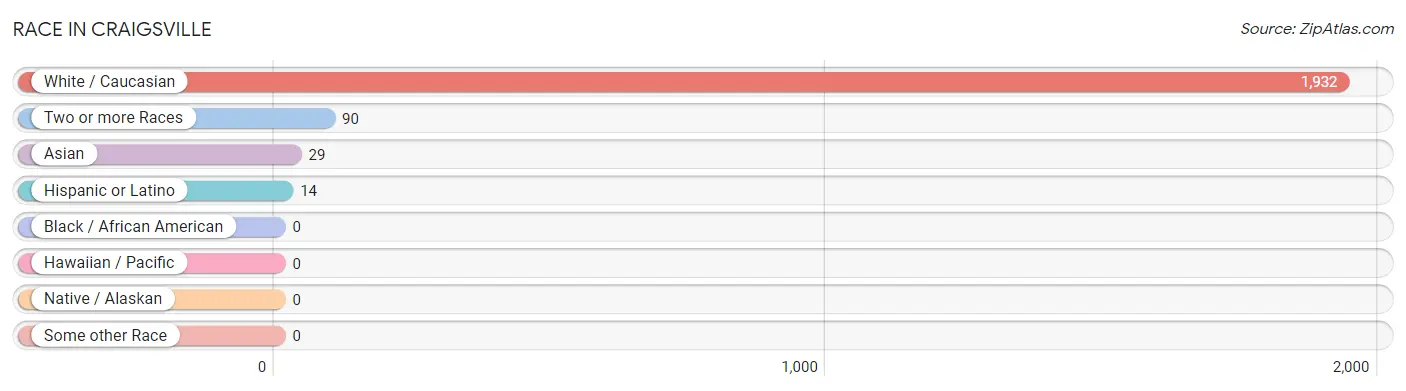
| Race | # Population | % Population |
| Asian | 29 | 1.4% |
| Black / African American | 0 | 0.0% |
| Hawaiian / Pacific | 0 | 0.0% |
| Hispanic or Latino | 14 | 0.7% |
| Native / Alaskan | 0 | 0.0% |
| White / Caucasian | 1,932 | 94.2% |
| Two or more Races | 90 | 4.4% |
| Some other Race | 0 | 0.0% |
| Total | 2,051 | 100.0% |
Ancestry in Craigsville
The most populous ancestries reported in Craigsville are Irish (495 | 24.1%), German (382 | 18.6%), English (324 | 15.8%), American (108 | 5.3%), and Scottish (83 | 4.1%), together accounting for 67.9% of all Craigsville residents.
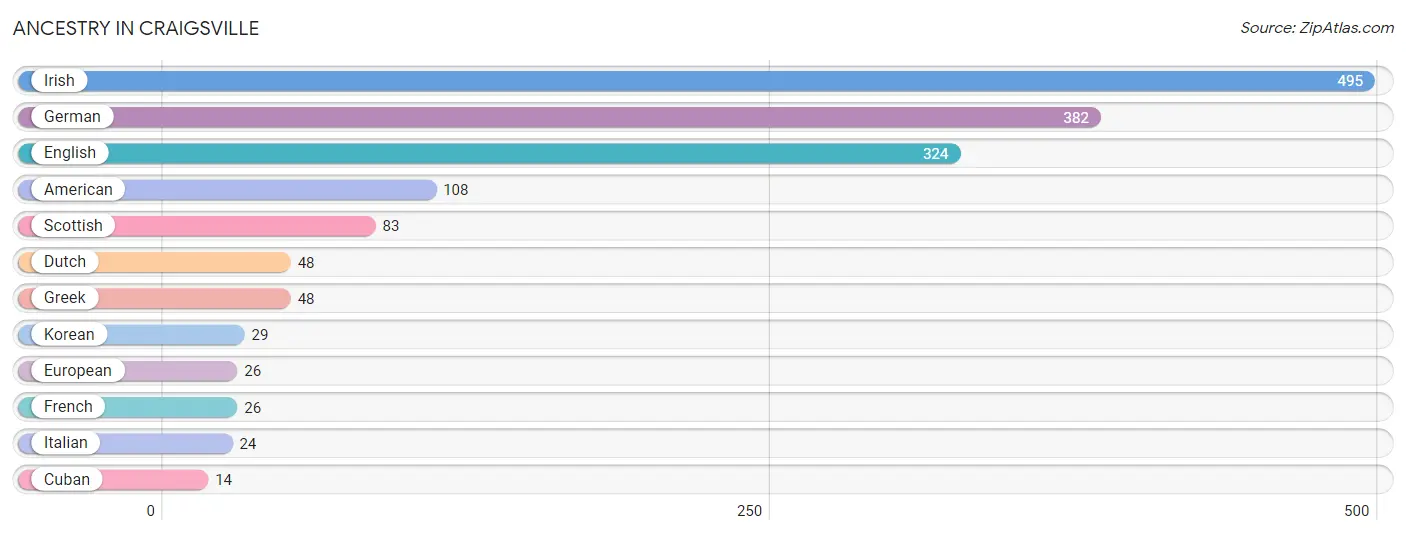
| Ancestry | # Population | % Population |
| American | 108 | 5.3% |
| Cuban | 14 | 0.7% |
| Dutch | 48 | 2.3% |
| English | 324 | 15.8% |
| European | 26 | 1.3% |
| French | 26 | 1.3% |
| German | 382 | 18.6% |
| Greek | 48 | 2.3% |
| Irish | 495 | 24.1% |
| Italian | 24 | 1.2% |
| Korean | 29 | 1.4% |
| Scottish | 83 | 4.1% | View All 12 Rows |
Immigrants in Craigsville
The most numerous immigrant groups reported in Craigsville came from Asia (29 | 1.4%), China (29 | 1.4%), Eastern Asia (29 | 1.4%), Caribbean (14 | 0.7%), and Cuba (14 | 0.7%), together accounting for 5.6% of all Craigsville residents.
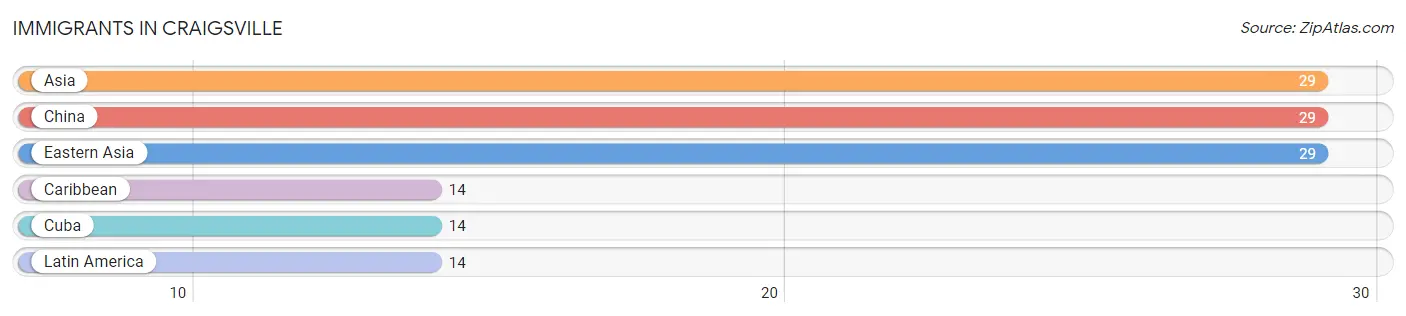
| Immigration Origin | # Population | % Population |
| Asia | 29 | 1.4% |
| Caribbean | 14 | 0.7% |
| China | 29 | 1.4% |
| Cuba | 14 | 0.7% |
| Eastern Asia | 29 | 1.4% |
| Latin America | 14 | 0.7% | View All 6 Rows |
Sex and Age in Craigsville
Sex and Age in Craigsville
The most populous age groups in Craigsville are 60 to 64 Years (253 | 22.4%) for men and 70 to 74 Years (121 | 13.2%) for women.
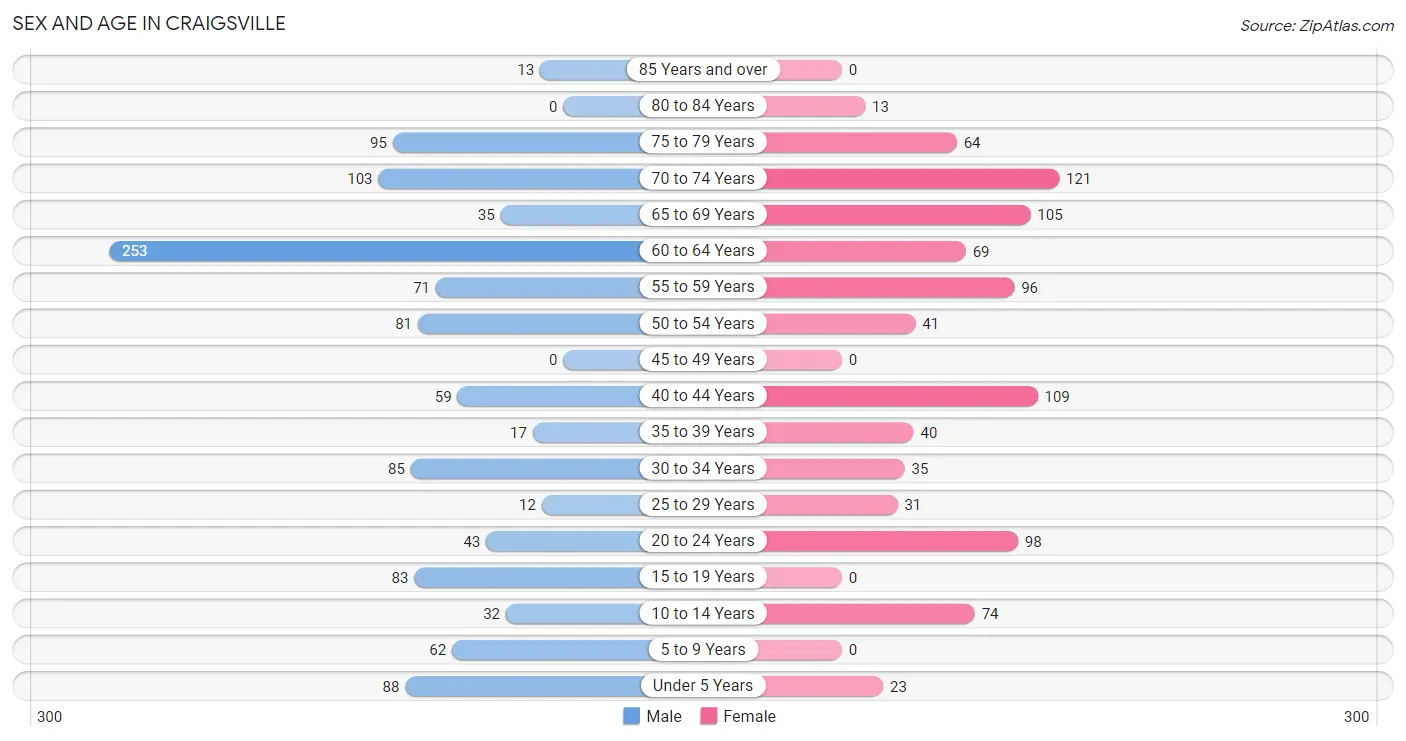
| Age Bracket | Male | Female |
| Under 5 Years | 88 (7.8%) | 23 (2.5%) |
| 5 to 9 Years | 62 (5.5%) | 0 (0.0%) |
| 10 to 14 Years | 32 (2.8%) | 74 (8.1%) |
| 15 to 19 Years | 83 (7.3%) | 0 (0.0%) |
| 20 to 24 Years | 43 (3.8%) | 98 (10.7%) |
| 25 to 29 Years | 12 (1.1%) | 31 (3.4%) |
| 30 to 34 Years | 85 (7.5%) | 35 (3.8%) |
| 35 to 39 Years | 17 (1.5%) | 40 (4.3%) |
| 40 to 44 Years | 59 (5.2%) | 109 (11.9%) |
| 45 to 49 Years | 0 (0.0%) | 0 (0.0%) |
| 50 to 54 Years | 81 (7.2%) | 41 (4.5%) |
| 55 to 59 Years | 71 (6.3%) | 96 (10.4%) |
| 60 to 64 Years | 253 (22.4%) | 69 (7.5%) |
| 65 to 69 Years | 35 (3.1%) | 105 (11.4%) |
| 70 to 74 Years | 103 (9.1%) | 121 (13.2%) |
| 75 to 79 Years | 95 (8.4%) | 64 (7.0%) |
| 80 to 84 Years | 0 (0.0%) | 13 (1.4%) |
| 85 Years and over | 13 (1.1%) | 0 (0.0%) |
| Total | 1,132 (100.0%) | 919 (100.0%) |
Families and Households in Craigsville
Median Family Size in Craigsville
The median family size in Craigsville is 2.71 persons per family, with single male/father families (41 | 7.0%) accounting for the largest median family size of 3.54 persons per family. On the other hand, married-couple families (445 | 75.9%) represent the smallest median family size with 2.50 persons per family.
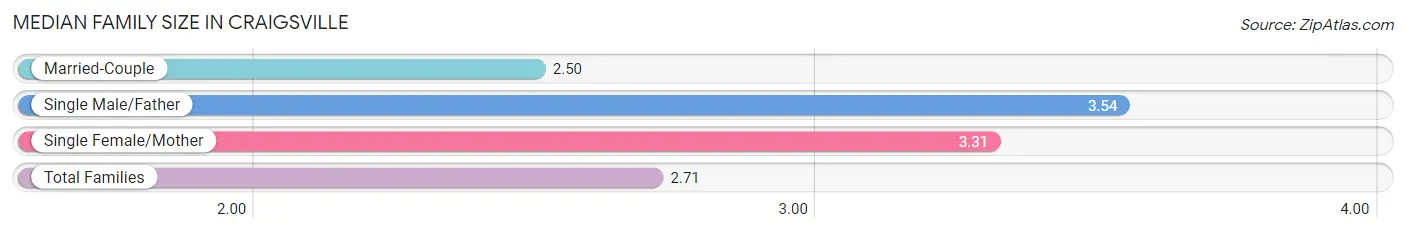
| Family Type | # Families | Family Size |
| Married-Couple | 445 (75.9%) | 2.50 |
| Single Male/Father | 41 (7.0%) | 3.54 |
| Single Female/Mother | 100 (17.1%) | 3.31 |
| Total Families | 586 (100.0%) | 2.71 |
Median Household Size in Craigsville
The median household size in Craigsville is 2.16 persons per household, with single male/father households (41 | 4.3%) accounting for the largest median household size of 3.54 persons per household. non-family households (362 | 38.2%) represent the smallest median household size with 1.24 persons per household.
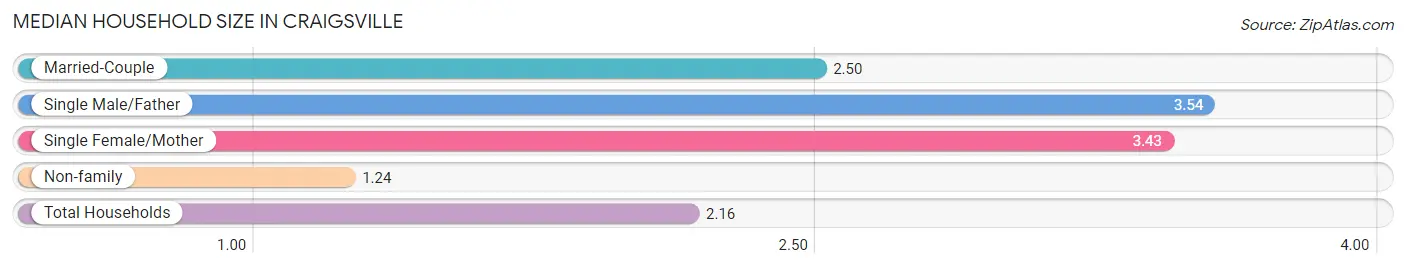
| Household Type | # Households | Household Size |
| Married-Couple | 445 (46.9%) | 2.50 |
| Single Male/Father | 41 (4.3%) | 3.54 |
| Single Female/Mother | 100 (10.5%) | 3.43 |
| Non-family | 362 (38.2%) | 1.24 |
| Total Households | 948 (100.0%) | 2.16 |
Household Size by Marriage Status in Craigsville
Out of a total of 948 households in Craigsville, 586 (61.8%) are family households, while 362 (38.2%) are nonfamily households. The most numerous type of family households are 2-person households, comprising 388, and the most common type of nonfamily households are 1-person households, comprising 323.
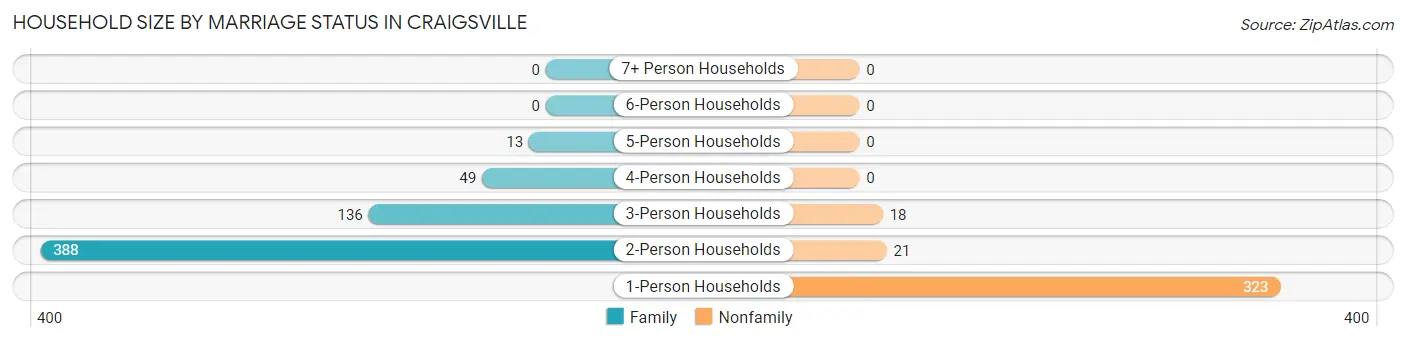
| Household Size | Family Households | Nonfamily Households |
| 1-Person Households | - | 323 (34.1%) |
| 2-Person Households | 388 (40.9%) | 21 (2.2%) |
| 3-Person Households | 136 (14.3%) | 18 (1.9%) |
| 4-Person Households | 49 (5.2%) | 0 (0.0%) |
| 5-Person Households | 13 (1.4%) | 0 (0.0%) |
| 6-Person Households | 0 (0.0%) | 0 (0.0%) |
| 7+ Person Households | 0 (0.0%) | 0 (0.0%) |
| Total | 586 (61.8%) | 362 (38.2%) |
Female Fertility in Craigsville
Fertility by Age in Craigsville
| Age Bracket | Women with Births | Births / 1,000 Women |
| 15 to 19 years | 0 (0.0%) | 0.0 |
| 20 to 34 years | 0 (0.0%) | 0.0 |
| 35 to 50 years | 0 (0.0%) | 0.0 |
| Total | 0 (0.0%) | 0.0 |
Fertility by Age by Marriage Status in Craigsville
| Age Bracket | Married | Unmarried |
| 15 to 19 years | 0 (0.0%) | 0 (0.0%) |
| 20 to 34 years | 0 (0.0%) | 0 (0.0%) |
| 35 to 50 years | 0 (0.0%) | 0 (0.0%) |
| Total | 0 (0.0%) | 0 (0.0%) |
Fertility by Education in Craigsville
| Educational Attainment | Women with Births | Births / 1,000 Women |
| Less than High School | 0 (0.0%) | 0.0 |
| High School Diploma | 0 (0.0%) | 0.0 |
| College or Associate's Degree | 0 (0.0%) | 0.0 |
| Bachelor's Degree | 0 (0.0%) | 0.0 |
| Graduate Degree | 0 (0.0%) | 0.0 |
| Total | 0 (0.0%) | 0.0 |
Fertility by Education by Marriage Status in Craigsville
| Educational Attainment | Married | Unmarried |
| Less than High School | 0 (0.0%) | 0 (0.0%) |
| High School Diploma | 0 (0.0%) | 0 (0.0%) |
| College or Associate's Degree | 0 (0.0%) | 0 (0.0%) |
| Bachelor's Degree | 0 (0.0%) | 0 (0.0%) |
| Graduate Degree | 0 (0.0%) | 0 (0.0%) |
| Total | 0 (0.0%) | 0 (0.0%) |
Employment Characteristics in Craigsville
Employment by Class of Employer in Craigsville
Among the 672 employed individuals in Craigsville, private company employees (430 | 64.0%), self-employed (not incorporated) (80 | 11.9%), and not-for-profit organizations (71 | 10.6%) make up the most common classes of employment.
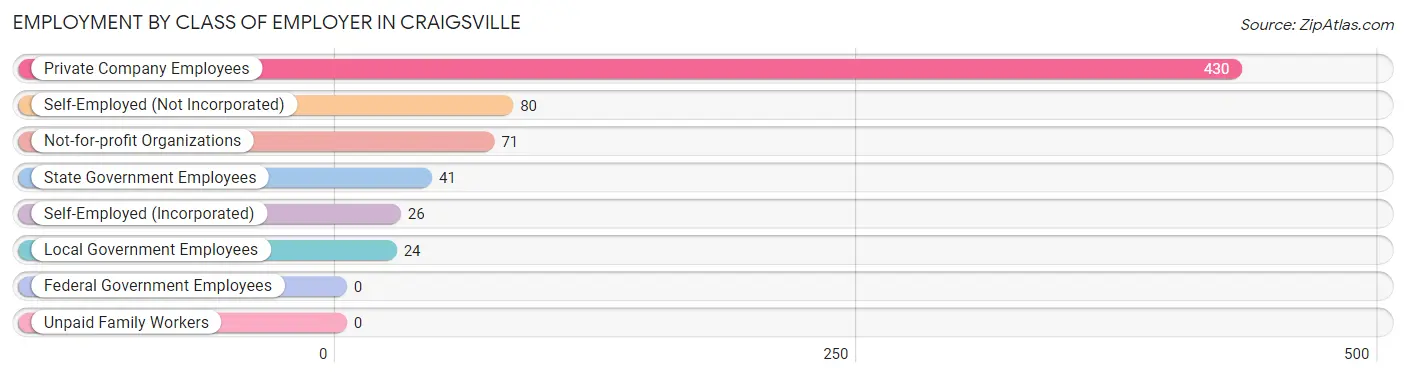
| Employer Class | # Employees | % Employees |
| Private Company Employees | 430 | 64.0% |
| Self-Employed (Incorporated) | 26 | 3.9% |
| Self-Employed (Not Incorporated) | 80 | 11.9% |
| Not-for-profit Organizations | 71 | 10.6% |
| Local Government Employees | 24 | 3.6% |
| State Government Employees | 41 | 6.1% |
| Federal Government Employees | 0 | 0.0% |
| Unpaid Family Workers | 0 | 0.0% |
| Total | 672 | 100.0% |
Employment Status by Age in Craigsville
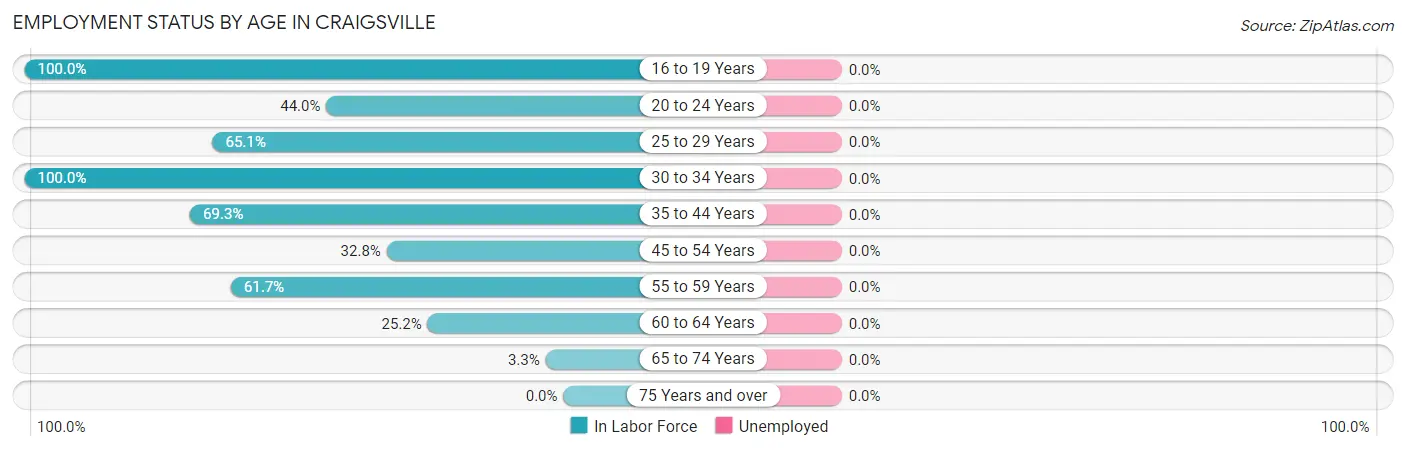
| Age Bracket | In Labor Force | Unemployed |
| 16 to 19 Years | 83 (100.0%) | 0 (0.0%) |
| 20 to 24 Years | 62 (44.0%) | 0 (0.0%) |
| 25 to 29 Years | 28 (65.1%) | 0 (0.0%) |
| 30 to 34 Years | 120 (100.0%) | 0 (0.0%) |
| 35 to 44 Years | 156 (69.3%) | 0 (0.0%) |
| 45 to 54 Years | 40 (32.8%) | 0 (0.0%) |
| 55 to 59 Years | 103 (61.7%) | 0 (0.0%) |
| 60 to 64 Years | 81 (25.2%) | 0 (0.0%) |
| 65 to 74 Years | 12 (3.3%) | 0 (0.0%) |
| 75 Years and over | 0 (0.0%) | 0 (0.0%) |
| Total | 686 (38.7%) | 0 (0.0%) |
Employment Status by Educational Attainment in Craigsville
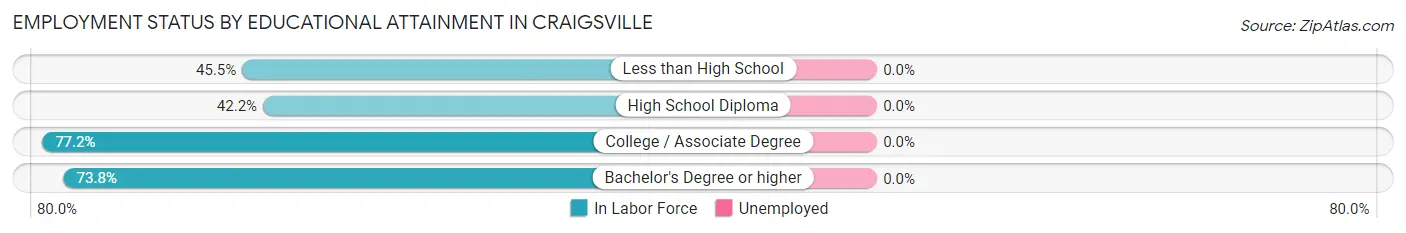
| Educational Attainment | In Labor Force | Unemployed |
| Less than High School | 50 (45.5%) | 0 (0.0%) |
| High School Diploma | 246 (42.2%) | 0 (0.0%) |
| College / Associate Degree | 139 (77.2%) | 0 (0.0%) |
| Bachelor's Degree or higher | 93 (73.8%) | 0 (0.0%) |
| Total | 528 (52.9%) | 0 (0.0%) |
Employment Occupations by Sex in Craigsville
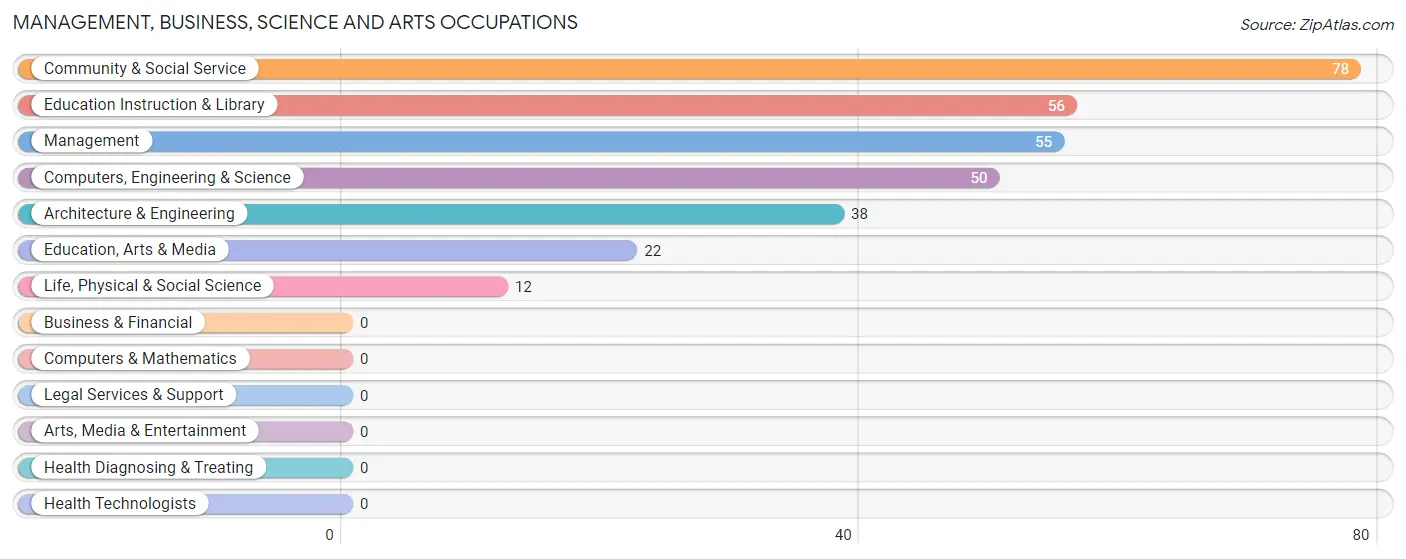
Management, Business, Science and Arts Occupations
The most common Management, Business, Science and Arts occupations in Craigsville are Community & Social Service (78 | 11.4%), Education Instruction & Library (56 | 8.2%), Management (55 | 8.0%), Computers, Engineering & Science (50 | 7.3%), and Architecture & Engineering (38 | 5.6%).
Management, Business, Science and Arts Occupations by Sex
Within the Management, Business, Science and Arts occupations in Craigsville, the most male-oriented occupations are Architecture & Engineering (100.0%), Computers, Engineering & Science (76.0%), and Education Instruction & Library (42.9%), while the most female-oriented occupations are Management (100.0%), Life, Physical & Social Science (100.0%), and Education, Arts & Media (100.0%).
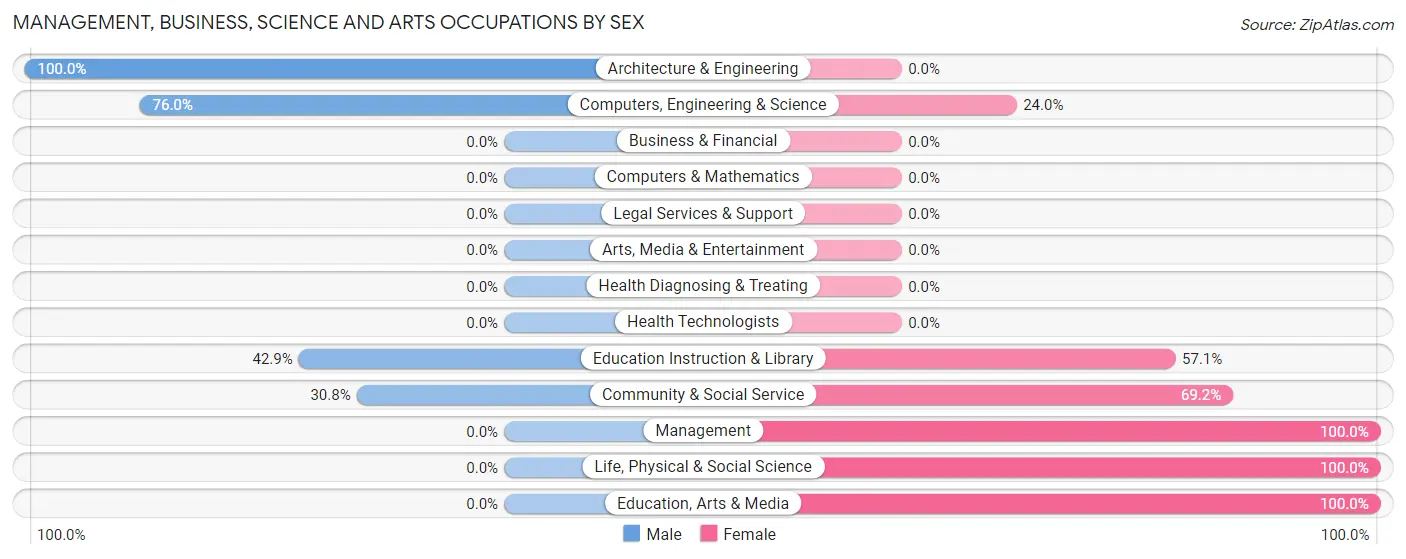
| Occupation | Male | Female |
| Management | 0 (0.0%) | 55 (100.0%) |
| Business & Financial | 0 (0.0%) | 0 (0.0%) |
| Computers, Engineering & Science | 38 (76.0%) | 12 (24.0%) |
| Computers & Mathematics | 0 (0.0%) | 0 (0.0%) |
| Architecture & Engineering | 38 (100.0%) | 0 (0.0%) |
| Life, Physical & Social Science | 0 (0.0%) | 12 (100.0%) |
| Community & Social Service | 24 (30.8%) | 54 (69.2%) |
| Education, Arts & Media | 0 (0.0%) | 22 (100.0%) |
| Legal Services & Support | 0 (0.0%) | 0 (0.0%) |
| Education Instruction & Library | 24 (42.9%) | 32 (57.1%) |
| Arts, Media & Entertainment | 0 (0.0%) | 0 (0.0%) |
| Health Diagnosing & Treating | 0 (0.0%) | 0 (0.0%) |
| Health Technologists | 0 (0.0%) | 0 (0.0%) |
| Total (Category) | 62 (33.9%) | 121 (66.1%) |
| Total (Overall) | 345 (50.4%) | 340 (49.6%) |
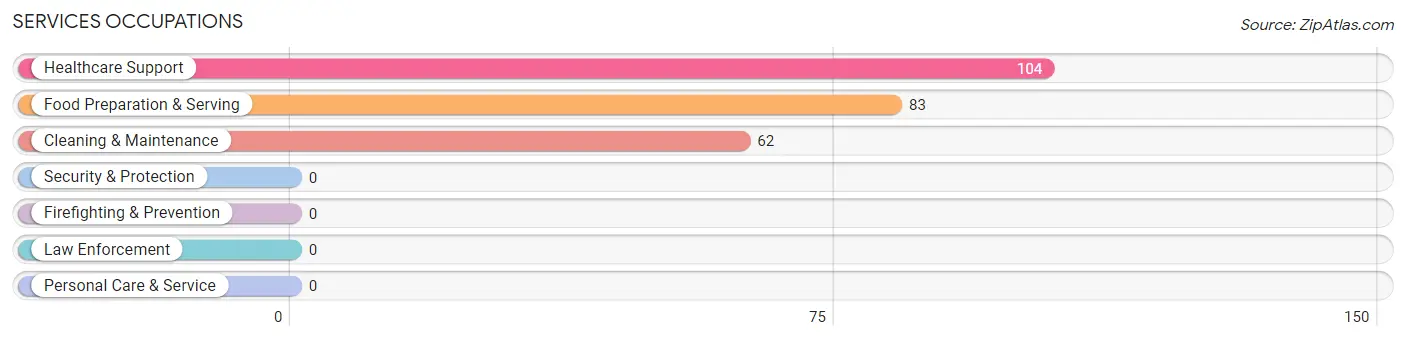
Services Occupations
The most common Services occupations in Craigsville are Healthcare Support (104 | 15.2%), Food Preparation & Serving (83 | 12.1%), and Cleaning & Maintenance (62 | 9.0%).
Services Occupations by Sex
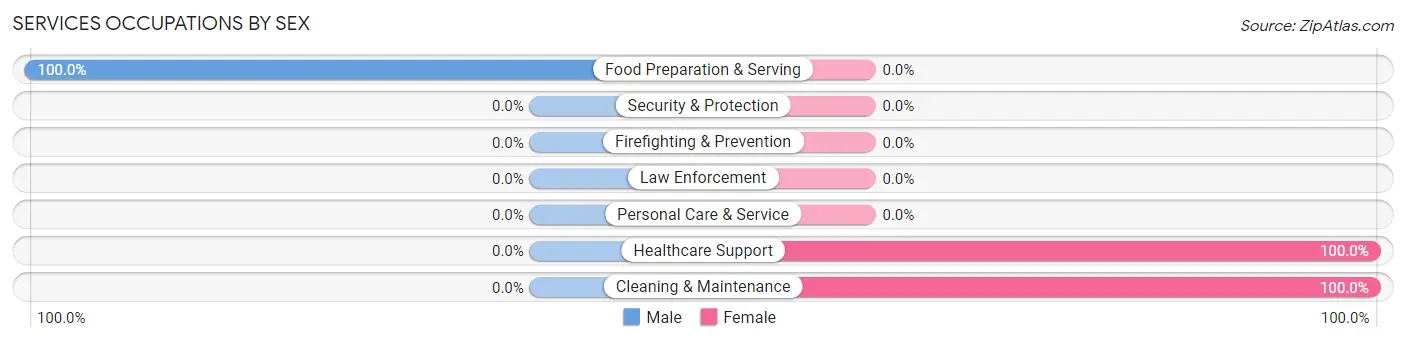
| Occupation | Male | Female |
| Healthcare Support | 0 (0.0%) | 104 (100.0%) |
| Security & Protection | 0 (0.0%) | 0 (0.0%) |
| Firefighting & Prevention | 0 (0.0%) | 0 (0.0%) |
| Law Enforcement | 0 (0.0%) | 0 (0.0%) |
| Food Preparation & Serving | 83 (100.0%) | 0 (0.0%) |
| Cleaning & Maintenance | 0 (0.0%) | 62 (100.0%) |
| Personal Care & Service | 0 (0.0%) | 0 (0.0%) |
| Total (Category) | 83 (33.3%) | 166 (66.7%) |
| Total (Overall) | 345 (50.4%) | 340 (49.6%) |
Sales and Office Occupations
The most common Sales and Office occupations in Craigsville are , and Sales & Related (13 | 1.9%).
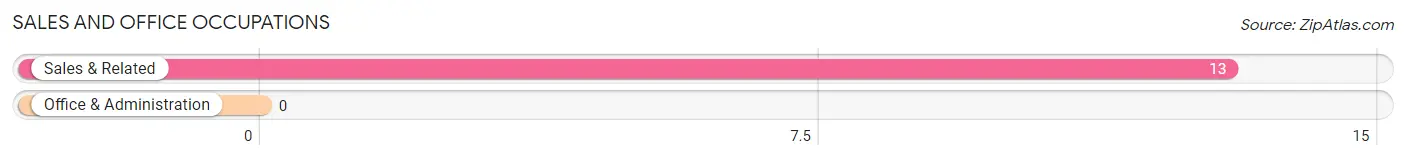
Sales and Office Occupations by Sex
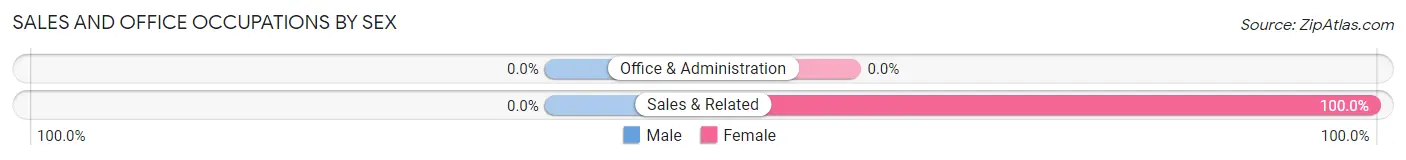
| Occupation | Male | Female |
| Sales & Related | 0 (0.0%) | 13 (100.0%) |
| Office & Administration | 0 (0.0%) | 0 (0.0%) |
| Total (Category) | 0 (0.0%) | 13 (100.0%) |
| Total (Overall) | 345 (50.4%) | 340 (49.6%) |
Natural Resources, Construction and Maintenance Occupations
The most common Natural Resources, Construction and Maintenance occupations in Craigsville are Installation, Maintenance & Repair (90 | 13.1%), Construction & Extraction (69 | 10.1%), and Farming, Fishing & Forestry (12 | 1.8%).
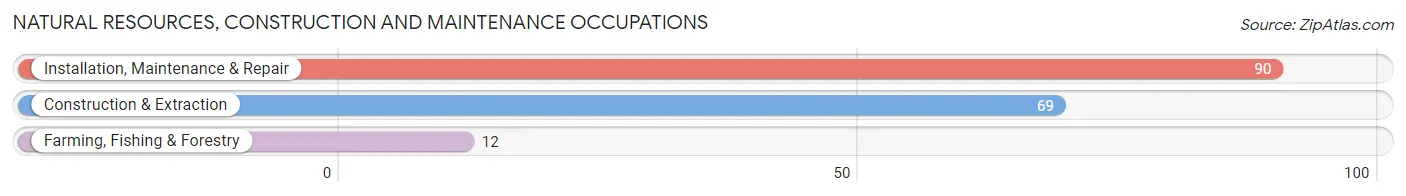
Natural Resources, Construction and Maintenance Occupations by Sex
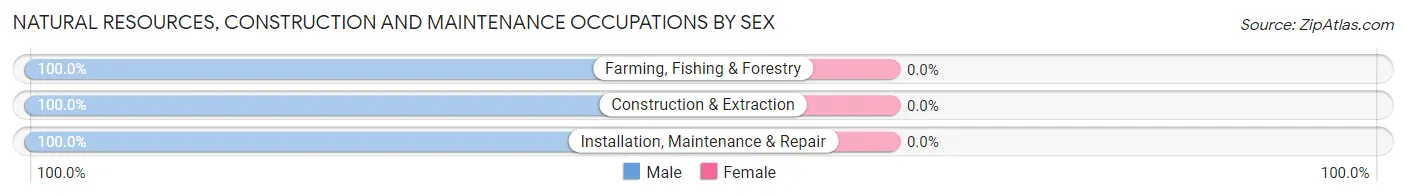
| Occupation | Male | Female |
| Farming, Fishing & Forestry | 12 (100.0%) | 0 (0.0%) |
| Construction & Extraction | 69 (100.0%) | 0 (0.0%) |
| Installation, Maintenance & Repair | 90 (100.0%) | 0 (0.0%) |
| Total (Category) | 171 (100.0%) | 0 (0.0%) |
| Total (Overall) | 345 (50.4%) | 340 (49.6%) |
Production, Transportation and Moving Occupations
The most common Production, Transportation and Moving occupations in Craigsville are Production (40 | 5.8%), and Material Moving (29 | 4.2%).
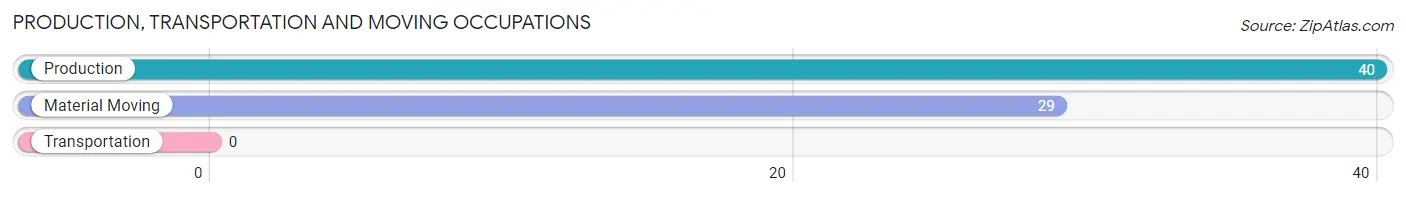
Production, Transportation and Moving Occupations by Sex
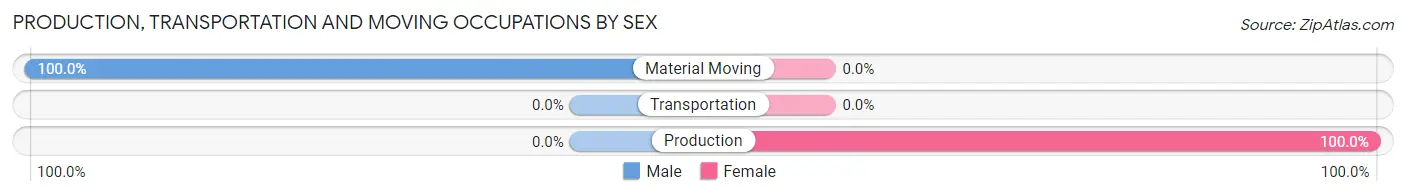
| Occupation | Male | Female |
| Production | 0 (0.0%) | 40 (100.0%) |
| Transportation | 0 (0.0%) | 0 (0.0%) |
| Material Moving | 29 (100.0%) | 0 (0.0%) |
| Total (Category) | 29 (42.0%) | 40 (58.0%) |
| Total (Overall) | 345 (50.4%) | 340 (49.6%) |
Employment Industries by Sex in Craigsville
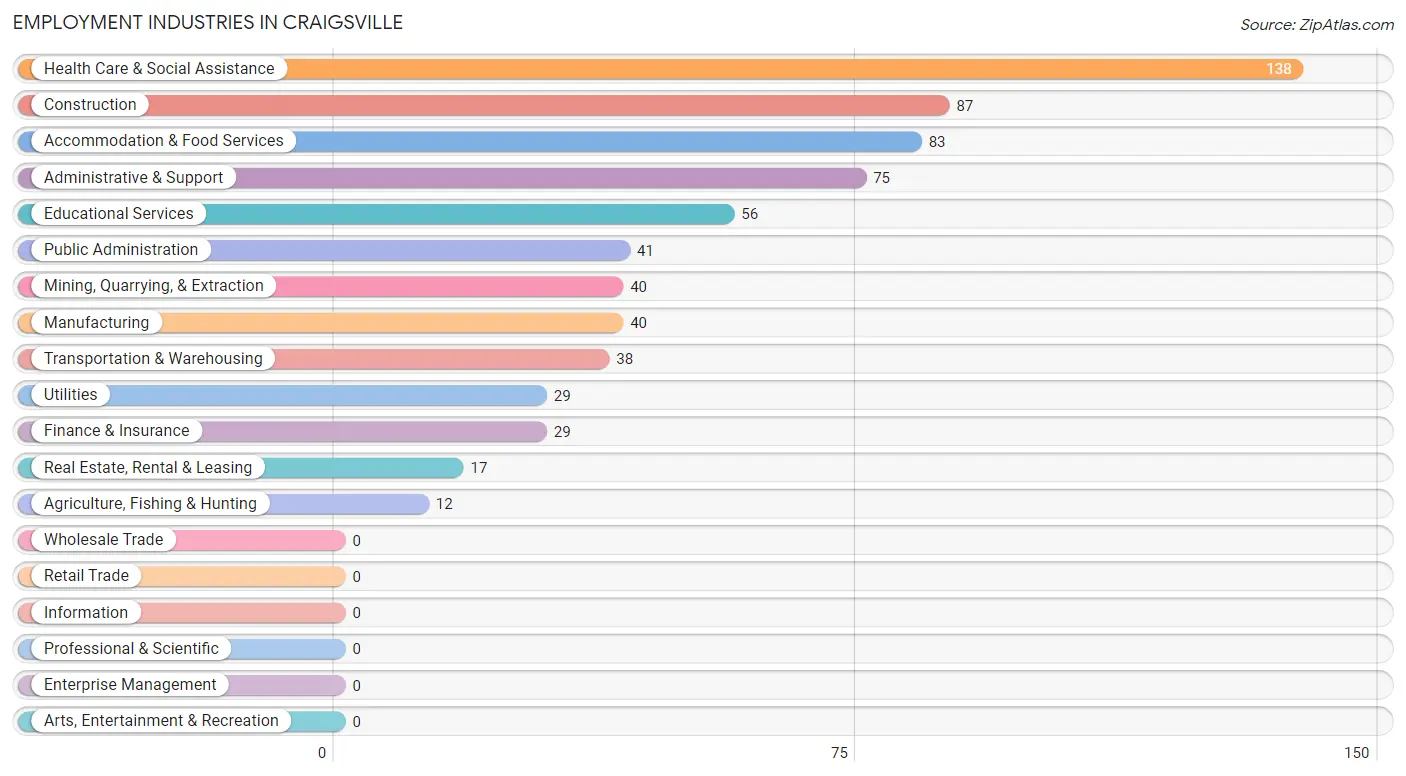
Employment Industries in Craigsville
The major employment industries in Craigsville include Health Care & Social Assistance (138 | 20.2%), Construction (87 | 12.7%), Accommodation & Food Services (83 | 12.1%), Administrative & Support (75 | 11.0%), and Educational Services (56 | 8.2%).
Employment Industries by Sex in Craigsville
The Craigsville industries that see more men than women are Agriculture, Fishing & Hunting (100.0%), Mining, Quarrying, & Extraction (100.0%), and Transportation & Warehousing (100.0%), whereas the industries that tend to have a higher number of women are Manufacturing (100.0%), Finance & Insurance (100.0%), and Administrative & Support (100.0%).
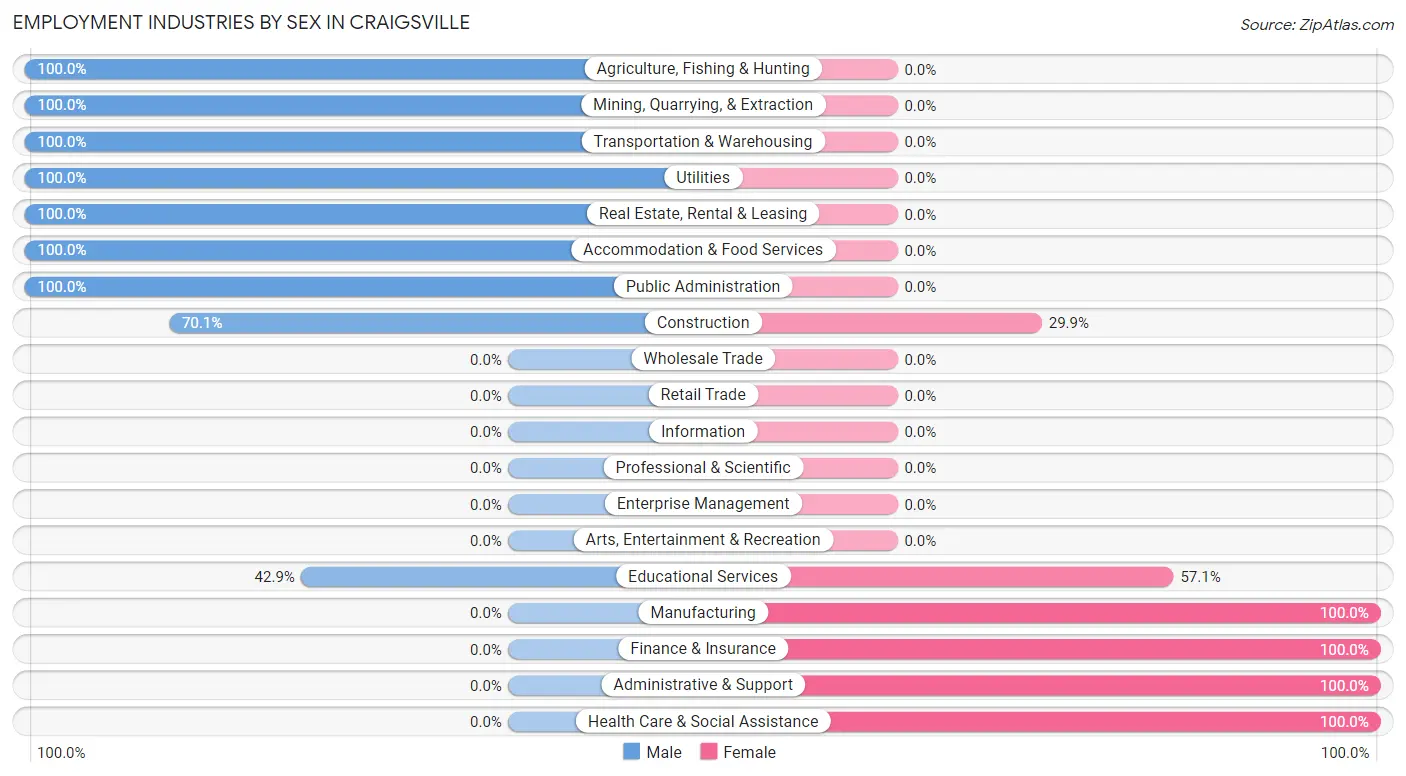
| Industry | Male | Female |
| Agriculture, Fishing & Hunting | 12 (100.0%) | 0 (0.0%) |
| Mining, Quarrying, & Extraction | 40 (100.0%) | 0 (0.0%) |
| Construction | 61 (70.1%) | 26 (29.9%) |
| Manufacturing | 0 (0.0%) | 40 (100.0%) |
| Wholesale Trade | 0 (0.0%) | 0 (0.0%) |
| Retail Trade | 0 (0.0%) | 0 (0.0%) |
| Transportation & Warehousing | 38 (100.0%) | 0 (0.0%) |
| Utilities | 29 (100.0%) | 0 (0.0%) |
| Information | 0 (0.0%) | 0 (0.0%) |
| Finance & Insurance | 0 (0.0%) | 29 (100.0%) |
| Real Estate, Rental & Leasing | 17 (100.0%) | 0 (0.0%) |
| Professional & Scientific | 0 (0.0%) | 0 (0.0%) |
| Enterprise Management | 0 (0.0%) | 0 (0.0%) |
| Administrative & Support | 0 (0.0%) | 75 (100.0%) |
| Educational Services | 24 (42.9%) | 32 (57.1%) |
| Health Care & Social Assistance | 0 (0.0%) | 138 (100.0%) |
| Arts, Entertainment & Recreation | 0 (0.0%) | 0 (0.0%) |
| Accommodation & Food Services | 83 (100.0%) | 0 (0.0%) |
| Public Administration | 41 (100.0%) | 0 (0.0%) |
| Total | 345 (50.4%) | 340 (49.6%) |
Education in Craigsville
School Enrollment in Craigsville
The most common levels of schooling among the 318 students in Craigsville are middle school (106 | 33.3%), high school (83 | 26.1%), and college / undergraduate (72 | 22.6%).
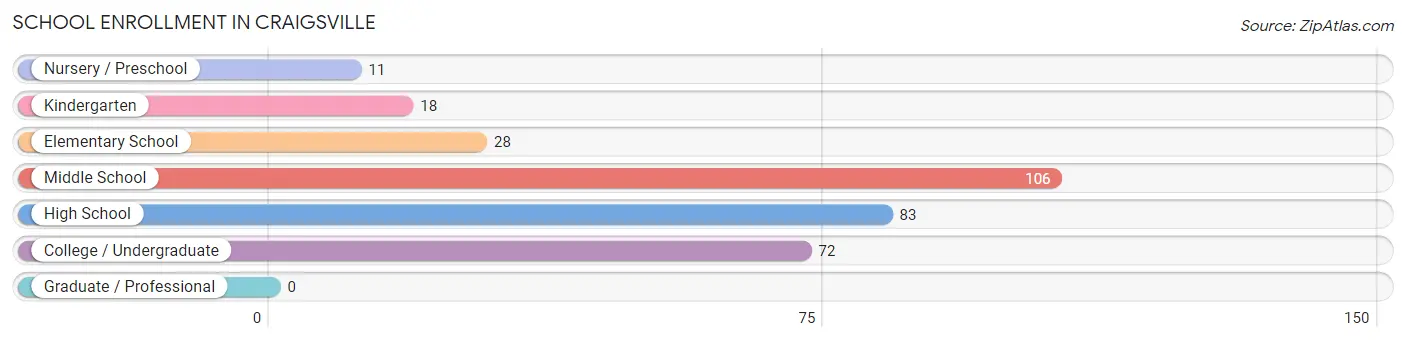
| School Level | # Students | % Students |
| Nursery / Preschool | 11 | 3.5% |
| Kindergarten | 18 | 5.7% |
| Elementary School | 28 | 8.8% |
| Middle School | 106 | 33.3% |
| High School | 83 | 26.1% |
| College / Undergraduate | 72 | 22.6% |
| Graduate / Professional | 0 | 0.0% |
| Total | 318 | 100.0% |
School Enrollment by Age by Funding Source in Craigsville
Out of a total of 318 students who are enrolled in schools in Craigsville, 32 (10.1%) attend a private institution, while the remaining 286 (89.9%) are enrolled in public schools. The age group of 10 to 14 year olds has the highest likelihood of being enrolled in private schools, with 32 (30.2% in the age bracket) enrolled. Conversely, the age group of 3 to 4 year olds has the lowest likelihood of being enrolled in a private school, with 11 (100.0% in the age bracket) attending a public institution.
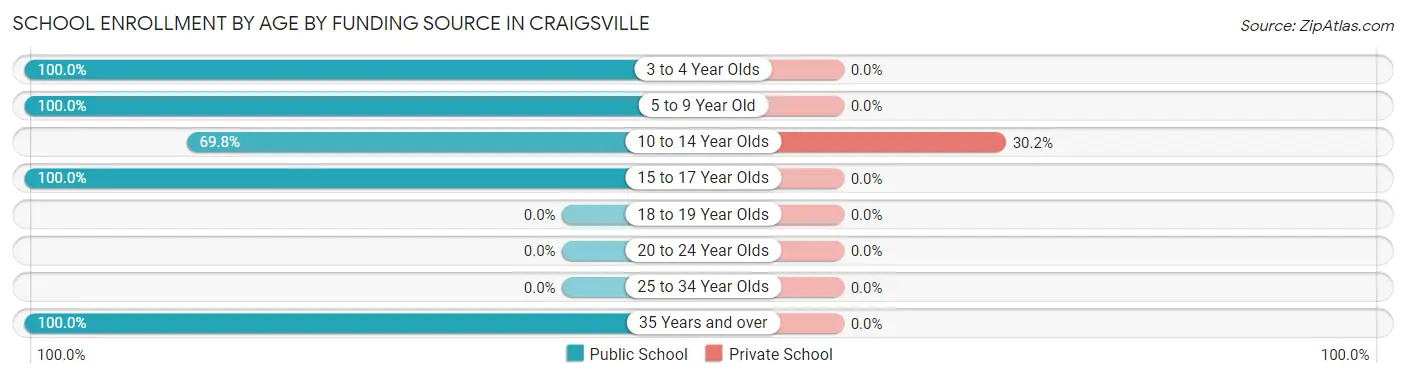
| Age Bracket | Public School | Private School |
| 3 to 4 Year Olds | 11 (100.0%) | 0 (0.0%) |
| 5 to 9 Year Old | 46 (100.0%) | 0 (0.0%) |
| 10 to 14 Year Olds | 74 (69.8%) | 32 (30.2%) |
| 15 to 17 Year Olds | 83 (100.0%) | 0 (0.0%) |
| 18 to 19 Year Olds | 0 (0.0%) | 0 (0.0%) |
| 20 to 24 Year Olds | 0 (0.0%) | 0 (0.0%) |
| 25 to 34 Year Olds | 0 (0.0%) | 0 (0.0%) |
| 35 Years and over | 72 (100.0%) | 0 (0.0%) |
| Total | 286 (89.9%) | 32 (10.1%) |
Educational Attainment by Field of Study in Craigsville
Education (89 | 38.7%), business (74 | 32.2%), psychology (26 | 11.3%), computers & mathematics (24 | 10.4%), and social sciences (17 | 7.4%) are the most common fields of study among 230 individuals in Craigsville who have obtained a bachelor's degree or higher.
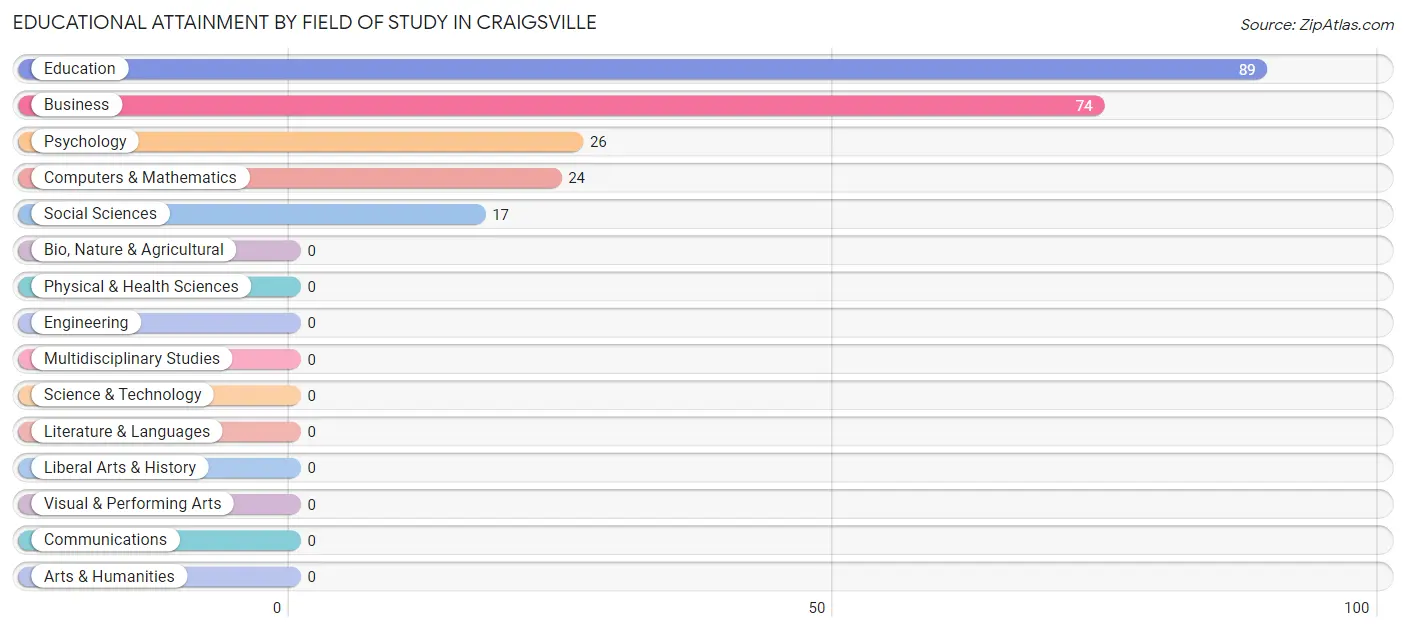
| Field of Study | # Graduates | % Graduates |
| Computers & Mathematics | 24 | 10.4% |
| Bio, Nature & Agricultural | 0 | 0.0% |
| Physical & Health Sciences | 0 | 0.0% |
| Psychology | 26 | 11.3% |
| Social Sciences | 17 | 7.4% |
| Engineering | 0 | 0.0% |
| Multidisciplinary Studies | 0 | 0.0% |
| Science & Technology | 0 | 0.0% |
| Business | 74 | 32.2% |
| Education | 89 | 38.7% |
| Literature & Languages | 0 | 0.0% |
| Liberal Arts & History | 0 | 0.0% |
| Visual & Performing Arts | 0 | 0.0% |
| Communications | 0 | 0.0% |
| Arts & Humanities | 0 | 0.0% |
| Total | 230 | 100.0% |
Transportation & Commute in Craigsville
Vehicle Availability by Sex in Craigsville
The most prevalent vehicle ownership categories in Craigsville are males with 2 vehicles (165, accounting for 47.8%) and females with 2 vehicles (186, making up 50.5%).
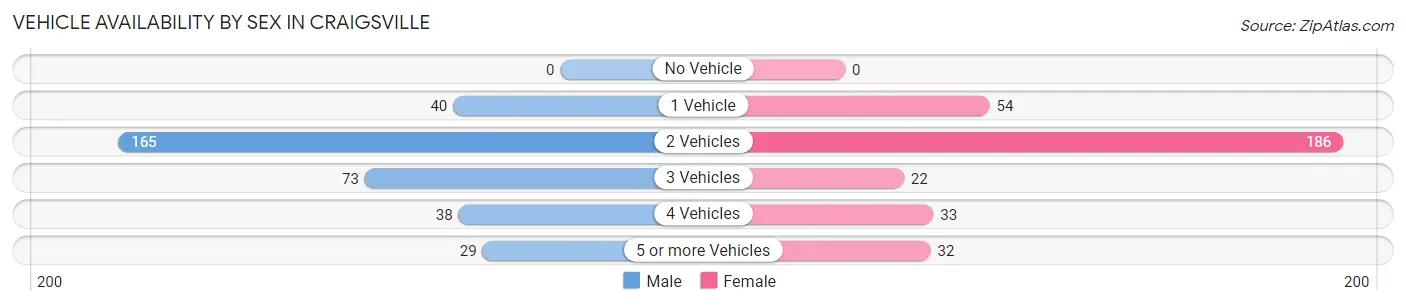
| Vehicles Available | Male | Female |
| No Vehicle | 0 (0.0%) | 0 (0.0%) |
| 1 Vehicle | 40 (11.6%) | 54 (16.5%) |
| 2 Vehicles | 165 (47.8%) | 186 (56.9%) |
| 3 Vehicles | 73 (21.2%) | 22 (6.7%) |
| 4 Vehicles | 38 (11.0%) | 33 (10.1%) |
| 5 or more Vehicles | 29 (8.4%) | 32 (9.8%) |
| Total | 345 (100.0%) | 327 (100.0%) |
Commute Time in Craigsville
The most frequently occuring commute durations in Craigsville are less than 5 minutes (152 commuters, 25.1%), 5 to 9 minutes (134 commuters, 22.1%), and 20 to 24 minutes (100 commuters, 16.5%).
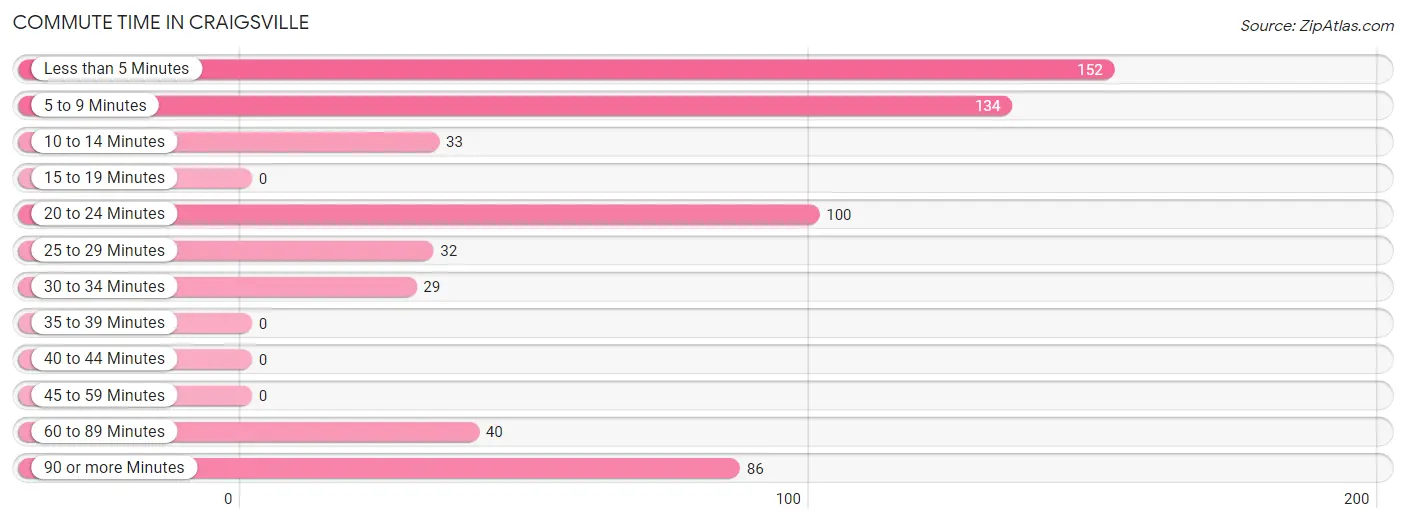
| Commute Time | # Commuters | % Commuters |
| Less than 5 Minutes | 152 | 25.1% |
| 5 to 9 Minutes | 134 | 22.1% |
| 10 to 14 Minutes | 33 | 5.4% |
| 15 to 19 Minutes | 0 | 0.0% |
| 20 to 24 Minutes | 100 | 16.5% |
| 25 to 29 Minutes | 32 | 5.3% |
| 30 to 34 Minutes | 29 | 4.8% |
| 35 to 39 Minutes | 0 | 0.0% |
| 40 to 44 Minutes | 0 | 0.0% |
| 45 to 59 Minutes | 0 | 0.0% |
| 60 to 89 Minutes | 40 | 6.6% |
| 90 or more Minutes | 86 | 14.2% |
Commute Time by Sex in Craigsville
The most common commute times in Craigsville are 5 to 9 minutes (112 commuters, 32.5%) for males and 20 to 24 minutes (100 commuters, 38.3%) for females.
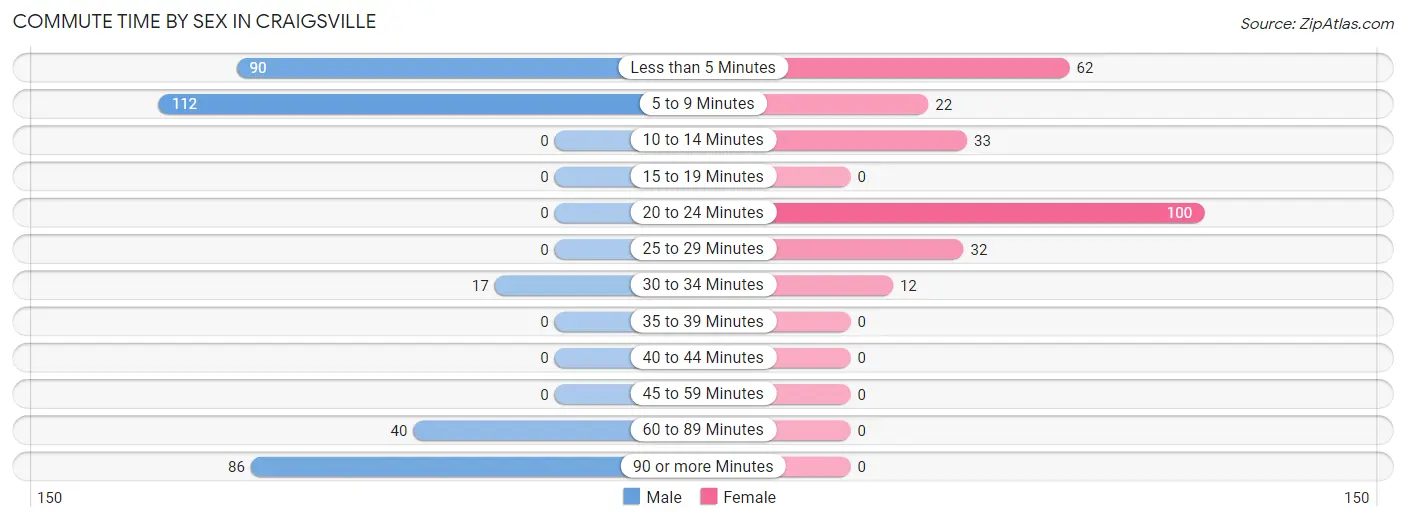
| Commute Time | Male | Female |
| Less than 5 Minutes | 90 (26.1%) | 62 (23.7%) |
| 5 to 9 Minutes | 112 (32.5%) | 22 (8.4%) |
| 10 to 14 Minutes | 0 (0.0%) | 33 (12.6%) |
| 15 to 19 Minutes | 0 (0.0%) | 0 (0.0%) |
| 20 to 24 Minutes | 0 (0.0%) | 100 (38.3%) |
| 25 to 29 Minutes | 0 (0.0%) | 32 (12.3%) |
| 30 to 34 Minutes | 17 (4.9%) | 12 (4.6%) |
| 35 to 39 Minutes | 0 (0.0%) | 0 (0.0%) |
| 40 to 44 Minutes | 0 (0.0%) | 0 (0.0%) |
| 45 to 59 Minutes | 0 (0.0%) | 0 (0.0%) |
| 60 to 89 Minutes | 40 (11.6%) | 0 (0.0%) |
| 90 or more Minutes | 86 (24.9%) | 0 (0.0%) |
Time of Departure to Work by Sex in Craigsville
The most frequent times of departure to work in Craigsville are 4:00 PM to 11:59 PM (83, 24.1%) for males and 4:00 PM to 11:59 PM (62, 23.7%) for females.
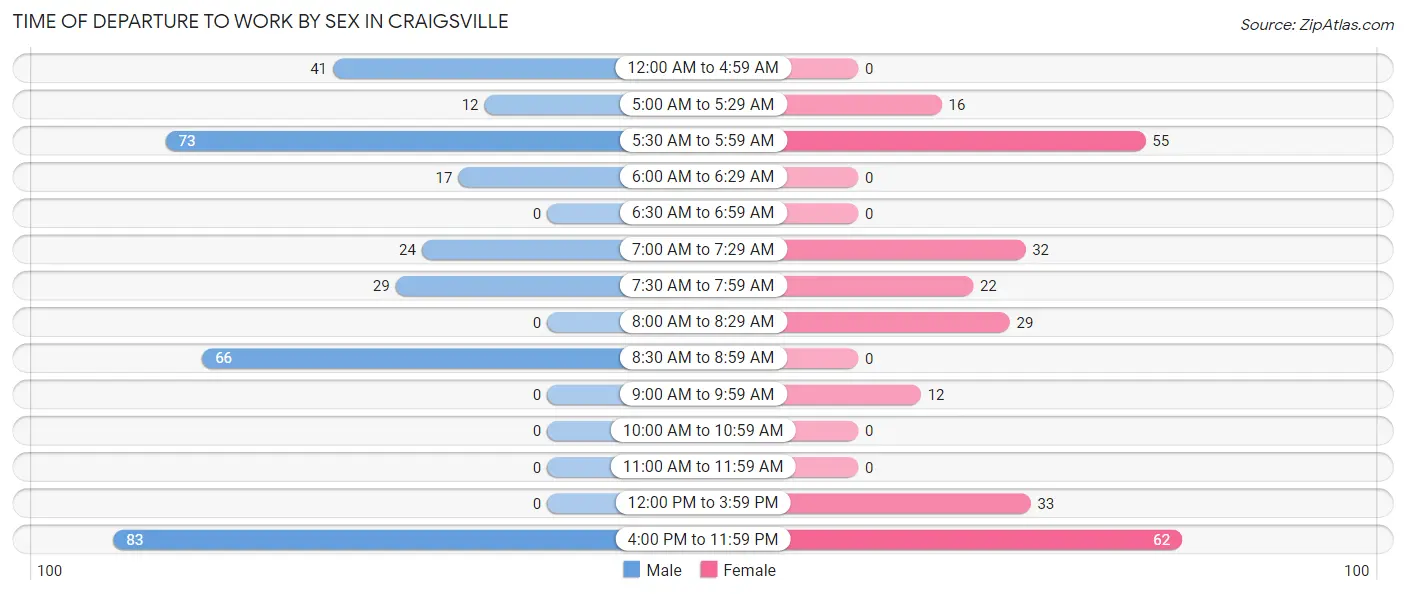
| Time of Departure | Male | Female |
| 12:00 AM to 4:59 AM | 41 (11.9%) | 0 (0.0%) |
| 5:00 AM to 5:29 AM | 12 (3.5%) | 16 (6.1%) |
| 5:30 AM to 5:59 AM | 73 (21.2%) | 55 (21.1%) |
| 6:00 AM to 6:29 AM | 17 (4.9%) | 0 (0.0%) |
| 6:30 AM to 6:59 AM | 0 (0.0%) | 0 (0.0%) |
| 7:00 AM to 7:29 AM | 24 (7.0%) | 32 (12.3%) |
| 7:30 AM to 7:59 AM | 29 (8.4%) | 22 (8.4%) |
| 8:00 AM to 8:29 AM | 0 (0.0%) | 29 (11.1%) |
| 8:30 AM to 8:59 AM | 66 (19.1%) | 0 (0.0%) |
| 9:00 AM to 9:59 AM | 0 (0.0%) | 12 (4.6%) |
| 10:00 AM to 10:59 AM | 0 (0.0%) | 0 (0.0%) |
| 11:00 AM to 11:59 AM | 0 (0.0%) | 0 (0.0%) |
| 12:00 PM to 3:59 PM | 0 (0.0%) | 33 (12.6%) |
| 4:00 PM to 11:59 PM | 83 (24.1%) | 62 (23.7%) |
| Total | 345 (100.0%) | 261 (100.0%) |
Housing Occupancy in Craigsville
Occupancy by Ownership in Craigsville
Of the total 948 dwellings in Craigsville, owner-occupied units account for 627 (66.1%), while renter-occupied units make up 321 (33.9%).
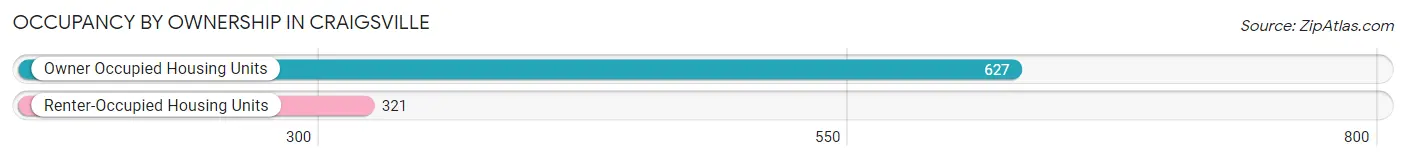
| Occupancy | # Housing Units | % Housing Units |
| Owner Occupied Housing Units | 627 | 66.1% |
| Renter-Occupied Housing Units | 321 | 33.9% |
| Total Occupied Housing Units | 948 | 100.0% |
Occupancy by Household Size in Craigsville
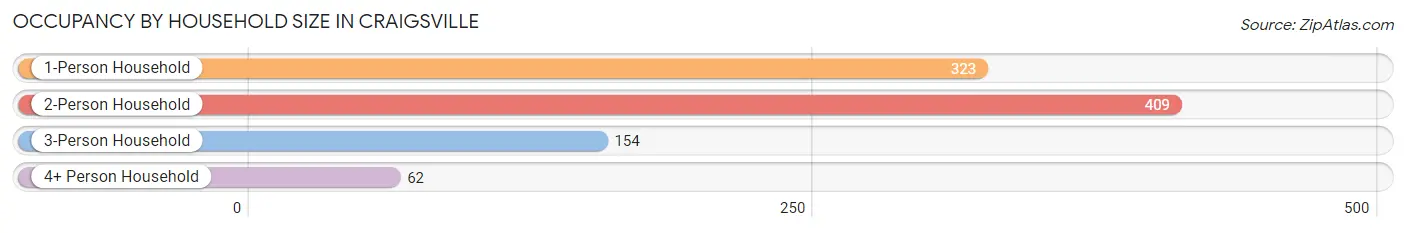
| Household Size | # Housing Units | % Housing Units |
| 1-Person Household | 323 | 34.1% |
| 2-Person Household | 409 | 43.1% |
| 3-Person Household | 154 | 16.2% |
| 4+ Person Household | 62 | 6.5% |
| Total Housing Units | 948 | 100.0% |
Occupancy by Ownership by Household Size in Craigsville
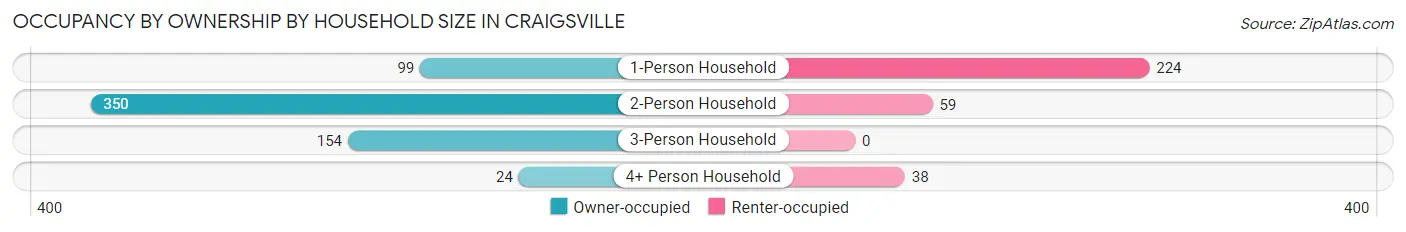
| Household Size | Owner-occupied | Renter-occupied |
| 1-Person Household | 99 (30.6%) | 224 (69.4%) |
| 2-Person Household | 350 (85.6%) | 59 (14.4%) |
| 3-Person Household | 154 (100.0%) | 0 (0.0%) |
| 4+ Person Household | 24 (38.7%) | 38 (61.3%) |
| Total Housing Units | 627 (66.1%) | 321 (33.9%) |
Occupancy by Educational Attainment in Craigsville
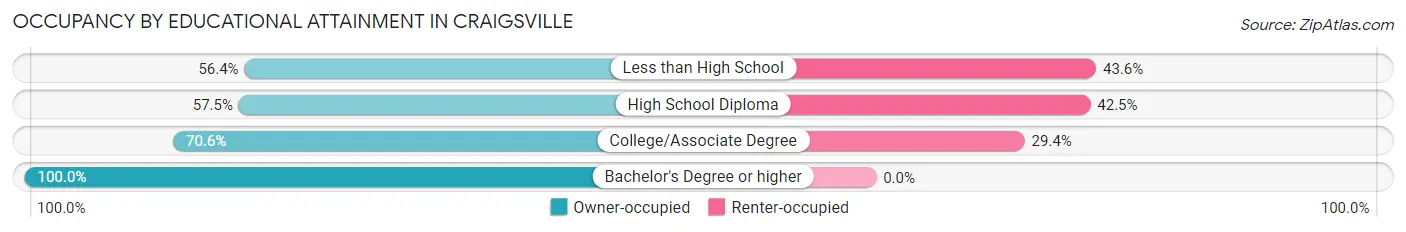
| Household Size | Owner-occupied | Renter-occupied |
| Less than High School | 44 (56.4%) | 34 (43.6%) |
| High School Diploma | 317 (57.5%) | 234 (42.5%) |
| College/Associate Degree | 127 (70.6%) | 53 (29.4%) |
| Bachelor's Degree or higher | 139 (100.0%) | 0 (0.0%) |
Occupancy by Age of Householder in Craigsville
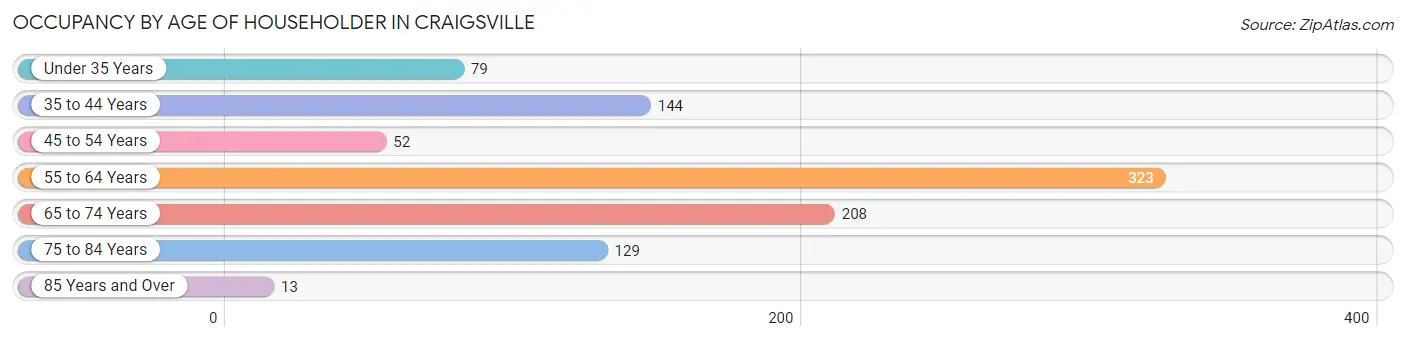
| Age Bracket | # Households | % Households |
| Under 35 Years | 79 | 8.3% |
| 35 to 44 Years | 144 | 15.2% |
| 45 to 54 Years | 52 | 5.5% |
| 55 to 64 Years | 323 | 34.1% |
| 65 to 74 Years | 208 | 21.9% |
| 75 to 84 Years | 129 | 13.6% |
| 85 Years and Over | 13 | 1.4% |
| Total | 948 | 100.0% |
Housing Finances in Craigsville
Median Income by Occupancy in Craigsville
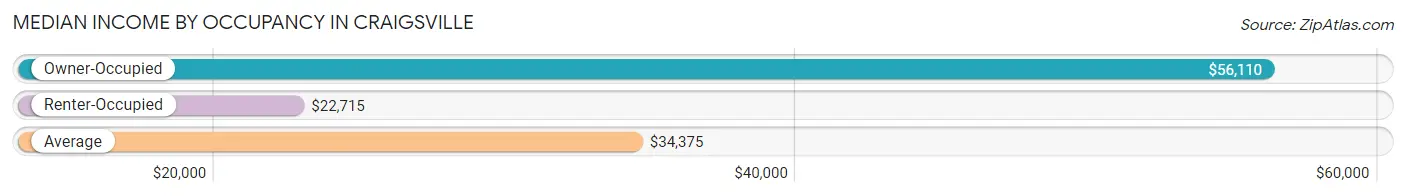
| Occupancy Type | # Households | Median Income |
| Owner-Occupied | 627 (66.1%) | $56,110 |
| Renter-Occupied | 321 (33.9%) | $22,715 |
| Average | 948 (100.0%) | $34,375 |
Occupancy by Householder Income Bracket in Craigsville
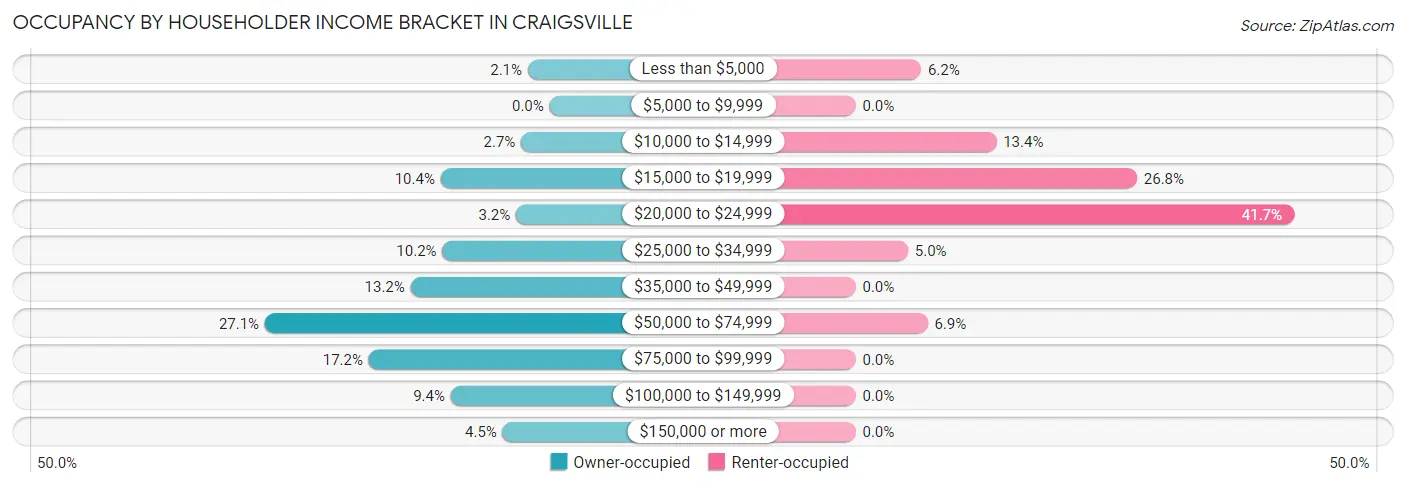
| Income Bracket | Owner-occupied | Renter-occupied |
| Less than $5,000 | 13 (2.1%) | 20 (6.2%) |
| $5,000 to $9,999 | 0 (0.0%) | 0 (0.0%) |
| $10,000 to $14,999 | 17 (2.7%) | 43 (13.4%) |
| $15,000 to $19,999 | 65 (10.4%) | 86 (26.8%) |
| $20,000 to $24,999 | 20 (3.2%) | 134 (41.7%) |
| $25,000 to $34,999 | 64 (10.2%) | 16 (5.0%) |
| $35,000 to $49,999 | 83 (13.2%) | 0 (0.0%) |
| $50,000 to $74,999 | 170 (27.1%) | 22 (6.9%) |
| $75,000 to $99,999 | 108 (17.2%) | 0 (0.0%) |
| $100,000 to $149,999 | 59 (9.4%) | 0 (0.0%) |
| $150,000 or more | 28 (4.5%) | 0 (0.0%) |
| Total | 627 (100.0%) | 321 (100.0%) |
Monthly Housing Cost Tiers in Craigsville
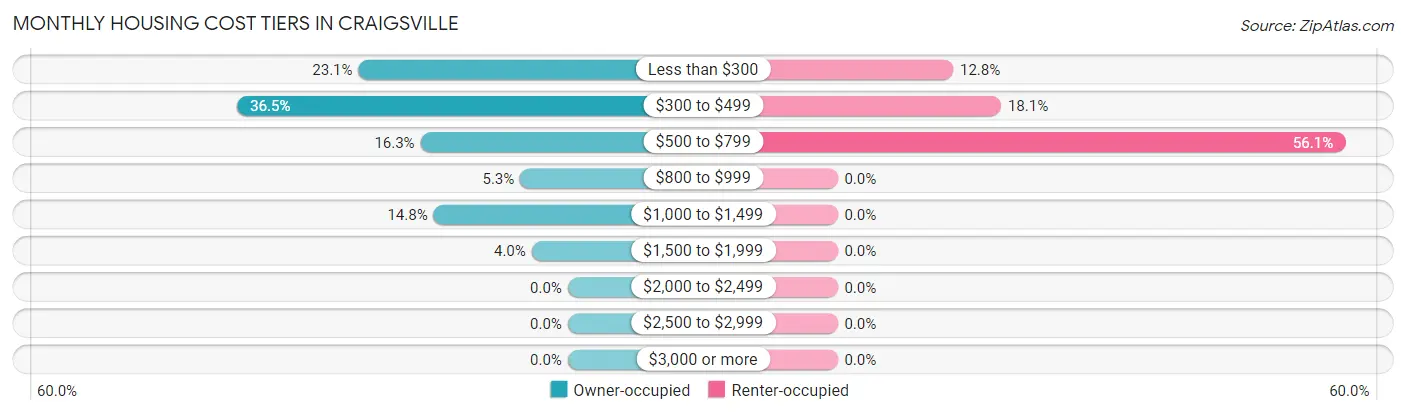
| Monthly Cost | Owner-occupied | Renter-occupied |
| Less than $300 | 145 (23.1%) | 41 (12.8%) |
| $300 to $499 | 229 (36.5%) | 58 (18.1%) |
| $500 to $799 | 102 (16.3%) | 180 (56.1%) |
| $800 to $999 | 33 (5.3%) | 0 (0.0%) |
| $1,000 to $1,499 | 93 (14.8%) | 0 (0.0%) |
| $1,500 to $1,999 | 25 (4.0%) | 0 (0.0%) |
| $2,000 to $2,499 | 0 (0.0%) | 0 (0.0%) |
| $2,500 to $2,999 | 0 (0.0%) | 0 (0.0%) |
| $3,000 or more | 0 (0.0%) | 0 (0.0%) |
| Total | 627 (100.0%) | 321 (100.0%) |
Physical Housing Characteristics in Craigsville
Housing Structures in Craigsville
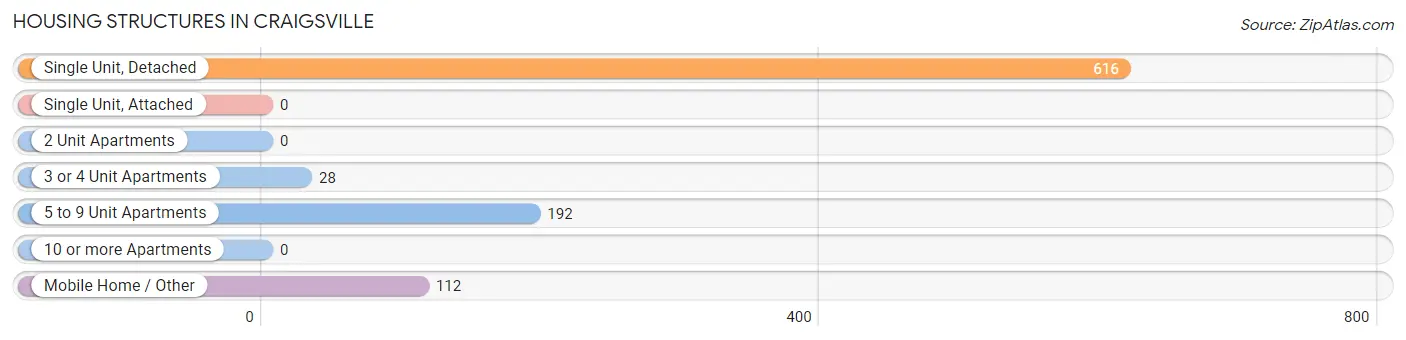
| Structure Type | # Housing Units | % Housing Units |
| Single Unit, Detached | 616 | 65.0% |
| Single Unit, Attached | 0 | 0.0% |
| 2 Unit Apartments | 0 | 0.0% |
| 3 or 4 Unit Apartments | 28 | 2.9% |
| 5 to 9 Unit Apartments | 192 | 20.3% |
| 10 or more Apartments | 0 | 0.0% |
| Mobile Home / Other | 112 | 11.8% |
| Total | 948 | 100.0% |
Housing Structures by Occupancy in Craigsville
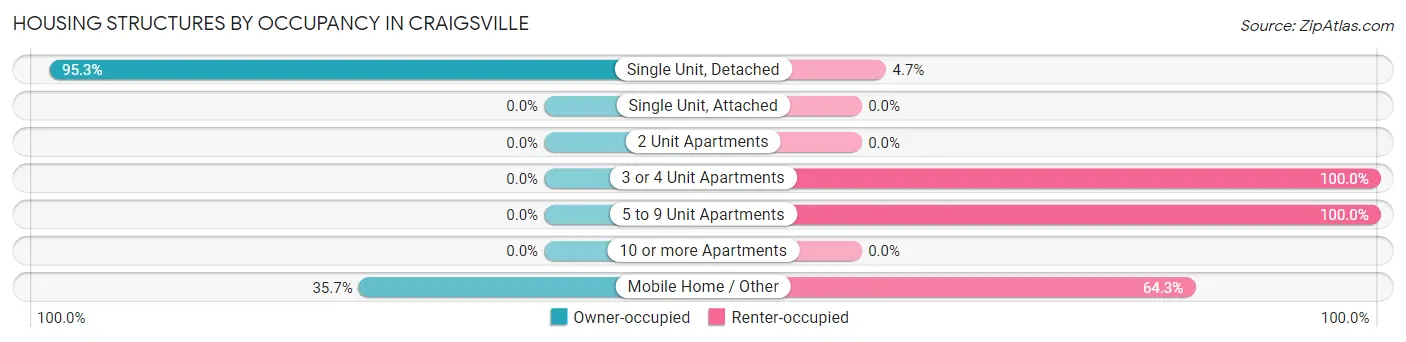
| Structure Type | Owner-occupied | Renter-occupied |
| Single Unit, Detached | 587 (95.3%) | 29 (4.7%) |
| Single Unit, Attached | 0 (0.0%) | 0 (0.0%) |
| 2 Unit Apartments | 0 (0.0%) | 0 (0.0%) |
| 3 or 4 Unit Apartments | 0 (0.0%) | 28 (100.0%) |
| 5 to 9 Unit Apartments | 0 (0.0%) | 192 (100.0%) |
| 10 or more Apartments | 0 (0.0%) | 0 (0.0%) |
| Mobile Home / Other | 40 (35.7%) | 72 (64.3%) |
| Total | 627 (66.1%) | 321 (33.9%) |
Housing Structures by Number of Rooms in Craigsville
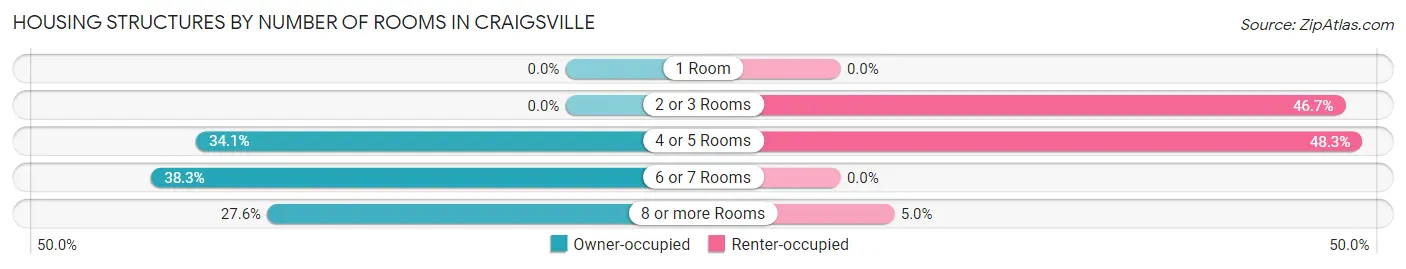
| Number of Rooms | Owner-occupied | Renter-occupied |
| 1 Room | 0 (0.0%) | 0 (0.0%) |
| 2 or 3 Rooms | 0 (0.0%) | 150 (46.7%) |
| 4 or 5 Rooms | 214 (34.1%) | 155 (48.3%) |
| 6 or 7 Rooms | 240 (38.3%) | 0 (0.0%) |
| 8 or more Rooms | 173 (27.6%) | 16 (5.0%) |
| Total | 627 (100.0%) | 321 (100.0%) |
Housing Structure by Heating Type in Craigsville
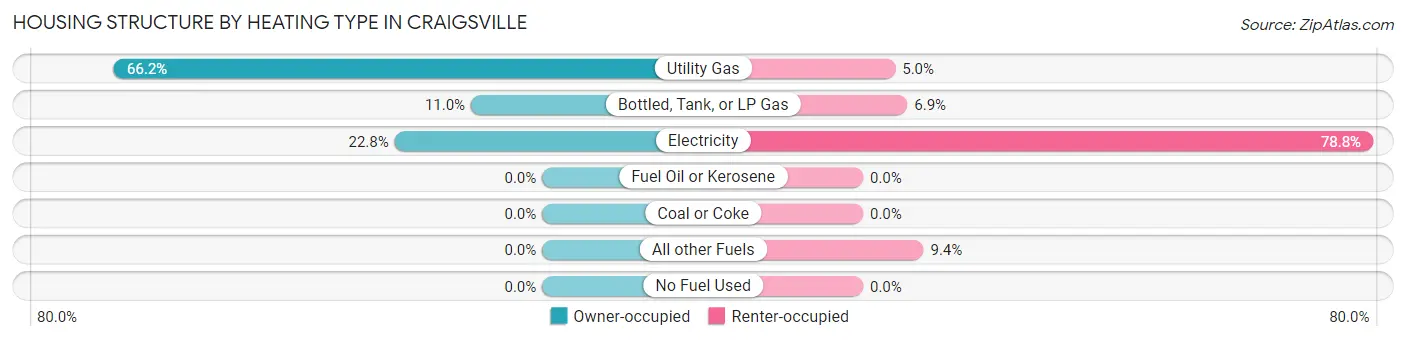
| Heating Type | Owner-occupied | Renter-occupied |
| Utility Gas | 415 (66.2%) | 16 (5.0%) |
| Bottled, Tank, or LP Gas | 69 (11.0%) | 22 (6.9%) |
| Electricity | 143 (22.8%) | 253 (78.8%) |
| Fuel Oil or Kerosene | 0 (0.0%) | 0 (0.0%) |
| Coal or Coke | 0 (0.0%) | 0 (0.0%) |
| All other Fuels | 0 (0.0%) | 30 (9.3%) |
| No Fuel Used | 0 (0.0%) | 0 (0.0%) |
| Total | 627 (100.0%) | 321 (100.0%) |
Household Vehicle Usage in Craigsville
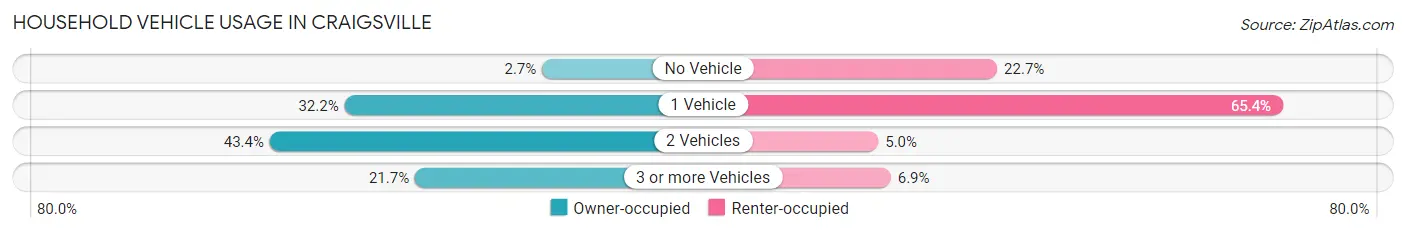
| Vehicles per Household | Owner-occupied | Renter-occupied |
| No Vehicle | 17 (2.7%) | 73 (22.7%) |
| 1 Vehicle | 202 (32.2%) | 210 (65.4%) |
| 2 Vehicles | 272 (43.4%) | 16 (5.0%) |
| 3 or more Vehicles | 136 (21.7%) | 22 (6.9%) |
| Total | 627 (100.0%) | 321 (100.0%) |
Real Estate & Mortgages in Craigsville
Real Estate and Mortgage Overview in Craigsville
| Characteristic | Without Mortgage | With Mortgage |
| Housing Units | 412 | 215 |
| Median Property Value | $112,200 | $101,200 |
| Median Household Income | $48,621 | $11 |
| Monthly Housing Costs | $331 | $0 |
| Real Estate Taxes | - | - |
Property Value by Mortgage Status in Craigsville
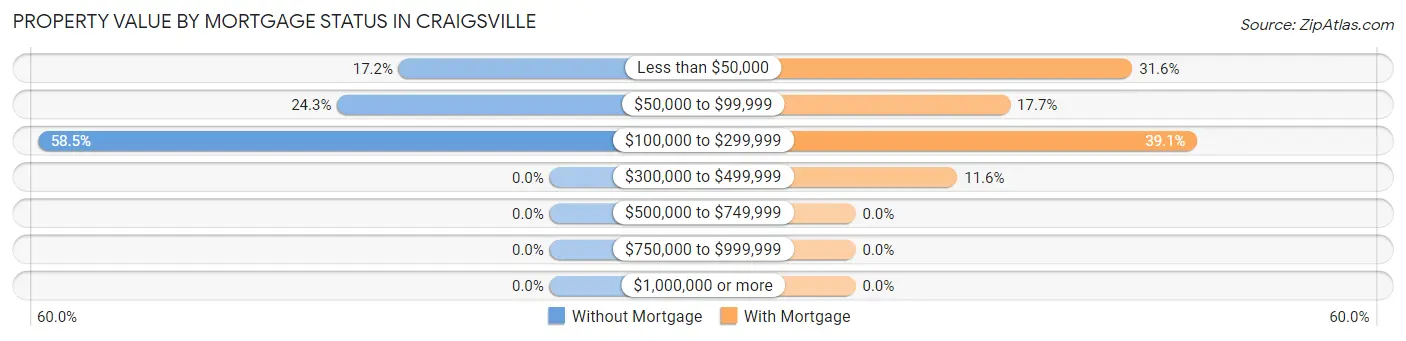
| Property Value | Without Mortgage | With Mortgage |
| Less than $50,000 | 71 (17.2%) | 68 (31.6%) |
| $50,000 to $99,999 | 100 (24.3%) | 38 (17.7%) |
| $100,000 to $299,999 | 241 (58.5%) | 84 (39.1%) |
| $300,000 to $499,999 | 0 (0.0%) | 25 (11.6%) |
| $500,000 to $749,999 | 0 (0.0%) | 0 (0.0%) |
| $750,000 to $999,999 | 0 (0.0%) | 0 (0.0%) |
| $1,000,000 or more | 0 (0.0%) | 0 (0.0%) |
| Total | 412 (100.0%) | 215 (100.0%) |
Household Income by Mortgage Status in Craigsville
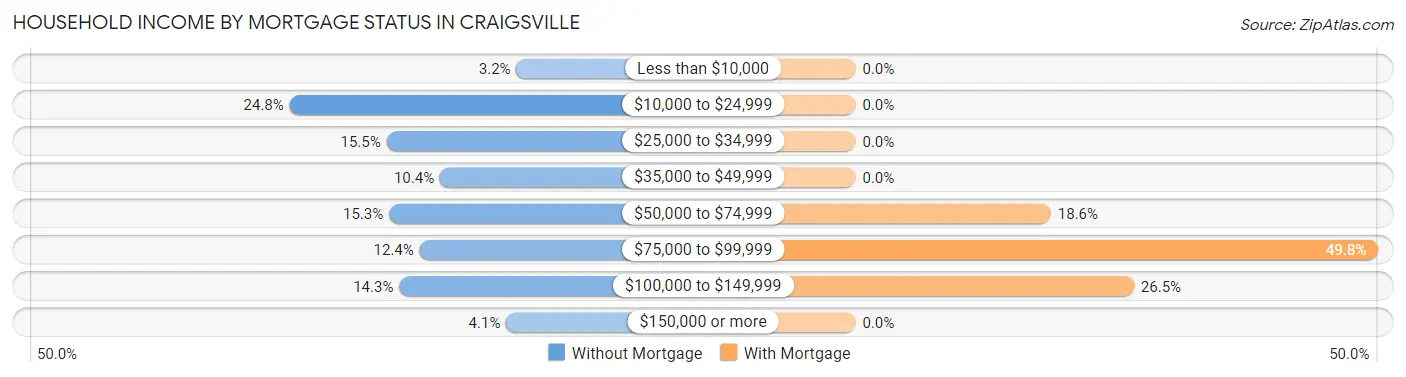
| Household Income | Without Mortgage | With Mortgage |
| Less than $10,000 | 13 (3.2%) | 0 (0.0%) |
| $10,000 to $24,999 | 102 (24.8%) | 0 (0.0%) |
| $25,000 to $34,999 | 64 (15.5%) | 0 (0.0%) |
| $35,000 to $49,999 | 43 (10.4%) | 0 (0.0%) |
| $50,000 to $74,999 | 63 (15.3%) | 40 (18.6%) |
| $75,000 to $99,999 | 51 (12.4%) | 107 (49.8%) |
| $100,000 to $149,999 | 59 (14.3%) | 57 (26.5%) |
| $150,000 or more | 17 (4.1%) | 0 (0.0%) |
| Total | 412 (100.0%) | 215 (100.0%) |
Property Value to Household Income Ratio in Craigsville
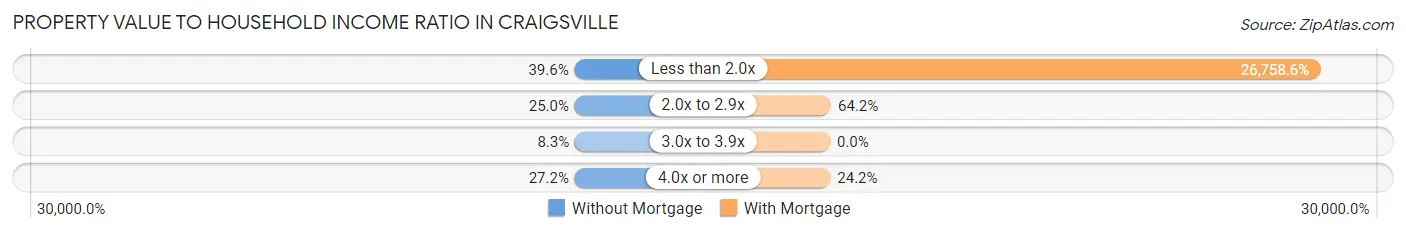
| Value-to-Income Ratio | Without Mortgage | With Mortgage |
| Less than 2.0x | 163 (39.6%) | 57,531 (26,758.6%) |
| 2.0x to 2.9x | 103 (25.0%) | 138 (64.2%) |
| 3.0x to 3.9x | 34 (8.3%) | 0 (0.0%) |
| 4.0x or more | 112 (27.2%) | 52 (24.2%) |
| Total | 412 (100.0%) | 215 (100.0%) |
Real Estate Taxes by Mortgage Status in Craigsville
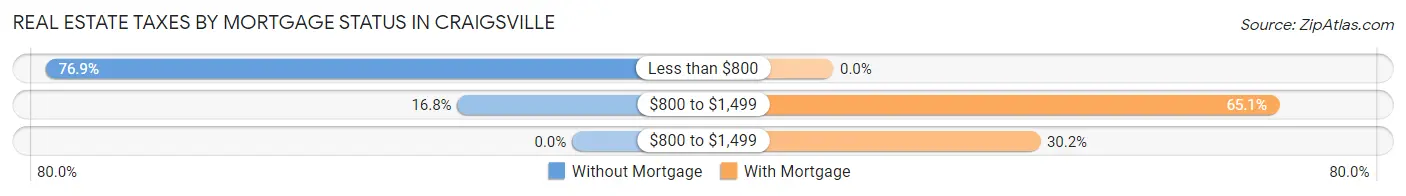
| Property Taxes | Without Mortgage | With Mortgage |
| Less than $800 | 317 (76.9%) | 0 (0.0%) |
| $800 to $1,499 | 69 (16.8%) | 140 (65.1%) |
| $800 to $1,499 | 0 (0.0%) | 65 (30.2%) |
| Total | 412 (100.0%) | 215 (100.0%) |
Health & Disability in Craigsville
Health Insurance Coverage by Age in Craigsville
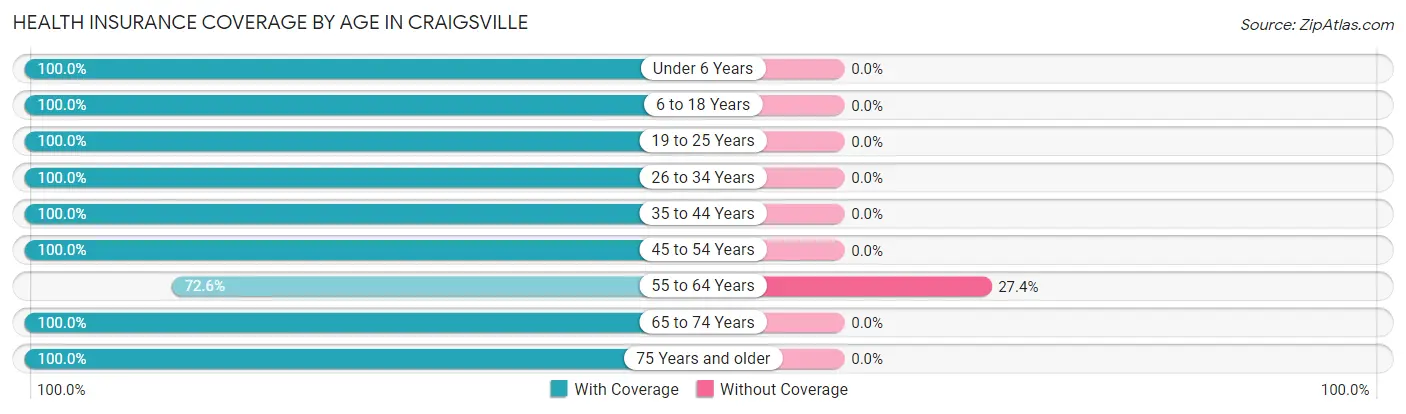
| Age Bracket | With Coverage | Without Coverage |
| Under 6 Years | 129 (100.0%) | 0 (0.0%) |
| 6 to 18 Years | 233 (100.0%) | 0 (0.0%) |
| 19 to 25 Years | 157 (100.0%) | 0 (0.0%) |
| 26 to 34 Years | 147 (100.0%) | 0 (0.0%) |
| 35 to 44 Years | 225 (100.0%) | 0 (0.0%) |
| 45 to 54 Years | 122 (100.0%) | 0 (0.0%) |
| 55 to 64 Years | 355 (72.6%) | 134 (27.4%) |
| 65 to 74 Years | 364 (100.0%) | 0 (0.0%) |
| 75 Years and older | 185 (100.0%) | 0 (0.0%) |
| Total | 1,917 (93.5%) | 134 (6.5%) |
Health Insurance Coverage by Citizenship Status in Craigsville
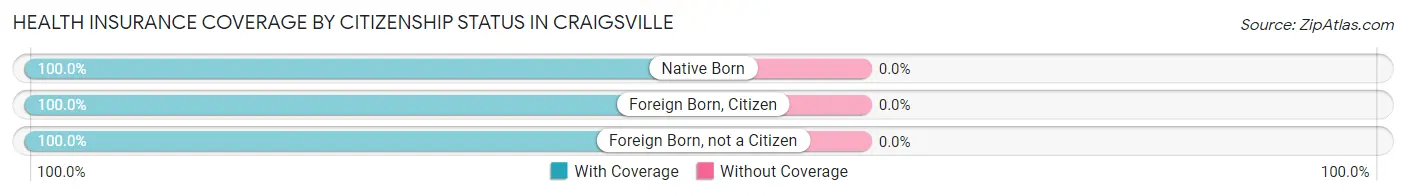
| Citizenship Status | With Coverage | Without Coverage |
| Native Born | 129 (100.0%) | 0 (0.0%) |
| Foreign Born, Citizen | 233 (100.0%) | 0 (0.0%) |
| Foreign Born, not a Citizen | 157 (100.0%) | 0 (0.0%) |
Health Insurance Coverage by Household Income in Craigsville
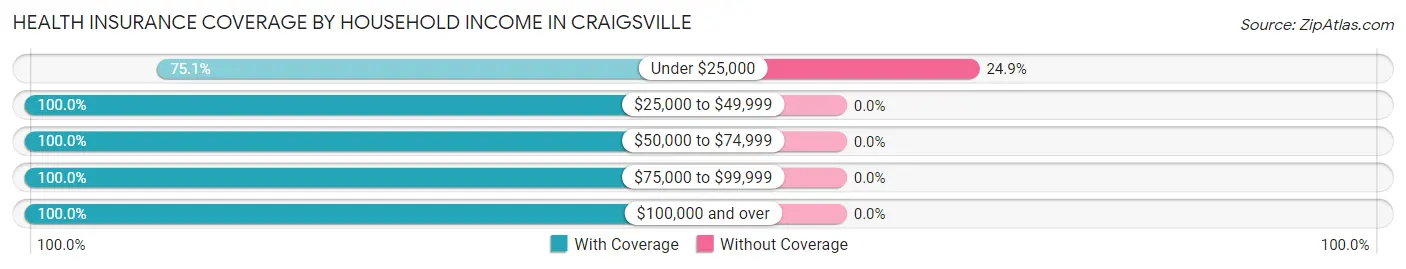
| Household Income | With Coverage | Without Coverage |
| Under $25,000 | 405 (75.1%) | 134 (24.9%) |
| $25,000 to $49,999 | 432 (100.0%) | 0 (0.0%) |
| $50,000 to $74,999 | 560 (100.0%) | 0 (0.0%) |
| $75,000 to $99,999 | 231 (100.0%) | 0 (0.0%) |
| $100,000 and over | 289 (100.0%) | 0 (0.0%) |
Public vs Private Health Insurance Coverage by Age in Craigsville
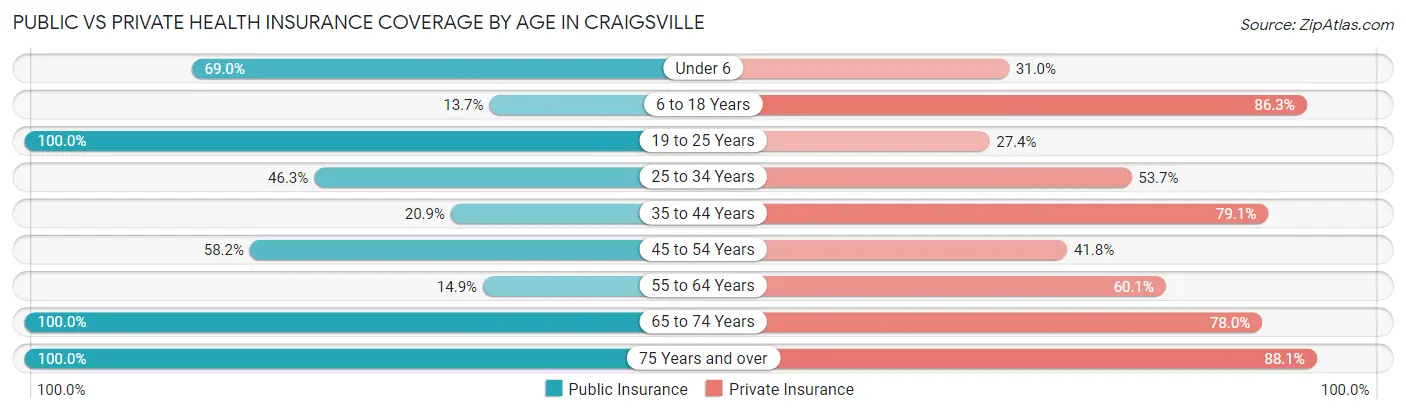
| Age Bracket | Public Insurance | Private Insurance |
| Under 6 | 89 (69.0%) | 40 (31.0%) |
| 6 to 18 Years | 32 (13.7%) | 201 (86.3%) |
| 19 to 25 Years | 157 (100.0%) | 43 (27.4%) |
| 25 to 34 Years | 68 (46.3%) | 79 (53.7%) |
| 35 to 44 Years | 47 (20.9%) | 178 (79.1%) |
| 45 to 54 Years | 71 (58.2%) | 51 (41.8%) |
| 55 to 64 Years | 73 (14.9%) | 294 (60.1%) |
| 65 to 74 Years | 364 (100.0%) | 284 (78.0%) |
| 75 Years and over | 185 (100.0%) | 163 (88.1%) |
| Total | 1,086 (52.9%) | 1,333 (65.0%) |
Disability Status by Sex by Age in Craigsville
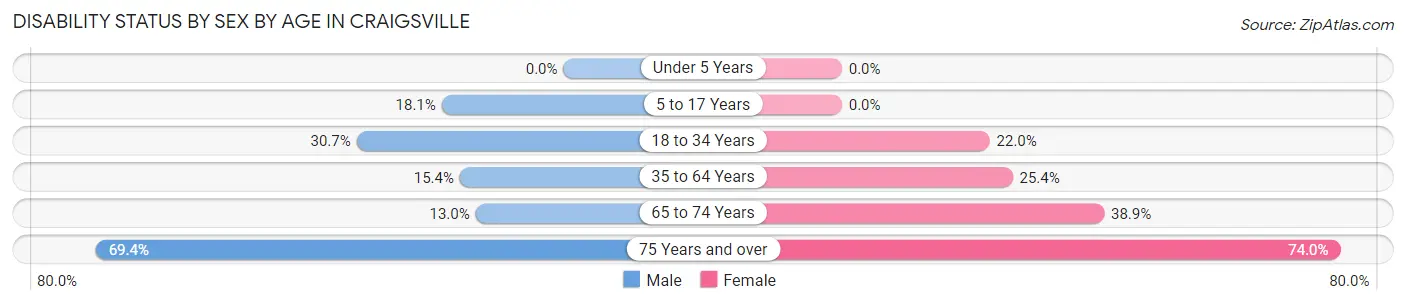
| Age Bracket | Male | Female |
| Under 5 Years | 0 (0.0%) | 0 (0.0%) |
| 5 to 17 Years | 32 (18.1%) | 0 (0.0%) |
| 18 to 34 Years | 43 (30.7%) | 36 (22.0%) |
| 35 to 64 Years | 74 (15.4%) | 90 (25.4%) |
| 65 to 74 Years | 18 (13.0%) | 88 (38.9%) |
| 75 Years and over | 75 (69.4%) | 57 (74.0%) |
Disability Class by Sex by Age in Craigsville
Disability Class: Hearing Difficulty
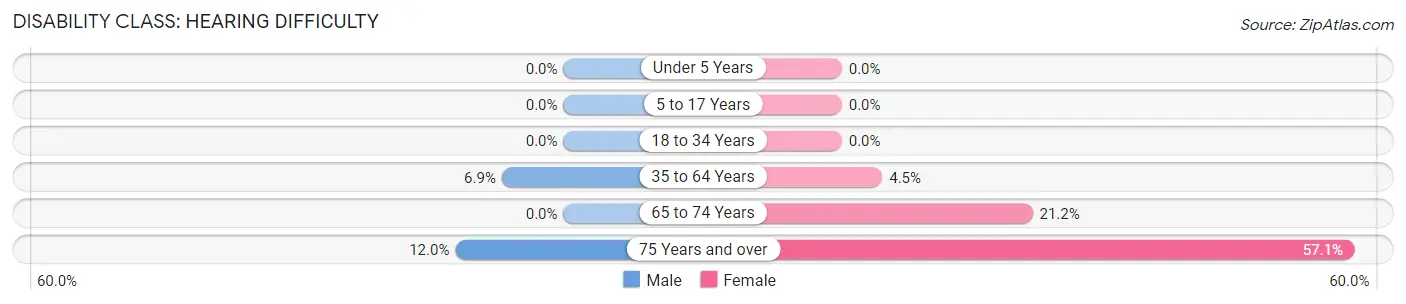
| Age Bracket | Male | Female |
| Under 5 Years | 0 (0.0%) | 0 (0.0%) |
| 5 to 17 Years | 0 (0.0%) | 0 (0.0%) |
| 18 to 34 Years | 0 (0.0%) | 0 (0.0%) |
| 35 to 64 Years | 33 (6.9%) | 16 (4.5%) |
| 65 to 74 Years | 0 (0.0%) | 48 (21.2%) |
| 75 Years and over | 13 (12.0%) | 44 (57.1%) |
Disability Class: Vision Difficulty
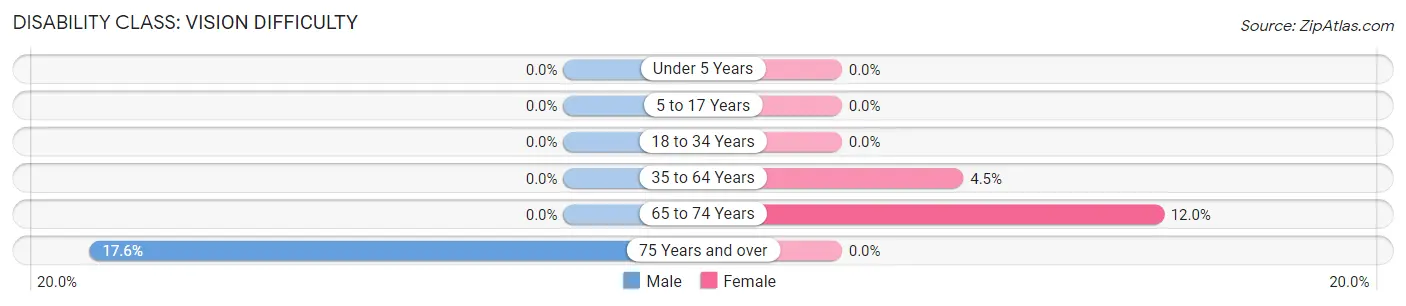
| Age Bracket | Male | Female |
| Under 5 Years | 0 (0.0%) | 0 (0.0%) |
| 5 to 17 Years | 0 (0.0%) | 0 (0.0%) |
| 18 to 34 Years | 0 (0.0%) | 0 (0.0%) |
| 35 to 64 Years | 0 (0.0%) | 16 (4.5%) |
| 65 to 74 Years | 0 (0.0%) | 27 (11.9%) |
| 75 Years and over | 19 (17.6%) | 0 (0.0%) |
Disability Class: Cognitive Difficulty
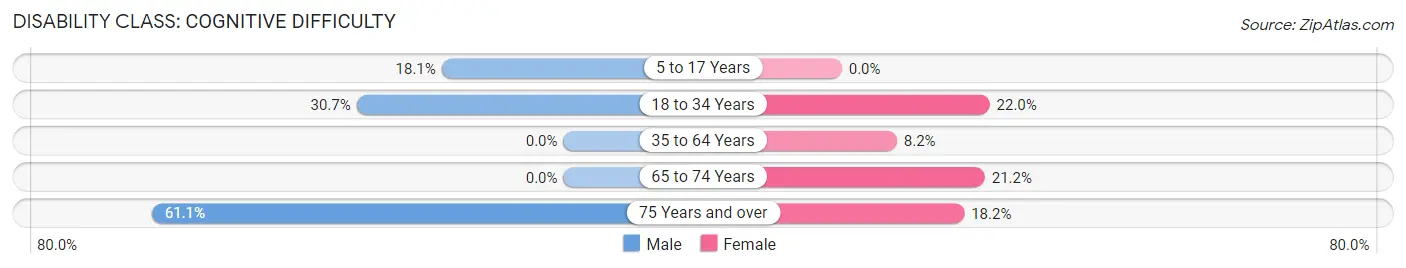
| Age Bracket | Male | Female |
| 5 to 17 Years | 32 (18.1%) | 0 (0.0%) |
| 18 to 34 Years | 43 (30.7%) | 36 (22.0%) |
| 35 to 64 Years | 0 (0.0%) | 29 (8.2%) |
| 65 to 74 Years | 0 (0.0%) | 48 (21.2%) |
| 75 Years and over | 66 (61.1%) | 14 (18.2%) |
Disability Class: Ambulatory Difficulty
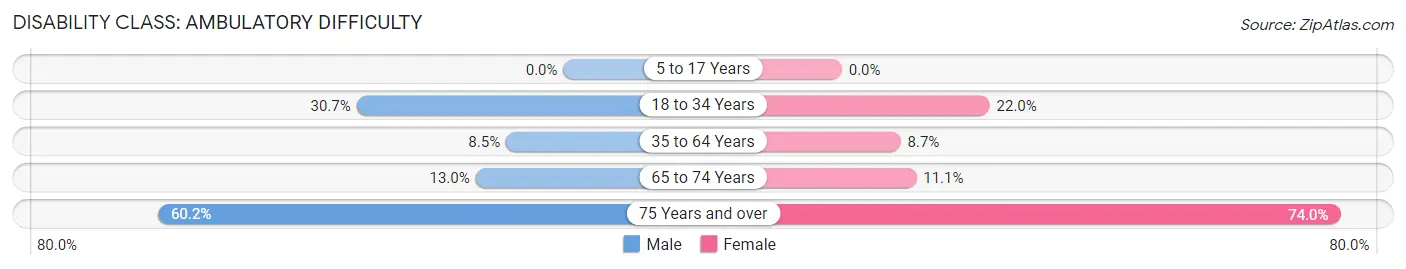
| Age Bracket | Male | Female |
| 5 to 17 Years | 0 (0.0%) | 0 (0.0%) |
| 18 to 34 Years | 43 (30.7%) | 36 (22.0%) |
| 35 to 64 Years | 41 (8.5%) | 31 (8.7%) |
| 65 to 74 Years | 18 (13.0%) | 25 (11.1%) |
| 75 Years and over | 65 (60.2%) | 57 (74.0%) |
Disability Class: Self-Care Difficulty
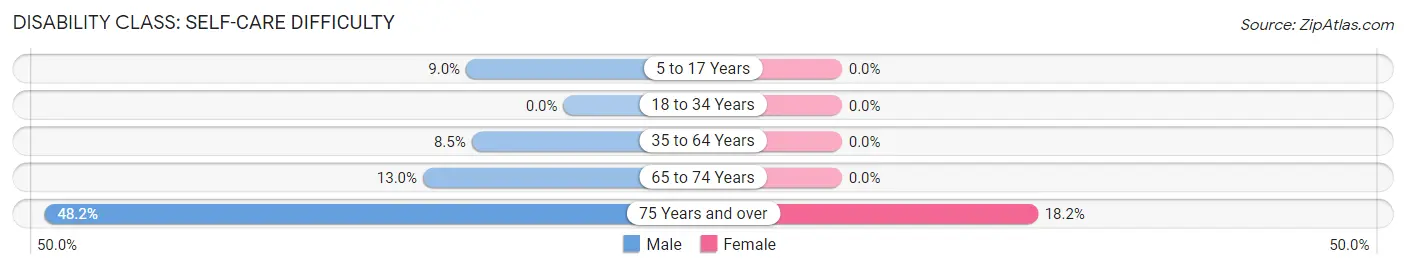
| Age Bracket | Male | Female |
| 5 to 17 Years | 16 (9.0%) | 0 (0.0%) |
| 18 to 34 Years | 0 (0.0%) | 0 (0.0%) |
| 35 to 64 Years | 41 (8.5%) | 0 (0.0%) |
| 65 to 74 Years | 18 (13.0%) | 0 (0.0%) |
| 75 Years and over | 52 (48.1%) | 14 (18.2%) |
Technology Access in Craigsville
Computing Device Access in Craigsville
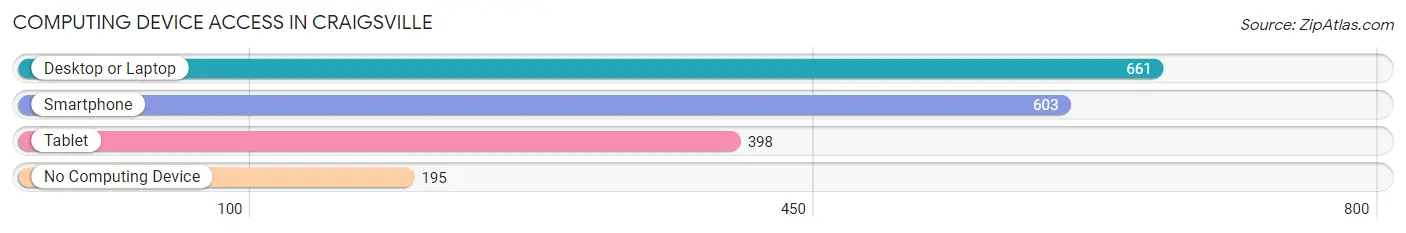
| Device Type | # Households | % Households |
| Desktop or Laptop | 661 | 69.7% |
| Smartphone | 603 | 63.6% |
| Tablet | 398 | 42.0% |
| No Computing Device | 195 | 20.6% |
| Total | 948 | 100.0% |
Internet Access in Craigsville
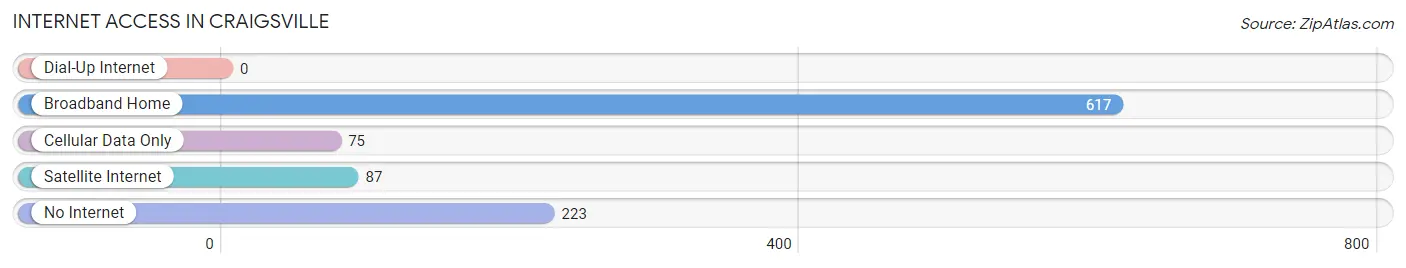
| Internet Type | # Households | % Households |
| Dial-Up Internet | 0 | 0.0% |
| Broadband Home | 617 | 65.1% |
| Cellular Data Only | 75 | 7.9% |
| Satellite Internet | 87 | 9.2% |
| No Internet | 223 | 23.5% |
| Total | 948 | 100.0% |
Craigsville Summary
Craigville, West Virginia is a small town located in the eastern part of the state, in Nicholas County. It is situated on the banks of the Gauley River, and is surrounded by the beautiful Appalachian Mountains. The town was founded in 1817 by William Craig, and was named after him. It is a small, rural community with a population of just over 500 people.
Geography
Craigville is located in the Appalachian Mountains of West Virginia, in Nicholas County. It is situated on the banks of the Gauley River, and is surrounded by the beautiful Appalachian Mountains. The town is located at an elevation of 1,845 feet above sea level. The climate in Craigville is humid continental, with hot summers and cold winters. The average annual temperature is around 50 degrees Fahrenheit.
Economy
The economy of Craigville is largely based on agriculture and tourism. The town is home to several small farms, which produce a variety of crops, including corn, soybeans, and hay. The town also has a few small businesses, such as a gas station, a grocery store, and a few restaurants. Tourism is also an important part of the economy, as the town is located near several popular outdoor recreation areas, such as the Gauley River National Recreation Area and the Monongahela National Forest.
Demographics
As of the 2010 census, the population of Craigville was 514 people. The racial makeup of the town was 97.3% White, 0.6% African American, 0.2% Native American, 0.2% Asian, 0.2% from other races, and 1.6% from two or more races. The median household income was $30,000, and the median family income was $35,000. The per capita income was $14,000.
History
Craigville was founded in 1817 by William Craig, and was named after him. The town was originally a small farming community, and the main crops grown were corn, soybeans, and hay. In the late 19th century, the town began to grow and develop, and several businesses were established. In the early 20th century, the town was connected to the rest of the state by the West Virginia Central and Pittsburgh Railway. The town continued to grow and develop throughout the 20th century, and today it is a small, rural community with a population of just over 500 people.
Conclusion
Craigville, West Virginia is a small, rural town located in the Appalachian Mountains of West Virginia. It is situated on the banks of the Gauley River, and is surrounded by the beautiful Appalachian Mountains. The town was founded in 1817 by William Craig, and was named after him. The economy of Craigville is largely based on agriculture and tourism, and the town is home to several small farms and businesses. The population of Craigville is 514 people, and the racial makeup of the town is 97.3% White, 0.6% African American, 0.2% Native American, 0.2% Asian, 0.2% from other races, and 1.6% from two or more races. Craigville is a small, rural community with a rich history and a bright future.
Common Questions
What is Per Capita Income in Craigsville?
Per Capita income in Craigsville is $24,770.
What is the Median Family Income in Craigsville?
Median Family Income in Craigsville is $56,798.
What is the Median Household income in Craigsville?
Median Household Income in Craigsville is $34,375.
What is Income or Wage Gap in Craigsville?
Income or Wage Gap in Craigsville is 43.6%.
Women in Craigsville earn 56.4 cents for every dollar earned by a man.
What is Inequality or Gini Index in Craigsville?
Inequality or Gini Index in Craigsville is 0.40.
What is the Total Population of Craigsville?
Total Population of Craigsville is 2,051.
What is the Total Male Population of Craigsville?
Total Male Population of Craigsville is 1,132.
What is the Total Female Population of Craigsville?
Total Female Population of Craigsville is 919.
What is the Ratio of Males per 100 Females in Craigsville?
There are 123.18 Males per 100 Females in Craigsville.
What is the Ratio of Females per 100 Males in Craigsville?
There are 81.18 Females per 100 Males in Craigsville.
What is the Median Population Age in Craigsville?
Median Population Age in Craigsville is 55.4 Years.
What is the Average Family Size in Craigsville
Average Family Size in Craigsville is 2.7 People.
What is the Average Household Size in Craigsville
Average Household Size in Craigsville is 2.2 People.
How Large is the Labor Force in Craigsville?
There are 686 People in the Labor Forcein in Craigsville.
What is the Percentage of People in the Labor Force in Craigsville?
38.7% of People are in the Labor Force in Craigsville.