Mineralwells, WV Map & Demographics
Mineralwells Map
Mineralwells Overview
$28,971
PER CAPITA INCOME
$100,735
AVG FAMILY INCOME
$79,760
AVG HOUSEHOLD INCOME
33.9%
WAGE / INCOME GAP [ % ]
66.1¢/ $1
WAGE / INCOME GAP [ $ ]
0.37
INEQUALITY / GINI INDEX
2,549
TOTAL POPULATION
1,307
MALE POPULATION
1,242
FEMALE POPULATION
105.23
MALES / 100 FEMALES
95.03
FEMALES / 100 MALES
33.0
MEDIAN AGE
4.1
AVG FAMILY SIZE
3.2
AVG HOUSEHOLD SIZE
946
LABOR FORCE [ PEOPLE ]
52.2%
PERCENT IN LABOR FORCE
1.0%
UNEMPLOYMENT RATE
Income in Mineralwells
Income Overview in Mineralwells
Per Capita Income in Mineralwells is $28,971, while median incomes of families and households are $100,735 and $79,760 respectively.
| Characteristic | Number | Measure |
| Per Capita Income | 2,549 | $28,971 |
| Median Family Income | 550 | $100,735 |
| Mean Family Income | 550 | $102,608 |
| Median Household Income | 795 | $79,760 |
| Mean Household Income | 795 | $88,893 |
| Income Deficit | 550 | $0 |
| Wage / Income Gap (%) | 2,549 | 33.87% |
| Wage / Income Gap ($) | 2,549 | 66.13¢ per $1 |
| Gini / Inequality Index | 2,549 | 0.37 |
Earnings by Sex in Mineralwells
Average Earnings in Mineralwells are $34,398, $47,258 for men and $31,250 for women, a difference of 33.9%.
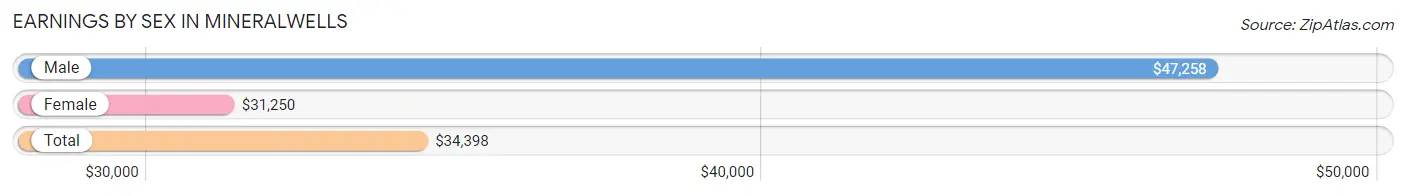
| Sex | Number | Average Earnings |
| Male | 538 (54.6%) | $47,258 |
| Female | 448 (45.4%) | $31,250 |
| Total | 986 (100.0%) | $34,398 |
Earnings by Sex by Income Bracket in Mineralwells
The most common earnings brackets in Mineralwells are $75,000 to $99,999 for men (117 | 21.7%) and $25,000 to $29,999 for women (117 | 26.1%).
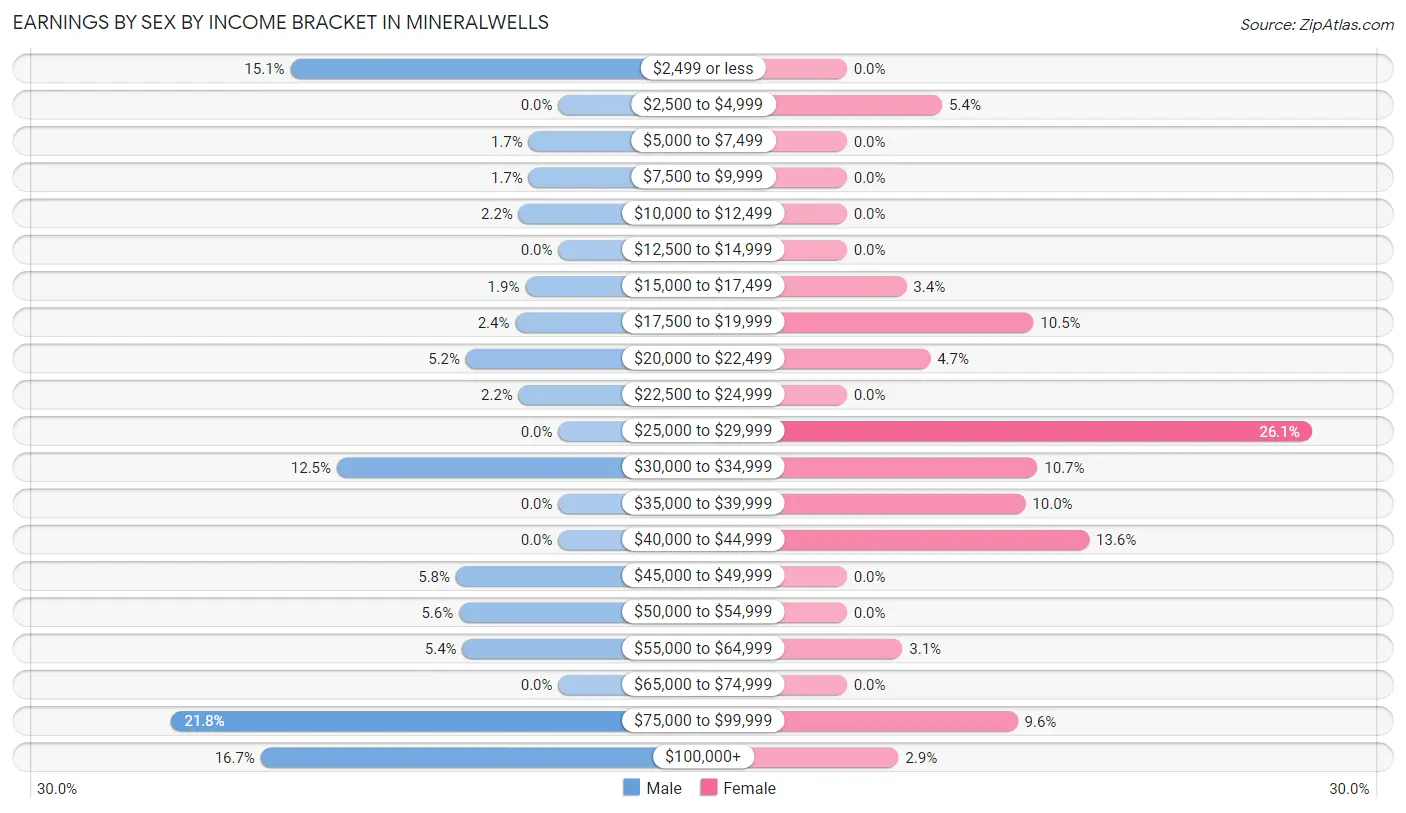
| Income | Male | Female |
| $2,499 or less | 81 (15.1%) | 0 (0.0%) |
| $2,500 to $4,999 | 0 (0.0%) | 24 (5.4%) |
| $5,000 to $7,499 | 9 (1.7%) | 0 (0.0%) |
| $7,500 to $9,999 | 9 (1.7%) | 0 (0.0%) |
| $10,000 to $12,499 | 12 (2.2%) | 0 (0.0%) |
| $12,500 to $14,999 | 0 (0.0%) | 0 (0.0%) |
| $15,000 to $17,499 | 10 (1.9%) | 15 (3.4%) |
| $17,500 to $19,999 | 13 (2.4%) | 47 (10.5%) |
| $20,000 to $22,499 | 28 (5.2%) | 21 (4.7%) |
| $22,500 to $24,999 | 12 (2.2%) | 0 (0.0%) |
| $25,000 to $29,999 | 0 (0.0%) | 117 (26.1%) |
| $30,000 to $34,999 | 67 (12.4%) | 48 (10.7%) |
| $35,000 to $39,999 | 0 (0.0%) | 45 (10.0%) |
| $40,000 to $44,999 | 0 (0.0%) | 61 (13.6%) |
| $45,000 to $49,999 | 31 (5.8%) | 0 (0.0%) |
| $50,000 to $54,999 | 30 (5.6%) | 0 (0.0%) |
| $55,000 to $64,999 | 29 (5.4%) | 14 (3.1%) |
| $65,000 to $74,999 | 0 (0.0%) | 0 (0.0%) |
| $75,000 to $99,999 | 117 (21.7%) | 43 (9.6%) |
| $100,000+ | 90 (16.7%) | 13 (2.9%) |
| Total | 538 (100.0%) | 448 (100.0%) |
Earnings by Sex by Educational Attainment in Mineralwells
Average earnings in Mineralwells are $51,833 for men and $33,203 for women, a difference of 35.9%. Men with an educational attainment of bachelor's degree enjoy the highest average annual earnings of $101,350, while those with college or associate's degree education earn the least with $30,324. Women with an educational attainment of college or associate's degree earn the most with the average annual earnings of $33,568, while those with high school diploma education have the smallest earnings of $26,003.
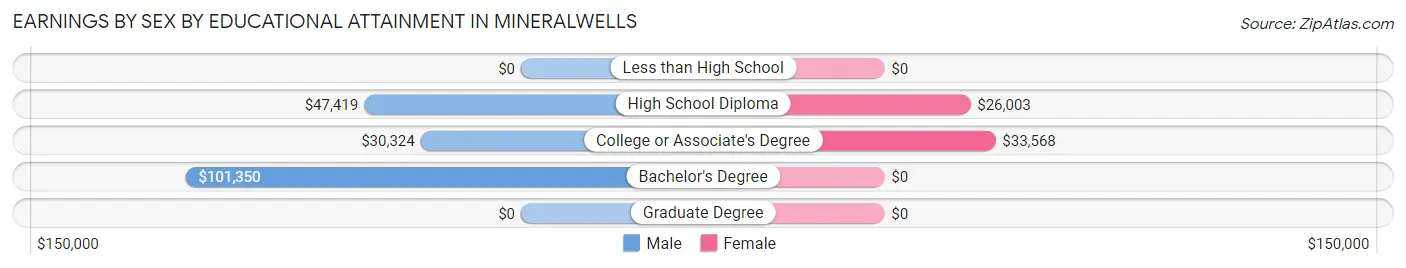
| Educational Attainment | Male Income | Female Income |
| Less than High School | - | - |
| High School Diploma | $47,419 | $26,003 |
| College or Associate's Degree | $30,324 | $33,568 |
| Bachelor's Degree | $101,350 | $0 |
| Graduate Degree | - | - |
| Total | $51,833 | $33,203 |
Family Income in Mineralwells
Family Income Brackets in Mineralwells
According to the Mineralwells family income data, there are 206 families falling into the $100,000 to $149,999 income range, which is the most common income bracket and makes up 37.4% of all families.
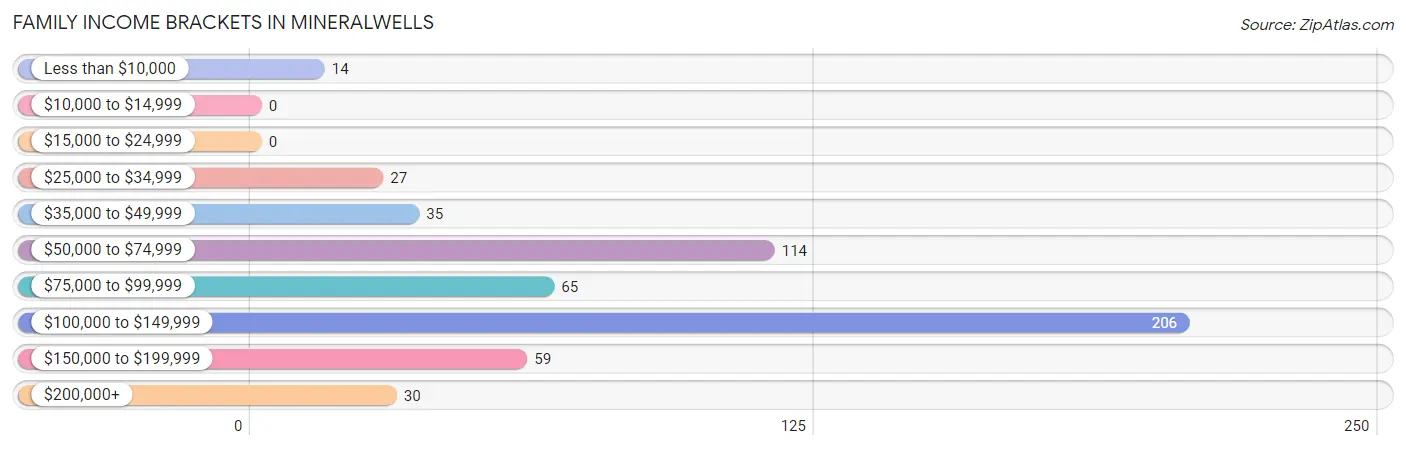
| Income Bracket | # Families | % Families |
| Less than $10,000 | 14 | 2.5% |
| $10,000 to $14,999 | 0 | 0.0% |
| $15,000 to $24,999 | 0 | 0.0% |
| $25,000 to $34,999 | 27 | 4.9% |
| $35,000 to $49,999 | 35 | 6.4% |
| $50,000 to $74,999 | 114 | 20.7% |
| $75,000 to $99,999 | 65 | 11.8% |
| $100,000 to $149,999 | 206 | 37.5% |
| $150,000 to $199,999 | 59 | 10.7% |
| $200,000+ | 30 | 5.5% |
Family Income by Famaliy Size in Mineralwells
3-person families (99 | 18.0%) account for the highest median family income in Mineralwells with $118,917 per family, while 3-person families (99 | 18.0%) have the highest median income of $39,639 per family member.
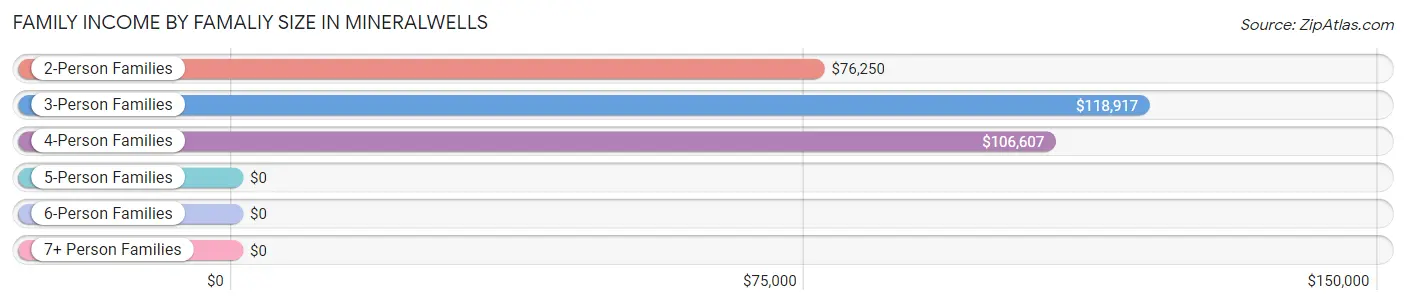
| Income Bracket | # Families | Median Income |
| 2-Person Families | 118 (21.4%) | $76,250 |
| 3-Person Families | 99 (18.0%) | $118,917 |
| 4-Person Families | 241 (43.8%) | $106,607 |
| 5-Person Families | 69 (12.6%) | $0 |
| 6-Person Families | 0 (0.0%) | $0 |
| 7+ Person Families | 23 (4.2%) | $0 |
| Total | 550 (100.0%) | $100,735 |
Family Income by Number of Earners in Mineralwells
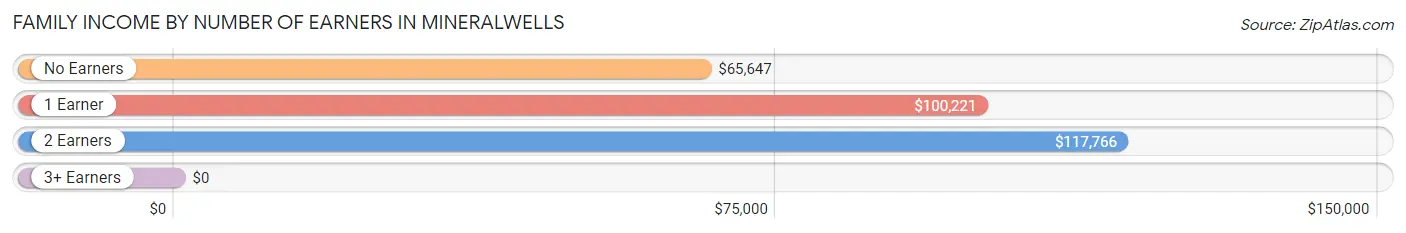
| Number of Earners | # Families | Median Income |
| No Earners | 43 (7.8%) | $65,647 |
| 1 Earner | 262 (47.6%) | $100,221 |
| 2 Earners | 191 (34.7%) | $117,766 |
| 3+ Earners | 54 (9.8%) | $0 |
| Total | 550 (100.0%) | $100,735 |
Household Income in Mineralwells
Household Income Brackets in Mineralwells
With 214 households falling in the category, the $100,000 to $149,999 income range is the most frequent in Mineralwells, accounting for 26.9% of all households. In contrast, only 12 households (1.5%) fall into the $15,000 to $24,999 income bracket, making it the least populous group.
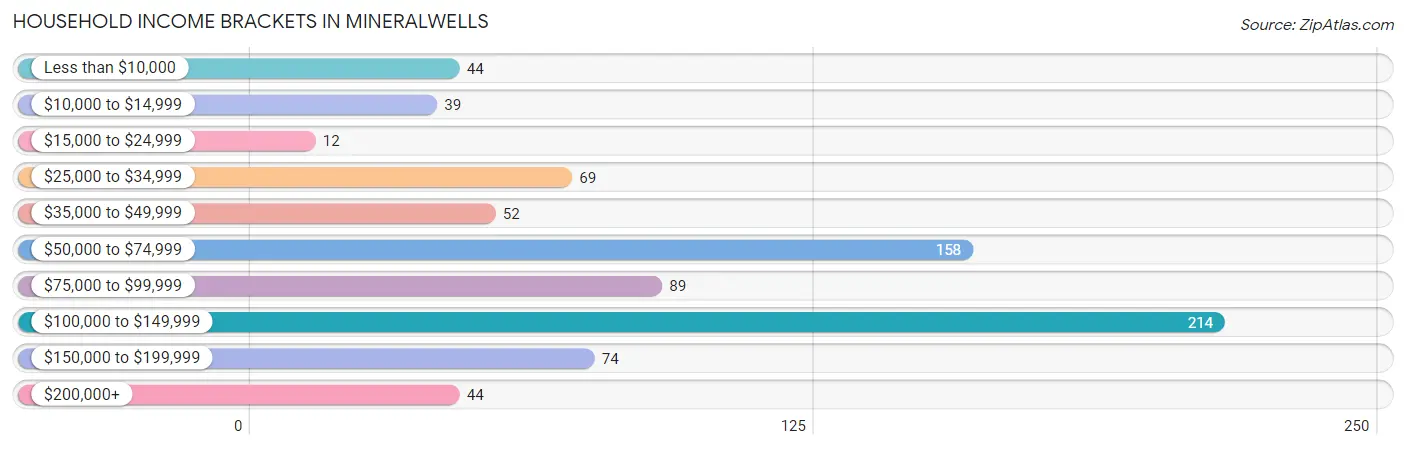
| Income Bracket | # Households | % Households |
| Less than $10,000 | 44 | 5.5% |
| $10,000 to $14,999 | 39 | 4.9% |
| $15,000 to $24,999 | 12 | 1.5% |
| $25,000 to $34,999 | 69 | 8.7% |
| $35,000 to $49,999 | 52 | 6.5% |
| $50,000 to $74,999 | 158 | 19.9% |
| $75,000 to $99,999 | 89 | 11.2% |
| $100,000 to $149,999 | 214 | 26.9% |
| $150,000 to $199,999 | 74 | 9.3% |
| $200,000+ | 44 | 5.5% |
Household Income by Householder Age in Mineralwells
The median household income in Mineralwells is $79,760, with the highest median household income of $100,441 found in the 45 to 64 years age bracket for the primary householder. A total of 224 households (28.2%) fall into this category. Meanwhile, the 15 to 24 years age bracket for the primary householder has the lowest median household income of $0, with 11 households (1.4%) in this group.
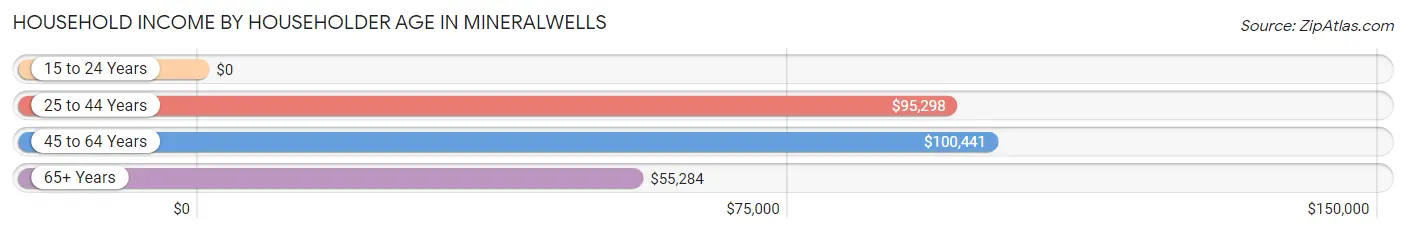
| Income Bracket | # Households | Median Income |
| 15 to 24 Years | 11 (1.4%) | $0 |
| 25 to 44 Years | 323 (40.6%) | $95,298 |
| 45 to 64 Years | 224 (28.2%) | $100,441 |
| 65+ Years | 237 (29.8%) | $55,284 |
| Total | 795 (100.0%) | $79,760 |
Poverty in Mineralwells
Income Below Poverty by Sex and Age in Mineralwells
With 2.6% poverty level for males and 3.8% for females among the residents of Mineralwells, 45 to 54 year old males and 65 to 74 year old females are the most vulnerable to poverty, with 19 males (14.8%) and 47 females (26.1%) in their respective age groups living below the poverty level.
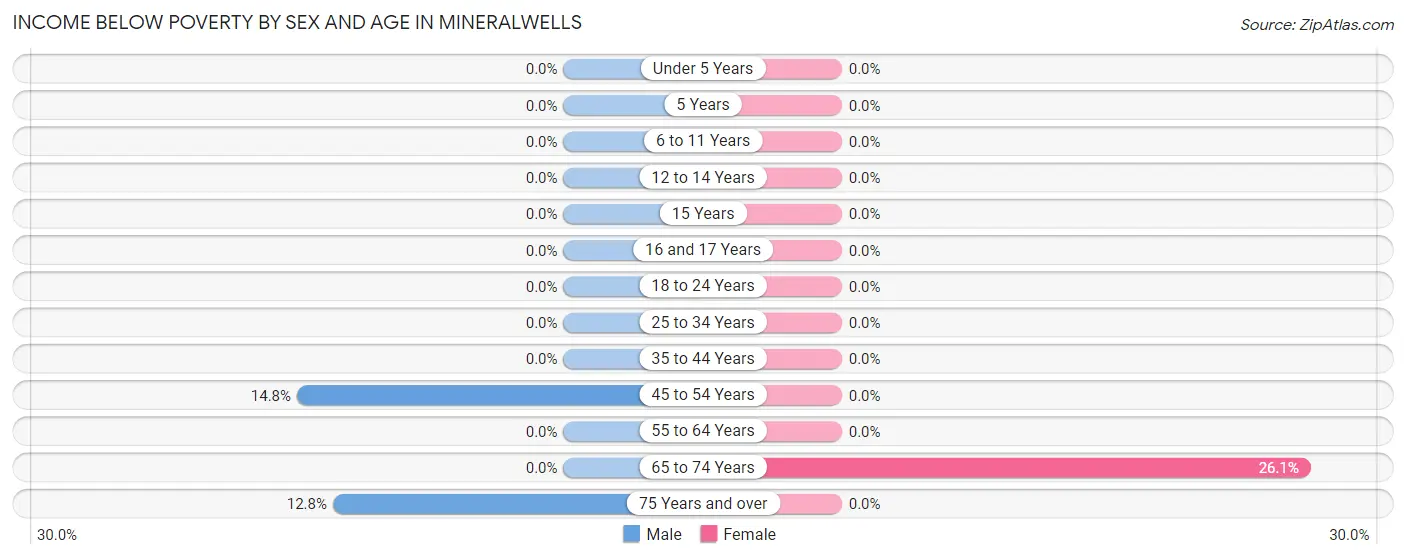
| Age Bracket | Male | Female |
| Under 5 Years | 0 (0.0%) | 0 (0.0%) |
| 5 Years | 0 (0.0%) | 0 (0.0%) |
| 6 to 11 Years | 0 (0.0%) | 0 (0.0%) |
| 12 to 14 Years | 0 (0.0%) | 0 (0.0%) |
| 15 Years | 0 (0.0%) | 0 (0.0%) |
| 16 and 17 Years | 0 (0.0%) | 0 (0.0%) |
| 18 to 24 Years | 0 (0.0%) | 0 (0.0%) |
| 25 to 34 Years | 0 (0.0%) | 0 (0.0%) |
| 35 to 44 Years | 0 (0.0%) | 0 (0.0%) |
| 45 to 54 Years | 19 (14.8%) | 0 (0.0%) |
| 55 to 64 Years | 0 (0.0%) | 0 (0.0%) |
| 65 to 74 Years | 0 (0.0%) | 47 (26.1%) |
| 75 Years and over | 14 (12.8%) | 0 (0.0%) |
| Total | 33 (2.6%) | 47 (3.8%) |
Income Above Poverty by Sex and Age in Mineralwells
According to the poverty statistics in Mineralwells, males aged under 5 years and females aged under 5 years are the age groups that are most secure financially, with 100.0% of males and 100.0% of females in these age groups living above the poverty line.
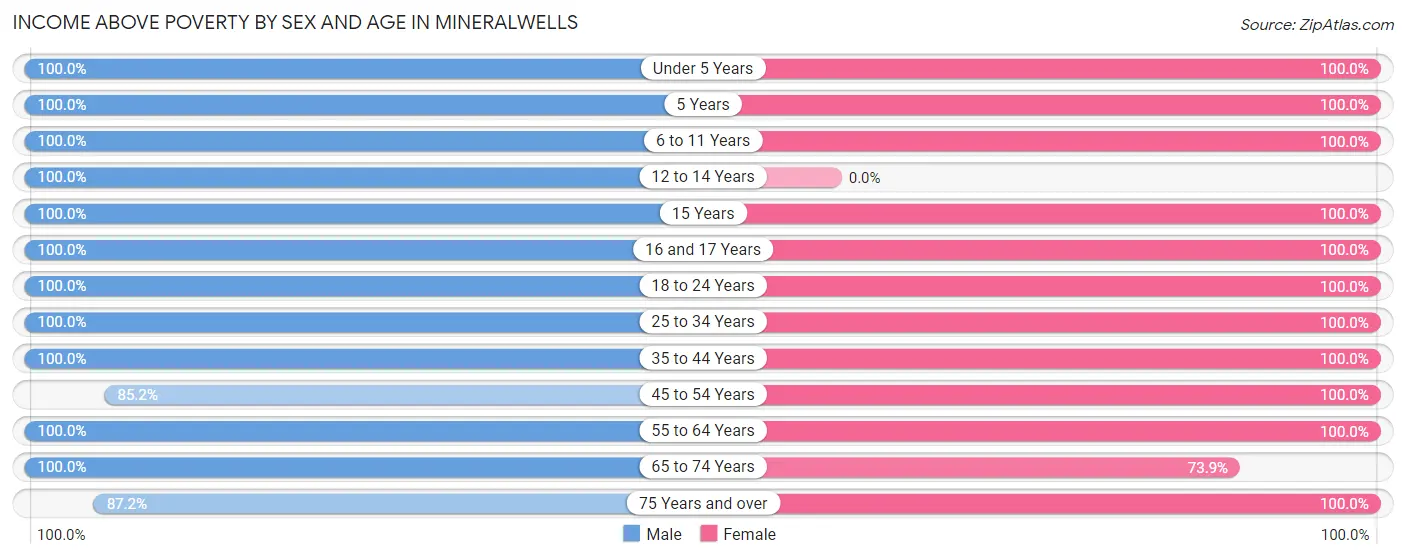
| Age Bracket | Male | Female |
| Under 5 Years | 138 (100.0%) | 80 (100.0%) |
| 5 Years | 45 (100.0%) | 64 (100.0%) |
| 6 to 11 Years | 105 (100.0%) | 155 (100.0%) |
| 12 to 14 Years | 41 (100.0%) | 0 (0.0%) |
| 15 Years | 13 (100.0%) | 67 (100.0%) |
| 16 and 17 Years | 148 (100.0%) | 25 (100.0%) |
| 18 to 24 Years | 53 (100.0%) | 27 (100.0%) |
| 25 to 34 Years | 155 (100.0%) | 185 (100.0%) |
| 35 to 44 Years | 176 (100.0%) | 250 (100.0%) |
| 45 to 54 Years | 109 (85.2%) | 56 (100.0%) |
| 55 to 64 Years | 114 (100.0%) | 98 (100.0%) |
| 65 to 74 Years | 53 (100.0%) | 133 (73.9%) |
| 75 Years and over | 95 (87.2%) | 55 (100.0%) |
| Total | 1,245 (97.4%) | 1,195 (96.2%) |
Income Below Poverty Among Married-Couple Families in Mineralwells
The poverty statistics for married-couple families in Mineralwells show that 2.7% or 14 of the total 524 families live below the poverty line. Families with no children have the highest poverty rate of 9.7%, comprising of 14 families. On the other hand, families with 1 or 2 children have the lowest poverty rate of 0.0%, which includes 0 families.
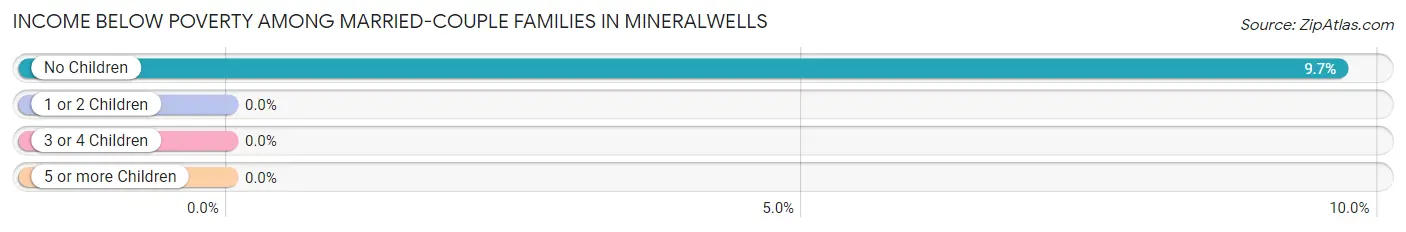
| Children | Above Poverty | Below Poverty |
| No Children | 131 (90.3%) | 14 (9.7%) |
| 1 or 2 Children | 287 (100.0%) | 0 (0.0%) |
| 3 or 4 Children | 69 (100.0%) | 0 (0.0%) |
| 5 or more Children | 23 (100.0%) | 0 (0.0%) |
| Total | 510 (97.3%) | 14 (2.7%) |
Income Below Poverty Among Single-Parent Households in Mineralwells
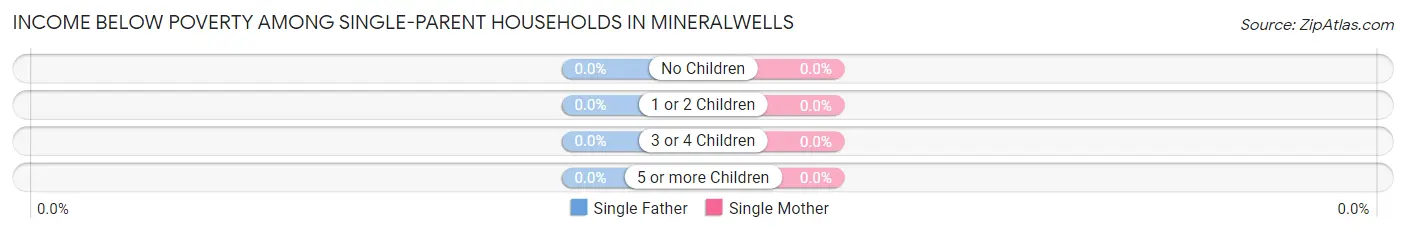
| Children | Single Father | Single Mother |
| No Children | 0 (0.0%) | 0 (0.0%) |
| 1 or 2 Children | 0 (0.0%) | 0 (0.0%) |
| 3 or 4 Children | 0 (0.0%) | 0 (0.0%) |
| 5 or more Children | 0 (0.0%) | 0 (0.0%) |
| Total | 0 (0.0%) | 0 (0.0%) |
Income Below Poverty Among Married-Couple vs Single-Parent Households in Mineralwells
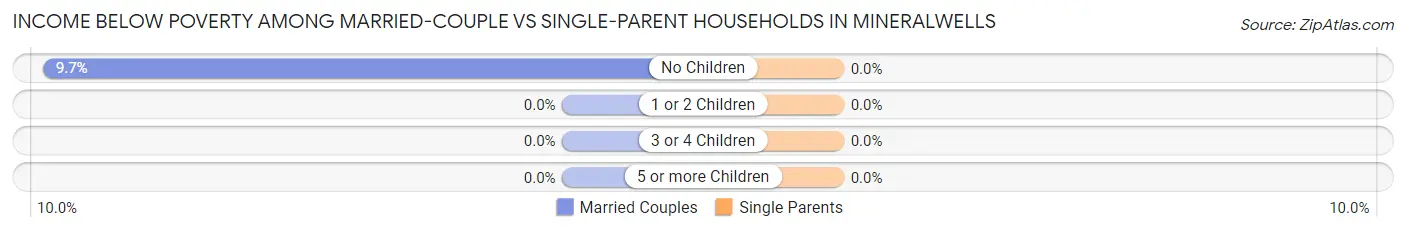
| Children | Married-Couple Families | Single-Parent Households |
| No Children | 14 (9.7%) | 0 (0.0%) |
| 1 or 2 Children | 0 (0.0%) | 0 (0.0%) |
| 3 or 4 Children | 0 (0.0%) | 0 (0.0%) |
| 5 or more Children | 0 (0.0%) | 0 (0.0%) |
| Total | 14 (2.7%) | 0 (0.0%) |
Race in Mineralwells
The most populous races in Mineralwells are White / Caucasian (2,503 | 98.2%), Native / Alaskan (22 | 0.9%), and Black / African American (13 | 0.5%).
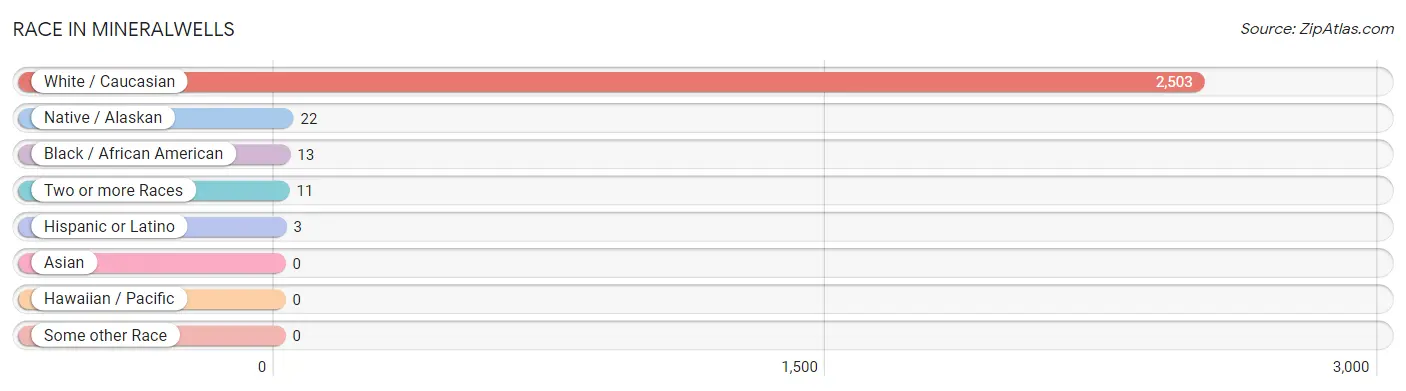
| Race | # Population | % Population |
| Asian | 0 | 0.0% |
| Black / African American | 13 | 0.5% |
| Hawaiian / Pacific | 0 | 0.0% |
| Hispanic or Latino | 3 | 0.1% |
| Native / Alaskan | 22 | 0.9% |
| White / Caucasian | 2,503 | 98.2% |
| Two or more Races | 11 | 0.4% |
| Some other Race | 0 | 0.0% |
| Total | 2,549 | 100.0% |
Ancestry in Mineralwells
The most populous ancestries reported in Mineralwells are Irish (364 | 14.3%), American (326 | 12.8%), German (204 | 8.0%), English (159 | 6.2%), and European (59 | 2.3%), together accounting for 43.6% of all Mineralwells residents.
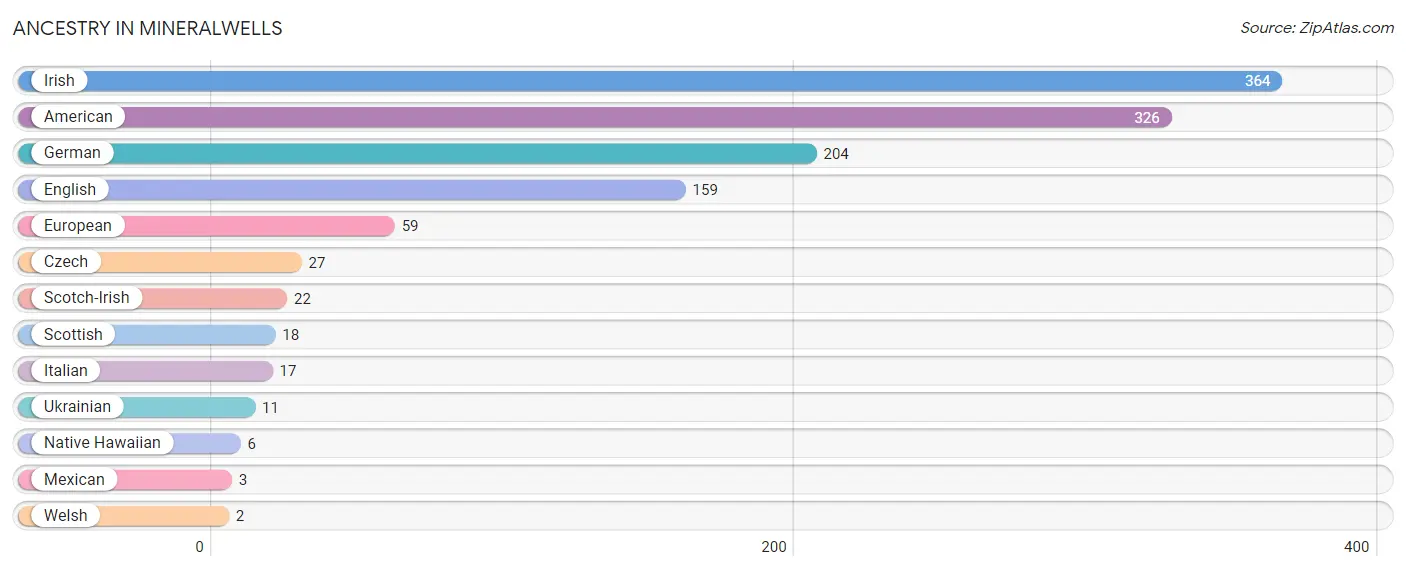
| Ancestry | # Population | % Population |
| American | 326 | 12.8% |
| Czech | 27 | 1.1% |
| English | 159 | 6.2% |
| European | 59 | 2.3% |
| German | 204 | 8.0% |
| Irish | 364 | 14.3% |
| Italian | 17 | 0.7% |
| Mexican | 3 | 0.1% |
| Native Hawaiian | 6 | 0.2% |
| Scotch-Irish | 22 | 0.9% |
| Scottish | 18 | 0.7% |
| Ukrainian | 11 | 0.4% |
| Welsh | 2 | 0.1% | View All 13 Rows |
Immigrants in Mineralwells

| Immigration Origin | # Population | % Population | View All 0 Rows |
Sex and Age in Mineralwells
Sex and Age in Mineralwells
The most populous age groups in Mineralwells are 15 to 19 Years (203 | 15.5%) for men and 40 to 44 Years (158 | 12.7%) for women.
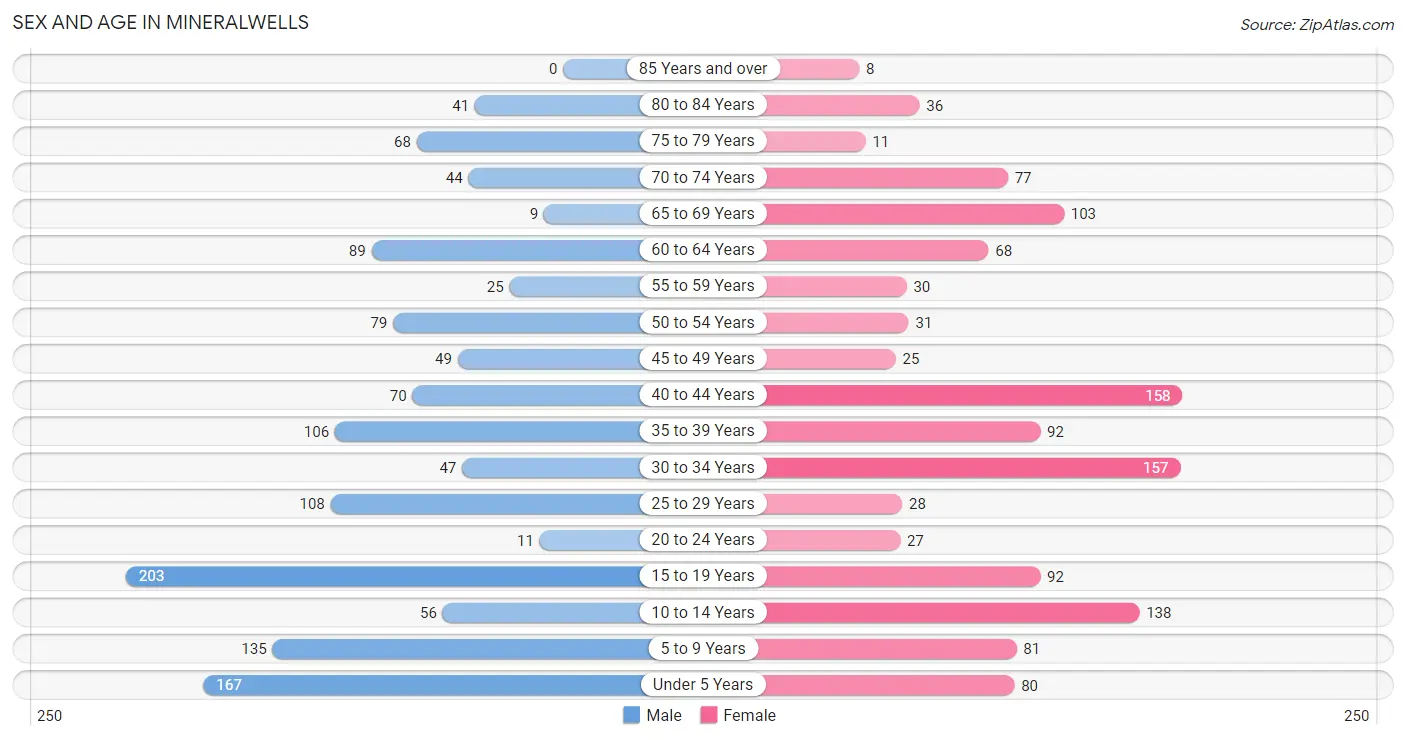
| Age Bracket | Male | Female |
| Under 5 Years | 167 (12.8%) | 80 (6.4%) |
| 5 to 9 Years | 135 (10.3%) | 81 (6.5%) |
| 10 to 14 Years | 56 (4.3%) | 138 (11.1%) |
| 15 to 19 Years | 203 (15.5%) | 92 (7.4%) |
| 20 to 24 Years | 11 (0.8%) | 27 (2.2%) |
| 25 to 29 Years | 108 (8.3%) | 28 (2.2%) |
| 30 to 34 Years | 47 (3.6%) | 157 (12.6%) |
| 35 to 39 Years | 106 (8.1%) | 92 (7.4%) |
| 40 to 44 Years | 70 (5.4%) | 158 (12.7%) |
| 45 to 49 Years | 49 (3.7%) | 25 (2.0%) |
| 50 to 54 Years | 79 (6.0%) | 31 (2.5%) |
| 55 to 59 Years | 25 (1.9%) | 30 (2.4%) |
| 60 to 64 Years | 89 (6.8%) | 68 (5.5%) |
| 65 to 69 Years | 9 (0.7%) | 103 (8.3%) |
| 70 to 74 Years | 44 (3.4%) | 77 (6.2%) |
| 75 to 79 Years | 68 (5.2%) | 11 (0.9%) |
| 80 to 84 Years | 41 (3.1%) | 36 (2.9%) |
| 85 Years and over | 0 (0.0%) | 8 (0.6%) |
| Total | 1,307 (100.0%) | 1,242 (100.0%) |
Families and Households in Mineralwells
Median Family Size in Mineralwells
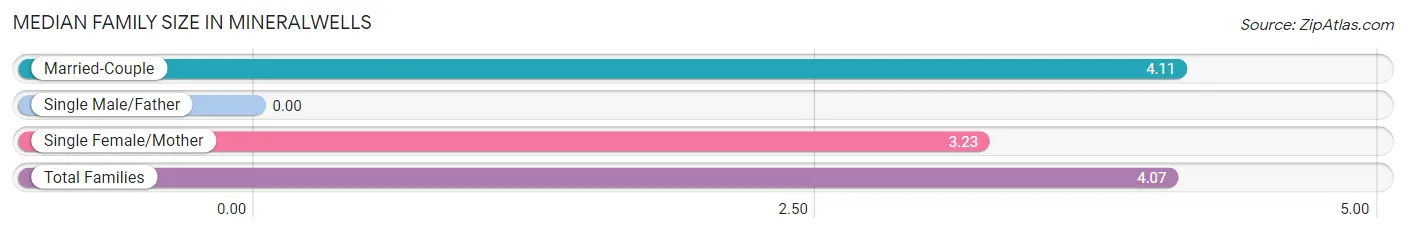
| Family Type | # Families | Family Size |
| Married-Couple | 524 (95.3%) | 4.11 |
| Single Male/Father | 0 (0.0%) | - |
| Single Female/Mother | 26 (4.7%) | 3.23 |
| Total Families | 550 (100.0%) | 4.07 |
Median Household Size in Mineralwells
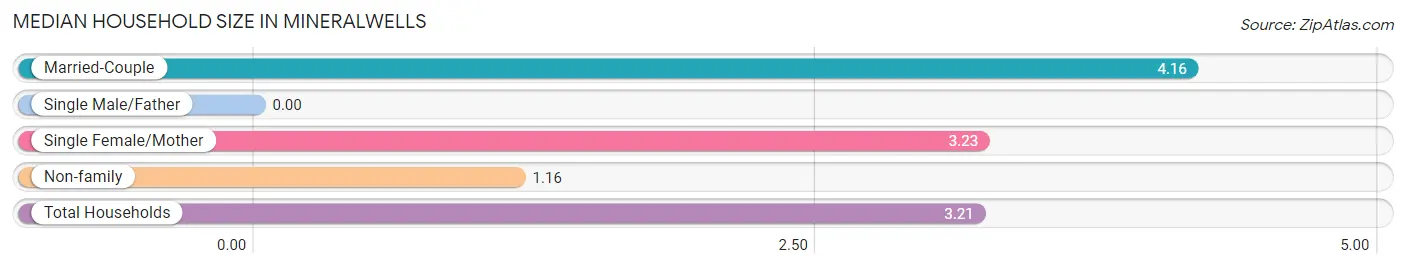
| Household Type | # Households | Household Size |
| Married-Couple | 524 (65.9%) | 4.16 |
| Single Male/Father | 0 (0.0%) | - |
| Single Female/Mother | 26 (3.3%) | 3.23 |
| Non-family | 245 (30.8%) | 1.16 |
| Total Households | 795 (100.0%) | 3.21 |
Household Size by Marriage Status in Mineralwells
Out of a total of 795 households in Mineralwells, 550 (69.2%) are family households, while 245 (30.8%) are nonfamily households. The most numerous type of family households are 4-person households, comprising 241, and the most common type of nonfamily households are 1-person households, comprising 214.
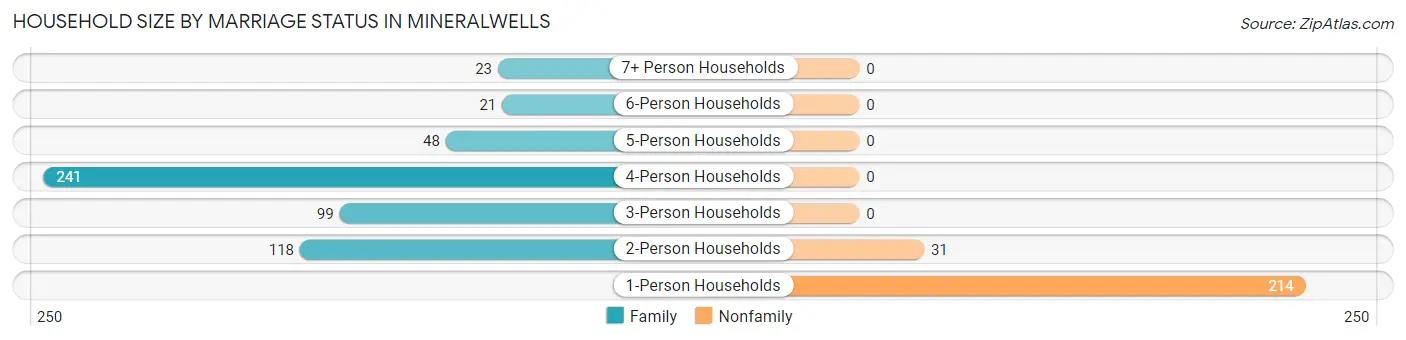
| Household Size | Family Households | Nonfamily Households |
| 1-Person Households | - | 214 (26.9%) |
| 2-Person Households | 118 (14.8%) | 31 (3.9%) |
| 3-Person Households | 99 (12.4%) | 0 (0.0%) |
| 4-Person Households | 241 (30.3%) | 0 (0.0%) |
| 5-Person Households | 48 (6.0%) | 0 (0.0%) |
| 6-Person Households | 21 (2.6%) | 0 (0.0%) |
| 7+ Person Households | 23 (2.9%) | 0 (0.0%) |
| Total | 550 (69.2%) | 245 (30.8%) |
Female Fertility in Mineralwells
Fertility by Age in Mineralwells
Average fertility rate in Mineralwells is 64.0 births per 1,000 women. Women in the age bracket of 20 to 34 years have the highest fertility rate with 118.0 births per 1,000 women. Women in the age bracket of 20 to 34 years acount for 65.8% of all women with births.
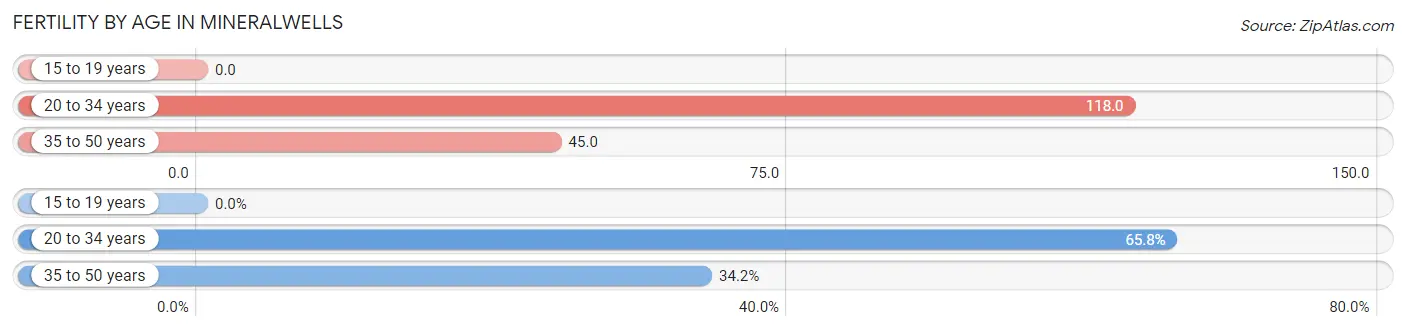
| Age Bracket | Women with Births | Births / 1,000 Women |
| 15 to 19 years | 0 (0.0%) | 0.0 |
| 20 to 34 years | 25 (65.8%) | 118.0 |
| 35 to 50 years | 13 (34.2%) | 45.0 |
| Total | 38 (100.0%) | 64.0 |
Fertility by Age by Marriage Status in Mineralwells
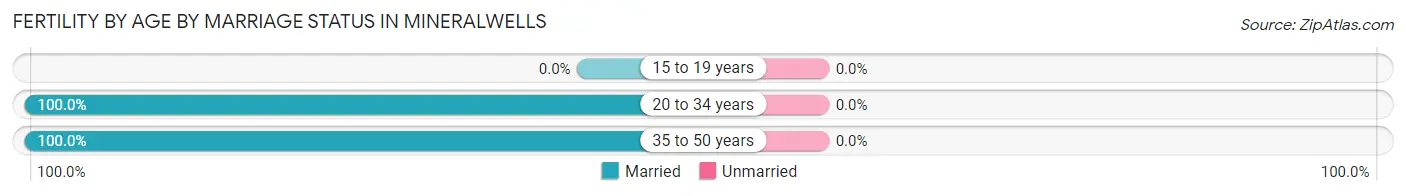
| Age Bracket | Married | Unmarried |
| 15 to 19 years | 0 (0.0%) | 0 (0.0%) |
| 20 to 34 years | 25 (100.0%) | 0 (0.0%) |
| 35 to 50 years | 13 (100.0%) | 0 (0.0%) |
| Total | 38 (100.0%) | 0 (0.0%) |
Fertility by Education in Mineralwells
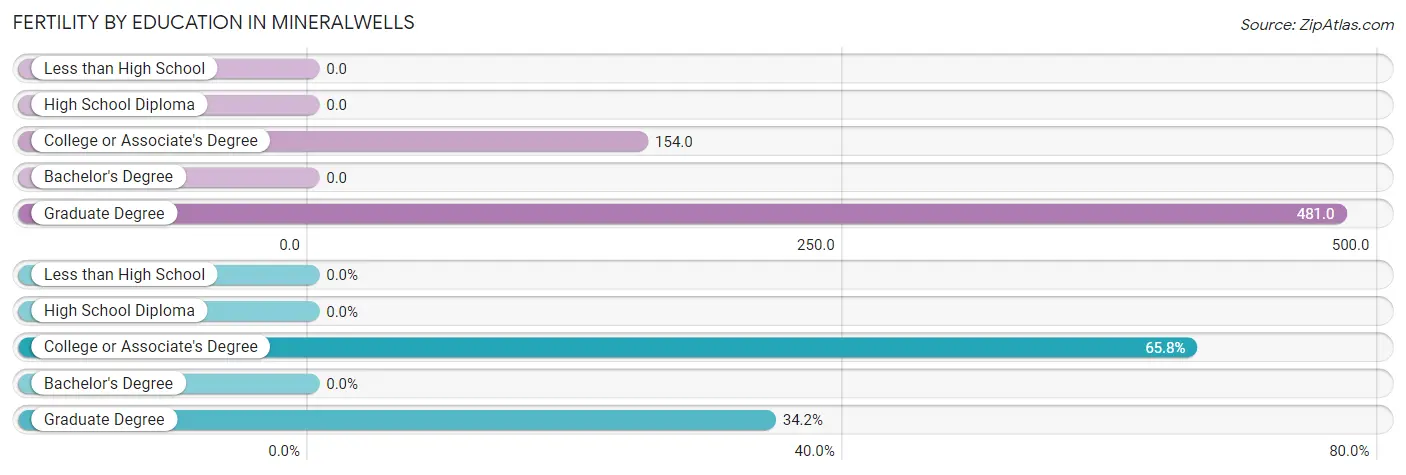
| Educational Attainment | Women with Births | Births / 1,000 Women |
| Less than High School | 0 (0.0%) | 0.0 |
| High School Diploma | 0 (0.0%) | 0.0 |
| College or Associate's Degree | 25 (65.8%) | 154.0 |
| Bachelor's Degree | 0 (0.0%) | 0.0 |
| Graduate Degree | 13 (34.2%) | 481.0 |
| Total | 38 (100.0%) | 64.0 |
Fertility by Education by Marriage Status in Mineralwells
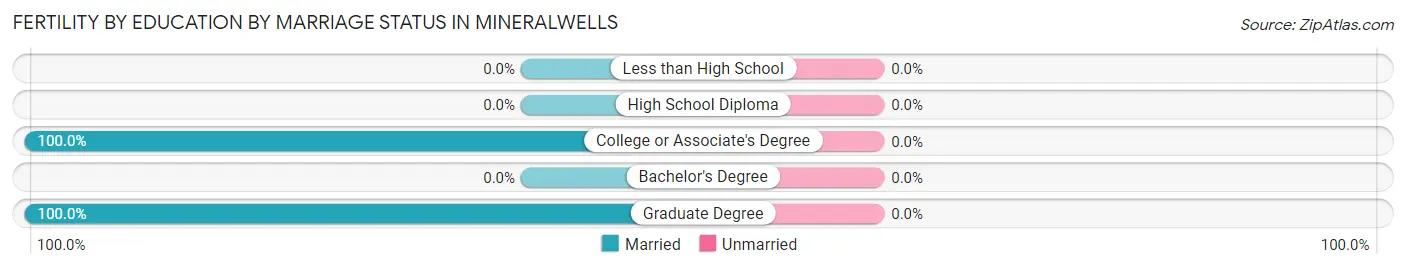
| Educational Attainment | Married | Unmarried |
| Less than High School | 0 (0.0%) | 0 (0.0%) |
| High School Diploma | 0 (0.0%) | 0 (0.0%) |
| College or Associate's Degree | 25 (100.0%) | 0 (0.0%) |
| Bachelor's Degree | 0 (0.0%) | 0 (0.0%) |
| Graduate Degree | 13 (100.0%) | 0 (0.0%) |
| Total | 38 (100.0%) | 0 (0.0%) |
Employment Characteristics in Mineralwells
Employment by Class of Employer in Mineralwells
Among the 924 employed individuals in Mineralwells, private company employees (702 | 76.0%), local government employees (95 | 10.3%), and not-for-profit organizations (68 | 7.4%) make up the most common classes of employment.
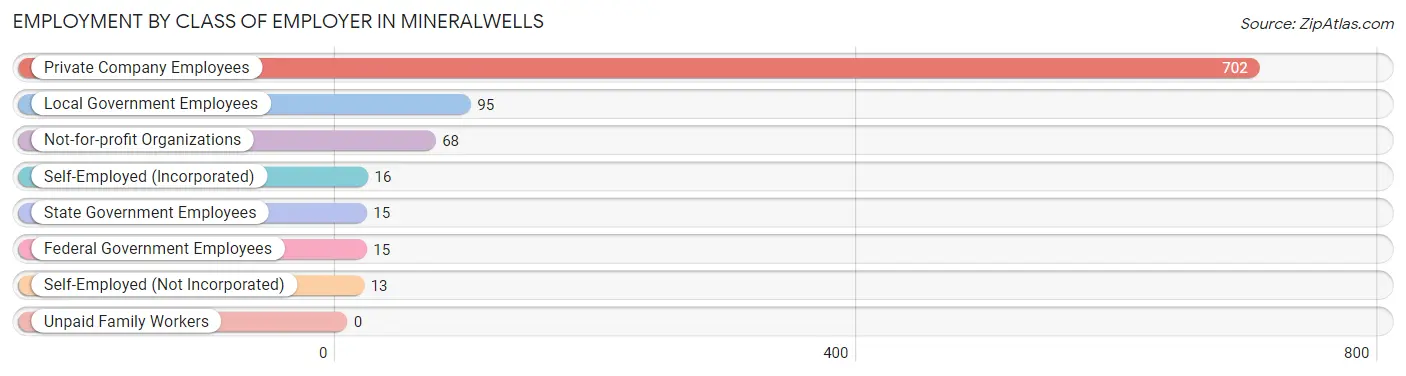
| Employer Class | # Employees | % Employees |
| Private Company Employees | 702 | 76.0% |
| Self-Employed (Incorporated) | 16 | 1.7% |
| Self-Employed (Not Incorporated) | 13 | 1.4% |
| Not-for-profit Organizations | 68 | 7.4% |
| Local Government Employees | 95 | 10.3% |
| State Government Employees | 15 | 1.6% |
| Federal Government Employees | 15 | 1.6% |
| Unpaid Family Workers | 0 | 0.0% |
| Total | 924 | 100.0% |
Employment Status by Age in Mineralwells
According to the labor force statistics for Mineralwells, out of the total population over 16 years of age (1,812), 52.2% or 946 individuals are in the labor force, with 1.0% or 9 of them unemployed. The age group with the highest labor force participation rate is 20 to 24 years, with 100.0% or 38 individuals in the labor force. Within the labor force, the 65 to 74 years age range has the highest percentage of unemployed individuals, with 33.3% or 9 of them being unemployed.
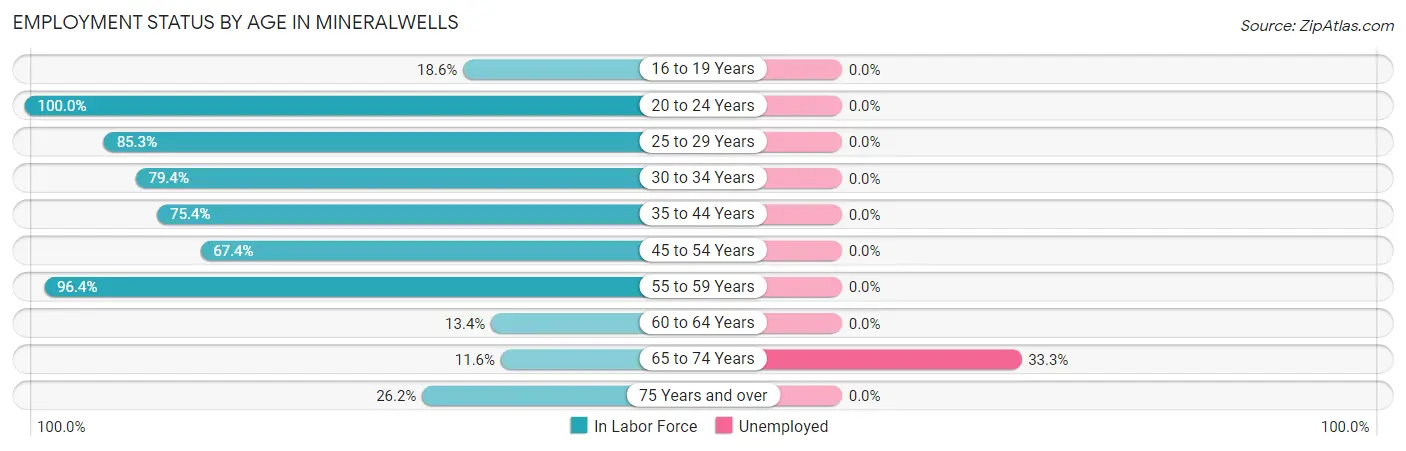
| Age Bracket | In Labor Force | Unemployed |
| 16 to 19 Years | 40 (18.6%) | 0 (0.0%) |
| 20 to 24 Years | 38 (100.0%) | 0 (0.0%) |
| 25 to 29 Years | 116 (85.3%) | 0 (0.0%) |
| 30 to 34 Years | 162 (79.4%) | 0 (0.0%) |
| 35 to 44 Years | 321 (75.4%) | 0 (0.0%) |
| 45 to 54 Years | 124 (67.4%) | 0 (0.0%) |
| 55 to 59 Years | 53 (96.4%) | 0 (0.0%) |
| 60 to 64 Years | 21 (13.4%) | 0 (0.0%) |
| 65 to 74 Years | 27 (11.6%) | 9 (33.3%) |
| 75 Years and over | 43 (26.2%) | 0 (0.0%) |
| Total | 946 (52.2%) | 9 (1.0%) |
Employment Status by Educational Attainment in Mineralwells
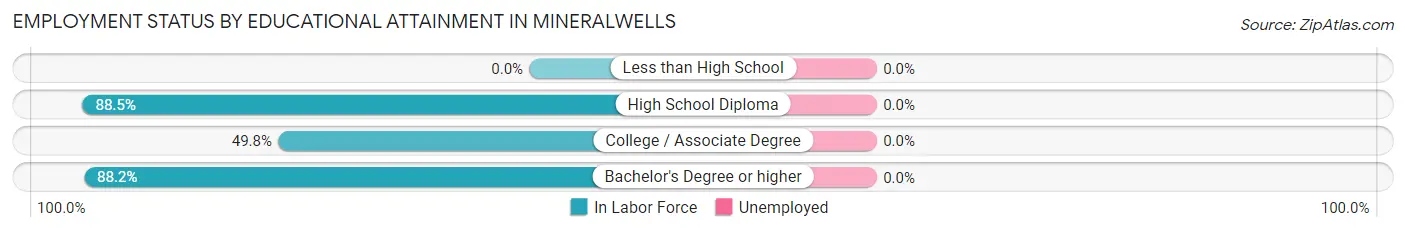
| Educational Attainment | In Labor Force | Unemployed |
| Less than High School | 0 (0.0%) | 0 (0.0%) |
| High School Diploma | 338 (88.5%) | 0 (0.0%) |
| College / Associate Degree | 235 (49.8%) | 0 (0.0%) |
| Bachelor's Degree or higher | 224 (88.2%) | 0 (0.0%) |
| Total | 797 (68.6%) | 0 (0.0%) |
Employment Occupations by Sex in Mineralwells
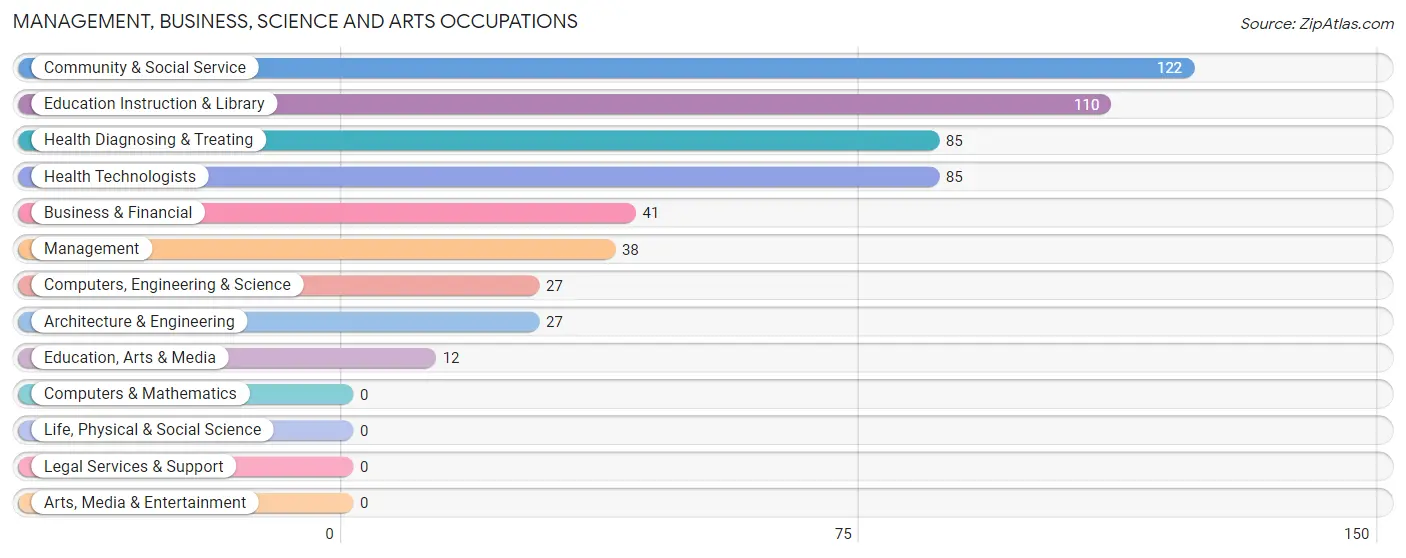
Management, Business, Science and Arts Occupations
The most common Management, Business, Science and Arts occupations in Mineralwells are Community & Social Service (122 | 13.0%), Education Instruction & Library (110 | 11.7%), Health Diagnosing & Treating (85 | 9.1%), Health Technologists (85 | 9.1%), and Business & Financial (41 | 4.4%).
Management, Business, Science and Arts Occupations by Sex
Within the Management, Business, Science and Arts occupations in Mineralwells, the most male-oriented occupations are Management (100.0%), Education, Arts & Media (100.0%), and Computers, Engineering & Science (51.8%), while the most female-oriented occupations are Health Diagnosing & Treating (71.8%), Health Technologists (71.8%), and Education Instruction & Library (68.2%).
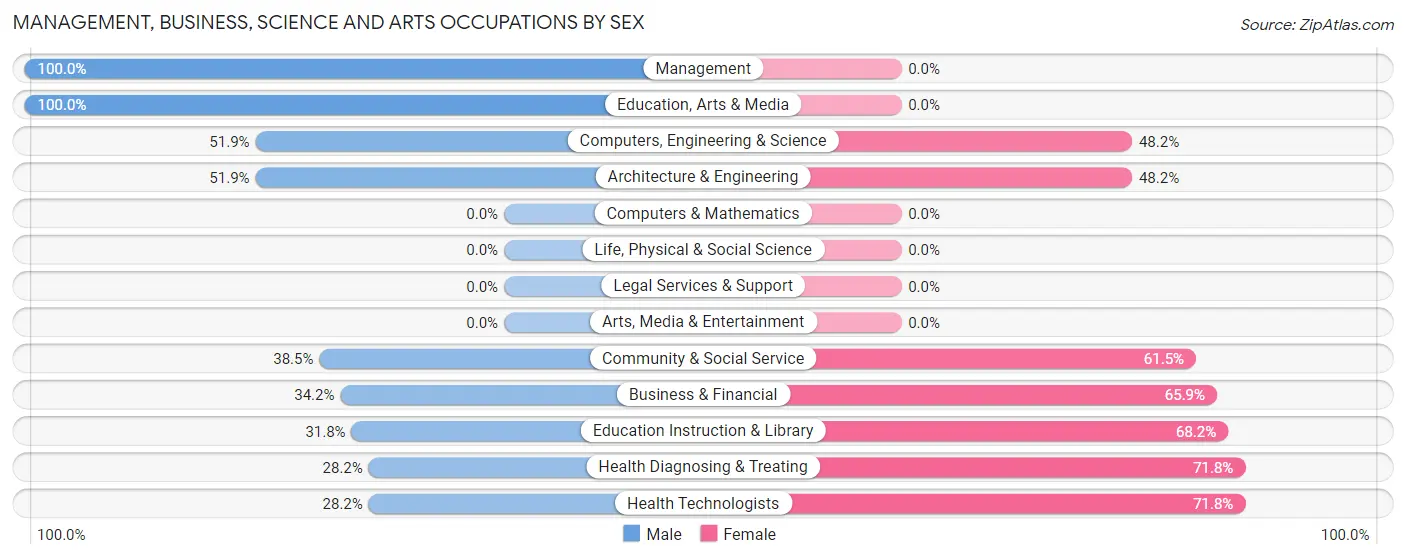
| Occupation | Male | Female |
| Management | 38 (100.0%) | 0 (0.0%) |
| Business & Financial | 14 (34.2%) | 27 (65.8%) |
| Computers, Engineering & Science | 14 (51.8%) | 13 (48.1%) |
| Computers & Mathematics | 0 (0.0%) | 0 (0.0%) |
| Architecture & Engineering | 14 (51.8%) | 13 (48.1%) |
| Life, Physical & Social Science | 0 (0.0%) | 0 (0.0%) |
| Community & Social Service | 47 (38.5%) | 75 (61.5%) |
| Education, Arts & Media | 12 (100.0%) | 0 (0.0%) |
| Legal Services & Support | 0 (0.0%) | 0 (0.0%) |
| Education Instruction & Library | 35 (31.8%) | 75 (68.2%) |
| Arts, Media & Entertainment | 0 (0.0%) | 0 (0.0%) |
| Health Diagnosing & Treating | 24 (28.2%) | 61 (71.8%) |
| Health Technologists | 24 (28.2%) | 61 (71.8%) |
| Total (Category) | 137 (43.8%) | 176 (56.2%) |
| Total (Overall) | 488 (52.1%) | 448 (47.9%) |
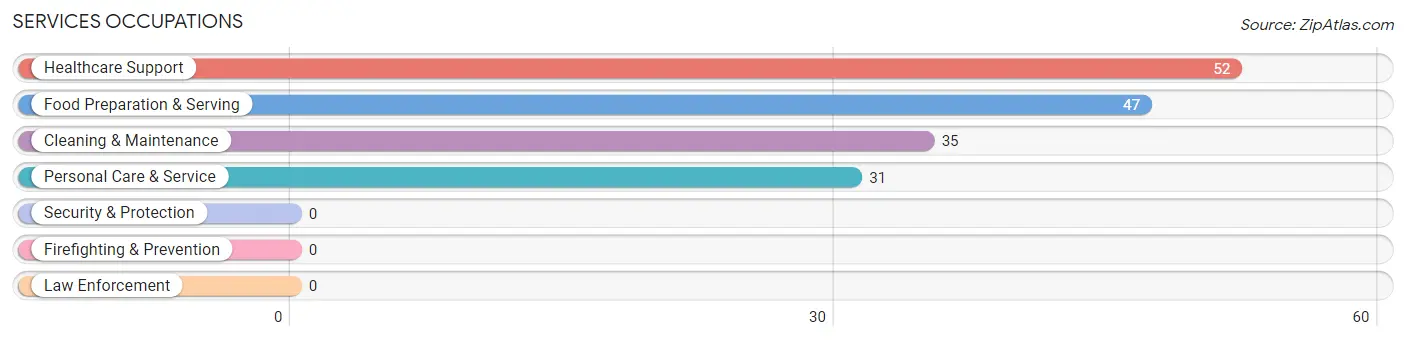
Services Occupations
The most common Services occupations in Mineralwells are Healthcare Support (52 | 5.6%), Food Preparation & Serving (47 | 5.0%), Cleaning & Maintenance (35 | 3.7%), and Personal Care & Service (31 | 3.3%).
Services Occupations by Sex
Within the Services occupations in Mineralwells, the most male-oriented occupations are Food Preparation & Serving (100.0%), and Cleaning & Maintenance (100.0%), while the most female-oriented occupations are Healthcare Support (100.0%), and Personal Care & Service (100.0%).
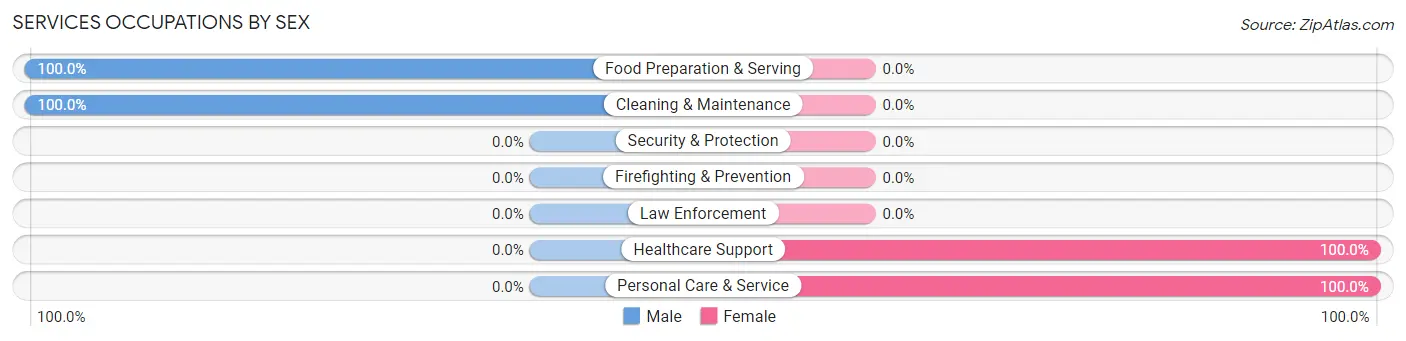
| Occupation | Male | Female |
| Healthcare Support | 0 (0.0%) | 52 (100.0%) |
| Security & Protection | 0 (0.0%) | 0 (0.0%) |
| Firefighting & Prevention | 0 (0.0%) | 0 (0.0%) |
| Law Enforcement | 0 (0.0%) | 0 (0.0%) |
| Food Preparation & Serving | 47 (100.0%) | 0 (0.0%) |
| Cleaning & Maintenance | 35 (100.0%) | 0 (0.0%) |
| Personal Care & Service | 0 (0.0%) | 31 (100.0%) |
| Total (Category) | 82 (49.7%) | 83 (50.3%) |
| Total (Overall) | 488 (52.1%) | 448 (47.9%) |
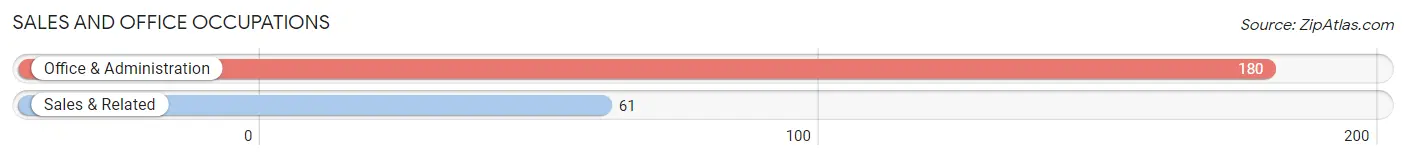
Sales and Office Occupations
The most common Sales and Office occupations in Mineralwells are Office & Administration (180 | 19.2%), and Sales & Related (61 | 6.5%).
Sales and Office Occupations by Sex

| Occupation | Male | Female |
| Sales & Related | 61 (100.0%) | 0 (0.0%) |
| Office & Administration | 15 (8.3%) | 165 (91.7%) |
| Total (Category) | 76 (31.5%) | 165 (68.5%) |
| Total (Overall) | 488 (52.1%) | 448 (47.9%) |
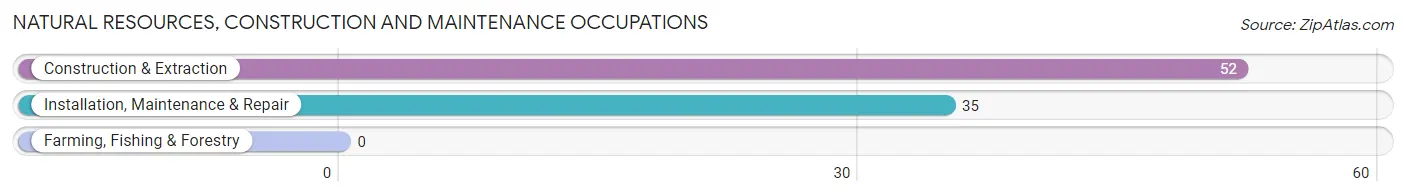
Natural Resources, Construction and Maintenance Occupations
The most common Natural Resources, Construction and Maintenance occupations in Mineralwells are Construction & Extraction (52 | 5.6%), and Installation, Maintenance & Repair (35 | 3.7%).
Natural Resources, Construction and Maintenance Occupations by Sex
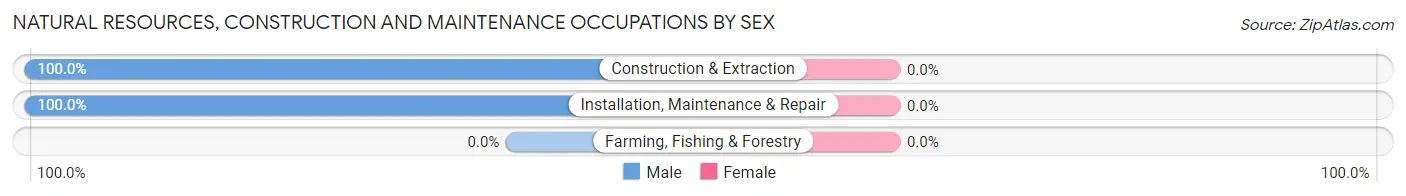
| Occupation | Male | Female |
| Farming, Fishing & Forestry | 0 (0.0%) | 0 (0.0%) |
| Construction & Extraction | 52 (100.0%) | 0 (0.0%) |
| Installation, Maintenance & Repair | 35 (100.0%) | 0 (0.0%) |
| Total (Category) | 87 (100.0%) | 0 (0.0%) |
| Total (Overall) | 488 (52.1%) | 448 (47.9%) |
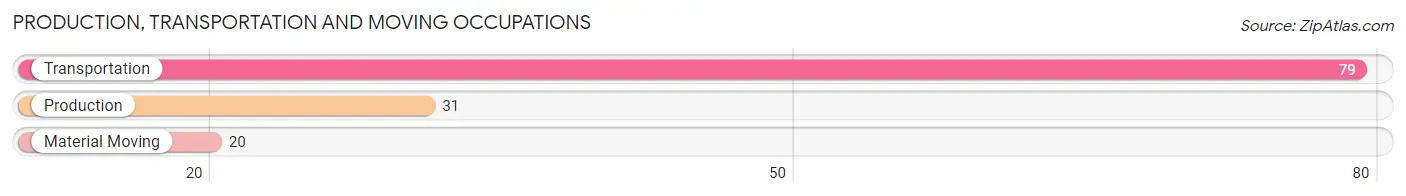
Production, Transportation and Moving Occupations
The most common Production, Transportation and Moving occupations in Mineralwells are Transportation (79 | 8.4%), Production (31 | 3.3%), and Material Moving (20 | 2.1%).
Production, Transportation and Moving Occupations by Sex
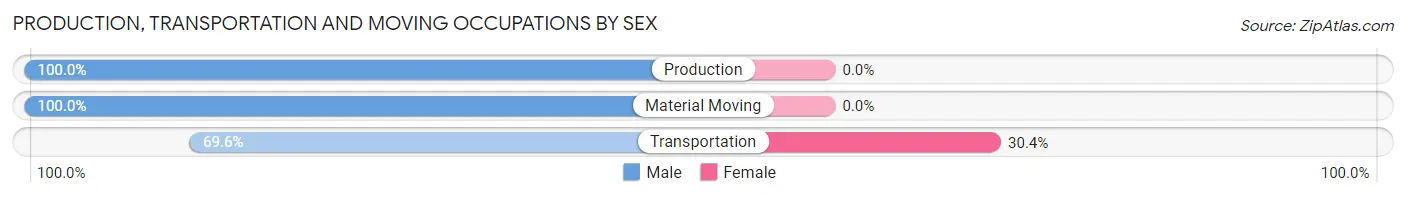
| Occupation | Male | Female |
| Production | 31 (100.0%) | 0 (0.0%) |
| Transportation | 55 (69.6%) | 24 (30.4%) |
| Material Moving | 20 (100.0%) | 0 (0.0%) |
| Total (Category) | 106 (81.5%) | 24 (18.5%) |
| Total (Overall) | 488 (52.1%) | 448 (47.9%) |
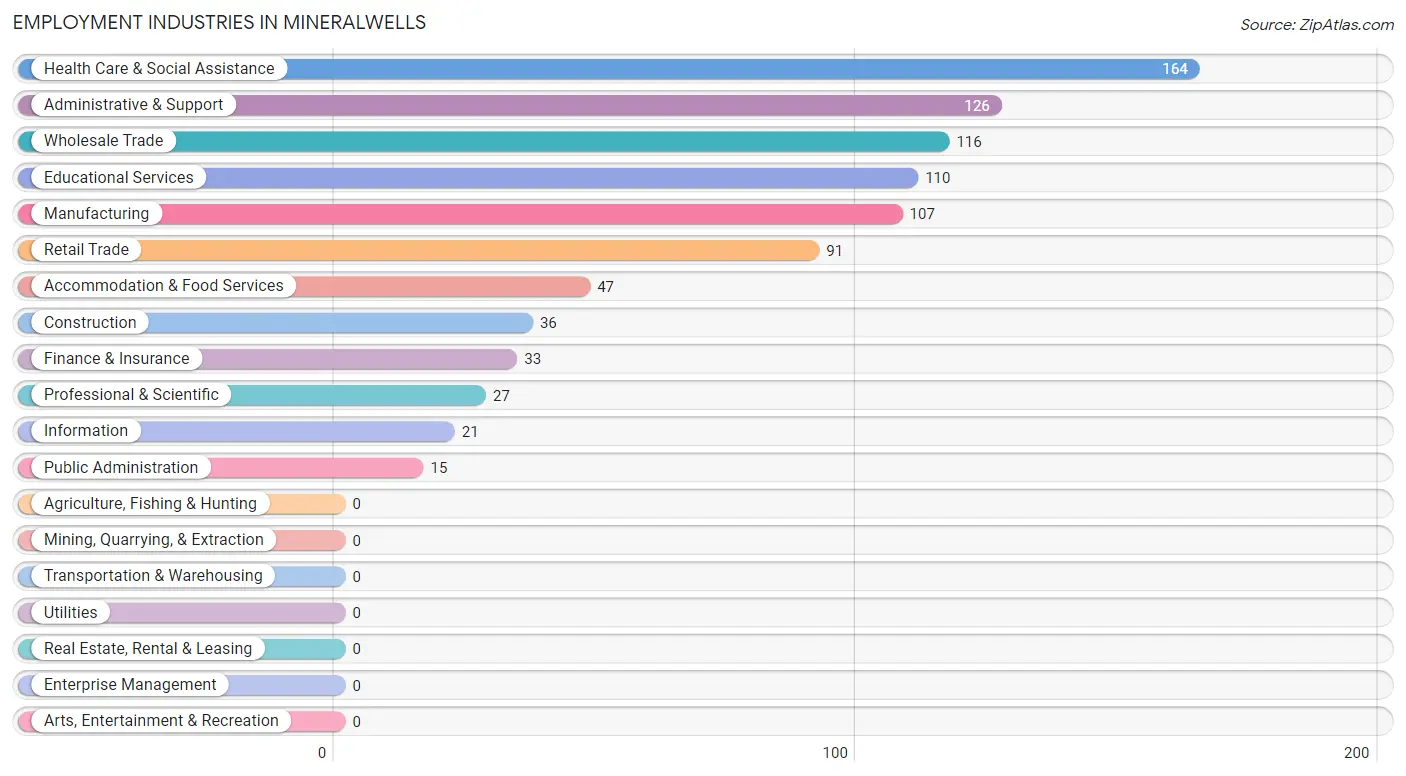
Employment Industries by Sex in Mineralwells
Employment Industries in Mineralwells
The major employment industries in Mineralwells include Health Care & Social Assistance (164 | 17.5%), Administrative & Support (126 | 13.5%), Wholesale Trade (116 | 12.4%), Educational Services (110 | 11.7%), and Manufacturing (107 | 11.4%).
Employment Industries by Sex in Mineralwells
The Mineralwells industries that see more men than women are Wholesale Trade (100.0%), Information (100.0%), and Professional & Scientific (100.0%), whereas the industries that tend to have a higher number of women are Finance & Insurance (100.0%), Public Administration (100.0%), and Health Care & Social Assistance (85.4%).
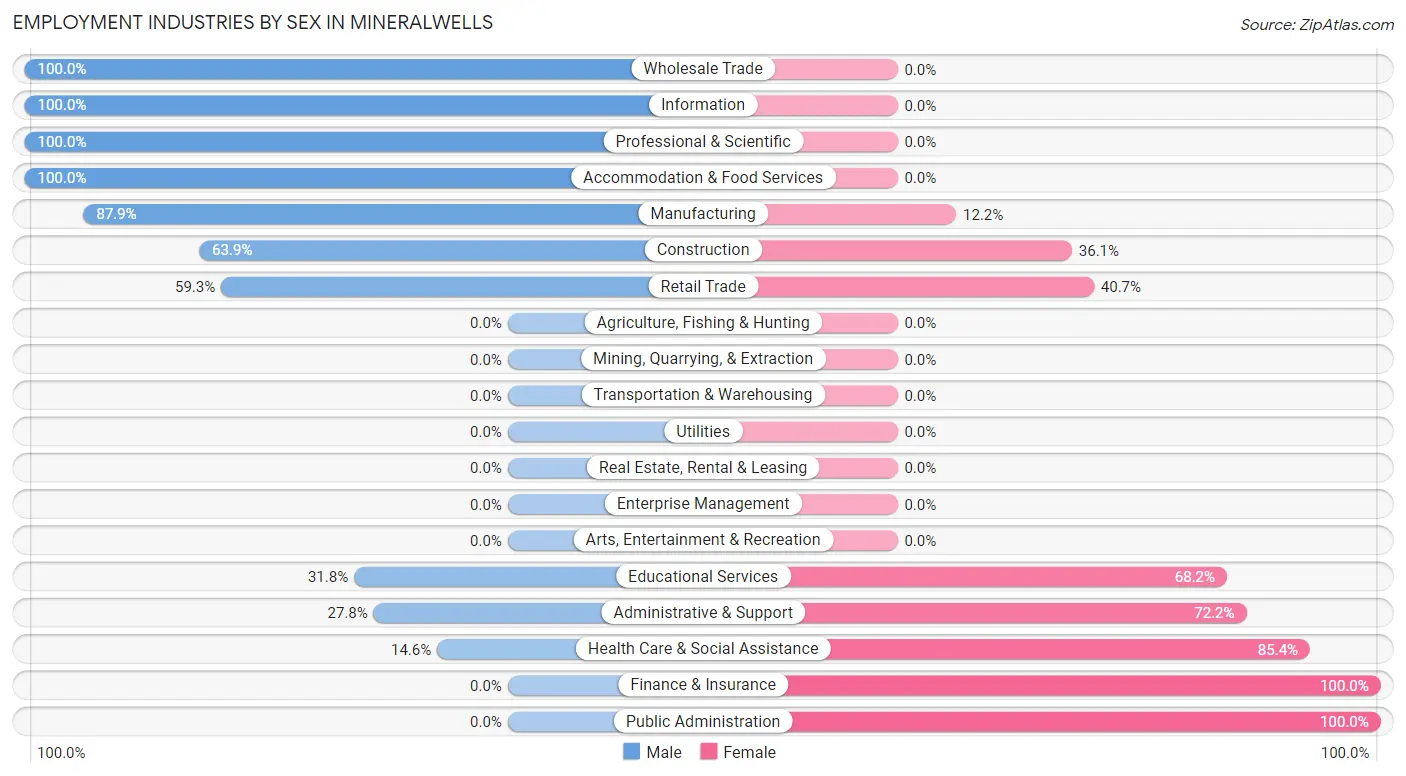
| Industry | Male | Female |
| Agriculture, Fishing & Hunting | 0 (0.0%) | 0 (0.0%) |
| Mining, Quarrying, & Extraction | 0 (0.0%) | 0 (0.0%) |
| Construction | 23 (63.9%) | 13 (36.1%) |
| Manufacturing | 94 (87.8%) | 13 (12.1%) |
| Wholesale Trade | 116 (100.0%) | 0 (0.0%) |
| Retail Trade | 54 (59.3%) | 37 (40.7%) |
| Transportation & Warehousing | 0 (0.0%) | 0 (0.0%) |
| Utilities | 0 (0.0%) | 0 (0.0%) |
| Information | 21 (100.0%) | 0 (0.0%) |
| Finance & Insurance | 0 (0.0%) | 33 (100.0%) |
| Real Estate, Rental & Leasing | 0 (0.0%) | 0 (0.0%) |
| Professional & Scientific | 27 (100.0%) | 0 (0.0%) |
| Enterprise Management | 0 (0.0%) | 0 (0.0%) |
| Administrative & Support | 35 (27.8%) | 91 (72.2%) |
| Educational Services | 35 (31.8%) | 75 (68.2%) |
| Health Care & Social Assistance | 24 (14.6%) | 140 (85.4%) |
| Arts, Entertainment & Recreation | 0 (0.0%) | 0 (0.0%) |
| Accommodation & Food Services | 47 (100.0%) | 0 (0.0%) |
| Public Administration | 0 (0.0%) | 15 (100.0%) |
| Total | 488 (52.1%) | 448 (47.9%) |
Education in Mineralwells
School Enrollment in Mineralwells
The most common levels of schooling among the 838 students in Mineralwells are high school (311 | 37.1%), middle school (150 | 17.9%), and nursery / preschool (138 | 16.5%).
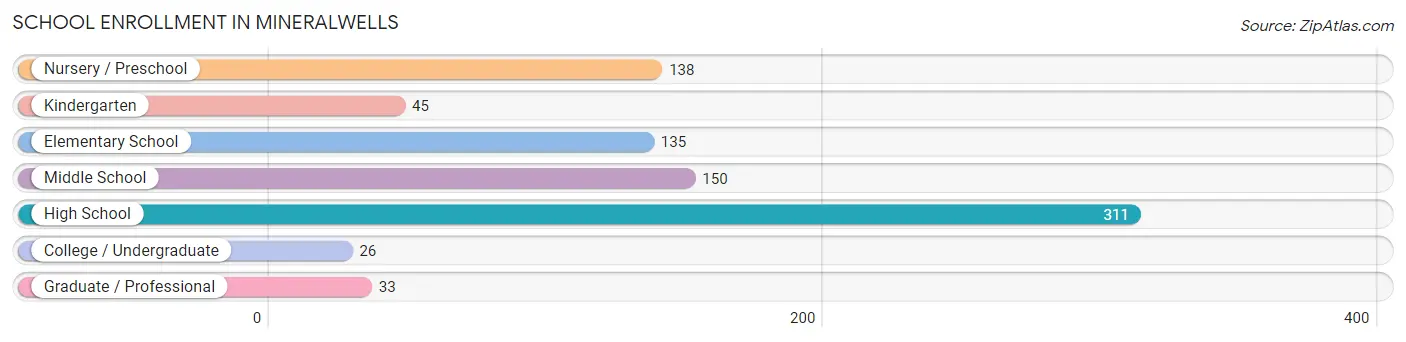
| School Level | # Students | % Students |
| Nursery / Preschool | 138 | 16.5% |
| Kindergarten | 45 | 5.4% |
| Elementary School | 135 | 16.1% |
| Middle School | 150 | 17.9% |
| High School | 311 | 37.1% |
| College / Undergraduate | 26 | 3.1% |
| Graduate / Professional | 33 | 3.9% |
| Total | 838 | 100.0% |
School Enrollment by Age by Funding Source in Mineralwells
Out of a total of 838 students who are enrolled in schools in Mineralwells, 128 (15.3%) attend a private institution, while the remaining 710 (84.7%) are enrolled in public schools. The age group of 5 to 9 year old has the highest likelihood of being enrolled in private schools, with 103 (47.7% in the age bracket) enrolled. Conversely, the age group of 10 to 14 year olds has the lowest likelihood of being enrolled in a private school, with 194 (100.0% in the age bracket) attending a public institution.
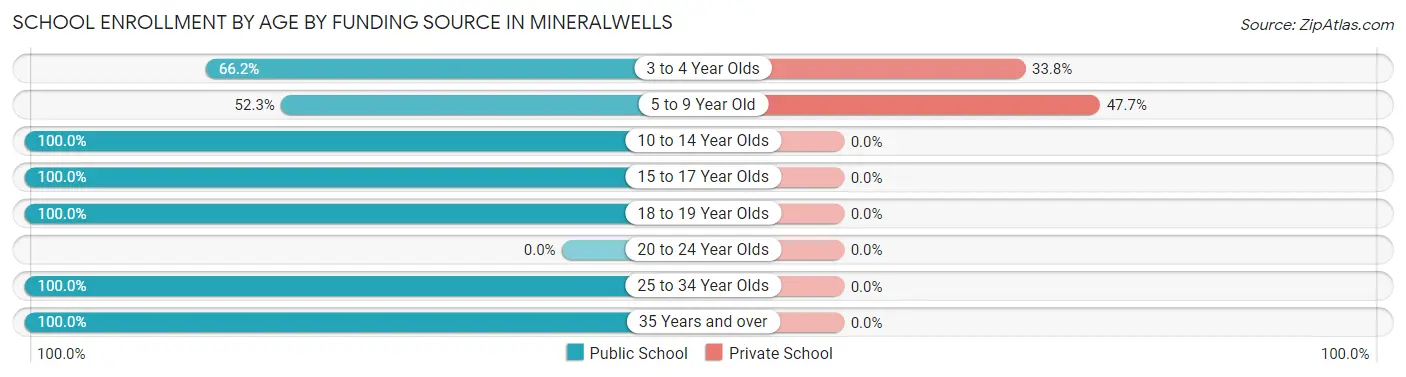
| Age Bracket | Public School | Private School |
| 3 to 4 Year Olds | 49 (66.2%) | 25 (33.8%) |
| 5 to 9 Year Old | 113 (52.3%) | 103 (47.7%) |
| 10 to 14 Year Olds | 194 (100.0%) | 0 (0.0%) |
| 15 to 17 Year Olds | 253 (100.0%) | 0 (0.0%) |
| 18 to 19 Year Olds | 42 (100.0%) | 0 (0.0%) |
| 20 to 24 Year Olds | 0 (0.0%) | 0 (0.0%) |
| 25 to 34 Year Olds | 33 (100.0%) | 0 (0.0%) |
| 35 Years and over | 26 (100.0%) | 0 (0.0%) |
| Total | 710 (84.7%) | 128 (15.3%) |
Educational Attainment by Field of Study in Mineralwells
Education (100 | 28.2%), bio, nature & agricultural (62 | 17.5%), business (54 | 15.2%), engineering (52 | 14.7%), and science & technology (50 | 14.1%) are the most common fields of study among 354 individuals in Mineralwells who have obtained a bachelor's degree or higher.
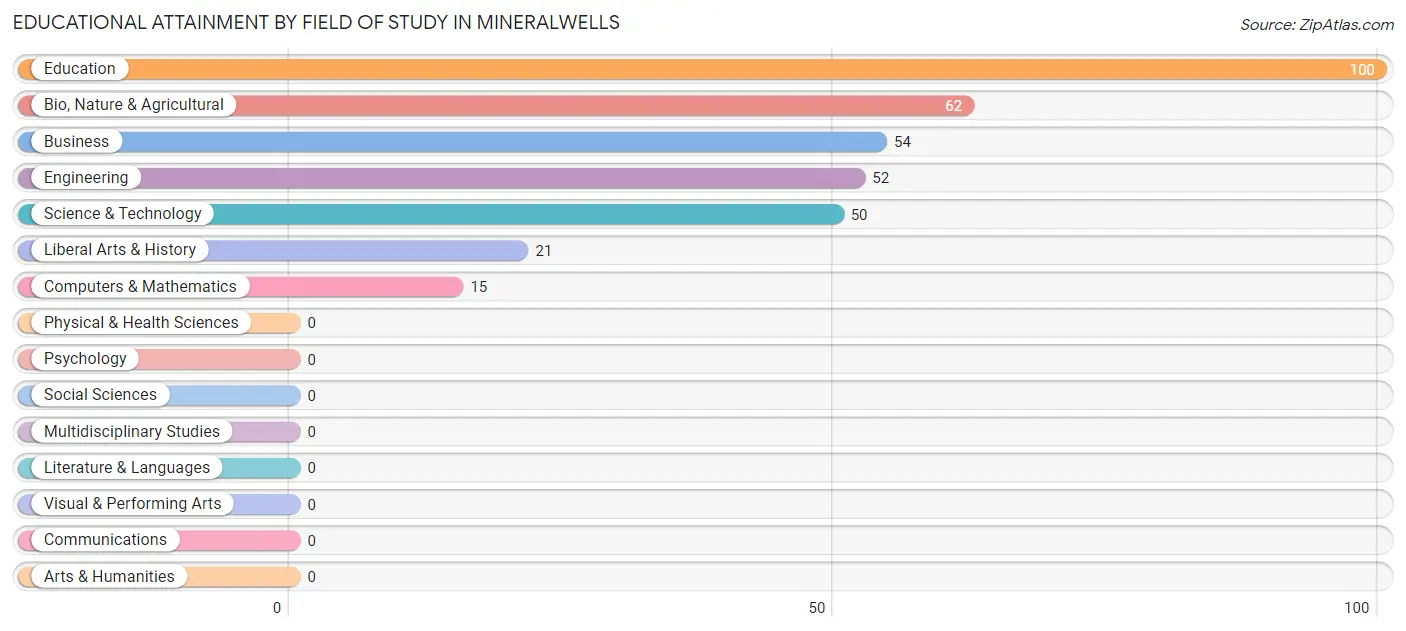
| Field of Study | # Graduates | % Graduates |
| Computers & Mathematics | 15 | 4.2% |
| Bio, Nature & Agricultural | 62 | 17.5% |
| Physical & Health Sciences | 0 | 0.0% |
| Psychology | 0 | 0.0% |
| Social Sciences | 0 | 0.0% |
| Engineering | 52 | 14.7% |
| Multidisciplinary Studies | 0 | 0.0% |
| Science & Technology | 50 | 14.1% |
| Business | 54 | 15.2% |
| Education | 100 | 28.2% |
| Literature & Languages | 0 | 0.0% |
| Liberal Arts & History | 21 | 5.9% |
| Visual & Performing Arts | 0 | 0.0% |
| Communications | 0 | 0.0% |
| Arts & Humanities | 0 | 0.0% |
| Total | 354 | 100.0% |
Transportation & Commute in Mineralwells
Vehicle Availability by Sex in Mineralwells
The most prevalent vehicle ownership categories in Mineralwells are males with 2 vehicles (233, accounting for 47.7%) and females with 2 vehicles (205, making up 53.4%).
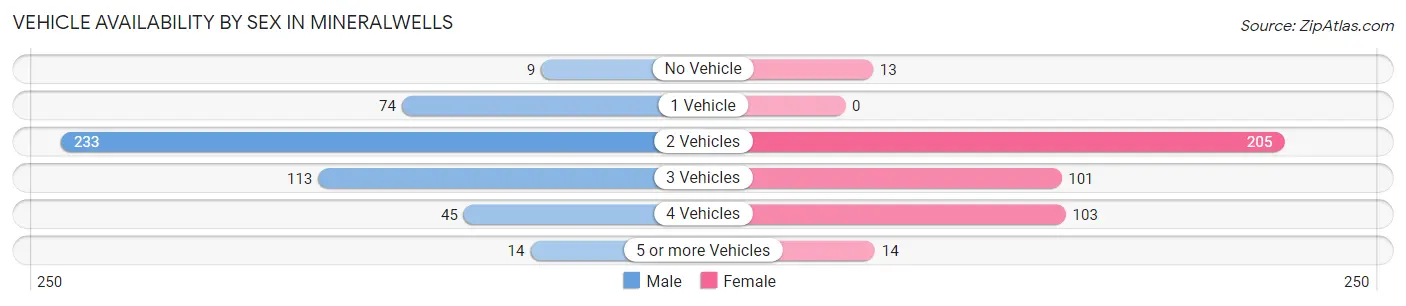
| Vehicles Available | Male | Female |
| No Vehicle | 9 (1.8%) | 13 (3.0%) |
| 1 Vehicle | 74 (15.2%) | 0 (0.0%) |
| 2 Vehicles | 233 (47.7%) | 205 (47.0%) |
| 3 Vehicles | 113 (23.2%) | 101 (23.2%) |
| 4 Vehicles | 45 (9.2%) | 103 (23.6%) |
| 5 or more Vehicles | 14 (2.9%) | 14 (3.2%) |
| Total | 488 (100.0%) | 436 (100.0%) |
Commute Time in Mineralwells
The most frequently occuring commute durations in Mineralwells are 20 to 24 minutes (180 commuters, 21.8%), 10 to 14 minutes (157 commuters, 19.0%), and 30 to 34 minutes (132 commuters, 16.0%).
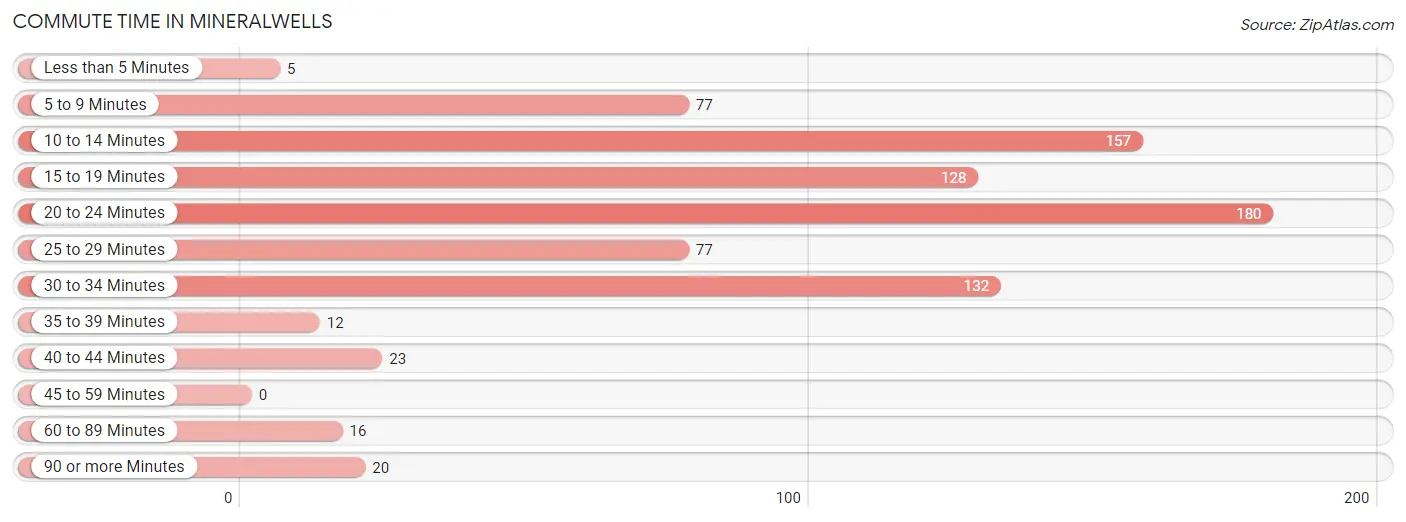
| Commute Time | # Commuters | % Commuters |
| Less than 5 Minutes | 5 | 0.6% |
| 5 to 9 Minutes | 77 | 9.3% |
| 10 to 14 Minutes | 157 | 19.0% |
| 15 to 19 Minutes | 128 | 15.5% |
| 20 to 24 Minutes | 180 | 21.8% |
| 25 to 29 Minutes | 77 | 9.3% |
| 30 to 34 Minutes | 132 | 16.0% |
| 35 to 39 Minutes | 12 | 1.5% |
| 40 to 44 Minutes | 23 | 2.8% |
| 45 to 59 Minutes | 0 | 0.0% |
| 60 to 89 Minutes | 16 | 1.9% |
| 90 or more Minutes | 20 | 2.4% |
Commute Time by Sex in Mineralwells
The most common commute times in Mineralwells are 10 to 14 minutes (96 commuters, 19.7%) for males and 20 to 24 minutes (91 commuters, 26.8%) for females.
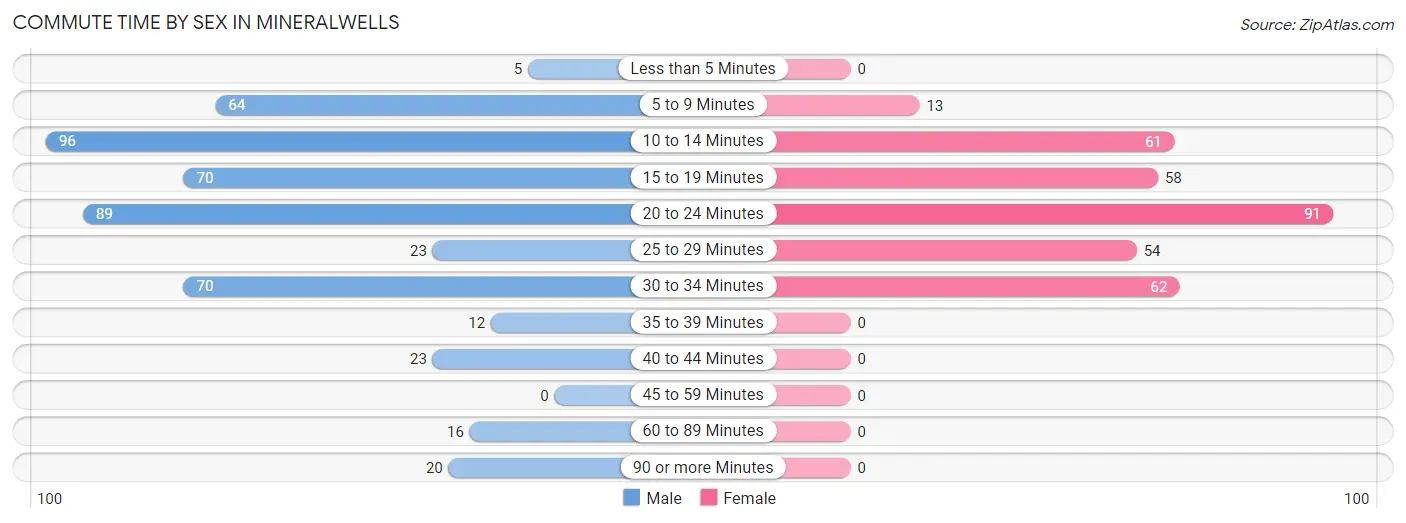
| Commute Time | Male | Female |
| Less than 5 Minutes | 5 (1.0%) | 0 (0.0%) |
| 5 to 9 Minutes | 64 (13.1%) | 13 (3.8%) |
| 10 to 14 Minutes | 96 (19.7%) | 61 (18.0%) |
| 15 to 19 Minutes | 70 (14.3%) | 58 (17.1%) |
| 20 to 24 Minutes | 89 (18.2%) | 91 (26.8%) |
| 25 to 29 Minutes | 23 (4.7%) | 54 (15.9%) |
| 30 to 34 Minutes | 70 (14.3%) | 62 (18.3%) |
| 35 to 39 Minutes | 12 (2.5%) | 0 (0.0%) |
| 40 to 44 Minutes | 23 (4.7%) | 0 (0.0%) |
| 45 to 59 Minutes | 0 (0.0%) | 0 (0.0%) |
| 60 to 89 Minutes | 16 (3.3%) | 0 (0.0%) |
| 90 or more Minutes | 20 (4.1%) | 0 (0.0%) |
Time of Departure to Work by Sex in Mineralwells
The most frequent times of departure to work in Mineralwells are 5:00 AM to 5:29 AM (95, 19.5%) for males and 8:30 AM to 8:59 AM (112, 33.0%) for females.
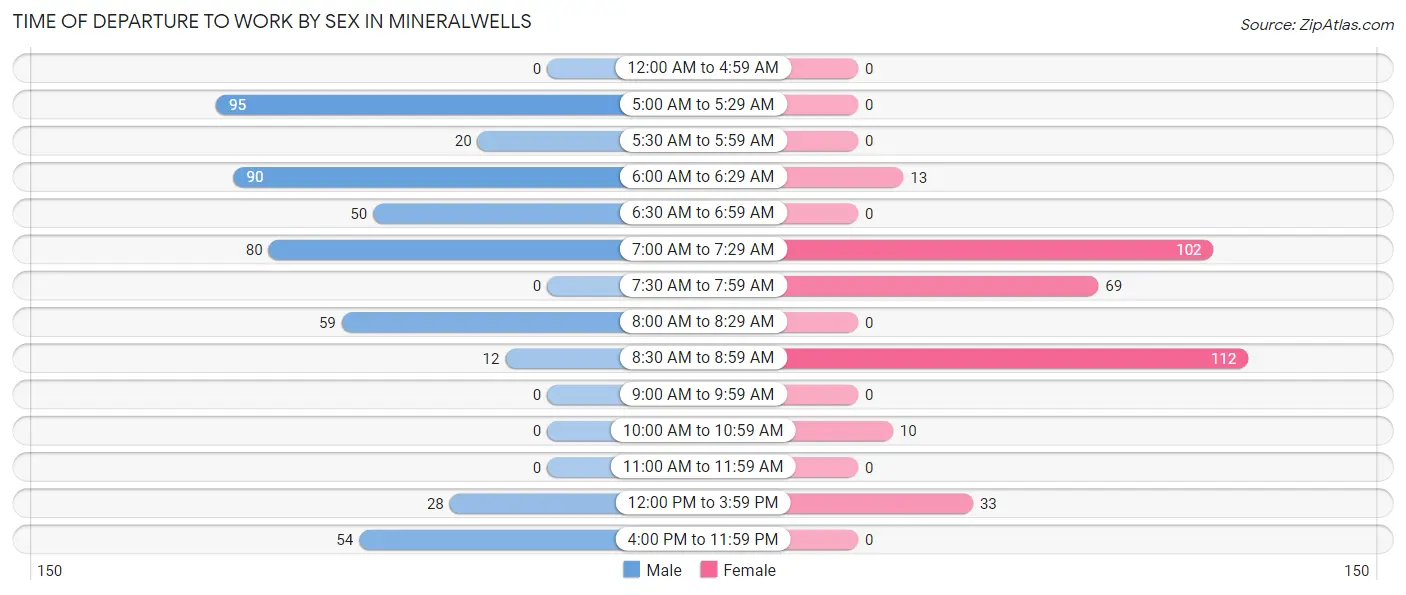
| Time of Departure | Male | Female |
| 12:00 AM to 4:59 AM | 0 (0.0%) | 0 (0.0%) |
| 5:00 AM to 5:29 AM | 95 (19.5%) | 0 (0.0%) |
| 5:30 AM to 5:59 AM | 20 (4.1%) | 0 (0.0%) |
| 6:00 AM to 6:29 AM | 90 (18.4%) | 13 (3.8%) |
| 6:30 AM to 6:59 AM | 50 (10.2%) | 0 (0.0%) |
| 7:00 AM to 7:29 AM | 80 (16.4%) | 102 (30.1%) |
| 7:30 AM to 7:59 AM | 0 (0.0%) | 69 (20.3%) |
| 8:00 AM to 8:29 AM | 59 (12.1%) | 0 (0.0%) |
| 8:30 AM to 8:59 AM | 12 (2.5%) | 112 (33.0%) |
| 9:00 AM to 9:59 AM | 0 (0.0%) | 0 (0.0%) |
| 10:00 AM to 10:59 AM | 0 (0.0%) | 10 (2.9%) |
| 11:00 AM to 11:59 AM | 0 (0.0%) | 0 (0.0%) |
| 12:00 PM to 3:59 PM | 28 (5.7%) | 33 (9.7%) |
| 4:00 PM to 11:59 PM | 54 (11.1%) | 0 (0.0%) |
| Total | 488 (100.0%) | 339 (100.0%) |
Housing Occupancy in Mineralwells
Occupancy by Ownership in Mineralwells
Of the total 795 dwellings in Mineralwells, owner-occupied units account for 649 (81.6%), while renter-occupied units make up 146 (18.4%).
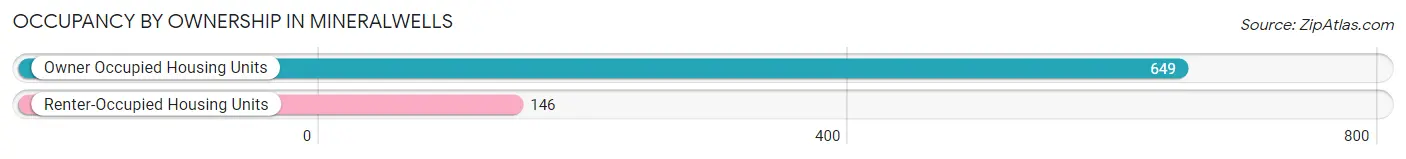
| Occupancy | # Housing Units | % Housing Units |
| Owner Occupied Housing Units | 649 | 81.6% |
| Renter-Occupied Housing Units | 146 | 18.4% |
| Total Occupied Housing Units | 795 | 100.0% |
Occupancy by Household Size in Mineralwells
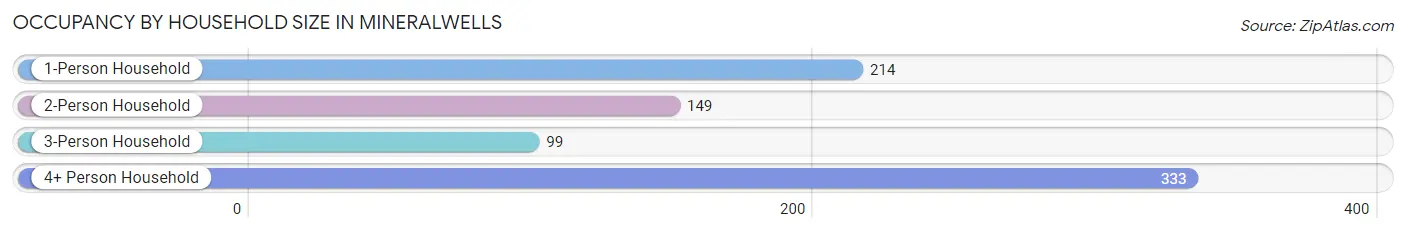
| Household Size | # Housing Units | % Housing Units |
| 1-Person Household | 214 | 26.9% |
| 2-Person Household | 149 | 18.7% |
| 3-Person Household | 99 | 12.4% |
| 4+ Person Household | 333 | 41.9% |
| Total Housing Units | 795 | 100.0% |
Occupancy by Ownership by Household Size in Mineralwells
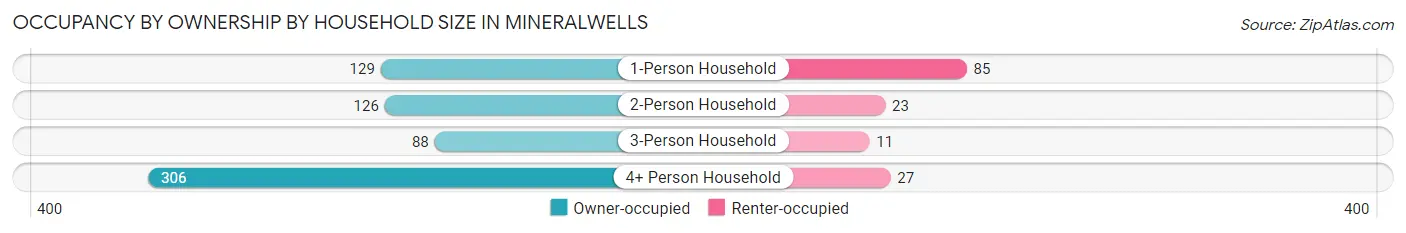
| Household Size | Owner-occupied | Renter-occupied |
| 1-Person Household | 129 (60.3%) | 85 (39.7%) |
| 2-Person Household | 126 (84.6%) | 23 (15.4%) |
| 3-Person Household | 88 (88.9%) | 11 (11.1%) |
| 4+ Person Household | 306 (91.9%) | 27 (8.1%) |
| Total Housing Units | 649 (81.6%) | 146 (18.4%) |
Occupancy by Educational Attainment in Mineralwells
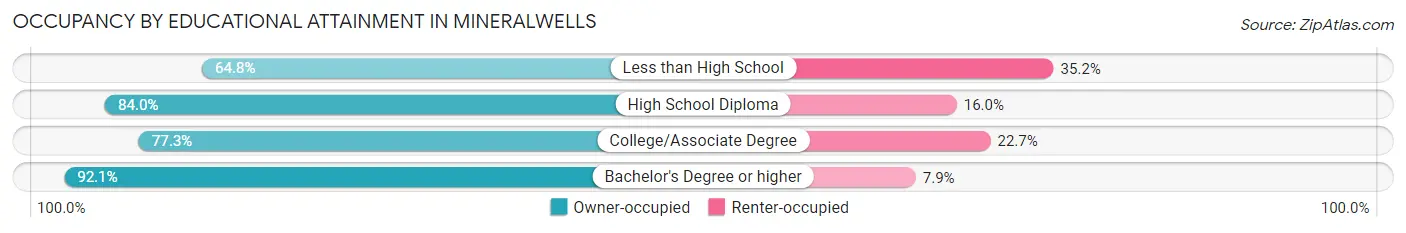
| Household Size | Owner-occupied | Renter-occupied |
| Less than High School | 35 (64.8%) | 19 (35.2%) |
| High School Diploma | 184 (84.0%) | 35 (16.0%) |
| College/Associate Degree | 266 (77.3%) | 78 (22.7%) |
| Bachelor's Degree or higher | 164 (92.1%) | 14 (7.9%) |
Occupancy by Age of Householder in Mineralwells
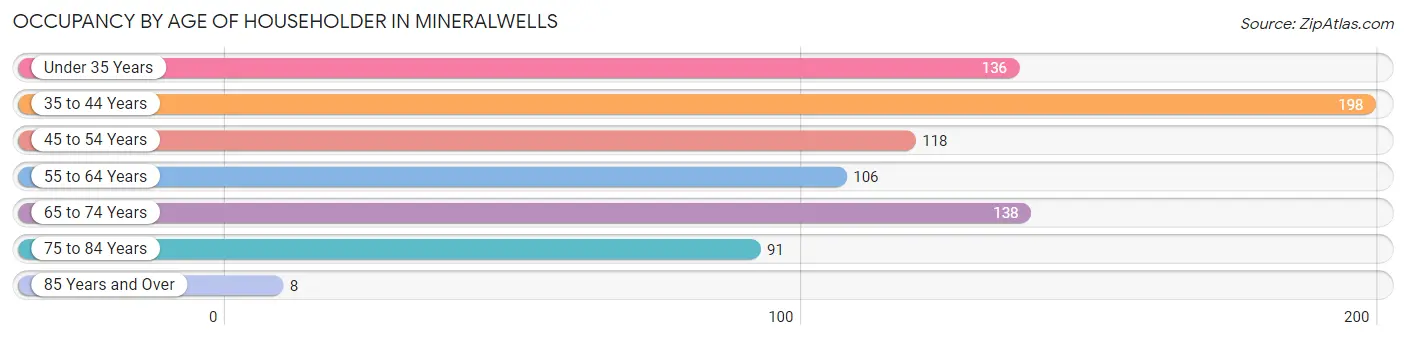
| Age Bracket | # Households | % Households |
| Under 35 Years | 136 | 17.1% |
| 35 to 44 Years | 198 | 24.9% |
| 45 to 54 Years | 118 | 14.8% |
| 55 to 64 Years | 106 | 13.3% |
| 65 to 74 Years | 138 | 17.4% |
| 75 to 84 Years | 91 | 11.5% |
| 85 Years and Over | 8 | 1.0% |
| Total | 795 | 100.0% |
Housing Finances in Mineralwells
Median Income by Occupancy in Mineralwells
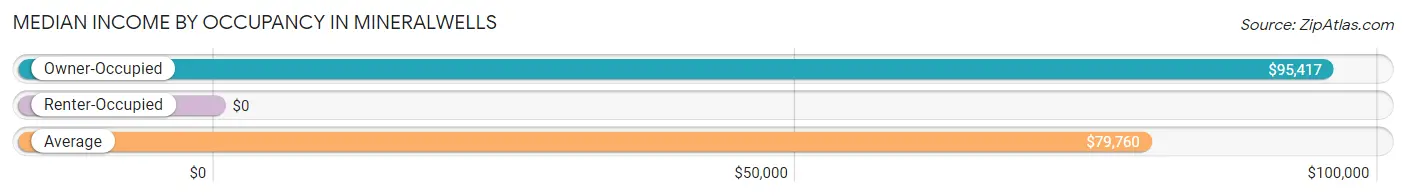
| Occupancy Type | # Households | Median Income |
| Owner-Occupied | 649 (81.6%) | $95,417 |
| Renter-Occupied | 146 (18.4%) | $0 |
| Average | 795 (100.0%) | $79,760 |
Occupancy by Householder Income Bracket in Mineralwells
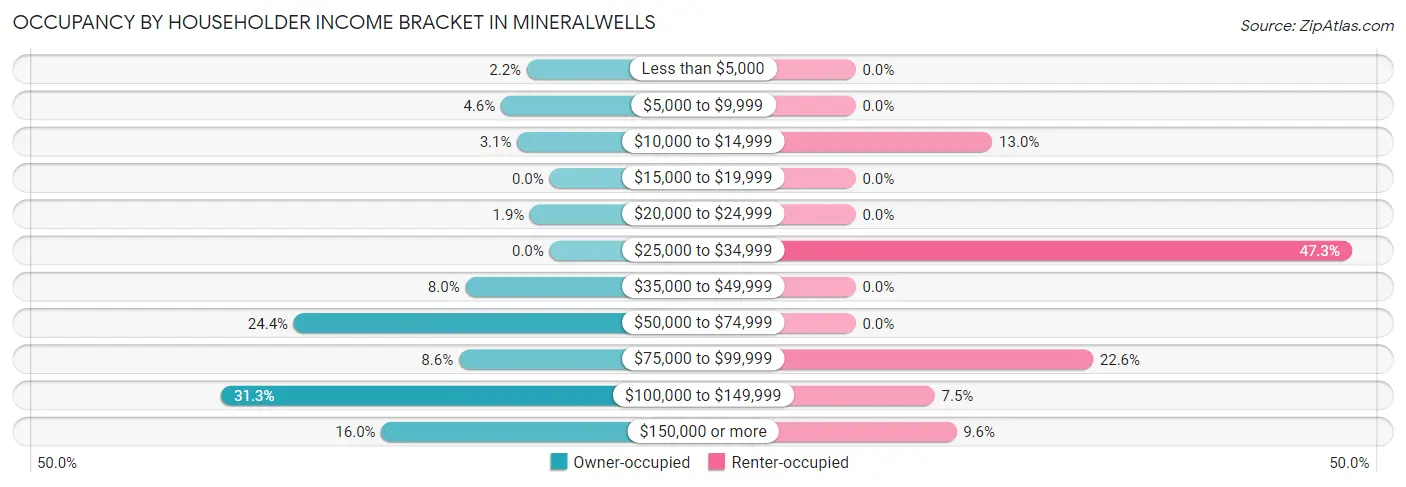
| Income Bracket | Owner-occupied | Renter-occupied |
| Less than $5,000 | 14 (2.2%) | 0 (0.0%) |
| $5,000 to $9,999 | 30 (4.6%) | 0 (0.0%) |
| $10,000 to $14,999 | 20 (3.1%) | 19 (13.0%) |
| $15,000 to $19,999 | 0 (0.0%) | 0 (0.0%) |
| $20,000 to $24,999 | 12 (1.8%) | 0 (0.0%) |
| $25,000 to $34,999 | 0 (0.0%) | 69 (47.3%) |
| $35,000 to $49,999 | 52 (8.0%) | 0 (0.0%) |
| $50,000 to $74,999 | 158 (24.3%) | 0 (0.0%) |
| $75,000 to $99,999 | 56 (8.6%) | 33 (22.6%) |
| $100,000 to $149,999 | 203 (31.3%) | 11 (7.5%) |
| $150,000 or more | 104 (16.0%) | 14 (9.6%) |
| Total | 649 (100.0%) | 146 (100.0%) |
Monthly Housing Cost Tiers in Mineralwells
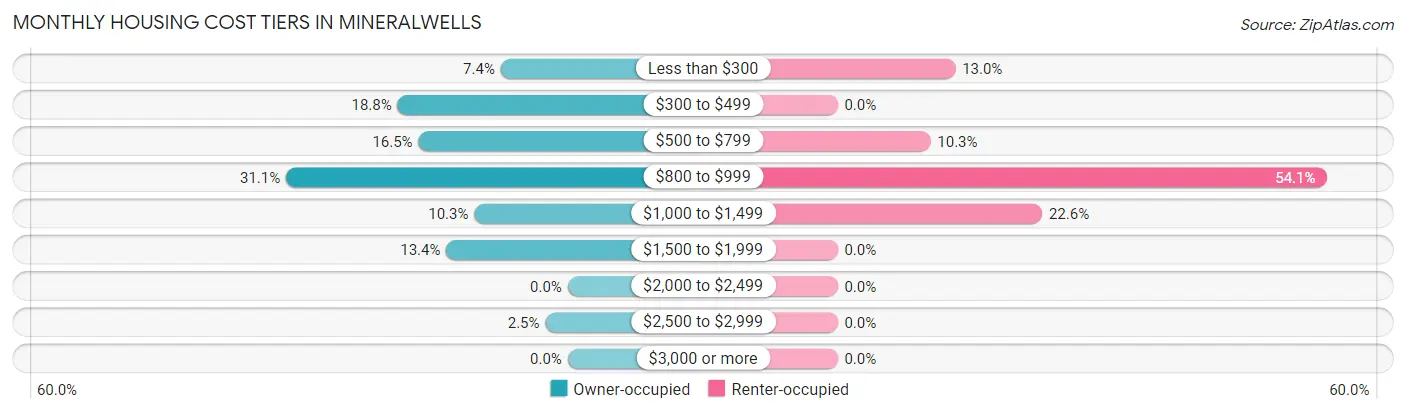
| Monthly Cost | Owner-occupied | Renter-occupied |
| Less than $300 | 48 (7.4%) | 19 (13.0%) |
| $300 to $499 | 122 (18.8%) | 0 (0.0%) |
| $500 to $799 | 107 (16.5%) | 15 (10.3%) |
| $800 to $999 | 202 (31.1%) | 79 (54.1%) |
| $1,000 to $1,499 | 67 (10.3%) | 33 (22.6%) |
| $1,500 to $1,999 | 87 (13.4%) | 0 (0.0%) |
| $2,000 to $2,499 | 0 (0.0%) | 0 (0.0%) |
| $2,500 to $2,999 | 16 (2.5%) | 0 (0.0%) |
| $3,000 or more | 0 (0.0%) | 0 (0.0%) |
| Total | 649 (100.0%) | 146 (100.0%) |
Physical Housing Characteristics in Mineralwells
Housing Structures in Mineralwells
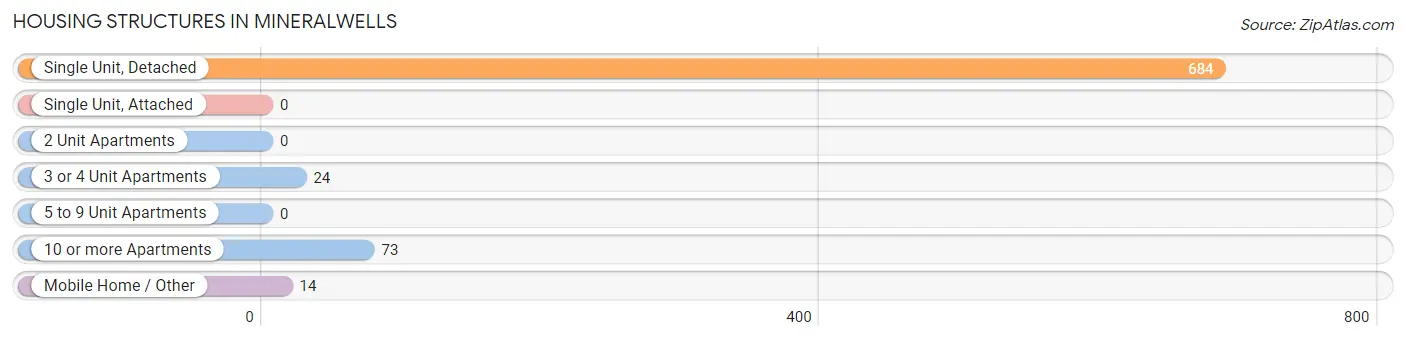
| Structure Type | # Housing Units | % Housing Units |
| Single Unit, Detached | 684 | 86.0% |
| Single Unit, Attached | 0 | 0.0% |
| 2 Unit Apartments | 0 | 0.0% |
| 3 or 4 Unit Apartments | 24 | 3.0% |
| 5 to 9 Unit Apartments | 0 | 0.0% |
| 10 or more Apartments | 73 | 9.2% |
| Mobile Home / Other | 14 | 1.8% |
| Total | 795 | 100.0% |
Housing Structures by Occupancy in Mineralwells
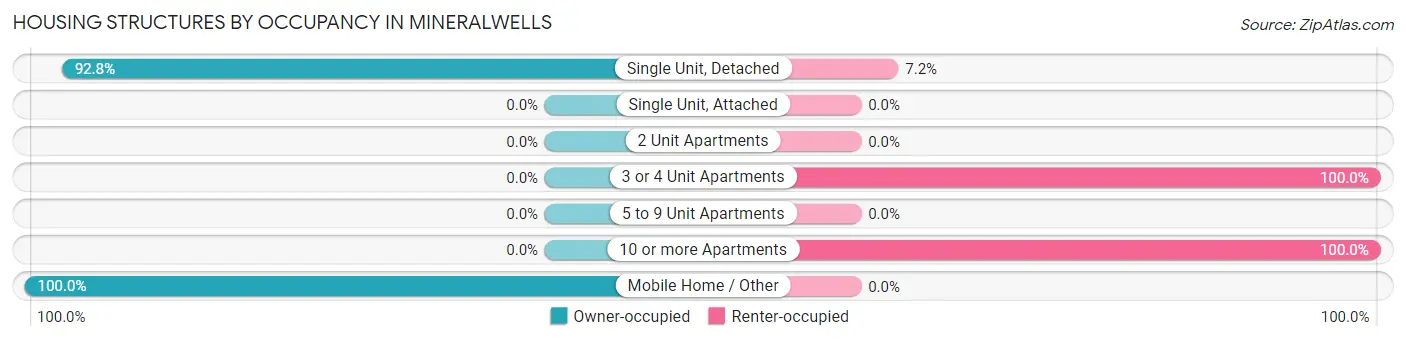
| Structure Type | Owner-occupied | Renter-occupied |
| Single Unit, Detached | 635 (92.8%) | 49 (7.2%) |
| Single Unit, Attached | 0 (0.0%) | 0 (0.0%) |
| 2 Unit Apartments | 0 (0.0%) | 0 (0.0%) |
| 3 or 4 Unit Apartments | 0 (0.0%) | 24 (100.0%) |
| 5 to 9 Unit Apartments | 0 (0.0%) | 0 (0.0%) |
| 10 or more Apartments | 0 (0.0%) | 73 (100.0%) |
| Mobile Home / Other | 14 (100.0%) | 0 (0.0%) |
| Total | 649 (81.6%) | 146 (18.4%) |
Housing Structures by Number of Rooms in Mineralwells
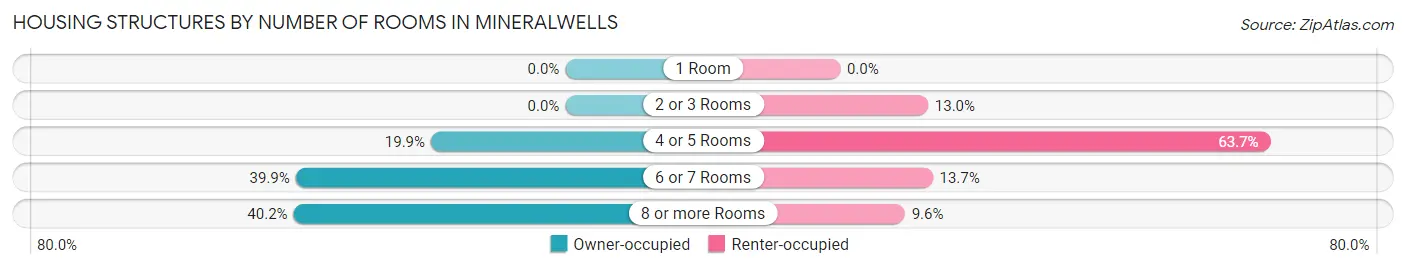
| Number of Rooms | Owner-occupied | Renter-occupied |
| 1 Room | 0 (0.0%) | 0 (0.0%) |
| 2 or 3 Rooms | 0 (0.0%) | 19 (13.0%) |
| 4 or 5 Rooms | 129 (19.9%) | 93 (63.7%) |
| 6 or 7 Rooms | 259 (39.9%) | 20 (13.7%) |
| 8 or more Rooms | 261 (40.2%) | 14 (9.6%) |
| Total | 649 (100.0%) | 146 (100.0%) |
Housing Structure by Heating Type in Mineralwells
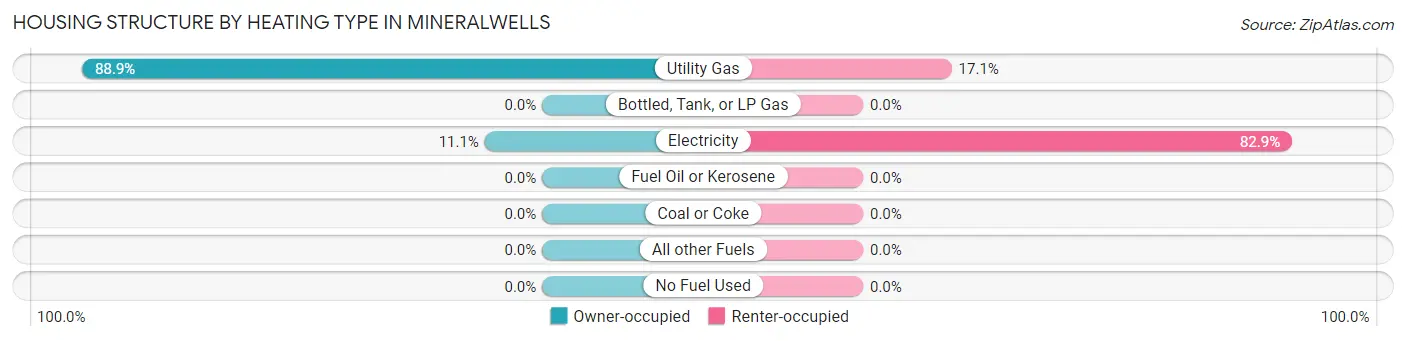
| Heating Type | Owner-occupied | Renter-occupied |
| Utility Gas | 577 (88.9%) | 25 (17.1%) |
| Bottled, Tank, or LP Gas | 0 (0.0%) | 0 (0.0%) |
| Electricity | 72 (11.1%) | 121 (82.9%) |
| Fuel Oil or Kerosene | 0 (0.0%) | 0 (0.0%) |
| Coal or Coke | 0 (0.0%) | 0 (0.0%) |
| All other Fuels | 0 (0.0%) | 0 (0.0%) |
| No Fuel Used | 0 (0.0%) | 0 (0.0%) |
| Total | 649 (100.0%) | 146 (100.0%) |
Household Vehicle Usage in Mineralwells
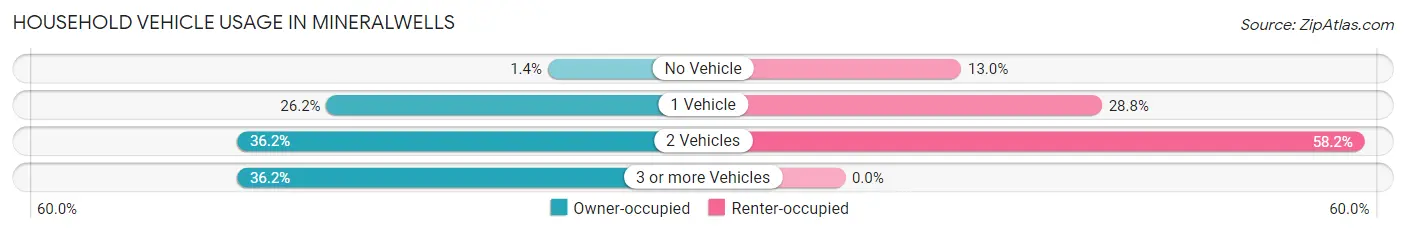
| Vehicles per Household | Owner-occupied | Renter-occupied |
| No Vehicle | 9 (1.4%) | 19 (13.0%) |
| 1 Vehicle | 170 (26.2%) | 42 (28.8%) |
| 2 Vehicles | 235 (36.2%) | 85 (58.2%) |
| 3 or more Vehicles | 235 (36.2%) | 0 (0.0%) |
| Total | 649 (100.0%) | 146 (100.0%) |
Real Estate & Mortgages in Mineralwells
Real Estate and Mortgage Overview in Mineralwells
| Characteristic | Without Mortgage | With Mortgage |
| Housing Units | 264 | 385 |
| Median Property Value | $183,500 | $141,200 |
| Median Household Income | $100,395 | $81 |
| Monthly Housing Costs | $424 | $0 |
| Real Estate Taxes | $915 | $23 |
Property Value by Mortgage Status in Mineralwells
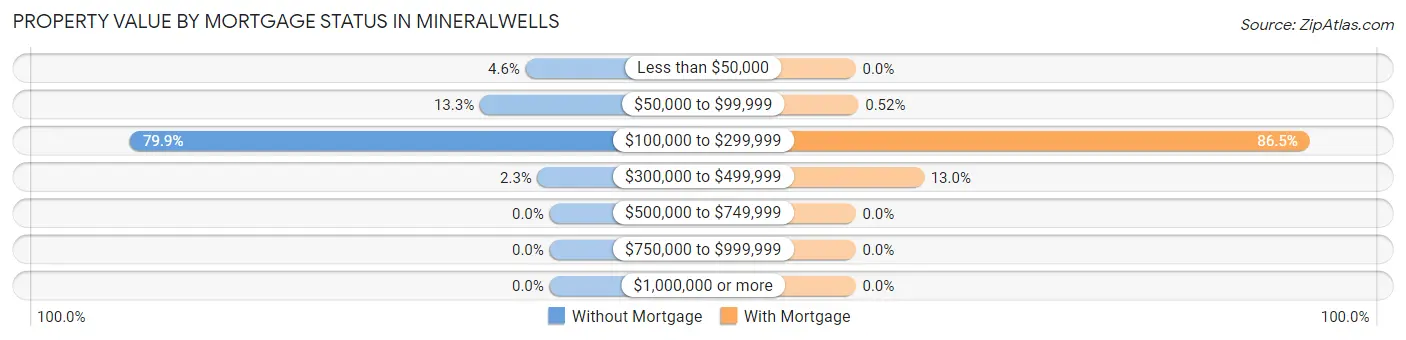
| Property Value | Without Mortgage | With Mortgage |
| Less than $50,000 | 12 (4.5%) | 0 (0.0%) |
| $50,000 to $99,999 | 35 (13.3%) | 2 (0.5%) |
| $100,000 to $299,999 | 211 (79.9%) | 333 (86.5%) |
| $300,000 to $499,999 | 6 (2.3%) | 50 (13.0%) |
| $500,000 to $749,999 | 0 (0.0%) | 0 (0.0%) |
| $750,000 to $999,999 | 0 (0.0%) | 0 (0.0%) |
| $1,000,000 or more | 0 (0.0%) | 0 (0.0%) |
| Total | 264 (100.0%) | 385 (100.0%) |
Household Income by Mortgage Status in Mineralwells
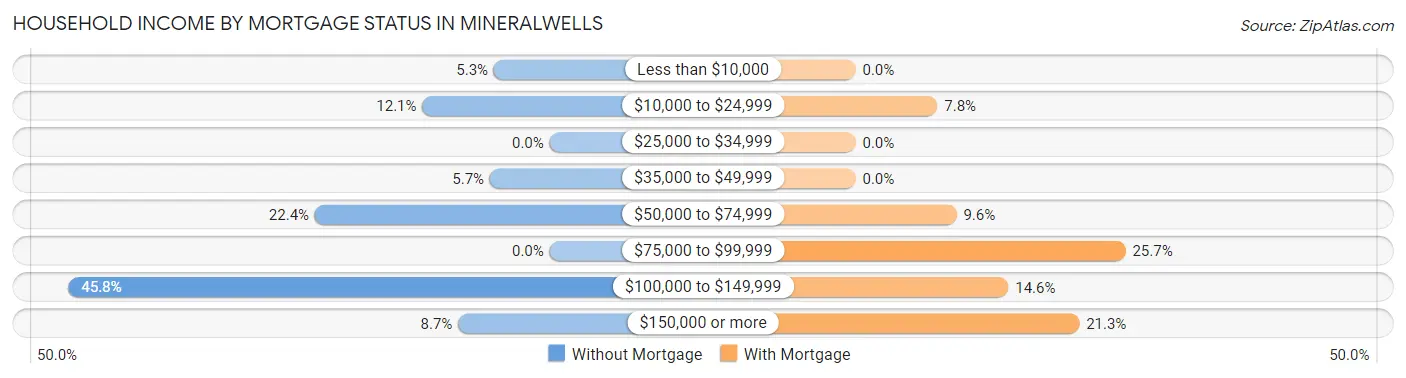
| Household Income | Without Mortgage | With Mortgage |
| Less than $10,000 | 14 (5.3%) | 0 (0.0%) |
| $10,000 to $24,999 | 32 (12.1%) | 30 (7.8%) |
| $25,000 to $34,999 | 0 (0.0%) | 0 (0.0%) |
| $35,000 to $49,999 | 15 (5.7%) | 0 (0.0%) |
| $50,000 to $74,999 | 59 (22.4%) | 37 (9.6%) |
| $75,000 to $99,999 | 0 (0.0%) | 99 (25.7%) |
| $100,000 to $149,999 | 121 (45.8%) | 56 (14.5%) |
| $150,000 or more | 23 (8.7%) | 82 (21.3%) |
| Total | 264 (100.0%) | 385 (100.0%) |
Property Value to Household Income Ratio in Mineralwells
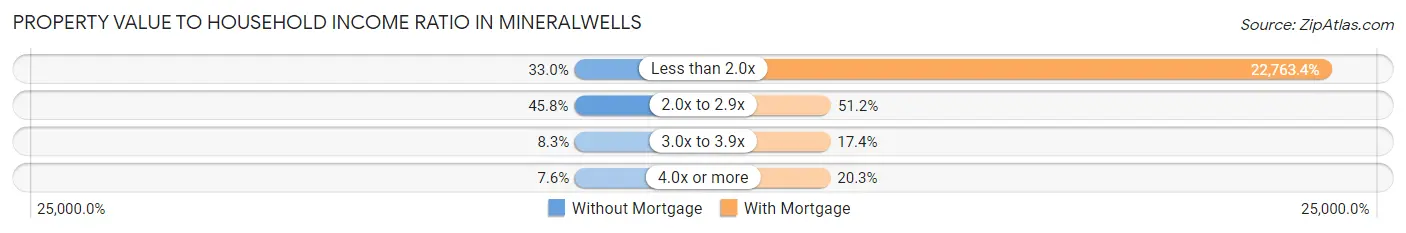
| Value-to-Income Ratio | Without Mortgage | With Mortgage |
| Less than 2.0x | 87 (33.0%) | 87,639 (22,763.4%) |
| 2.0x to 2.9x | 121 (45.8%) | 197 (51.2%) |
| 3.0x to 3.9x | 22 (8.3%) | 67 (17.4%) |
| 4.0x or more | 20 (7.6%) | 78 (20.3%) |
| Total | 264 (100.0%) | 385 (100.0%) |
Real Estate Taxes by Mortgage Status in Mineralwells
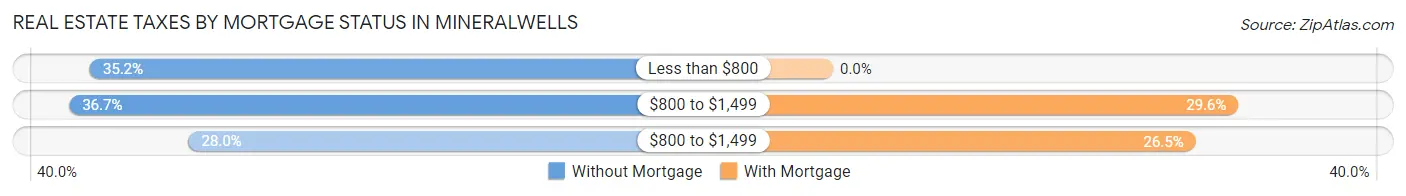
| Property Taxes | Without Mortgage | With Mortgage |
| Less than $800 | 93 (35.2%) | 0 (0.0%) |
| $800 to $1,499 | 97 (36.7%) | 114 (29.6%) |
| $800 to $1,499 | 74 (28.0%) | 102 (26.5%) |
| Total | 264 (100.0%) | 385 (100.0%) |
Health & Disability in Mineralwells
Health Insurance Coverage by Age in Mineralwells
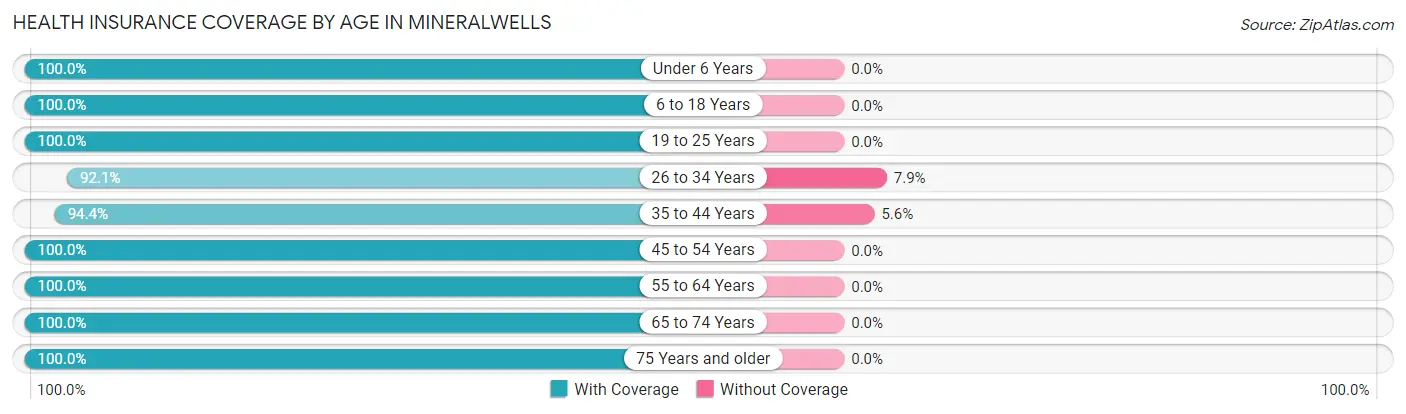
| Age Bracket | With Coverage | Without Coverage |
| Under 6 Years | 356 (100.0%) | 0 (0.0%) |
| 6 to 18 Years | 596 (100.0%) | 0 (0.0%) |
| 19 to 25 Years | 38 (100.0%) | 0 (0.0%) |
| 26 to 34 Years | 313 (92.1%) | 27 (7.9%) |
| 35 to 44 Years | 402 (94.4%) | 24 (5.6%) |
| 45 to 54 Years | 184 (100.0%) | 0 (0.0%) |
| 55 to 64 Years | 212 (100.0%) | 0 (0.0%) |
| 65 to 74 Years | 233 (100.0%) | 0 (0.0%) |
| 75 Years and older | 164 (100.0%) | 0 (0.0%) |
| Total | 2,498 (98.0%) | 51 (2.0%) |
Health Insurance Coverage by Citizenship Status in Mineralwells
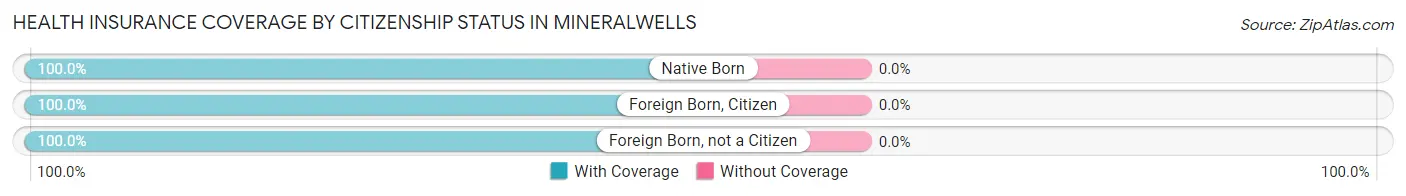
| Citizenship Status | With Coverage | Without Coverage |
| Native Born | 356 (100.0%) | 0 (0.0%) |
| Foreign Born, Citizen | 596 (100.0%) | 0 (0.0%) |
| Foreign Born, not a Citizen | 38 (100.0%) | 0 (0.0%) |
Health Insurance Coverage by Household Income in Mineralwells
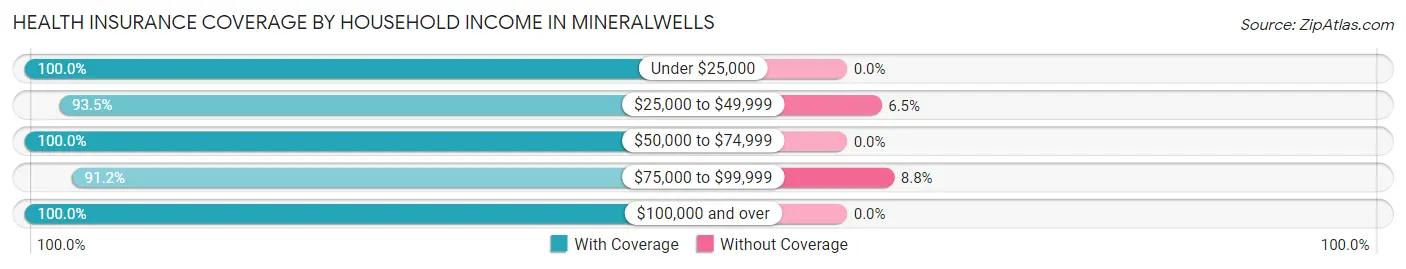
| Household Income | With Coverage | Without Coverage |
| Under $25,000 | 112 (100.0%) | 0 (0.0%) |
| $25,000 to $49,999 | 391 (93.5%) | 27 (6.5%) |
| $50,000 to $74,999 | 509 (100.0%) | 0 (0.0%) |
| $75,000 to $99,999 | 248 (91.2%) | 24 (8.8%) |
| $100,000 and over | 1,238 (100.0%) | 0 (0.0%) |
Public vs Private Health Insurance Coverage by Age in Mineralwells
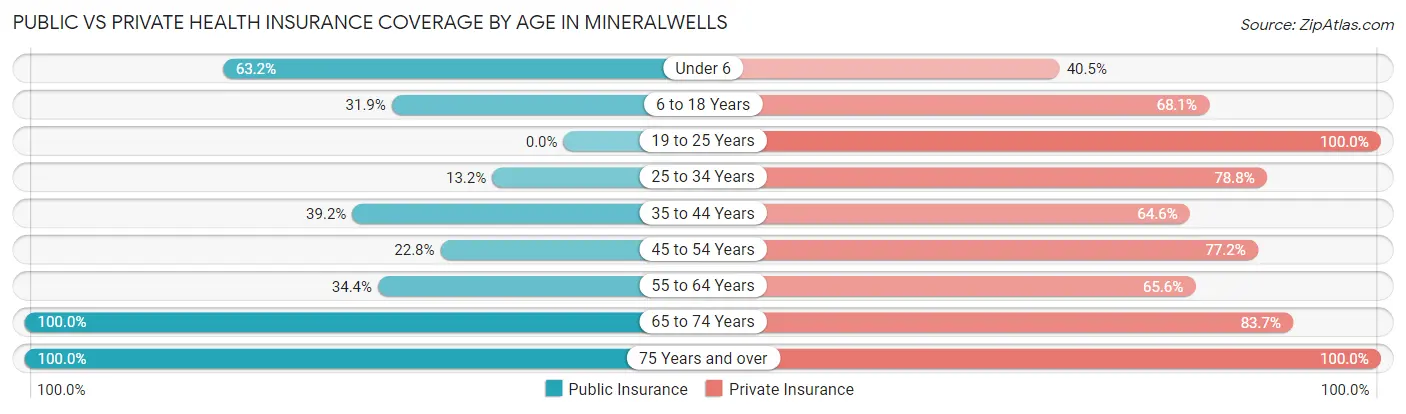
| Age Bracket | Public Insurance | Private Insurance |
| Under 6 | 225 (63.2%) | 144 (40.5%) |
| 6 to 18 Years | 190 (31.9%) | 406 (68.1%) |
| 19 to 25 Years | 0 (0.0%) | 38 (100.0%) |
| 25 to 34 Years | 45 (13.2%) | 268 (78.8%) |
| 35 to 44 Years | 167 (39.2%) | 275 (64.5%) |
| 45 to 54 Years | 42 (22.8%) | 142 (77.2%) |
| 55 to 64 Years | 73 (34.4%) | 139 (65.6%) |
| 65 to 74 Years | 233 (100.0%) | 195 (83.7%) |
| 75 Years and over | 164 (100.0%) | 164 (100.0%) |
| Total | 1,139 (44.7%) | 1,771 (69.5%) |
Disability Status by Sex by Age in Mineralwells
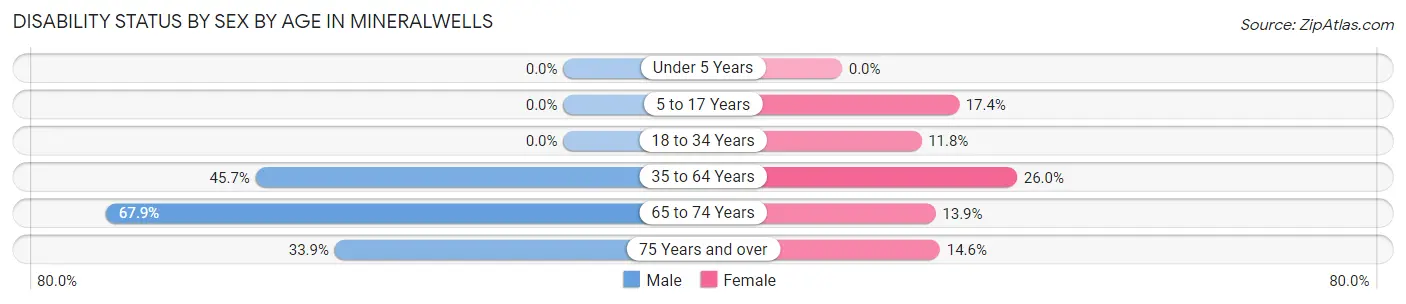
| Age Bracket | Male | Female |
| Under 5 Years | 0 (0.0%) | 0 (0.0%) |
| 5 to 17 Years | 0 (0.0%) | 54 (17.4%) |
| 18 to 34 Years | 0 (0.0%) | 25 (11.8%) |
| 35 to 64 Years | 191 (45.7%) | 105 (26.0%) |
| 65 to 74 Years | 36 (67.9%) | 25 (13.9%) |
| 75 Years and over | 37 (33.9%) | 8 (14.5%) |
Disability Class by Sex by Age in Mineralwells
Disability Class: Hearing Difficulty
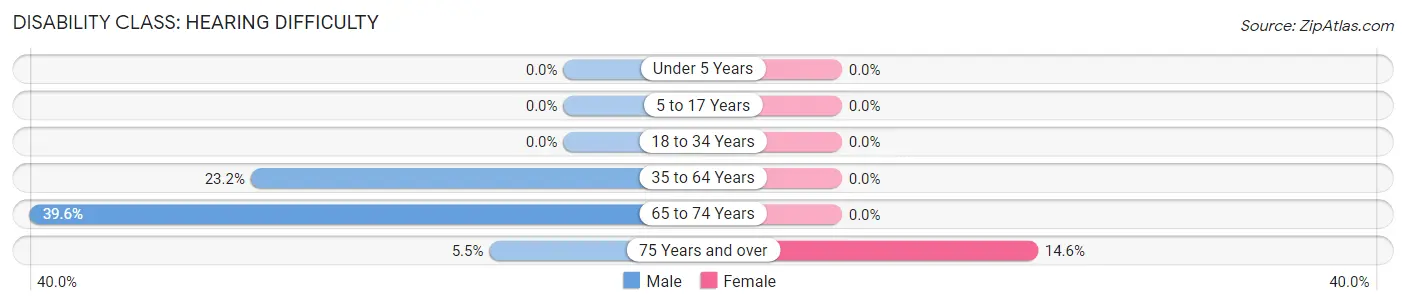
| Age Bracket | Male | Female |
| Under 5 Years | 0 (0.0%) | 0 (0.0%) |
| 5 to 17 Years | 0 (0.0%) | 0 (0.0%) |
| 18 to 34 Years | 0 (0.0%) | 0 (0.0%) |
| 35 to 64 Years | 97 (23.2%) | 0 (0.0%) |
| 65 to 74 Years | 21 (39.6%) | 0 (0.0%) |
| 75 Years and over | 6 (5.5%) | 8 (14.5%) |
Disability Class: Vision Difficulty
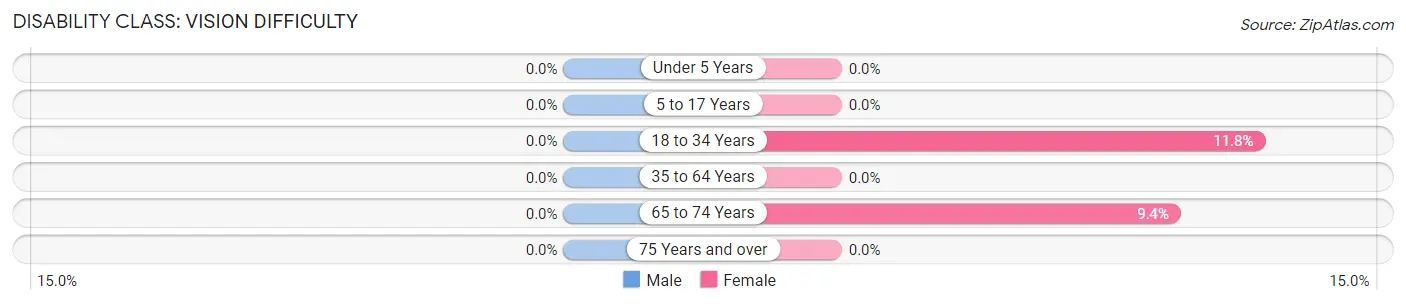
| Age Bracket | Male | Female |
| Under 5 Years | 0 (0.0%) | 0 (0.0%) |
| 5 to 17 Years | 0 (0.0%) | 0 (0.0%) |
| 18 to 34 Years | 0 (0.0%) | 25 (11.8%) |
| 35 to 64 Years | 0 (0.0%) | 0 (0.0%) |
| 65 to 74 Years | 0 (0.0%) | 17 (9.4%) |
| 75 Years and over | 0 (0.0%) | 0 (0.0%) |
Disability Class: Cognitive Difficulty
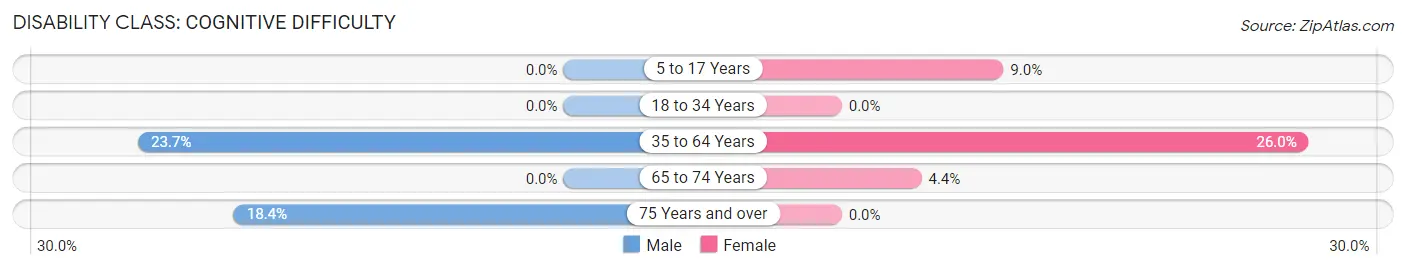
| Age Bracket | Male | Female |
| 5 to 17 Years | 0 (0.0%) | 28 (9.0%) |
| 18 to 34 Years | 0 (0.0%) | 0 (0.0%) |
| 35 to 64 Years | 99 (23.7%) | 105 (26.0%) |
| 65 to 74 Years | 0 (0.0%) | 8 (4.4%) |
| 75 Years and over | 20 (18.3%) | 0 (0.0%) |
Disability Class: Ambulatory Difficulty
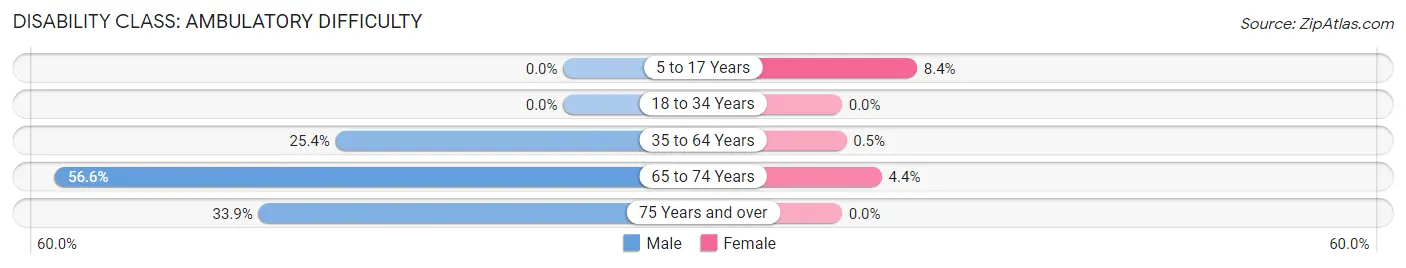
| Age Bracket | Male | Female |
| 5 to 17 Years | 0 (0.0%) | 26 (8.4%) |
| 18 to 34 Years | 0 (0.0%) | 0 (0.0%) |
| 35 to 64 Years | 106 (25.4%) | 2 (0.5%) |
| 65 to 74 Years | 30 (56.6%) | 8 (4.4%) |
| 75 Years and over | 37 (33.9%) | 0 (0.0%) |
Disability Class: Self-Care Difficulty
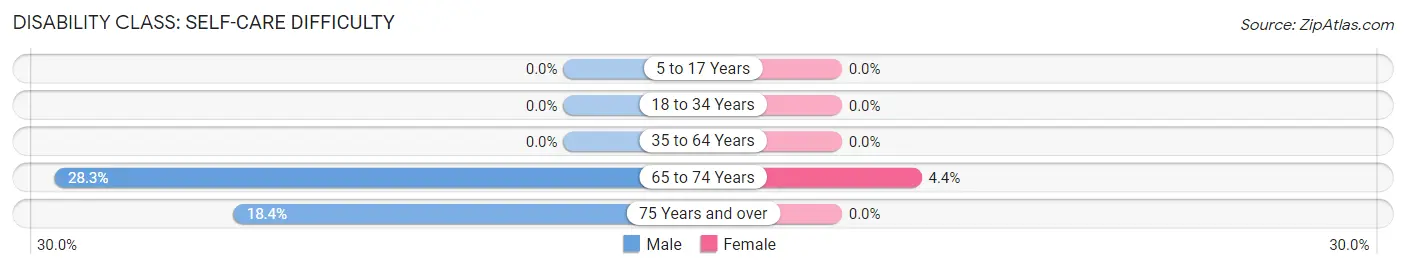
| Age Bracket | Male | Female |
| 5 to 17 Years | 0 (0.0%) | 0 (0.0%) |
| 18 to 34 Years | 0 (0.0%) | 0 (0.0%) |
| 35 to 64 Years | 0 (0.0%) | 0 (0.0%) |
| 65 to 74 Years | 15 (28.3%) | 8 (4.4%) |
| 75 Years and over | 20 (18.3%) | 0 (0.0%) |
Technology Access in Mineralwells
Computing Device Access in Mineralwells
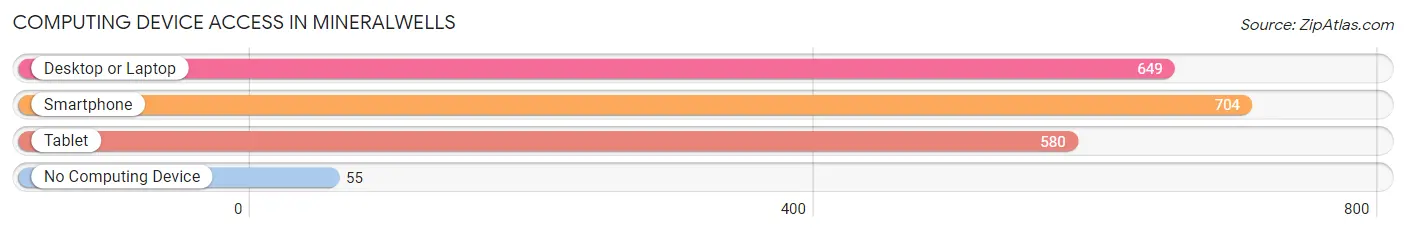
| Device Type | # Households | % Households |
| Desktop or Laptop | 649 | 81.6% |
| Smartphone | 704 | 88.5% |
| Tablet | 580 | 73.0% |
| No Computing Device | 55 | 6.9% |
| Total | 795 | 100.0% |
Internet Access in Mineralwells
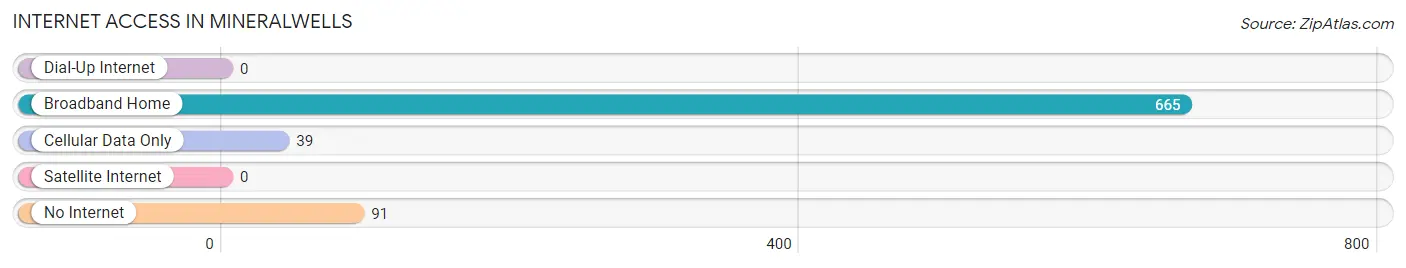
| Internet Type | # Households | % Households |
| Dial-Up Internet | 0 | 0.0% |
| Broadband Home | 665 | 83.7% |
| Cellular Data Only | 39 | 4.9% |
| Satellite Internet | 0 | 0.0% |
| No Internet | 91 | 11.5% |
| Total | 795 | 100.0% |
Mineralwells Summary
Mineralwells, West Virginia is a small town located in Wood County, West Virginia. It is situated along the Ohio River, just south of Parkersburg. The town was founded in 1871 and was named after the mineral springs that were discovered in the area. The town has a population of approximately 1,500 people and is part of the Parkersburg-Marietta-Vienna Metropolitan Statistical Area.
Geography
Mineralwells is located in the Appalachian Mountains of West Virginia. The town is situated along the Ohio River, just south of Parkersburg. The town is surrounded by rolling hills and forests, and is located in the Appalachian Plateau. The climate in Mineralwells is humid continental, with hot summers and cold winters. The average annual temperature is around 50 degrees Fahrenheit.
Economy
The economy of Mineralwells is largely based on the oil and gas industry. The town is home to several oil and gas companies, including Chesapeake Energy, Antero Resources, and EQT Corporation. The town also has a number of small businesses, including restaurants, retail stores, and service providers.
Demographics
As of the 2010 census, the population of Mineralwells was 1,500. The racial makeup of the town was 97.3% White, 0.7% African American, 0.3% Native American, 0.3% Asian, and 1.3% from other races. The median household income was $35,000, and the median family income was $41,000. The per capita income was $17,000.
History
Mineralwells was founded in 1871 by a group of settlers who discovered mineral springs in the area. The town was named after the mineral springs, and the springs were believed to have healing properties. The town quickly grew and became a popular destination for tourists. In the late 19th century, the town was home to several hotels and resorts, and the mineral springs were a popular attraction.
In the early 20th century, the town began to decline as the popularity of the mineral springs began to wane. The town was also affected by the Great Depression, and many of the businesses in the town closed. In the 1950s, the town began to experience a resurgence as the oil and gas industry began to move into the area. The town has since become a popular destination for tourists, and the mineral springs are still a popular attraction.
Conclusion
Mineralwells, West Virginia is a small town located in Wood County, West Virginia. It is situated along the Ohio River, just south of Parkersburg. The town was founded in 1871 and was named after the mineral springs that were discovered in the area. The town has a population of approximately 1,500 people and is part of the Parkersburg-Marietta-Vienna Metropolitan Statistical Area. The economy of Mineralwells is largely based on the oil and gas industry, and the town is home to several small businesses. The racial makeup of the town is predominantly White, and the median household income is around $35,000. The town has a long history, and the mineral springs are still a popular attraction.
Common Questions
What is Per Capita Income in Mineralwells?
Per Capita income in Mineralwells is $28,971.
What is the Median Family Income in Mineralwells?
Median Family Income in Mineralwells is $100,735.
What is the Median Household income in Mineralwells?
Median Household Income in Mineralwells is $79,760.
What is Income or Wage Gap in Mineralwells?
Income or Wage Gap in Mineralwells is 33.9%.
Women in Mineralwells earn 66.1 cents for every dollar earned by a man.
What is Inequality or Gini Index in Mineralwells?
Inequality or Gini Index in Mineralwells is 0.37.
What is the Total Population of Mineralwells?
Total Population of Mineralwells is 2,549.
What is the Total Male Population of Mineralwells?
Total Male Population of Mineralwells is 1,307.
What is the Total Female Population of Mineralwells?
Total Female Population of Mineralwells is 1,242.
What is the Ratio of Males per 100 Females in Mineralwells?
There are 105.23 Males per 100 Females in Mineralwells.
What is the Ratio of Females per 100 Males in Mineralwells?
There are 95.03 Females per 100 Males in Mineralwells.
What is the Median Population Age in Mineralwells?
Median Population Age in Mineralwells is 33.0 Years.
What is the Average Family Size in Mineralwells
Average Family Size in Mineralwells is 4.1 People.
What is the Average Household Size in Mineralwells
Average Household Size in Mineralwells is 3.2 People.
How Large is the Labor Force in Mineralwells?
There are 946 People in the Labor Forcein in Mineralwells.
What is the Percentage of People in the Labor Force in Mineralwells?
52.2% of People are in the Labor Force in Mineralwells.
What is the Unemployment Rate in Mineralwells?
Unemployment Rate in Mineralwells is 1.0%.