Zip Codes with the Highest Percentage of Population Employed in Architecture & Engineering in Martinsburg, WV
RELATED REPORTS & OPTIONS
Architecture & Engineering
Martinsburg
Compare Zip Codes
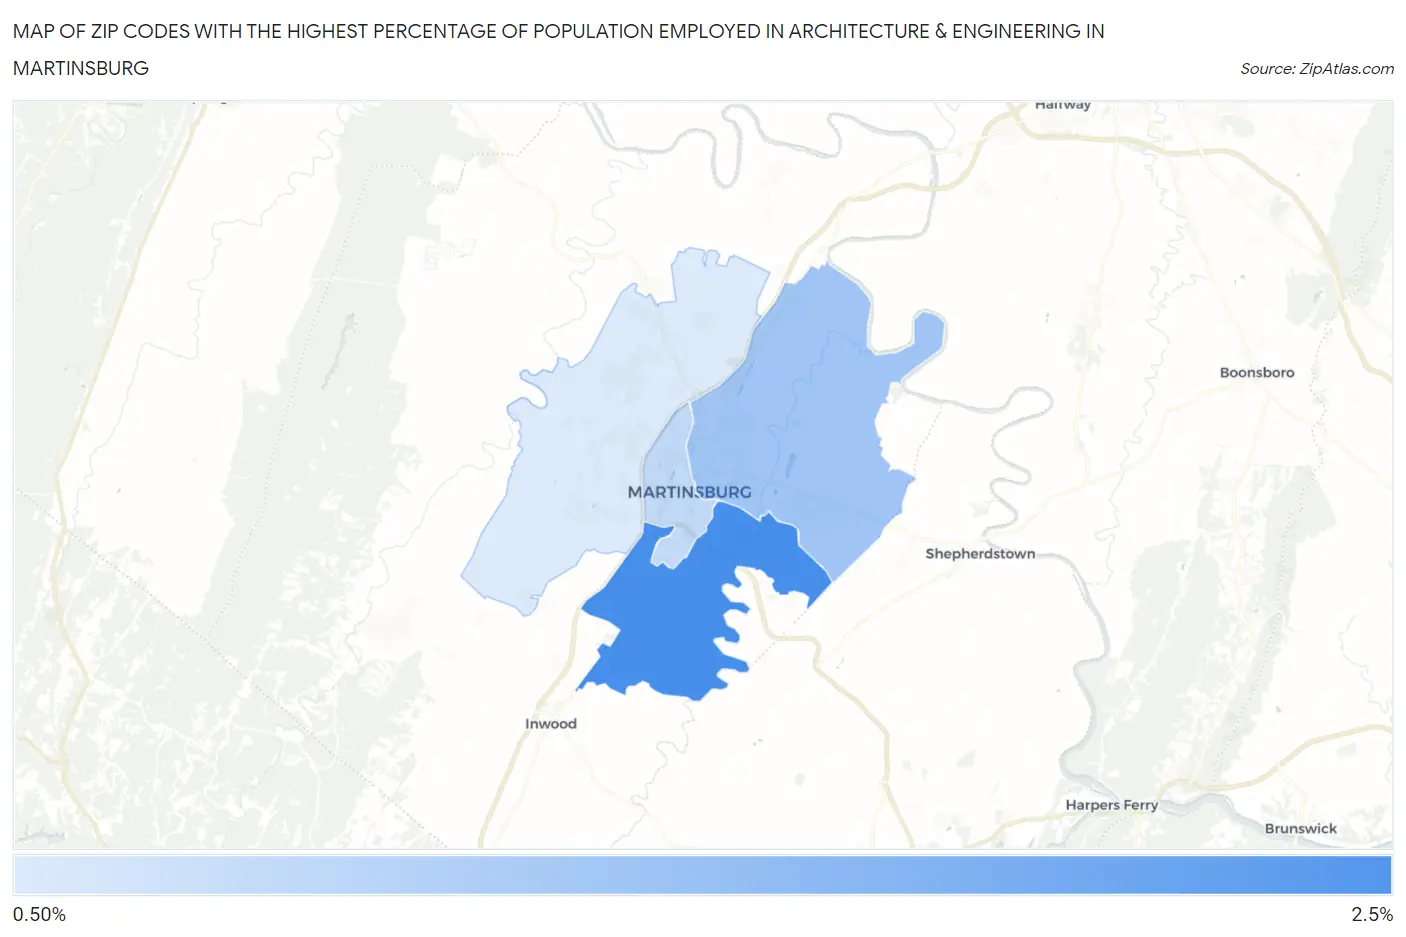
Map of Zip Codes with the Highest Percentage of Population Employed in Architecture & Engineering in Martinsburg
0.87%
2.1%
Zip Codes with the Highest Percentage of Population Employed in Architecture & Engineering in Martinsburg, WV
| Zip Code | % Employed | vs State | vs National | |
| 1. | 25405 | 2.1% | 1.6%(+0.502)#120 | 2.1%(-0.088)#9,250 |
| 2. | 25404 | 1.3% | 1.6%(-0.215)#149 | 2.1%(-0.804)#13,994 |
| 3. | 25401 | 1.1% | 1.6%(-0.472)#166 | 2.1%(-1.06)#15,965 |
| 4. | 25403 | 0.87% | 1.6%(-0.693)#184 | 2.1%(-1.28)#17,628 |
1
Common Questions
What are the Top 3 Zip Codes with the Highest Percentage of Population Employed in Architecture & Engineering in Martinsburg, WV?
Top 3 Zip Codes with the Highest Percentage of Population Employed in Architecture & Engineering in Martinsburg, WV are:
What zip code has the Highest Percentage of Population Employed in Architecture & Engineering in Martinsburg, WV?
25405 has the Highest Percentage of Population Employed in Architecture & Engineering in Martinsburg, WV with 2.1%.
What is the Percentage of Population Employed in Architecture & Engineering in Martinsburg, WV?
Percentage of Population Employed in Architecture & Engineering in Martinsburg is 0.75%.
What is the Percentage of Population Employed in Architecture & Engineering in West Virginia?
Percentage of Population Employed in Architecture & Engineering in West Virginia is 1.6%.
What is the Percentage of Population Employed in Architecture & Engineering in the United States?
Percentage of Population Employed in Architecture & Engineering in the United States is 2.1%.