North Hills, WV Map & Demographics
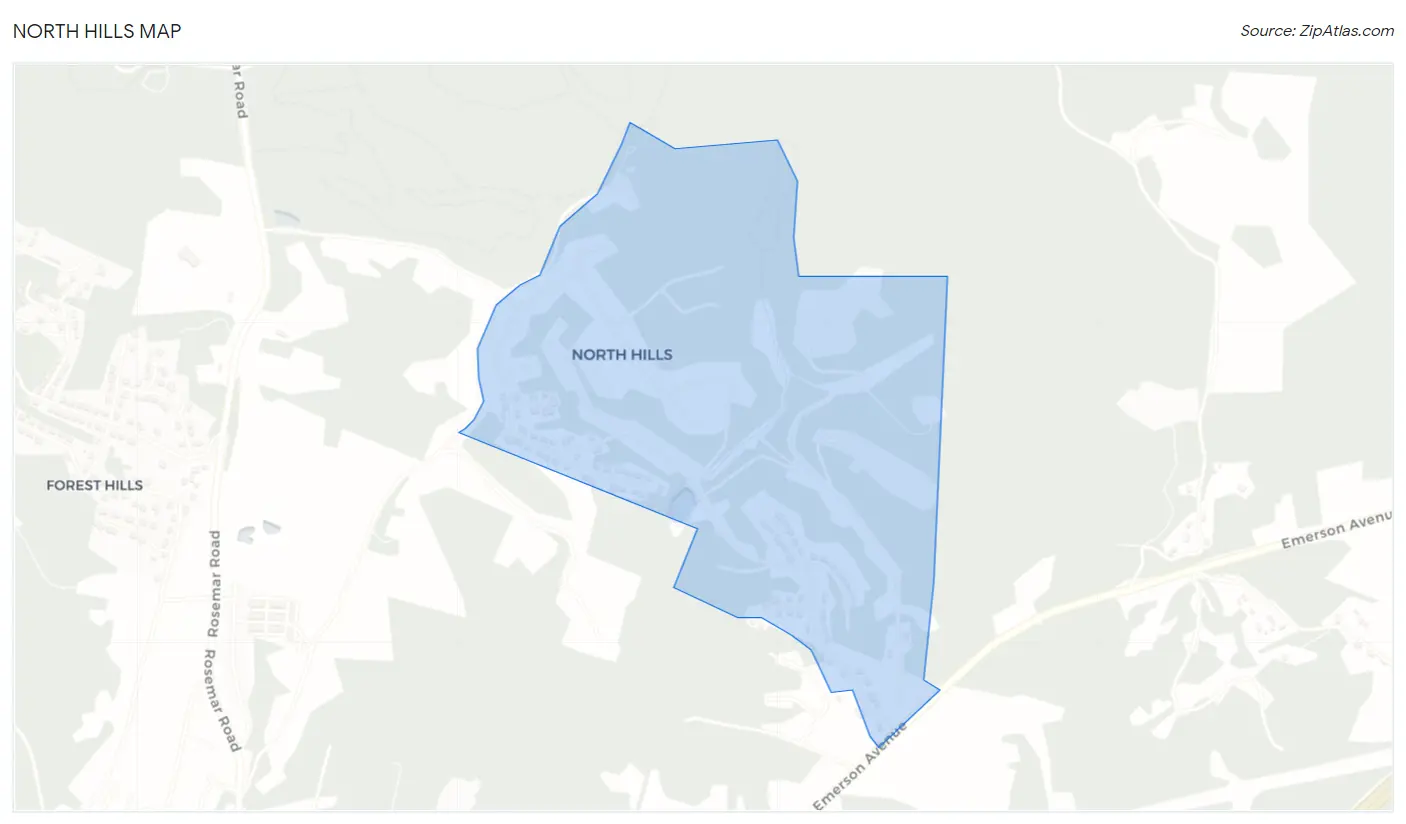
North Hills Map
North Hills Overview
$47,980
PER CAPITA INCOME
$138,929
AVG FAMILY INCOME
$137,875
AVG HOUSEHOLD INCOME
47.4%
WAGE / INCOME GAP [ % ]
52.6¢/ $1
WAGE / INCOME GAP [ $ ]
0.37
INEQUALITY / GINI INDEX
991
TOTAL POPULATION
532
MALE POPULATION
459
FEMALE POPULATION
115.90
MALES / 100 FEMALES
86.28
FEMALES / 100 MALES
37.4
MEDIAN AGE
3.4
AVG FAMILY SIZE
3.2
AVG HOUSEHOLD SIZE
389
LABOR FORCE [ PEOPLE ]
58.4%
PERCENT IN LABOR FORCE
5.1%
UNEMPLOYMENT RATE
Income in North Hills
Income Overview in North Hills
Per Capita Income in North Hills is $47,980, while median incomes of families and households are $138,929 and $137,875 respectively.
| Characteristic | Number | Measure |
| Per Capita Income | 991 | $47,980 |
| Median Family Income | 264 | $138,929 |
| Mean Family Income | 264 | $152,377 |
| Median Household Income | 309 | $137,875 |
| Mean Household Income | 309 | $148,914 |
| Income Deficit | 264 | $0 |
| Wage / Income Gap (%) | 991 | 47.41% |
| Wage / Income Gap ($) | 991 | 52.59¢ per $1 |
| Gini / Inequality Index | 991 | 0.37 |
Earnings by Sex in North Hills
Average Earnings in North Hills are $44,667, $56,250 for men and $29,583 for women, a difference of 47.4%.
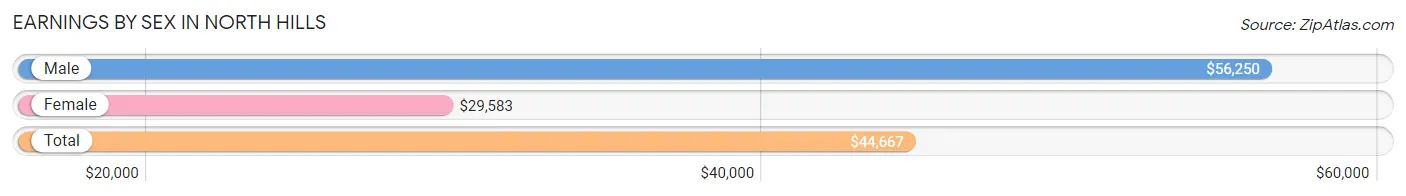
| Sex | Number | Average Earnings |
| Male | 254 (59.9%) | $56,250 |
| Female | 170 (40.1%) | $29,583 |
| Total | 424 (100.0%) | $44,667 |
Earnings by Sex by Income Bracket in North Hills
The most common earnings brackets in North Hills are $100,000+ for men (79 | 31.1%) and $25,000 to $29,999 for women (35 | 20.6%).
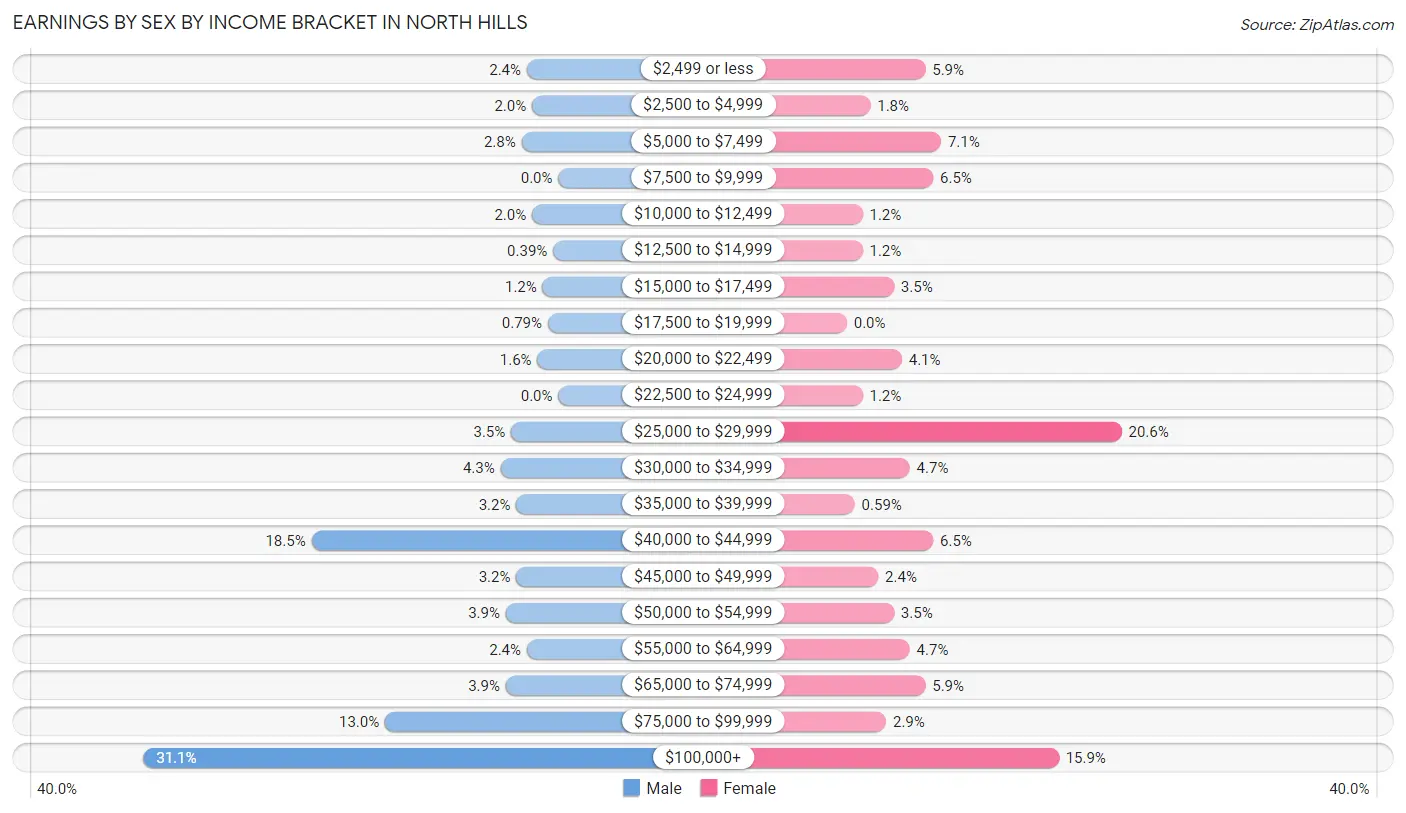
| Income | Male | Female |
| $2,499 or less | 6 (2.4%) | 10 (5.9%) |
| $2,500 to $4,999 | 5 (2.0%) | 3 (1.8%) |
| $5,000 to $7,499 | 7 (2.8%) | 12 (7.1%) |
| $7,500 to $9,999 | 0 (0.0%) | 11 (6.5%) |
| $10,000 to $12,499 | 5 (2.0%) | 2 (1.2%) |
| $12,500 to $14,999 | 1 (0.4%) | 2 (1.2%) |
| $15,000 to $17,499 | 3 (1.2%) | 6 (3.5%) |
| $17,500 to $19,999 | 2 (0.8%) | 0 (0.0%) |
| $20,000 to $22,499 | 4 (1.6%) | 7 (4.1%) |
| $22,500 to $24,999 | 0 (0.0%) | 2 (1.2%) |
| $25,000 to $29,999 | 9 (3.5%) | 35 (20.6%) |
| $30,000 to $34,999 | 11 (4.3%) | 8 (4.7%) |
| $35,000 to $39,999 | 8 (3.2%) | 1 (0.6%) |
| $40,000 to $44,999 | 47 (18.5%) | 11 (6.5%) |
| $45,000 to $49,999 | 8 (3.2%) | 4 (2.4%) |
| $50,000 to $54,999 | 10 (3.9%) | 6 (3.5%) |
| $55,000 to $64,999 | 6 (2.4%) | 8 (4.7%) |
| $65,000 to $74,999 | 10 (3.9%) | 10 (5.9%) |
| $75,000 to $99,999 | 33 (13.0%) | 5 (2.9%) |
| $100,000+ | 79 (31.1%) | 27 (15.9%) |
| Total | 254 (100.0%) | 170 (100.0%) |
Earnings by Sex by Educational Attainment in North Hills
Average earnings in North Hills are $91,250 for men and $33,750 for women, a difference of 63.0%. Men with an educational attainment of bachelor's degree enjoy the highest average annual earnings of $108,750, while those with college or associate's degree education earn the least with $36,667. Women with an educational attainment of graduate degree earn the most with the average annual earnings of $65,750, while those with college or associate's degree education have the smallest earnings of $29,300.
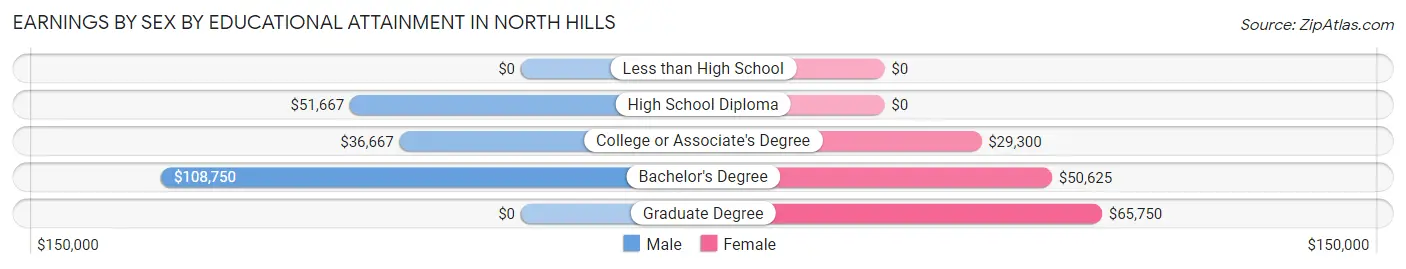
| Educational Attainment | Male Income | Female Income |
| Less than High School | - | - |
| High School Diploma | $51,667 | $0 |
| College or Associate's Degree | $36,667 | $29,300 |
| Bachelor's Degree | $108,750 | $50,625 |
| Graduate Degree | - | - |
| Total | $91,250 | $33,750 |
Family Income in North Hills
Family Income Brackets in North Hills
According to the North Hills family income data, there are 76 families falling into the $100,000 to $149,999 income range, which is the most common income bracket and makes up 28.8% of all families.
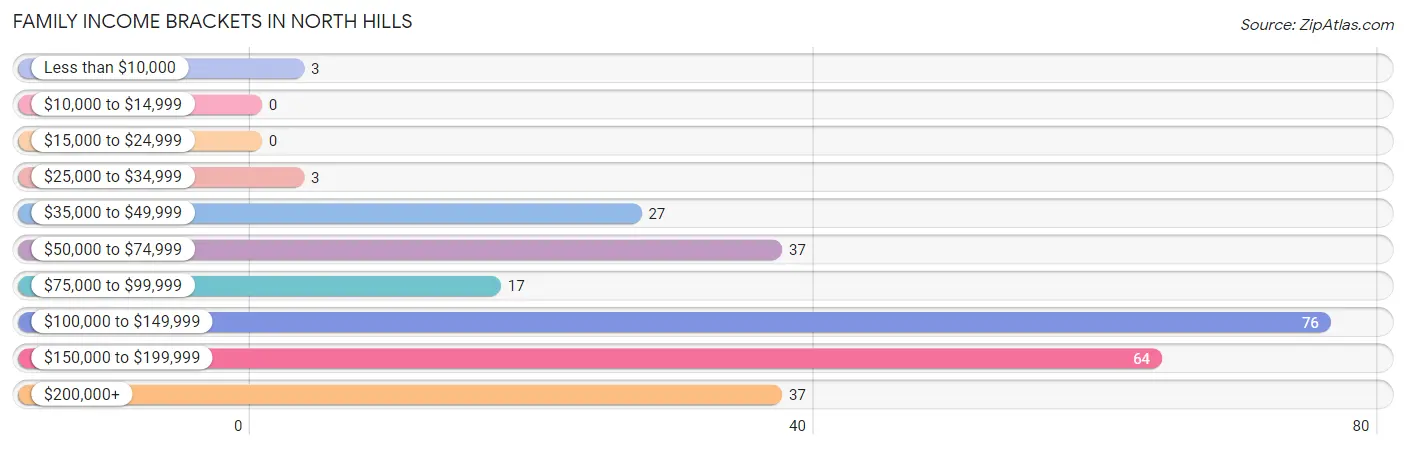
| Income Bracket | # Families | % Families |
| Less than $10,000 | 3 | 1.1% |
| $10,000 to $14,999 | 0 | 0.0% |
| $15,000 to $24,999 | 0 | 0.0% |
| $25,000 to $34,999 | 3 | 1.1% |
| $35,000 to $49,999 | 27 | 10.2% |
| $50,000 to $74,999 | 37 | 14.0% |
| $75,000 to $99,999 | 17 | 6.4% |
| $100,000 to $149,999 | 76 | 28.8% |
| $150,000 to $199,999 | 64 | 24.2% |
| $200,000+ | 37 | 14.0% |
Family Income by Famaliy Size in North Hills
5-person families (31 | 11.7%) account for the highest median family income in North Hills with $158,250 per family, while 2-person families (114 | 43.2%) have the highest median income of $61,250 per family member.
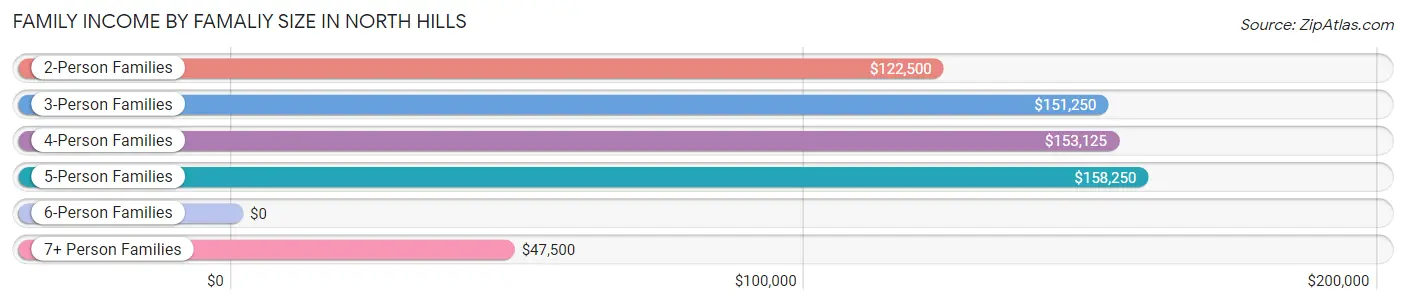
| Income Bracket | # Families | Median Income |
| 2-Person Families | 114 (43.2%) | $122,500 |
| 3-Person Families | 46 (17.4%) | $151,250 |
| 4-Person Families | 39 (14.8%) | $153,125 |
| 5-Person Families | 31 (11.7%) | $158,250 |
| 6-Person Families | 26 (9.9%) | $0 |
| 7+ Person Families | 8 (3.0%) | $47,500 |
| Total | 264 (100.0%) | $138,929 |
Family Income by Number of Earners in North Hills
The median family income in North Hills is $138,929, with families comprising 3+ earners (12) having the highest median family income of $171,250, while families with 2 earners (118) have the lowest median family income of $128,750, accounting for 4.5% and 44.7% of families, respectively.
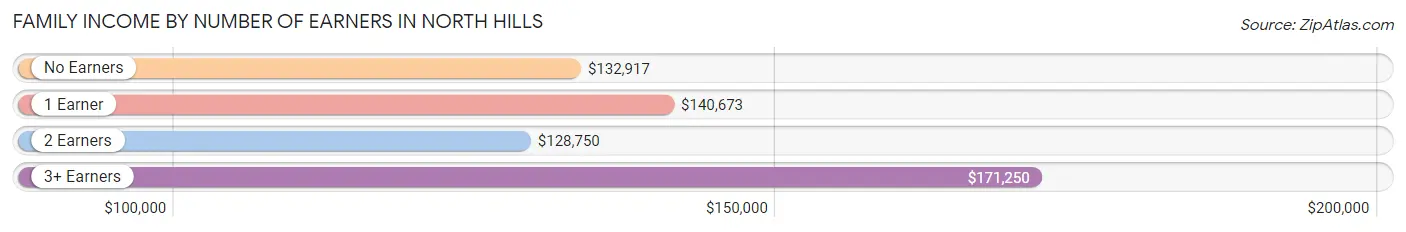
| Number of Earners | # Families | Median Income |
| No Earners | 37 (14.0%) | $132,917 |
| 1 Earner | 97 (36.7%) | $140,673 |
| 2 Earners | 118 (44.7%) | $128,750 |
| 3+ Earners | 12 (4.5%) | $171,250 |
| Total | 264 (100.0%) | $138,929 |
Household Income in North Hills
Household Income Brackets in North Hills
With 87 households falling in the category, the $100,000 to $149,999 income range is the most frequent in North Hills, accounting for 28.2% of all households.
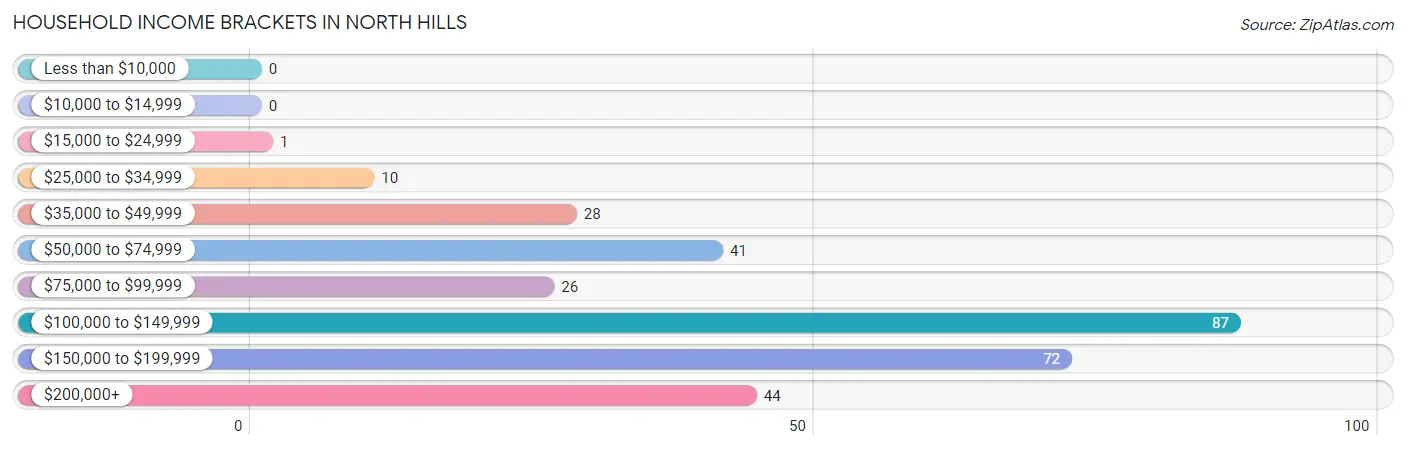
| Income Bracket | # Households | % Households |
| Less than $10,000 | 0 | 0.0% |
| $10,000 to $14,999 | 0 | 0.0% |
| $15,000 to $24,999 | 1 | 0.3% |
| $25,000 to $34,999 | 10 | 3.2% |
| $35,000 to $49,999 | 28 | 9.1% |
| $50,000 to $74,999 | 41 | 13.3% |
| $75,000 to $99,999 | 26 | 8.4% |
| $100,000 to $149,999 | 87 | 28.2% |
| $150,000 to $199,999 | 72 | 23.3% |
| $200,000+ | 44 | 14.2% |
Household Income by Householder Age in North Hills
The median household income in North Hills is $137,875, with the highest median household income of $146,667 found in the 25 to 44 years age bracket for the primary householder. A total of 94 households (30.4%) fall into this category.
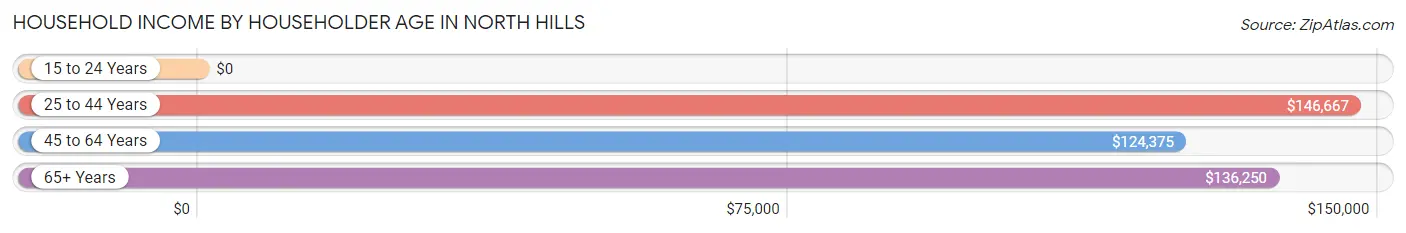
| Income Bracket | # Households | Median Income |
| 15 to 24 Years | 0 (0.0%) | $0 |
| 25 to 44 Years | 94 (30.4%) | $146,667 |
| 45 to 64 Years | 105 (34.0%) | $124,375 |
| 65+ Years | 110 (35.6%) | $136,250 |
| Total | 309 (100.0%) | $137,875 |
Poverty in North Hills
Income Below Poverty by Sex and Age in North Hills
With 9.5% poverty level for males and 11.1% for females among the residents of North Hills, under 5 year old males and under 5 year old females are the most vulnerable to poverty, with 13 males (44.8%) and 11 females (42.3%) in their respective age groups living below the poverty level.
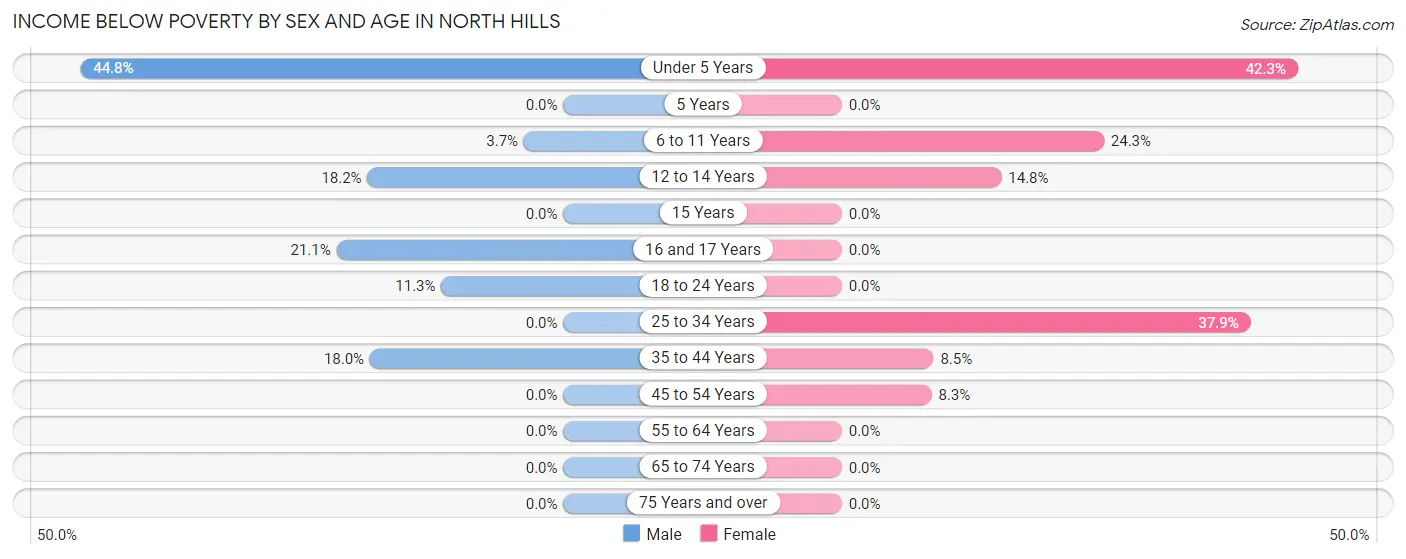
| Age Bracket | Male | Female |
| Under 5 Years | 13 (44.8%) | 11 (42.3%) |
| 5 Years | 0 (0.0%) | 0 (0.0%) |
| 6 to 11 Years | 3 (3.7%) | 18 (24.3%) |
| 12 to 14 Years | 10 (18.2%) | 4 (14.8%) |
| 15 Years | 0 (0.0%) | 0 (0.0%) |
| 16 and 17 Years | 4 (21.0%) | 0 (0.0%) |
| 18 to 24 Years | 6 (11.3%) | 0 (0.0%) |
| 25 to 34 Years | 0 (0.0%) | 11 (37.9%) |
| 35 to 44 Years | 14 (17.9%) | 4 (8.5%) |
| 45 to 54 Years | 0 (0.0%) | 3 (8.3%) |
| 55 to 64 Years | 0 (0.0%) | 0 (0.0%) |
| 65 to 74 Years | 0 (0.0%) | 0 (0.0%) |
| 75 Years and over | 0 (0.0%) | 0 (0.0%) |
| Total | 50 (9.5%) | 51 (11.1%) |
Income Above Poverty by Sex and Age in North Hills
According to the poverty statistics in North Hills, males aged 5 years and females aged 5 years are the age groups that are most secure financially, with 100.0% of males and 100.0% of females in these age groups living above the poverty line.
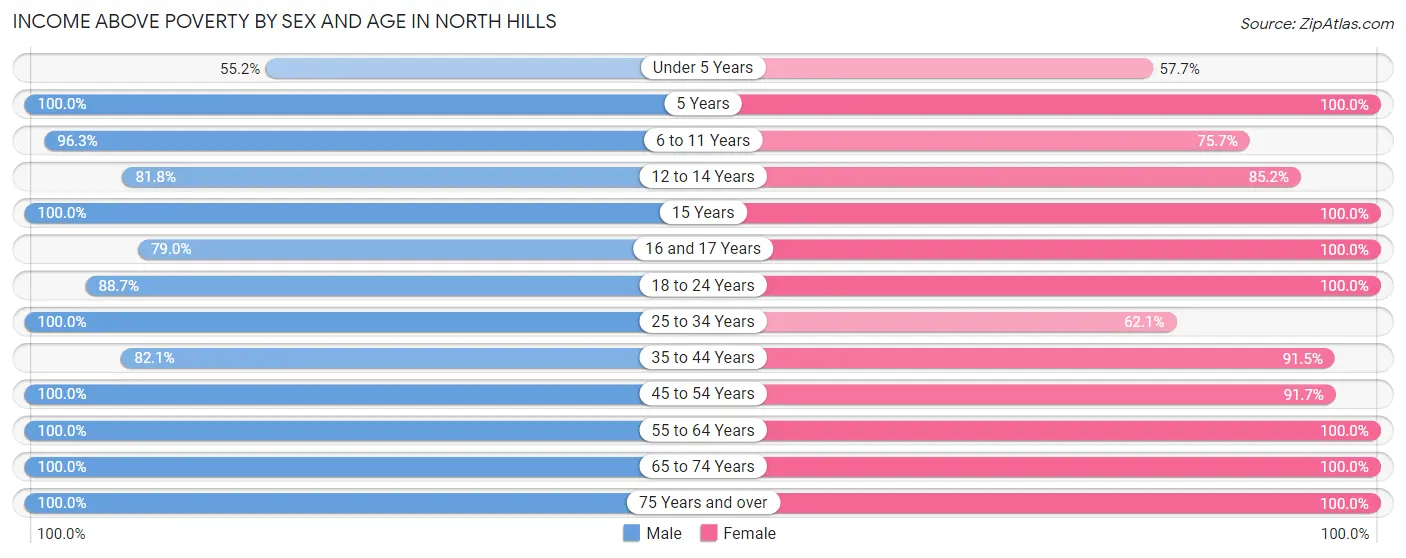
| Age Bracket | Male | Female |
| Under 5 Years | 16 (55.2%) | 15 (57.7%) |
| 5 Years | 16 (100.0%) | 6 (100.0%) |
| 6 to 11 Years | 79 (96.3%) | 56 (75.7%) |
| 12 to 14 Years | 45 (81.8%) | 23 (85.2%) |
| 15 Years | 4 (100.0%) | 2 (100.0%) |
| 16 and 17 Years | 15 (78.9%) | 10 (100.0%) |
| 18 to 24 Years | 47 (88.7%) | 19 (100.0%) |
| 25 to 34 Years | 25 (100.0%) | 18 (62.1%) |
| 35 to 44 Years | 64 (82.1%) | 43 (91.5%) |
| 45 to 54 Years | 33 (100.0%) | 33 (91.7%) |
| 55 to 64 Years | 48 (100.0%) | 71 (100.0%) |
| 65 to 74 Years | 39 (100.0%) | 75 (100.0%) |
| 75 Years and over | 47 (100.0%) | 37 (100.0%) |
| Total | 478 (90.5%) | 408 (88.9%) |
Income Below Poverty Among Married-Couple Families in North Hills
The poverty statistics for married-couple families in North Hills show that 6.7% or 15 of the total 223 families live below the poverty line. Families with 3 or 4 children have the highest poverty rate of 25.0%, comprising of 15 families. On the other hand, families with no children have the lowest poverty rate of 0.0%, which includes 0 families.
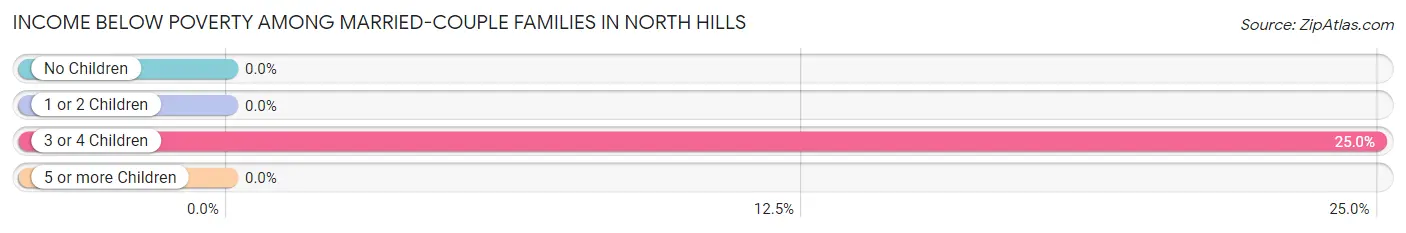
| Children | Above Poverty | Below Poverty |
| No Children | 115 (100.0%) | 0 (0.0%) |
| 1 or 2 Children | 46 (100.0%) | 0 (0.0%) |
| 3 or 4 Children | 45 (75.0%) | 15 (25.0%) |
| 5 or more Children | 2 (100.0%) | 0 (0.0%) |
| Total | 208 (93.3%) | 15 (6.7%) |
Income Below Poverty Among Single-Parent Households in North Hills
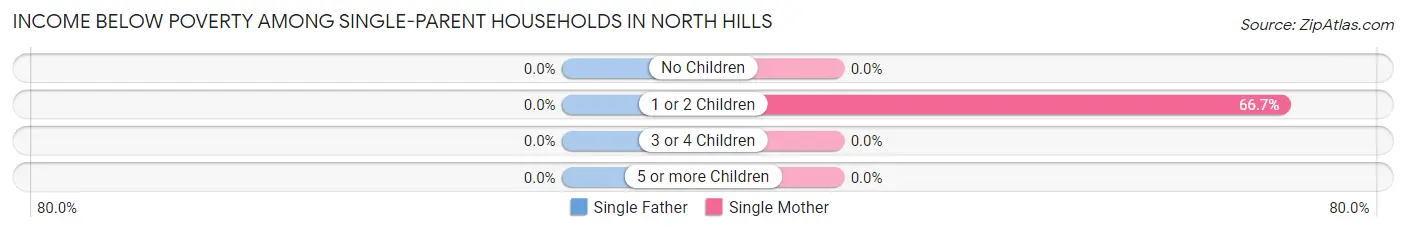
| Children | Single Father | Single Mother |
| No Children | 0 (0.0%) | 0 (0.0%) |
| 1 or 2 Children | 0 (0.0%) | 6 (66.7%) |
| 3 or 4 Children | 0 (0.0%) | 0 (0.0%) |
| 5 or more Children | 0 (0.0%) | 0 (0.0%) |
| Total | 0 (0.0%) | 6 (15.0%) |
Income Below Poverty Among Married-Couple vs Single-Parent Households in North Hills
The poverty data for North Hills shows that 15 of the married-couple family households (6.7%) and 6 of the single-parent households (14.6%) are living below the poverty level. Within the married-couple family households, those with 3 or 4 children have the highest poverty rate, with 15 households (25.0%) falling below the poverty line. Among the single-parent households, those with 1 or 2 children have the highest poverty rate, with 6 household (66.7%) living below poverty.
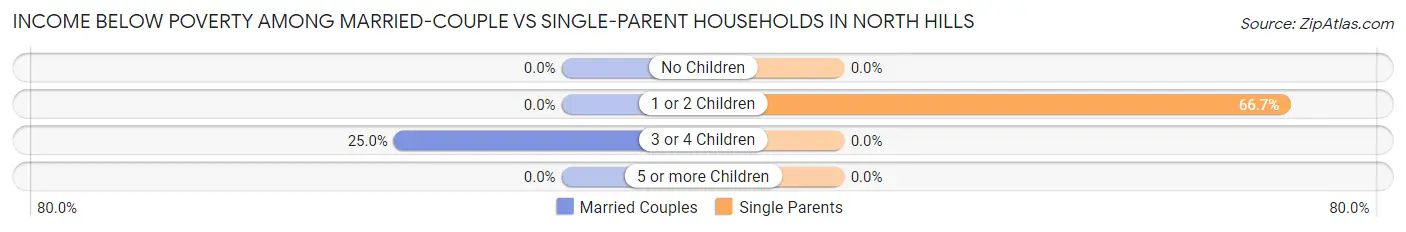
| Children | Married-Couple Families | Single-Parent Households |
| No Children | 0 (0.0%) | 0 (0.0%) |
| 1 or 2 Children | 0 (0.0%) | 6 (66.7%) |
| 3 or 4 Children | 15 (25.0%) | 0 (0.0%) |
| 5 or more Children | 0 (0.0%) | 0 (0.0%) |
| Total | 15 (6.7%) | 6 (14.6%) |
Race in North Hills
The most populous races in North Hills are White / Caucasian (942 | 95.1%), Hispanic or Latino (29 | 2.9%), and Two or more Races (26 | 2.6%).
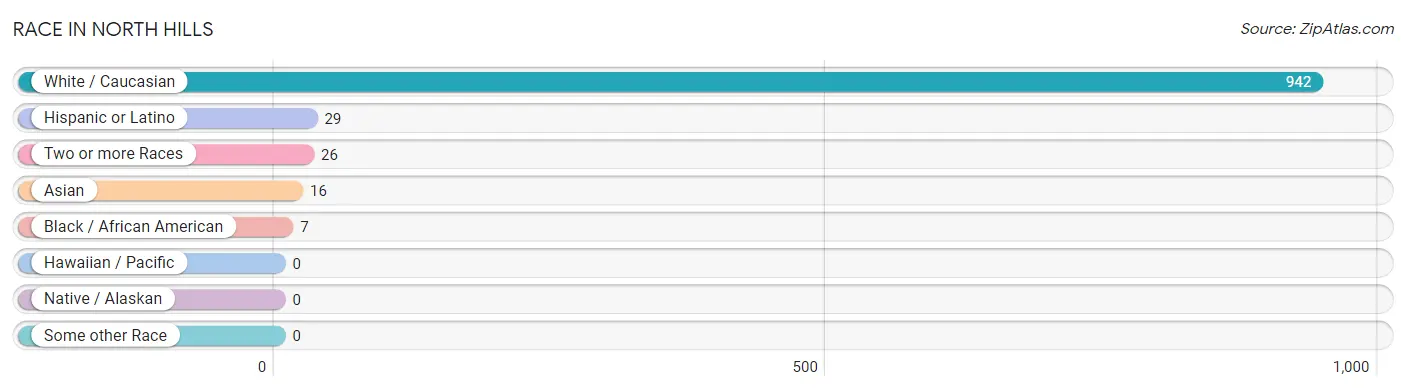
| Race | # Population | % Population |
| Asian | 16 | 1.6% |
| Black / African American | 7 | 0.7% |
| Hawaiian / Pacific | 0 | 0.0% |
| Hispanic or Latino | 29 | 2.9% |
| Native / Alaskan | 0 | 0.0% |
| White / Caucasian | 942 | 95.1% |
| Two or more Races | 26 | 2.6% |
| Some other Race | 0 | 0.0% |
| Total | 991 | 100.0% |
Ancestry in North Hills
The most populous ancestries reported in North Hills are German (171 | 17.3%), English (124 | 12.5%), American (104 | 10.5%), Irish (69 | 7.0%), and Danish (64 | 6.5%), together accounting for 53.7% of all North Hills residents.
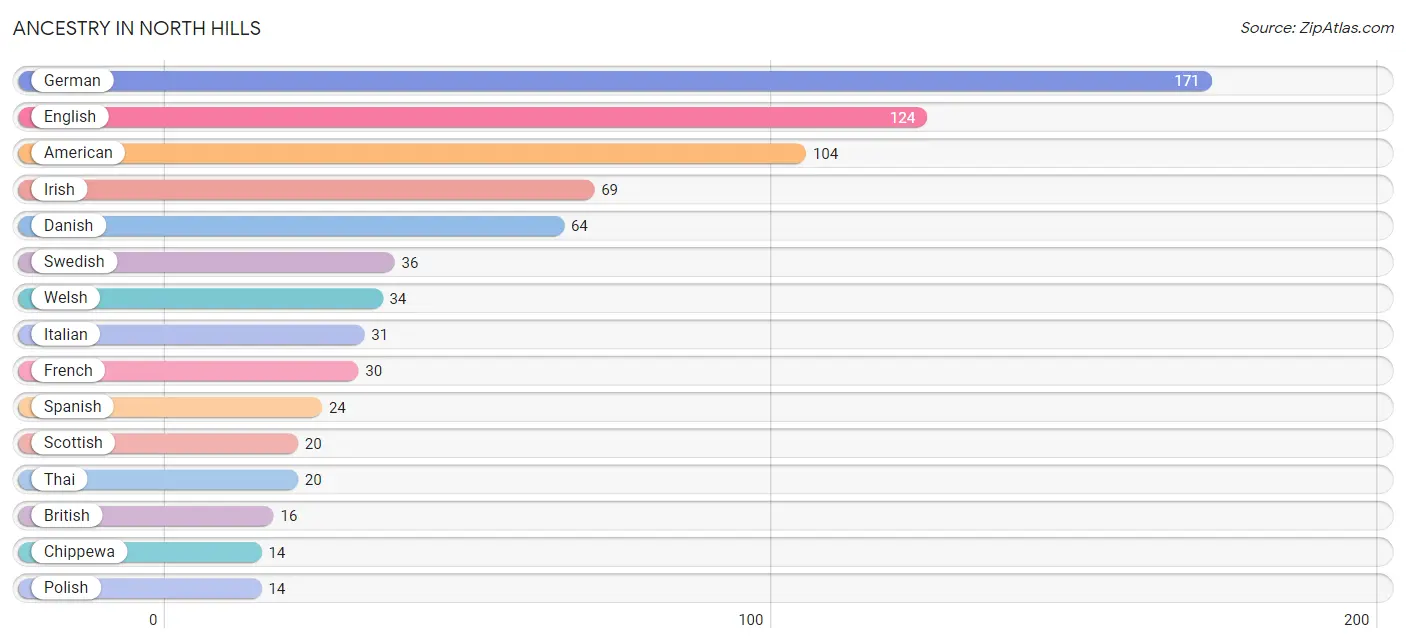
| Ancestry | # Population | % Population |
| American | 104 | 10.5% |
| Bhutanese | 2 | 0.2% |
| Bolivian | 2 | 0.2% |
| British | 16 | 1.6% |
| Chippewa | 14 | 1.4% |
| Czech | 1 | 0.1% |
| Danish | 64 | 6.5% |
| Dutch | 3 | 0.3% |
| Eastern European | 2 | 0.2% |
| English | 124 | 12.5% |
| European | 6 | 0.6% |
| French | 30 | 3.0% |
| German | 171 | 17.3% |
| Irish | 69 | 7.0% |
| Italian | 31 | 3.1% |
| Korean | 2 | 0.2% |
| Mexican | 3 | 0.3% |
| Norwegian | 10 | 1.0% |
| Polish | 14 | 1.4% |
| Scandinavian | 6 | 0.6% |
| Scotch-Irish | 14 | 1.4% |
| Scottish | 20 | 2.0% |
| South American | 2 | 0.2% |
| Spanish | 24 | 2.4% |
| Swedish | 36 | 3.6% |
| Swiss | 10 | 1.0% |
| Thai | 20 | 2.0% |
| Welsh | 34 | 3.4% | View All 28 Rows |
Immigrants in North Hills
The most numerous immigrant groups reported in North Hills came from Asia (14 | 1.4%), India (14 | 1.4%), South Central Asia (14 | 1.4%), Central America (4 | 0.4%), and Latin America (4 | 0.4%), together accounting for 5.0% of all North Hills residents.
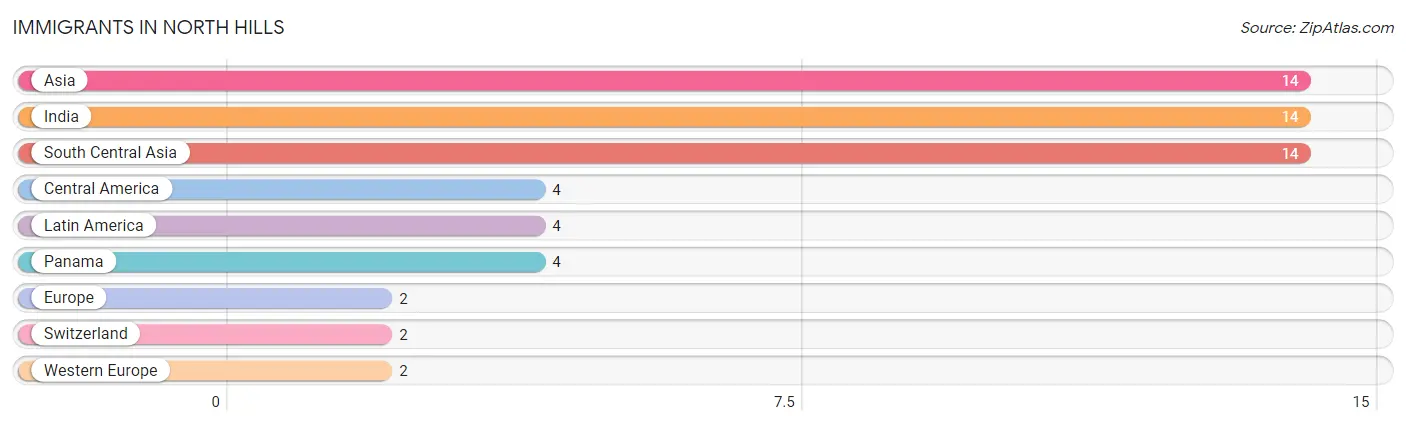
| Immigration Origin | # Population | % Population |
| Asia | 14 | 1.4% |
| Central America | 4 | 0.4% |
| Europe | 2 | 0.2% |
| India | 14 | 1.4% |
| Latin America | 4 | 0.4% |
| Panama | 4 | 0.4% |
| South Central Asia | 14 | 1.4% |
| Switzerland | 2 | 0.2% |
| Western Europe | 2 | 0.2% | View All 9 Rows |
Sex and Age in North Hills
Sex and Age in North Hills
The most populous age groups in North Hills are 10 to 14 Years (96 | 18.0%) for men and 10 to 14 Years (63 | 13.7%) for women.
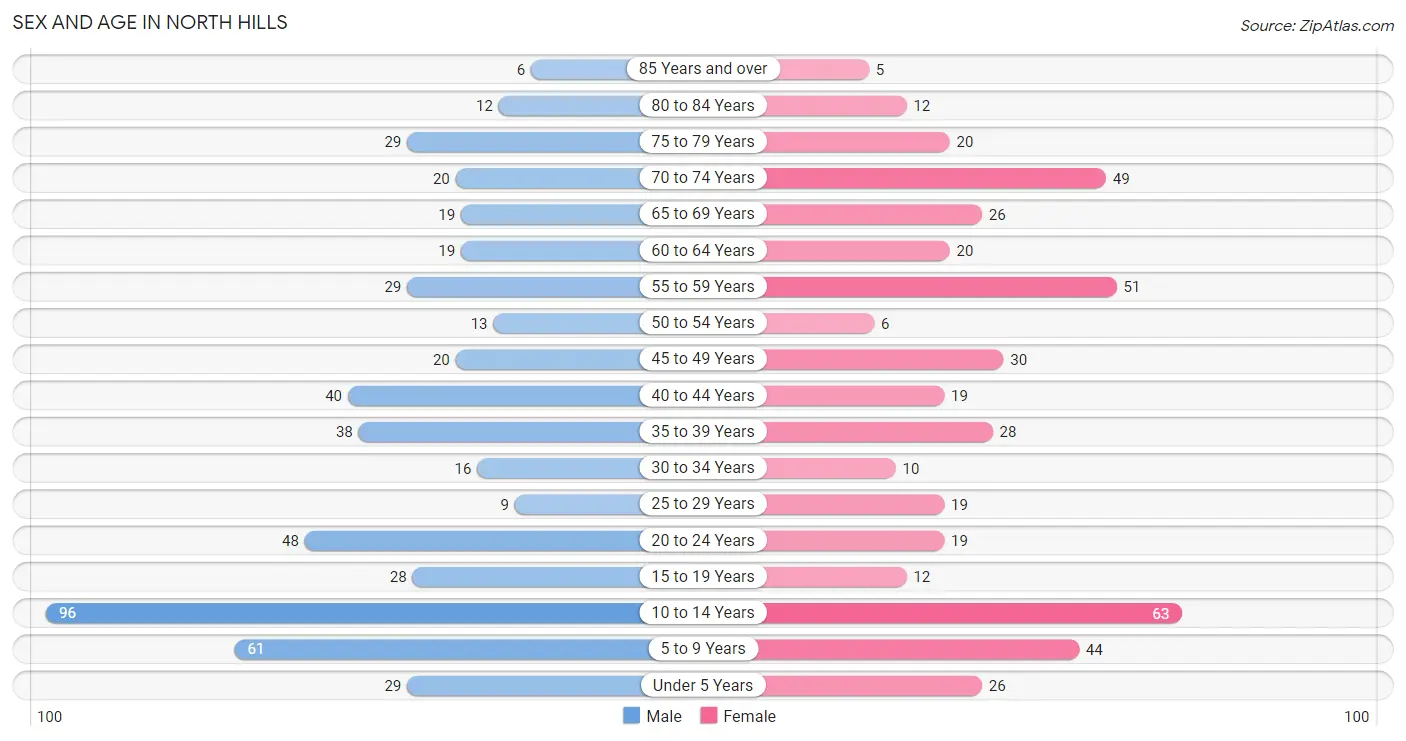
| Age Bracket | Male | Female |
| Under 5 Years | 29 (5.4%) | 26 (5.7%) |
| 5 to 9 Years | 61 (11.5%) | 44 (9.6%) |
| 10 to 14 Years | 96 (18.0%) | 63 (13.7%) |
| 15 to 19 Years | 28 (5.3%) | 12 (2.6%) |
| 20 to 24 Years | 48 (9.0%) | 19 (4.1%) |
| 25 to 29 Years | 9 (1.7%) | 19 (4.1%) |
| 30 to 34 Years | 16 (3.0%) | 10 (2.2%) |
| 35 to 39 Years | 38 (7.1%) | 28 (6.1%) |
| 40 to 44 Years | 40 (7.5%) | 19 (4.1%) |
| 45 to 49 Years | 20 (3.8%) | 30 (6.5%) |
| 50 to 54 Years | 13 (2.4%) | 6 (1.3%) |
| 55 to 59 Years | 29 (5.4%) | 51 (11.1%) |
| 60 to 64 Years | 19 (3.6%) | 20 (4.4%) |
| 65 to 69 Years | 19 (3.6%) | 26 (5.7%) |
| 70 to 74 Years | 20 (3.8%) | 49 (10.7%) |
| 75 to 79 Years | 29 (5.4%) | 20 (4.4%) |
| 80 to 84 Years | 12 (2.3%) | 12 (2.6%) |
| 85 Years and over | 6 (1.1%) | 5 (1.1%) |
| Total | 532 (100.0%) | 459 (100.0%) |
Families and Households in North Hills
Median Family Size in North Hills
The median family size in North Hills is 3.44 persons per family, with married-couple families (223 | 84.5%) accounting for the largest median family size of 3.55 persons per family. On the other hand, single female/mother families (40 | 15.1%) represent the smallest median family size with 2.85 persons per family.
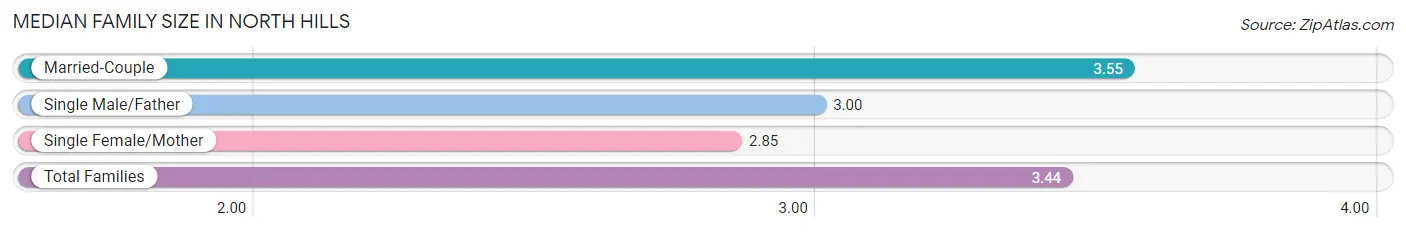
| Family Type | # Families | Family Size |
| Married-Couple | 223 (84.5%) | 3.55 |
| Single Male/Father | 1 (0.4%) | 3.00 |
| Single Female/Mother | 40 (15.1%) | 2.85 |
| Total Families | 264 (100.0%) | 3.44 |
Median Household Size in North Hills
The median household size in North Hills is 3.21 persons per household, with single male/father households (1 | 0.3%) accounting for the largest median household size of 8 persons per household. non-family households (45 | 14.6%) represent the smallest median household size with 1.31 persons per household.
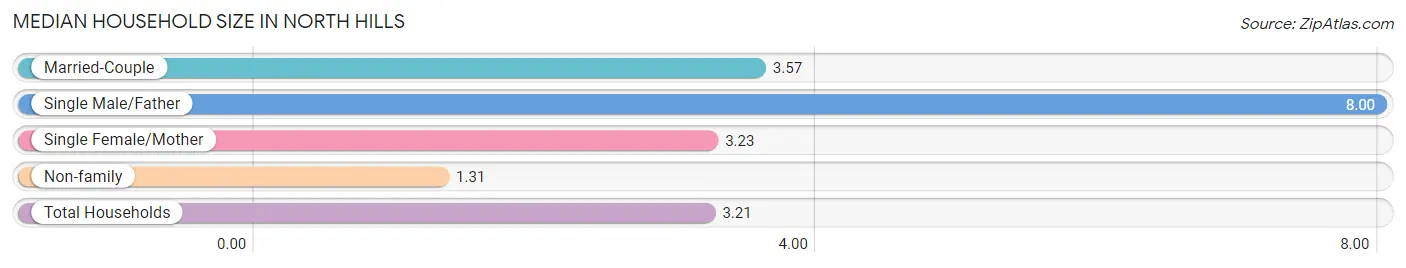
| Household Type | # Households | Household Size |
| Married-Couple | 223 (72.2%) | 3.57 |
| Single Male/Father | 1 (0.3%) | 8.00 |
| Single Female/Mother | 40 (12.9%) | 3.23 |
| Non-family | 45 (14.6%) | 1.31 |
| Total Households | 309 (100.0%) | 3.21 |
Household Size by Marriage Status in North Hills
Out of a total of 309 households in North Hills, 264 (85.4%) are family households, while 45 (14.6%) are nonfamily households. The most numerous type of family households are 2-person households, comprising 113, and the most common type of nonfamily households are 1-person households, comprising 35.
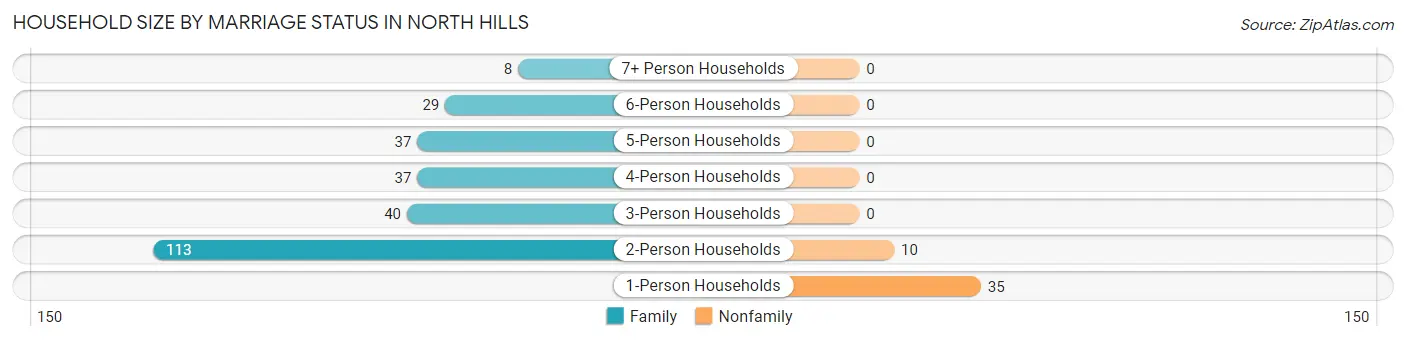
| Household Size | Family Households | Nonfamily Households |
| 1-Person Households | - | 35 (11.3%) |
| 2-Person Households | 113 (36.6%) | 10 (3.2%) |
| 3-Person Households | 40 (12.9%) | 0 (0.0%) |
| 4-Person Households | 37 (12.0%) | 0 (0.0%) |
| 5-Person Households | 37 (12.0%) | 0 (0.0%) |
| 6-Person Households | 29 (9.4%) | 0 (0.0%) |
| 7+ Person Households | 8 (2.6%) | 0 (0.0%) |
| Total | 264 (85.4%) | 45 (14.6%) |
Female Fertility in North Hills
Fertility by Age in North Hills
Average fertility rate in North Hills is 15.0 births per 1,000 women. Women in the age bracket of 20 to 34 years have the highest fertility rate with 42.0 births per 1,000 women. Women in the age bracket of 20 to 34 years acount for 100.0% of all women with births.
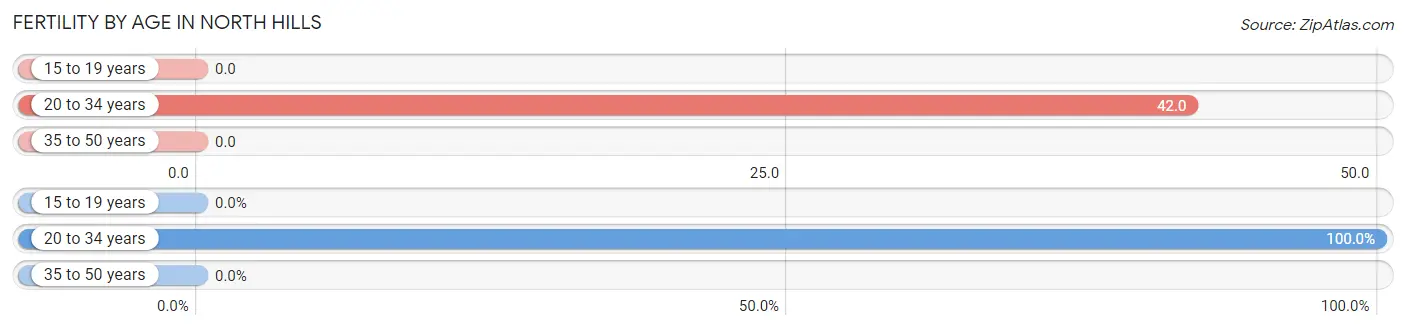
| Age Bracket | Women with Births | Births / 1,000 Women |
| 15 to 19 years | 0 (0.0%) | 0.0 |
| 20 to 34 years | 2 (100.0%) | 42.0 |
| 35 to 50 years | 0 (0.0%) | 0.0 |
| Total | 2 (100.0%) | 15.0 |
Fertility by Age by Marriage Status in North Hills
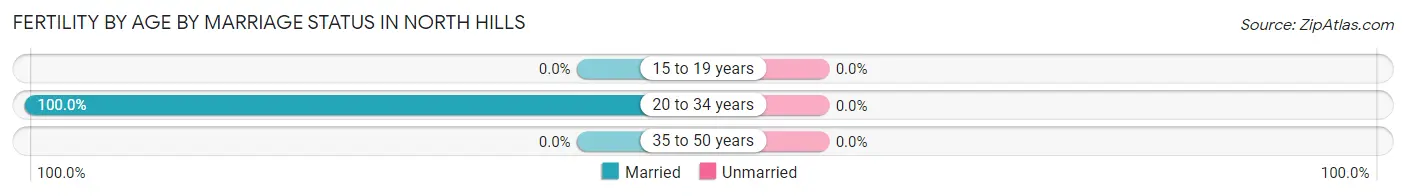
| Age Bracket | Married | Unmarried |
| 15 to 19 years | 0 (0.0%) | 0 (0.0%) |
| 20 to 34 years | 2 (100.0%) | 0 (0.0%) |
| 35 to 50 years | 0 (0.0%) | 0 (0.0%) |
| Total | 2 (100.0%) | 0 (0.0%) |
Fertility by Education in North Hills
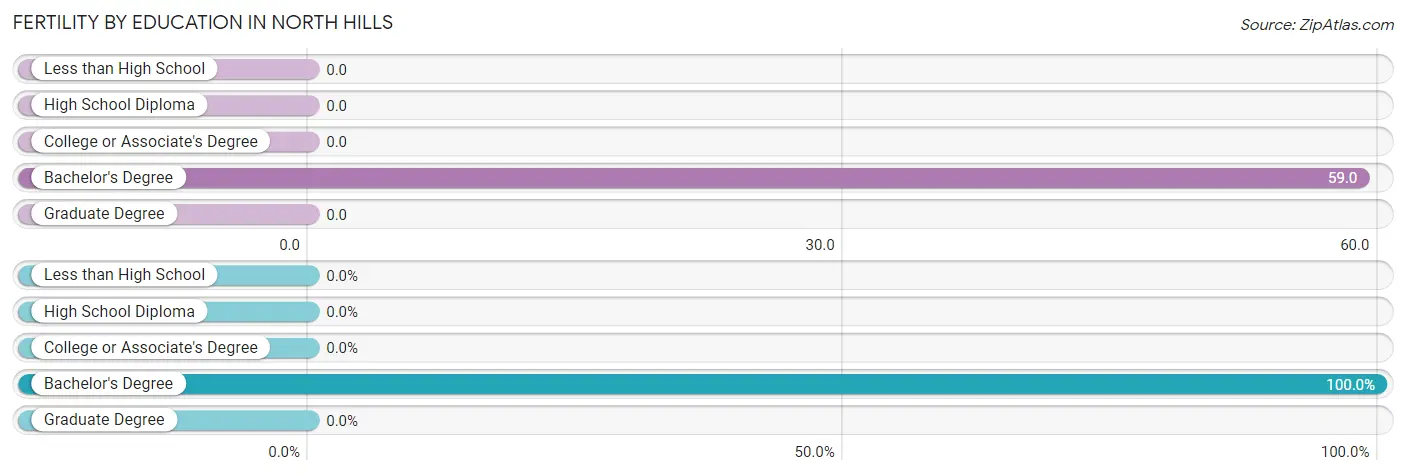
| Educational Attainment | Women with Births | Births / 1,000 Women |
| Less than High School | 0 (0.0%) | 0.0 |
| High School Diploma | 0 (0.0%) | 0.0 |
| College or Associate's Degree | 0 (0.0%) | 0.0 |
| Bachelor's Degree | 2 (100.0%) | 59.0 |
| Graduate Degree | 0 (0.0%) | 0.0 |
| Total | 2 (100.0%) | 15.0 |
Fertility by Education by Marriage Status in North Hills
| Educational Attainment | Married | Unmarried |
| Less than High School | 0 (0.0%) | 0 (0.0%) |
| High School Diploma | 0 (0.0%) | 0 (0.0%) |
| College or Associate's Degree | 0 (0.0%) | 0 (0.0%) |
| Bachelor's Degree | 2 (100.0%) | 0 (0.0%) |
| Graduate Degree | 0 (0.0%) | 0 (0.0%) |
| Total | 2 (100.0%) | 0 (0.0%) |
Employment Characteristics in North Hills
Employment by Class of Employer in North Hills
Among the 339 employed individuals in North Hills, private company employees (200 | 59.0%), not-for-profit organizations (64 | 18.9%), and federal government employees (23 | 6.8%) make up the most common classes of employment.
| Employer Class | # Employees | % Employees |
| Private Company Employees | 200 | 59.0% |
| Self-Employed (Incorporated) | 8 | 2.4% |
| Self-Employed (Not Incorporated) | 14 | 4.1% |
| Not-for-profit Organizations | 64 | 18.9% |
| Local Government Employees | 13 | 3.8% |
| State Government Employees | 17 | 5.0% |
| Federal Government Employees | 23 | 6.8% |
| Unpaid Family Workers | 0 | 0.0% |
| Total | 339 | 100.0% |
Employment Status by Age in North Hills
According to the labor force statistics for North Hills, out of the total population over 16 years of age (666), 58.4% or 389 individuals are in the labor force, with 5.1% or 20 of them unemployed. The age group with the highest labor force participation rate is 35 to 44 years, with 90.4% or 113 individuals in the labor force. Within the labor force, the 30 to 34 years age range has the highest percentage of unemployed individuals, with 26.1% or 6 of them being unemployed.
| Age Bracket | In Labor Force | Unemployed |
| 16 to 19 Years | 4 (11.8%) | 0 (0.0%) |
| 20 to 24 Years | 55 (82.1%) | 0 (0.0%) |
| 25 to 29 Years | 23 (82.1%) | 0 (0.0%) |
| 30 to 34 Years | 23 (88.5%) | 6 (26.1%) |
| 35 to 44 Years | 113 (90.4%) | 13 (11.5%) |
| 45 to 54 Years | 54 (78.3%) | 1 (1.9%) |
| 55 to 59 Years | 67 (83.8%) | 0 (0.0%) |
| 60 to 64 Years | 11 (28.2%) | 0 (0.0%) |
| 65 to 74 Years | 24 (21.1%) | 0 (0.0%) |
| 75 Years and over | 15 (17.9%) | 0 (0.0%) |
| Total | 389 (58.4%) | 20 (5.1%) |
Employment Status by Educational Attainment in North Hills
According to labor force statistics for North Hills, 79.3% of individuals (291) out of the total population between 25 and 64 years of age (367) are in the labor force, with 6.9% or 20 of them being unemployed. The group with the highest labor force participation rate are those with the educational attainment of bachelor's degree or higher, with 83.0% or 176 individuals in the labor force. Within the labor force, individuals with high school diploma education have the highest percentage of unemployment, with 20.7% or 6 of them being unemployed.
| Educational Attainment | In Labor Force | Unemployed |
| Less than High School | 6 (60.0%) | 0 (0.0%) |
| High School Diploma | 29 (63.0%) | 10 (20.7%) |
| College / Associate Degree | 80 (80.8%) | 14 (13.8%) |
| Bachelor's Degree or higher | 176 (83.0%) | 4 (1.7%) |
| Total | 291 (79.3%) | 25 (6.9%) |
Employment Occupations by Sex in North Hills
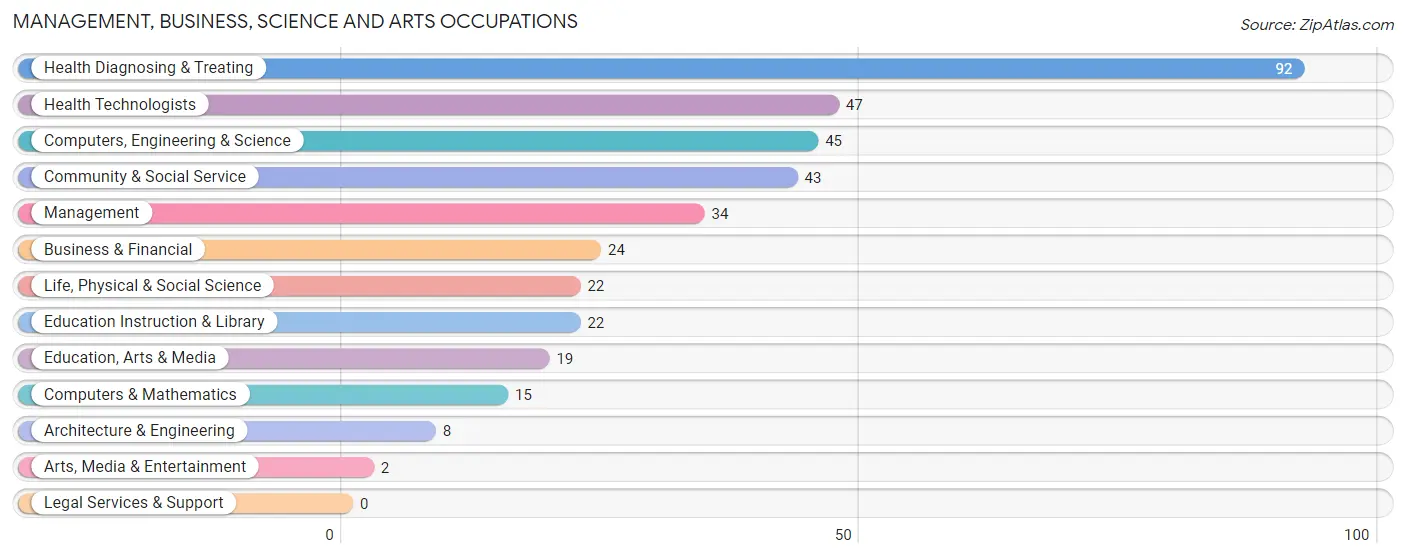
Management, Business, Science and Arts Occupations
The most common Management, Business, Science and Arts occupations in North Hills are Health Diagnosing & Treating (92 | 24.9%), Health Technologists (47 | 12.7%), Computers, Engineering & Science (45 | 12.2%), Community & Social Service (43 | 11.7%), and Management (34 | 9.2%).
Management, Business, Science and Arts Occupations by Sex
Within the Management, Business, Science and Arts occupations in North Hills, the most male-oriented occupations are Management (88.2%), Architecture & Engineering (87.5%), and Life, Physical & Social Science (86.4%), while the most female-oriented occupations are Arts, Media & Entertainment (100.0%), Education Instruction & Library (72.7%), and Health Technologists (59.6%).
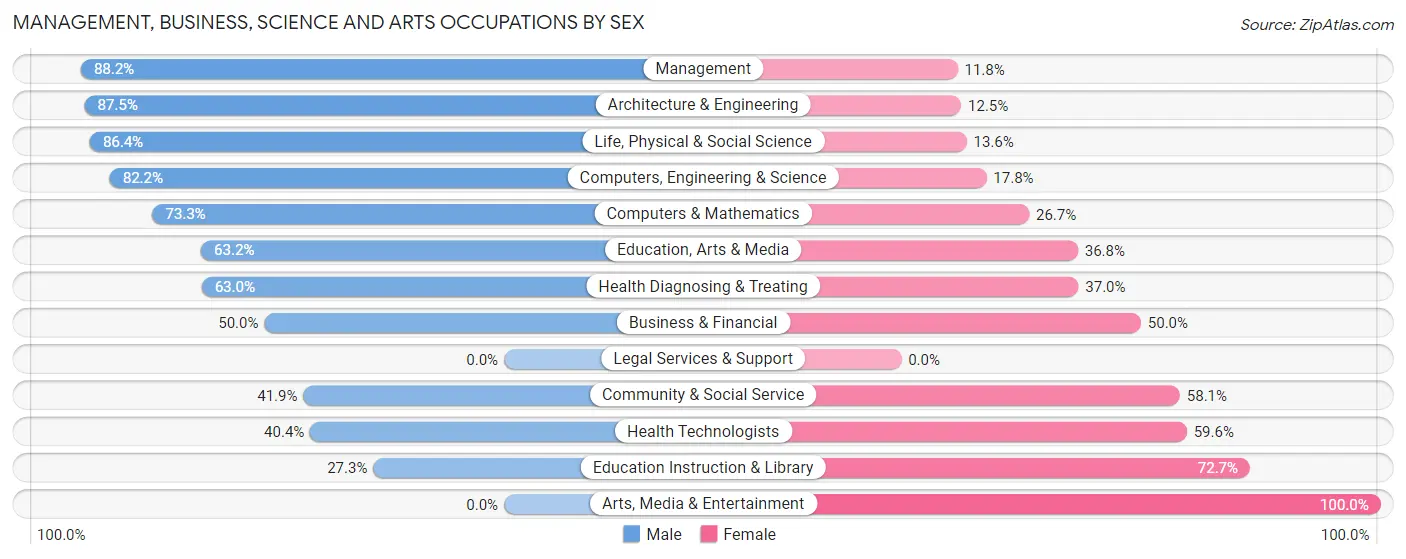
| Occupation | Male | Female |
| Management | 30 (88.2%) | 4 (11.8%) |
| Business & Financial | 12 (50.0%) | 12 (50.0%) |
| Computers, Engineering & Science | 37 (82.2%) | 8 (17.8%) |
| Computers & Mathematics | 11 (73.3%) | 4 (26.7%) |
| Architecture & Engineering | 7 (87.5%) | 1 (12.5%) |
| Life, Physical & Social Science | 19 (86.4%) | 3 (13.6%) |
| Community & Social Service | 18 (41.9%) | 25 (58.1%) |
| Education, Arts & Media | 12 (63.2%) | 7 (36.8%) |
| Legal Services & Support | 0 (0.0%) | 0 (0.0%) |
| Education Instruction & Library | 6 (27.3%) | 16 (72.7%) |
| Arts, Media & Entertainment | 0 (0.0%) | 2 (100.0%) |
| Health Diagnosing & Treating | 58 (63.0%) | 34 (37.0%) |
| Health Technologists | 19 (40.4%) | 28 (59.6%) |
| Total (Category) | 155 (65.1%) | 83 (34.9%) |
| Total (Overall) | 225 (61.0%) | 144 (39.0%) |
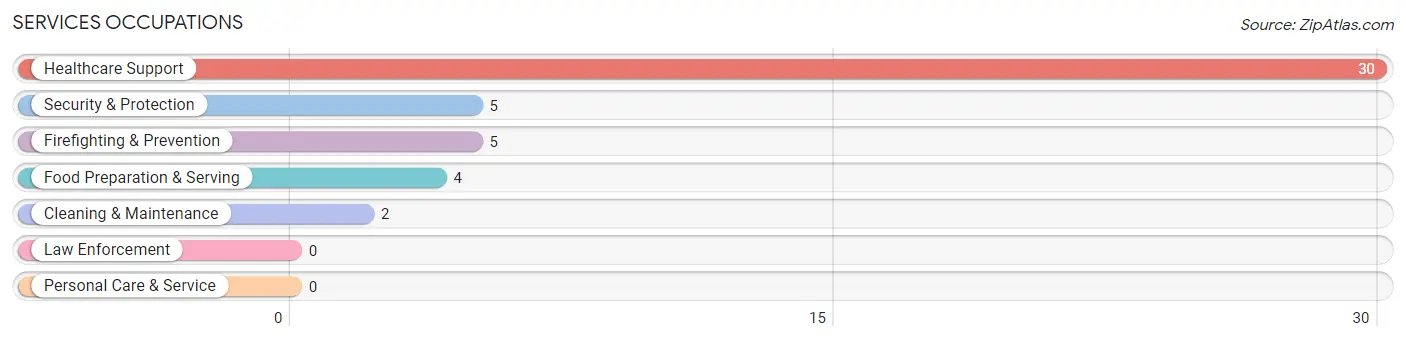
Services Occupations
The most common Services occupations in North Hills are Healthcare Support (30 | 8.1%), Security & Protection (5 | 1.4%), Firefighting & Prevention (5 | 1.4%), Food Preparation & Serving (4 | 1.1%), and Cleaning & Maintenance (2 | 0.5%).
Services Occupations by Sex
Within the Services occupations in North Hills, the most male-oriented occupations are Food Preparation & Serving (100.0%), and Cleaning & Maintenance (100.0%), while the most female-oriented occupations are Healthcare Support (100.0%), Security & Protection (100.0%), and Firefighting & Prevention (100.0%).
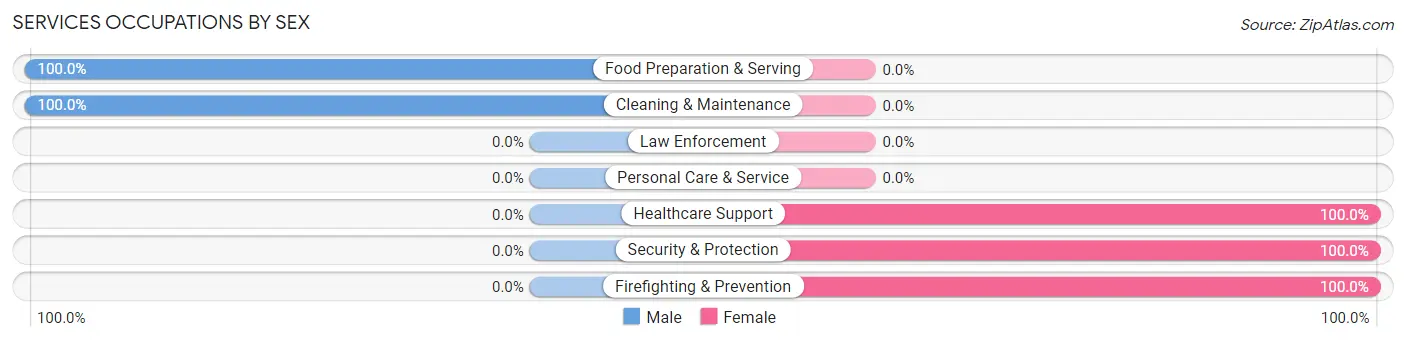
| Occupation | Male | Female |
| Healthcare Support | 0 (0.0%) | 30 (100.0%) |
| Security & Protection | 0 (0.0%) | 5 (100.0%) |
| Firefighting & Prevention | 0 (0.0%) | 5 (100.0%) |
| Law Enforcement | 0 (0.0%) | 0 (0.0%) |
| Food Preparation & Serving | 4 (100.0%) | 0 (0.0%) |
| Cleaning & Maintenance | 2 (100.0%) | 0 (0.0%) |
| Personal Care & Service | 0 (0.0%) | 0 (0.0%) |
| Total (Category) | 6 (14.6%) | 35 (85.4%) |
| Total (Overall) | 225 (61.0%) | 144 (39.0%) |
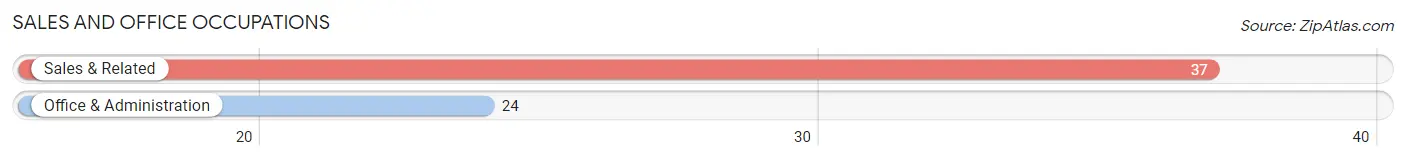
Sales and Office Occupations
The most common Sales and Office occupations in North Hills are Sales & Related (37 | 10.0%), and Office & Administration (24 | 6.5%).
Sales and Office Occupations by Sex
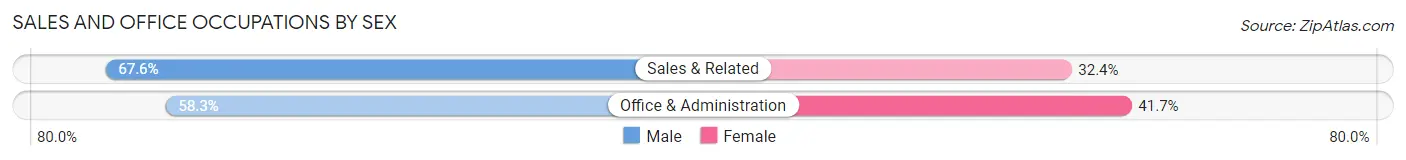
| Occupation | Male | Female |
| Sales & Related | 25 (67.6%) | 12 (32.4%) |
| Office & Administration | 14 (58.3%) | 10 (41.7%) |
| Total (Category) | 39 (63.9%) | 22 (36.1%) |
| Total (Overall) | 225 (61.0%) | 144 (39.0%) |
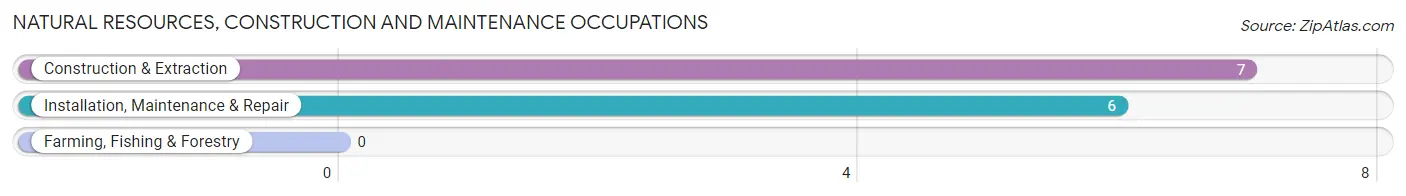
Natural Resources, Construction and Maintenance Occupations
The most common Natural Resources, Construction and Maintenance occupations in North Hills are Construction & Extraction (7 | 1.9%), and Installation, Maintenance & Repair (6 | 1.6%).
Natural Resources, Construction and Maintenance Occupations by Sex
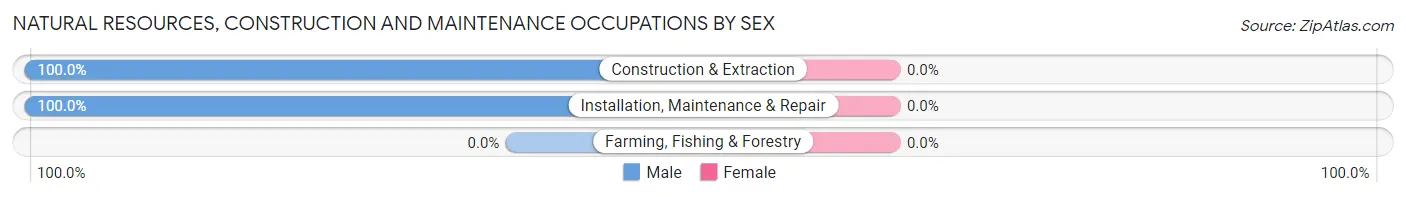
| Occupation | Male | Female |
| Farming, Fishing & Forestry | 0 (0.0%) | 0 (0.0%) |
| Construction & Extraction | 7 (100.0%) | 0 (0.0%) |
| Installation, Maintenance & Repair | 6 (100.0%) | 0 (0.0%) |
| Total (Category) | 13 (100.0%) | 0 (0.0%) |
| Total (Overall) | 225 (61.0%) | 144 (39.0%) |
Production, Transportation and Moving Occupations
The most common Production, Transportation and Moving occupations in North Hills are Production (10 | 2.7%), Material Moving (4 | 1.1%), and Transportation (2 | 0.5%).
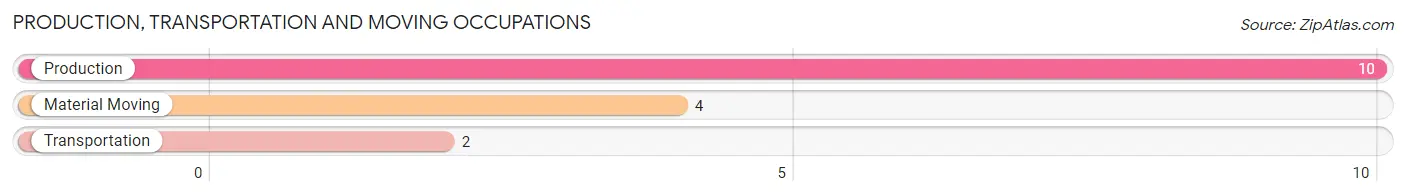
Production, Transportation and Moving Occupations by Sex
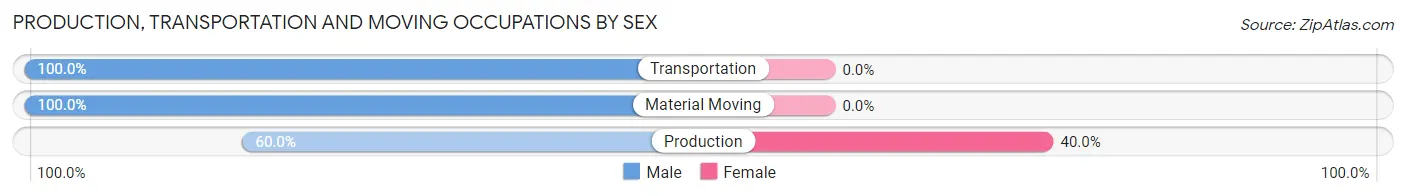
| Occupation | Male | Female |
| Production | 6 (60.0%) | 4 (40.0%) |
| Transportation | 2 (100.0%) | 0 (0.0%) |
| Material Moving | 4 (100.0%) | 0 (0.0%) |
| Total (Category) | 12 (75.0%) | 4 (25.0%) |
| Total (Overall) | 225 (61.0%) | 144 (39.0%) |
Employment Industries by Sex in North Hills
Employment Industries in North Hills
The major employment industries in North Hills include Health Care & Social Assistance (127 | 34.4%), Finance & Insurance (32 | 8.7%), Retail Trade (28 | 7.6%), Educational Services (27 | 7.3%), and Manufacturing (24 | 6.5%).
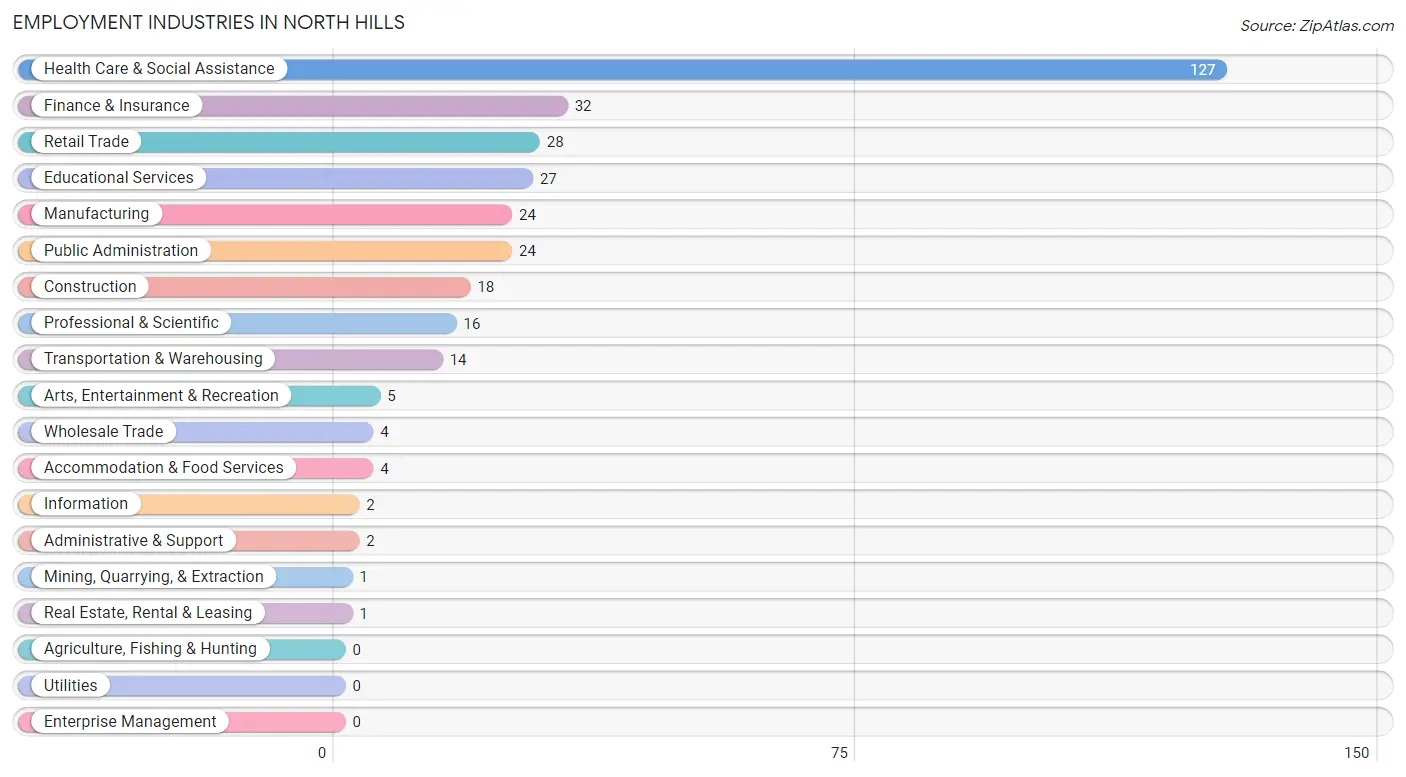
Employment Industries by Sex in North Hills
The North Hills industries that see more men than women are Mining, Quarrying, & Extraction (100.0%), Construction (100.0%), and Wholesale Trade (100.0%), whereas the industries that tend to have a higher number of women are Information (100.0%), Arts, Entertainment & Recreation (100.0%), and Retail Trade (67.9%).
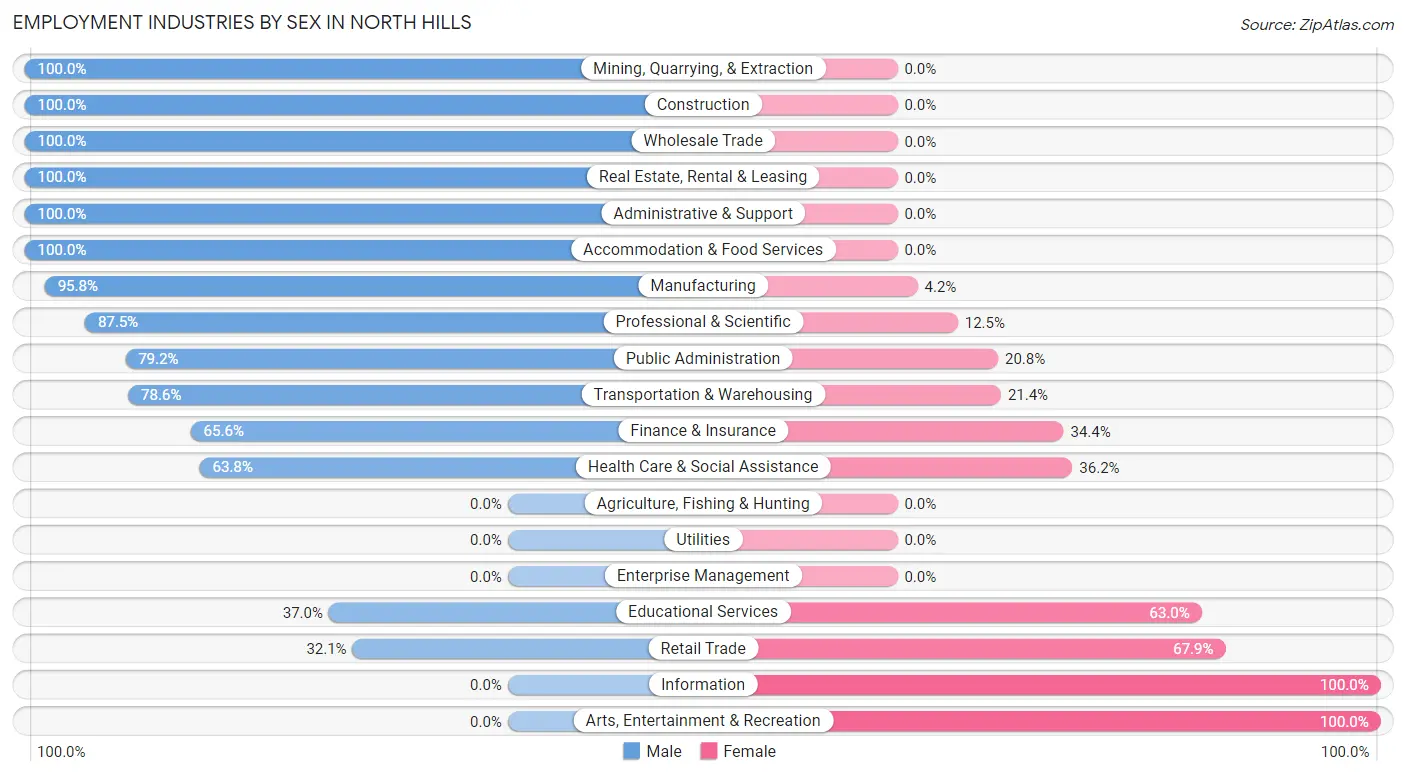
| Industry | Male | Female |
| Agriculture, Fishing & Hunting | 0 (0.0%) | 0 (0.0%) |
| Mining, Quarrying, & Extraction | 1 (100.0%) | 0 (0.0%) |
| Construction | 18 (100.0%) | 0 (0.0%) |
| Manufacturing | 23 (95.8%) | 1 (4.2%) |
| Wholesale Trade | 4 (100.0%) | 0 (0.0%) |
| Retail Trade | 9 (32.1%) | 19 (67.9%) |
| Transportation & Warehousing | 11 (78.6%) | 3 (21.4%) |
| Utilities | 0 (0.0%) | 0 (0.0%) |
| Information | 0 (0.0%) | 2 (100.0%) |
| Finance & Insurance | 21 (65.6%) | 11 (34.4%) |
| Real Estate, Rental & Leasing | 1 (100.0%) | 0 (0.0%) |
| Professional & Scientific | 14 (87.5%) | 2 (12.5%) |
| Enterprise Management | 0 (0.0%) | 0 (0.0%) |
| Administrative & Support | 2 (100.0%) | 0 (0.0%) |
| Educational Services | 10 (37.0%) | 17 (63.0%) |
| Health Care & Social Assistance | 81 (63.8%) | 46 (36.2%) |
| Arts, Entertainment & Recreation | 0 (0.0%) | 5 (100.0%) |
| Accommodation & Food Services | 4 (100.0%) | 0 (0.0%) |
| Public Administration | 19 (79.2%) | 5 (20.8%) |
| Total | 225 (61.0%) | 144 (39.0%) |
Education in North Hills
School Enrollment in North Hills
The most common levels of schooling among the 338 students in North Hills are middle school (124 | 36.7%), elementary school (82 | 24.3%), and high school (54 | 16.0%).
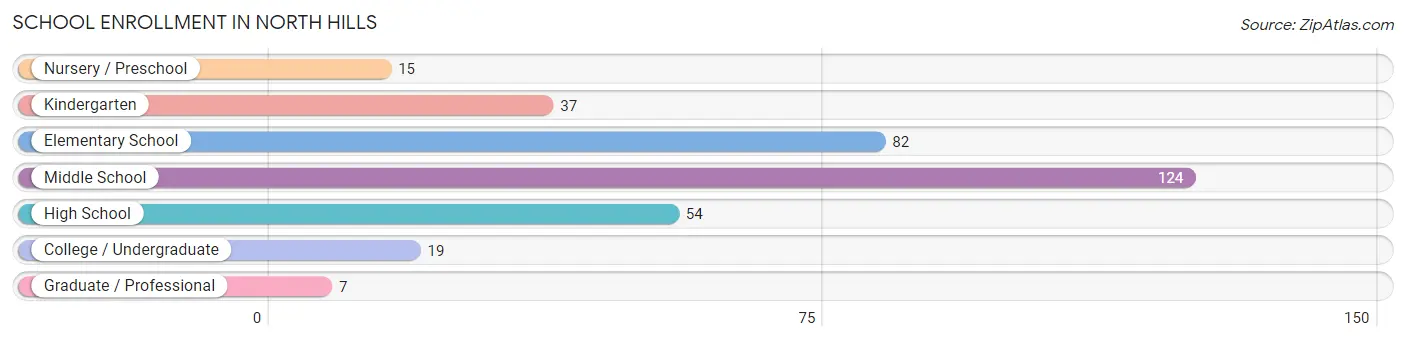
| School Level | # Students | % Students |
| Nursery / Preschool | 15 | 4.4% |
| Kindergarten | 37 | 11.0% |
| Elementary School | 82 | 24.3% |
| Middle School | 124 | 36.7% |
| High School | 54 | 16.0% |
| College / Undergraduate | 19 | 5.6% |
| Graduate / Professional | 7 | 2.1% |
| Total | 338 | 100.0% |
School Enrollment by Age by Funding Source in North Hills
Out of a total of 338 students who are enrolled in schools in North Hills, 84 (24.9%) attend a private institution, while the remaining 254 (75.1%) are enrolled in public schools. The age group of 35 years and over has the highest likelihood of being enrolled in private schools, with 2 (50.0% in the age bracket) enrolled. Conversely, the age group of 15 to 17 year olds has the lowest likelihood of being enrolled in a private school, with 35 (100.0% in the age bracket) attending a public institution.
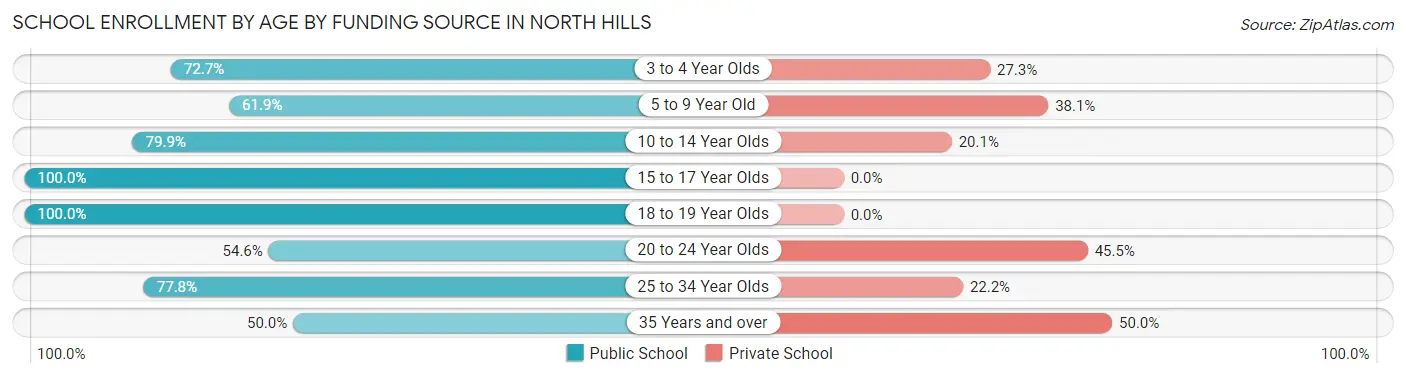
| Age Bracket | Public School | Private School |
| 3 to 4 Year Olds | 8 (72.7%) | 3 (27.3%) |
| 5 to 9 Year Old | 65 (61.9%) | 40 (38.1%) |
| 10 to 14 Year Olds | 127 (79.9%) | 32 (20.1%) |
| 15 to 17 Year Olds | 35 (100.0%) | 0 (0.0%) |
| 18 to 19 Year Olds | 4 (100.0%) | 0 (0.0%) |
| 20 to 24 Year Olds | 6 (54.5%) | 5 (45.5%) |
| 25 to 34 Year Olds | 7 (77.8%) | 2 (22.2%) |
| 35 Years and over | 2 (50.0%) | 2 (50.0%) |
| Total | 254 (75.1%) | 84 (24.9%) |
Educational Attainment by Field of Study in North Hills
Education (54 | 16.0%), engineering (48 | 14.2%), business (47 | 14.0%), physical & health sciences (37 | 11.0%), and bio, nature & agricultural (34 | 10.1%) are the most common fields of study among 337 individuals in North Hills who have obtained a bachelor's degree or higher.
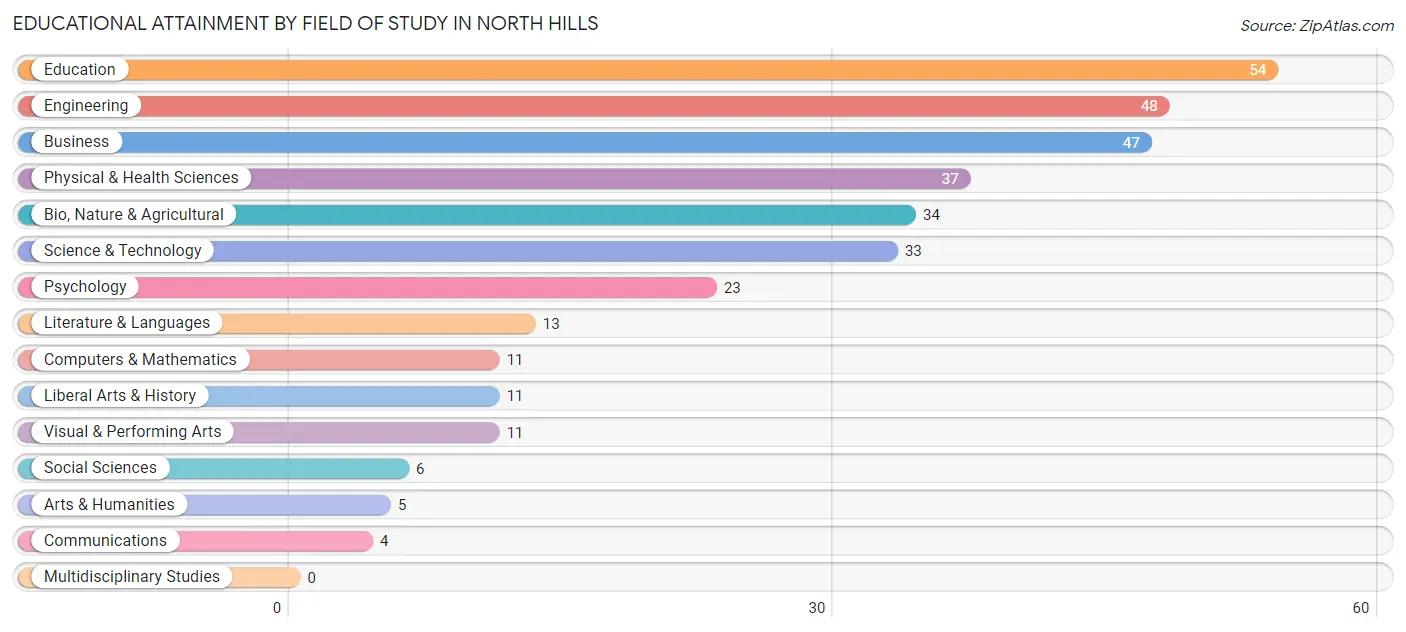
| Field of Study | # Graduates | % Graduates |
| Computers & Mathematics | 11 | 3.3% |
| Bio, Nature & Agricultural | 34 | 10.1% |
| Physical & Health Sciences | 37 | 11.0% |
| Psychology | 23 | 6.8% |
| Social Sciences | 6 | 1.8% |
| Engineering | 48 | 14.2% |
| Multidisciplinary Studies | 0 | 0.0% |
| Science & Technology | 33 | 9.8% |
| Business | 47 | 14.0% |
| Education | 54 | 16.0% |
| Literature & Languages | 13 | 3.9% |
| Liberal Arts & History | 11 | 3.3% |
| Visual & Performing Arts | 11 | 3.3% |
| Communications | 4 | 1.2% |
| Arts & Humanities | 5 | 1.5% |
| Total | 337 | 100.0% |
Transportation & Commute in North Hills
Vehicle Availability by Sex in North Hills
The most prevalent vehicle ownership categories in North Hills are males with 2 vehicles (138, accounting for 61.3%) and females with 2 vehicles (50, making up 121.0%).
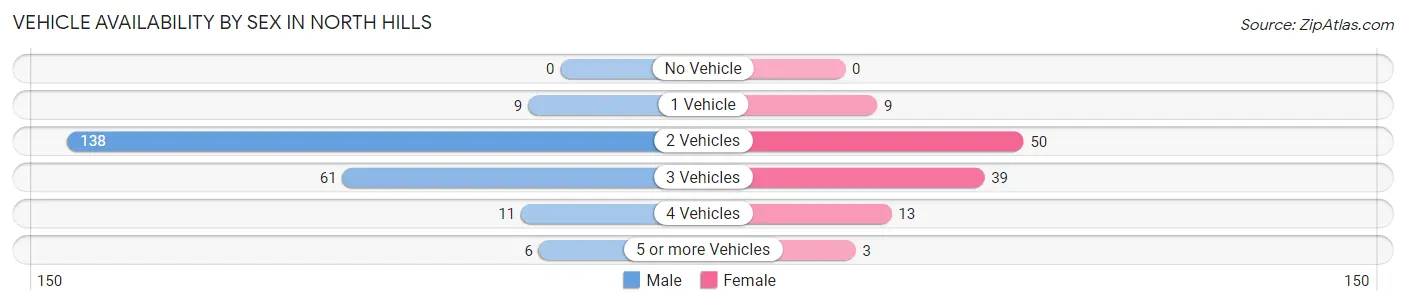
| Vehicles Available | Male | Female |
| No Vehicle | 0 (0.0%) | 0 (0.0%) |
| 1 Vehicle | 9 (4.0%) | 9 (7.9%) |
| 2 Vehicles | 138 (61.3%) | 50 (43.9%) |
| 3 Vehicles | 61 (27.1%) | 39 (34.2%) |
| 4 Vehicles | 11 (4.9%) | 13 (11.4%) |
| 5 or more Vehicles | 6 (2.7%) | 3 (2.6%) |
| Total | 225 (100.0%) | 114 (100.0%) |
Commute Time in North Hills
The most frequently occuring commute durations in North Hills are 10 to 14 minutes (129 commuters, 43.6%), 15 to 19 minutes (77 commuters, 26.0%), and 20 to 24 minutes (40 commuters, 13.5%).
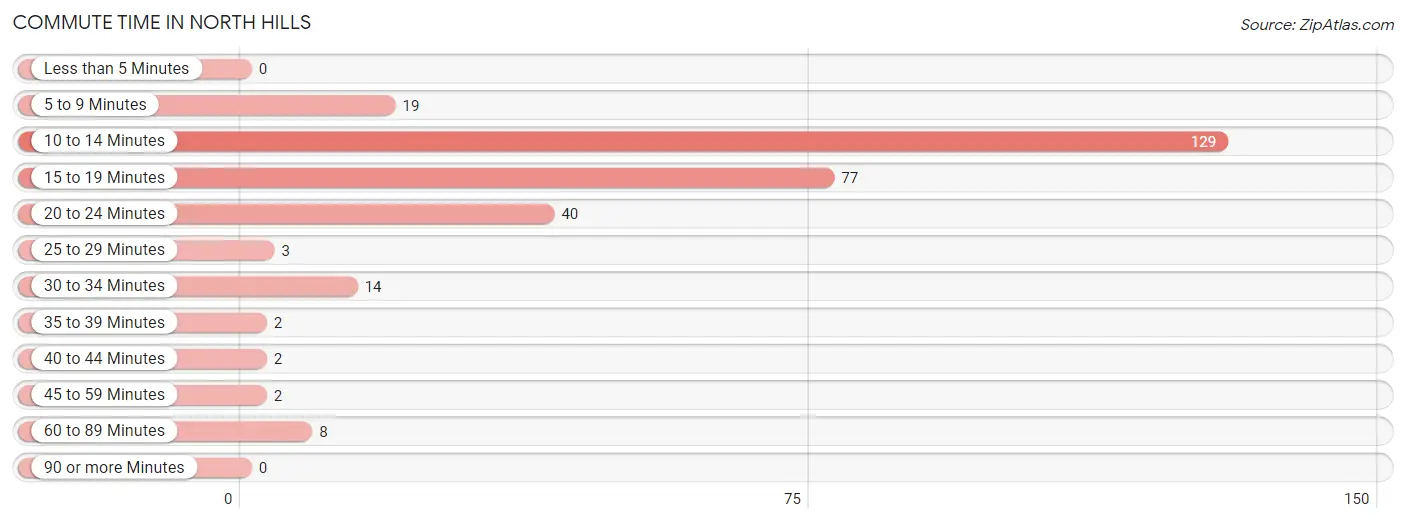
| Commute Time | # Commuters | % Commuters |
| Less than 5 Minutes | 0 | 0.0% |
| 5 to 9 Minutes | 19 | 6.4% |
| 10 to 14 Minutes | 129 | 43.6% |
| 15 to 19 Minutes | 77 | 26.0% |
| 20 to 24 Minutes | 40 | 13.5% |
| 25 to 29 Minutes | 3 | 1.0% |
| 30 to 34 Minutes | 14 | 4.7% |
| 35 to 39 Minutes | 2 | 0.7% |
| 40 to 44 Minutes | 2 | 0.7% |
| 45 to 59 Minutes | 2 | 0.7% |
| 60 to 89 Minutes | 8 | 2.7% |
| 90 or more Minutes | 0 | 0.0% |
Commute Time by Sex in North Hills
The most common commute times in North Hills are 10 to 14 minutes (91 commuters, 45.5%) for males and 10 to 14 minutes (38 commuters, 39.6%) for females.
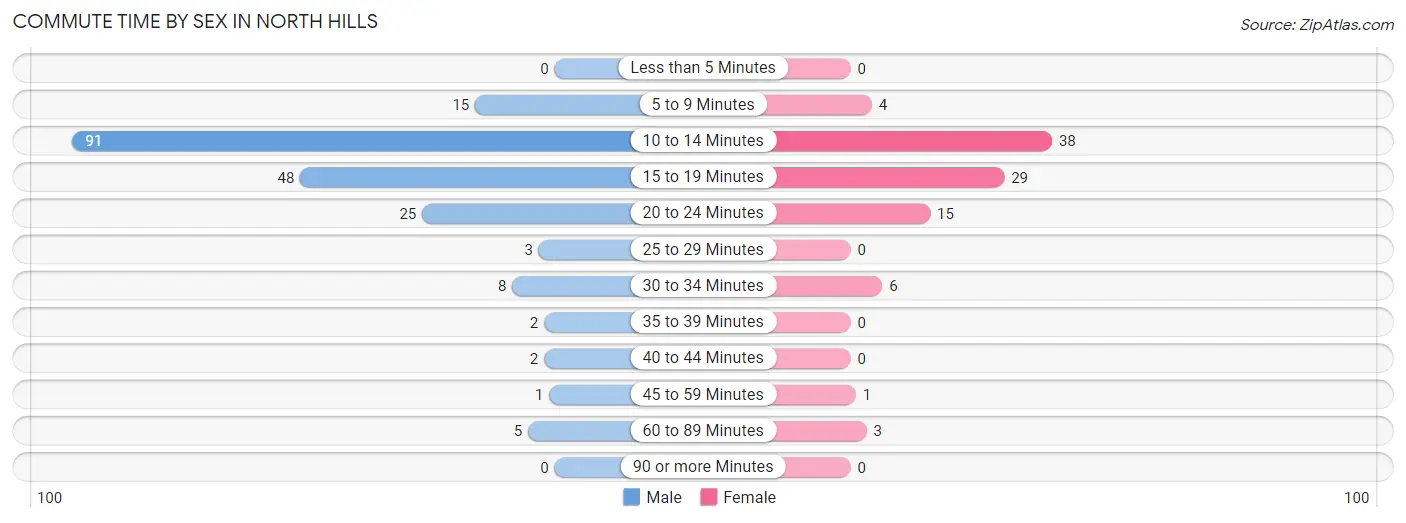
| Commute Time | Male | Female |
| Less than 5 Minutes | 0 (0.0%) | 0 (0.0%) |
| 5 to 9 Minutes | 15 (7.5%) | 4 (4.2%) |
| 10 to 14 Minutes | 91 (45.5%) | 38 (39.6%) |
| 15 to 19 Minutes | 48 (24.0%) | 29 (30.2%) |
| 20 to 24 Minutes | 25 (12.5%) | 15 (15.6%) |
| 25 to 29 Minutes | 3 (1.5%) | 0 (0.0%) |
| 30 to 34 Minutes | 8 (4.0%) | 6 (6.2%) |
| 35 to 39 Minutes | 2 (1.0%) | 0 (0.0%) |
| 40 to 44 Minutes | 2 (1.0%) | 0 (0.0%) |
| 45 to 59 Minutes | 1 (0.5%) | 1 (1.0%) |
| 60 to 89 Minutes | 5 (2.5%) | 3 (3.1%) |
| 90 or more Minutes | 0 (0.0%) | 0 (0.0%) |
Time of Departure to Work by Sex in North Hills
The most frequent times of departure to work in North Hills are 7:00 AM to 7:29 AM (74, 37.0%) for males and 7:30 AM to 7:59 AM (24, 25.0%) for females.
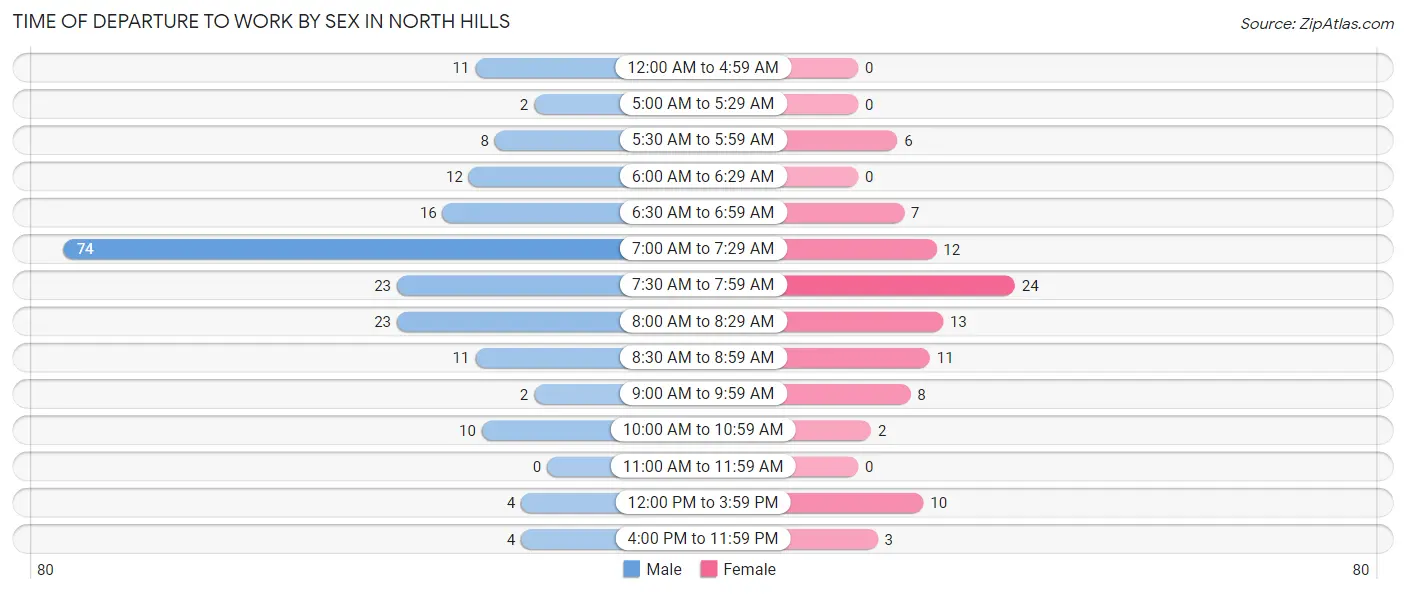
| Time of Departure | Male | Female |
| 12:00 AM to 4:59 AM | 11 (5.5%) | 0 (0.0%) |
| 5:00 AM to 5:29 AM | 2 (1.0%) | 0 (0.0%) |
| 5:30 AM to 5:59 AM | 8 (4.0%) | 6 (6.2%) |
| 6:00 AM to 6:29 AM | 12 (6.0%) | 0 (0.0%) |
| 6:30 AM to 6:59 AM | 16 (8.0%) | 7 (7.3%) |
| 7:00 AM to 7:29 AM | 74 (37.0%) | 12 (12.5%) |
| 7:30 AM to 7:59 AM | 23 (11.5%) | 24 (25.0%) |
| 8:00 AM to 8:29 AM | 23 (11.5%) | 13 (13.5%) |
| 8:30 AM to 8:59 AM | 11 (5.5%) | 11 (11.5%) |
| 9:00 AM to 9:59 AM | 2 (1.0%) | 8 (8.3%) |
| 10:00 AM to 10:59 AM | 10 (5.0%) | 2 (2.1%) |
| 11:00 AM to 11:59 AM | 0 (0.0%) | 0 (0.0%) |
| 12:00 PM to 3:59 PM | 4 (2.0%) | 10 (10.4%) |
| 4:00 PM to 11:59 PM | 4 (2.0%) | 3 (3.1%) |
| Total | 200 (100.0%) | 96 (100.0%) |
Housing Occupancy in North Hills
Occupancy by Ownership in North Hills
Of the total 309 dwellings in North Hills, owner-occupied units account for 300 (97.1%), while renter-occupied units make up 9 (2.9%).
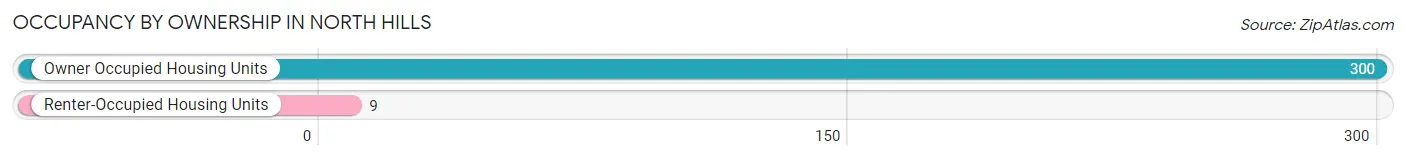
| Occupancy | # Housing Units | % Housing Units |
| Owner Occupied Housing Units | 300 | 97.1% |
| Renter-Occupied Housing Units | 9 | 2.9% |
| Total Occupied Housing Units | 309 | 100.0% |
Occupancy by Household Size in North Hills
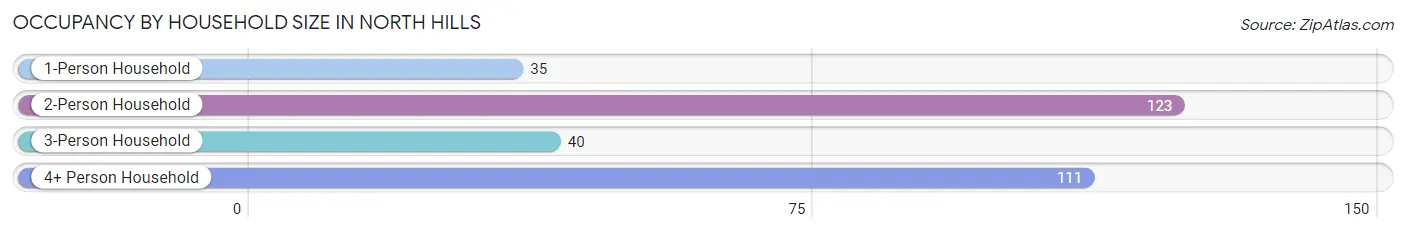
| Household Size | # Housing Units | % Housing Units |
| 1-Person Household | 35 | 11.3% |
| 2-Person Household | 123 | 39.8% |
| 3-Person Household | 40 | 12.9% |
| 4+ Person Household | 111 | 35.9% |
| Total Housing Units | 309 | 100.0% |
Occupancy by Ownership by Household Size in North Hills
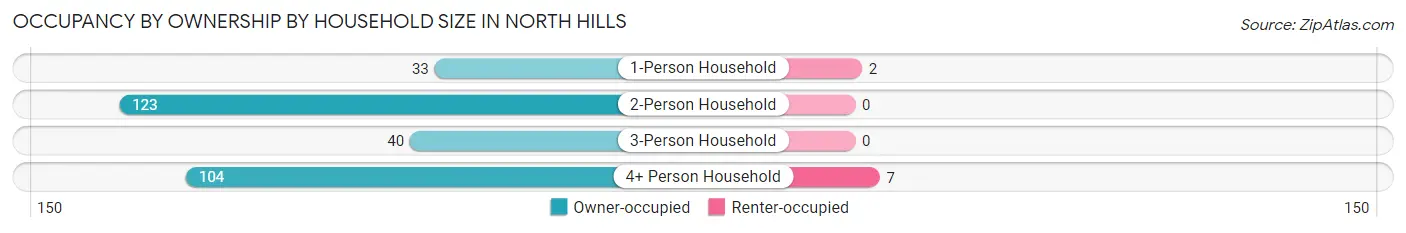
| Household Size | Owner-occupied | Renter-occupied |
| 1-Person Household | 33 (94.3%) | 2 (5.7%) |
| 2-Person Household | 123 (100.0%) | 0 (0.0%) |
| 3-Person Household | 40 (100.0%) | 0 (0.0%) |
| 4+ Person Household | 104 (93.7%) | 7 (6.3%) |
| Total Housing Units | 300 (97.1%) | 9 (2.9%) |
Occupancy by Educational Attainment in North Hills
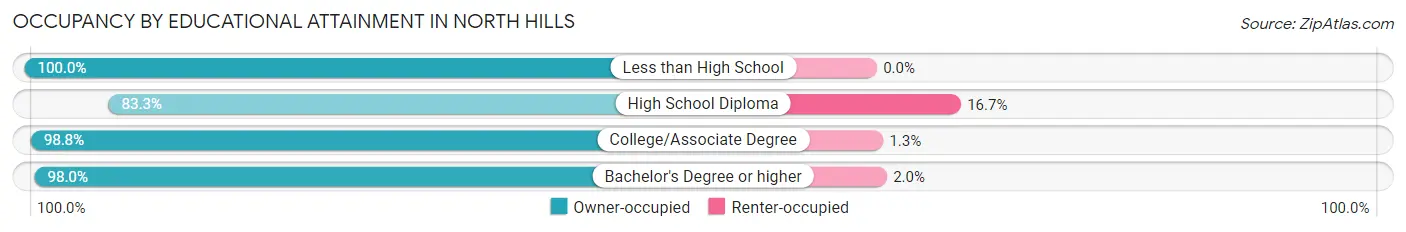
| Household Size | Owner-occupied | Renter-occupied |
| Less than High School | 4 (100.0%) | 0 (0.0%) |
| High School Diploma | 20 (83.3%) | 4 (16.7%) |
| College/Associate Degree | 79 (98.8%) | 1 (1.3%) |
| Bachelor's Degree or higher | 197 (98.0%) | 4 (2.0%) |
Occupancy by Age of Householder in North Hills
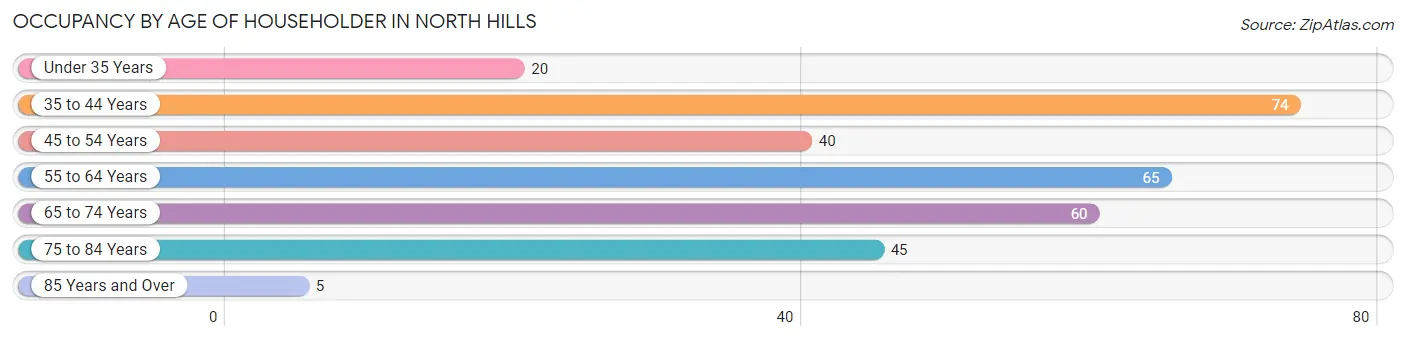
| Age Bracket | # Households | % Households |
| Under 35 Years | 20 | 6.5% |
| 35 to 44 Years | 74 | 23.9% |
| 45 to 54 Years | 40 | 12.9% |
| 55 to 64 Years | 65 | 21.0% |
| 65 to 74 Years | 60 | 19.4% |
| 75 to 84 Years | 45 | 14.6% |
| 85 Years and Over | 5 | 1.6% |
| Total | 309 | 100.0% |
Housing Finances in North Hills
Median Income by Occupancy in North Hills
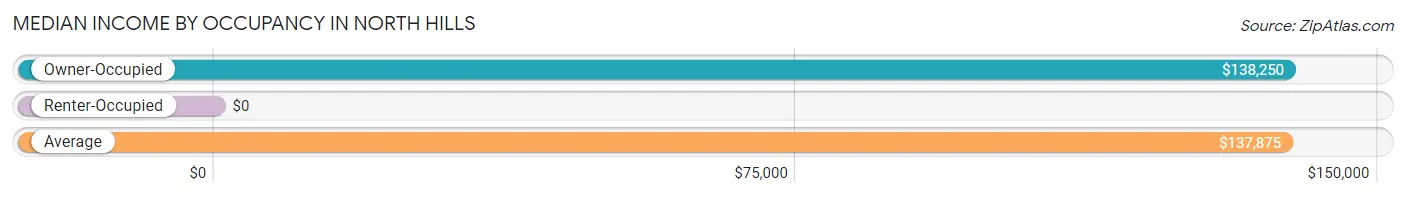
| Occupancy Type | # Households | Median Income |
| Owner-Occupied | 300 (97.1%) | $138,250 |
| Renter-Occupied | 9 (2.9%) | $0 |
| Average | 309 (100.0%) | $137,875 |
Occupancy by Householder Income Bracket in North Hills
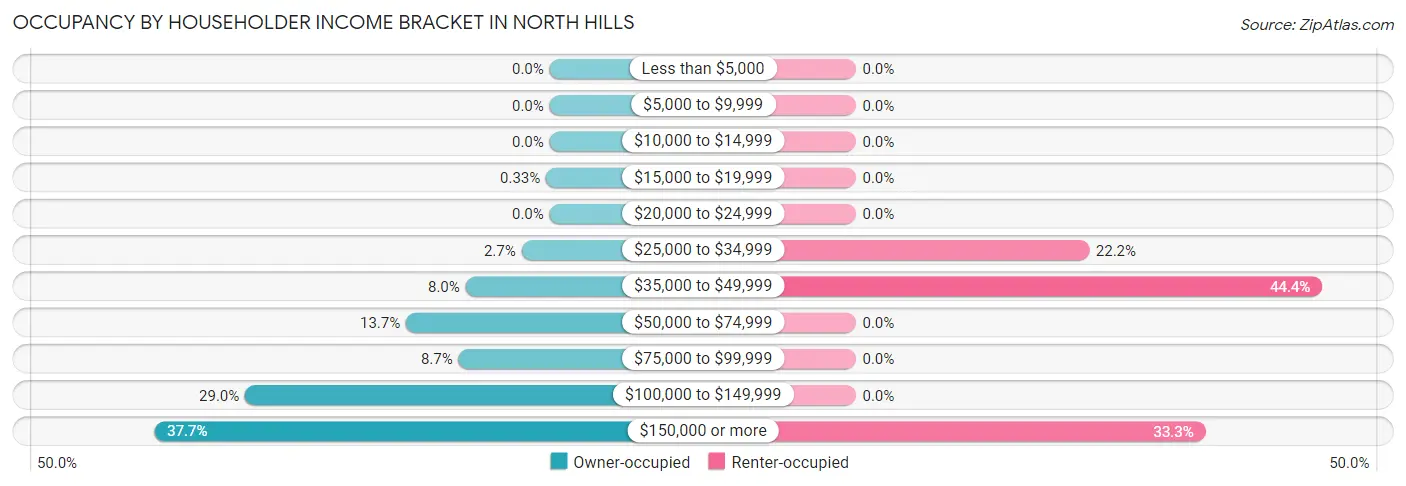
| Income Bracket | Owner-occupied | Renter-occupied |
| Less than $5,000 | 0 (0.0%) | 0 (0.0%) |
| $5,000 to $9,999 | 0 (0.0%) | 0 (0.0%) |
| $10,000 to $14,999 | 0 (0.0%) | 0 (0.0%) |
| $15,000 to $19,999 | 1 (0.3%) | 0 (0.0%) |
| $20,000 to $24,999 | 0 (0.0%) | 0 (0.0%) |
| $25,000 to $34,999 | 8 (2.7%) | 2 (22.2%) |
| $35,000 to $49,999 | 24 (8.0%) | 4 (44.4%) |
| $50,000 to $74,999 | 41 (13.7%) | 0 (0.0%) |
| $75,000 to $99,999 | 26 (8.7%) | 0 (0.0%) |
| $100,000 to $149,999 | 87 (29.0%) | 0 (0.0%) |
| $150,000 or more | 113 (37.7%) | 3 (33.3%) |
| Total | 300 (100.0%) | 9 (100.0%) |
Monthly Housing Cost Tiers in North Hills
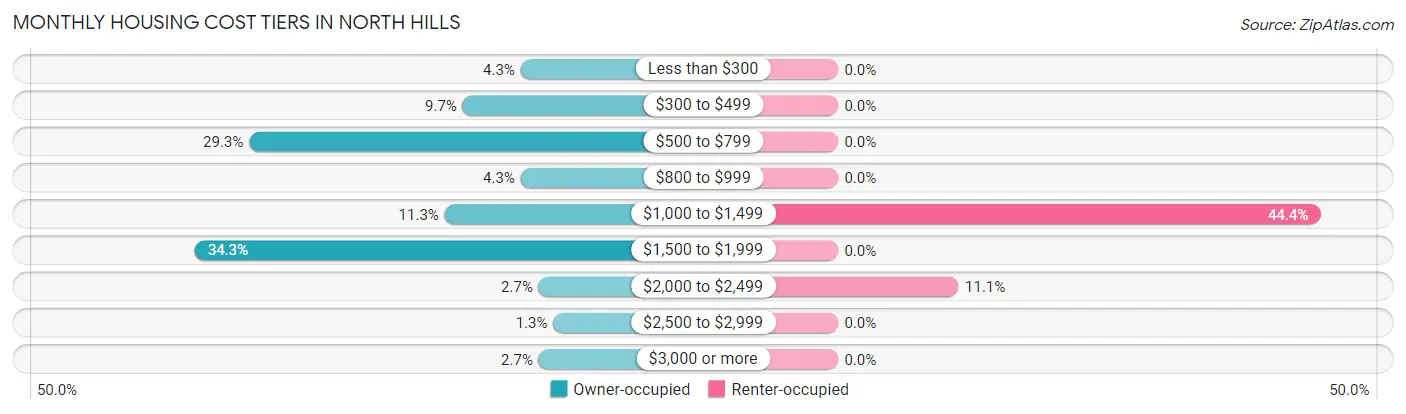
| Monthly Cost | Owner-occupied | Renter-occupied |
| Less than $300 | 13 (4.3%) | 0 (0.0%) |
| $300 to $499 | 29 (9.7%) | 0 (0.0%) |
| $500 to $799 | 88 (29.3%) | 0 (0.0%) |
| $800 to $999 | 13 (4.3%) | 0 (0.0%) |
| $1,000 to $1,499 | 34 (11.3%) | 4 (44.4%) |
| $1,500 to $1,999 | 103 (34.3%) | 0 (0.0%) |
| $2,000 to $2,499 | 8 (2.7%) | 1 (11.1%) |
| $2,500 to $2,999 | 4 (1.3%) | 0 (0.0%) |
| $3,000 or more | 8 (2.7%) | 0 (0.0%) |
| Total | 300 (100.0%) | 9 (100.0%) |
Physical Housing Characteristics in North Hills
Housing Structures in North Hills
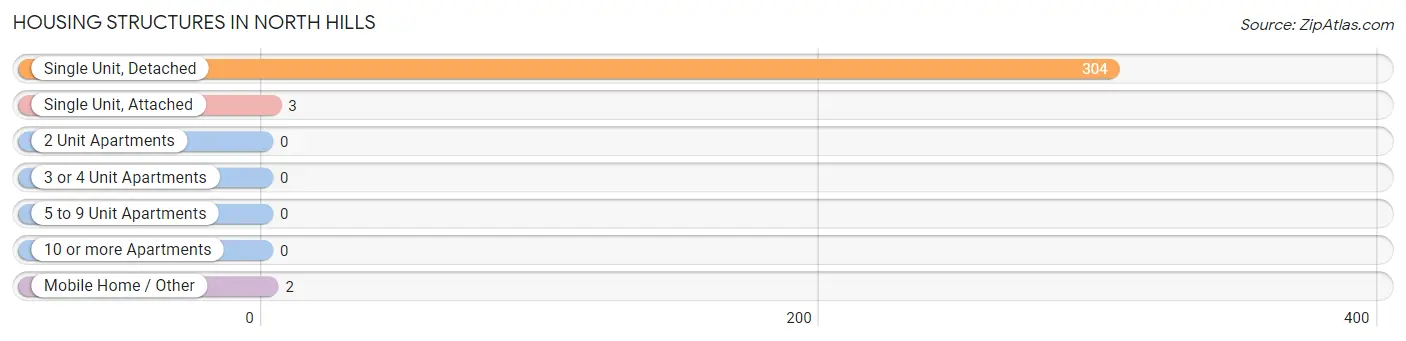
| Structure Type | # Housing Units | % Housing Units |
| Single Unit, Detached | 304 | 98.4% |
| Single Unit, Attached | 3 | 1.0% |
| 2 Unit Apartments | 0 | 0.0% |
| 3 or 4 Unit Apartments | 0 | 0.0% |
| 5 to 9 Unit Apartments | 0 | 0.0% |
| 10 or more Apartments | 0 | 0.0% |
| Mobile Home / Other | 2 | 0.6% |
| Total | 309 | 100.0% |
Housing Structures by Occupancy in North Hills
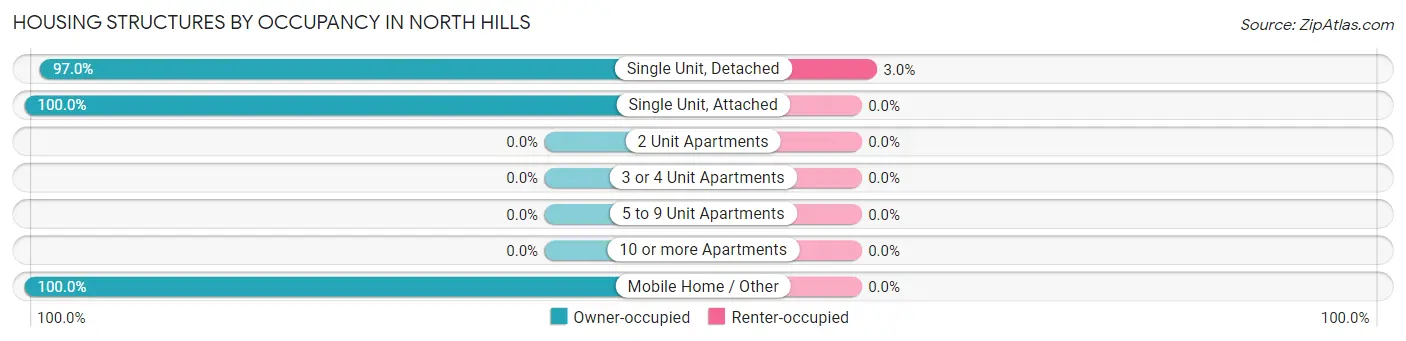
| Structure Type | Owner-occupied | Renter-occupied |
| Single Unit, Detached | 295 (97.0%) | 9 (3.0%) |
| Single Unit, Attached | 3 (100.0%) | 0 (0.0%) |
| 2 Unit Apartments | 0 (0.0%) | 0 (0.0%) |
| 3 or 4 Unit Apartments | 0 (0.0%) | 0 (0.0%) |
| 5 to 9 Unit Apartments | 0 (0.0%) | 0 (0.0%) |
| 10 or more Apartments | 0 (0.0%) | 0 (0.0%) |
| Mobile Home / Other | 2 (100.0%) | 0 (0.0%) |
| Total | 300 (97.1%) | 9 (2.9%) |
Housing Structures by Number of Rooms in North Hills
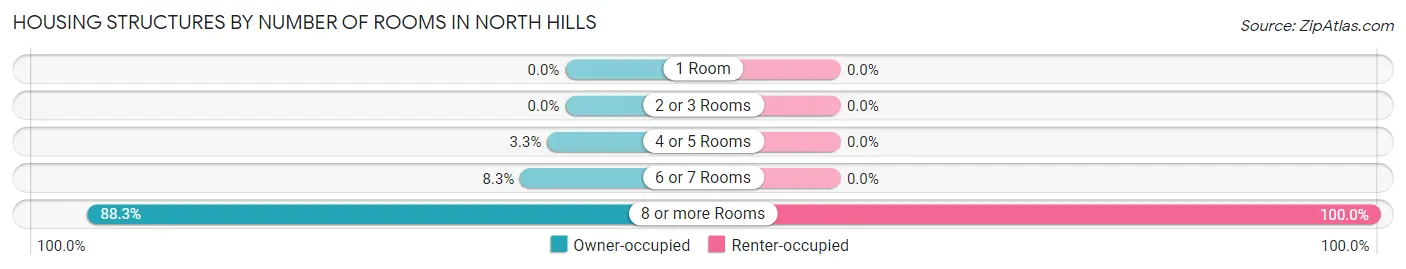
| Number of Rooms | Owner-occupied | Renter-occupied |
| 1 Room | 0 (0.0%) | 0 (0.0%) |
| 2 or 3 Rooms | 0 (0.0%) | 0 (0.0%) |
| 4 or 5 Rooms | 10 (3.3%) | 0 (0.0%) |
| 6 or 7 Rooms | 25 (8.3%) | 0 (0.0%) |
| 8 or more Rooms | 265 (88.3%) | 9 (100.0%) |
| Total | 300 (100.0%) | 9 (100.0%) |
Housing Structure by Heating Type in North Hills
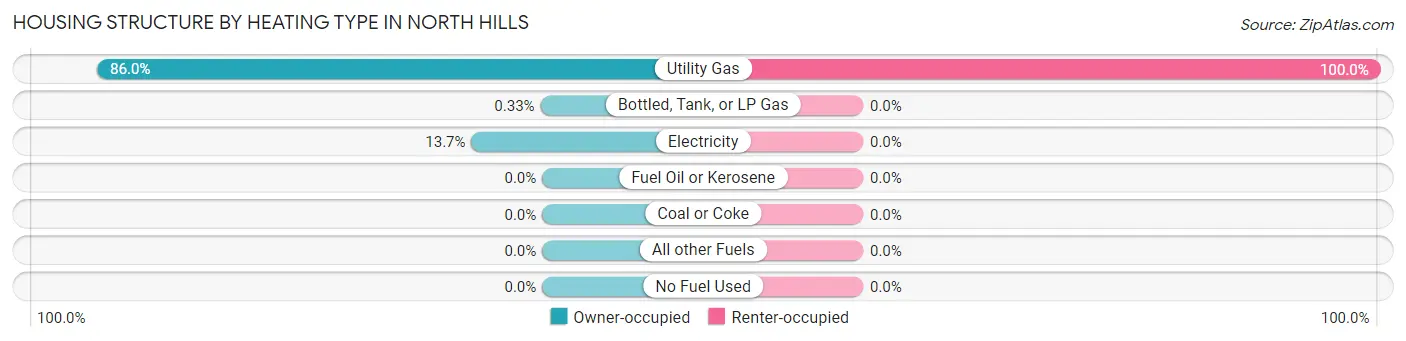
| Heating Type | Owner-occupied | Renter-occupied |
| Utility Gas | 258 (86.0%) | 9 (100.0%) |
| Bottled, Tank, or LP Gas | 1 (0.3%) | 0 (0.0%) |
| Electricity | 41 (13.7%) | 0 (0.0%) |
| Fuel Oil or Kerosene | 0 (0.0%) | 0 (0.0%) |
| Coal or Coke | 0 (0.0%) | 0 (0.0%) |
| All other Fuels | 0 (0.0%) | 0 (0.0%) |
| No Fuel Used | 0 (0.0%) | 0 (0.0%) |
| Total | 300 (100.0%) | 9 (100.0%) |
Household Vehicle Usage in North Hills
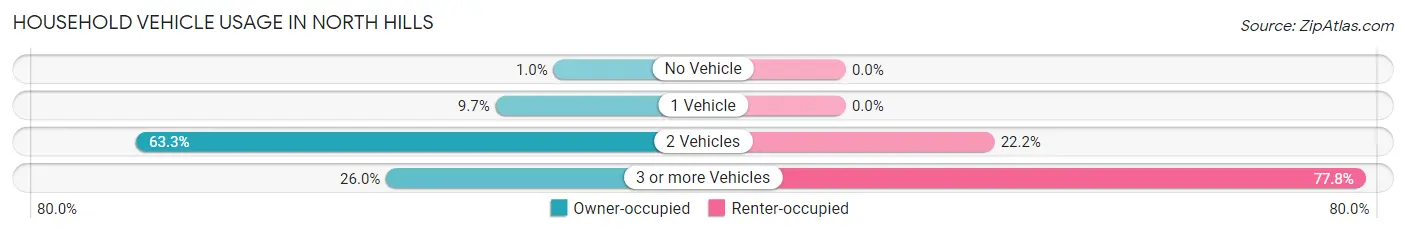
| Vehicles per Household | Owner-occupied | Renter-occupied |
| No Vehicle | 3 (1.0%) | 0 (0.0%) |
| 1 Vehicle | 29 (9.7%) | 0 (0.0%) |
| 2 Vehicles | 190 (63.3%) | 2 (22.2%) |
| 3 or more Vehicles | 78 (26.0%) | 7 (77.8%) |
| Total | 300 (100.0%) | 9 (100.0%) |
Real Estate & Mortgages in North Hills
Real Estate and Mortgage Overview in North Hills
| Characteristic | Without Mortgage | With Mortgage |
| Housing Units | 109 | 191 |
| Median Property Value | $239,400 | $233,400 |
| Median Household Income | $157,589 | $54 |
| Monthly Housing Costs | $563 | $8 |
| Real Estate Taxes | $1,546 | $18 |
Property Value by Mortgage Status in North Hills
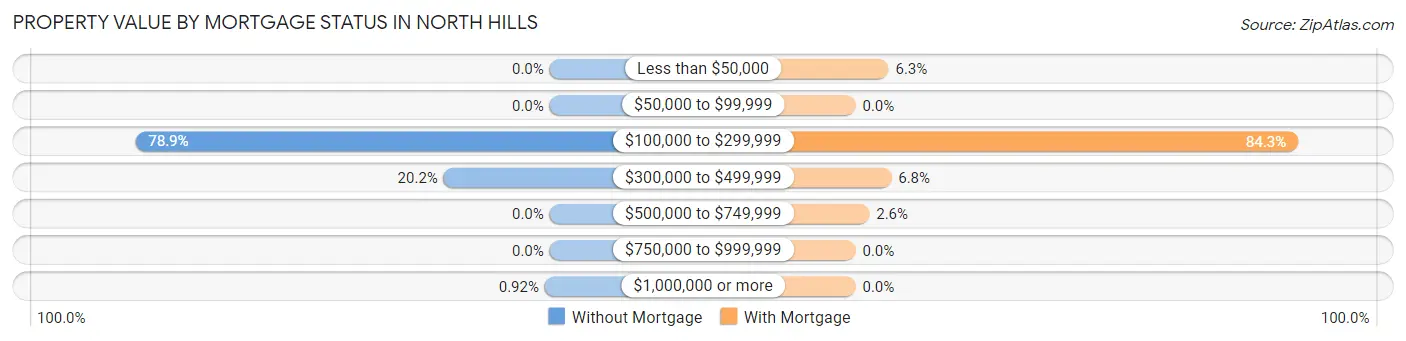
| Property Value | Without Mortgage | With Mortgage |
| Less than $50,000 | 0 (0.0%) | 12 (6.3%) |
| $50,000 to $99,999 | 0 (0.0%) | 0 (0.0%) |
| $100,000 to $299,999 | 86 (78.9%) | 161 (84.3%) |
| $300,000 to $499,999 | 22 (20.2%) | 13 (6.8%) |
| $500,000 to $749,999 | 0 (0.0%) | 5 (2.6%) |
| $750,000 to $999,999 | 0 (0.0%) | 0 (0.0%) |
| $1,000,000 or more | 1 (0.9%) | 0 (0.0%) |
| Total | 109 (100.0%) | 191 (100.0%) |
Household Income by Mortgage Status in North Hills
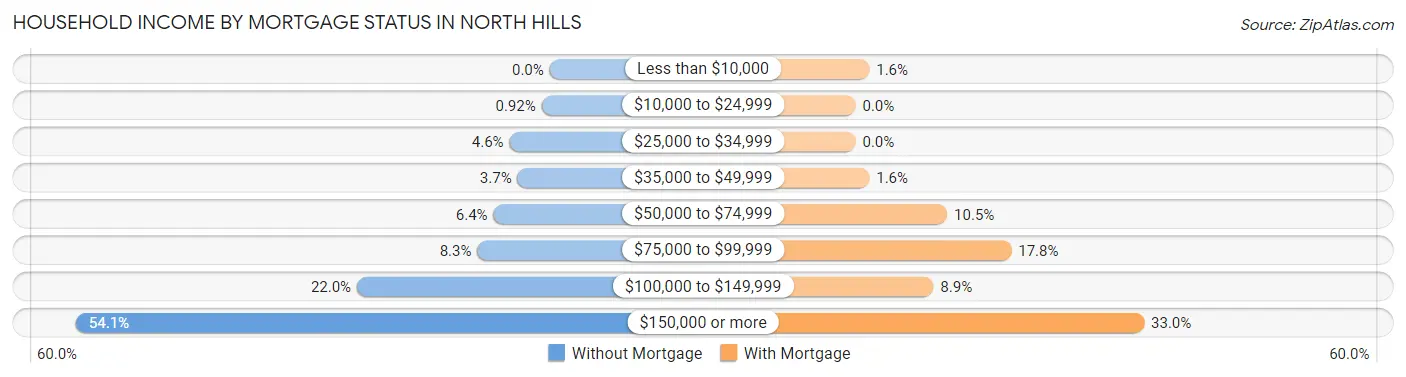
| Household Income | Without Mortgage | With Mortgage |
| Less than $10,000 | 0 (0.0%) | 3 (1.6%) |
| $10,000 to $24,999 | 1 (0.9%) | 0 (0.0%) |
| $25,000 to $34,999 | 5 (4.6%) | 0 (0.0%) |
| $35,000 to $49,999 | 4 (3.7%) | 3 (1.6%) |
| $50,000 to $74,999 | 7 (6.4%) | 20 (10.5%) |
| $75,000 to $99,999 | 9 (8.3%) | 34 (17.8%) |
| $100,000 to $149,999 | 24 (22.0%) | 17 (8.9%) |
| $150,000 or more | 59 (54.1%) | 63 (33.0%) |
| Total | 109 (100.0%) | 191 (100.0%) |
Property Value to Household Income Ratio in North Hills
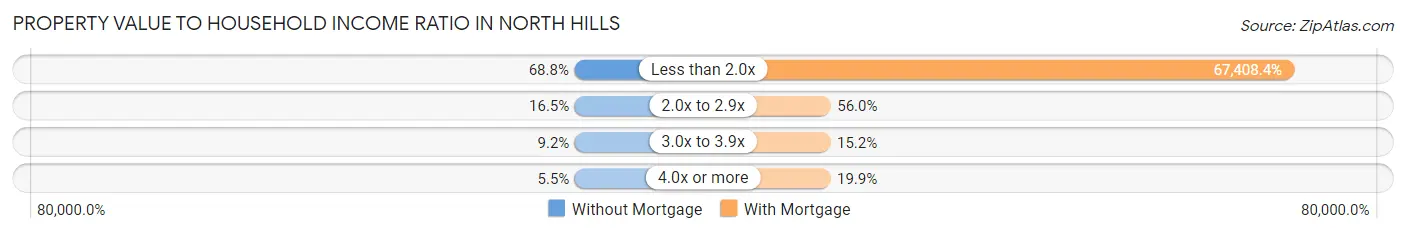
| Value-to-Income Ratio | Without Mortgage | With Mortgage |
| Less than 2.0x | 75 (68.8%) | 128,750 (67,408.4%) |
| 2.0x to 2.9x | 18 (16.5%) | 107 (56.0%) |
| 3.0x to 3.9x | 10 (9.2%) | 29 (15.2%) |
| 4.0x or more | 6 (5.5%) | 38 (19.9%) |
| Total | 109 (100.0%) | 191 (100.0%) |
Real Estate Taxes by Mortgage Status in North Hills
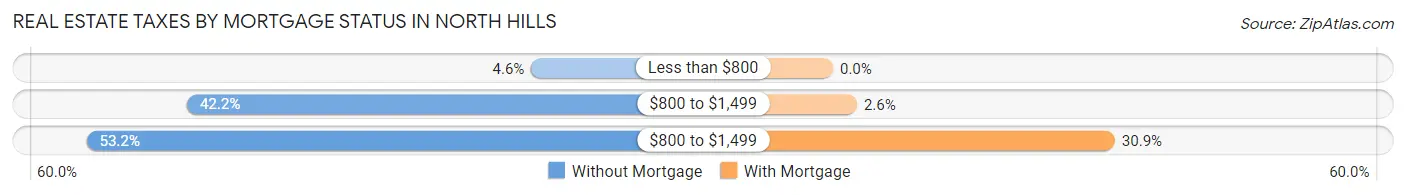
| Property Taxes | Without Mortgage | With Mortgage |
| Less than $800 | 5 (4.6%) | 0 (0.0%) |
| $800 to $1,499 | 46 (42.2%) | 5 (2.6%) |
| $800 to $1,499 | 58 (53.2%) | 59 (30.9%) |
| Total | 109 (100.0%) | 191 (100.0%) |
Health & Disability in North Hills
Health Insurance Coverage by Age in North Hills
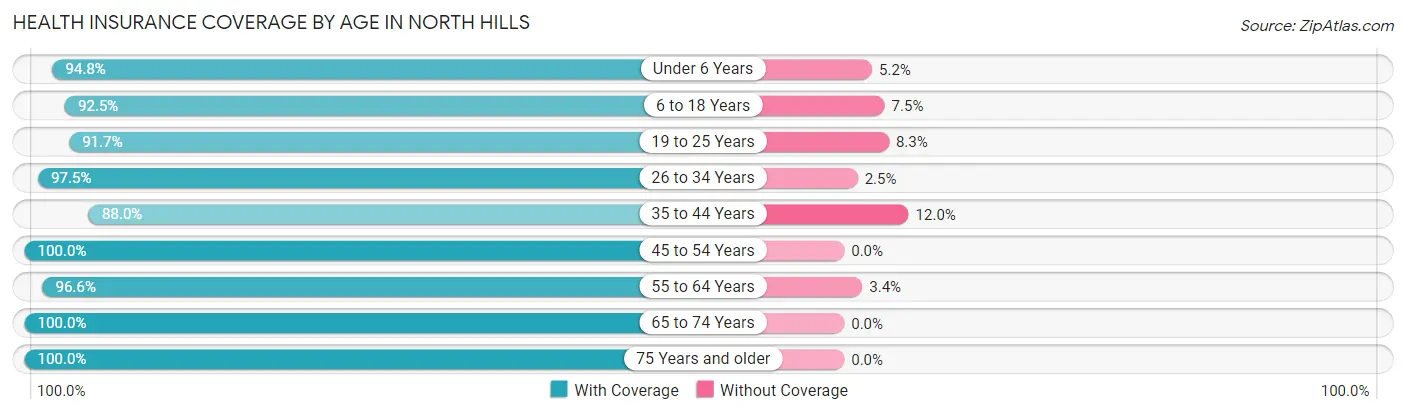
| Age Bracket | With Coverage | Without Coverage |
| Under 6 Years | 73 (94.8%) | 4 (5.2%) |
| 6 to 18 Years | 258 (92.5%) | 21 (7.5%) |
| 19 to 25 Years | 77 (91.7%) | 7 (8.3%) |
| 26 to 34 Years | 39 (97.5%) | 1 (2.5%) |
| 35 to 44 Years | 110 (88.0%) | 15 (12.0%) |
| 45 to 54 Years | 69 (100.0%) | 0 (0.0%) |
| 55 to 64 Years | 115 (96.6%) | 4 (3.4%) |
| 65 to 74 Years | 114 (100.0%) | 0 (0.0%) |
| 75 Years and older | 84 (100.0%) | 0 (0.0%) |
| Total | 939 (94.8%) | 52 (5.2%) |
Health Insurance Coverage by Citizenship Status in North Hills
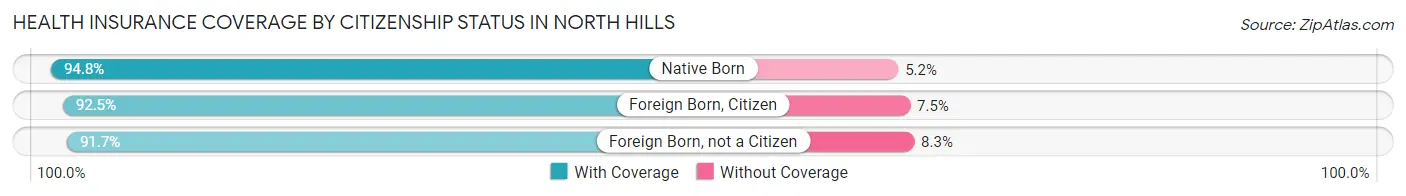
| Citizenship Status | With Coverage | Without Coverage |
| Native Born | 73 (94.8%) | 4 (5.2%) |
| Foreign Born, Citizen | 258 (92.5%) | 21 (7.5%) |
| Foreign Born, not a Citizen | 77 (91.7%) | 7 (8.3%) |
Health Insurance Coverage by Household Income in North Hills
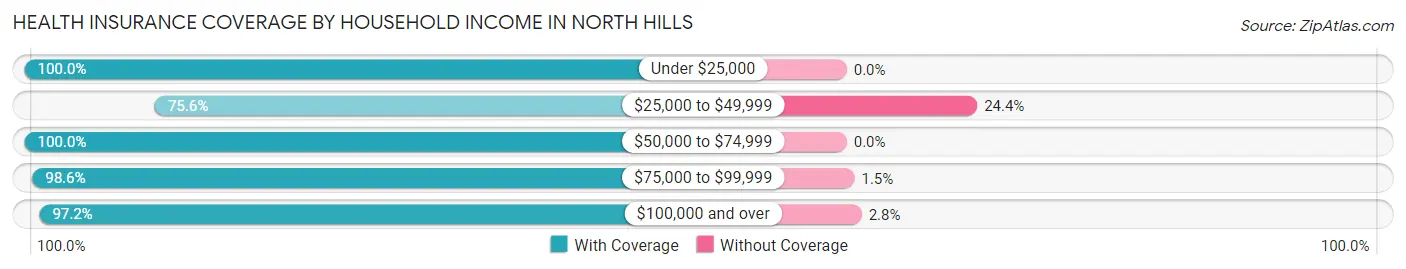
| Household Income | With Coverage | Without Coverage |
| Under $25,000 | 1 (100.0%) | 0 (0.0%) |
| $25,000 to $49,999 | 99 (75.6%) | 32 (24.4%) |
| $50,000 to $74,999 | 110 (100.0%) | 0 (0.0%) |
| $75,000 to $99,999 | 68 (98.6%) | 1 (1.5%) |
| $100,000 and over | 661 (97.2%) | 19 (2.8%) |
Public vs Private Health Insurance Coverage by Age in North Hills
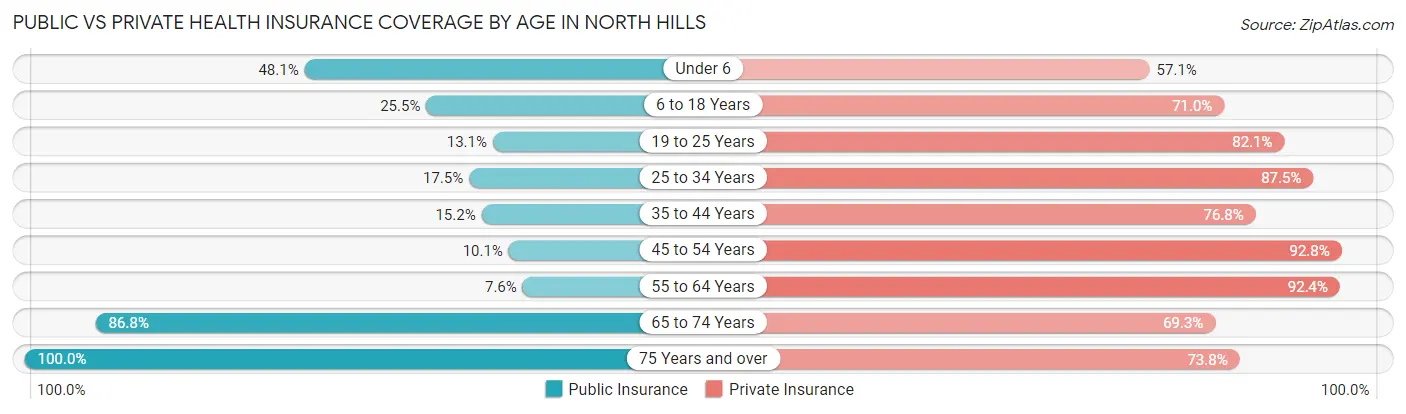
| Age Bracket | Public Insurance | Private Insurance |
| Under 6 | 37 (48.0%) | 44 (57.1%) |
| 6 to 18 Years | 71 (25.5%) | 198 (71.0%) |
| 19 to 25 Years | 11 (13.1%) | 69 (82.1%) |
| 25 to 34 Years | 7 (17.5%) | 35 (87.5%) |
| 35 to 44 Years | 19 (15.2%) | 96 (76.8%) |
| 45 to 54 Years | 7 (10.1%) | 64 (92.7%) |
| 55 to 64 Years | 9 (7.6%) | 110 (92.4%) |
| 65 to 74 Years | 99 (86.8%) | 79 (69.3%) |
| 75 Years and over | 84 (100.0%) | 62 (73.8%) |
| Total | 344 (34.7%) | 757 (76.4%) |
Disability Status by Sex by Age in North Hills
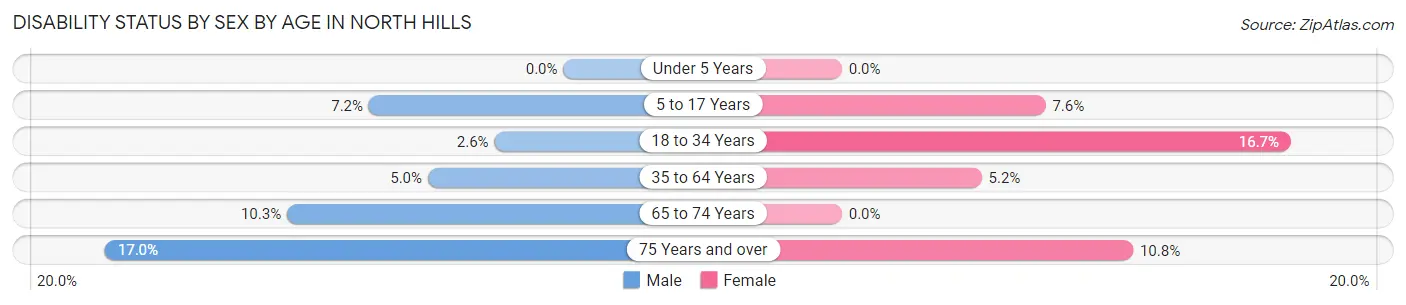
| Age Bracket | Male | Female |
| Under 5 Years | 0 (0.0%) | 0 (0.0%) |
| 5 to 17 Years | 13 (7.2%) | 9 (7.6%) |
| 18 to 34 Years | 2 (2.6%) | 8 (16.7%) |
| 35 to 64 Years | 8 (5.0%) | 8 (5.2%) |
| 65 to 74 Years | 4 (10.3%) | 0 (0.0%) |
| 75 Years and over | 8 (17.0%) | 4 (10.8%) |
Disability Class by Sex by Age in North Hills
Disability Class: Hearing Difficulty
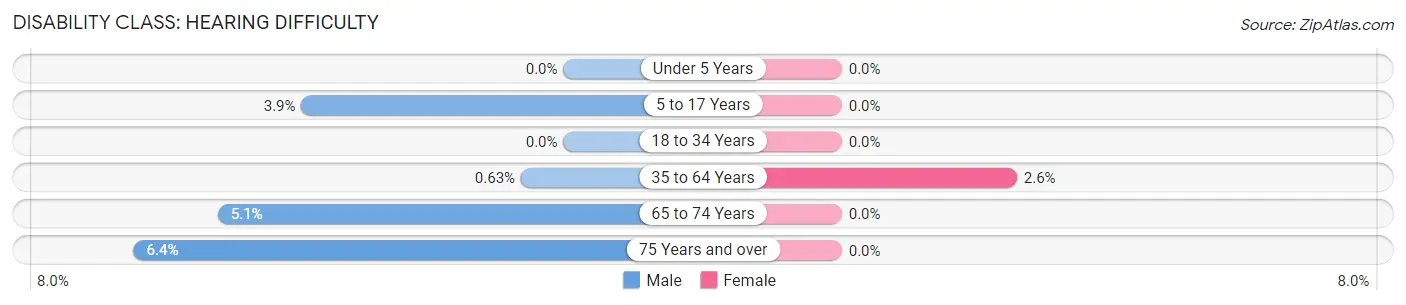
| Age Bracket | Male | Female |
| Under 5 Years | 0 (0.0%) | 0 (0.0%) |
| 5 to 17 Years | 7 (3.9%) | 0 (0.0%) |
| 18 to 34 Years | 0 (0.0%) | 0 (0.0%) |
| 35 to 64 Years | 1 (0.6%) | 4 (2.6%) |
| 65 to 74 Years | 2 (5.1%) | 0 (0.0%) |
| 75 Years and over | 3 (6.4%) | 0 (0.0%) |
Disability Class: Vision Difficulty
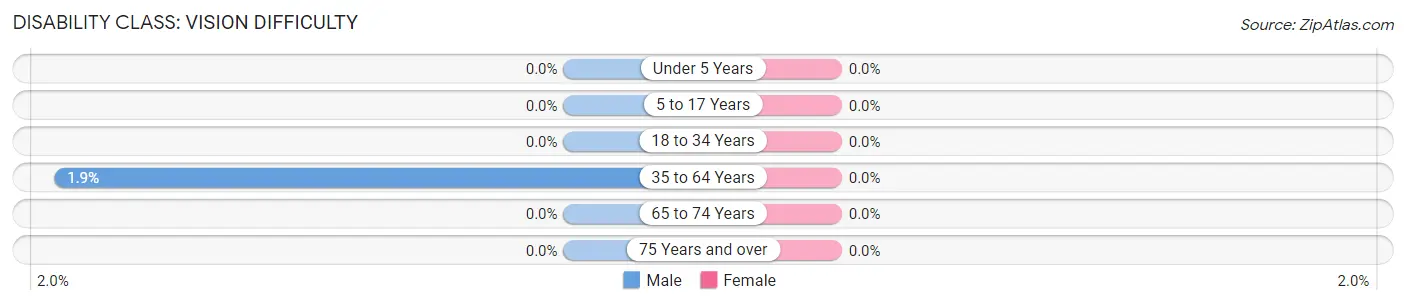
| Age Bracket | Male | Female |
| Under 5 Years | 0 (0.0%) | 0 (0.0%) |
| 5 to 17 Years | 0 (0.0%) | 0 (0.0%) |
| 18 to 34 Years | 0 (0.0%) | 0 (0.0%) |
| 35 to 64 Years | 3 (1.9%) | 0 (0.0%) |
| 65 to 74 Years | 0 (0.0%) | 0 (0.0%) |
| 75 Years and over | 0 (0.0%) | 0 (0.0%) |
Disability Class: Cognitive Difficulty
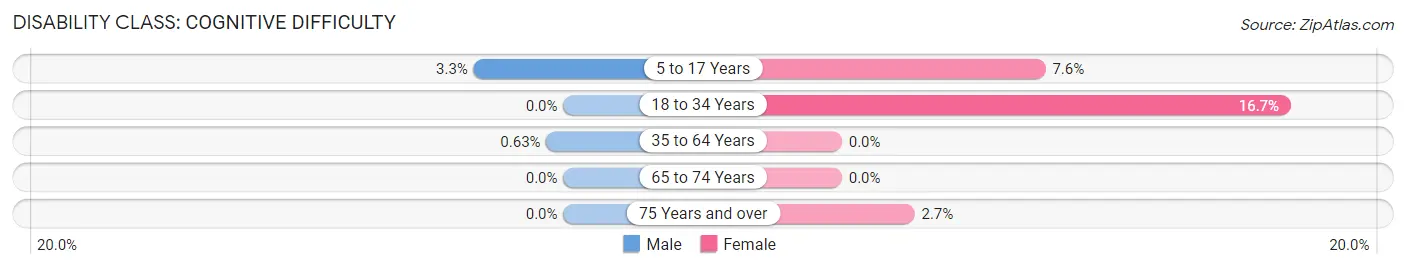
| Age Bracket | Male | Female |
| 5 to 17 Years | 6 (3.3%) | 9 (7.6%) |
| 18 to 34 Years | 0 (0.0%) | 8 (16.7%) |
| 35 to 64 Years | 1 (0.6%) | 0 (0.0%) |
| 65 to 74 Years | 0 (0.0%) | 0 (0.0%) |
| 75 Years and over | 0 (0.0%) | 1 (2.7%) |
Disability Class: Ambulatory Difficulty
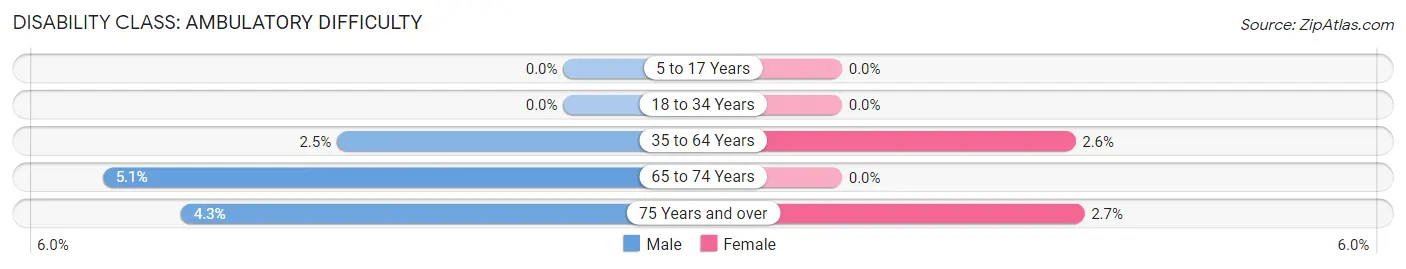
| Age Bracket | Male | Female |
| 5 to 17 Years | 0 (0.0%) | 0 (0.0%) |
| 18 to 34 Years | 0 (0.0%) | 0 (0.0%) |
| 35 to 64 Years | 4 (2.5%) | 4 (2.6%) |
| 65 to 74 Years | 2 (5.1%) | 0 (0.0%) |
| 75 Years and over | 2 (4.3%) | 1 (2.7%) |
Disability Class: Self-Care Difficulty
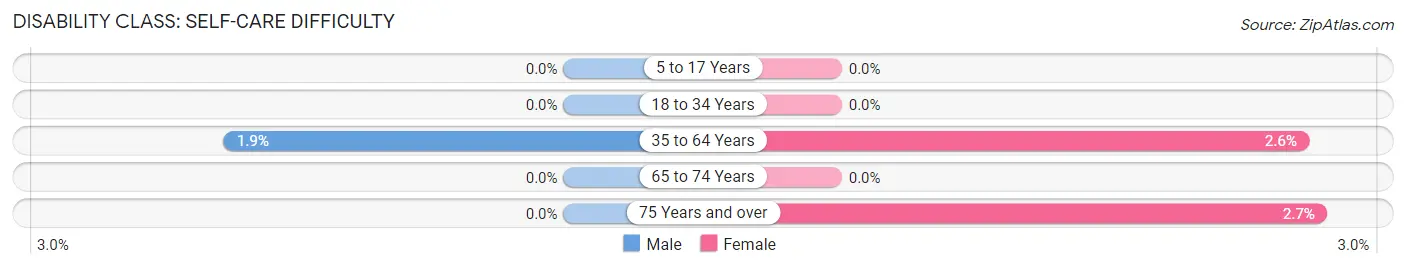
| Age Bracket | Male | Female |
| 5 to 17 Years | 0 (0.0%) | 0 (0.0%) |
| 18 to 34 Years | 0 (0.0%) | 0 (0.0%) |
| 35 to 64 Years | 3 (1.9%) | 4 (2.6%) |
| 65 to 74 Years | 0 (0.0%) | 0 (0.0%) |
| 75 Years and over | 0 (0.0%) | 1 (2.7%) |
Technology Access in North Hills
Computing Device Access in North Hills
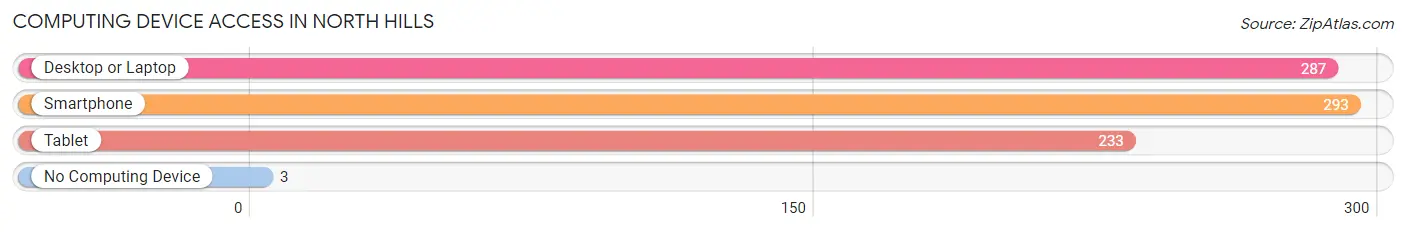
| Device Type | # Households | % Households |
| Desktop or Laptop | 287 | 92.9% |
| Smartphone | 293 | 94.8% |
| Tablet | 233 | 75.4% |
| No Computing Device | 3 | 1.0% |
| Total | 309 | 100.0% |
Internet Access in North Hills
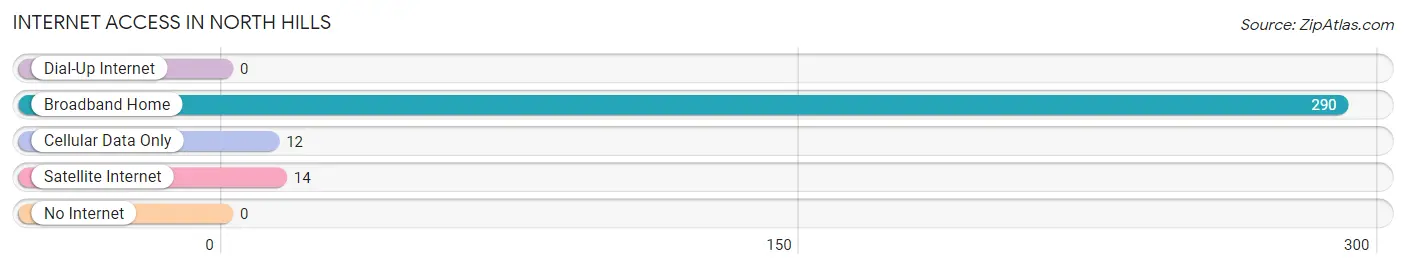
| Internet Type | # Households | % Households |
| Dial-Up Internet | 0 | 0.0% |
| Broadband Home | 290 | 93.9% |
| Cellular Data Only | 12 | 3.9% |
| Satellite Internet | 14 | 4.5% |
| No Internet | 0 | 0.0% |
| Total | 309 | 100.0% |
North Hills Summary
History
North Hills, West Virginia is a small unincorporated community located in the northern part of the state. It is situated in the foothills of the Appalachian Mountains and is part of the Monongahela National Forest. The area was first settled in the late 1700s by settlers from Pennsylvania and Virginia. The first settlers were mostly farmers and loggers who were attracted to the area due to its abundant natural resources.
The area was originally known as “North Hill” and was part of the larger area known as “The Great North Hill”. The area was home to several small settlements, including the towns of North Hill, South Hill, and East Hill. The area was also home to several small coal mines, which provided employment for many of the area’s residents.
In the late 1800s, the area was home to a large logging industry. Logging was the primary industry in the area until the early 1900s when the coal industry began to take over. The coal industry provided employment for many of the area’s residents and helped to spur economic growth in the area.
The area was also home to several small businesses, including a general store, a post office, and a blacksmith shop. The area was also home to several churches, including the North Hill Methodist Church, which was established in 1883.
The area was also home to several schools, including the North Hill School, which was established in 1891. The school was later renamed the North Hills School and is still in operation today.
Geography
North Hills is located in the northern part of West Virginia in the foothills of the Appalachian Mountains. The area is part of the Monongahela National Forest and is home to several small streams and rivers, including the North Fork of the Potomac River. The area is also home to several small mountains, including the North Hill Mountain, which is the highest peak in the area.
The area is also home to several small towns, including North Hill, South Hill, and East Hill. The area is also home to several small coal mines, which provided employment for many of the area’s residents.
Economy
The economy of North Hills is largely based on the coal industry. The area is home to several small coal mines, which provide employment for many of the area’s residents. The coal industry has been the primary source of employment in the area for many years and has helped to spur economic growth in the area.
The area is also home to several small businesses, including a general store, a post office, and a blacksmith shop. The area is also home to several churches, including the North Hill Methodist Church, which was established in 1883.
The area is also home to several schools, including the North Hills School, which was established in 1891. The school is still in operation today and provides education to the area’s children.
Demographics
As of the 2010 census, the population of North Hills was 1,845. The population is largely white, with a small percentage of African Americans and Native Americans. The median household income in the area is $37,000, which is slightly lower than the national average. The median age in the area is 44.7 years, which is slightly higher than the national average. The area is largely rural, with most of the population living in small towns and villages.
Common Questions
What is Per Capita Income in North Hills?
Per Capita income in North Hills is $47,980.
What is the Median Family Income in North Hills?
Median Family Income in North Hills is $138,929.
What is the Median Household income in North Hills?
Median Household Income in North Hills is $137,875.
What is Income or Wage Gap in North Hills?
Income or Wage Gap in North Hills is 47.4%.
Women in North Hills earn 52.6 cents for every dollar earned by a man.
What is Inequality or Gini Index in North Hills?
Inequality or Gini Index in North Hills is 0.37.
What is the Total Population of North Hills?
Total Population of North Hills is 991.
What is the Total Male Population of North Hills?
Total Male Population of North Hills is 532.
What is the Total Female Population of North Hills?
Total Female Population of North Hills is 459.
What is the Ratio of Males per 100 Females in North Hills?
There are 115.90 Males per 100 Females in North Hills.
What is the Ratio of Females per 100 Males in North Hills?
There are 86.28 Females per 100 Males in North Hills.
What is the Median Population Age in North Hills?
Median Population Age in North Hills is 37.4 Years.
What is the Average Family Size in North Hills
Average Family Size in North Hills is 3.4 People.
What is the Average Household Size in North Hills
Average Household Size in North Hills is 3.2 People.
How Large is the Labor Force in North Hills?
There are 389 People in the Labor Forcein in North Hills.
What is the Percentage of People in the Labor Force in North Hills?
58.4% of People are in the Labor Force in North Hills.
What is the Unemployment Rate in North Hills?
Unemployment Rate in North Hills is 5.1%.