West Milford, WV Map & Demographics
West Milford Map
West Milford Overview
$28,871
PER CAPITA INCOME
$88,542
AVG FAMILY INCOME
$59,297
AVG HOUSEHOLD INCOME
37.3%
WAGE / INCOME GAP [ % ]
62.7¢/ $1
WAGE / INCOME GAP [ $ ]
0.32
INEQUALITY / GINI INDEX
501
TOTAL POPULATION
199
MALE POPULATION
302
FEMALE POPULATION
65.89
MALES / 100 FEMALES
151.76
FEMALES / 100 MALES
32.4
MEDIAN AGE
3.3
AVG FAMILY SIZE
2.7
AVG HOUSEHOLD SIZE
286
LABOR FORCE [ PEOPLE ]
76.3%
PERCENT IN LABOR FORCE
3.1%
UNEMPLOYMENT RATE
West Milford Zip Codes
West Milford Area Codes
Income in West Milford
Income Overview in West Milford
Per Capita Income in West Milford is $28,871, while median incomes of families and households are $88,542 and $59,297 respectively.
| Characteristic | Number | Measure |
| Per Capita Income | 501 | $28,871 |
| Median Family Income | 127 | $88,542 |
| Mean Family Income | 127 | $88,949 |
| Median Household Income | 187 | $59,297 |
| Mean Household Income | 187 | $74,776 |
| Income Deficit | 127 | $0 |
| Wage / Income Gap (%) | 501 | 37.27% |
| Wage / Income Gap ($) | 501 | 62.73¢ per $1 |
| Gini / Inequality Index | 501 | 0.32 |
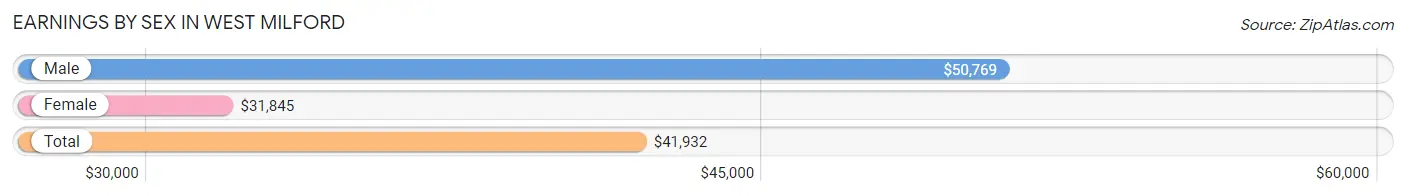
Earnings by Sex in West Milford
Average Earnings in West Milford are $41,932, $50,769 for men and $31,845 for women, a difference of 37.3%.
| Sex | Number | Average Earnings |
| Male | 128 (45.6%) | $50,769 |
| Female | 153 (54.4%) | $31,845 |
| Total | 281 (100.0%) | $41,932 |
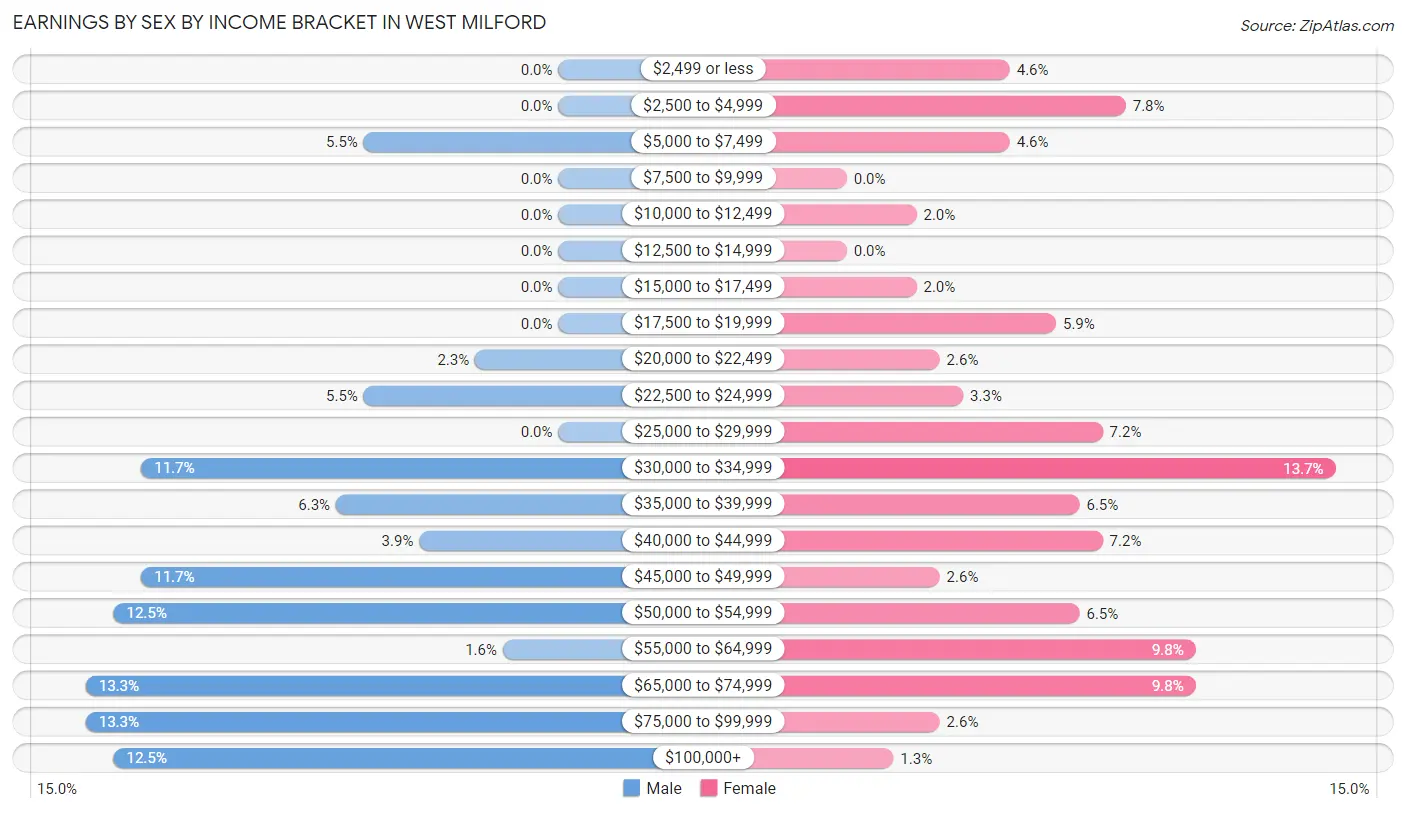
Earnings by Sex by Income Bracket in West Milford
The most common earnings brackets in West Milford are $65,000 to $74,999 for men (17 | 13.3%) and $30,000 to $34,999 for women (21 | 13.7%).
| Income | Male | Female |
| $2,499 or less | 0 (0.0%) | 7 (4.6%) |
| $2,500 to $4,999 | 0 (0.0%) | 12 (7.8%) |
| $5,000 to $7,499 | 7 (5.5%) | 7 (4.6%) |
| $7,500 to $9,999 | 0 (0.0%) | 0 (0.0%) |
| $10,000 to $12,499 | 0 (0.0%) | 3 (2.0%) |
| $12,500 to $14,999 | 0 (0.0%) | 0 (0.0%) |
| $15,000 to $17,499 | 0 (0.0%) | 3 (2.0%) |
| $17,500 to $19,999 | 0 (0.0%) | 9 (5.9%) |
| $20,000 to $22,499 | 3 (2.3%) | 4 (2.6%) |
| $22,500 to $24,999 | 7 (5.5%) | 5 (3.3%) |
| $25,000 to $29,999 | 0 (0.0%) | 11 (7.2%) |
| $30,000 to $34,999 | 15 (11.7%) | 21 (13.7%) |
| $35,000 to $39,999 | 8 (6.2%) | 10 (6.5%) |
| $40,000 to $44,999 | 5 (3.9%) | 11 (7.2%) |
| $45,000 to $49,999 | 15 (11.7%) | 4 (2.6%) |
| $50,000 to $54,999 | 16 (12.5%) | 10 (6.5%) |
| $55,000 to $64,999 | 2 (1.6%) | 15 (9.8%) |
| $65,000 to $74,999 | 17 (13.3%) | 15 (9.8%) |
| $75,000 to $99,999 | 17 (13.3%) | 4 (2.6%) |
| $100,000+ | 16 (12.5%) | 2 (1.3%) |
| Total | 128 (100.0%) | 153 (100.0%) |
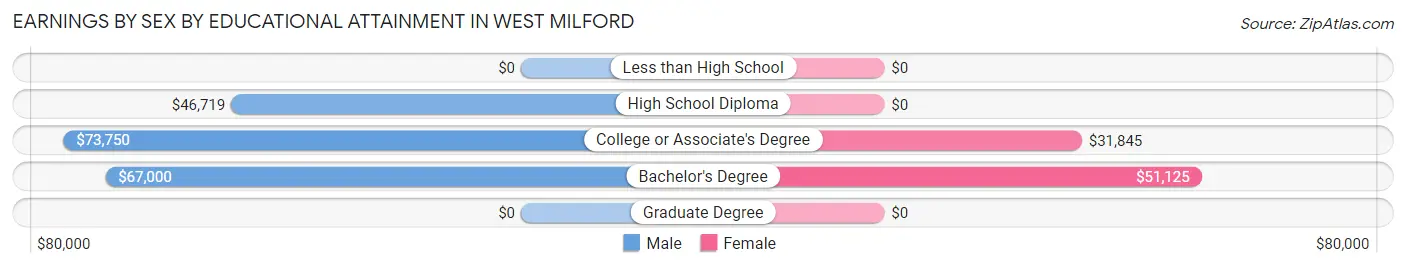
Earnings by Sex by Educational Attainment in West Milford
Average earnings in West Milford are $52,019 for men and $40,536 for women, a difference of 22.1%. Men with an educational attainment of college or associate's degree enjoy the highest average annual earnings of $73,750, while those with high school diploma education earn the least with $46,719. Women with an educational attainment of bachelor's degree earn the most with the average annual earnings of $51,125, while those with college or associate's degree education have the smallest earnings of $31,845.
| Educational Attainment | Male Income | Female Income |
| Less than High School | - | - |
| High School Diploma | $46,719 | $0 |
| College or Associate's Degree | $73,750 | $31,845 |
| Bachelor's Degree | $67,000 | $51,125 |
| Graduate Degree | - | - |
| Total | $52,019 | $40,536 |
Family Income in West Milford
Family Income Brackets in West Milford
According to the West Milford family income data, there are 47 families falling into the $50,000 to $74,999 income range, which is the most common income bracket and makes up 37.0% of all families.
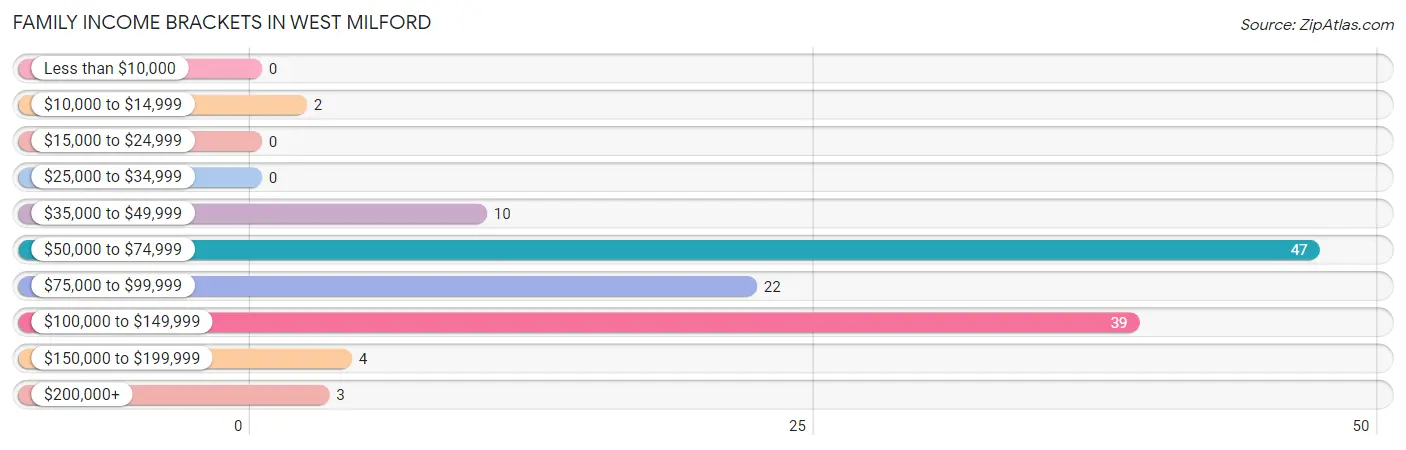
| Income Bracket | # Families | % Families |
| Less than $10,000 | 0 | 0.0% |
| $10,000 to $14,999 | 2 | 1.6% |
| $15,000 to $24,999 | 0 | 0.0% |
| $25,000 to $34,999 | 0 | 0.0% |
| $35,000 to $49,999 | 10 | 7.9% |
| $50,000 to $74,999 | 47 | 37.0% |
| $75,000 to $99,999 | 22 | 17.3% |
| $100,000 to $149,999 | 39 | 30.7% |
| $150,000 to $199,999 | 4 | 3.1% |
| $200,000+ | 3 | 2.4% |
Family Income by Famaliy Size in West Milford
4-person families (27 | 21.3%) account for the highest median family income in West Milford with $140,125 per family, while 2-person families (60 | 47.2%) have the highest median income of $44,792 per family member.
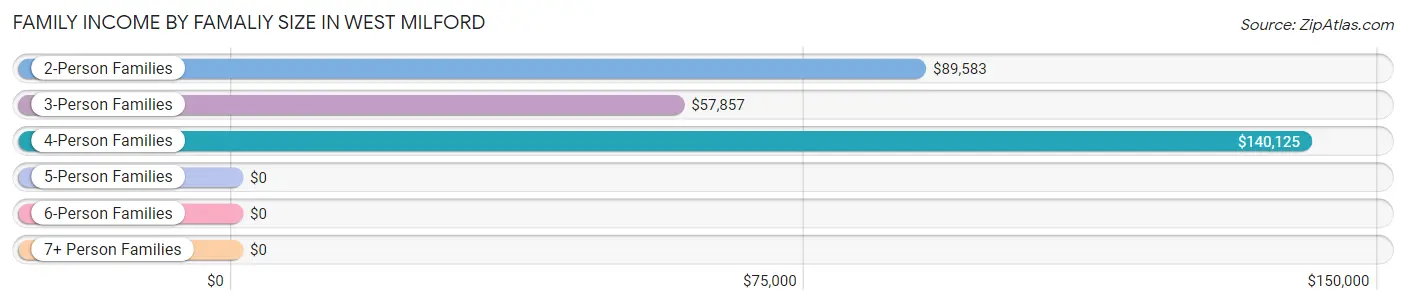
| Income Bracket | # Families | Median Income |
| 2-Person Families | 60 (47.2%) | $89,583 |
| 3-Person Families | 32 (25.2%) | $57,857 |
| 4-Person Families | 27 (21.3%) | $140,125 |
| 5-Person Families | 0 (0.0%) | $0 |
| 6-Person Families | 7 (5.5%) | $0 |
| 7+ Person Families | 1 (0.8%) | $0 |
| Total | 127 (100.0%) | $88,542 |
Family Income by Number of Earners in West Milford
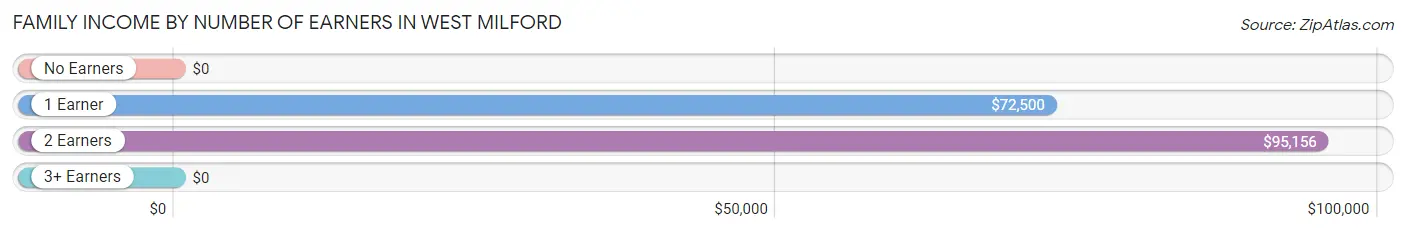
| Number of Earners | # Families | Median Income |
| No Earners | 1 (0.8%) | $0 |
| 1 Earner | 46 (36.2%) | $72,500 |
| 2 Earners | 71 (55.9%) | $95,156 |
| 3+ Earners | 9 (7.1%) | $0 |
| Total | 127 (100.0%) | $88,542 |
Household Income in West Milford
Household Income Brackets in West Milford
With 60 households falling in the category, the $50,000 to $74,999 income range is the most frequent in West Milford, accounting for 32.1% of all households.
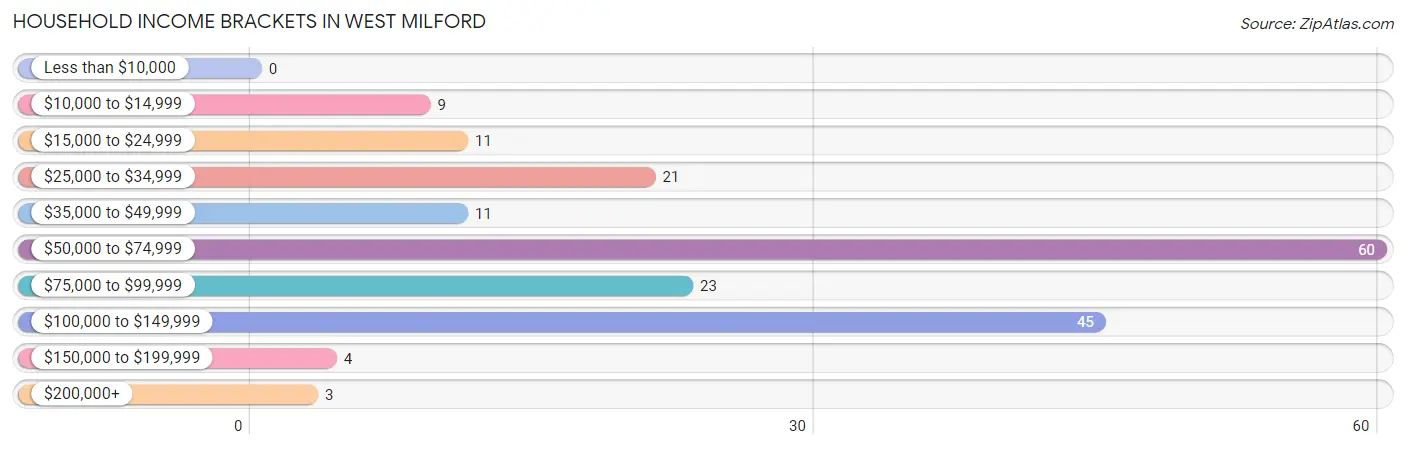
| Income Bracket | # Households | % Households |
| Less than $10,000 | 0 | 0.0% |
| $10,000 to $14,999 | 9 | 4.8% |
| $15,000 to $24,999 | 11 | 5.9% |
| $25,000 to $34,999 | 21 | 11.2% |
| $35,000 to $49,999 | 11 | 5.9% |
| $50,000 to $74,999 | 60 | 32.1% |
| $75,000 to $99,999 | 23 | 12.3% |
| $100,000 to $149,999 | 45 | 24.1% |
| $150,000 to $199,999 | 4 | 2.1% |
| $200,000+ | 3 | 1.6% |
Household Income by Householder Age in West Milford
The median household income in West Milford is $59,297, with the highest median household income of $60,417 found in the 45 to 64 years age bracket for the primary householder. A total of 82 households (43.9%) fall into this category. Meanwhile, the 15 to 24 years age bracket for the primary householder has the lowest median household income of $0, with 12 households (6.4%) in this group.
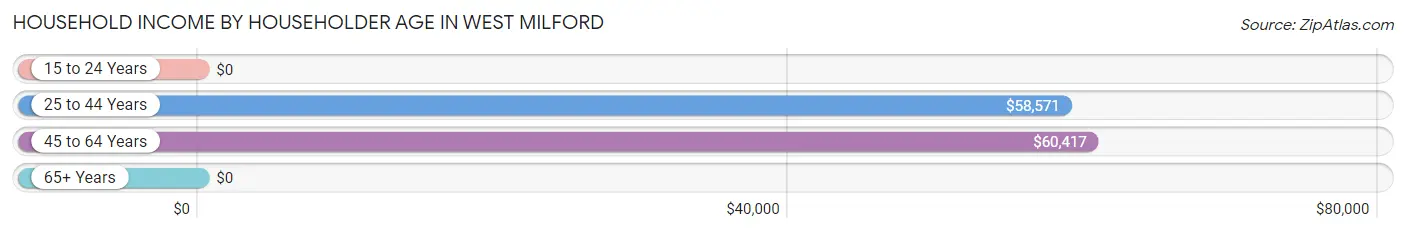
| Income Bracket | # Households | Median Income |
| 15 to 24 Years | 12 (6.4%) | $0 |
| 25 to 44 Years | 64 (34.2%) | $58,571 |
| 45 to 64 Years | 82 (43.9%) | $60,417 |
| 65+ Years | 29 (15.5%) | $0 |
| Total | 187 (100.0%) | $59,297 |
Poverty in West Milford
Income Below Poverty by Sex and Age in West Milford
With 3.0% poverty level for males and 5.6% for females among the residents of West Milford, 6 to 11 year old males and 65 to 74 year old females are the most vulnerable to poverty, with 3 males (21.4%) and 5 females (31.2%) in their respective age groups living below the poverty level.
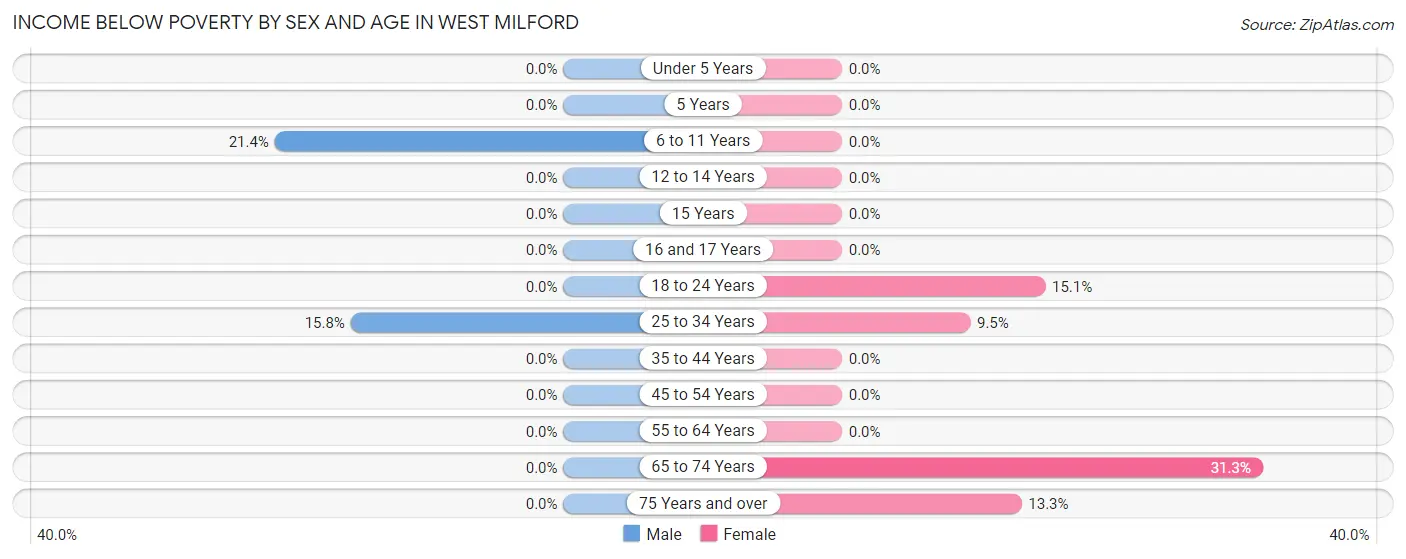
| Age Bracket | Male | Female |
| Under 5 Years | 0 (0.0%) | 0 (0.0%) |
| 5 Years | 0 (0.0%) | 0 (0.0%) |
| 6 to 11 Years | 3 (21.4%) | 0 (0.0%) |
| 12 to 14 Years | 0 (0.0%) | 0 (0.0%) |
| 15 Years | 0 (0.0%) | 0 (0.0%) |
| 16 and 17 Years | 0 (0.0%) | 0 (0.0%) |
| 18 to 24 Years | 0 (0.0%) | 8 (15.1%) |
| 25 to 34 Years | 3 (15.8%) | 2 (9.5%) |
| 35 to 44 Years | 0 (0.0%) | 0 (0.0%) |
| 45 to 54 Years | 0 (0.0%) | 0 (0.0%) |
| 55 to 64 Years | 0 (0.0%) | 0 (0.0%) |
| 65 to 74 Years | 0 (0.0%) | 5 (31.2%) |
| 75 Years and over | 0 (0.0%) | 2 (13.3%) |
| Total | 6 (3.0%) | 17 (5.6%) |
Income Above Poverty by Sex and Age in West Milford
According to the poverty statistics in West Milford, males aged under 5 years and females aged under 5 years are the age groups that are most secure financially, with 100.0% of males and 100.0% of females in these age groups living above the poverty line.
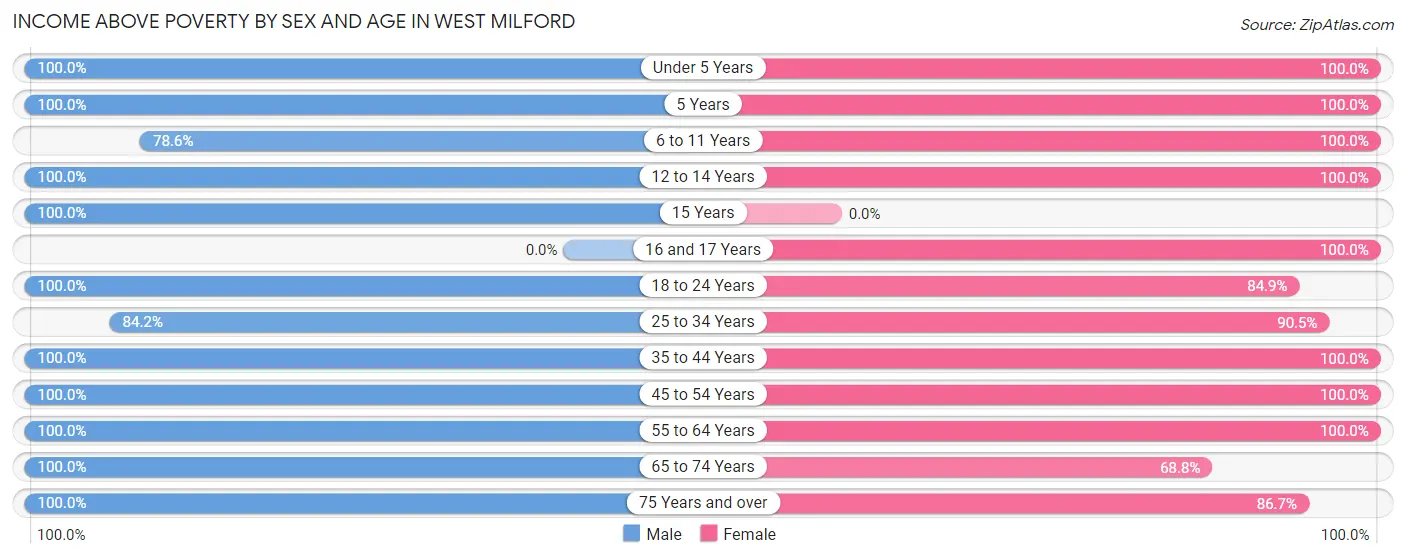
| Age Bracket | Male | Female |
| Under 5 Years | 5 (100.0%) | 10 (100.0%) |
| 5 Years | 4 (100.0%) | 14 (100.0%) |
| 6 to 11 Years | 11 (78.6%) | 49 (100.0%) |
| 12 to 14 Years | 16 (100.0%) | 5 (100.0%) |
| 15 Years | 9 (100.0%) | 0 (0.0%) |
| 16 and 17 Years | 0 (0.0%) | 1 (100.0%) |
| 18 to 24 Years | 39 (100.0%) | 45 (84.9%) |
| 25 to 34 Years | 16 (84.2%) | 19 (90.5%) |
| 35 to 44 Years | 22 (100.0%) | 56 (100.0%) |
| 45 to 54 Years | 31 (100.0%) | 32 (100.0%) |
| 55 to 64 Years | 32 (100.0%) | 30 (100.0%) |
| 65 to 74 Years | 5 (100.0%) | 11 (68.8%) |
| 75 Years and over | 3 (100.0%) | 13 (86.7%) |
| Total | 193 (97.0%) | 285 (94.4%) |
Income Below Poverty Among Married-Couple Families in West Milford
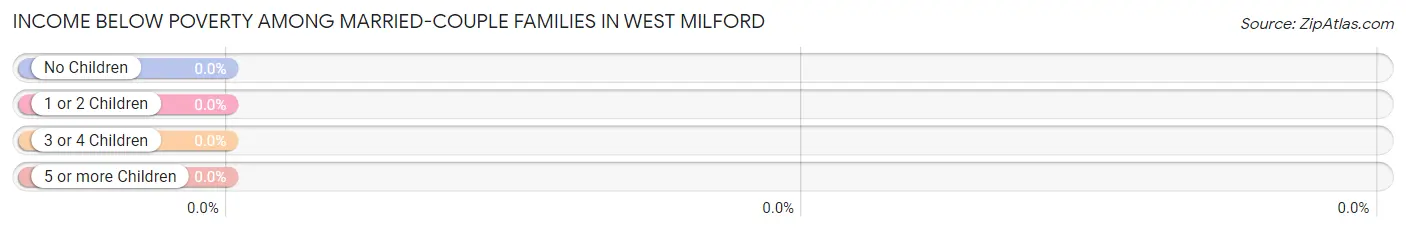
| Children | Above Poverty | Below Poverty |
| No Children | 54 (100.0%) | 0 (0.0%) |
| 1 or 2 Children | 24 (100.0%) | 0 (0.0%) |
| 3 or 4 Children | 5 (100.0%) | 0 (0.0%) |
| 5 or more Children | 1 (100.0%) | 0 (0.0%) |
| Total | 84 (100.0%) | 0 (0.0%) |
Income Below Poverty Among Single-Parent Households in West Milford
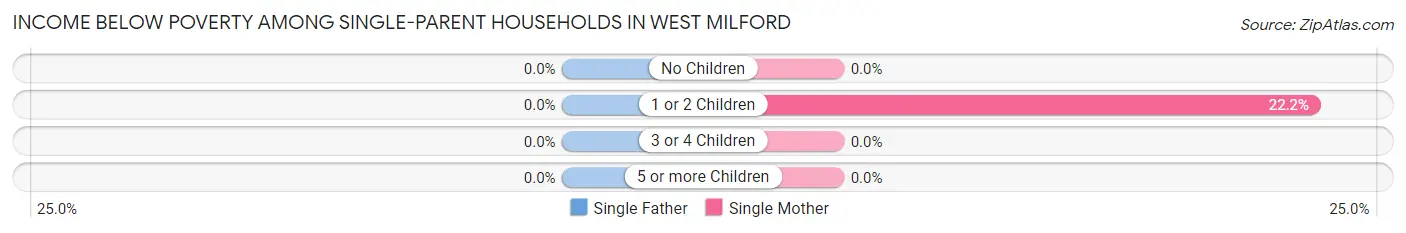
| Children | Single Father | Single Mother |
| No Children | 0 (0.0%) | 0 (0.0%) |
| 1 or 2 Children | 0 (0.0%) | 2 (22.2%) |
| 3 or 4 Children | 0 (0.0%) | 0 (0.0%) |
| 5 or more Children | 0 (0.0%) | 0 (0.0%) |
| Total | 0 (0.0%) | 2 (8.0%) |
Income Below Poverty Among Married-Couple vs Single-Parent Households in West Milford
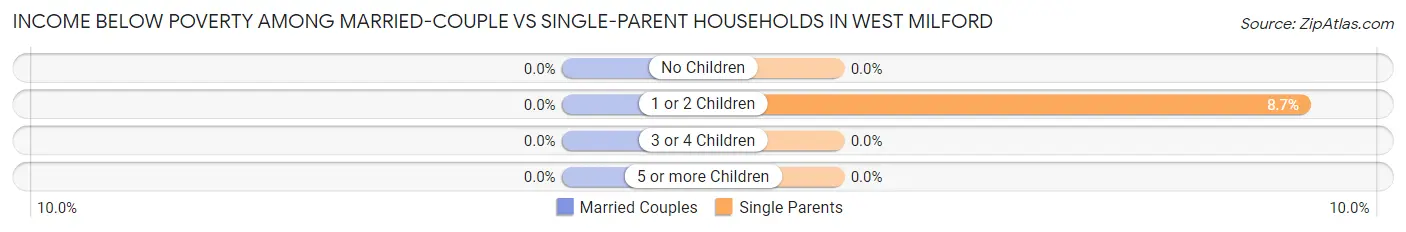
| Children | Married-Couple Families | Single-Parent Households |
| No Children | 0 (0.0%) | 0 (0.0%) |
| 1 or 2 Children | 0 (0.0%) | 2 (8.7%) |
| 3 or 4 Children | 0 (0.0%) | 0 (0.0%) |
| 5 or more Children | 0 (0.0%) | 0 (0.0%) |
| Total | 0 (0.0%) | 2 (4.6%) |
Race in West Milford
The most populous races in West Milford are White / Caucasian (487 | 97.2%), and Two or more Races (14 | 2.8%).
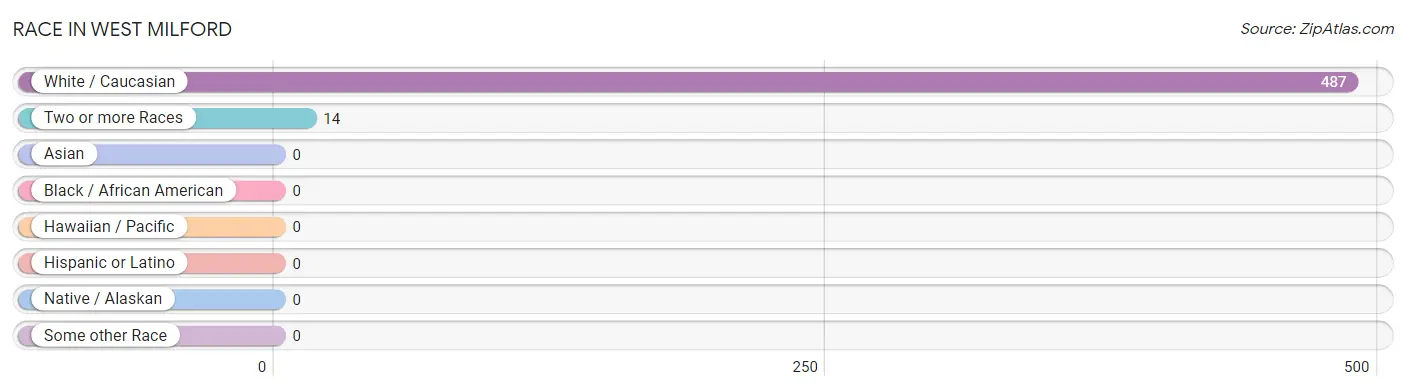
| Race | # Population | % Population |
| Asian | 0 | 0.0% |
| Black / African American | 0 | 0.0% |
| Hawaiian / Pacific | 0 | 0.0% |
| Hispanic or Latino | 0 | 0.0% |
| Native / Alaskan | 0 | 0.0% |
| White / Caucasian | 487 | 97.2% |
| Two or more Races | 14 | 2.8% |
| Some other Race | 0 | 0.0% |
| Total | 501 | 100.0% |
Ancestry in West Milford
The most populous ancestries reported in West Milford are German (103 | 20.6%), English (66 | 13.2%), Irish (65 | 13.0%), Scottish (59 | 11.8%), and Italian (58 | 11.6%), together accounting for 70.1% of all West Milford residents.
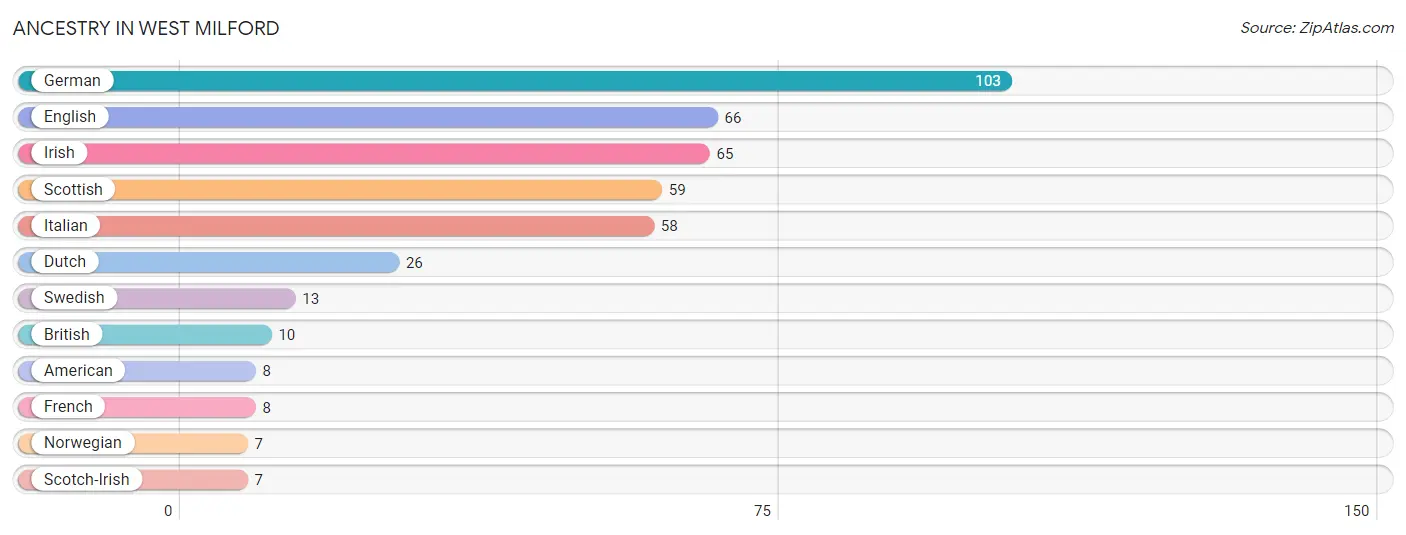
| Ancestry | # Population | % Population |
| American | 8 | 1.6% |
| British | 10 | 2.0% |
| Dutch | 26 | 5.2% |
| English | 66 | 13.2% |
| French | 8 | 1.6% |
| German | 103 | 20.6% |
| Irish | 65 | 13.0% |
| Italian | 58 | 11.6% |
| Norwegian | 7 | 1.4% |
| Scotch-Irish | 7 | 1.4% |
| Scottish | 59 | 11.8% |
| Swedish | 13 | 2.6% | View All 12 Rows |
Immigrants in West Milford

| Immigration Origin | # Population | % Population | View All 0 Rows |
Sex and Age in West Milford
Sex and Age in West Milford
The most populous age groups in West Milford are 20 to 24 Years (28 | 14.1%) for men and 40 to 44 Years (44 | 14.6%) for women.
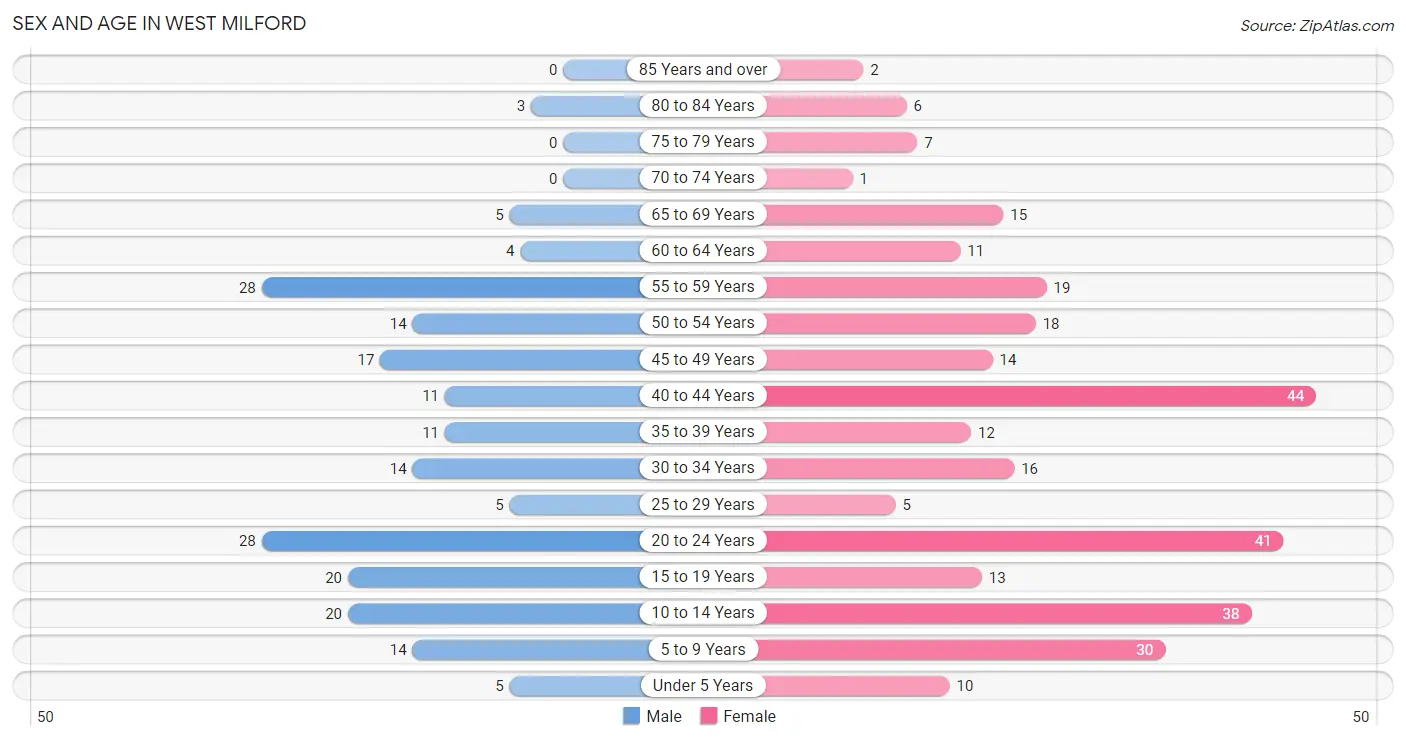
| Age Bracket | Male | Female |
| Under 5 Years | 5 (2.5%) | 10 (3.3%) |
| 5 to 9 Years | 14 (7.0%) | 30 (9.9%) |
| 10 to 14 Years | 20 (10.1%) | 38 (12.6%) |
| 15 to 19 Years | 20 (10.1%) | 13 (4.3%) |
| 20 to 24 Years | 28 (14.1%) | 41 (13.6%) |
| 25 to 29 Years | 5 (2.5%) | 5 (1.7%) |
| 30 to 34 Years | 14 (7.0%) | 16 (5.3%) |
| 35 to 39 Years | 11 (5.5%) | 12 (4.0%) |
| 40 to 44 Years | 11 (5.5%) | 44 (14.6%) |
| 45 to 49 Years | 17 (8.5%) | 14 (4.6%) |
| 50 to 54 Years | 14 (7.0%) | 18 (6.0%) |
| 55 to 59 Years | 28 (14.1%) | 19 (6.3%) |
| 60 to 64 Years | 4 (2.0%) | 11 (3.6%) |
| 65 to 69 Years | 5 (2.5%) | 15 (5.0%) |
| 70 to 74 Years | 0 (0.0%) | 1 (0.3%) |
| 75 to 79 Years | 0 (0.0%) | 7 (2.3%) |
| 80 to 84 Years | 3 (1.5%) | 6 (2.0%) |
| 85 Years and over | 0 (0.0%) | 2 (0.7%) |
| Total | 199 (100.0%) | 302 (100.0%) |
Families and Households in West Milford
Median Family Size in West Milford
The median family size in West Milford is 3.31 persons per family, with married-couple families (84 | 66.1%) accounting for the largest median family size of 3.6 persons per family. On the other hand, single male/father families (18 | 14.2%) represent the smallest median family size with 2.39 persons per family.
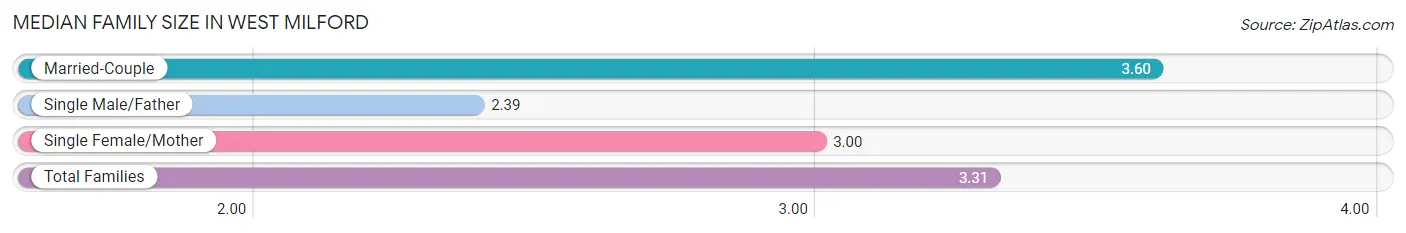
| Family Type | # Families | Family Size |
| Married-Couple | 84 (66.1%) | 3.60 |
| Single Male/Father | 18 (14.2%) | 2.39 |
| Single Female/Mother | 25 (19.7%) | 3.00 |
| Total Families | 127 (100.0%) | 3.31 |
Median Household Size in West Milford
The median household size in West Milford is 2.68 persons per household, with married-couple households (84 | 44.9%) accounting for the largest median household size of 3.65 persons per household. non-family households (60 | 32.1%) represent the smallest median household size with 1.07 persons per household.
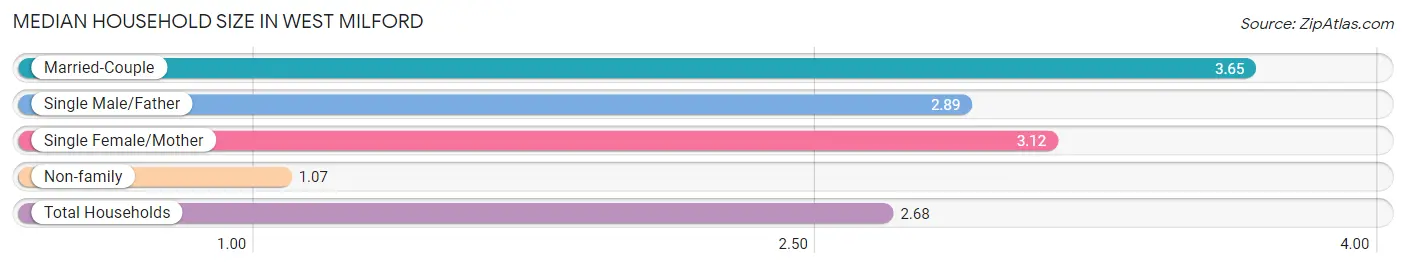
| Household Type | # Households | Household Size |
| Married-Couple | 84 (44.9%) | 3.65 |
| Single Male/Father | 18 (9.6%) | 2.89 |
| Single Female/Mother | 25 (13.4%) | 3.12 |
| Non-family | 60 (32.1%) | 1.07 |
| Total Households | 187 (100.0%) | 2.68 |
Household Size by Marriage Status in West Milford
Out of a total of 187 households in West Milford, 127 (67.9%) are family households, while 60 (32.1%) are nonfamily households. The most numerous type of family households are 2-person households, comprising 51, and the most common type of nonfamily households are 1-person households, comprising 56.
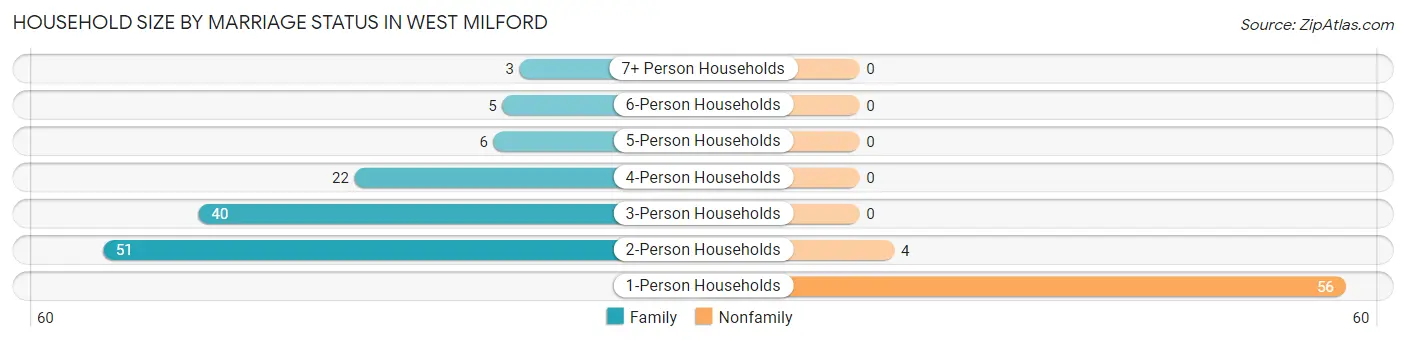
| Household Size | Family Households | Nonfamily Households |
| 1-Person Households | - | 56 (29.9%) |
| 2-Person Households | 51 (27.3%) | 4 (2.1%) |
| 3-Person Households | 40 (21.4%) | 0 (0.0%) |
| 4-Person Households | 22 (11.8%) | 0 (0.0%) |
| 5-Person Households | 6 (3.2%) | 0 (0.0%) |
| 6-Person Households | 5 (2.7%) | 0 (0.0%) |
| 7+ Person Households | 3 (1.6%) | 0 (0.0%) |
| Total | 127 (67.9%) | 60 (32.1%) |
Female Fertility in West Milford
Fertility by Age in West Milford
Average fertility rate in West Milford is 21.0 births per 1,000 women. Women in the age bracket of 20 to 34 years have the highest fertility rate with 48.0 births per 1,000 women. Women in the age bracket of 20 to 34 years acount for 100.0% of all women with births.
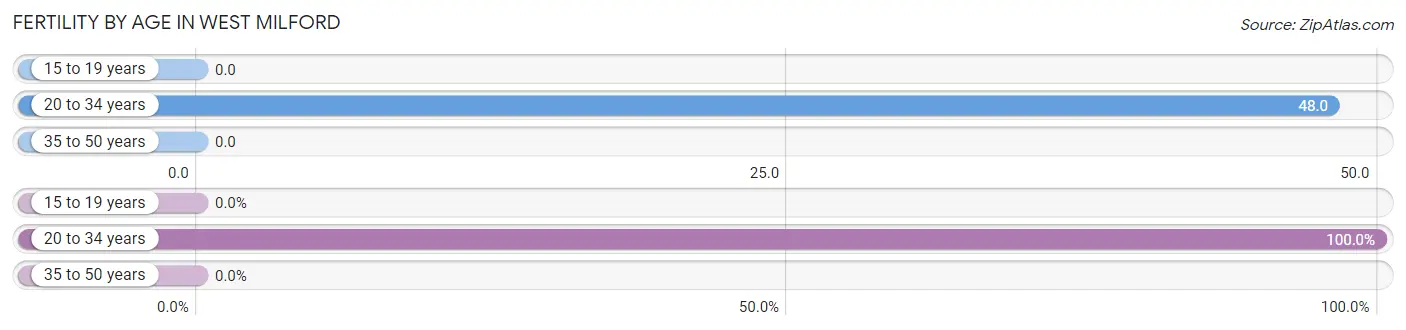
| Age Bracket | Women with Births | Births / 1,000 Women |
| 15 to 19 years | 0 (0.0%) | 0.0 |
| 20 to 34 years | 3 (100.0%) | 48.0 |
| 35 to 50 years | 0 (0.0%) | 0.0 |
| Total | 3 (100.0%) | 21.0 |
Fertility by Age by Marriage Status in West Milford
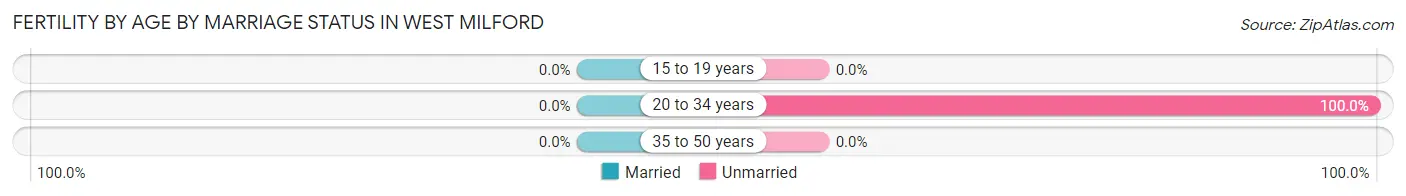
| Age Bracket | Married | Unmarried |
| 15 to 19 years | 0 (0.0%) | 0 (0.0%) |
| 20 to 34 years | 0 (0.0%) | 3 (100.0%) |
| 35 to 50 years | 0 (0.0%) | 0 (0.0%) |
| Total | 0 (0.0%) | 3 (100.0%) |
Fertility by Education in West Milford
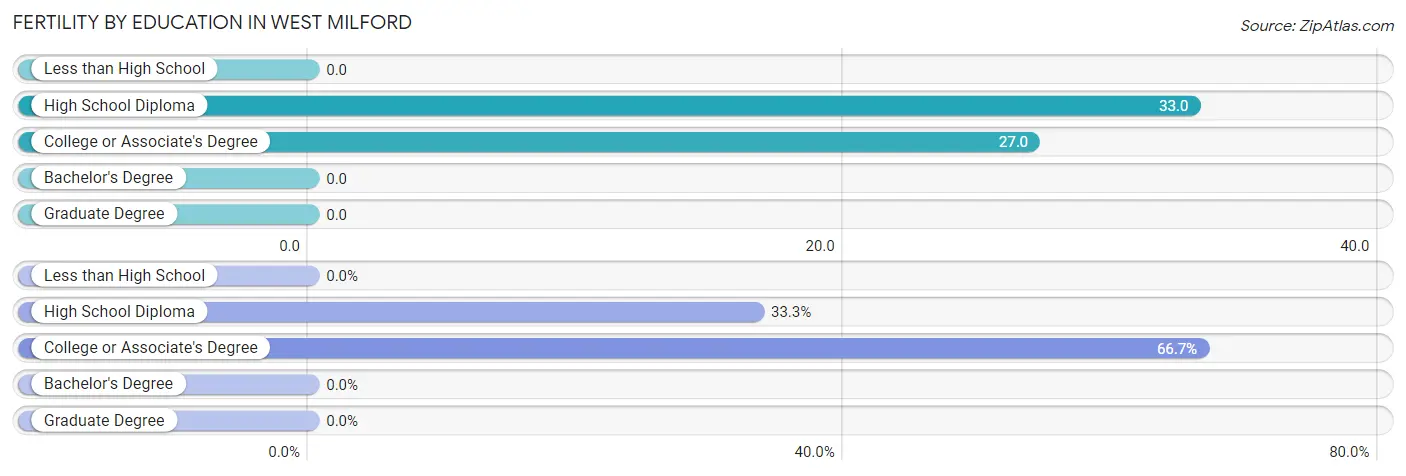
| Educational Attainment | Women with Births | Births / 1,000 Women |
| Less than High School | 0 (0.0%) | 0.0 |
| High School Diploma | 1 (33.3%) | 33.0 |
| College or Associate's Degree | 2 (66.7%) | 27.0 |
| Bachelor's Degree | 0 (0.0%) | 0.0 |
| Graduate Degree | 0 (0.0%) | 0.0 |
| Total | 3 (100.0%) | 21.0 |
Fertility by Education by Marriage Status in West Milford
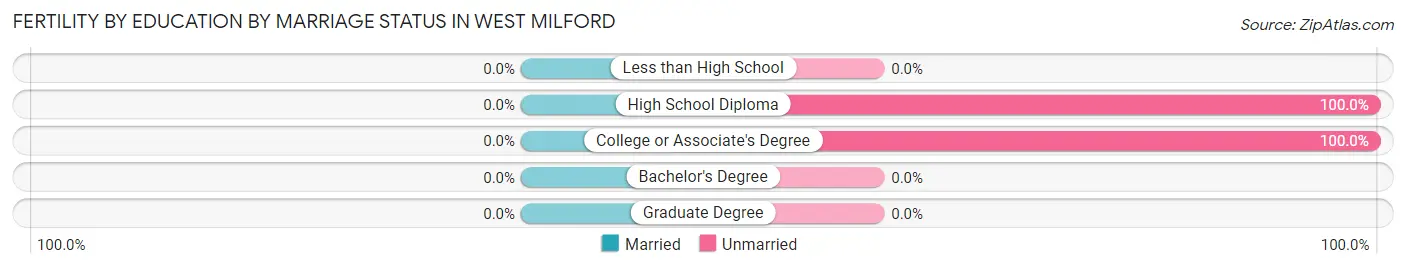
| Educational Attainment | Married | Unmarried |
| Less than High School | 0 (0.0%) | 0 (0.0%) |
| High School Diploma | 0 (0.0%) | 1 (100.0%) |
| College or Associate's Degree | 0 (0.0%) | 2 (100.0%) |
| Bachelor's Degree | 0 (0.0%) | 0 (0.0%) |
| Graduate Degree | 0 (0.0%) | 0 (0.0%) |
| Total | 0 (0.0%) | 3 (100.0%) |
Employment Characteristics in West Milford
Employment by Class of Employer in West Milford
Among the 277 employed individuals in West Milford, private company employees (154 | 55.6%), not-for-profit organizations (56 | 20.2%), and state government employees (23 | 8.3%) make up the most common classes of employment.
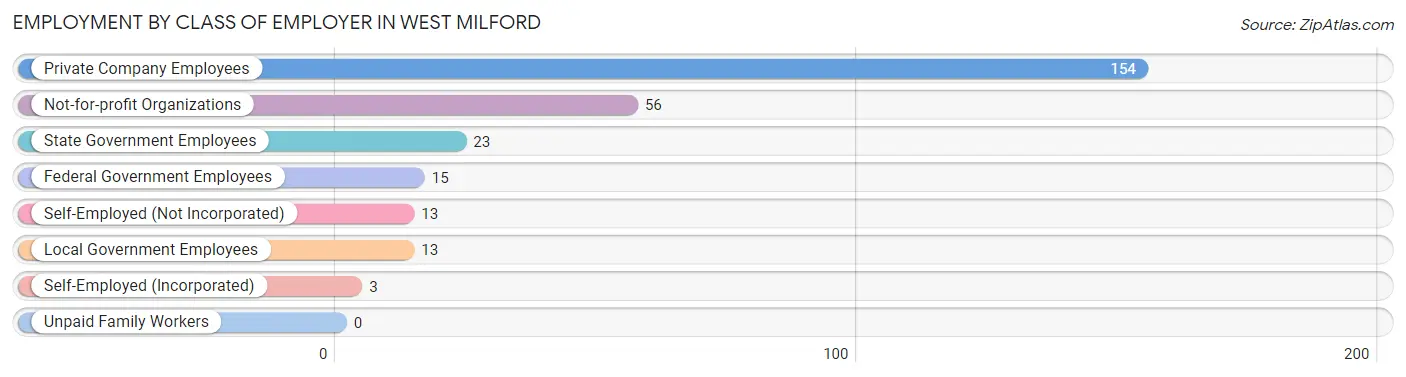
| Employer Class | # Employees | % Employees |
| Private Company Employees | 154 | 55.6% |
| Self-Employed (Incorporated) | 3 | 1.1% |
| Self-Employed (Not Incorporated) | 13 | 4.7% |
| Not-for-profit Organizations | 56 | 20.2% |
| Local Government Employees | 13 | 4.7% |
| State Government Employees | 23 | 8.3% |
| Federal Government Employees | 15 | 5.4% |
| Unpaid Family Workers | 0 | 0.0% |
| Total | 277 | 100.0% |
Employment Status by Age in West Milford
According to the labor force statistics for West Milford, out of the total population over 16 years of age (375), 76.3% or 286 individuals are in the labor force, with 3.1% or 9 of them unemployed. The age group with the highest labor force participation rate is 25 to 29 years, with 100.0% or 10 individuals in the labor force. Within the labor force, the 60 to 64 years age range has the highest percentage of unemployed individuals, with 42.9% or 6 of them being unemployed.
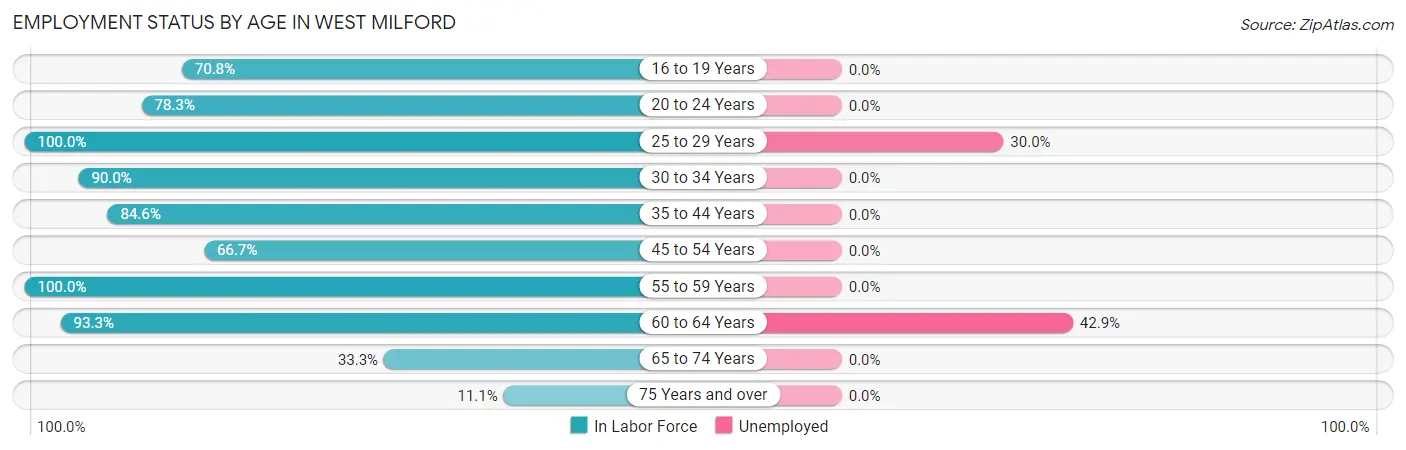
| Age Bracket | In Labor Force | Unemployed |
| 16 to 19 Years | 17 (70.8%) | 0 (0.0%) |
| 20 to 24 Years | 54 (78.3%) | 0 (0.0%) |
| 25 to 29 Years | 10 (100.0%) | 3 (30.0%) |
| 30 to 34 Years | 27 (90.0%) | 0 (0.0%) |
| 35 to 44 Years | 66 (84.6%) | 0 (0.0%) |
| 45 to 54 Years | 42 (66.7%) | 0 (0.0%) |
| 55 to 59 Years | 47 (100.0%) | 0 (0.0%) |
| 60 to 64 Years | 14 (93.3%) | 6 (42.9%) |
| 65 to 74 Years | 7 (33.3%) | 0 (0.0%) |
| 75 Years and over | 2 (11.1%) | 0 (0.0%) |
| Total | 286 (76.3%) | 9 (3.1%) |
Employment Status by Educational Attainment in West Milford
According to labor force statistics for West Milford, 84.8% of individuals (206) out of the total population between 25 and 64 years of age (243) are in the labor force, with 4.4% or 9 of them being unemployed. The group with the highest labor force participation rate are those with the educational attainment of less than high school, with 100.0% or 4 individuals in the labor force. Within the labor force, individuals with college / associate degree education have the highest percentage of unemployment, with 10.0% or 9 of them being unemployed.
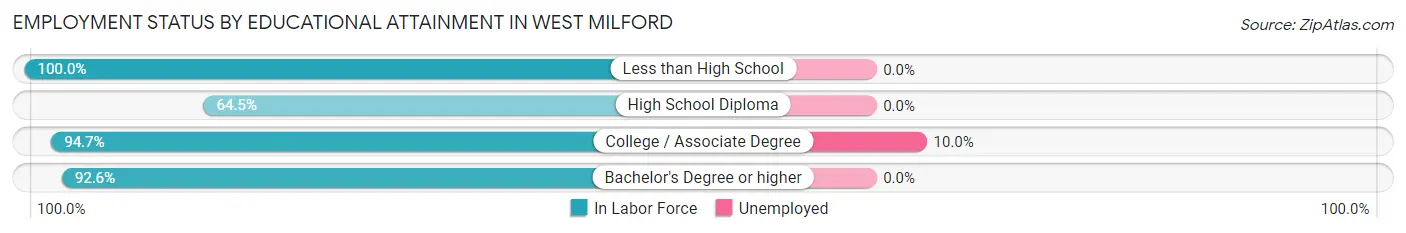
| Educational Attainment | In Labor Force | Unemployed |
| Less than High School | 4 (100.0%) | 0 (0.0%) |
| High School Diploma | 49 (64.5%) | 0 (0.0%) |
| College / Associate Degree | 90 (94.7%) | 10 (10.0%) |
| Bachelor's Degree or higher | 63 (92.6%) | 0 (0.0%) |
| Total | 206 (84.8%) | 11 (4.4%) |
Employment Occupations by Sex in West Milford
Management, Business, Science and Arts Occupations
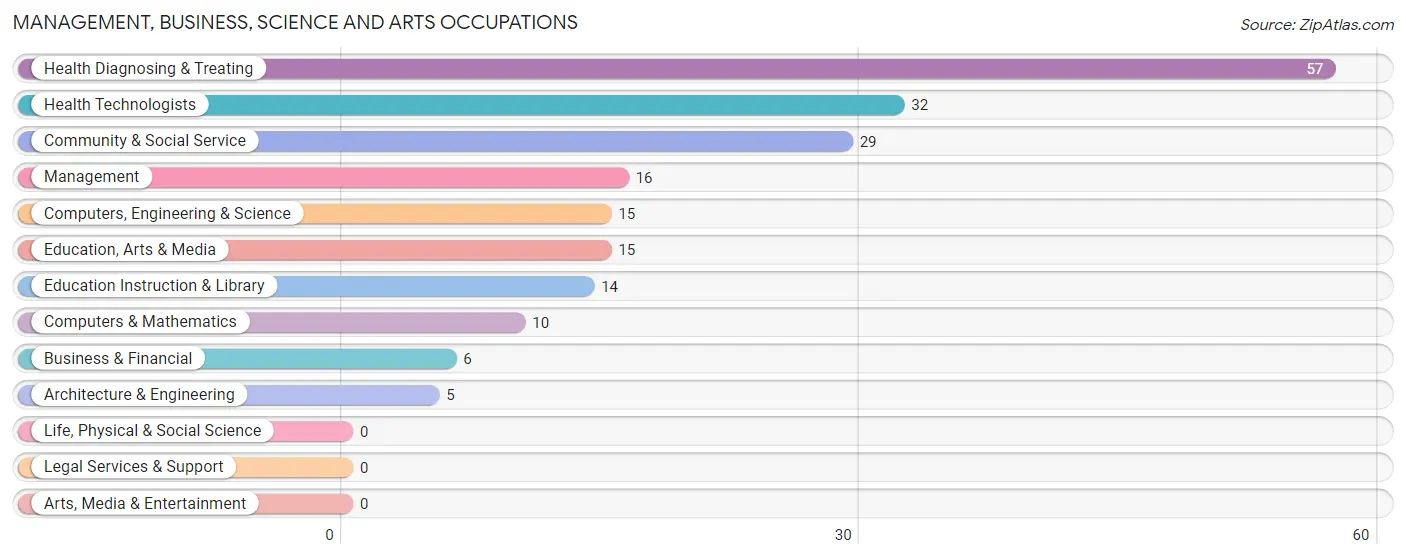
The most common Management, Business, Science and Arts occupations in West Milford are Health Diagnosing & Treating (57 | 20.6%), Health Technologists (32 | 11.6%), Community & Social Service (29 | 10.5%), Management (16 | 5.8%), and Computers, Engineering & Science (15 | 5.4%).
Management, Business, Science and Arts Occupations by Sex
Within the Management, Business, Science and Arts occupations in West Milford, the most male-oriented occupations are Architecture & Engineering (100.0%), Computers, Engineering & Science (80.0%), and Computers & Mathematics (70.0%), while the most female-oriented occupations are Education Instruction & Library (100.0%), Management (87.5%), and Health Diagnosing & Treating (82.5%).
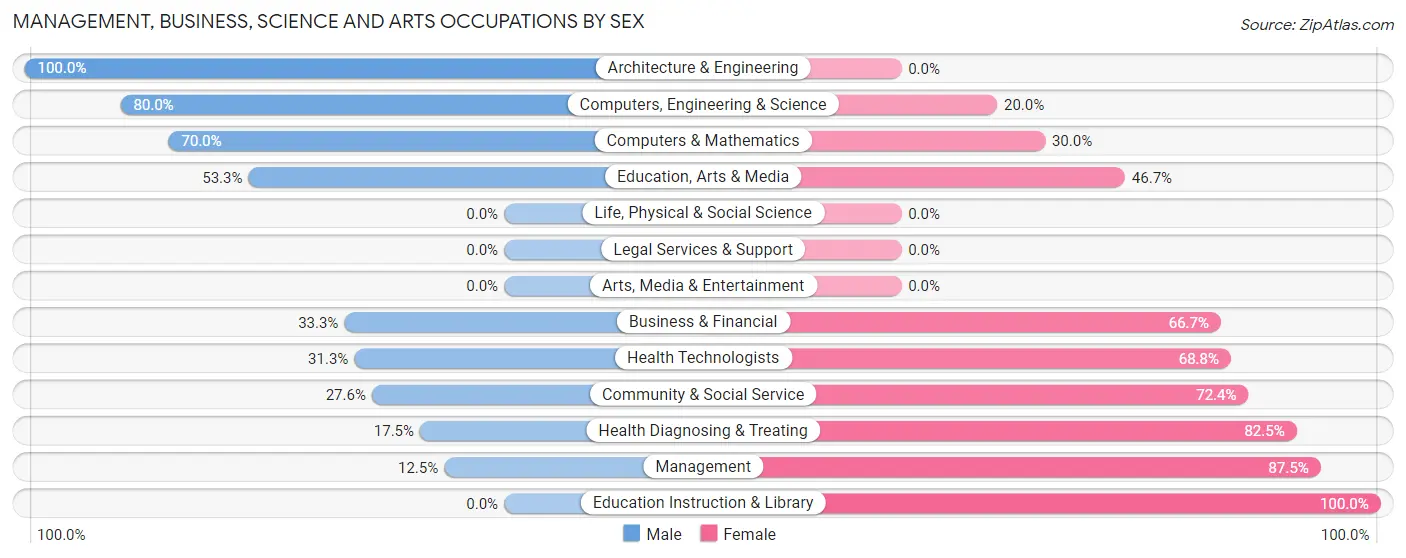
| Occupation | Male | Female |
| Management | 2 (12.5%) | 14 (87.5%) |
| Business & Financial | 2 (33.3%) | 4 (66.7%) |
| Computers, Engineering & Science | 12 (80.0%) | 3 (20.0%) |
| Computers & Mathematics | 7 (70.0%) | 3 (30.0%) |
| Architecture & Engineering | 5 (100.0%) | 0 (0.0%) |
| Life, Physical & Social Science | 0 (0.0%) | 0 (0.0%) |
| Community & Social Service | 8 (27.6%) | 21 (72.4%) |
| Education, Arts & Media | 8 (53.3%) | 7 (46.7%) |
| Legal Services & Support | 0 (0.0%) | 0 (0.0%) |
| Education Instruction & Library | 0 (0.0%) | 14 (100.0%) |
| Arts, Media & Entertainment | 0 (0.0%) | 0 (0.0%) |
| Health Diagnosing & Treating | 10 (17.5%) | 47 (82.5%) |
| Health Technologists | 10 (31.2%) | 22 (68.8%) |
| Total (Category) | 34 (27.6%) | 89 (72.4%) |
| Total (Overall) | 128 (46.2%) | 149 (53.8%) |
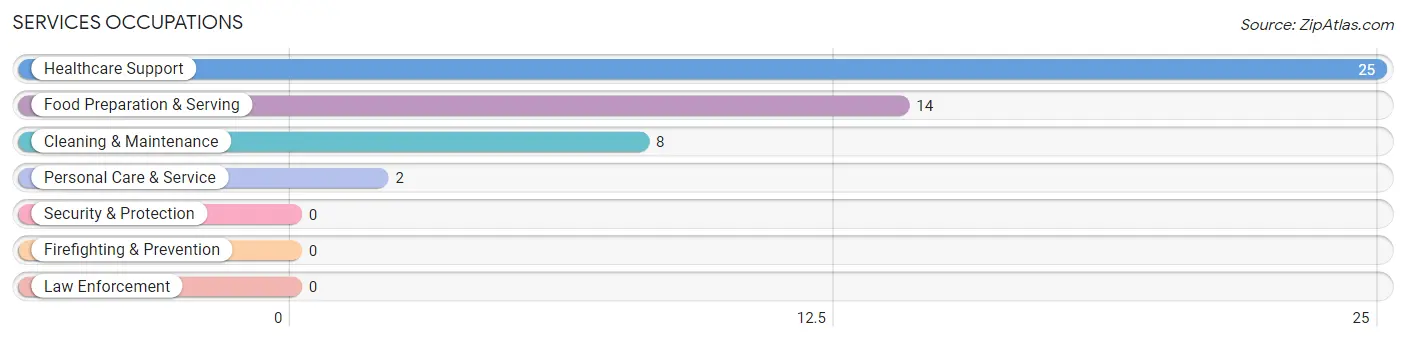
Services Occupations
The most common Services occupations in West Milford are Healthcare Support (25 | 9.0%), Food Preparation & Serving (14 | 5.1%), Cleaning & Maintenance (8 | 2.9%), and Personal Care & Service (2 | 0.7%).
Services Occupations by Sex
Within the Services occupations in West Milford, the most male-oriented occupations are Cleaning & Maintenance (100.0%), Food Preparation & Serving (21.4%), and Healthcare Support (12.0%), while the most female-oriented occupations are Personal Care & Service (100.0%), Healthcare Support (88.0%), and Food Preparation & Serving (78.6%).
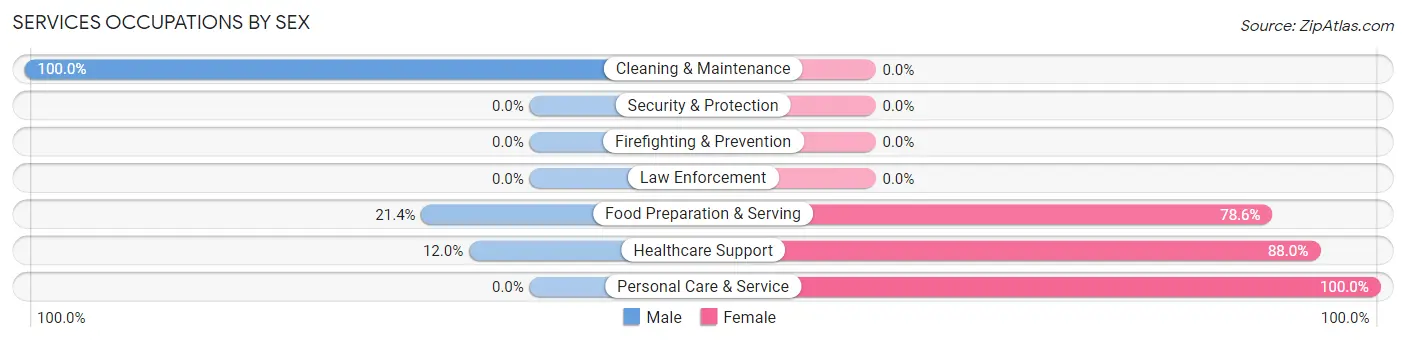
| Occupation | Male | Female |
| Healthcare Support | 3 (12.0%) | 22 (88.0%) |
| Security & Protection | 0 (0.0%) | 0 (0.0%) |
| Firefighting & Prevention | 0 (0.0%) | 0 (0.0%) |
| Law Enforcement | 0 (0.0%) | 0 (0.0%) |
| Food Preparation & Serving | 3 (21.4%) | 11 (78.6%) |
| Cleaning & Maintenance | 8 (100.0%) | 0 (0.0%) |
| Personal Care & Service | 0 (0.0%) | 2 (100.0%) |
| Total (Category) | 14 (28.6%) | 35 (71.4%) |
| Total (Overall) | 128 (46.2%) | 149 (53.8%) |
Sales and Office Occupations
The most common Sales and Office occupations in West Milford are Office & Administration (15 | 5.4%), and Sales & Related (14 | 5.1%).
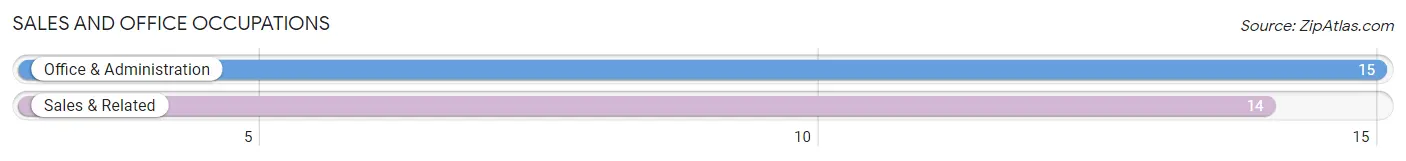
Sales and Office Occupations by Sex
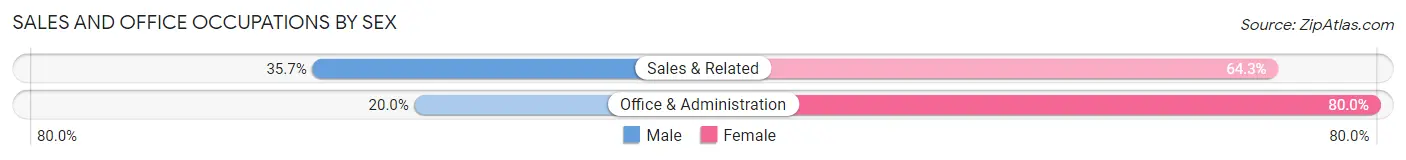
| Occupation | Male | Female |
| Sales & Related | 5 (35.7%) | 9 (64.3%) |
| Office & Administration | 3 (20.0%) | 12 (80.0%) |
| Total (Category) | 8 (27.6%) | 21 (72.4%) |
| Total (Overall) | 128 (46.2%) | 149 (53.8%) |
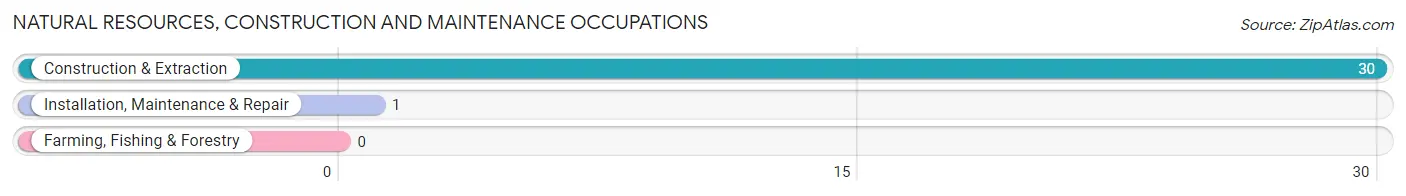
Natural Resources, Construction and Maintenance Occupations
The most common Natural Resources, Construction and Maintenance occupations in West Milford are Construction & Extraction (30 | 10.8%), and Installation, Maintenance & Repair (1 | 0.4%).
Natural Resources, Construction and Maintenance Occupations by Sex
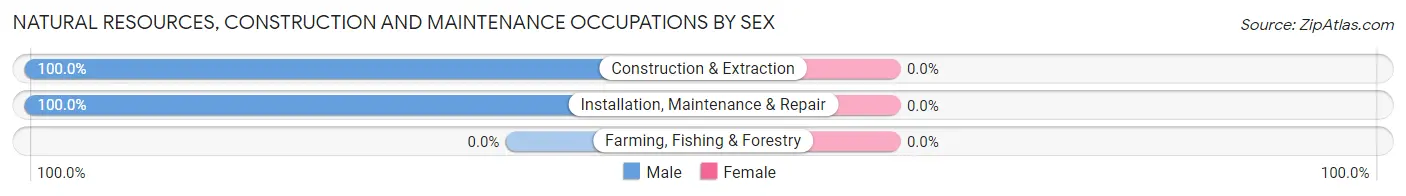
| Occupation | Male | Female |
| Farming, Fishing & Forestry | 0 (0.0%) | 0 (0.0%) |
| Construction & Extraction | 30 (100.0%) | 0 (0.0%) |
| Installation, Maintenance & Repair | 1 (100.0%) | 0 (0.0%) |
| Total (Category) | 31 (100.0%) | 0 (0.0%) |
| Total (Overall) | 128 (46.2%) | 149 (53.8%) |
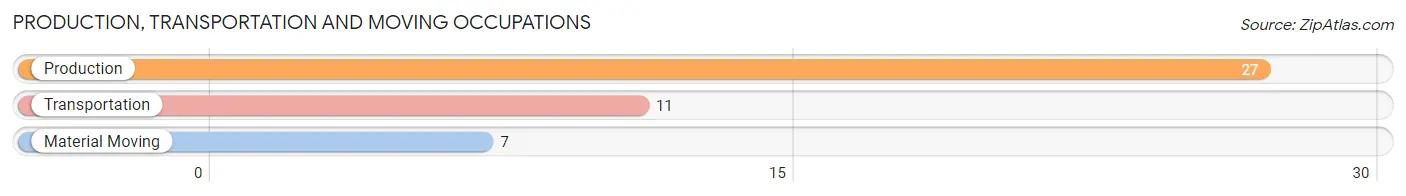
Production, Transportation and Moving Occupations
The most common Production, Transportation and Moving occupations in West Milford are Production (27 | 9.8%), Transportation (11 | 4.0%), and Material Moving (7 | 2.5%).
Production, Transportation and Moving Occupations by Sex
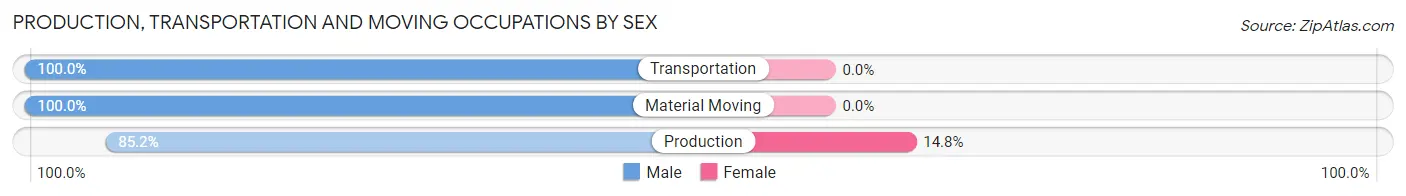
| Occupation | Male | Female |
| Production | 23 (85.2%) | 4 (14.8%) |
| Transportation | 11 (100.0%) | 0 (0.0%) |
| Material Moving | 7 (100.0%) | 0 (0.0%) |
| Total (Category) | 41 (91.1%) | 4 (8.9%) |
| Total (Overall) | 128 (46.2%) | 149 (53.8%) |
Employment Industries by Sex in West Milford
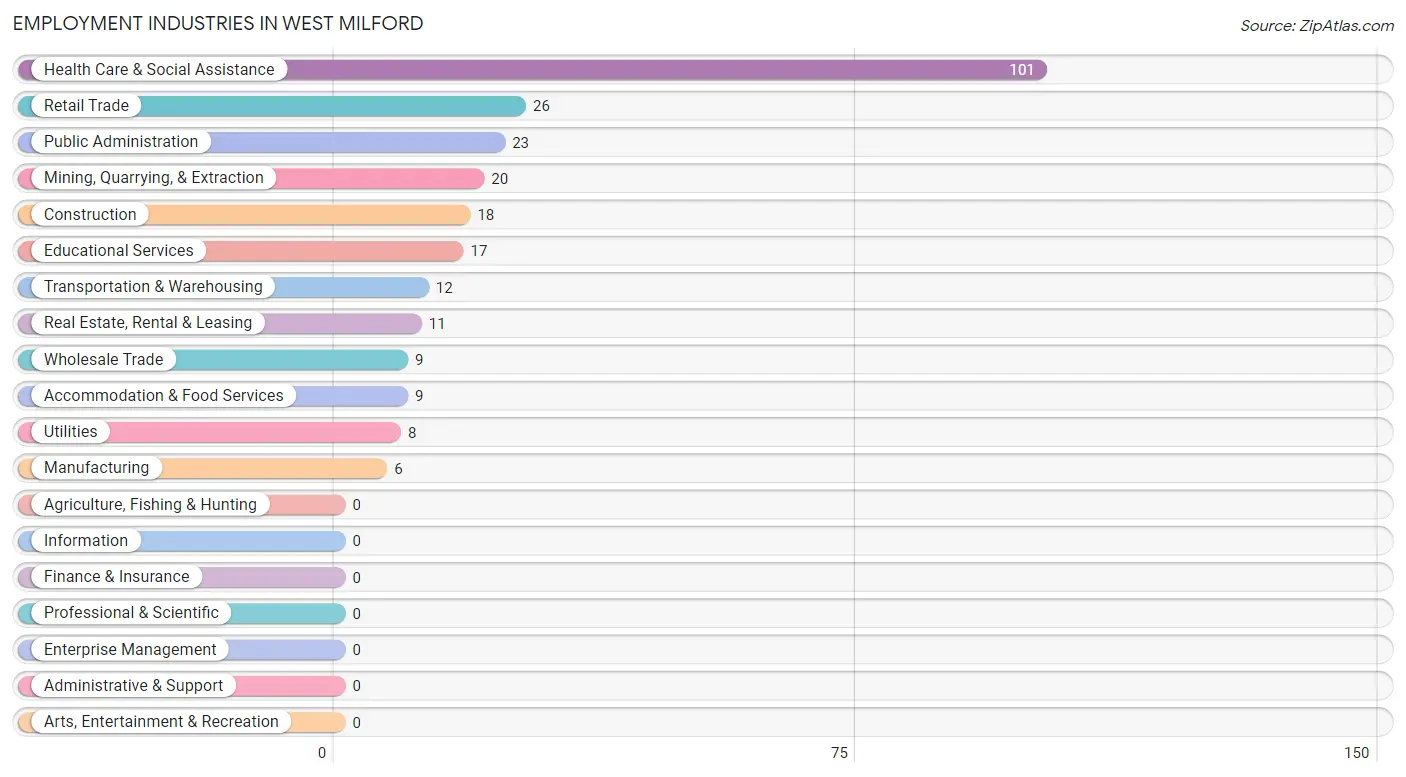
Employment Industries in West Milford
The major employment industries in West Milford include Health Care & Social Assistance (101 | 36.5%), Retail Trade (26 | 9.4%), Public Administration (23 | 8.3%), Mining, Quarrying, & Extraction (20 | 7.2%), and Construction (18 | 6.5%).
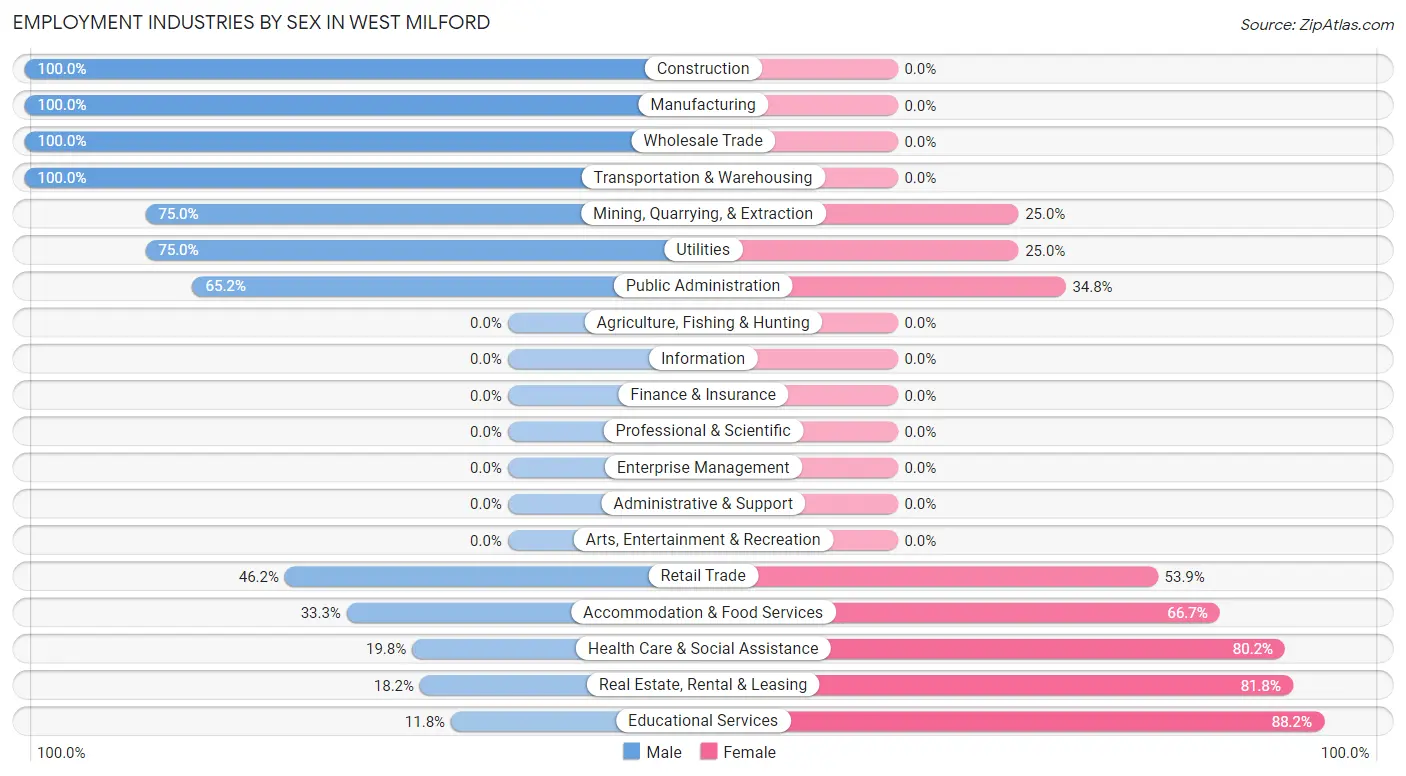
Employment Industries by Sex in West Milford
The West Milford industries that see more men than women are Construction (100.0%), Manufacturing (100.0%), and Wholesale Trade (100.0%), whereas the industries that tend to have a higher number of women are Educational Services (88.2%), Real Estate, Rental & Leasing (81.8%), and Health Care & Social Assistance (80.2%).
| Industry | Male | Female |
| Agriculture, Fishing & Hunting | 0 (0.0%) | 0 (0.0%) |
| Mining, Quarrying, & Extraction | 15 (75.0%) | 5 (25.0%) |
| Construction | 18 (100.0%) | 0 (0.0%) |
| Manufacturing | 6 (100.0%) | 0 (0.0%) |
| Wholesale Trade | 9 (100.0%) | 0 (0.0%) |
| Retail Trade | 12 (46.2%) | 14 (53.8%) |
| Transportation & Warehousing | 12 (100.0%) | 0 (0.0%) |
| Utilities | 6 (75.0%) | 2 (25.0%) |
| Information | 0 (0.0%) | 0 (0.0%) |
| Finance & Insurance | 0 (0.0%) | 0 (0.0%) |
| Real Estate, Rental & Leasing | 2 (18.2%) | 9 (81.8%) |
| Professional & Scientific | 0 (0.0%) | 0 (0.0%) |
| Enterprise Management | 0 (0.0%) | 0 (0.0%) |
| Administrative & Support | 0 (0.0%) | 0 (0.0%) |
| Educational Services | 2 (11.8%) | 15 (88.2%) |
| Health Care & Social Assistance | 20 (19.8%) | 81 (80.2%) |
| Arts, Entertainment & Recreation | 0 (0.0%) | 0 (0.0%) |
| Accommodation & Food Services | 3 (33.3%) | 6 (66.7%) |
| Public Administration | 15 (65.2%) | 8 (34.8%) |
| Total | 128 (46.2%) | 149 (53.8%) |
Education in West Milford
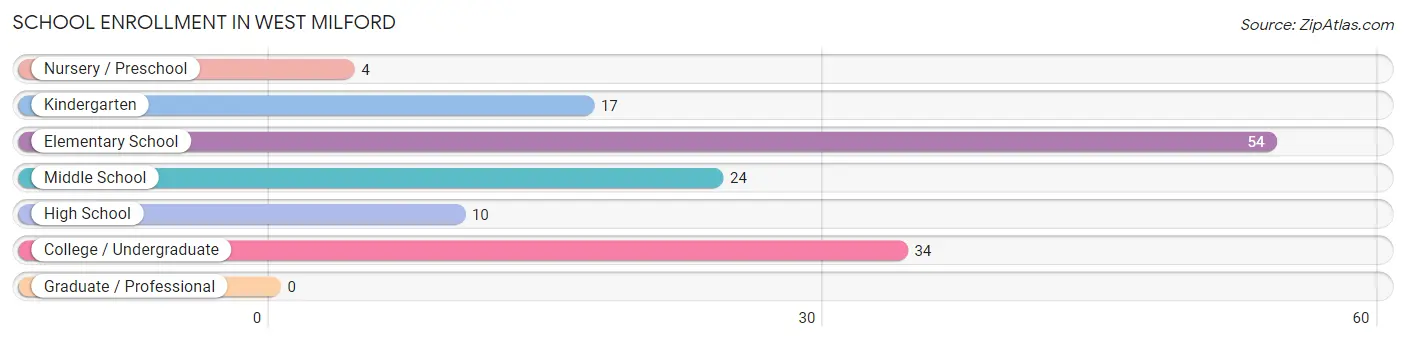
School Enrollment in West Milford
The most common levels of schooling among the 143 students in West Milford are elementary school (54 | 37.8%), college / undergraduate (34 | 23.8%), and middle school (24 | 16.8%).
| School Level | # Students | % Students |
| Nursery / Preschool | 4 | 2.8% |
| Kindergarten | 17 | 11.9% |
| Elementary School | 54 | 37.8% |
| Middle School | 24 | 16.8% |
| High School | 10 | 7.0% |
| College / Undergraduate | 34 | 23.8% |
| Graduate / Professional | 0 | 0.0% |
| Total | 143 | 100.0% |
School Enrollment by Age by Funding Source in West Milford
Out of a total of 143 students who are enrolled in schools in West Milford, 39 (27.3%) attend a private institution, while the remaining 104 (72.7%) are enrolled in public schools. The age group of 5 to 9 year old has the highest likelihood of being enrolled in private schools, with 14 (34.2% in the age bracket) enrolled. Conversely, the age group of 15 to 17 year olds has the lowest likelihood of being enrolled in a private school, with 10 (100.0% in the age bracket) attending a public institution.
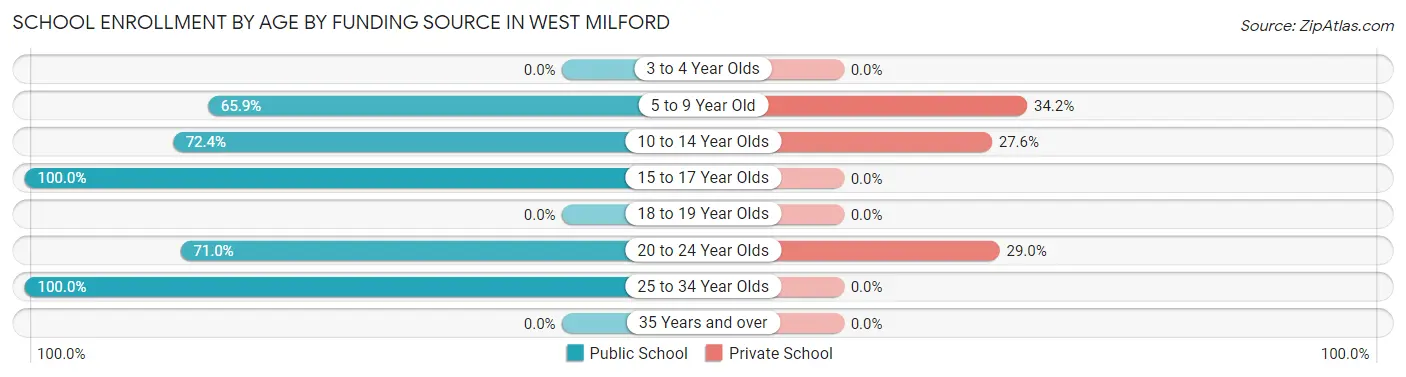
| Age Bracket | Public School | Private School |
| 3 to 4 Year Olds | 0 (0.0%) | 0 (0.0%) |
| 5 to 9 Year Old | 27 (65.8%) | 14 (34.2%) |
| 10 to 14 Year Olds | 42 (72.4%) | 16 (27.6%) |
| 15 to 17 Year Olds | 10 (100.0%) | 0 (0.0%) |
| 18 to 19 Year Olds | 0 (0.0%) | 0 (0.0%) |
| 20 to 24 Year Olds | 22 (71.0%) | 9 (29.0%) |
| 25 to 34 Year Olds | 3 (100.0%) | 0 (0.0%) |
| 35 Years and over | 0 (0.0%) | 0 (0.0%) |
| Total | 104 (72.7%) | 39 (27.3%) |
Educational Attainment by Field of Study in West Milford
Liberal arts & history (18 | 25.7%), science & technology (17 | 24.3%), business (12 | 17.1%), arts & humanities (11 | 15.7%), and bio, nature & agricultural (8 | 11.4%) are the most common fields of study among 70 individuals in West Milford who have obtained a bachelor's degree or higher.
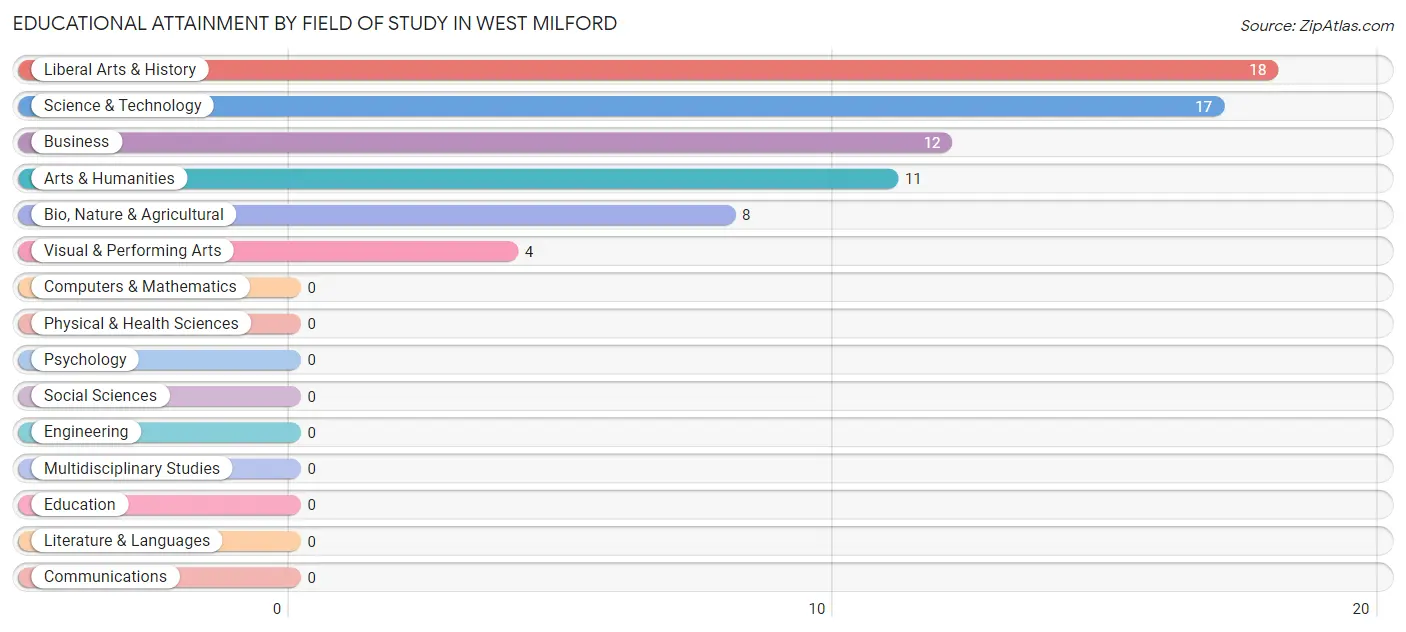
| Field of Study | # Graduates | % Graduates |
| Computers & Mathematics | 0 | 0.0% |
| Bio, Nature & Agricultural | 8 | 11.4% |
| Physical & Health Sciences | 0 | 0.0% |
| Psychology | 0 | 0.0% |
| Social Sciences | 0 | 0.0% |
| Engineering | 0 | 0.0% |
| Multidisciplinary Studies | 0 | 0.0% |
| Science & Technology | 17 | 24.3% |
| Business | 12 | 17.1% |
| Education | 0 | 0.0% |
| Literature & Languages | 0 | 0.0% |
| Liberal Arts & History | 18 | 25.7% |
| Visual & Performing Arts | 4 | 5.7% |
| Communications | 0 | 0.0% |
| Arts & Humanities | 11 | 15.7% |
| Total | 70 | 100.0% |
Transportation & Commute in West Milford
Vehicle Availability by Sex in West Milford
The most prevalent vehicle ownership categories in West Milford are males with 2 vehicles (61, accounting for 47.7%) and females with 2 vehicles (87, making up 40.9%).
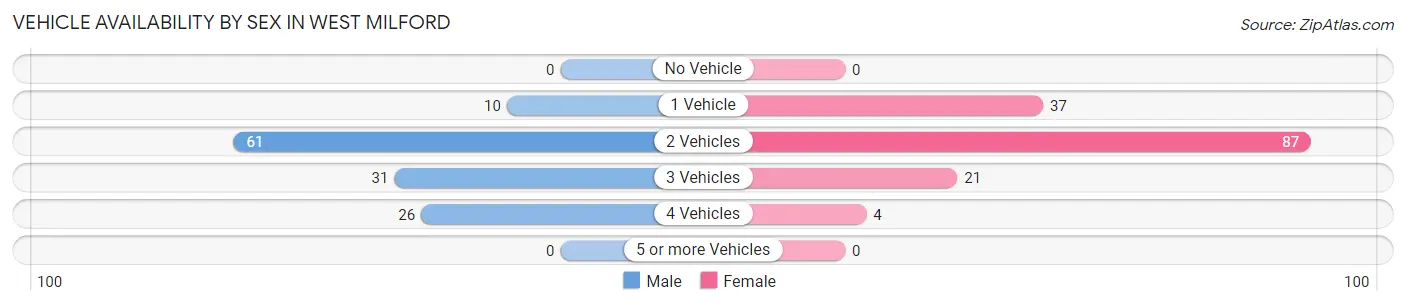
| Vehicles Available | Male | Female |
| No Vehicle | 0 (0.0%) | 0 (0.0%) |
| 1 Vehicle | 10 (7.8%) | 37 (24.8%) |
| 2 Vehicles | 61 (47.7%) | 87 (58.4%) |
| 3 Vehicles | 31 (24.2%) | 21 (14.1%) |
| 4 Vehicles | 26 (20.3%) | 4 (2.7%) |
| 5 or more Vehicles | 0 (0.0%) | 0 (0.0%) |
| Total | 128 (100.0%) | 149 (100.0%) |
Commute Time in West Milford
The most frequently occuring commute durations in West Milford are 30 to 34 minutes (72 commuters, 27.7%), 20 to 24 minutes (46 commuters, 17.7%), and 25 to 29 minutes (45 commuters, 17.3%).
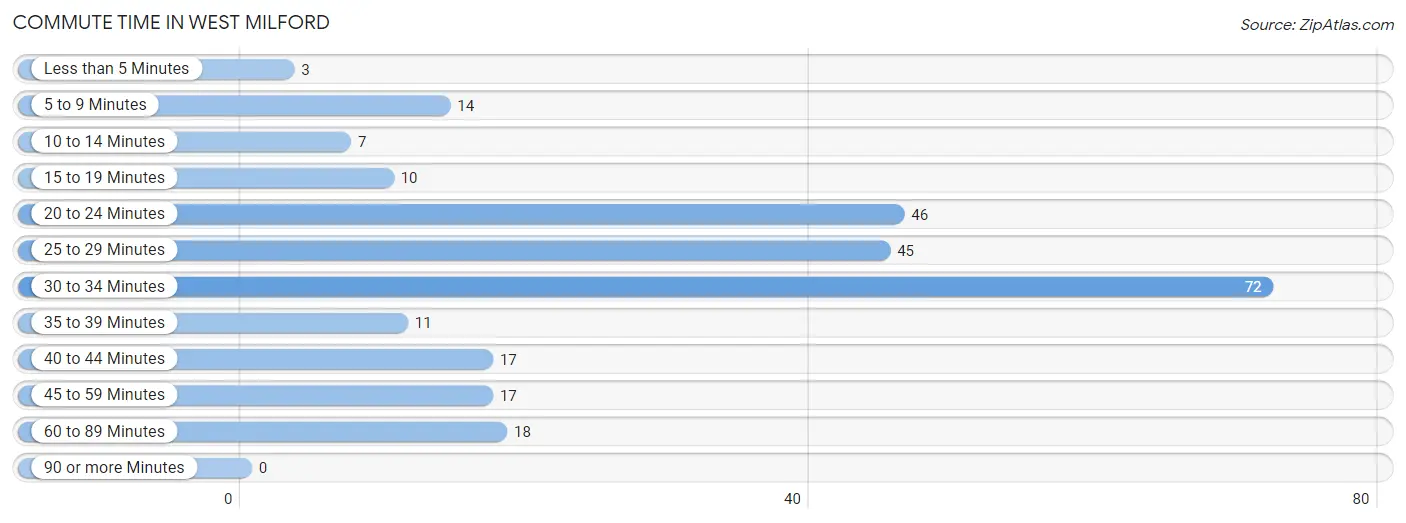
| Commute Time | # Commuters | % Commuters |
| Less than 5 Minutes | 3 | 1.1% |
| 5 to 9 Minutes | 14 | 5.4% |
| 10 to 14 Minutes | 7 | 2.7% |
| 15 to 19 Minutes | 10 | 3.8% |
| 20 to 24 Minutes | 46 | 17.7% |
| 25 to 29 Minutes | 45 | 17.3% |
| 30 to 34 Minutes | 72 | 27.7% |
| 35 to 39 Minutes | 11 | 4.2% |
| 40 to 44 Minutes | 17 | 6.5% |
| 45 to 59 Minutes | 17 | 6.5% |
| 60 to 89 Minutes | 18 | 6.9% |
| 90 or more Minutes | 0 | 0.0% |
Commute Time by Sex in West Milford
The most common commute times in West Milford are 30 to 34 minutes (26 commuters, 20.3%) for males and 30 to 34 minutes (46 commuters, 34.8%) for females.
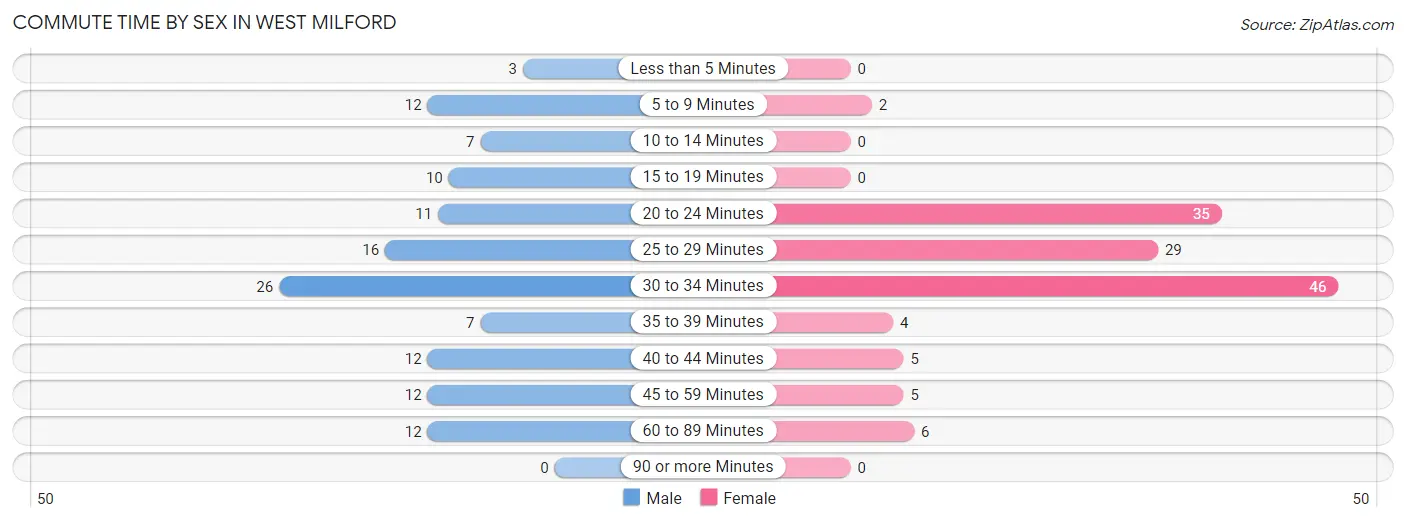
| Commute Time | Male | Female |
| Less than 5 Minutes | 3 (2.3%) | 0 (0.0%) |
| 5 to 9 Minutes | 12 (9.4%) | 2 (1.5%) |
| 10 to 14 Minutes | 7 (5.5%) | 0 (0.0%) |
| 15 to 19 Minutes | 10 (7.8%) | 0 (0.0%) |
| 20 to 24 Minutes | 11 (8.6%) | 35 (26.5%) |
| 25 to 29 Minutes | 16 (12.5%) | 29 (22.0%) |
| 30 to 34 Minutes | 26 (20.3%) | 46 (34.8%) |
| 35 to 39 Minutes | 7 (5.5%) | 4 (3.0%) |
| 40 to 44 Minutes | 12 (9.4%) | 5 (3.8%) |
| 45 to 59 Minutes | 12 (9.4%) | 5 (3.8%) |
| 60 to 89 Minutes | 12 (9.4%) | 6 (4.5%) |
| 90 or more Minutes | 0 (0.0%) | 0 (0.0%) |
Time of Departure to Work by Sex in West Milford
The most frequent times of departure to work in West Milford are 8:00 AM to 8:29 AM (18, 14.1%) for males and 6:00 AM to 6:29 AM (36, 27.3%) for females.
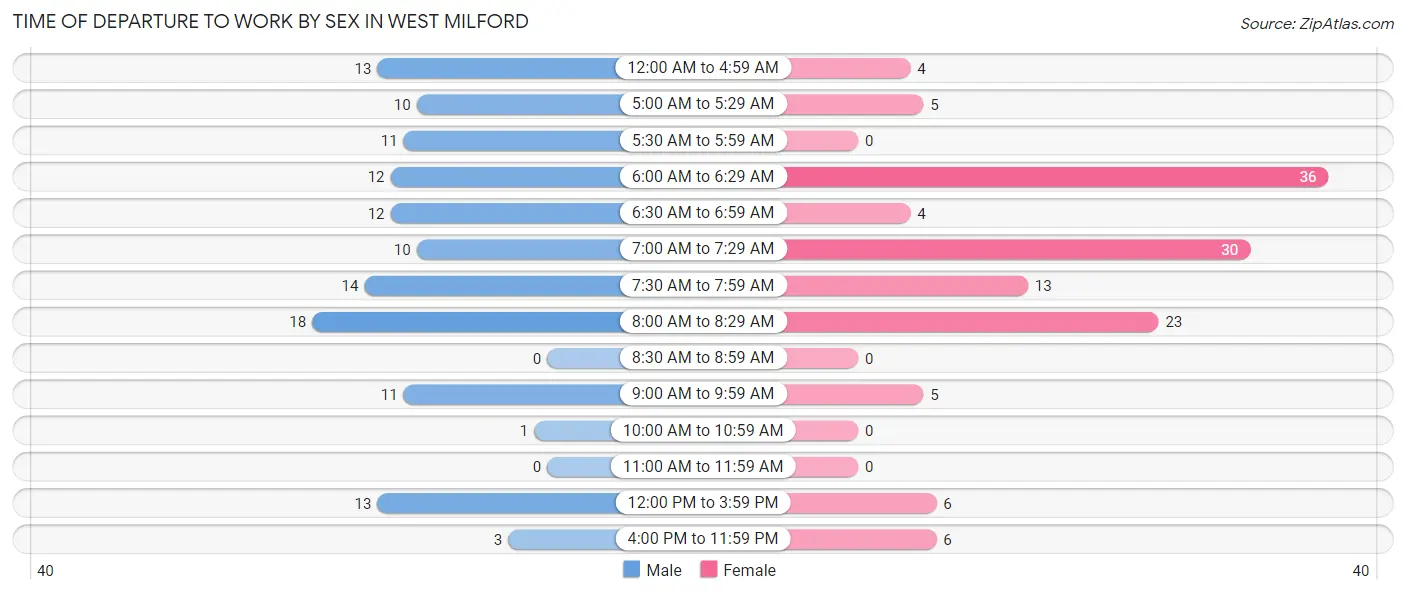
| Time of Departure | Male | Female |
| 12:00 AM to 4:59 AM | 13 (10.2%) | 4 (3.0%) |
| 5:00 AM to 5:29 AM | 10 (7.8%) | 5 (3.8%) |
| 5:30 AM to 5:59 AM | 11 (8.6%) | 0 (0.0%) |
| 6:00 AM to 6:29 AM | 12 (9.4%) | 36 (27.3%) |
| 6:30 AM to 6:59 AM | 12 (9.4%) | 4 (3.0%) |
| 7:00 AM to 7:29 AM | 10 (7.8%) | 30 (22.7%) |
| 7:30 AM to 7:59 AM | 14 (10.9%) | 13 (9.9%) |
| 8:00 AM to 8:29 AM | 18 (14.1%) | 23 (17.4%) |
| 8:30 AM to 8:59 AM | 0 (0.0%) | 0 (0.0%) |
| 9:00 AM to 9:59 AM | 11 (8.6%) | 5 (3.8%) |
| 10:00 AM to 10:59 AM | 1 (0.8%) | 0 (0.0%) |
| 11:00 AM to 11:59 AM | 0 (0.0%) | 0 (0.0%) |
| 12:00 PM to 3:59 PM | 13 (10.2%) | 6 (4.5%) |
| 4:00 PM to 11:59 PM | 3 (2.3%) | 6 (4.5%) |
| Total | 128 (100.0%) | 132 (100.0%) |
Housing Occupancy in West Milford
Occupancy by Ownership in West Milford
Of the total 187 dwellings in West Milford, owner-occupied units account for 169 (90.4%), while renter-occupied units make up 18 (9.6%).
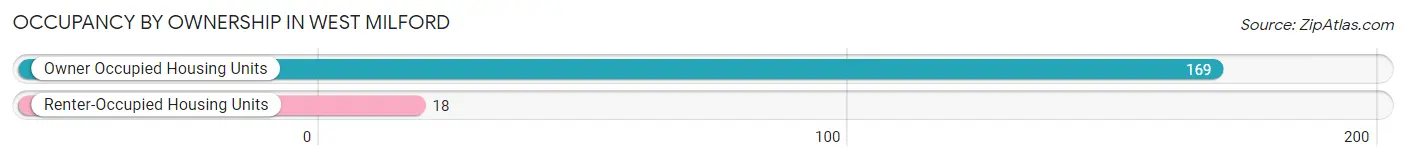
| Occupancy | # Housing Units | % Housing Units |
| Owner Occupied Housing Units | 169 | 90.4% |
| Renter-Occupied Housing Units | 18 | 9.6% |
| Total Occupied Housing Units | 187 | 100.0% |
Occupancy by Household Size in West Milford
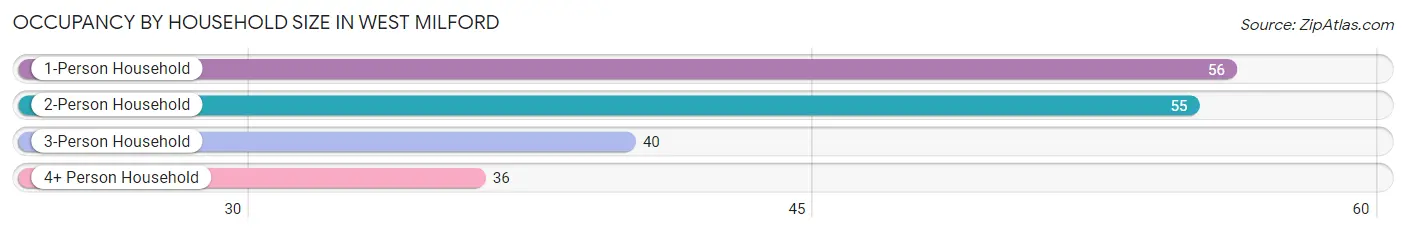
| Household Size | # Housing Units | % Housing Units |
| 1-Person Household | 56 | 29.9% |
| 2-Person Household | 55 | 29.4% |
| 3-Person Household | 40 | 21.4% |
| 4+ Person Household | 36 | 19.3% |
| Total Housing Units | 187 | 100.0% |
Occupancy by Ownership by Household Size in West Milford
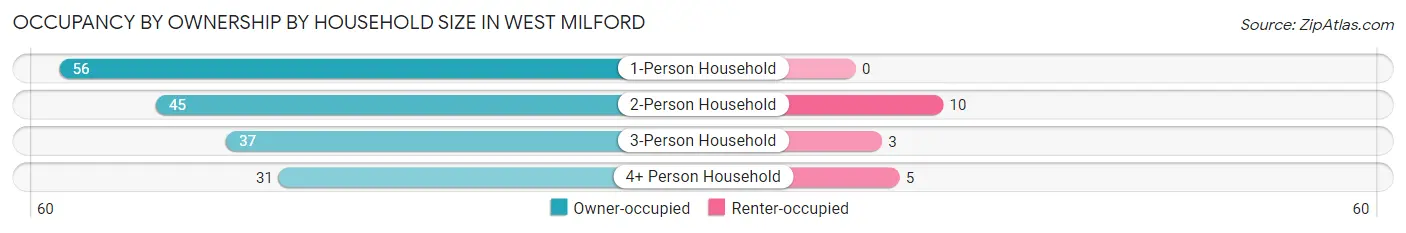
| Household Size | Owner-occupied | Renter-occupied |
| 1-Person Household | 56 (100.0%) | 0 (0.0%) |
| 2-Person Household | 45 (81.8%) | 10 (18.2%) |
| 3-Person Household | 37 (92.5%) | 3 (7.5%) |
| 4+ Person Household | 31 (86.1%) | 5 (13.9%) |
| Total Housing Units | 169 (90.4%) | 18 (9.6%) |
Occupancy by Educational Attainment in West Milford
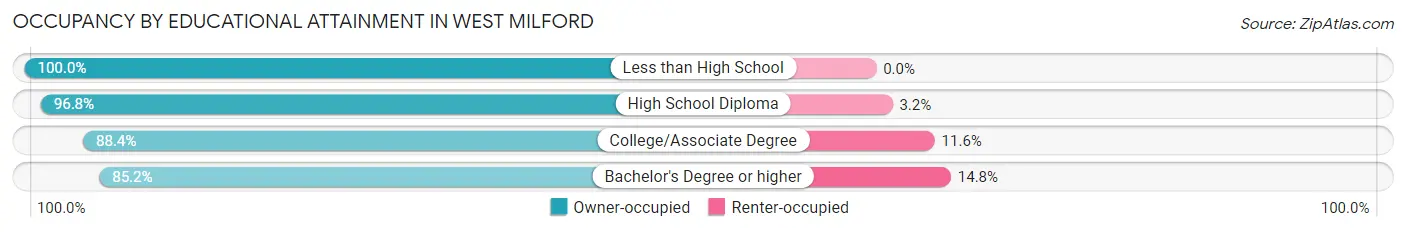
| Household Size | Owner-occupied | Renter-occupied |
| Less than High School | 2 (100.0%) | 0 (0.0%) |
| High School Diploma | 60 (96.8%) | 2 (3.2%) |
| College/Associate Degree | 61 (88.4%) | 8 (11.6%) |
| Bachelor's Degree or higher | 46 (85.2%) | 8 (14.8%) |
Occupancy by Age of Householder in West Milford
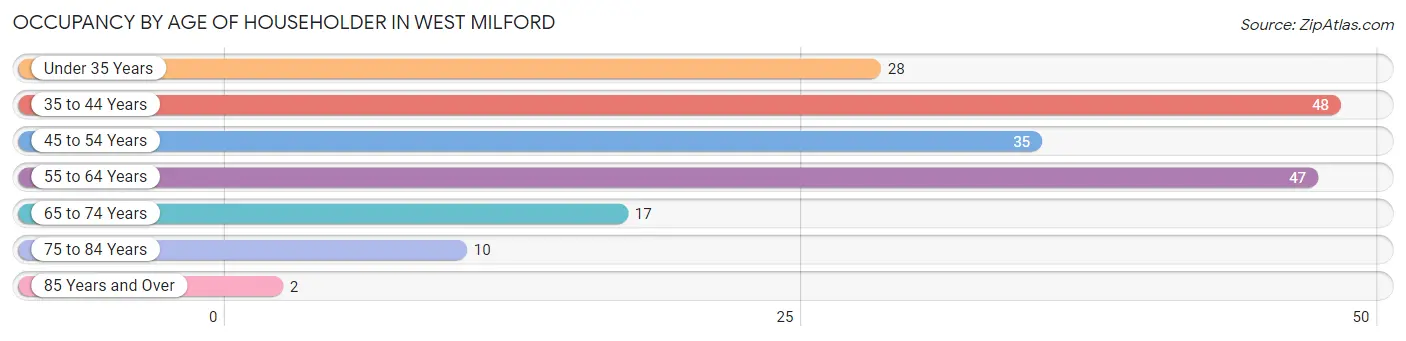
| Age Bracket | # Households | % Households |
| Under 35 Years | 28 | 15.0% |
| 35 to 44 Years | 48 | 25.7% |
| 45 to 54 Years | 35 | 18.7% |
| 55 to 64 Years | 47 | 25.1% |
| 65 to 74 Years | 17 | 9.1% |
| 75 to 84 Years | 10 | 5.3% |
| 85 Years and Over | 2 | 1.1% |
| Total | 187 | 100.0% |
Housing Finances in West Milford
Median Income by Occupancy in West Milford
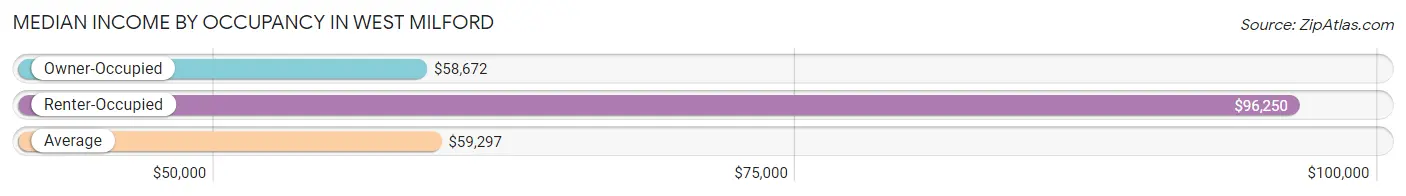
| Occupancy Type | # Households | Median Income |
| Owner-Occupied | 169 (90.4%) | $58,672 |
| Renter-Occupied | 18 (9.6%) | $96,250 |
| Average | 187 (100.0%) | $59,297 |
Occupancy by Householder Income Bracket in West Milford
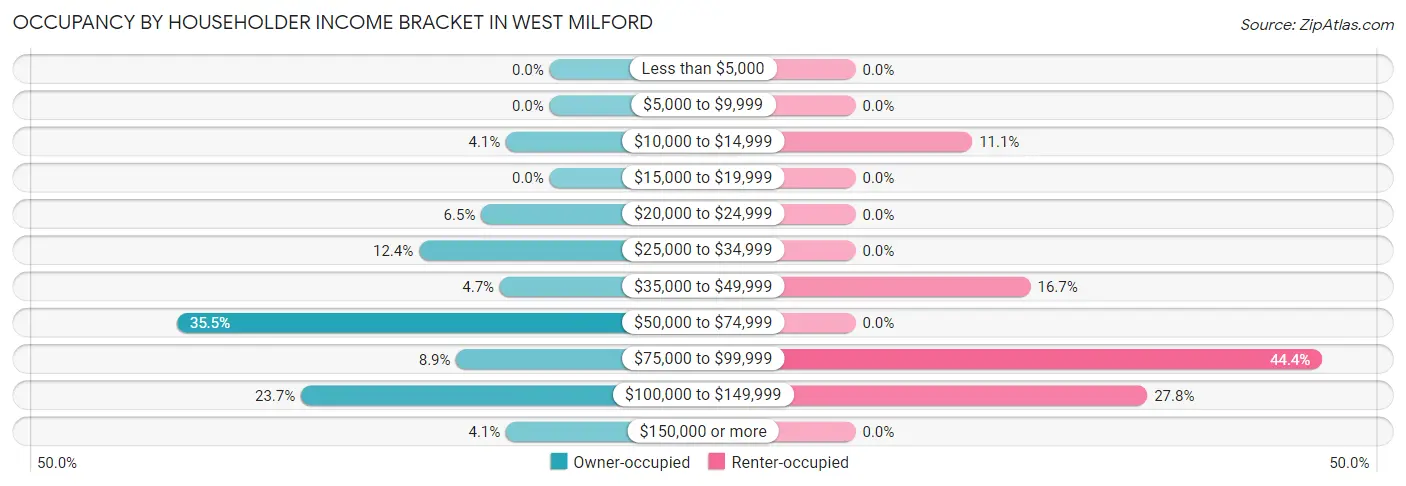
| Income Bracket | Owner-occupied | Renter-occupied |
| Less than $5,000 | 0 (0.0%) | 0 (0.0%) |
| $5,000 to $9,999 | 0 (0.0%) | 0 (0.0%) |
| $10,000 to $14,999 | 7 (4.1%) | 2 (11.1%) |
| $15,000 to $19,999 | 0 (0.0%) | 0 (0.0%) |
| $20,000 to $24,999 | 11 (6.5%) | 0 (0.0%) |
| $25,000 to $34,999 | 21 (12.4%) | 0 (0.0%) |
| $35,000 to $49,999 | 8 (4.7%) | 3 (16.7%) |
| $50,000 to $74,999 | 60 (35.5%) | 0 (0.0%) |
| $75,000 to $99,999 | 15 (8.9%) | 8 (44.4%) |
| $100,000 to $149,999 | 40 (23.7%) | 5 (27.8%) |
| $150,000 or more | 7 (4.1%) | 0 (0.0%) |
| Total | 169 (100.0%) | 18 (100.0%) |
Monthly Housing Cost Tiers in West Milford
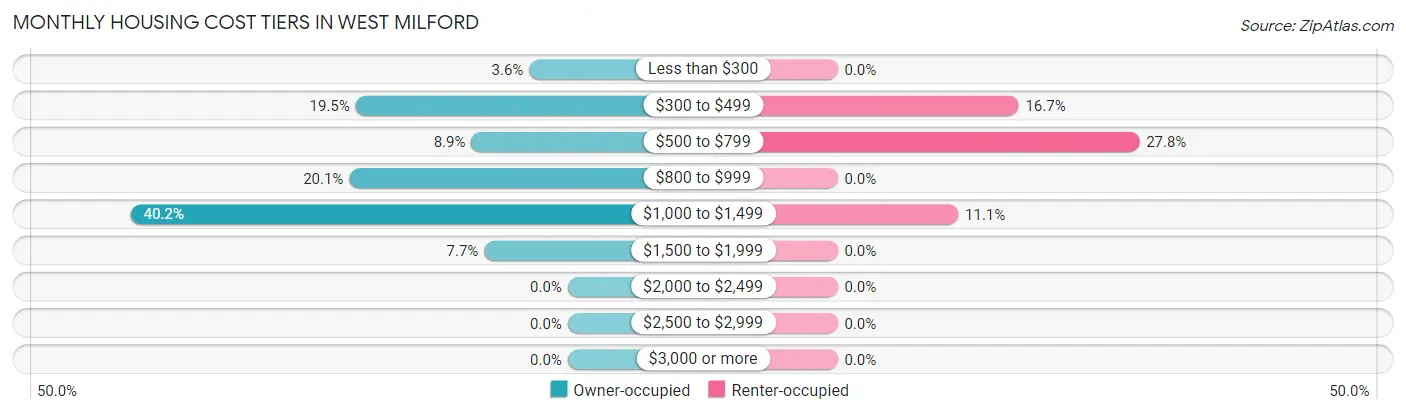
| Monthly Cost | Owner-occupied | Renter-occupied |
| Less than $300 | 6 (3.5%) | 0 (0.0%) |
| $300 to $499 | 33 (19.5%) | 3 (16.7%) |
| $500 to $799 | 15 (8.9%) | 5 (27.8%) |
| $800 to $999 | 34 (20.1%) | 0 (0.0%) |
| $1,000 to $1,499 | 68 (40.2%) | 2 (11.1%) |
| $1,500 to $1,999 | 13 (7.7%) | 0 (0.0%) |
| $2,000 to $2,499 | 0 (0.0%) | 0 (0.0%) |
| $2,500 to $2,999 | 0 (0.0%) | 0 (0.0%) |
| $3,000 or more | 0 (0.0%) | 0 (0.0%) |
| Total | 169 (100.0%) | 18 (100.0%) |
Physical Housing Characteristics in West Milford
Housing Structures in West Milford
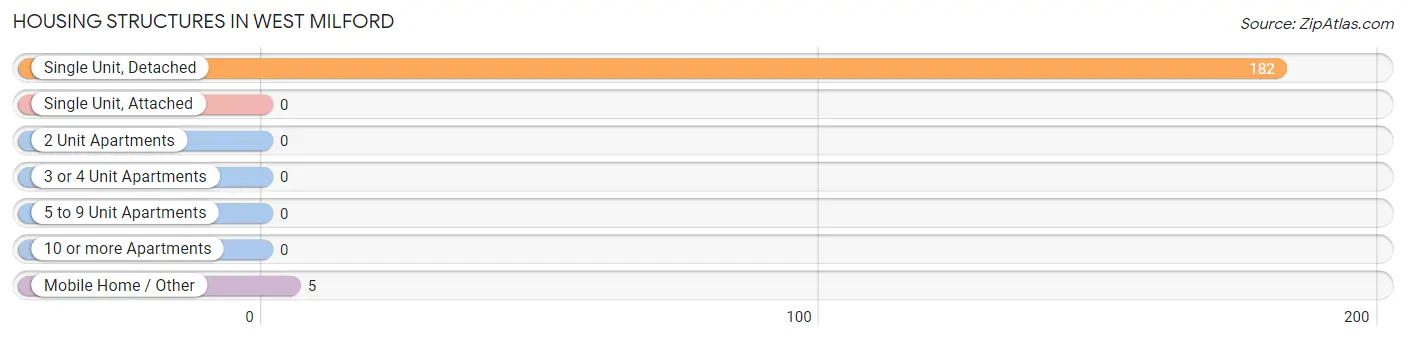
| Structure Type | # Housing Units | % Housing Units |
| Single Unit, Detached | 182 | 97.3% |
| Single Unit, Attached | 0 | 0.0% |
| 2 Unit Apartments | 0 | 0.0% |
| 3 or 4 Unit Apartments | 0 | 0.0% |
| 5 to 9 Unit Apartments | 0 | 0.0% |
| 10 or more Apartments | 0 | 0.0% |
| Mobile Home / Other | 5 | 2.7% |
| Total | 187 | 100.0% |
Housing Structures by Occupancy in West Milford
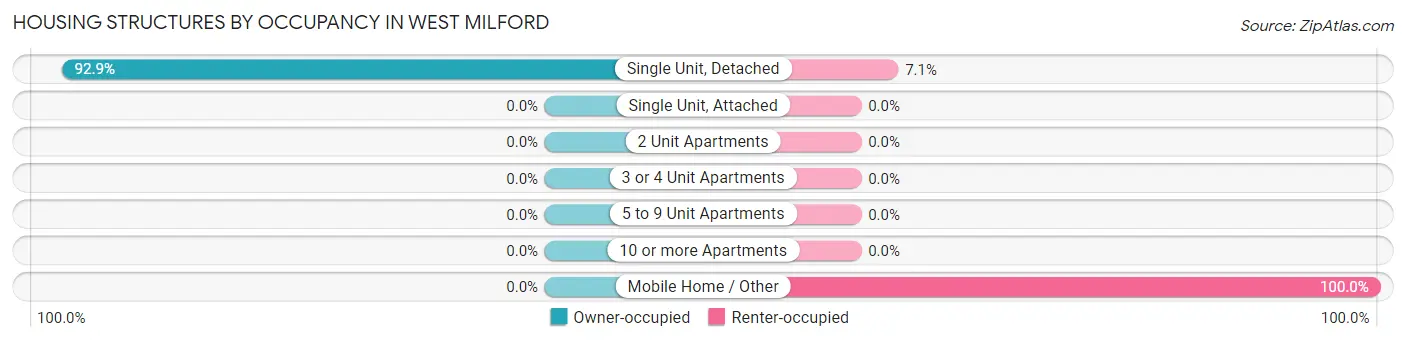
| Structure Type | Owner-occupied | Renter-occupied |
| Single Unit, Detached | 169 (92.9%) | 13 (7.1%) |
| Single Unit, Attached | 0 (0.0%) | 0 (0.0%) |
| 2 Unit Apartments | 0 (0.0%) | 0 (0.0%) |
| 3 or 4 Unit Apartments | 0 (0.0%) | 0 (0.0%) |
| 5 to 9 Unit Apartments | 0 (0.0%) | 0 (0.0%) |
| 10 or more Apartments | 0 (0.0%) | 0 (0.0%) |
| Mobile Home / Other | 0 (0.0%) | 5 (100.0%) |
| Total | 169 (90.4%) | 18 (9.6%) |
Housing Structures by Number of Rooms in West Milford
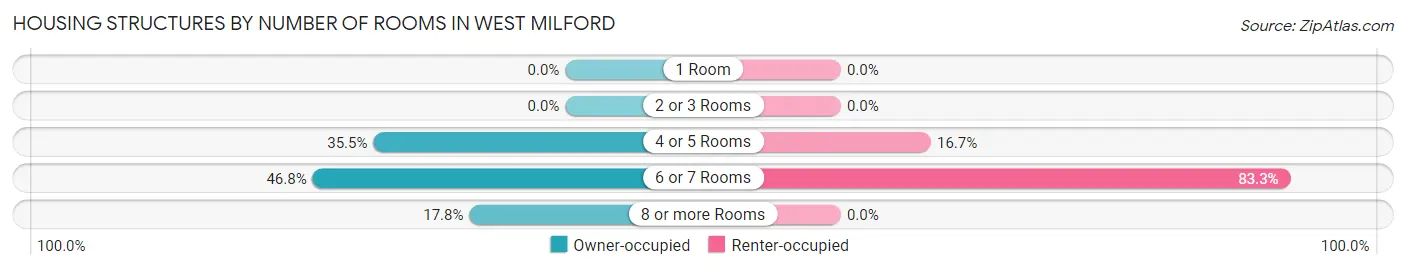
| Number of Rooms | Owner-occupied | Renter-occupied |
| 1 Room | 0 (0.0%) | 0 (0.0%) |
| 2 or 3 Rooms | 0 (0.0%) | 0 (0.0%) |
| 4 or 5 Rooms | 60 (35.5%) | 3 (16.7%) |
| 6 or 7 Rooms | 79 (46.8%) | 15 (83.3%) |
| 8 or more Rooms | 30 (17.7%) | 0 (0.0%) |
| Total | 169 (100.0%) | 18 (100.0%) |
Housing Structure by Heating Type in West Milford
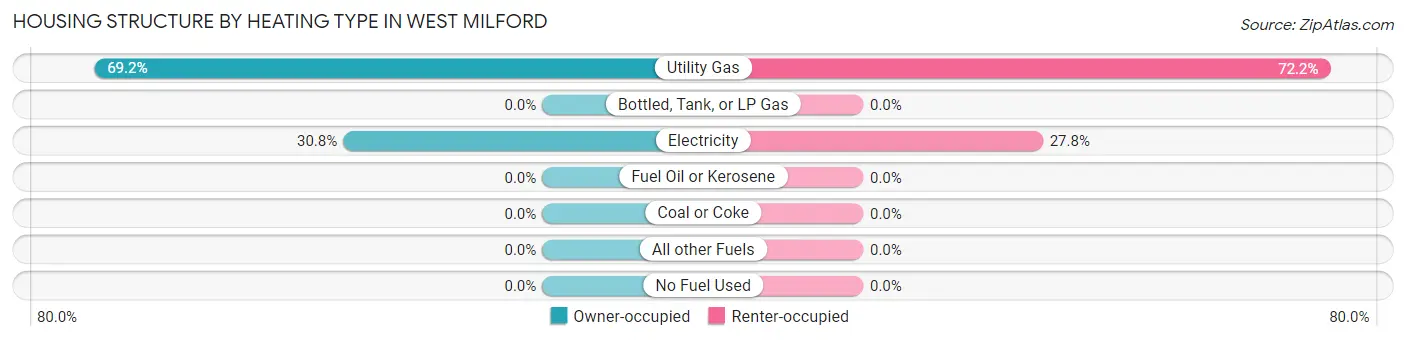
| Heating Type | Owner-occupied | Renter-occupied |
| Utility Gas | 117 (69.2%) | 13 (72.2%) |
| Bottled, Tank, or LP Gas | 0 (0.0%) | 0 (0.0%) |
| Electricity | 52 (30.8%) | 5 (27.8%) |
| Fuel Oil or Kerosene | 0 (0.0%) | 0 (0.0%) |
| Coal or Coke | 0 (0.0%) | 0 (0.0%) |
| All other Fuels | 0 (0.0%) | 0 (0.0%) |
| No Fuel Used | 0 (0.0%) | 0 (0.0%) |
| Total | 169 (100.0%) | 18 (100.0%) |
Household Vehicle Usage in West Milford
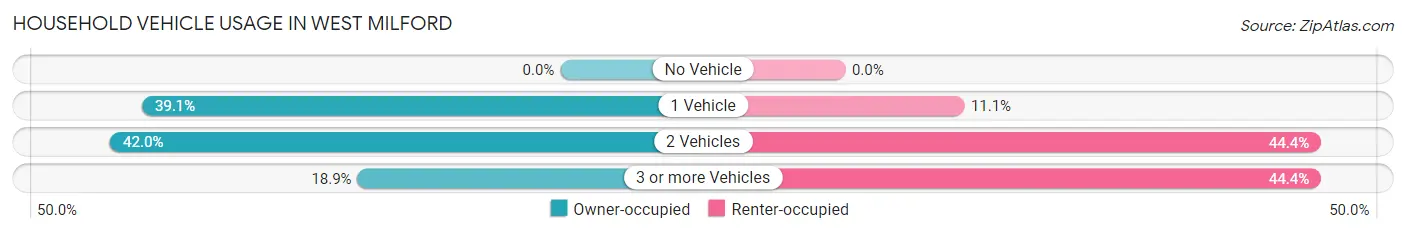
| Vehicles per Household | Owner-occupied | Renter-occupied |
| No Vehicle | 0 (0.0%) | 0 (0.0%) |
| 1 Vehicle | 66 (39.1%) | 2 (11.1%) |
| 2 Vehicles | 71 (42.0%) | 8 (44.4%) |
| 3 or more Vehicles | 32 (18.9%) | 8 (44.4%) |
| Total | 169 (100.0%) | 18 (100.0%) |
Real Estate & Mortgages in West Milford
Real Estate and Mortgage Overview in West Milford
| Characteristic | Without Mortgage | With Mortgage |
| Housing Units | 50 | 119 |
| Median Property Value | $104,200 | $140,300 |
| Median Household Income | $56,667 | $7 |
| Monthly Housing Costs | $371 | $0 |
| Real Estate Taxes | $847 | $1 |
Property Value by Mortgage Status in West Milford
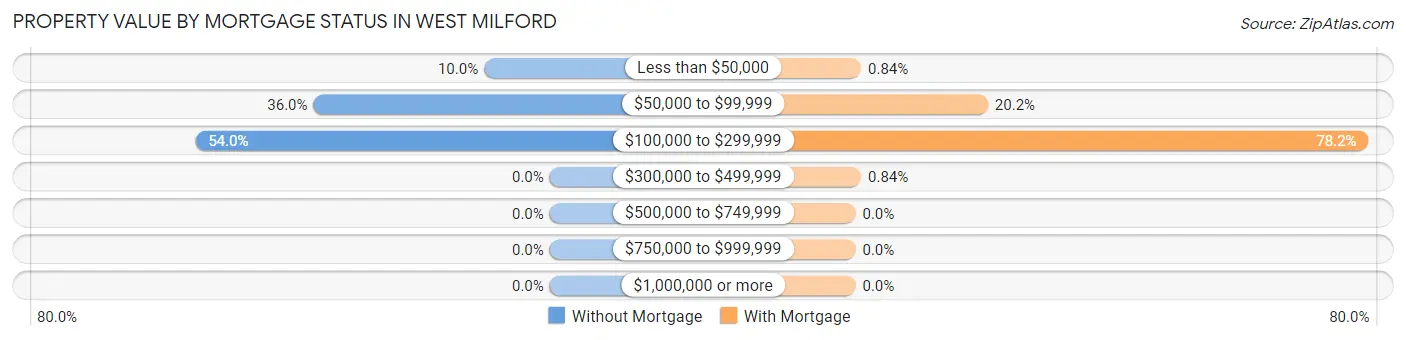
| Property Value | Without Mortgage | With Mortgage |
| Less than $50,000 | 5 (10.0%) | 1 (0.8%) |
| $50,000 to $99,999 | 18 (36.0%) | 24 (20.2%) |
| $100,000 to $299,999 | 27 (54.0%) | 93 (78.1%) |
| $300,000 to $499,999 | 0 (0.0%) | 1 (0.8%) |
| $500,000 to $749,999 | 0 (0.0%) | 0 (0.0%) |
| $750,000 to $999,999 | 0 (0.0%) | 0 (0.0%) |
| $1,000,000 or more | 0 (0.0%) | 0 (0.0%) |
| Total | 50 (100.0%) | 119 (100.0%) |
Household Income by Mortgage Status in West Milford
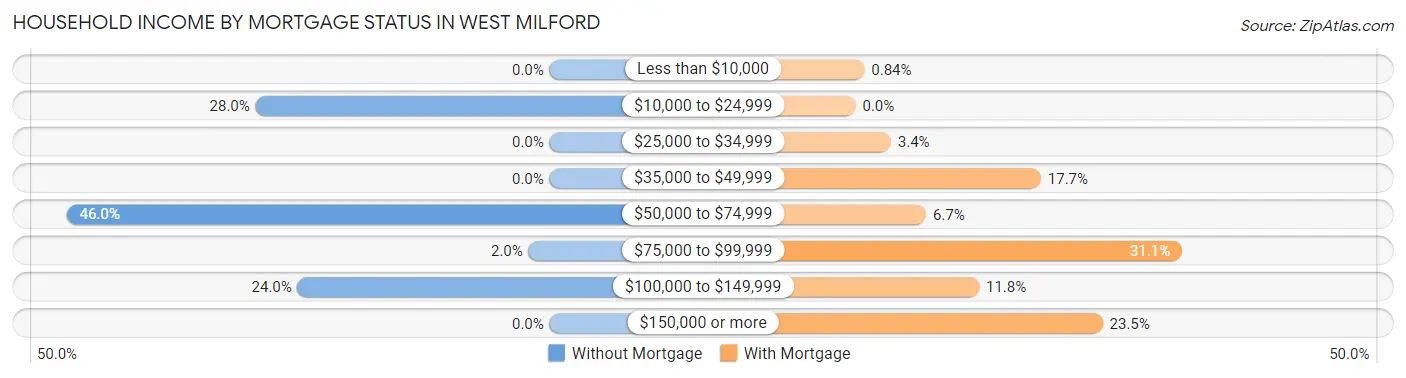
| Household Income | Without Mortgage | With Mortgage |
| Less than $10,000 | 0 (0.0%) | 1 (0.8%) |
| $10,000 to $24,999 | 14 (28.0%) | 0 (0.0%) |
| $25,000 to $34,999 | 0 (0.0%) | 4 (3.4%) |
| $35,000 to $49,999 | 0 (0.0%) | 21 (17.6%) |
| $50,000 to $74,999 | 23 (46.0%) | 8 (6.7%) |
| $75,000 to $99,999 | 1 (2.0%) | 37 (31.1%) |
| $100,000 to $149,999 | 12 (24.0%) | 14 (11.8%) |
| $150,000 or more | 0 (0.0%) | 28 (23.5%) |
| Total | 50 (100.0%) | 119 (100.0%) |
Property Value to Household Income Ratio in West Milford
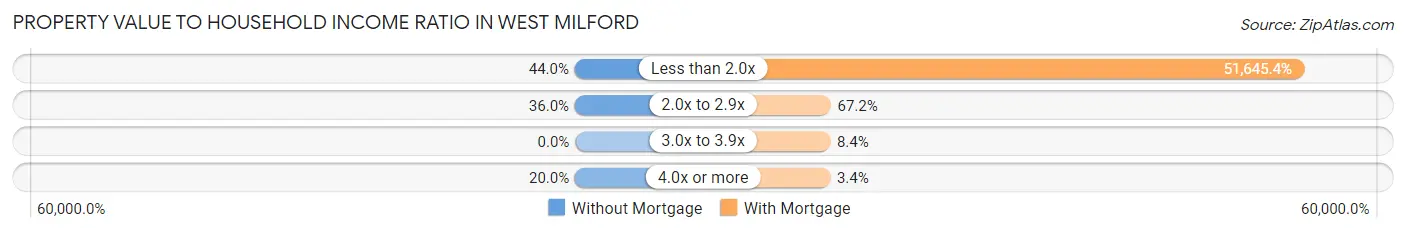
| Value-to-Income Ratio | Without Mortgage | With Mortgage |
| Less than 2.0x | 22 (44.0%) | 61,458 (51,645.4%) |
| 2.0x to 2.9x | 18 (36.0%) | 80 (67.2%) |
| 3.0x to 3.9x | 0 (0.0%) | 10 (8.4%) |
| 4.0x or more | 10 (20.0%) | 4 (3.4%) |
| Total | 50 (100.0%) | 119 (100.0%) |
Real Estate Taxes by Mortgage Status in West Milford
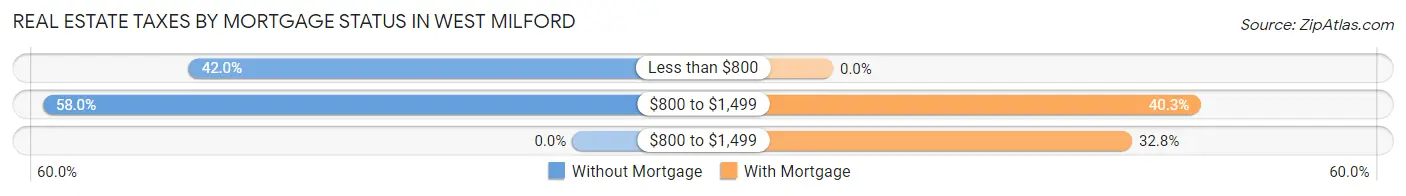
| Property Taxes | Without Mortgage | With Mortgage |
| Less than $800 | 21 (42.0%) | 0 (0.0%) |
| $800 to $1,499 | 29 (58.0%) | 48 (40.3%) |
| $800 to $1,499 | 0 (0.0%) | 39 (32.8%) |
| Total | 50 (100.0%) | 119 (100.0%) |
Health & Disability in West Milford
Health Insurance Coverage by Age in West Milford
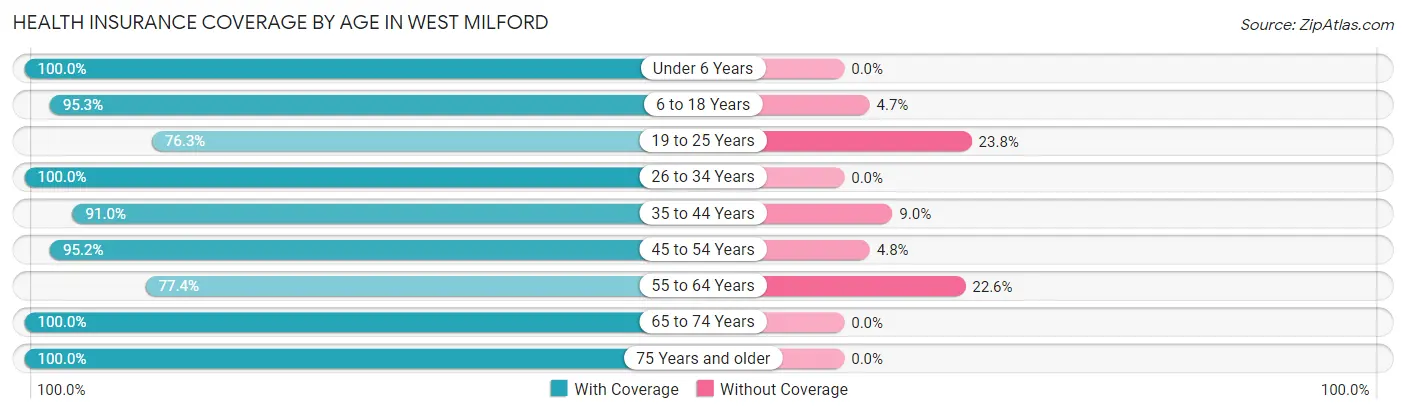
| Age Bracket | With Coverage | Without Coverage |
| Under 6 Years | 33 (100.0%) | 0 (0.0%) |
| 6 to 18 Years | 101 (95.3%) | 5 (4.7%) |
| 19 to 25 Years | 61 (76.2%) | 19 (23.7%) |
| 26 to 34 Years | 40 (100.0%) | 0 (0.0%) |
| 35 to 44 Years | 71 (91.0%) | 7 (9.0%) |
| 45 to 54 Years | 60 (95.2%) | 3 (4.8%) |
| 55 to 64 Years | 48 (77.4%) | 14 (22.6%) |
| 65 to 74 Years | 21 (100.0%) | 0 (0.0%) |
| 75 Years and older | 18 (100.0%) | 0 (0.0%) |
| Total | 453 (90.4%) | 48 (9.6%) |
Health Insurance Coverage by Citizenship Status in West Milford
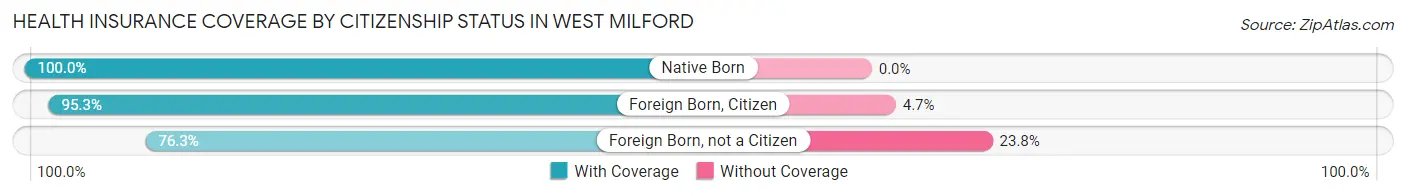
| Citizenship Status | With Coverage | Without Coverage |
| Native Born | 33 (100.0%) | 0 (0.0%) |
| Foreign Born, Citizen | 101 (95.3%) | 5 (4.7%) |
| Foreign Born, not a Citizen | 61 (76.2%) | 19 (23.7%) |
Health Insurance Coverage by Household Income in West Milford
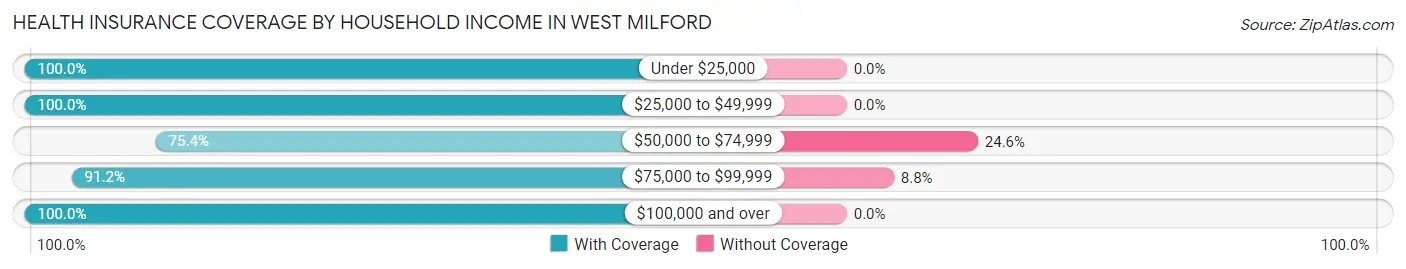
| Household Income | With Coverage | Without Coverage |
| Under $25,000 | 23 (100.0%) | 0 (0.0%) |
| $25,000 to $49,999 | 40 (100.0%) | 0 (0.0%) |
| $50,000 to $74,999 | 129 (75.4%) | 42 (24.6%) |
| $75,000 to $99,999 | 62 (91.2%) | 6 (8.8%) |
| $100,000 and over | 199 (100.0%) | 0 (0.0%) |
Public vs Private Health Insurance Coverage by Age in West Milford
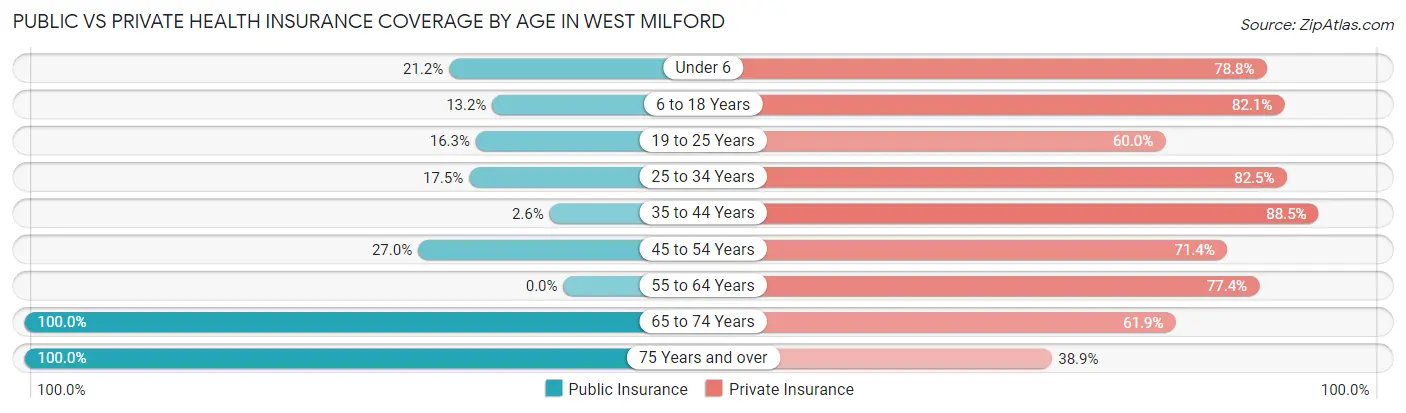
| Age Bracket | Public Insurance | Private Insurance |
| Under 6 | 7 (21.2%) | 26 (78.8%) |
| 6 to 18 Years | 14 (13.2%) | 87 (82.1%) |
| 19 to 25 Years | 13 (16.3%) | 48 (60.0%) |
| 25 to 34 Years | 7 (17.5%) | 33 (82.5%) |
| 35 to 44 Years | 2 (2.6%) | 69 (88.5%) |
| 45 to 54 Years | 17 (27.0%) | 45 (71.4%) |
| 55 to 64 Years | 0 (0.0%) | 48 (77.4%) |
| 65 to 74 Years | 21 (100.0%) | 13 (61.9%) |
| 75 Years and over | 18 (100.0%) | 7 (38.9%) |
| Total | 99 (19.8%) | 376 (75.0%) |
Disability Status by Sex by Age in West Milford
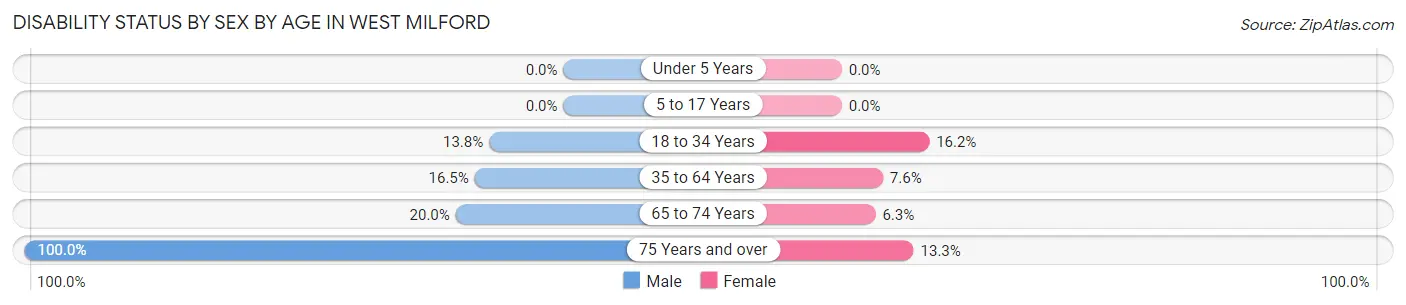
| Age Bracket | Male | Female |
| Under 5 Years | 0 (0.0%) | 0 (0.0%) |
| 5 to 17 Years | 0 (0.0%) | 0 (0.0%) |
| 18 to 34 Years | 8 (13.8%) | 12 (16.2%) |
| 35 to 64 Years | 14 (16.5%) | 9 (7.6%) |
| 65 to 74 Years | 1 (20.0%) | 1 (6.2%) |
| 75 Years and over | 3 (100.0%) | 2 (13.3%) |
Disability Class by Sex by Age in West Milford
Disability Class: Hearing Difficulty
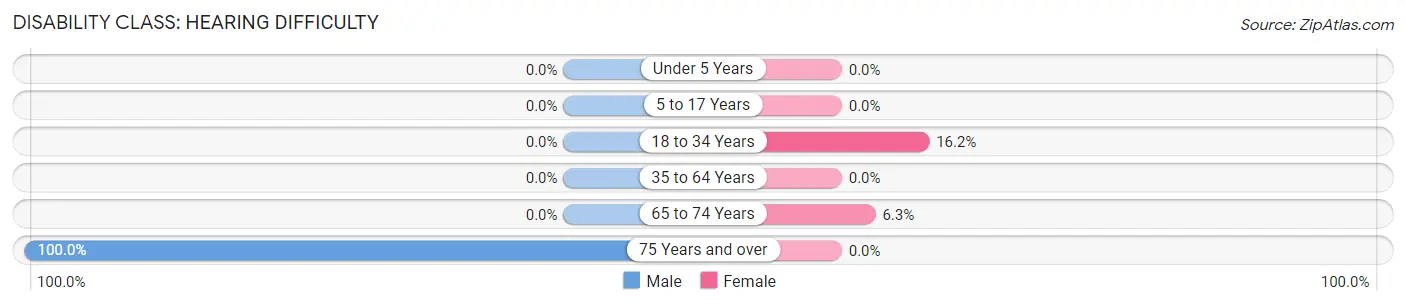
| Age Bracket | Male | Female |
| Under 5 Years | 0 (0.0%) | 0 (0.0%) |
| 5 to 17 Years | 0 (0.0%) | 0 (0.0%) |
| 18 to 34 Years | 0 (0.0%) | 12 (16.2%) |
| 35 to 64 Years | 0 (0.0%) | 0 (0.0%) |
| 65 to 74 Years | 0 (0.0%) | 1 (6.2%) |
| 75 Years and over | 3 (100.0%) | 0 (0.0%) |
Disability Class: Vision Difficulty
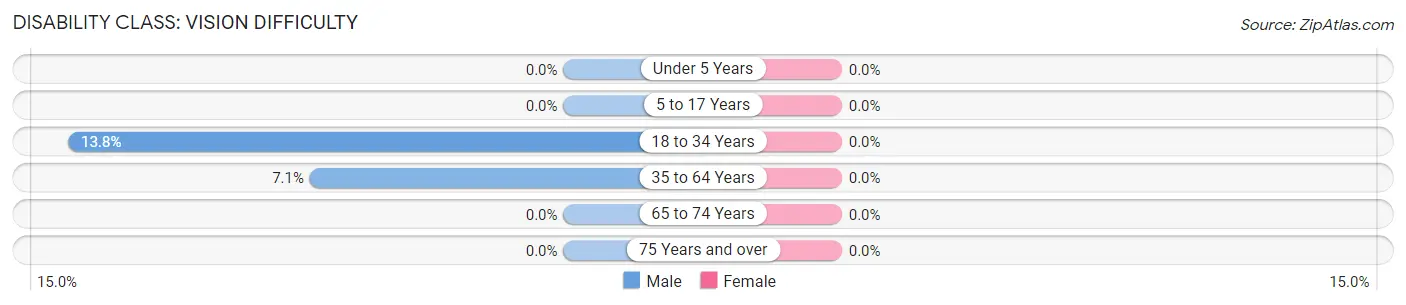
| Age Bracket | Male | Female |
| Under 5 Years | 0 (0.0%) | 0 (0.0%) |
| 5 to 17 Years | 0 (0.0%) | 0 (0.0%) |
| 18 to 34 Years | 8 (13.8%) | 0 (0.0%) |
| 35 to 64 Years | 6 (7.1%) | 0 (0.0%) |
| 65 to 74 Years | 0 (0.0%) | 0 (0.0%) |
| 75 Years and over | 0 (0.0%) | 0 (0.0%) |
Disability Class: Cognitive Difficulty
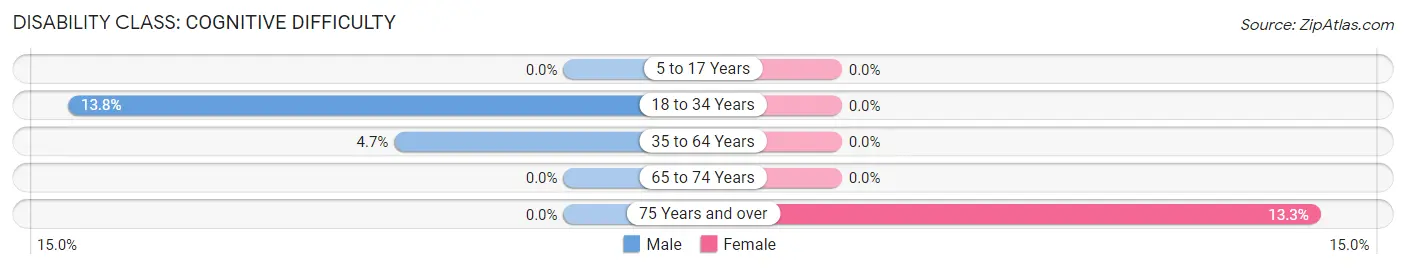
| Age Bracket | Male | Female |
| 5 to 17 Years | 0 (0.0%) | 0 (0.0%) |
| 18 to 34 Years | 8 (13.8%) | 0 (0.0%) |
| 35 to 64 Years | 4 (4.7%) | 0 (0.0%) |
| 65 to 74 Years | 0 (0.0%) | 0 (0.0%) |
| 75 Years and over | 0 (0.0%) | 2 (13.3%) |
Disability Class: Ambulatory Difficulty
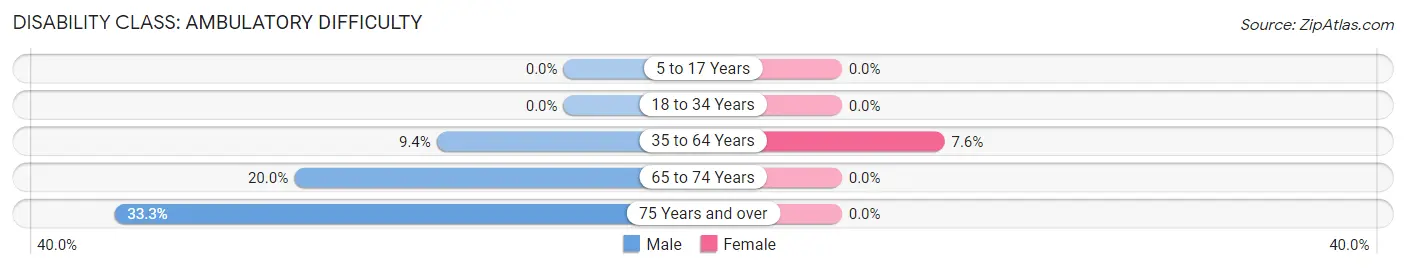
| Age Bracket | Male | Female |
| 5 to 17 Years | 0 (0.0%) | 0 (0.0%) |
| 18 to 34 Years | 0 (0.0%) | 0 (0.0%) |
| 35 to 64 Years | 8 (9.4%) | 9 (7.6%) |
| 65 to 74 Years | 1 (20.0%) | 0 (0.0%) |
| 75 Years and over | 1 (33.3%) | 0 (0.0%) |
Disability Class: Self-Care Difficulty
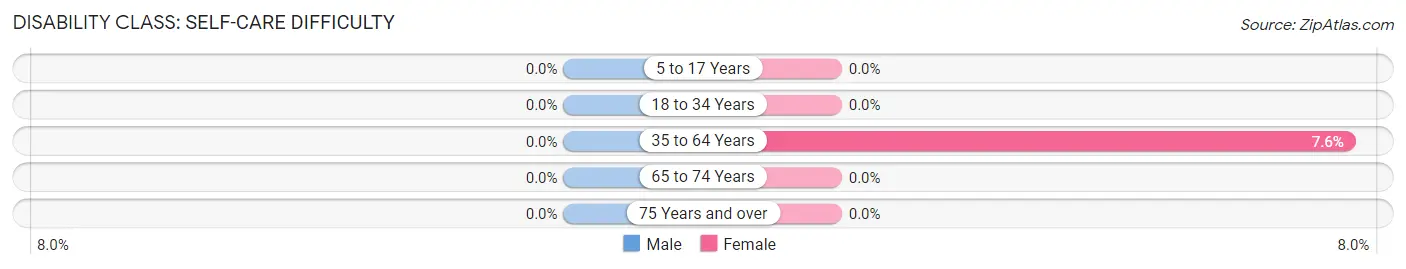
| Age Bracket | Male | Female |
| 5 to 17 Years | 0 (0.0%) | 0 (0.0%) |
| 18 to 34 Years | 0 (0.0%) | 0 (0.0%) |
| 35 to 64 Years | 0 (0.0%) | 9 (7.6%) |
| 65 to 74 Years | 0 (0.0%) | 0 (0.0%) |
| 75 Years and over | 0 (0.0%) | 0 (0.0%) |
Technology Access in West Milford
Computing Device Access in West Milford
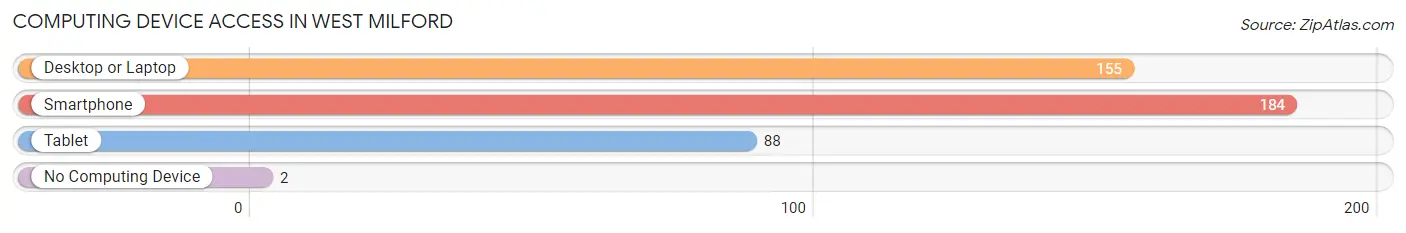
| Device Type | # Households | % Households |
| Desktop or Laptop | 155 | 82.9% |
| Smartphone | 184 | 98.4% |
| Tablet | 88 | 47.1% |
| No Computing Device | 2 | 1.1% |
| Total | 187 | 100.0% |
Internet Access in West Milford
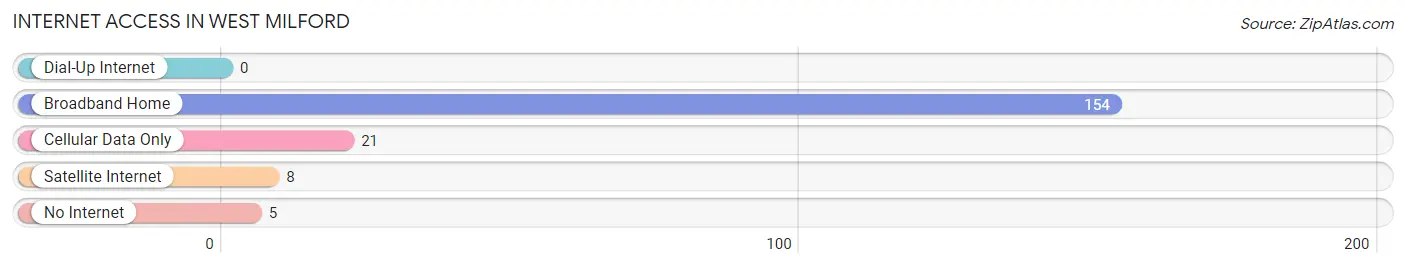
| Internet Type | # Households | % Households |
| Dial-Up Internet | 0 | 0.0% |
| Broadband Home | 154 | 82.4% |
| Cellular Data Only | 21 | 11.2% |
| Satellite Internet | 8 | 4.3% |
| No Internet | 5 | 2.7% |
| Total | 187 | 100.0% |
West Milford Summary
West Milford, West Virginia is a small town located in the eastern part of the state, in the Appalachian Mountains. It is situated in the northern part of Preston County, and is bordered by the towns of Kingwood, Reedsville, and Terra Alta. The town was founded in 1845 and was originally known as “West Milford Station”. The town was named after Milford, Pennsylvania, which was the hometown of the first settlers.
Geography
West Milford is located in the Appalachian Mountains, in the northern part of Preston County. The town is situated at an elevation of 1,890 feet above sea level. The town is surrounded by mountains and hills, and is located near the headwaters of the Cheat River. The town is located approximately 30 miles from Morgantown, West Virginia, and is approximately 90 miles from Pittsburgh, Pennsylvania.
The climate in West Milford is classified as humid continental, with cold winters and hot summers. The average annual temperature is around 50 degrees Fahrenheit, and the average annual precipitation is around 40 inches.
Economy
West Milford’s economy is largely based on agriculture and tourism. The town is home to several small farms, which produce a variety of crops, including corn, wheat, hay, and vegetables. The town is also home to several small businesses, including restaurants, shops, and a few small manufacturing companies.
Tourism is an important part of the local economy, as the town is located near several popular attractions, including the Cheat River, the Monongahela National Forest, and the Allegheny Mountains. The town is also home to several festivals and events throughout the year, including the West Milford Apple Festival and the West Milford Bluegrass Festival.
Demographics
As of the 2010 census, West Milford had a population of 1,890 people. The racial makeup of the town was 97.2% White, 0.6% African American, 0.3% Native American, 0.2% Asian, 0.1% Pacific Islander, 0.2% from other races, and 1.5% from two or more races. Hispanic or Latino of any race were 0.7% of the population.
The median household income in West Milford was $37,917, and the median family income was $45,000. The per capita income for the town was $18,945. About 11.2% of families and 14.2% of the population were below the poverty line, including 18.2% of those under age 18 and 8.3% of those age 65 or over.
Conclusion
West Milford, West Virginia is a small town located in the Appalachian Mountains, in the northern part of Preston County. The town was founded in 1845 and is home to a population of 1,890 people. The town’s economy is largely based on agriculture and tourism, and the town is home to several small businesses, farms, and festivals. The town has a humid continental climate, with cold winters and hot summers. The median household income in West Milford is $37,917, and the per capita income is $18,945.
Common Questions
What is Per Capita Income in West Milford?
Per Capita income in West Milford is $28,871.
What is the Median Family Income in West Milford?
Median Family Income in West Milford is $88,542.
What is the Median Household income in West Milford?
Median Household Income in West Milford is $59,297.
What is Income or Wage Gap in West Milford?
Income or Wage Gap in West Milford is 37.3%.
Women in West Milford earn 62.7 cents for every dollar earned by a man.
What is Inequality or Gini Index in West Milford?
Inequality or Gini Index in West Milford is 0.32.
What is the Total Population of West Milford?
Total Population of West Milford is 501.
What is the Total Male Population of West Milford?
Total Male Population of West Milford is 199.
What is the Total Female Population of West Milford?
Total Female Population of West Milford is 302.
What is the Ratio of Males per 100 Females in West Milford?
There are 65.89 Males per 100 Females in West Milford.
What is the Ratio of Females per 100 Males in West Milford?
There are 151.76 Females per 100 Males in West Milford.
What is the Median Population Age in West Milford?
Median Population Age in West Milford is 32.4 Years.
What is the Average Family Size in West Milford
Average Family Size in West Milford is 3.3 People.
What is the Average Household Size in West Milford
Average Household Size in West Milford is 2.7 People.
How Large is the Labor Force in West Milford?
There are 286 People in the Labor Forcein in West Milford.
What is the Percentage of People in the Labor Force in West Milford?
76.3% of People are in the Labor Force in West Milford.
What is the Unemployment Rate in West Milford?
Unemployment Rate in West Milford is 3.1%.