Great Cacapon, WV Map & Demographics
Great Cacapon Map
Great Cacapon Overview
$17,820
PER CAPITA INCOME
$40,909
AVG FAMILY INCOME
$42,045
AVG HOUSEHOLD INCOME
0.34
INEQUALITY / GINI INDEX
740
TOTAL POPULATION
470
MALE POPULATION
270
FEMALE POPULATION
174.07
MALES / 100 FEMALES
57.45
FEMALES / 100 MALES
39.0
MEDIAN AGE
3.8
AVG FAMILY SIZE
3.7
AVG HOUSEHOLD SIZE
303
LABOR FORCE [ PEOPLE ]
51.2%
PERCENT IN LABOR FORCE
Great Cacapon Zip Codes
Great Cacapon Area Codes
Income in Great Cacapon
Income Overview in Great Cacapon
Per Capita Income in Great Cacapon is $17,820, while median incomes of families and households are $40,909 and $42,045 respectively.
| Characteristic | Number | Measure |
| Per Capita Income | 740 | $17,820 |
| Median Family Income | 188 | $40,909 |
| Mean Family Income | 188 | $57,195 |
| Median Household Income | 198 | $42,045 |
| Mean Household Income | 198 | $57,568 |
| Income Deficit | 188 | $0 |
| Wage / Income Gap (%) | 740 | 0.00% |
| Wage / Income Gap ($) | 740 | 100.00¢ per $1 |
| Gini / Inequality Index | 740 | 0.34 |
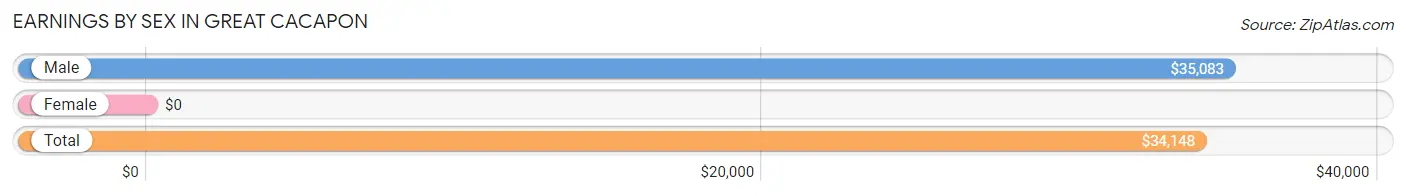
Earnings by Sex in Great Cacapon
| Sex | Number | Average Earnings |
| Male | 299 (90.6%) | $35,083 |
| Female | 31 (9.4%) | $0 |
| Total | 330 (100.0%) | $34,148 |
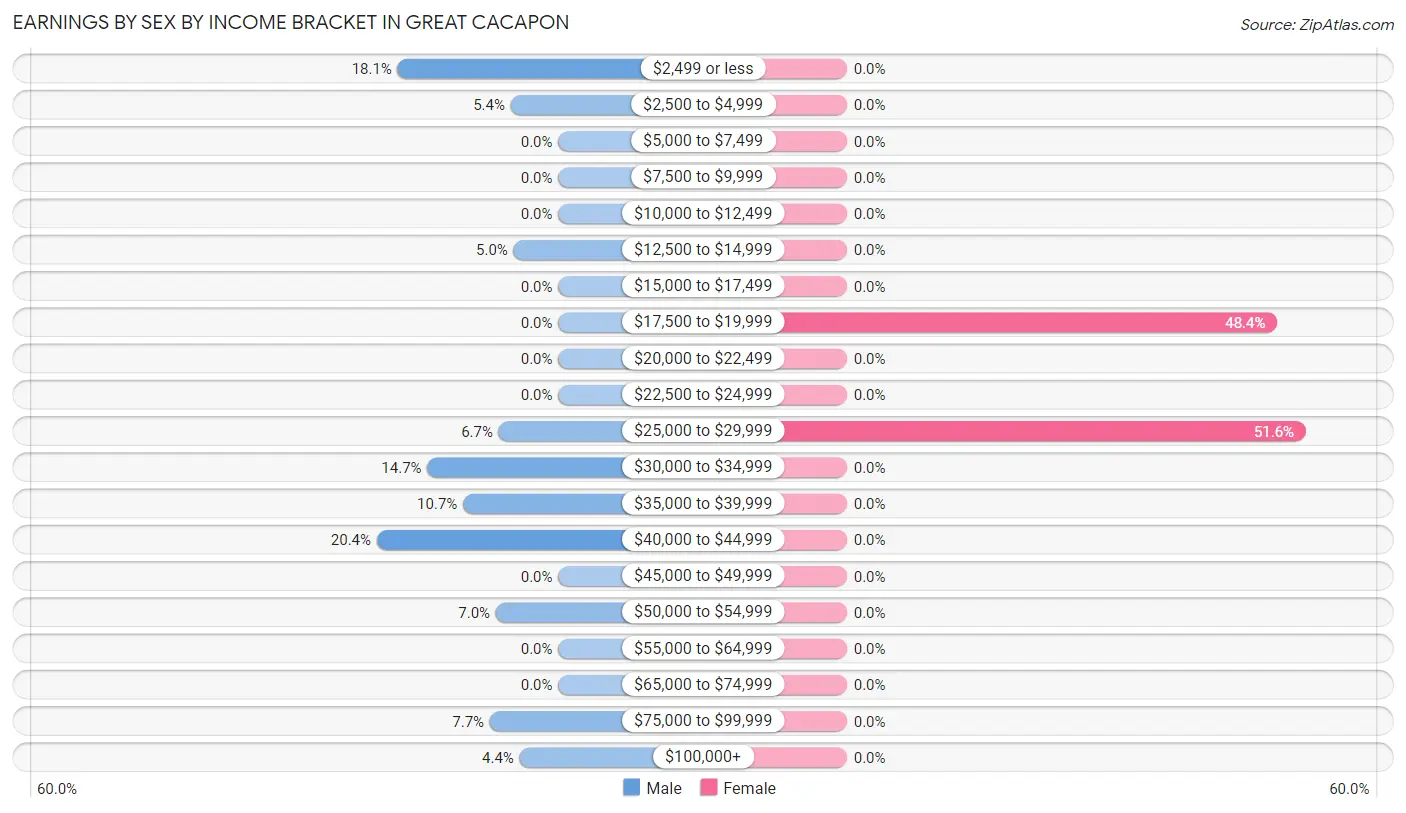
Earnings by Sex by Income Bracket in Great Cacapon
The most common earnings brackets in Great Cacapon are $40,000 to $44,999 for men (61 | 20.4%) and $25,000 to $29,999 for women (16 | 51.6%).
| Income | Male | Female |
| $2,499 or less | 54 (18.1%) | 0 (0.0%) |
| $2,500 to $4,999 | 16 (5.3%) | 0 (0.0%) |
| $5,000 to $7,499 | 0 (0.0%) | 0 (0.0%) |
| $7,500 to $9,999 | 0 (0.0%) | 0 (0.0%) |
| $10,000 to $12,499 | 0 (0.0%) | 0 (0.0%) |
| $12,500 to $14,999 | 15 (5.0%) | 0 (0.0%) |
| $15,000 to $17,499 | 0 (0.0%) | 0 (0.0%) |
| $17,500 to $19,999 | 0 (0.0%) | 15 (48.4%) |
| $20,000 to $22,499 | 0 (0.0%) | 0 (0.0%) |
| $22,500 to $24,999 | 0 (0.0%) | 0 (0.0%) |
| $25,000 to $29,999 | 20 (6.7%) | 16 (51.6%) |
| $30,000 to $34,999 | 44 (14.7%) | 0 (0.0%) |
| $35,000 to $39,999 | 32 (10.7%) | 0 (0.0%) |
| $40,000 to $44,999 | 61 (20.4%) | 0 (0.0%) |
| $45,000 to $49,999 | 0 (0.0%) | 0 (0.0%) |
| $50,000 to $54,999 | 21 (7.0%) | 0 (0.0%) |
| $55,000 to $64,999 | 0 (0.0%) | 0 (0.0%) |
| $65,000 to $74,999 | 0 (0.0%) | 0 (0.0%) |
| $75,000 to $99,999 | 23 (7.7%) | 0 (0.0%) |
| $100,000+ | 13 (4.3%) | 0 (0.0%) |
| Total | 299 (100.0%) | 31 (100.0%) |
Earnings by Sex by Educational Attainment in Great Cacapon
| Educational Attainment | Male Income | Female Income |
| Less than High School | - | - |
| High School Diploma | - | - |
| College or Associate's Degree | - | - |
| Bachelor's Degree | - | - |
| Graduate Degree | - | - |
| Total | $34,375 | $0 |
Family Income in Great Cacapon
Family Income Brackets in Great Cacapon
According to the Great Cacapon family income data, there are 57 families falling into the $35,000 to $49,999 income range, which is the most common income bracket and makes up 30.3% of all families.
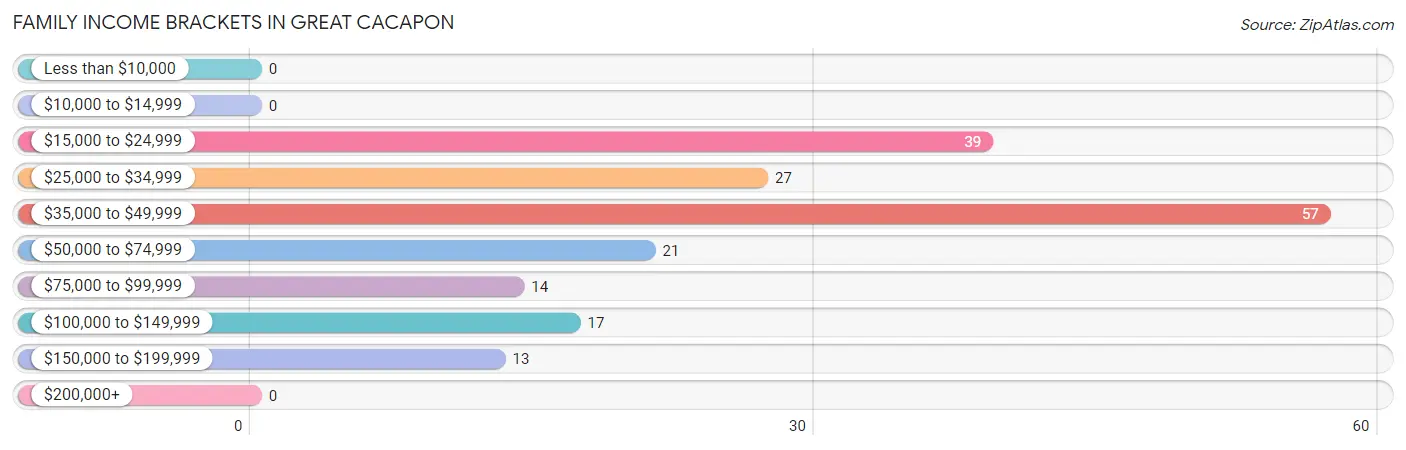
| Income Bracket | # Families | % Families |
| Less than $10,000 | 0 | 0.0% |
| $10,000 to $14,999 | 0 | 0.0% |
| $15,000 to $24,999 | 39 | 20.7% |
| $25,000 to $34,999 | 27 | 14.4% |
| $35,000 to $49,999 | 57 | 30.3% |
| $50,000 to $74,999 | 21 | 11.2% |
| $75,000 to $99,999 | 14 | 7.4% |
| $100,000 to $149,999 | 17 | 9.0% |
| $150,000 to $199,999 | 13 | 6.9% |
| $200,000+ | 0 | 0.0% |
Family Income by Famaliy Size in Great Cacapon
5-person families (60 | 31.9%) account for the highest median family income in Great Cacapon with $24,063 per family, while 5-person families (60 | 31.9%) have the highest median income of $4,813 per family member.
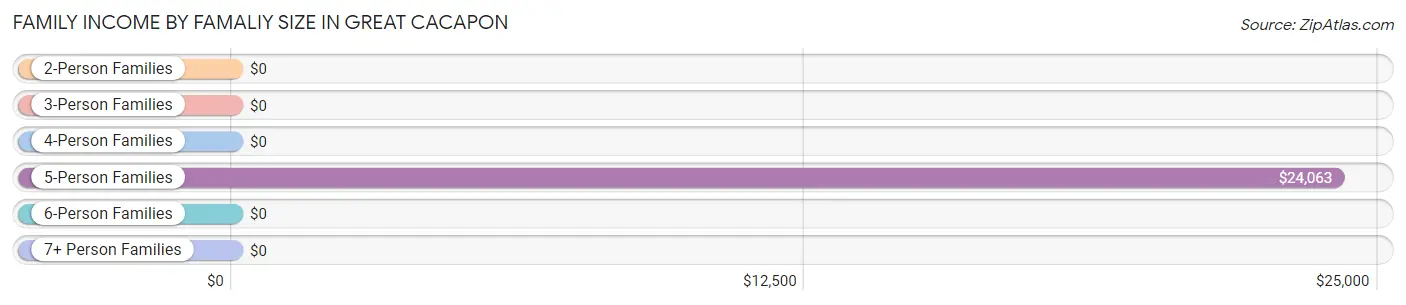
| Income Bracket | # Families | Median Income |
| 2-Person Families | 55 (29.3%) | $0 |
| 3-Person Families | 37 (19.7%) | $0 |
| 4-Person Families | 36 (19.2%) | $0 |
| 5-Person Families | 60 (31.9%) | $24,063 |
| 6-Person Families | 0 (0.0%) | $0 |
| 7+ Person Families | 0 (0.0%) | $0 |
| Total | 188 (100.0%) | $40,909 |
Family Income by Number of Earners in Great Cacapon
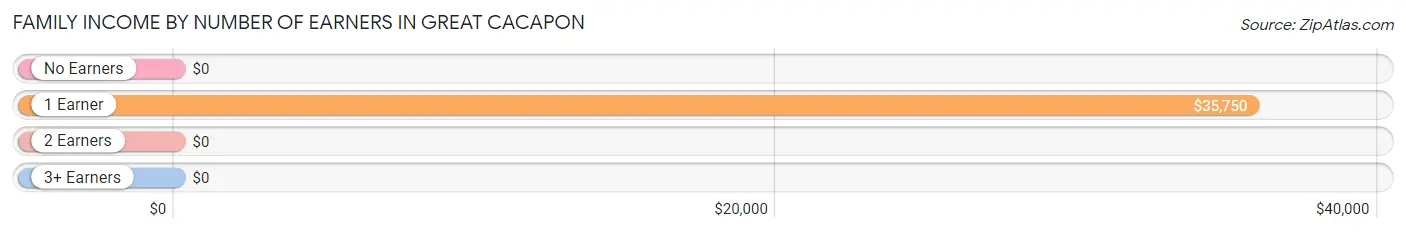
| Number of Earners | # Families | Median Income |
| No Earners | 24 (12.8%) | $0 |
| 1 Earner | 96 (51.1%) | $35,750 |
| 2 Earners | 29 (15.4%) | $0 |
| 3+ Earners | 39 (20.7%) | $0 |
| Total | 188 (100.0%) | $40,909 |
Household Income in Great Cacapon
Household Income Brackets in Great Cacapon
With 57 households falling in the category, the $35,000 to $49,999 income range is the most frequent in Great Cacapon, accounting for 28.8% of all households.
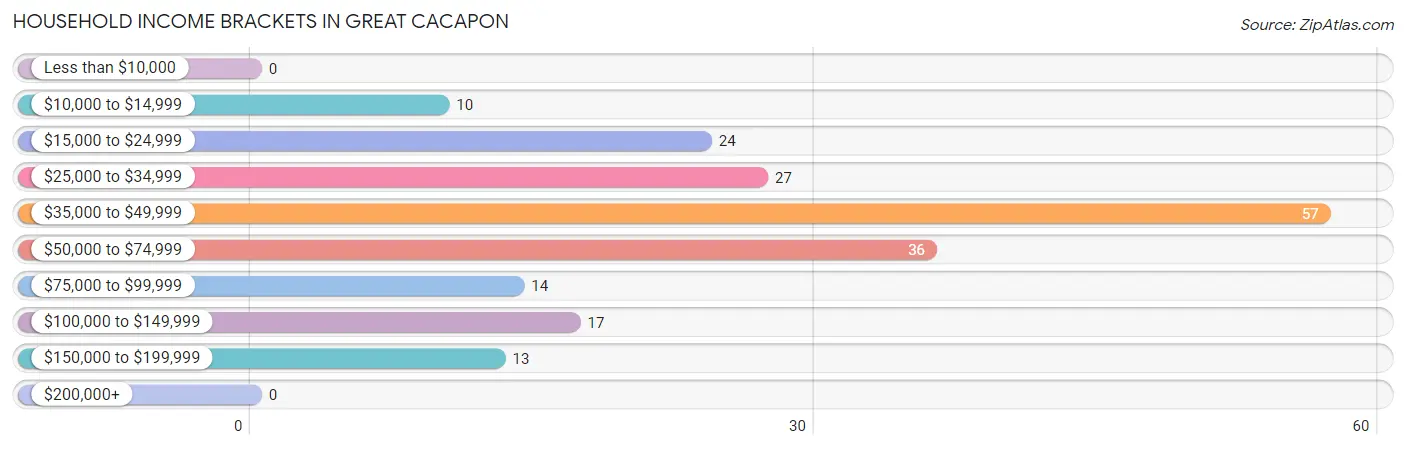
| Income Bracket | # Households | % Households |
| Less than $10,000 | 0 | 0.0% |
| $10,000 to $14,999 | 10 | 5.1% |
| $15,000 to $24,999 | 24 | 12.1% |
| $25,000 to $34,999 | 27 | 13.6% |
| $35,000 to $49,999 | 57 | 28.8% |
| $50,000 to $74,999 | 36 | 18.2% |
| $75,000 to $99,999 | 14 | 7.1% |
| $100,000 to $149,999 | 17 | 8.6% |
| $150,000 to $199,999 | 13 | 6.6% |
| $200,000+ | 0 | 0.0% |
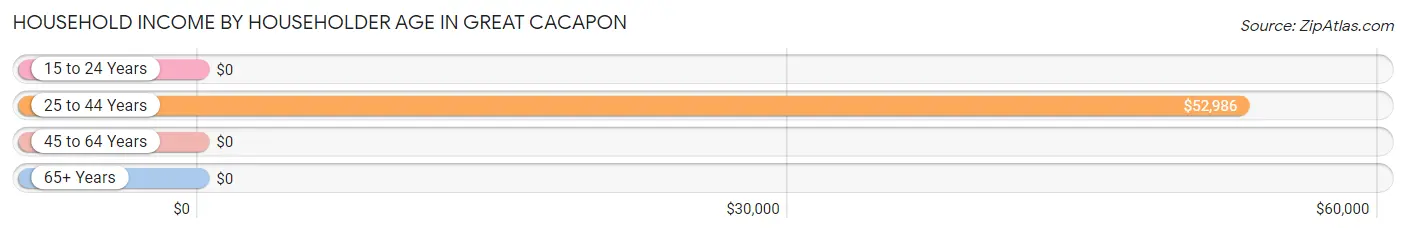
Household Income by Householder Age in Great Cacapon
The median household income in Great Cacapon is $42,045, with the highest median household income of $52,986 found in the 25 to 44 years age bracket for the primary householder. A total of 92 households (46.5%) fall into this category.
| Income Bracket | # Households | Median Income |
| 15 to 24 Years | 0 (0.0%) | $0 |
| 25 to 44 Years | 92 (46.5%) | $52,986 |
| 45 to 64 Years | 76 (38.4%) | $0 |
| 65+ Years | 30 (15.1%) | $0 |
| Total | 198 (100.0%) | $42,045 |
Poverty in Great Cacapon
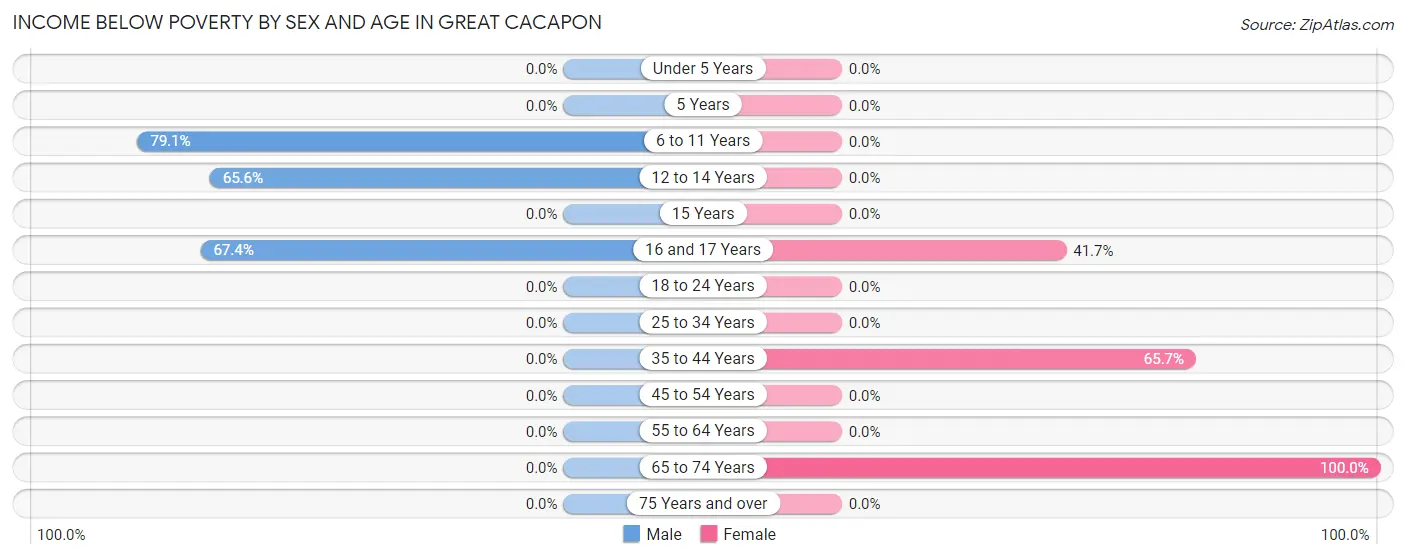
Income Below Poverty by Sex and Age in Great Cacapon
With 26.0% poverty level for males and 34.8% for females among the residents of Great Cacapon, 6 to 11 year old males and 65 to 74 year old females are the most vulnerable to poverty, with 68 males (79.1%) and 10 females (100.0%) in their respective age groups living below the poverty level.
| Age Bracket | Male | Female |
| Under 5 Years | 0 (0.0%) | 0 (0.0%) |
| 5 Years | 0 (0.0%) | 0 (0.0%) |
| 6 to 11 Years | 68 (79.1%) | 0 (0.0%) |
| 12 to 14 Years | 21 (65.6%) | 0 (0.0%) |
| 15 Years | 0 (0.0%) | 0 (0.0%) |
| 16 and 17 Years | 33 (67.3%) | 15 (41.7%) |
| 18 to 24 Years | 0 (0.0%) | 0 (0.0%) |
| 25 to 34 Years | 0 (0.0%) | 0 (0.0%) |
| 35 to 44 Years | 0 (0.0%) | 69 (65.7%) |
| 45 to 54 Years | 0 (0.0%) | 0 (0.0%) |
| 55 to 64 Years | 0 (0.0%) | 0 (0.0%) |
| 65 to 74 Years | 0 (0.0%) | 10 (100.0%) |
| 75 Years and over | 0 (0.0%) | 0 (0.0%) |
| Total | 122 (26.0%) | 94 (34.8%) |
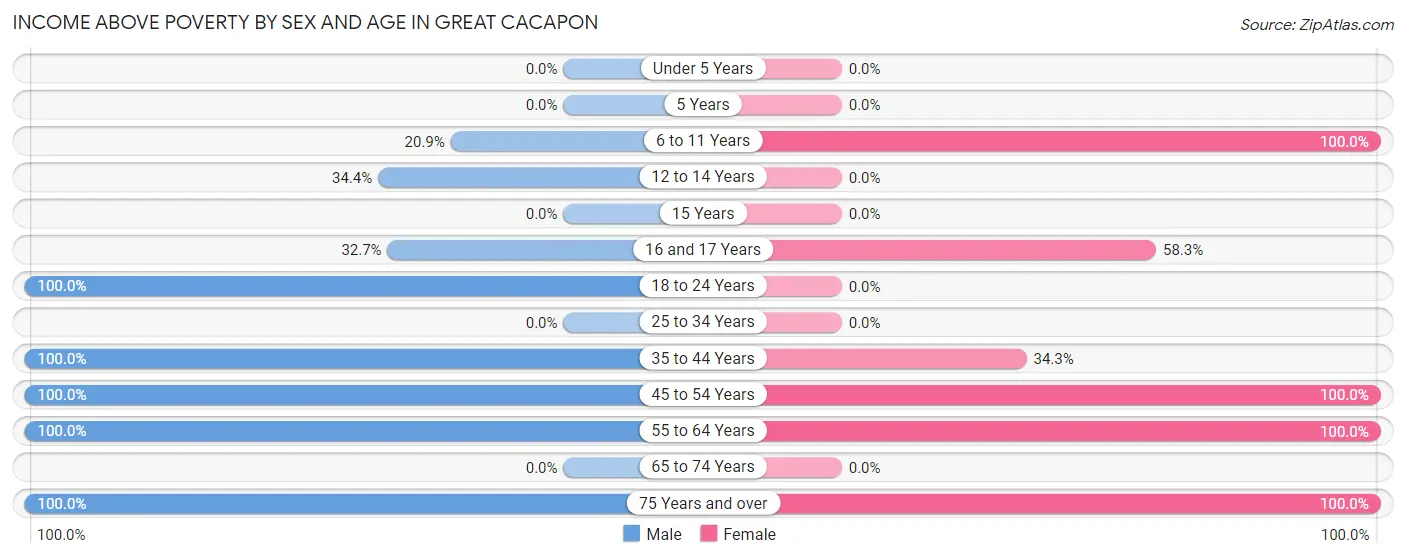
Income Above Poverty by Sex and Age in Great Cacapon
According to the poverty statistics in Great Cacapon, males aged 18 to 24 years and females aged 6 to 11 years are the age groups that are most secure financially, with 100.0% of males and 100.0% of females in these age groups living above the poverty line.
| Age Bracket | Male | Female |
| Under 5 Years | 0 (0.0%) | 0 (0.0%) |
| 5 Years | 0 (0.0%) | 0 (0.0%) |
| 6 to 11 Years | 18 (20.9%) | 30 (100.0%) |
| 12 to 14 Years | 11 (34.4%) | 0 (0.0%) |
| 15 Years | 0 (0.0%) | 0 (0.0%) |
| 16 and 17 Years | 16 (32.7%) | 21 (58.3%) |
| 18 to 24 Years | 39 (100.0%) | 0 (0.0%) |
| 25 to 34 Years | 0 (0.0%) | 0 (0.0%) |
| 35 to 44 Years | 139 (100.0%) | 36 (34.3%) |
| 45 to 54 Years | 50 (100.0%) | 39 (100.0%) |
| 55 to 64 Years | 55 (100.0%) | 35 (100.0%) |
| 65 to 74 Years | 0 (0.0%) | 0 (0.0%) |
| 75 Years and over | 20 (100.0%) | 15 (100.0%) |
| Total | 348 (74.0%) | 176 (65.2%) |
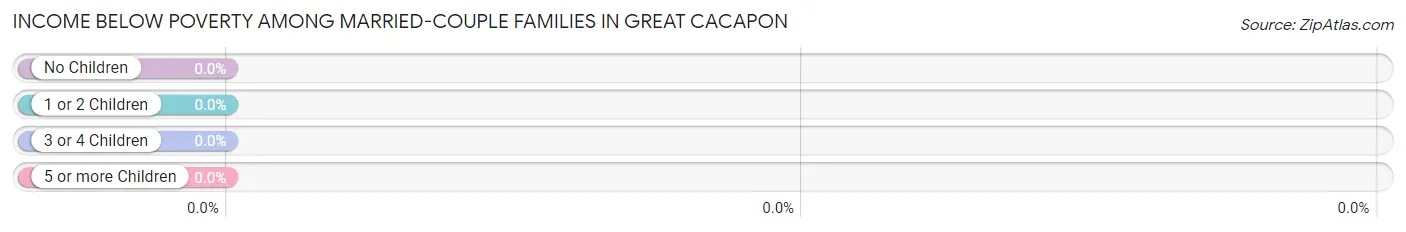
Income Below Poverty Among Married-Couple Families in Great Cacapon
| Children | Above Poverty | Below Poverty |
| No Children | 99 (100.0%) | 0 (0.0%) |
| 1 or 2 Children | 14 (100.0%) | 0 (0.0%) |
| 3 or 4 Children | 21 (100.0%) | 0 (0.0%) |
| 5 or more Children | 0 (0.0%) | 0 (0.0%) |
| Total | 134 (100.0%) | 0 (0.0%) |
Income Below Poverty Among Single-Parent Households in Great Cacapon
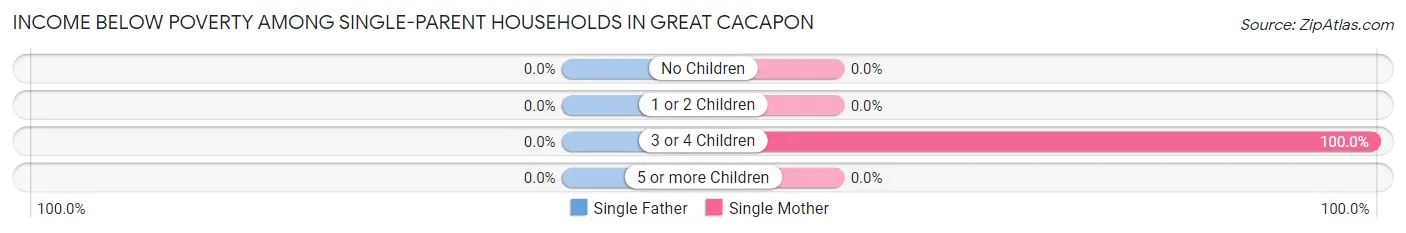
| Children | Single Father | Single Mother |
| No Children | 0 (0.0%) | 0 (0.0%) |
| 1 or 2 Children | 0 (0.0%) | 0 (0.0%) |
| 3 or 4 Children | 0 (0.0%) | 39 (100.0%) |
| 5 or more Children | 0 (0.0%) | 0 (0.0%) |
| Total | 0 (0.0%) | 39 (100.0%) |
Income Below Poverty Among Married-Couple vs Single-Parent Households in Great Cacapon
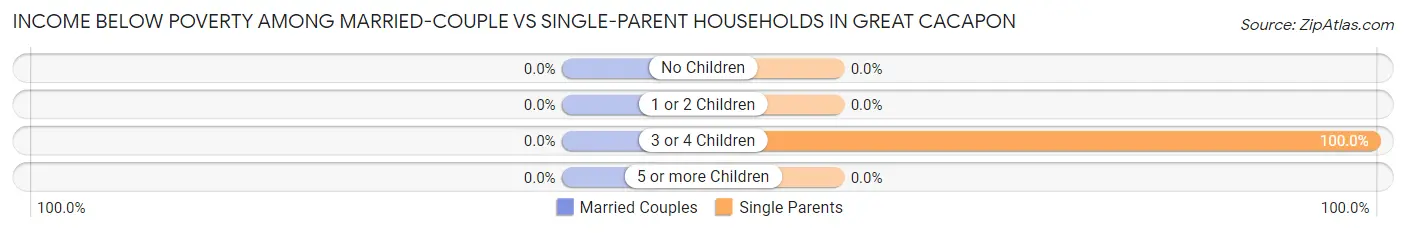
| Children | Married-Couple Families | Single-Parent Households |
| No Children | 0 (0.0%) | 0 (0.0%) |
| 1 or 2 Children | 0 (0.0%) | 0 (0.0%) |
| 3 or 4 Children | 0 (0.0%) | 39 (100.0%) |
| 5 or more Children | 0 (0.0%) | 0 (0.0%) |
| Total | 0 (0.0%) | 39 (72.2%) |
Race in Great Cacapon
The most populous races in Great Cacapon are White / Caucasian (740 | 100.0%), and Hispanic or Latino (33 | 4.5%).
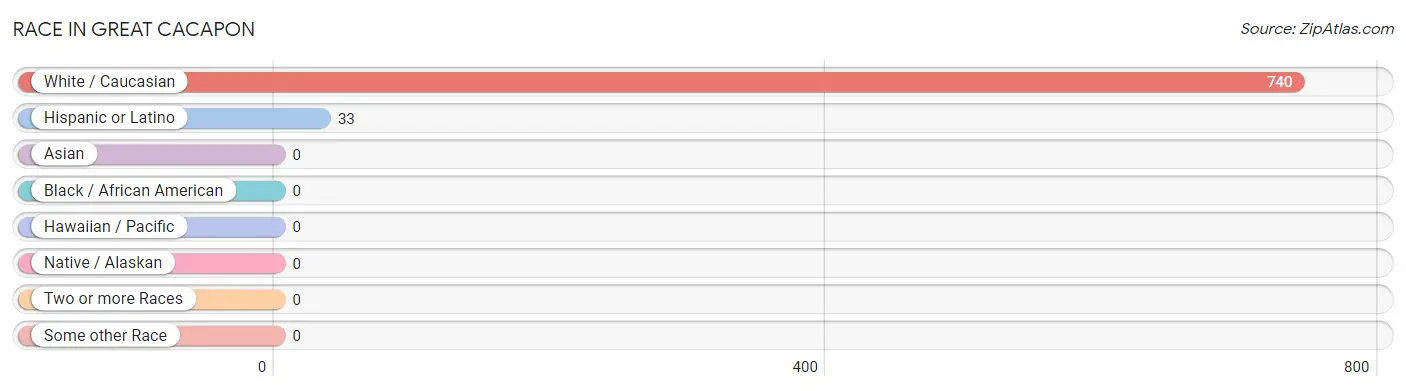
| Race | # Population | % Population |
| Asian | 0 | 0.0% |
| Black / African American | 0 | 0.0% |
| Hawaiian / Pacific | 0 | 0.0% |
| Hispanic or Latino | 33 | 4.5% |
| Native / Alaskan | 0 | 0.0% |
| White / Caucasian | 740 | 100.0% |
| Two or more Races | 0 | 0.0% |
| Some other Race | 0 | 0.0% |
| Total | 740 | 100.0% |
Ancestry in Great Cacapon
The most populous ancestries reported in Great Cacapon are Irish (135 | 18.2%), American (116 | 15.7%), English (54 | 7.3%), Puerto Rican (33 | 4.5%), and Welsh (13 | 1.8%), together accounting for 47.4% of all Great Cacapon residents.
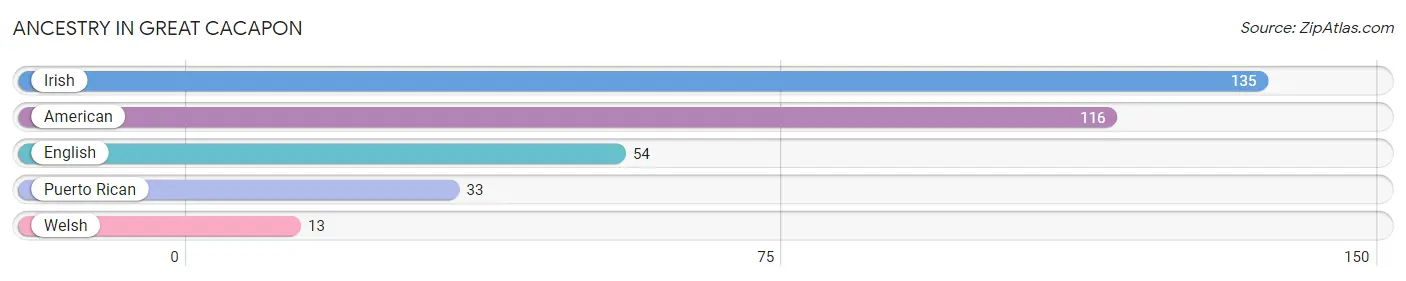
| Ancestry | # Population | % Population |
| American | 116 | 15.7% |
| English | 54 | 7.3% |
| Irish | 135 | 18.2% |
| Puerto Rican | 33 | 4.5% |
| Welsh | 13 | 1.8% | View All 5 Rows |
Immigrants in Great Cacapon

| Immigration Origin | # Population | % Population | View All 0 Rows |
Sex and Age in Great Cacapon
Sex and Age in Great Cacapon
The most populous age groups in Great Cacapon are 15 to 19 Years (88 | 18.7%) for men and 35 to 39 Years (65 | 24.1%) for women.
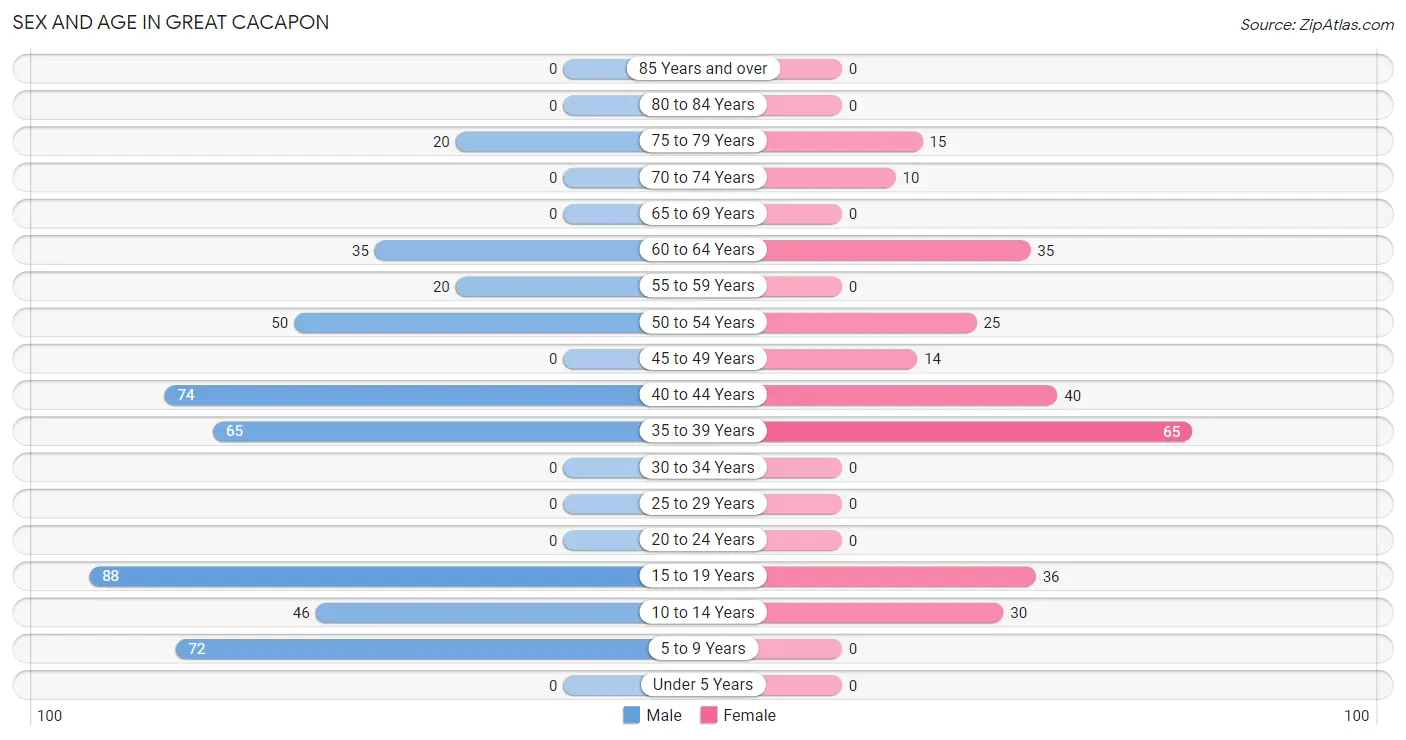
| Age Bracket | Male | Female |
| Under 5 Years | 0 (0.0%) | 0 (0.0%) |
| 5 to 9 Years | 72 (15.3%) | 0 (0.0%) |
| 10 to 14 Years | 46 (9.8%) | 30 (11.1%) |
| 15 to 19 Years | 88 (18.7%) | 36 (13.3%) |
| 20 to 24 Years | 0 (0.0%) | 0 (0.0%) |
| 25 to 29 Years | 0 (0.0%) | 0 (0.0%) |
| 30 to 34 Years | 0 (0.0%) | 0 (0.0%) |
| 35 to 39 Years | 65 (13.8%) | 65 (24.1%) |
| 40 to 44 Years | 74 (15.7%) | 40 (14.8%) |
| 45 to 49 Years | 0 (0.0%) | 14 (5.2%) |
| 50 to 54 Years | 50 (10.6%) | 25 (9.3%) |
| 55 to 59 Years | 20 (4.3%) | 0 (0.0%) |
| 60 to 64 Years | 35 (7.4%) | 35 (13.0%) |
| 65 to 69 Years | 0 (0.0%) | 0 (0.0%) |
| 70 to 74 Years | 0 (0.0%) | 10 (3.7%) |
| 75 to 79 Years | 20 (4.3%) | 15 (5.6%) |
| 80 to 84 Years | 0 (0.0%) | 0 (0.0%) |
| 85 Years and over | 0 (0.0%) | 0 (0.0%) |
| Total | 470 (100.0%) | 270 (100.0%) |
Families and Households in Great Cacapon
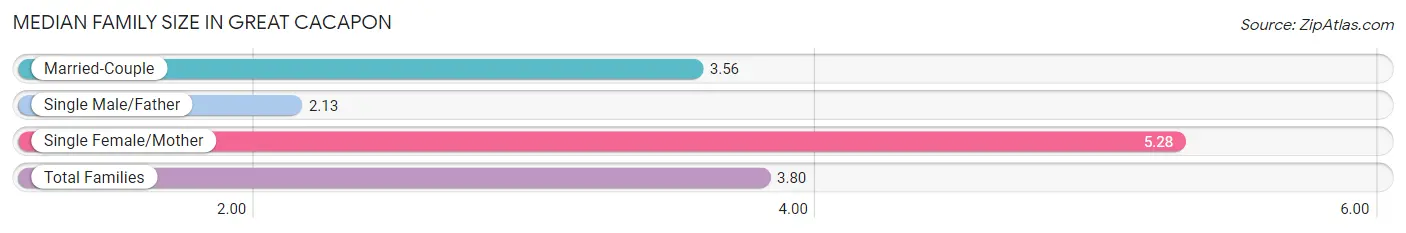
Median Family Size in Great Cacapon
The median family size in Great Cacapon is 3.80 persons per family, with single female/mother families (39 | 20.7%) accounting for the largest median family size of 5.28 persons per family. On the other hand, single male/father families (15 | 8.0%) represent the smallest median family size with 2.13 persons per family.
| Family Type | # Families | Family Size |
| Married-Couple | 134 (71.3%) | 3.56 |
| Single Male/Father | 15 (8.0%) | 2.13 |
| Single Female/Mother | 39 (20.7%) | 5.28 |
| Total Families | 188 (100.0%) | 3.80 |
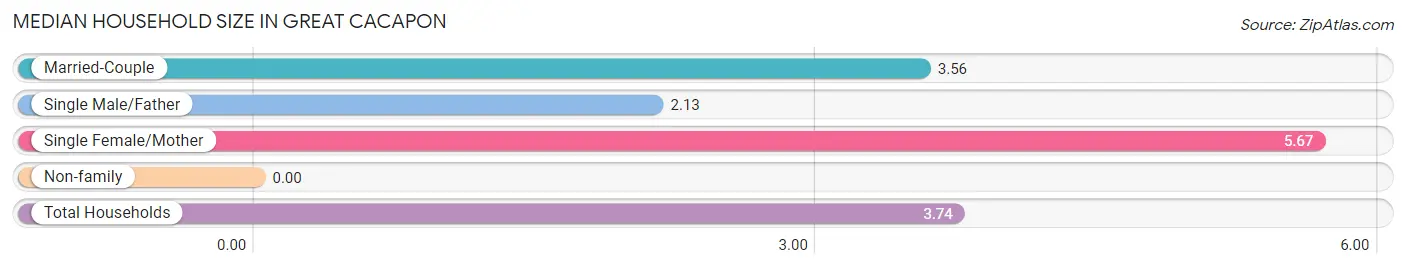
Median Household Size in Great Cacapon
| Household Type | # Households | Household Size |
| Married-Couple | 134 (67.7%) | 3.56 |
| Single Male/Father | 15 (7.6%) | 2.13 |
| Single Female/Mother | 39 (19.7%) | 5.67 |
| Non-family | 10 (5.1%) | - |
| Total Households | 198 (100.0%) | 3.74 |
Household Size by Marriage Status in Great Cacapon
Out of a total of 198 households in Great Cacapon, 188 (95.0%) are family households, while 10 (5.1%) are nonfamily households. The most numerous type of family households are 2-person households, comprising 55, and the most common type of nonfamily households are 1-person households, comprising 10.
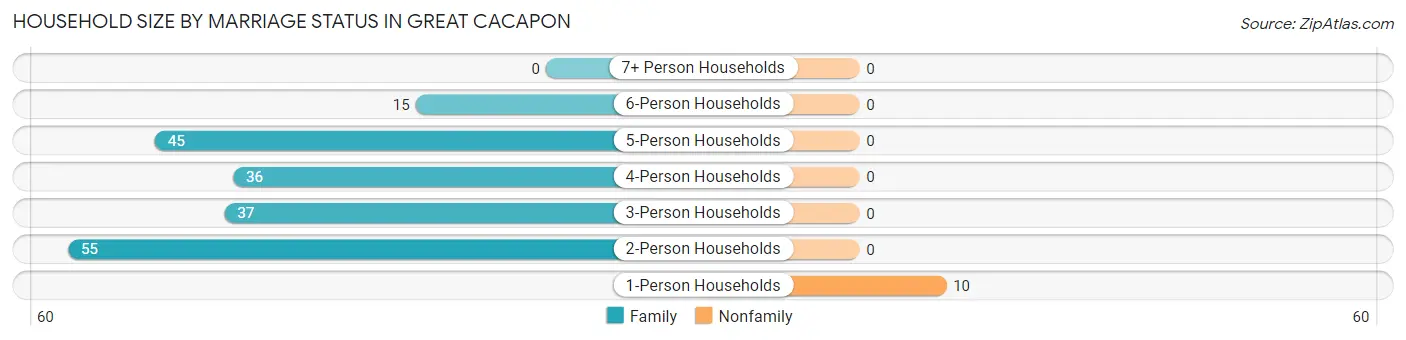
| Household Size | Family Households | Nonfamily Households |
| 1-Person Households | - | 10 (5.1%) |
| 2-Person Households | 55 (27.8%) | 0 (0.0%) |
| 3-Person Households | 37 (18.7%) | 0 (0.0%) |
| 4-Person Households | 36 (18.2%) | 0 (0.0%) |
| 5-Person Households | 45 (22.7%) | 0 (0.0%) |
| 6-Person Households | 15 (7.6%) | 0 (0.0%) |
| 7+ Person Households | 0 (0.0%) | 0 (0.0%) |
| Total | 188 (95.0%) | 10 (5.1%) |
Female Fertility in Great Cacapon
Fertility by Age in Great Cacapon
| Age Bracket | Women with Births | Births / 1,000 Women |
| 15 to 19 years | 0 (0.0%) | 0.0 |
| 20 to 34 years | 0 (0.0%) | 0.0 |
| 35 to 50 years | 0 (0.0%) | 0.0 |
| Total | 0 (0.0%) | 0.0 |
Fertility by Age by Marriage Status in Great Cacapon
| Age Bracket | Married | Unmarried |
| 15 to 19 years | 0 (0.0%) | 0 (0.0%) |
| 20 to 34 years | 0 (0.0%) | 0 (0.0%) |
| 35 to 50 years | 0 (0.0%) | 0 (0.0%) |
| Total | 0 (0.0%) | 0 (0.0%) |
Fertility by Education in Great Cacapon
| Educational Attainment | Women with Births | Births / 1,000 Women |
| Less than High School | 0 (0.0%) | 0.0 |
| High School Diploma | 0 (0.0%) | 0.0 |
| College or Associate's Degree | 0 (0.0%) | 0.0 |
| Bachelor's Degree | 0 (0.0%) | 0.0 |
| Graduate Degree | 0 (0.0%) | 0.0 |
| Total | 0 (0.0%) | 0.0 |
Fertility by Education by Marriage Status in Great Cacapon
| Educational Attainment | Married | Unmarried |
| Less than High School | 0 (0.0%) | 0 (0.0%) |
| High School Diploma | 0 (0.0%) | 0 (0.0%) |
| College or Associate's Degree | 0 (0.0%) | 0 (0.0%) |
| Bachelor's Degree | 0 (0.0%) | 0 (0.0%) |
| Graduate Degree | 0 (0.0%) | 0 (0.0%) |
| Total | 0 (0.0%) | 0 (0.0%) |
Employment Characteristics in Great Cacapon
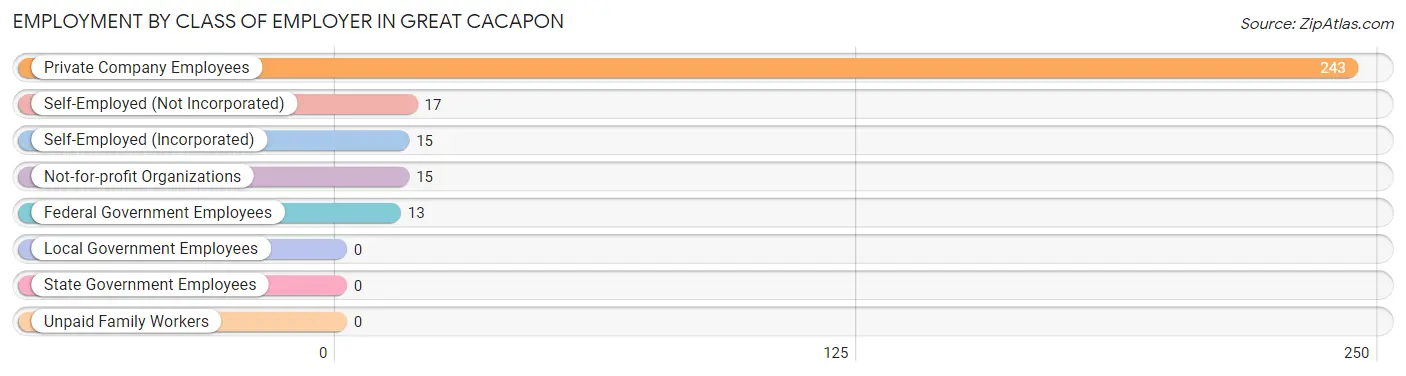
Employment by Class of Employer in Great Cacapon
Among the 303 employed individuals in Great Cacapon, private company employees (243 | 80.2%), self-employed (not incorporated) (17 | 5.6%), and self-employed (incorporated) (15 | 5.0%) make up the most common classes of employment.
| Employer Class | # Employees | % Employees |
| Private Company Employees | 243 | 80.2% |
| Self-Employed (Incorporated) | 15 | 5.0% |
| Self-Employed (Not Incorporated) | 17 | 5.6% |
| Not-for-profit Organizations | 15 | 5.0% |
| Local Government Employees | 0 | 0.0% |
| State Government Employees | 0 | 0.0% |
| Federal Government Employees | 13 | 4.3% |
| Unpaid Family Workers | 0 | 0.0% |
| Total | 303 | 100.0% |
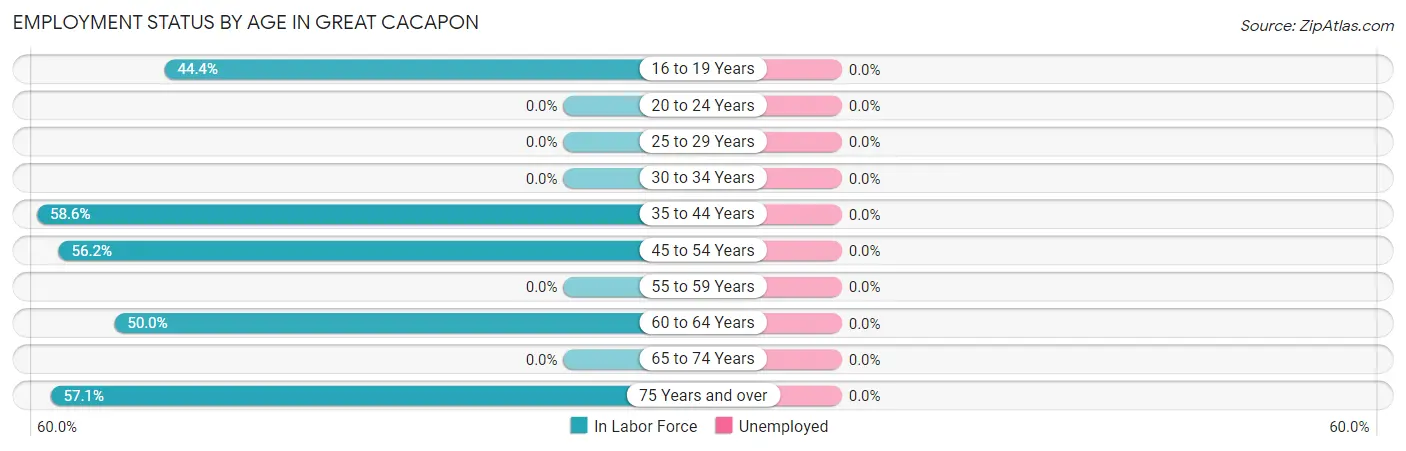
Employment Status by Age in Great Cacapon
| Age Bracket | In Labor Force | Unemployed |
| 16 to 19 Years | 55 (44.4%) | 0 (0.0%) |
| 20 to 24 Years | 0 (0.0%) | 0 (0.0%) |
| 25 to 29 Years | 0 (0.0%) | 0 (0.0%) |
| 30 to 34 Years | 0 (0.0%) | 0 (0.0%) |
| 35 to 44 Years | 143 (58.6%) | 0 (0.0%) |
| 45 to 54 Years | 50 (56.2%) | 0 (0.0%) |
| 55 to 59 Years | 0 (0.0%) | 0 (0.0%) |
| 60 to 64 Years | 35 (50.0%) | 0 (0.0%) |
| 65 to 74 Years | 0 (0.0%) | 0 (0.0%) |
| 75 Years and over | 20 (57.1%) | 0 (0.0%) |
| Total | 303 (51.2%) | 0 (0.0%) |
Employment Status by Educational Attainment in Great Cacapon

| Educational Attainment | In Labor Force | Unemployed |
| Less than High School | 76 (42.5%) | 0 (0.0%) |
| High School Diploma | 124 (65.6%) | 0 (0.0%) |
| College / Associate Degree | 28 (68.3%) | 0 (0.0%) |
| Bachelor's Degree or higher | 0 (0.0%) | 0 (0.0%) |
| Total | 228 (53.9%) | 0 (0.0%) |
Employment Occupations by Sex in Great Cacapon
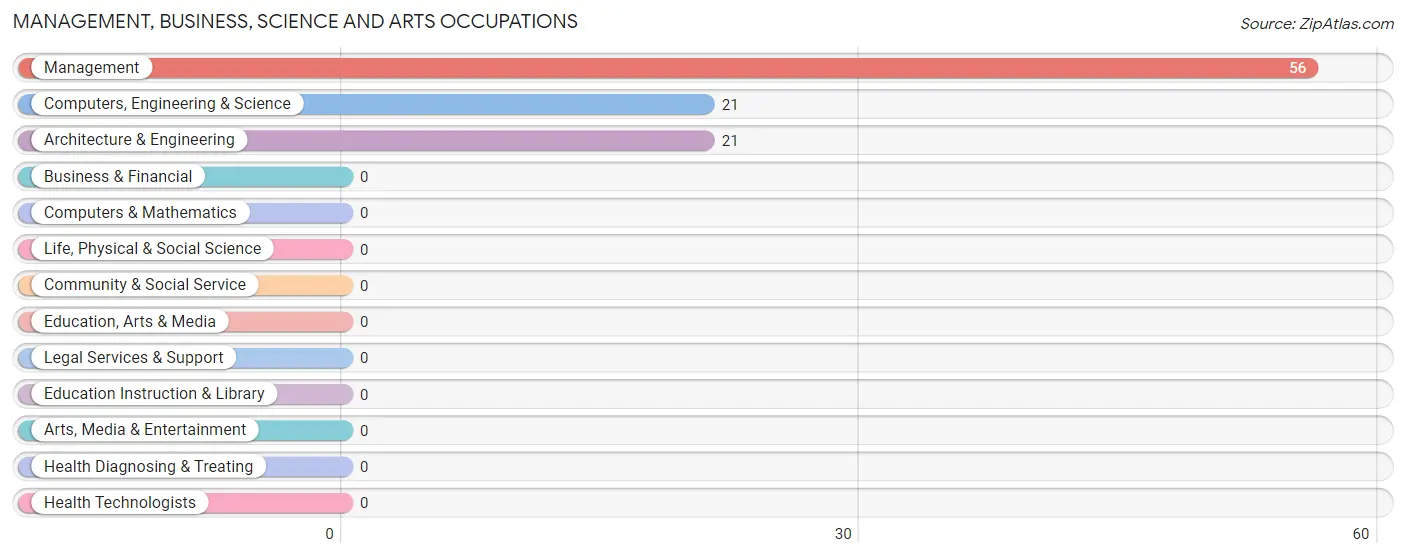
Management, Business, Science and Arts Occupations
The most common Management, Business, Science and Arts occupations in Great Cacapon are Management (56 | 18.5%), Computers, Engineering & Science (21 | 6.9%), and Architecture & Engineering (21 | 6.9%).
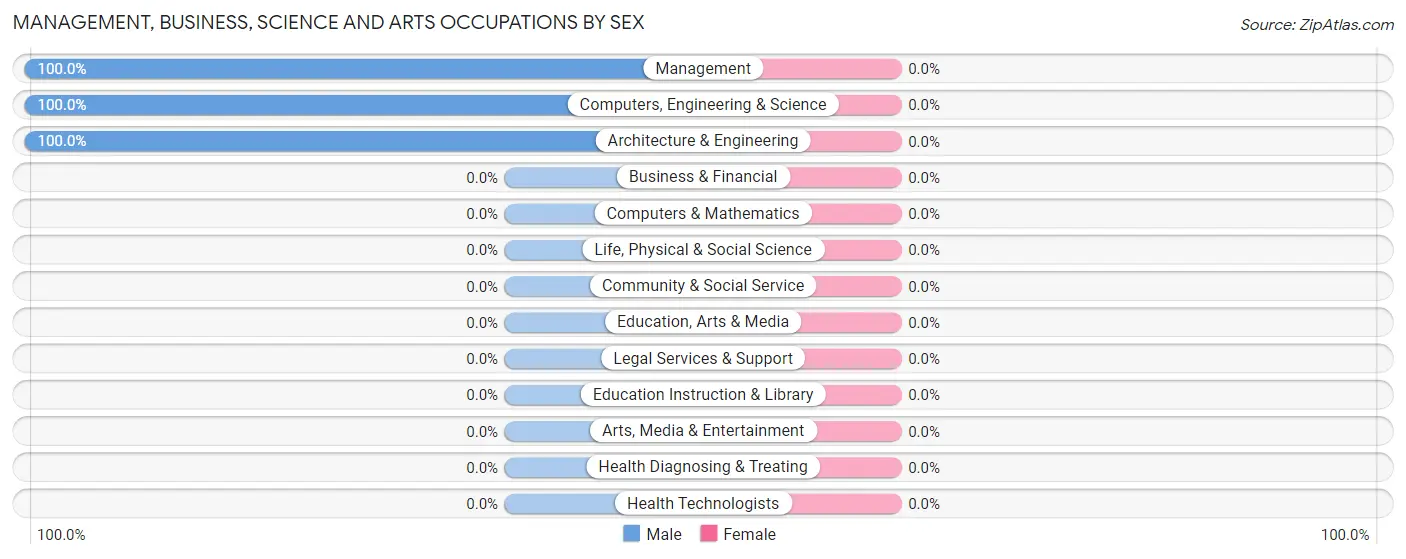
Management, Business, Science and Arts Occupations by Sex
| Occupation | Male | Female |
| Management | 56 (100.0%) | 0 (0.0%) |
| Business & Financial | 0 (0.0%) | 0 (0.0%) |
| Computers, Engineering & Science | 21 (100.0%) | 0 (0.0%) |
| Computers & Mathematics | 0 (0.0%) | 0 (0.0%) |
| Architecture & Engineering | 21 (100.0%) | 0 (0.0%) |
| Life, Physical & Social Science | 0 (0.0%) | 0 (0.0%) |
| Community & Social Service | 0 (0.0%) | 0 (0.0%) |
| Education, Arts & Media | 0 (0.0%) | 0 (0.0%) |
| Legal Services & Support | 0 (0.0%) | 0 (0.0%) |
| Education Instruction & Library | 0 (0.0%) | 0 (0.0%) |
| Arts, Media & Entertainment | 0 (0.0%) | 0 (0.0%) |
| Health Diagnosing & Treating | 0 (0.0%) | 0 (0.0%) |
| Health Technologists | 0 (0.0%) | 0 (0.0%) |
| Total (Category) | 77 (100.0%) | 0 (0.0%) |
| Total (Overall) | 272 (89.8%) | 31 (10.2%) |
Services Occupations
The most common Services occupations in Great Cacapon are , and Cleaning & Maintenance (17 | 5.6%).
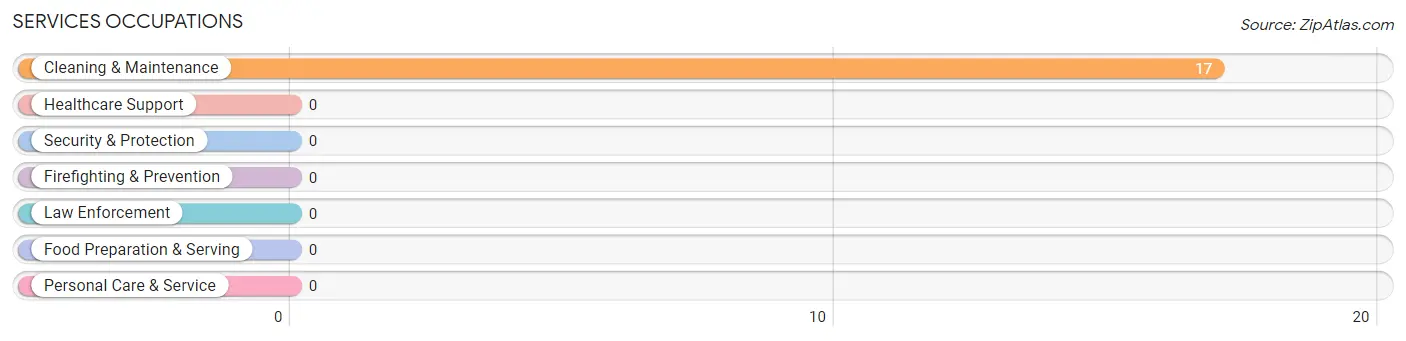
Services Occupations by Sex
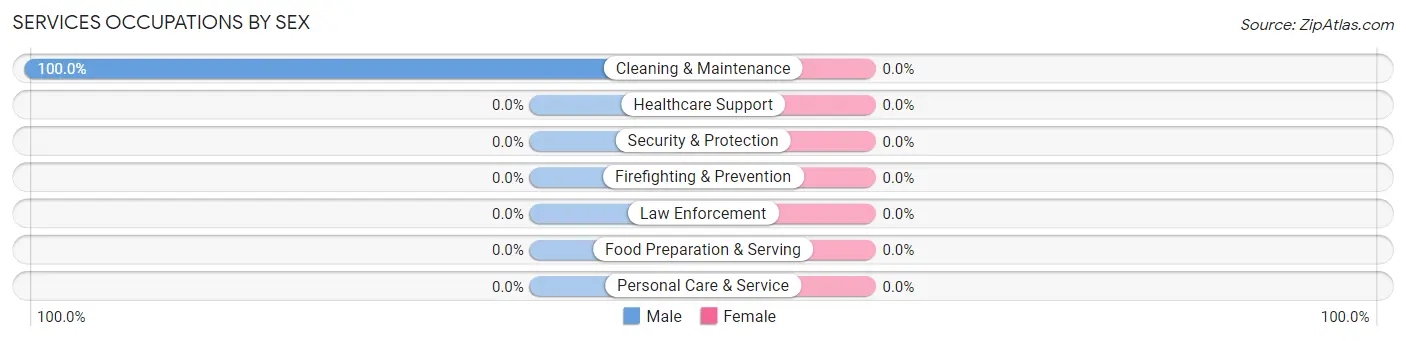
| Occupation | Male | Female |
| Healthcare Support | 0 (0.0%) | 0 (0.0%) |
| Security & Protection | 0 (0.0%) | 0 (0.0%) |
| Firefighting & Prevention | 0 (0.0%) | 0 (0.0%) |
| Law Enforcement | 0 (0.0%) | 0 (0.0%) |
| Food Preparation & Serving | 0 (0.0%) | 0 (0.0%) |
| Cleaning & Maintenance | 17 (100.0%) | 0 (0.0%) |
| Personal Care & Service | 0 (0.0%) | 0 (0.0%) |
| Total (Category) | 17 (100.0%) | 0 (0.0%) |
| Total (Overall) | 272 (89.8%) | 31 (10.2%) |
Sales and Office Occupations
The most common Sales and Office occupations in Great Cacapon are , and Sales & Related (62 | 20.5%).
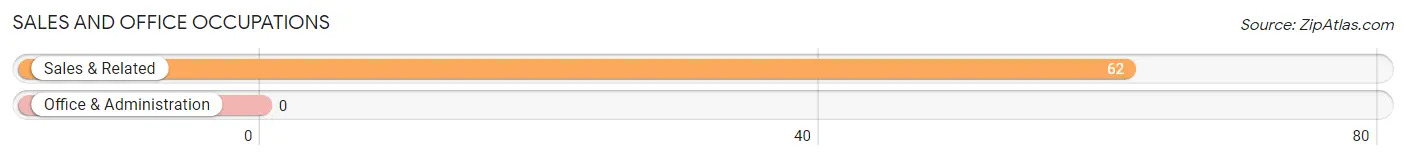
Sales and Office Occupations by Sex
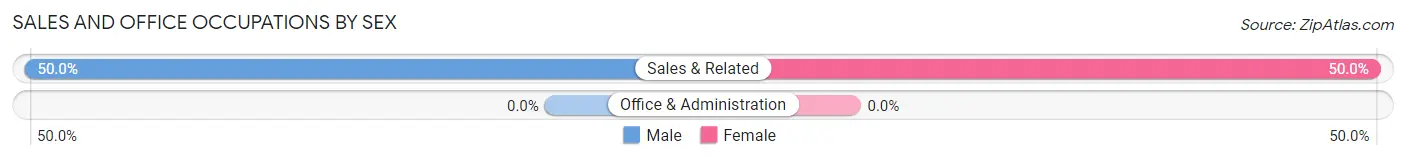
| Occupation | Male | Female |
| Sales & Related | 31 (50.0%) | 31 (50.0%) |
| Office & Administration | 0 (0.0%) | 0 (0.0%) |
| Total (Category) | 31 (50.0%) | 31 (50.0%) |
| Total (Overall) | 272 (89.8%) | 31 (10.2%) |
Natural Resources, Construction and Maintenance Occupations
The most common Natural Resources, Construction and Maintenance occupations in Great Cacapon are Construction & Extraction (83 | 27.4%), and Farming, Fishing & Forestry (27 | 8.9%).
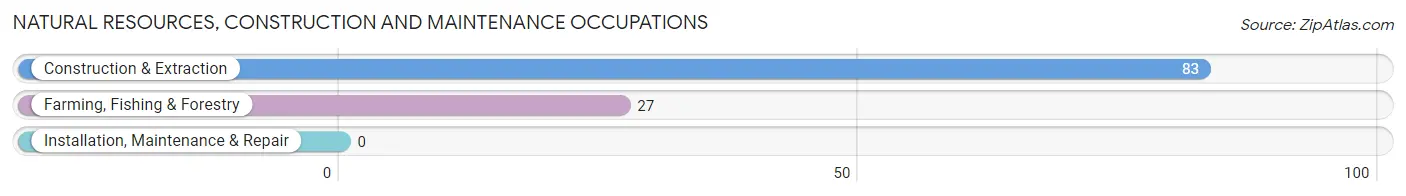
Natural Resources, Construction and Maintenance Occupations by Sex
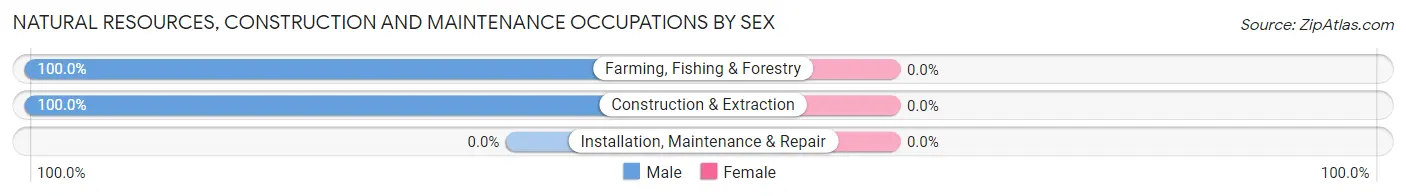
| Occupation | Male | Female |
| Farming, Fishing & Forestry | 27 (100.0%) | 0 (0.0%) |
| Construction & Extraction | 83 (100.0%) | 0 (0.0%) |
| Installation, Maintenance & Repair | 0 (0.0%) | 0 (0.0%) |
| Total (Category) | 110 (100.0%) | 0 (0.0%) |
| Total (Overall) | 272 (89.8%) | 31 (10.2%) |
Production, Transportation and Moving Occupations
The most common Production, Transportation and Moving occupations in Great Cacapon are , and Production (37 | 12.2%).
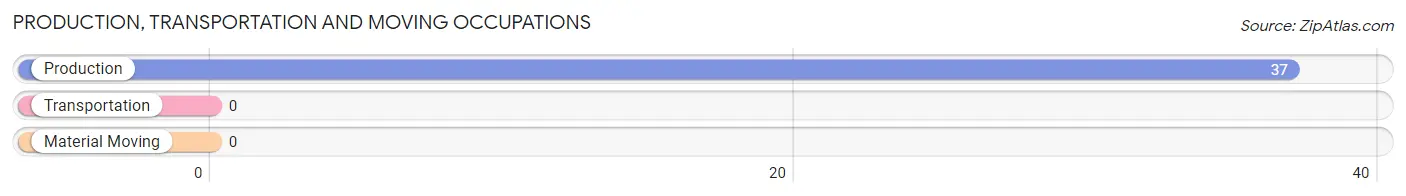
Production, Transportation and Moving Occupations by Sex
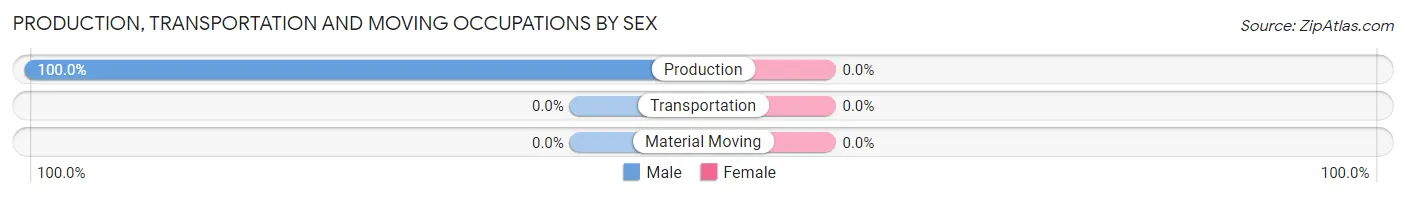
| Occupation | Male | Female |
| Production | 37 (100.0%) | 0 (0.0%) |
| Transportation | 0 (0.0%) | 0 (0.0%) |
| Material Moving | 0 (0.0%) | 0 (0.0%) |
| Total (Category) | 37 (100.0%) | 0 (0.0%) |
| Total (Overall) | 272 (89.8%) | 31 (10.2%) |
Employment Industries by Sex in Great Cacapon
Employment Industries in Great Cacapon
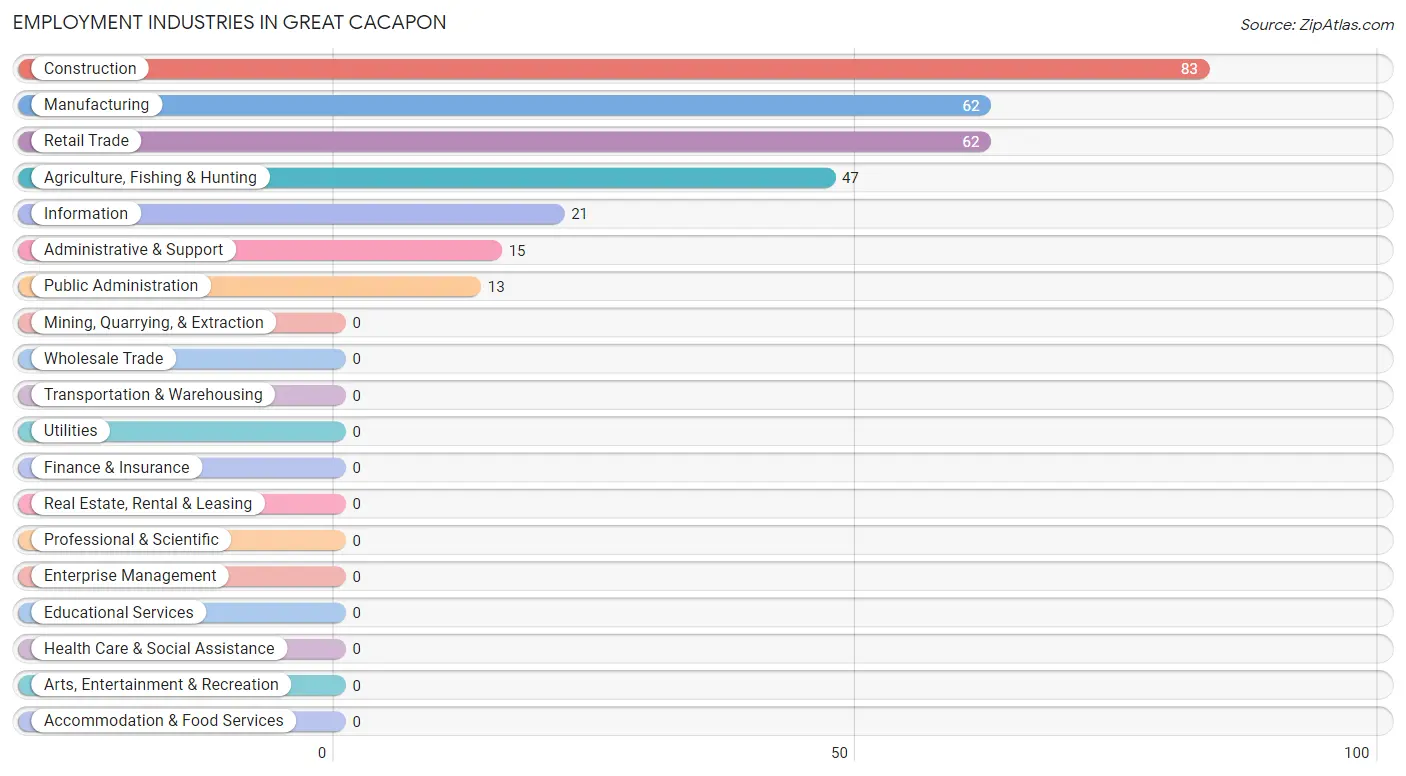
The major employment industries in Great Cacapon include Construction (83 | 27.4%), Manufacturing (62 | 20.5%), Retail Trade (62 | 20.5%), Agriculture, Fishing & Hunting (47 | 15.5%), and Information (21 | 6.9%).
Employment Industries by Sex in Great Cacapon
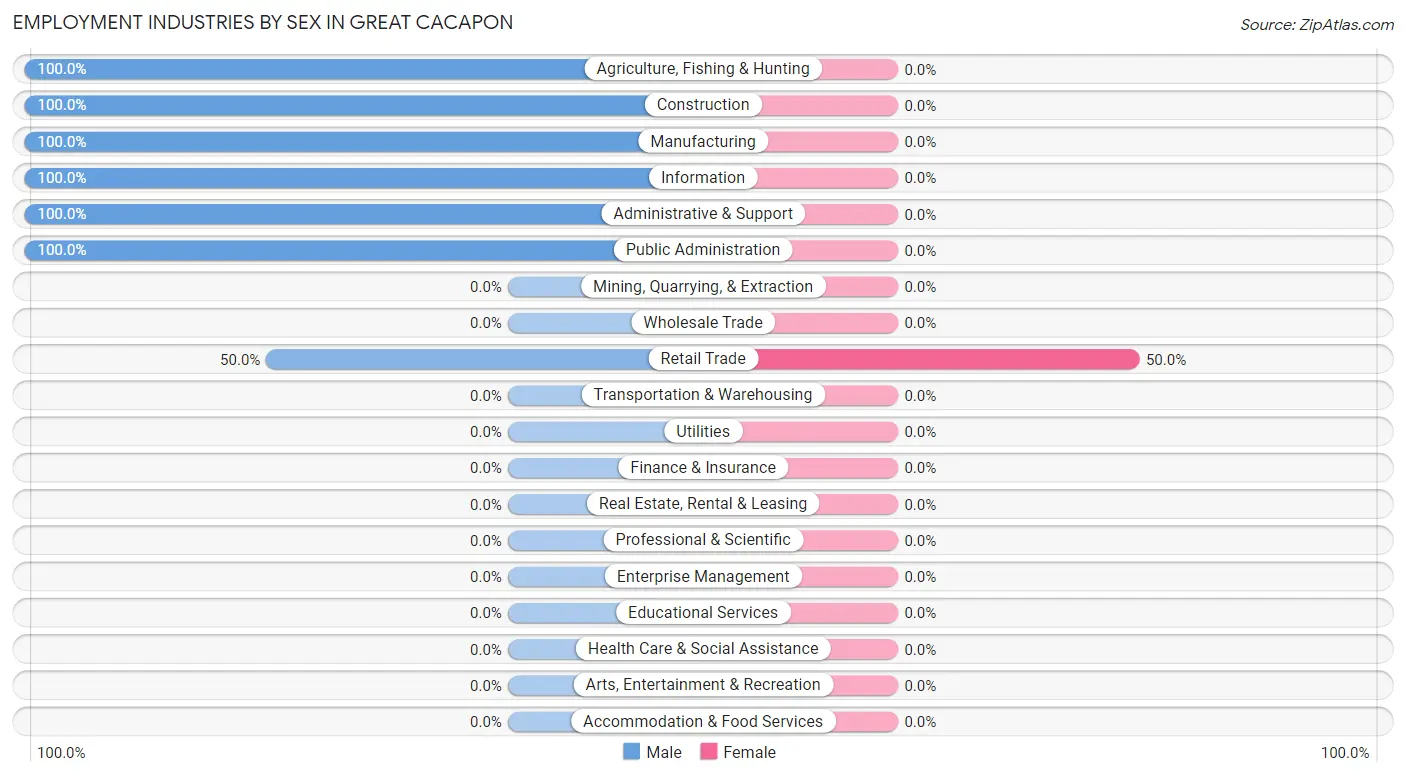
| Industry | Male | Female |
| Agriculture, Fishing & Hunting | 47 (100.0%) | 0 (0.0%) |
| Mining, Quarrying, & Extraction | 0 (0.0%) | 0 (0.0%) |
| Construction | 83 (100.0%) | 0 (0.0%) |
| Manufacturing | 62 (100.0%) | 0 (0.0%) |
| Wholesale Trade | 0 (0.0%) | 0 (0.0%) |
| Retail Trade | 31 (50.0%) | 31 (50.0%) |
| Transportation & Warehousing | 0 (0.0%) | 0 (0.0%) |
| Utilities | 0 (0.0%) | 0 (0.0%) |
| Information | 21 (100.0%) | 0 (0.0%) |
| Finance & Insurance | 0 (0.0%) | 0 (0.0%) |
| Real Estate, Rental & Leasing | 0 (0.0%) | 0 (0.0%) |
| Professional & Scientific | 0 (0.0%) | 0 (0.0%) |
| Enterprise Management | 0 (0.0%) | 0 (0.0%) |
| Administrative & Support | 15 (100.0%) | 0 (0.0%) |
| Educational Services | 0 (0.0%) | 0 (0.0%) |
| Health Care & Social Assistance | 0 (0.0%) | 0 (0.0%) |
| Arts, Entertainment & Recreation | 0 (0.0%) | 0 (0.0%) |
| Accommodation & Food Services | 0 (0.0%) | 0 (0.0%) |
| Public Administration | 13 (100.0%) | 0 (0.0%) |
| Total | 272 (89.8%) | 31 (10.2%) |
Education in Great Cacapon
School Enrollment in Great Cacapon
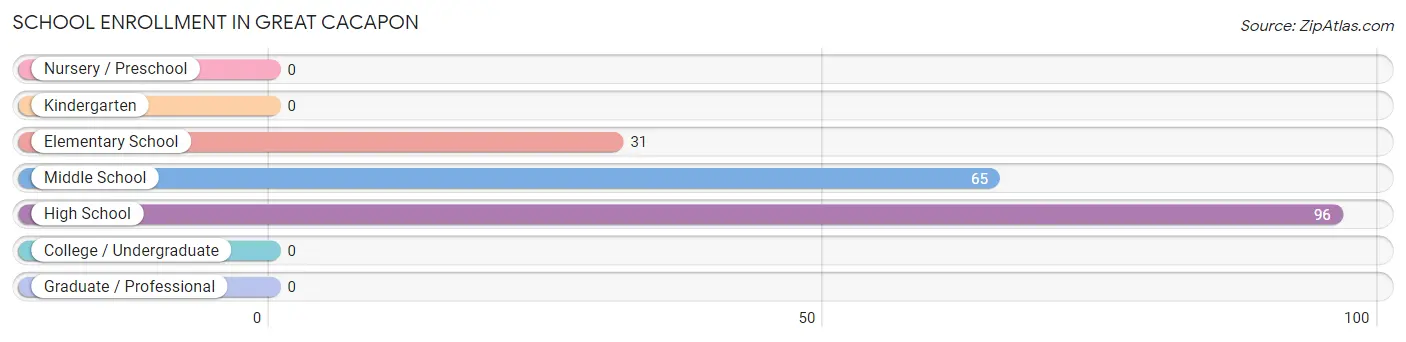
The most common levels of schooling among the 192 students in Great Cacapon are high school (96 | 50.0%), middle school (65 | 33.9%), and elementary school (31 | 16.2%).
| School Level | # Students | % Students |
| Nursery / Preschool | 0 | 0.0% |
| Kindergarten | 0 | 0.0% |
| Elementary School | 31 | 16.2% |
| Middle School | 65 | 33.9% |
| High School | 96 | 50.0% |
| College / Undergraduate | 0 | 0.0% |
| Graduate / Professional | 0 | 0.0% |
| Total | 192 | 100.0% |
School Enrollment by Age by Funding Source in Great Cacapon
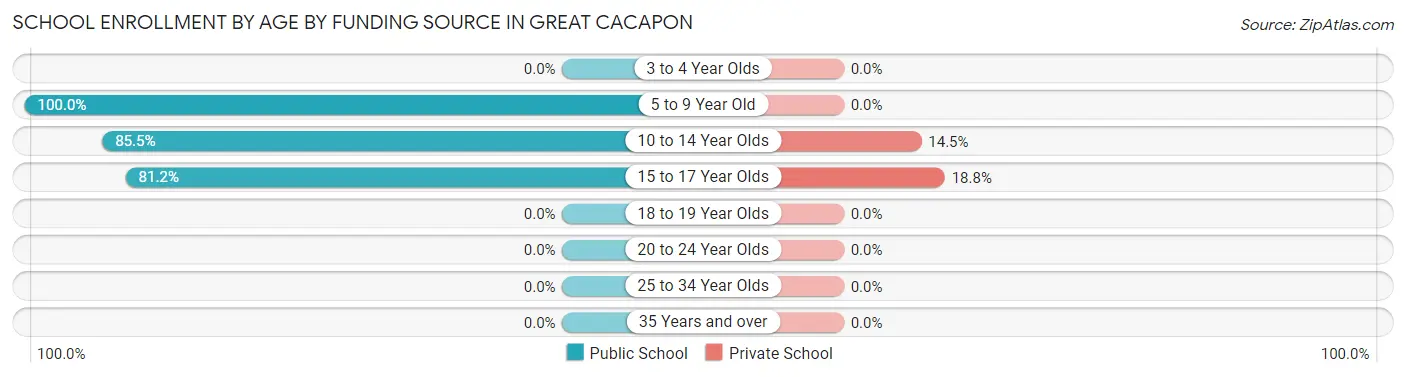
Out of a total of 192 students who are enrolled in schools in Great Cacapon, 27 (14.1%) attend a private institution, while the remaining 165 (85.9%) are enrolled in public schools. The age group of 15 to 17 year olds has the highest likelihood of being enrolled in private schools, with 16 (18.8% in the age bracket) enrolled. Conversely, the age group of 5 to 9 year old has the lowest likelihood of being enrolled in a private school, with 31 (100.0% in the age bracket) attending a public institution.
| Age Bracket | Public School | Private School |
| 3 to 4 Year Olds | 0 (0.0%) | 0 (0.0%) |
| 5 to 9 Year Old | 31 (100.0%) | 0 (0.0%) |
| 10 to 14 Year Olds | 65 (85.5%) | 11 (14.5%) |
| 15 to 17 Year Olds | 69 (81.2%) | 16 (18.8%) |
| 18 to 19 Year Olds | 0 (0.0%) | 0 (0.0%) |
| 20 to 24 Year Olds | 0 (0.0%) | 0 (0.0%) |
| 25 to 34 Year Olds | 0 (0.0%) | 0 (0.0%) |
| 35 Years and over | 0 (0.0%) | 0 (0.0%) |
| Total | 165 (85.9%) | 27 (14.1%) |
Educational Attainment by Field of Study in Great Cacapon
, and psychology (14 | 100.0%) are the most common fields of study among 14 individuals in Great Cacapon who have obtained a bachelor's degree or higher.
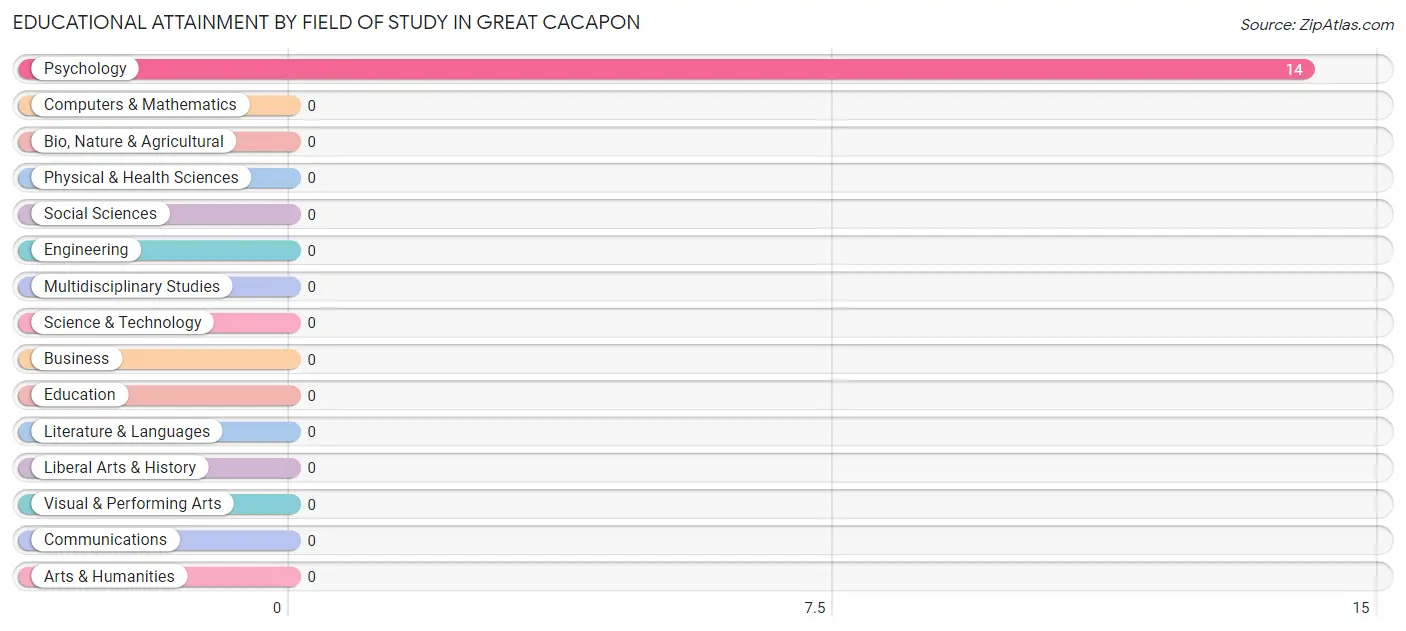
| Field of Study | # Graduates | % Graduates |
| Computers & Mathematics | 0 | 0.0% |
| Bio, Nature & Agricultural | 0 | 0.0% |
| Physical & Health Sciences | 0 | 0.0% |
| Psychology | 14 | 100.0% |
| Social Sciences | 0 | 0.0% |
| Engineering | 0 | 0.0% |
| Multidisciplinary Studies | 0 | 0.0% |
| Science & Technology | 0 | 0.0% |
| Business | 0 | 0.0% |
| Education | 0 | 0.0% |
| Literature & Languages | 0 | 0.0% |
| Liberal Arts & History | 0 | 0.0% |
| Visual & Performing Arts | 0 | 0.0% |
| Communications | 0 | 0.0% |
| Arts & Humanities | 0 | 0.0% |
| Total | 14 | 100.0% |
Transportation & Commute in Great Cacapon
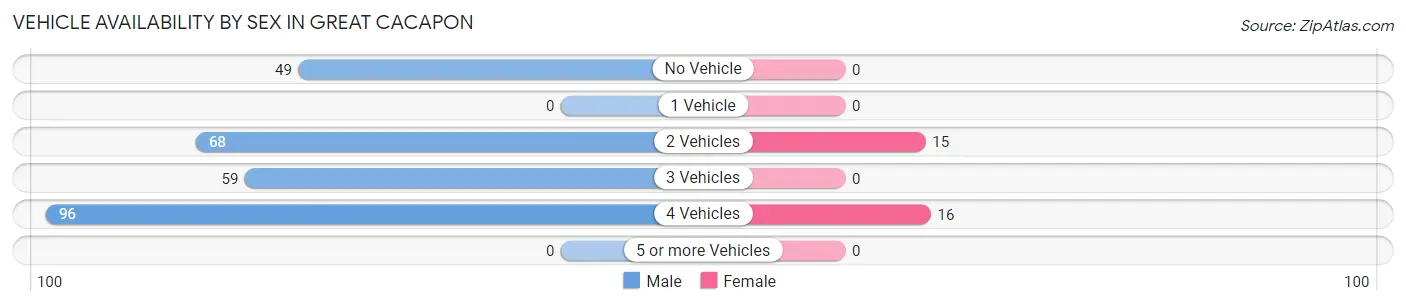
Vehicle Availability by Sex in Great Cacapon
The most prevalent vehicle ownership categories in Great Cacapon are males with 4 vehicles (96, accounting for 35.3%) and females with 4 vehicles (16, making up 309.7%).
| Vehicles Available | Male | Female |
| No Vehicle | 49 (18.0%) | 0 (0.0%) |
| 1 Vehicle | 0 (0.0%) | 0 (0.0%) |
| 2 Vehicles | 68 (25.0%) | 15 (48.4%) |
| 3 Vehicles | 59 (21.7%) | 0 (0.0%) |
| 4 Vehicles | 96 (35.3%) | 16 (51.6%) |
| 5 or more Vehicles | 0 (0.0%) | 0 (0.0%) |
| Total | 272 (100.0%) | 31 (100.0%) |
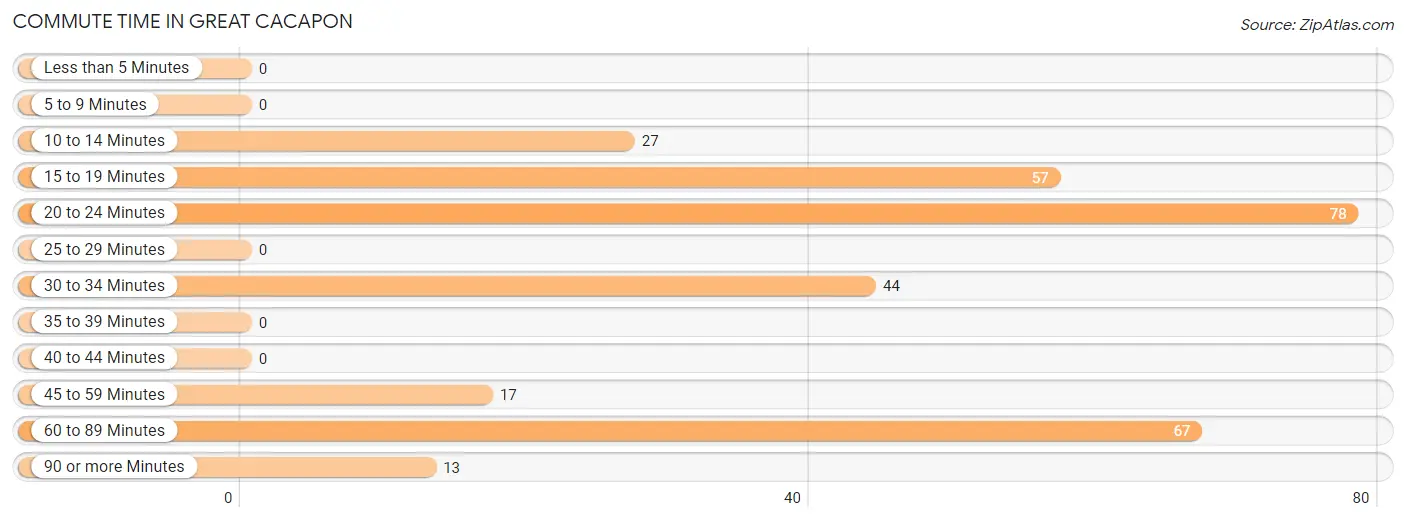
Commute Time in Great Cacapon
The most frequently occuring commute durations in Great Cacapon are 20 to 24 minutes (78 commuters, 25.7%), 60 to 89 minutes (67 commuters, 22.1%), and 15 to 19 minutes (57 commuters, 18.8%).
| Commute Time | # Commuters | % Commuters |
| Less than 5 Minutes | 0 | 0.0% |
| 5 to 9 Minutes | 0 | 0.0% |
| 10 to 14 Minutes | 27 | 8.9% |
| 15 to 19 Minutes | 57 | 18.8% |
| 20 to 24 Minutes | 78 | 25.7% |
| 25 to 29 Minutes | 0 | 0.0% |
| 30 to 34 Minutes | 44 | 14.5% |
| 35 to 39 Minutes | 0 | 0.0% |
| 40 to 44 Minutes | 0 | 0.0% |
| 45 to 59 Minutes | 17 | 5.6% |
| 60 to 89 Minutes | 67 | 22.1% |
| 90 or more Minutes | 13 | 4.3% |
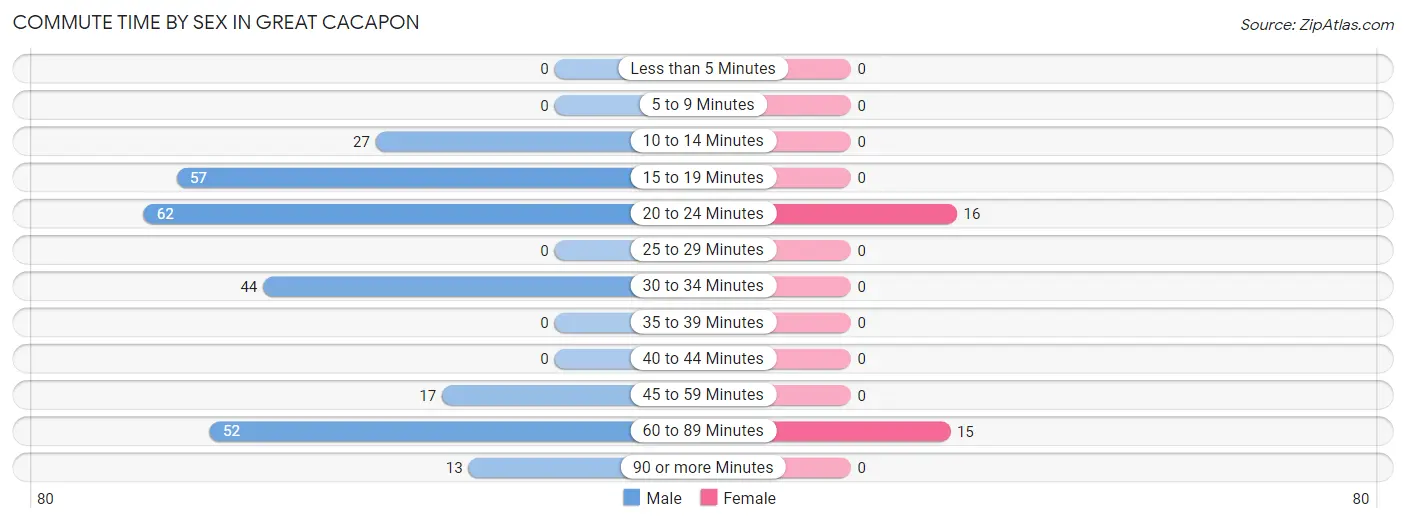
Commute Time by Sex in Great Cacapon
The most common commute times in Great Cacapon are 20 to 24 minutes (62 commuters, 22.8%) for males and 20 to 24 minutes (16 commuters, 51.6%) for females.
| Commute Time | Male | Female |
| Less than 5 Minutes | 0 (0.0%) | 0 (0.0%) |
| 5 to 9 Minutes | 0 (0.0%) | 0 (0.0%) |
| 10 to 14 Minutes | 27 (9.9%) | 0 (0.0%) |
| 15 to 19 Minutes | 57 (21.0%) | 0 (0.0%) |
| 20 to 24 Minutes | 62 (22.8%) | 16 (51.6%) |
| 25 to 29 Minutes | 0 (0.0%) | 0 (0.0%) |
| 30 to 34 Minutes | 44 (16.2%) | 0 (0.0%) |
| 35 to 39 Minutes | 0 (0.0%) | 0 (0.0%) |
| 40 to 44 Minutes | 0 (0.0%) | 0 (0.0%) |
| 45 to 59 Minutes | 17 (6.2%) | 0 (0.0%) |
| 60 to 89 Minutes | 52 (19.1%) | 15 (48.4%) |
| 90 or more Minutes | 13 (4.8%) | 0 (0.0%) |
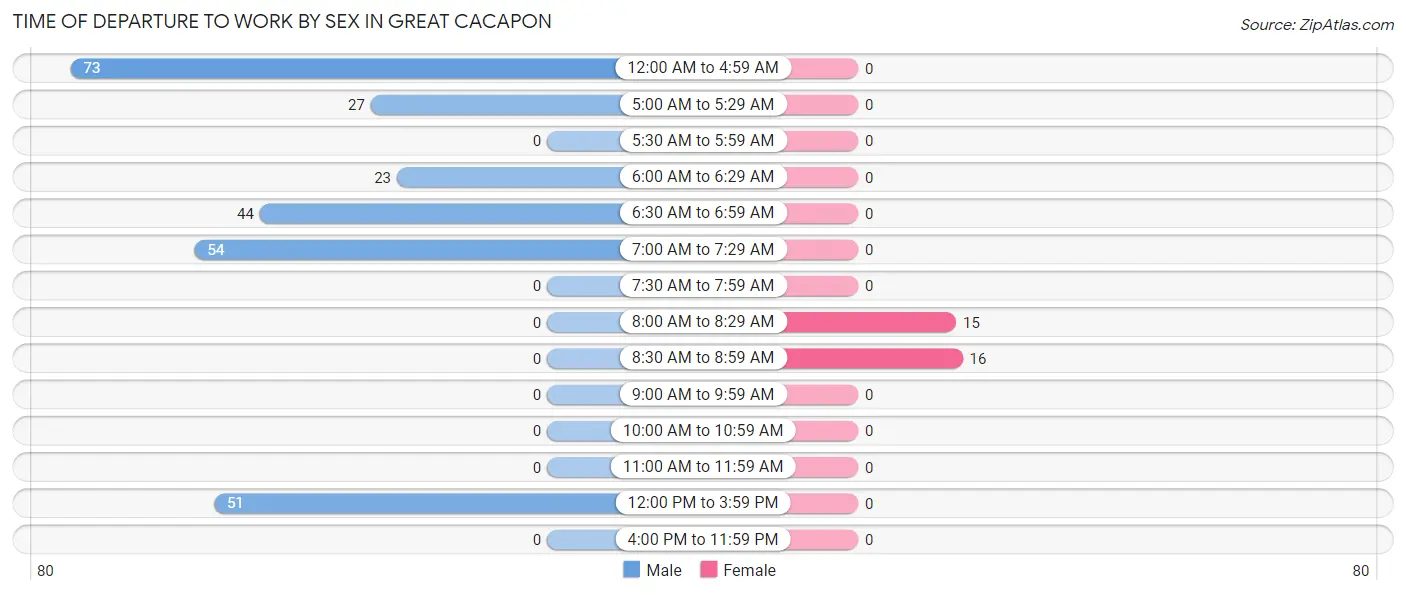
Time of Departure to Work by Sex in Great Cacapon
The most frequent times of departure to work in Great Cacapon are 12:00 AM to 4:59 AM (73, 26.8%) for males and 8:30 AM to 8:59 AM (16, 51.6%) for females.
| Time of Departure | Male | Female |
| 12:00 AM to 4:59 AM | 73 (26.8%) | 0 (0.0%) |
| 5:00 AM to 5:29 AM | 27 (9.9%) | 0 (0.0%) |
| 5:30 AM to 5:59 AM | 0 (0.0%) | 0 (0.0%) |
| 6:00 AM to 6:29 AM | 23 (8.5%) | 0 (0.0%) |
| 6:30 AM to 6:59 AM | 44 (16.2%) | 0 (0.0%) |
| 7:00 AM to 7:29 AM | 54 (19.9%) | 0 (0.0%) |
| 7:30 AM to 7:59 AM | 0 (0.0%) | 0 (0.0%) |
| 8:00 AM to 8:29 AM | 0 (0.0%) | 15 (48.4%) |
| 8:30 AM to 8:59 AM | 0 (0.0%) | 16 (51.6%) |
| 9:00 AM to 9:59 AM | 0 (0.0%) | 0 (0.0%) |
| 10:00 AM to 10:59 AM | 0 (0.0%) | 0 (0.0%) |
| 11:00 AM to 11:59 AM | 0 (0.0%) | 0 (0.0%) |
| 12:00 PM to 3:59 PM | 51 (18.8%) | 0 (0.0%) |
| 4:00 PM to 11:59 PM | 0 (0.0%) | 0 (0.0%) |
| Total | 272 (100.0%) | 31 (100.0%) |
Housing Occupancy in Great Cacapon
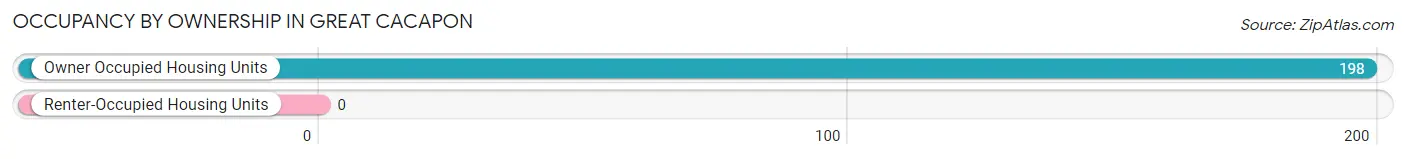
Occupancy by Ownership in Great Cacapon
Of the total 198 dwellings in Great Cacapon, owner-occupied units account for 198 (100.0%), while renter-occupied units make up 0 (0.0%).
| Occupancy | # Housing Units | % Housing Units |
| Owner Occupied Housing Units | 198 | 100.0% |
| Renter-Occupied Housing Units | 0 | 0.0% |
| Total Occupied Housing Units | 198 | 100.0% |
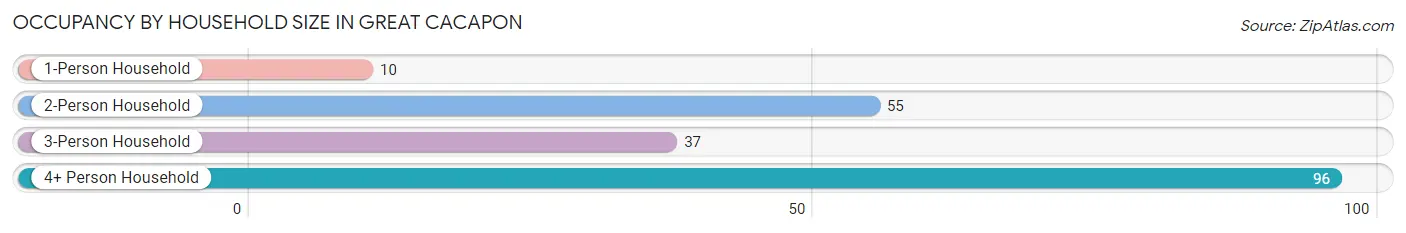
Occupancy by Household Size in Great Cacapon
| Household Size | # Housing Units | % Housing Units |
| 1-Person Household | 10 | 5.1% |
| 2-Person Household | 55 | 27.8% |
| 3-Person Household | 37 | 18.7% |
| 4+ Person Household | 96 | 48.5% |
| Total Housing Units | 198 | 100.0% |
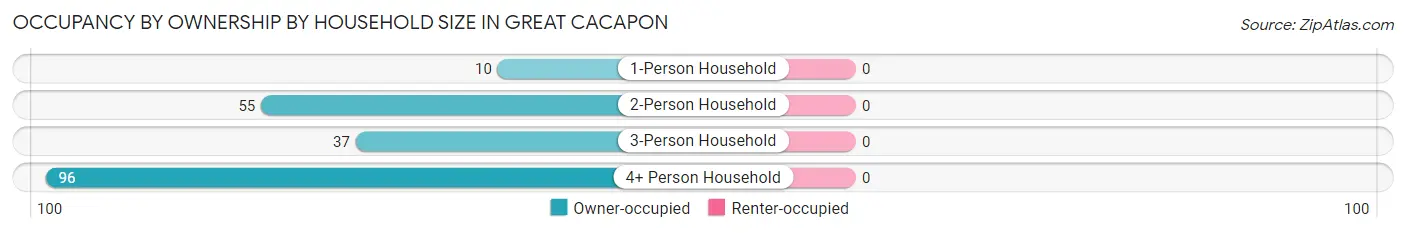
Occupancy by Ownership by Household Size in Great Cacapon
| Household Size | Owner-occupied | Renter-occupied |
| 1-Person Household | 10 (100.0%) | 0 (0.0%) |
| 2-Person Household | 55 (100.0%) | 0 (0.0%) |
| 3-Person Household | 37 (100.0%) | 0 (0.0%) |
| 4+ Person Household | 96 (100.0%) | 0 (0.0%) |
| Total Housing Units | 198 (100.0%) | 0 (0.0%) |
Occupancy by Educational Attainment in Great Cacapon
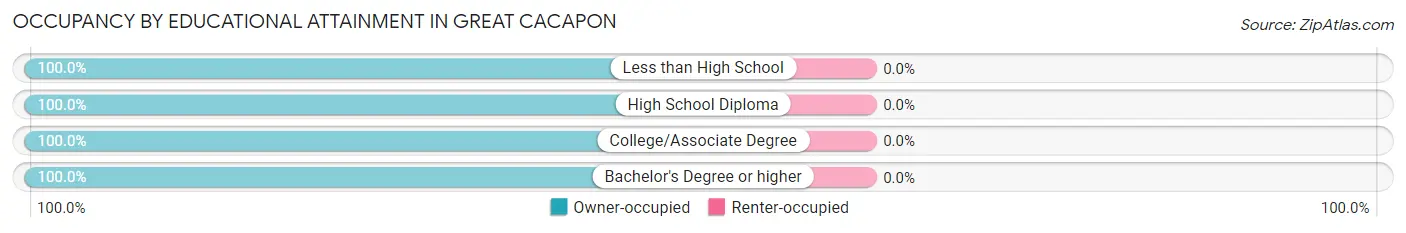
| Household Size | Owner-occupied | Renter-occupied |
| Less than High School | 93 (100.0%) | 0 (0.0%) |
| High School Diploma | 68 (100.0%) | 0 (0.0%) |
| College/Associate Degree | 23 (100.0%) | 0 (0.0%) |
| Bachelor's Degree or higher | 14 (100.0%) | 0 (0.0%) |
Occupancy by Age of Householder in Great Cacapon
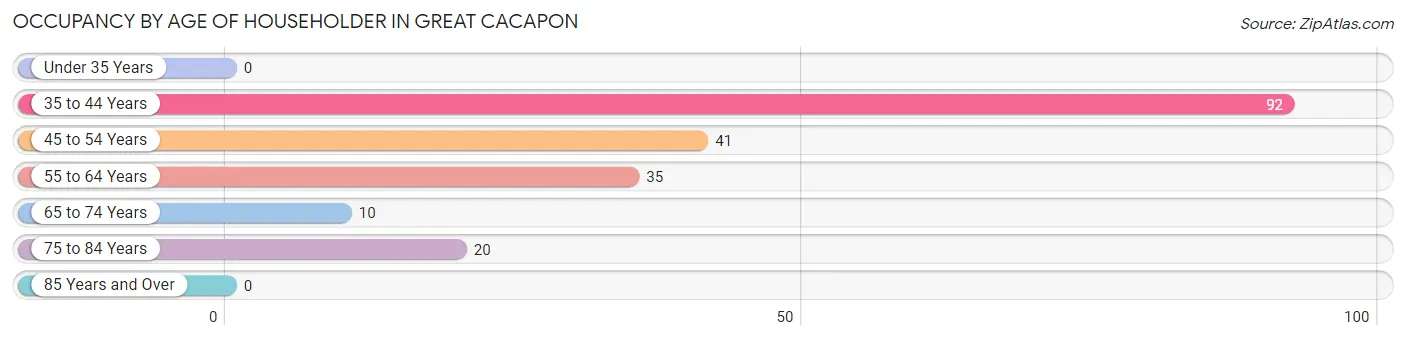
| Age Bracket | # Households | % Households |
| Under 35 Years | 0 | 0.0% |
| 35 to 44 Years | 92 | 46.5% |
| 45 to 54 Years | 41 | 20.7% |
| 55 to 64 Years | 35 | 17.7% |
| 65 to 74 Years | 10 | 5.1% |
| 75 to 84 Years | 20 | 10.1% |
| 85 Years and Over | 0 | 0.0% |
| Total | 198 | 100.0% |
Housing Finances in Great Cacapon
Median Income by Occupancy in Great Cacapon
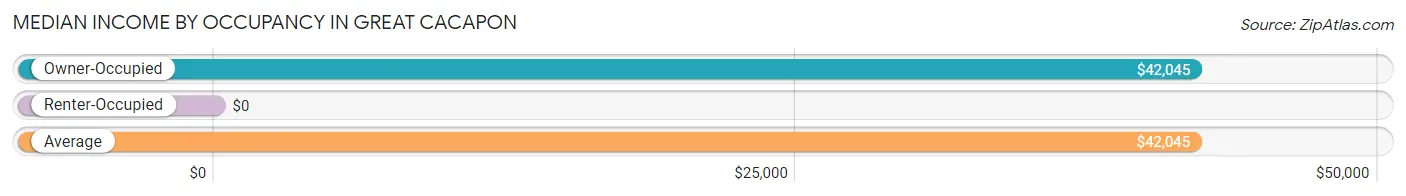
| Occupancy Type | # Households | Median Income |
| Owner-Occupied | 198 (100.0%) | $42,045 |
| Renter-Occupied | 0 (0.0%) | $0 |
| Average | 198 (100.0%) | $42,045 |
Occupancy by Householder Income Bracket in Great Cacapon
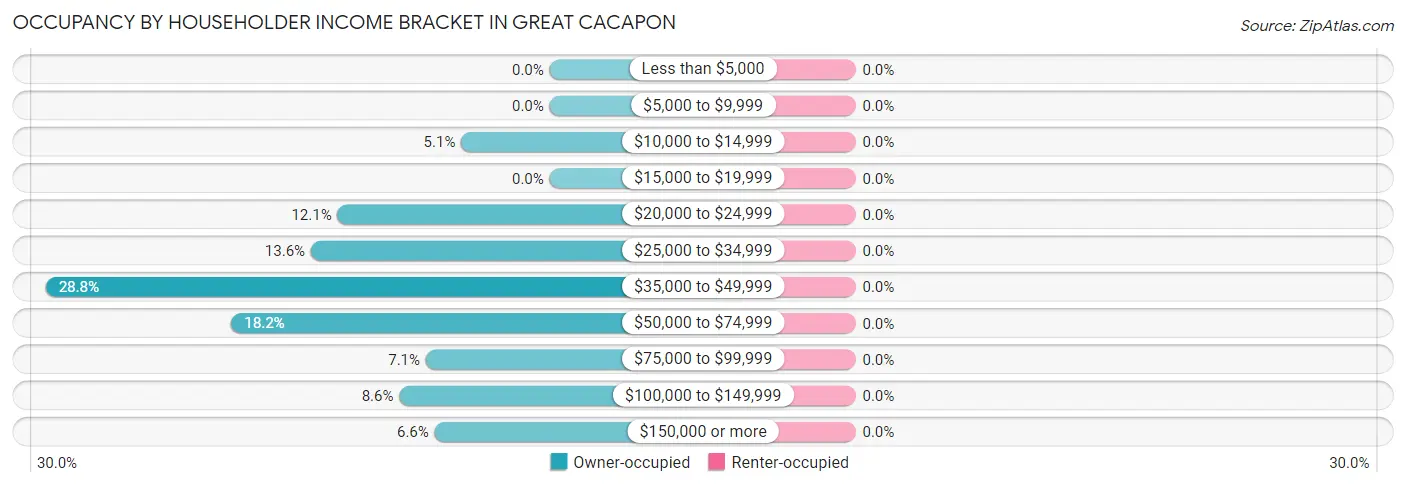
| Income Bracket | Owner-occupied | Renter-occupied |
| Less than $5,000 | 0 (0.0%) | 0 (0.0%) |
| $5,000 to $9,999 | 0 (0.0%) | 0 (0.0%) |
| $10,000 to $14,999 | 10 (5.1%) | 0 (0.0%) |
| $15,000 to $19,999 | 0 (0.0%) | 0 (0.0%) |
| $20,000 to $24,999 | 24 (12.1%) | 0 (0.0%) |
| $25,000 to $34,999 | 27 (13.6%) | 0 (0.0%) |
| $35,000 to $49,999 | 57 (28.8%) | 0 (0.0%) |
| $50,000 to $74,999 | 36 (18.2%) | 0 (0.0%) |
| $75,000 to $99,999 | 14 (7.1%) | 0 (0.0%) |
| $100,000 to $149,999 | 17 (8.6%) | 0 (0.0%) |
| $150,000 or more | 13 (6.6%) | 0 (0.0%) |
| Total | 198 (100.0%) | 0 (0.0%) |
Monthly Housing Cost Tiers in Great Cacapon
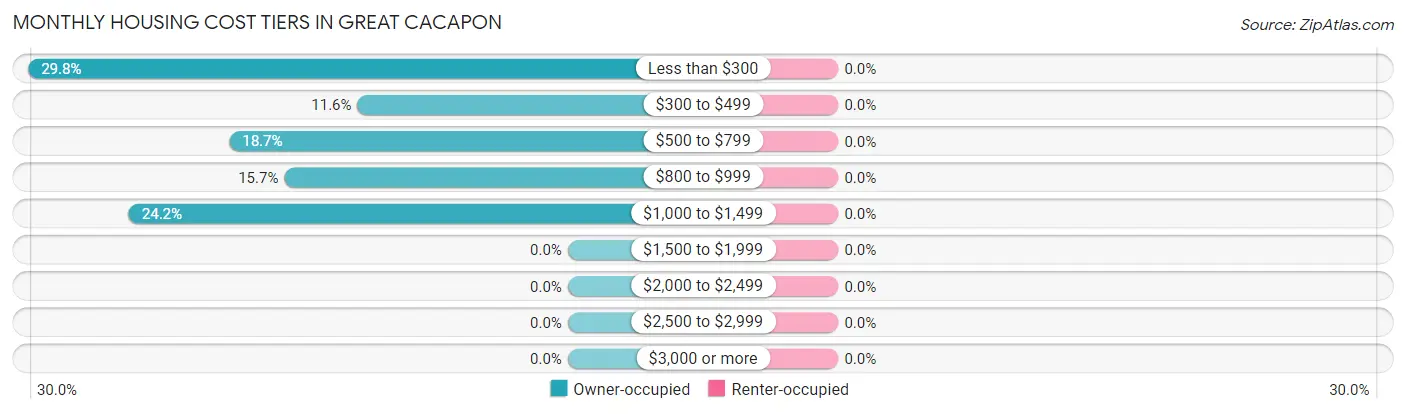
| Monthly Cost | Owner-occupied | Renter-occupied |
| Less than $300 | 59 (29.8%) | 0 (0.0%) |
| $300 to $499 | 23 (11.6%) | 0 (0.0%) |
| $500 to $799 | 37 (18.7%) | 0 (0.0%) |
| $800 to $999 | 31 (15.7%) | 0 (0.0%) |
| $1,000 to $1,499 | 48 (24.2%) | 0 (0.0%) |
| $1,500 to $1,999 | 0 (0.0%) | 0 (0.0%) |
| $2,000 to $2,499 | 0 (0.0%) | 0 (0.0%) |
| $2,500 to $2,999 | 0 (0.0%) | 0 (0.0%) |
| $3,000 or more | 0 (0.0%) | 0 (0.0%) |
| Total | 198 (100.0%) | 0 (0.0%) |
Physical Housing Characteristics in Great Cacapon
Housing Structures in Great Cacapon
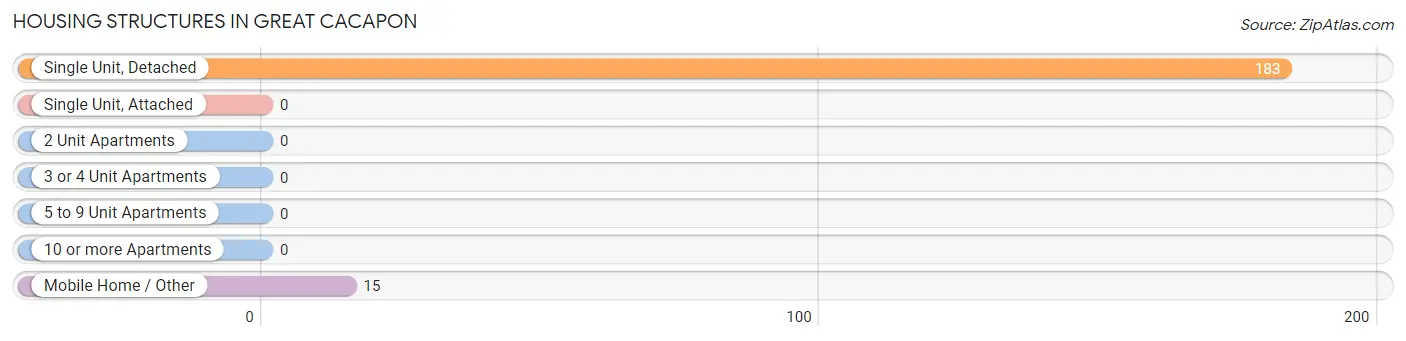
| Structure Type | # Housing Units | % Housing Units |
| Single Unit, Detached | 183 | 92.4% |
| Single Unit, Attached | 0 | 0.0% |
| 2 Unit Apartments | 0 | 0.0% |
| 3 or 4 Unit Apartments | 0 | 0.0% |
| 5 to 9 Unit Apartments | 0 | 0.0% |
| 10 or more Apartments | 0 | 0.0% |
| Mobile Home / Other | 15 | 7.6% |
| Total | 198 | 100.0% |
Housing Structures by Occupancy in Great Cacapon
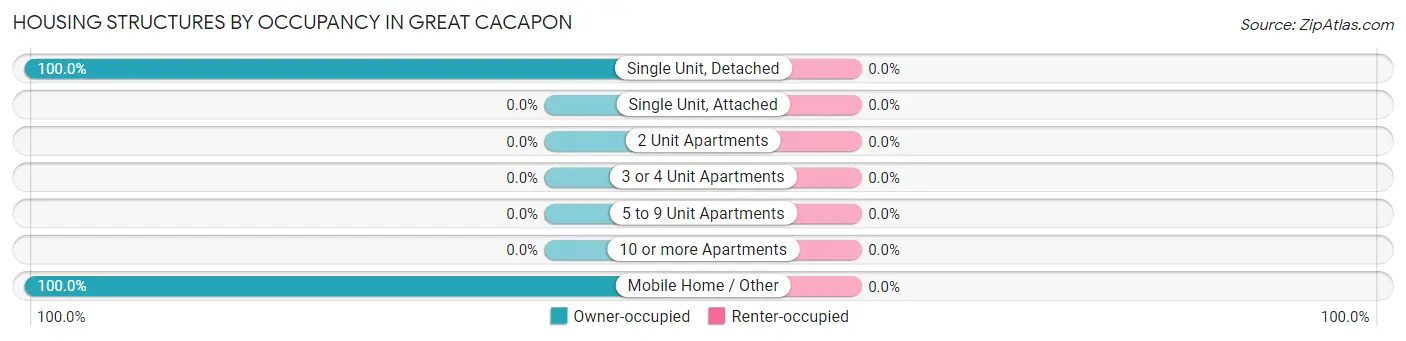
| Structure Type | Owner-occupied | Renter-occupied |
| Single Unit, Detached | 183 (100.0%) | 0 (0.0%) |
| Single Unit, Attached | 0 (0.0%) | 0 (0.0%) |
| 2 Unit Apartments | 0 (0.0%) | 0 (0.0%) |
| 3 or 4 Unit Apartments | 0 (0.0%) | 0 (0.0%) |
| 5 to 9 Unit Apartments | 0 (0.0%) | 0 (0.0%) |
| 10 or more Apartments | 0 (0.0%) | 0 (0.0%) |
| Mobile Home / Other | 15 (100.0%) | 0 (0.0%) |
| Total | 198 (100.0%) | 0 (0.0%) |
Housing Structures by Number of Rooms in Great Cacapon
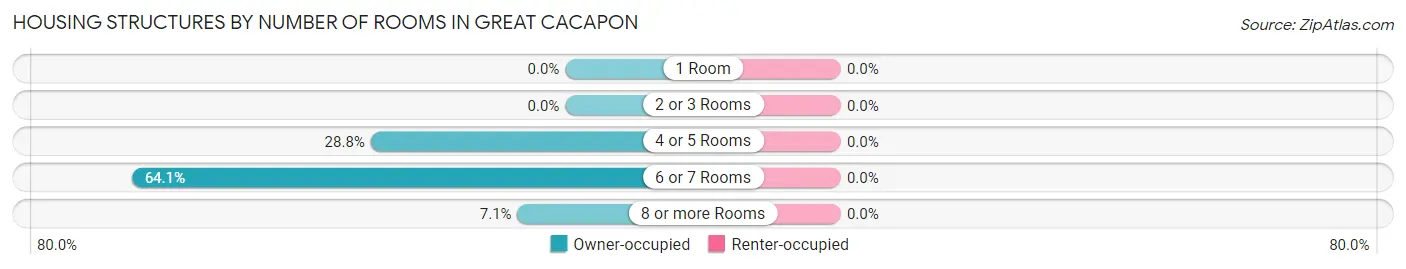
| Number of Rooms | Owner-occupied | Renter-occupied |
| 1 Room | 0 (0.0%) | 0 (0.0%) |
| 2 or 3 Rooms | 0 (0.0%) | 0 (0.0%) |
| 4 or 5 Rooms | 57 (28.8%) | 0 (0.0%) |
| 6 or 7 Rooms | 127 (64.1%) | 0 (0.0%) |
| 8 or more Rooms | 14 (7.1%) | 0 (0.0%) |
| Total | 198 (100.0%) | 0 (0.0%) |
Housing Structure by Heating Type in Great Cacapon
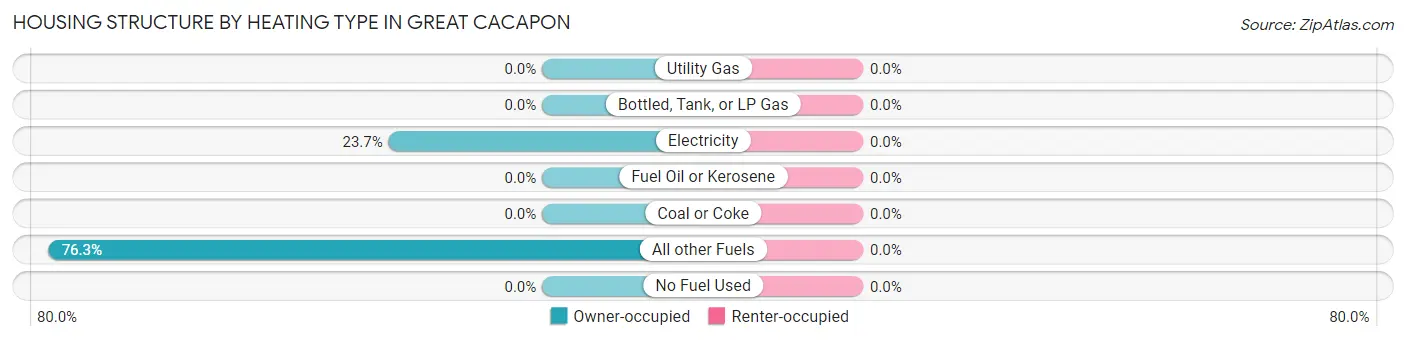
| Heating Type | Owner-occupied | Renter-occupied |
| Utility Gas | 0 (0.0%) | 0 (0.0%) |
| Bottled, Tank, or LP Gas | 0 (0.0%) | 0 (0.0%) |
| Electricity | 47 (23.7%) | 0 (0.0%) |
| Fuel Oil or Kerosene | 0 (0.0%) | 0 (0.0%) |
| Coal or Coke | 0 (0.0%) | 0 (0.0%) |
| All other Fuels | 151 (76.3%) | 0 (0.0%) |
| No Fuel Used | 0 (0.0%) | 0 (0.0%) |
| Total | 198 (100.0%) | 0 (0.0%) |
Household Vehicle Usage in Great Cacapon
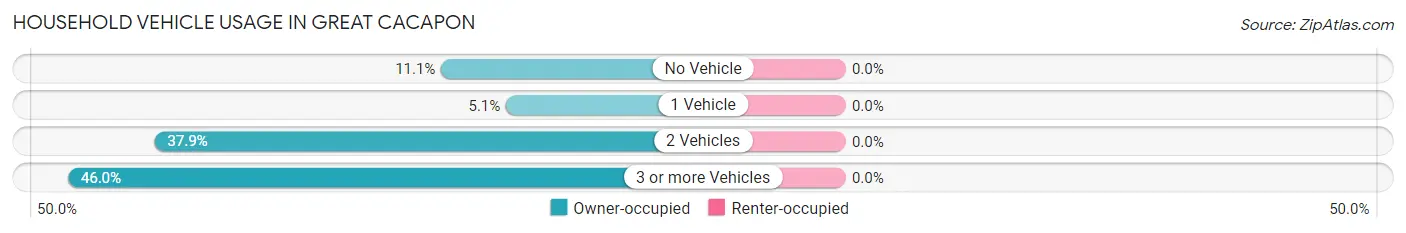
| Vehicles per Household | Owner-occupied | Renter-occupied |
| No Vehicle | 22 (11.1%) | 0 (0.0%) |
| 1 Vehicle | 10 (5.1%) | 0 (0.0%) |
| 2 Vehicles | 75 (37.9%) | 0 (0.0%) |
| 3 or more Vehicles | 91 (46.0%) | 0 (0.0%) |
| Total | 198 (100.0%) | 0 (0.0%) |
Real Estate & Mortgages in Great Cacapon
Real Estate and Mortgage Overview in Great Cacapon
| Characteristic | Without Mortgage | With Mortgage |
| Housing Units | 82 | 116 |
| Median Property Value | $45,900 | $117,600 |
| Median Household Income | $35,875 | $0 |
| Monthly Housing Costs | $235 | $0 |
| Real Estate Taxes | - | - |
Property Value by Mortgage Status in Great Cacapon
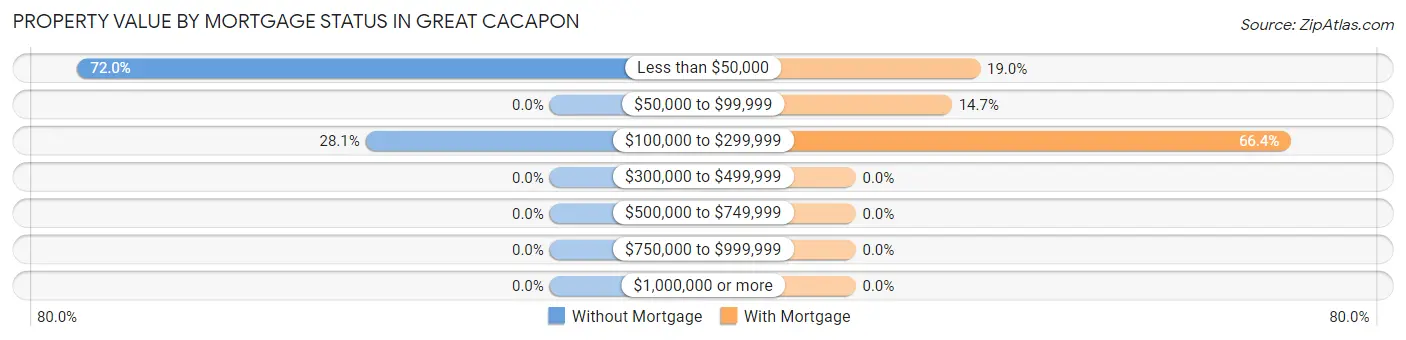
| Property Value | Without Mortgage | With Mortgage |
| Less than $50,000 | 59 (72.0%) | 22 (19.0%) |
| $50,000 to $99,999 | 0 (0.0%) | 17 (14.7%) |
| $100,000 to $299,999 | 23 (28.1%) | 77 (66.4%) |
| $300,000 to $499,999 | 0 (0.0%) | 0 (0.0%) |
| $500,000 to $749,999 | 0 (0.0%) | 0 (0.0%) |
| $750,000 to $999,999 | 0 (0.0%) | 0 (0.0%) |
| $1,000,000 or more | 0 (0.0%) | 0 (0.0%) |
| Total | 82 (100.0%) | 116 (100.0%) |
Household Income by Mortgage Status in Great Cacapon
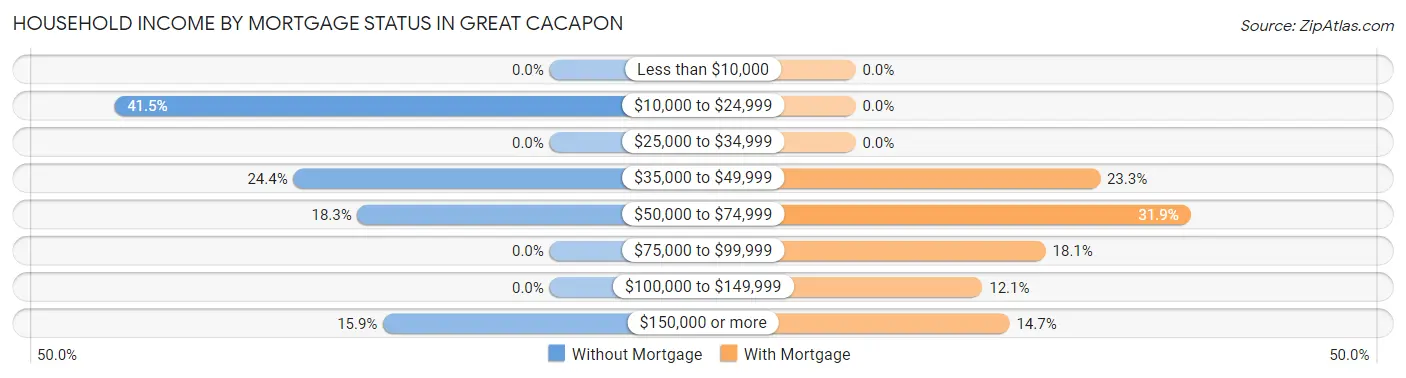
| Household Income | Without Mortgage | With Mortgage |
| Less than $10,000 | 0 (0.0%) | 0 (0.0%) |
| $10,000 to $24,999 | 34 (41.5%) | 0 (0.0%) |
| $25,000 to $34,999 | 0 (0.0%) | 0 (0.0%) |
| $35,000 to $49,999 | 20 (24.4%) | 27 (23.3%) |
| $50,000 to $74,999 | 15 (18.3%) | 37 (31.9%) |
| $75,000 to $99,999 | 0 (0.0%) | 21 (18.1%) |
| $100,000 to $149,999 | 0 (0.0%) | 14 (12.1%) |
| $150,000 or more | 13 (15.9%) | 17 (14.7%) |
| Total | 82 (100.0%) | 116 (100.0%) |
Property Value to Household Income Ratio in Great Cacapon
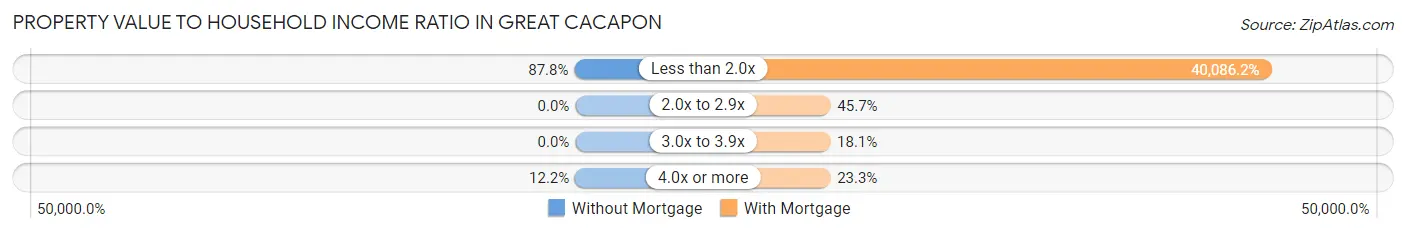
| Value-to-Income Ratio | Without Mortgage | With Mortgage |
| Less than 2.0x | 72 (87.8%) | 46,500 (40,086.2%) |
| 2.0x to 2.9x | 0 (0.0%) | 53 (45.7%) |
| 3.0x to 3.9x | 0 (0.0%) | 21 (18.1%) |
| 4.0x or more | 10 (12.2%) | 27 (23.3%) |
| Total | 82 (100.0%) | 116 (100.0%) |
Real Estate Taxes by Mortgage Status in Great Cacapon
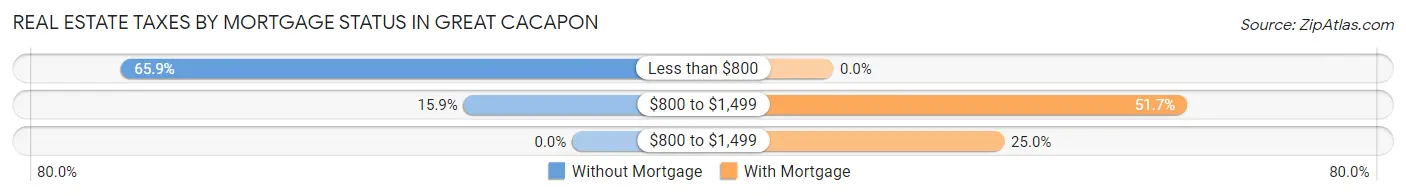
| Property Taxes | Without Mortgage | With Mortgage |
| Less than $800 | 54 (65.8%) | 0 (0.0%) |
| $800 to $1,499 | 13 (15.9%) | 60 (51.7%) |
| $800 to $1,499 | 0 (0.0%) | 29 (25.0%) |
| Total | 82 (100.0%) | 116 (100.0%) |
Health & Disability in Great Cacapon
Health Insurance Coverage by Age in Great Cacapon
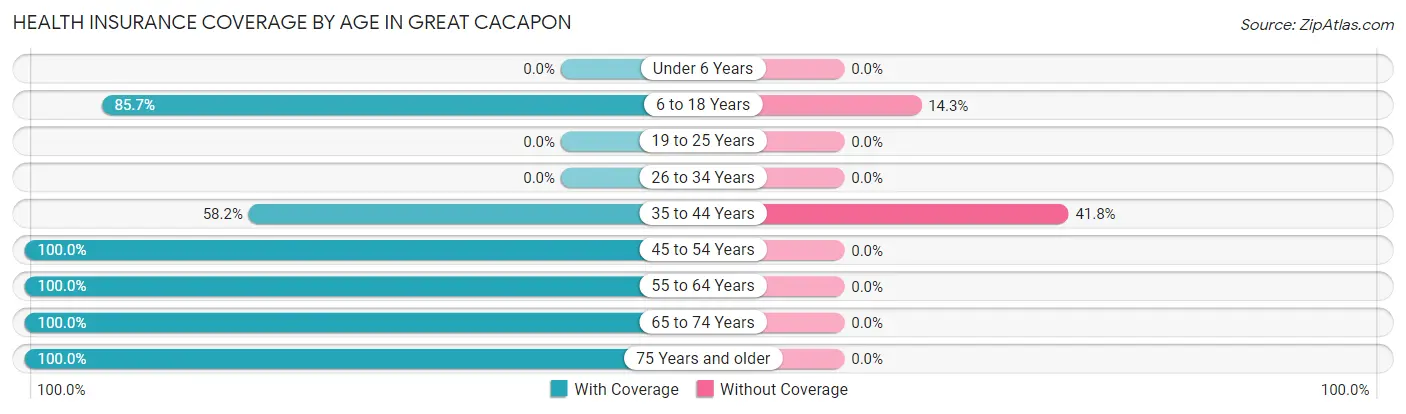
| Age Bracket | With Coverage | Without Coverage |
| Under 6 Years | 0 (0.0%) | 0 (0.0%) |
| 6 to 18 Years | 233 (85.7%) | 39 (14.3%) |
| 19 to 25 Years | 0 (0.0%) | 0 (0.0%) |
| 26 to 34 Years | 0 (0.0%) | 0 (0.0%) |
| 35 to 44 Years | 142 (58.2%) | 102 (41.8%) |
| 45 to 54 Years | 89 (100.0%) | 0 (0.0%) |
| 55 to 64 Years | 90 (100.0%) | 0 (0.0%) |
| 65 to 74 Years | 10 (100.0%) | 0 (0.0%) |
| 75 Years and older | 35 (100.0%) | 0 (0.0%) |
| Total | 599 (80.9%) | 141 (19.1%) |
Health Insurance Coverage by Citizenship Status in Great Cacapon
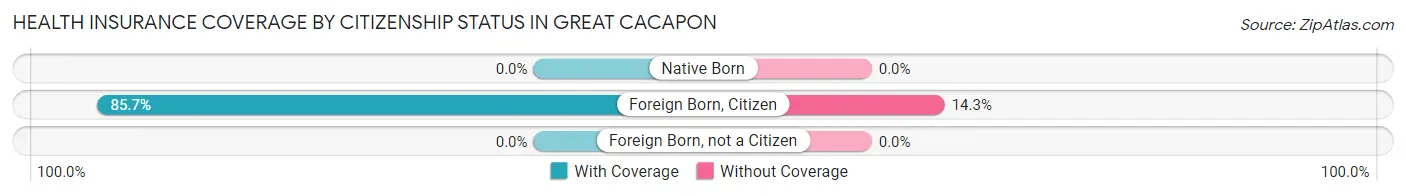
| Citizenship Status | With Coverage | Without Coverage |
| Native Born | 0 (0.0%) | 0 (0.0%) |
| Foreign Born, Citizen | 233 (85.7%) | 39 (14.3%) |
| Foreign Born, not a Citizen | 0 (0.0%) | 0 (0.0%) |
Health Insurance Coverage by Household Income in Great Cacapon
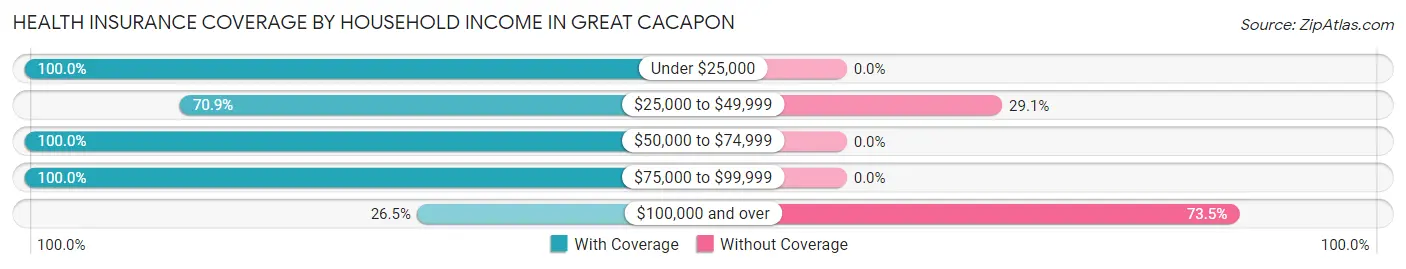
| Household Income | With Coverage | Without Coverage |
| Under $25,000 | 126 (100.0%) | 0 (0.0%) |
| $25,000 to $49,999 | 168 (70.9%) | 69 (29.1%) |
| $50,000 to $74,999 | 215 (100.0%) | 0 (0.0%) |
| $75,000 to $99,999 | 64 (100.0%) | 0 (0.0%) |
| $100,000 and over | 26 (26.5%) | 72 (73.5%) |
Public vs Private Health Insurance Coverage by Age in Great Cacapon
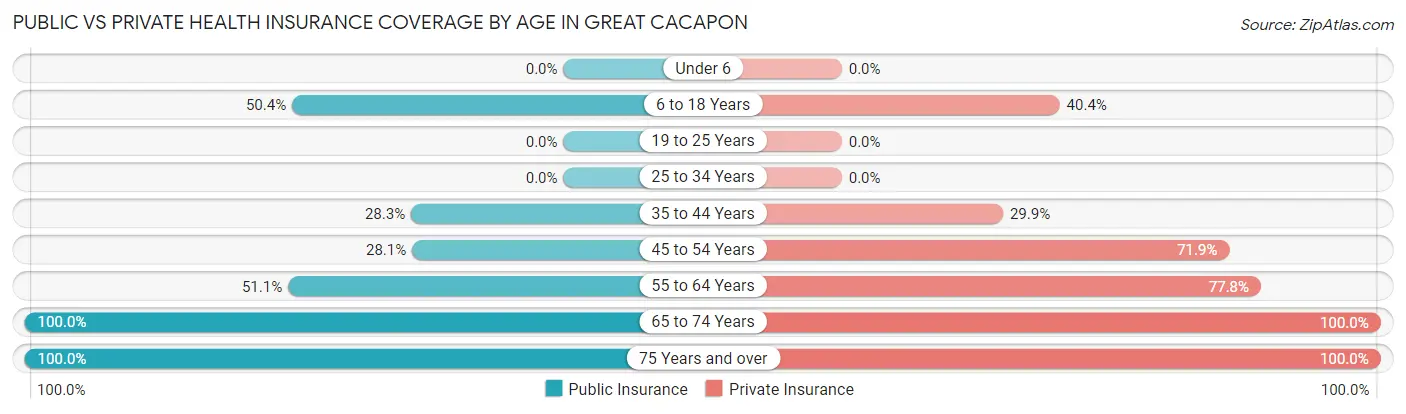
| Age Bracket | Public Insurance | Private Insurance |
| Under 6 | 0 (0.0%) | 0 (0.0%) |
| 6 to 18 Years | 137 (50.4%) | 110 (40.4%) |
| 19 to 25 Years | 0 (0.0%) | 0 (0.0%) |
| 25 to 34 Years | 0 (0.0%) | 0 (0.0%) |
| 35 to 44 Years | 69 (28.3%) | 73 (29.9%) |
| 45 to 54 Years | 25 (28.1%) | 64 (71.9%) |
| 55 to 64 Years | 46 (51.1%) | 70 (77.8%) |
| 65 to 74 Years | 10 (100.0%) | 10 (100.0%) |
| 75 Years and over | 35 (100.0%) | 35 (100.0%) |
| Total | 322 (43.5%) | 362 (48.9%) |
Disability Status by Sex by Age in Great Cacapon
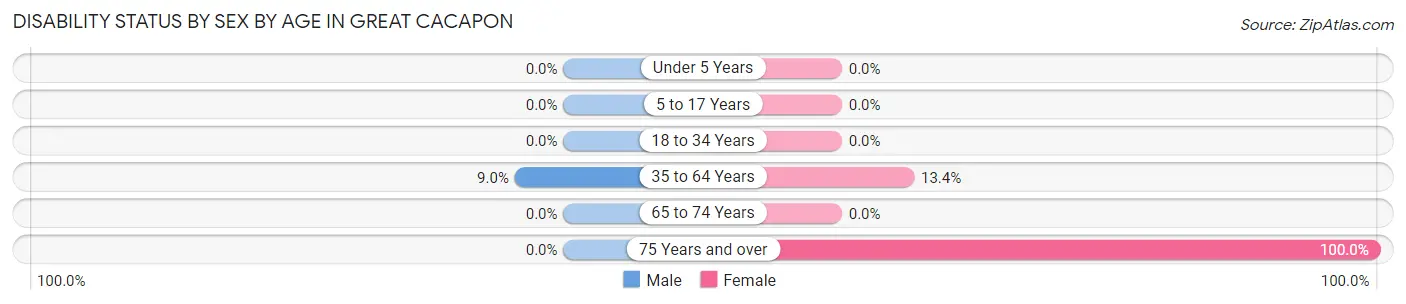
| Age Bracket | Male | Female |
| Under 5 Years | 0 (0.0%) | 0 (0.0%) |
| 5 to 17 Years | 0 (0.0%) | 0 (0.0%) |
| 18 to 34 Years | 0 (0.0%) | 0 (0.0%) |
| 35 to 64 Years | 22 (9.0%) | 24 (13.4%) |
| 65 to 74 Years | 0 (0.0%) | 0 (0.0%) |
| 75 Years and over | 0 (0.0%) | 15 (100.0%) |
Disability Class by Sex by Age in Great Cacapon
Disability Class: Hearing Difficulty
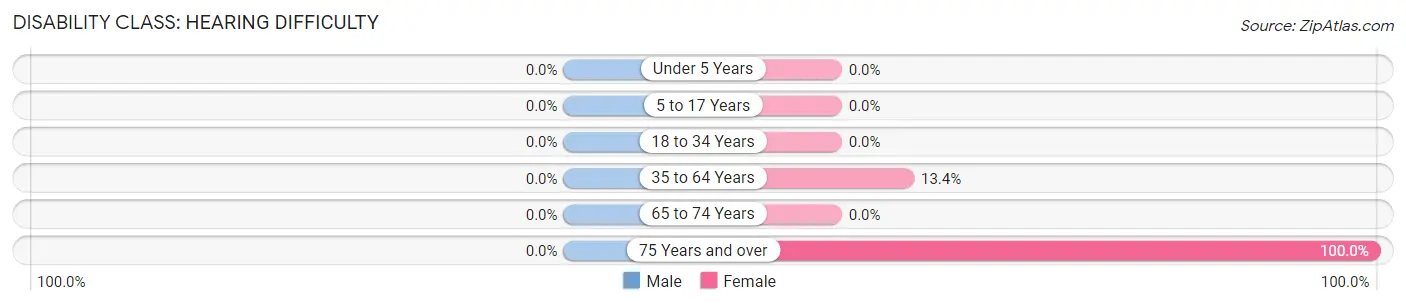
| Age Bracket | Male | Female |
| Under 5 Years | 0 (0.0%) | 0 (0.0%) |
| 5 to 17 Years | 0 (0.0%) | 0 (0.0%) |
| 18 to 34 Years | 0 (0.0%) | 0 (0.0%) |
| 35 to 64 Years | 0 (0.0%) | 24 (13.4%) |
| 65 to 74 Years | 0 (0.0%) | 0 (0.0%) |
| 75 Years and over | 0 (0.0%) | 15 (100.0%) |
Disability Class: Vision Difficulty
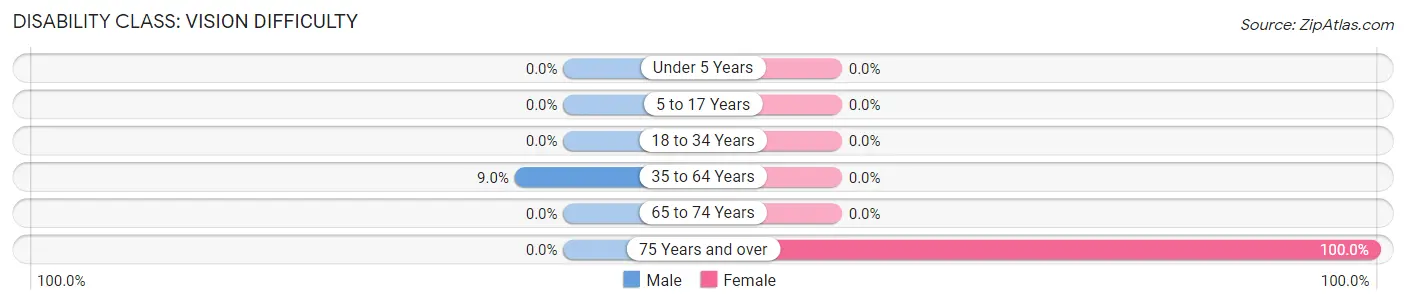
| Age Bracket | Male | Female |
| Under 5 Years | 0 (0.0%) | 0 (0.0%) |
| 5 to 17 Years | 0 (0.0%) | 0 (0.0%) |
| 18 to 34 Years | 0 (0.0%) | 0 (0.0%) |
| 35 to 64 Years | 22 (9.0%) | 0 (0.0%) |
| 65 to 74 Years | 0 (0.0%) | 0 (0.0%) |
| 75 Years and over | 0 (0.0%) | 15 (100.0%) |
Disability Class: Cognitive Difficulty
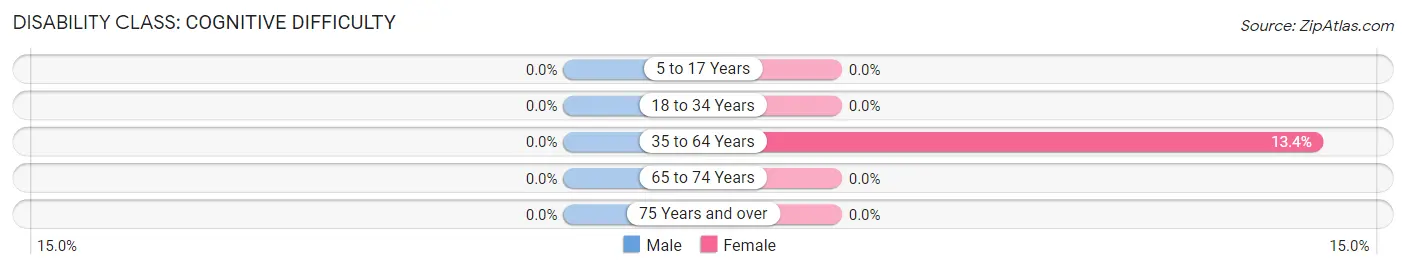
| Age Bracket | Male | Female |
| 5 to 17 Years | 0 (0.0%) | 0 (0.0%) |
| 18 to 34 Years | 0 (0.0%) | 0 (0.0%) |
| 35 to 64 Years | 0 (0.0%) | 24 (13.4%) |
| 65 to 74 Years | 0 (0.0%) | 0 (0.0%) |
| 75 Years and over | 0 (0.0%) | 0 (0.0%) |
Disability Class: Ambulatory Difficulty
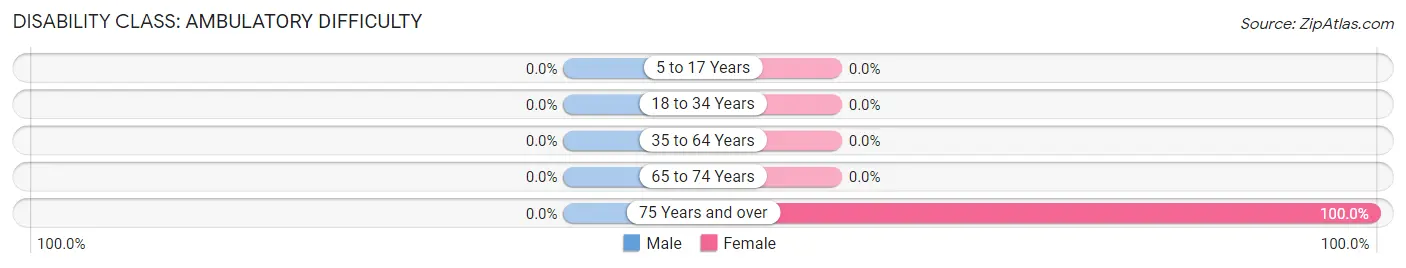
| Age Bracket | Male | Female |
| 5 to 17 Years | 0 (0.0%) | 0 (0.0%) |
| 18 to 34 Years | 0 (0.0%) | 0 (0.0%) |
| 35 to 64 Years | 0 (0.0%) | 0 (0.0%) |
| 65 to 74 Years | 0 (0.0%) | 0 (0.0%) |
| 75 Years and over | 0 (0.0%) | 15 (100.0%) |
Disability Class: Self-Care Difficulty
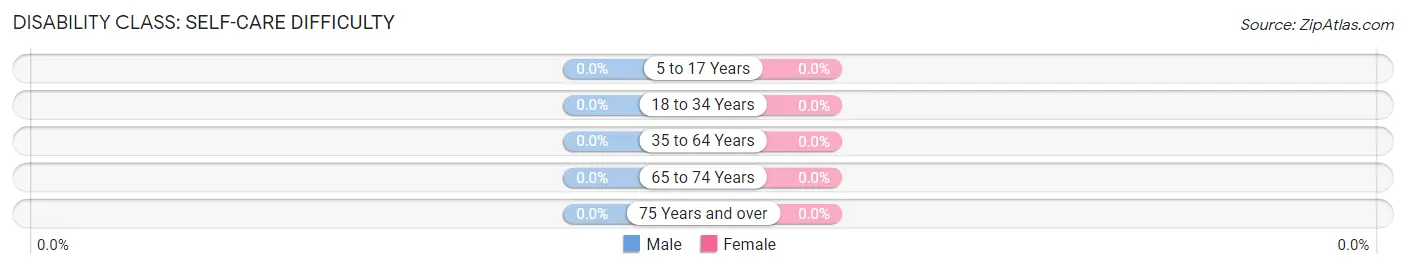
| Age Bracket | Male | Female |
| 5 to 17 Years | 0 (0.0%) | 0 (0.0%) |
| 18 to 34 Years | 0 (0.0%) | 0 (0.0%) |
| 35 to 64 Years | 0 (0.0%) | 0 (0.0%) |
| 65 to 74 Years | 0 (0.0%) | 0 (0.0%) |
| 75 Years and over | 0 (0.0%) | 0 (0.0%) |
Technology Access in Great Cacapon
Computing Device Access in Great Cacapon
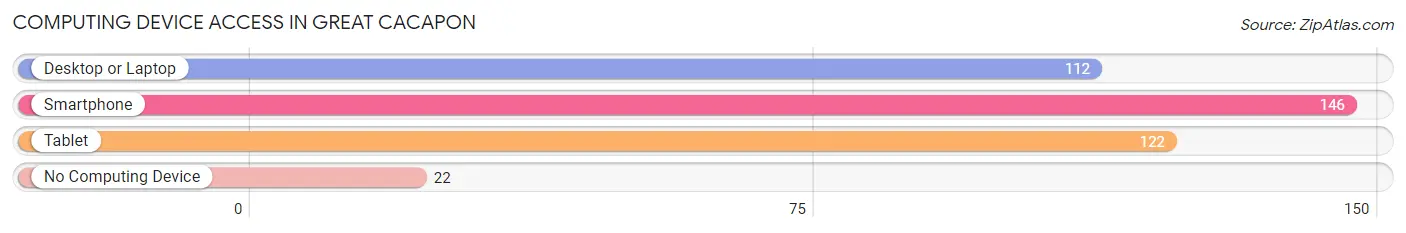
| Device Type | # Households | % Households |
| Desktop or Laptop | 112 | 56.6% |
| Smartphone | 146 | 73.7% |
| Tablet | 122 | 61.6% |
| No Computing Device | 22 | 11.1% |
| Total | 198 | 100.0% |
Internet Access in Great Cacapon
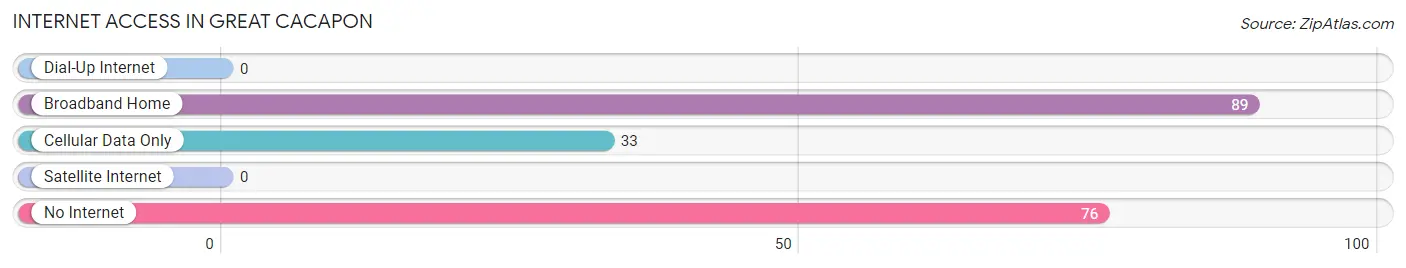
| Internet Type | # Households | % Households |
| Dial-Up Internet | 0 | 0.0% |
| Broadband Home | 89 | 45.0% |
| Cellular Data Only | 33 | 16.7% |
| Satellite Internet | 0 | 0.0% |
| No Internet | 76 | 38.4% |
| Total | 198 | 100.0% |
Great Cacapon Summary
Great Cacapon is a small unincorporated community located in Morgan County, West Virginia. It is situated along the banks of the Potomac River, approximately two miles south of Berkeley Springs. The town is named after the nearby Great Cacapon River, which was named after the Native American Cacapon tribe.
History
The area around Great Cacapon has been inhabited since the late 17th century. The first settlers were mostly of English and German descent. The town was officially established in 1786, when the first post office was opened. The town was originally known as “Cacapon”, but the name was changed to “Great Cacapon” in 1820.
The town was an important stop on the Baltimore and Ohio Railroad, which ran through the area in the late 19th century. The railroad brought many new settlers to the area, and the town grew rapidly. By the early 20th century, Great Cacapon had become a popular tourist destination, with many visitors coming to enjoy the scenic beauty of the Potomac River.
Geography
Great Cacapon is located in the Appalachian Mountains of West Virginia. The town is situated along the banks of the Potomac River, approximately two miles south of Berkeley Springs. The town is surrounded by rolling hills and forests, and is home to several small creeks and streams.
The climate in Great Cacapon is humid continental, with hot summers and cold winters. The average annual temperature is around 50°F (10°C). The average annual precipitation is around 40 inches (101 cm).
Economy
The economy of Great Cacapon is largely based on tourism. The town is home to several bed and breakfasts, as well as a few restaurants and shops. The town is also home to a small winery, which produces a variety of wines.
The town is also home to a few small businesses, including a lumber mill and a sawmill. The lumber mill produces a variety of wood products, including furniture and flooring. The sawmill produces a variety of wood products, including lumber and firewood.
Demographics
As of the 2010 census, the population of Great Cacapon was 545. The racial makeup of the town was 97.3% White, 0.7% African American, 0.2% Native American, 0.2% Asian, and 1.6% from other races. The median household income was $37,500, and the median family income was $45,000.
Great Cacapon is home to a variety of religious denominations, including Baptist, Methodist, and Presbyterian. The town is also home to a small Catholic church.
Great Cacapon is a small, rural community with a rich history and a strong sense of community. The town is home to a variety of businesses and attractions, and is a popular destination for tourists and outdoor enthusiasts. The town is also home to a variety of wildlife, including deer, bear, and wild turkey.
Common Questions
What is Per Capita Income in Great Cacapon?
Per Capita income in Great Cacapon is $17,820.
What is the Median Family Income in Great Cacapon?
Median Family Income in Great Cacapon is $40,909.
What is the Median Household income in Great Cacapon?
Median Household Income in Great Cacapon is $42,045.
What is Inequality or Gini Index in Great Cacapon?
Inequality or Gini Index in Great Cacapon is 0.34.
What is the Total Population of Great Cacapon?
Total Population of Great Cacapon is 740.
What is the Total Male Population of Great Cacapon?
Total Male Population of Great Cacapon is 470.
What is the Total Female Population of Great Cacapon?
Total Female Population of Great Cacapon is 270.
What is the Ratio of Males per 100 Females in Great Cacapon?
There are 174.07 Males per 100 Females in Great Cacapon.
What is the Ratio of Females per 100 Males in Great Cacapon?
There are 57.45 Females per 100 Males in Great Cacapon.
What is the Median Population Age in Great Cacapon?
Median Population Age in Great Cacapon is 39.0 Years.
What is the Average Family Size in Great Cacapon
Average Family Size in Great Cacapon is 3.8 People.
What is the Average Household Size in Great Cacapon
Average Household Size in Great Cacapon is 3.7 People.
How Large is the Labor Force in Great Cacapon?
There are 303 People in the Labor Forcein in Great Cacapon.
What is the Percentage of People in the Labor Force in Great Cacapon?
51.2% of People are in the Labor Force in Great Cacapon.