Bluewell, WV Map & Demographics
Bluewell Map
Bluewell Overview
$23,442
PER CAPITA INCOME
$67,250
AVG FAMILY INCOME
$32,763
AVG HOUSEHOLD INCOME
0.40
INEQUALITY / GINI INDEX
2,369
TOTAL POPULATION
1,345
MALE POPULATION
1,024
FEMALE POPULATION
131.35
MALES / 100 FEMALES
76.13
FEMALES / 100 MALES
57.9
MEDIAN AGE
2.9
AVG FAMILY SIZE
2.1
AVG HOUSEHOLD SIZE
828
LABOR FORCE [ PEOPLE ]
38.6%
PERCENT IN LABOR FORCE
3.5%
UNEMPLOYMENT RATE
Income in Bluewell
Income Overview in Bluewell
Per Capita Income in Bluewell is $23,442, while median incomes of families and households are $67,250 and $32,763 respectively.
| Characteristic | Number | Measure |
| Per Capita Income | 2,369 | $23,442 |
| Median Family Income | 607 | $67,250 |
| Mean Family Income | 607 | $65,020 |
| Median Household Income | 1,116 | $32,763 |
| Mean Household Income | 1,116 | $47,349 |
| Income Deficit | 607 | $0 |
| Wage / Income Gap (%) | 2,369 | 0.00% |
| Wage / Income Gap ($) | 2,369 | 100.00¢ per $1 |
| Gini / Inequality Index | 2,369 | 0.40 |
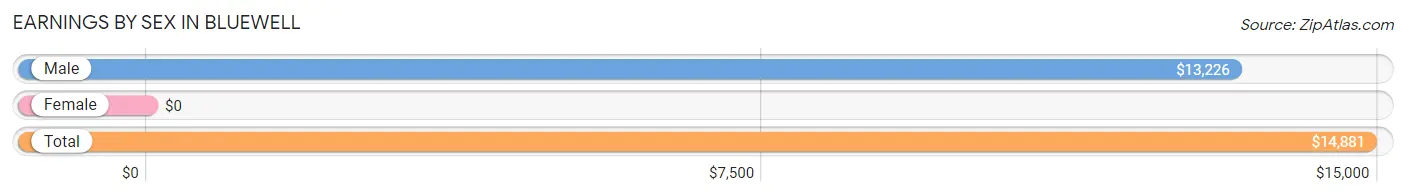
Earnings by Sex in Bluewell
| Sex | Number | Average Earnings |
| Male | 639 (67.2%) | $13,226 |
| Female | 312 (32.8%) | $0 |
| Total | 951 (100.0%) | $14,881 |
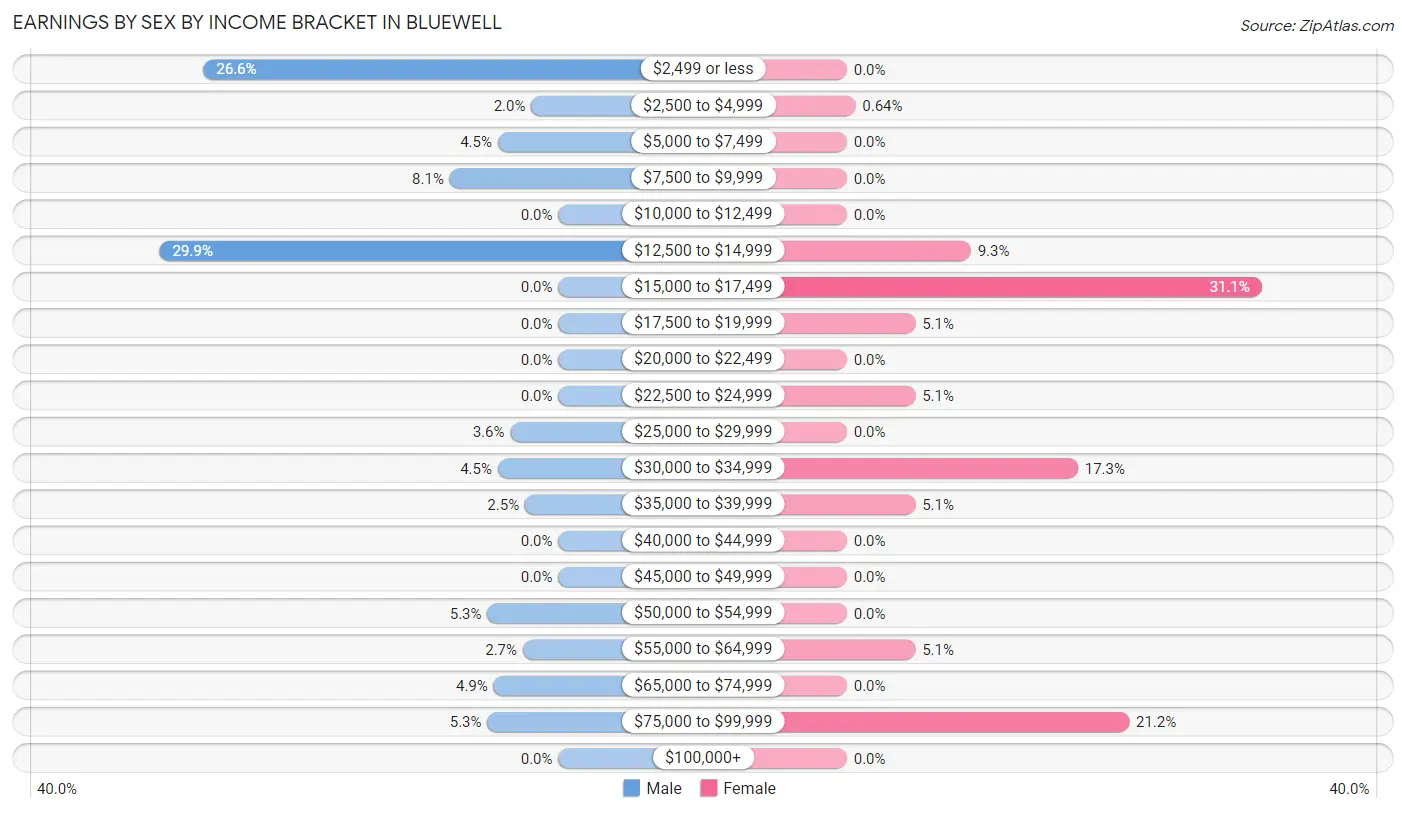
Earnings by Sex by Income Bracket in Bluewell
The most common earnings brackets in Bluewell are $12,500 to $14,999 for men (191 | 29.9%) and $15,000 to $17,499 for women (97 | 31.1%).
| Income | Male | Female |
| $2,499 or less | 170 (26.6%) | 0 (0.0%) |
| $2,500 to $4,999 | 13 (2.0%) | 2 (0.6%) |
| $5,000 to $7,499 | 29 (4.5%) | 0 (0.0%) |
| $7,500 to $9,999 | 52 (8.1%) | 0 (0.0%) |
| $10,000 to $12,499 | 0 (0.0%) | 0 (0.0%) |
| $12,500 to $14,999 | 191 (29.9%) | 29 (9.3%) |
| $15,000 to $17,499 | 0 (0.0%) | 97 (31.1%) |
| $17,500 to $19,999 | 0 (0.0%) | 16 (5.1%) |
| $20,000 to $22,499 | 0 (0.0%) | 0 (0.0%) |
| $22,500 to $24,999 | 0 (0.0%) | 16 (5.1%) |
| $25,000 to $29,999 | 23 (3.6%) | 0 (0.0%) |
| $30,000 to $34,999 | 29 (4.5%) | 54 (17.3%) |
| $35,000 to $39,999 | 16 (2.5%) | 16 (5.1%) |
| $40,000 to $44,999 | 0 (0.0%) | 0 (0.0%) |
| $45,000 to $49,999 | 0 (0.0%) | 0 (0.0%) |
| $50,000 to $54,999 | 34 (5.3%) | 0 (0.0%) |
| $55,000 to $64,999 | 17 (2.7%) | 16 (5.1%) |
| $65,000 to $74,999 | 31 (4.9%) | 0 (0.0%) |
| $75,000 to $99,999 | 34 (5.3%) | 66 (21.1%) |
| $100,000+ | 0 (0.0%) | 0 (0.0%) |
| Total | 639 (100.0%) | 312 (100.0%) |
Earnings by Sex by Educational Attainment in Bluewell
| Educational Attainment | Male Income | Female Income |
| Less than High School | - | - |
| High School Diploma | - | - |
| College or Associate's Degree | - | - |
| Bachelor's Degree | - | - |
| Graduate Degree | - | - |
| Total | - | - |
Family Income in Bluewell
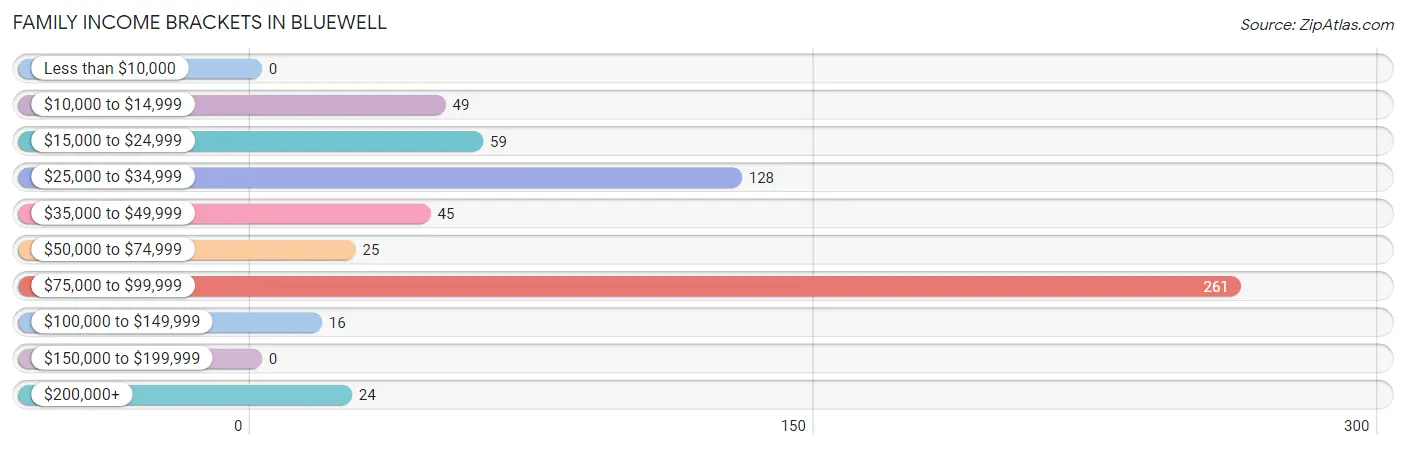
Family Income Brackets in Bluewell
According to the Bluewell family income data, there are 261 families falling into the $75,000 to $99,999 income range, which is the most common income bracket and makes up 43.0% of all families.
| Income Bracket | # Families | % Families |
| Less than $10,000 | 0 | 0.0% |
| $10,000 to $14,999 | 49 | 8.1% |
| $15,000 to $24,999 | 59 | 9.7% |
| $25,000 to $34,999 | 128 | 21.1% |
| $35,000 to $49,999 | 45 | 7.4% |
| $50,000 to $74,999 | 25 | 4.1% |
| $75,000 to $99,999 | 261 | 43.0% |
| $100,000 to $149,999 | 16 | 2.6% |
| $150,000 to $199,999 | 0 | 0.0% |
| $200,000+ | 24 | 4.0% |
Family Income by Famaliy Size in Bluewell
| Income Bracket | # Families | Median Income |
| 2-Person Families | 409 (67.4%) | $0 |
| 3-Person Families | 109 (18.0%) | $0 |
| 4-Person Families | 53 (8.7%) | $0 |
| 5-Person Families | 0 (0.0%) | $0 |
| 6-Person Families | 0 (0.0%) | $0 |
| 7+ Person Families | 36 (5.9%) | $0 |
| Total | 607 (100.0%) | $67,250 |
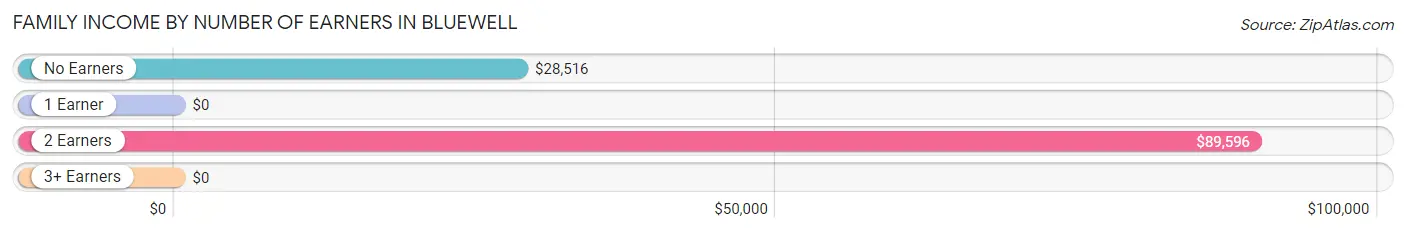
Family Income by Number of Earners in Bluewell
| Number of Earners | # Families | Median Income |
| No Earners | 272 (44.8%) | $28,516 |
| 1 Earner | 146 (24.0%) | $0 |
| 2 Earners | 153 (25.2%) | $89,596 |
| 3+ Earners | 36 (5.9%) | $0 |
| Total | 607 (100.0%) | $67,250 |
Household Income in Bluewell
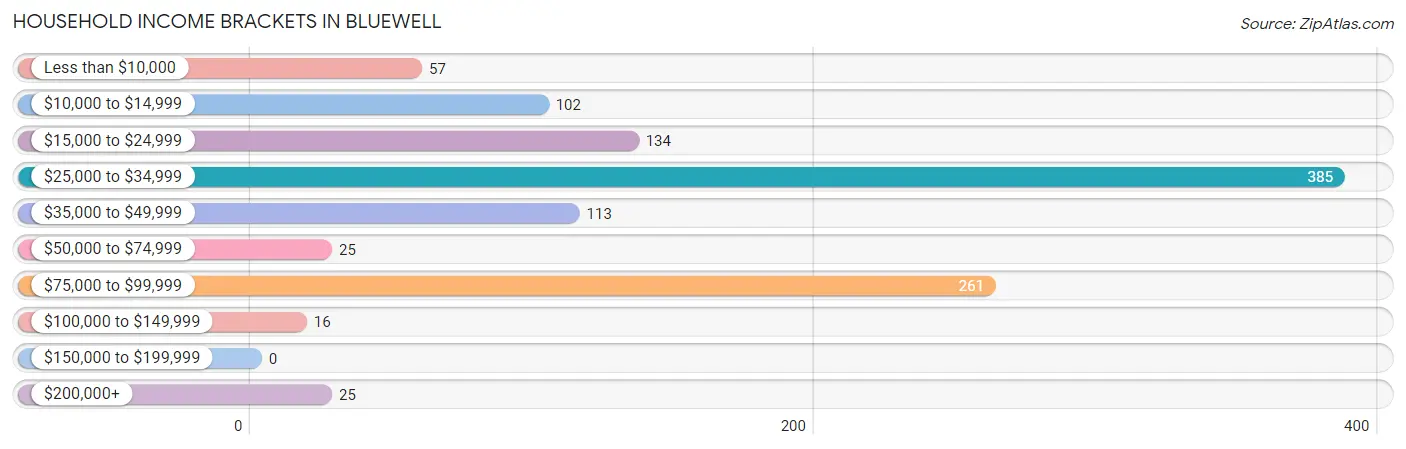
Household Income Brackets in Bluewell
With 385 households falling in the category, the $25,000 to $34,999 income range is the most frequent in Bluewell, accounting for 34.5% of all households.
| Income Bracket | # Households | % Households |
| Less than $10,000 | 57 | 5.1% |
| $10,000 to $14,999 | 102 | 9.1% |
| $15,000 to $24,999 | 134 | 12.0% |
| $25,000 to $34,999 | 385 | 34.5% |
| $35,000 to $49,999 | 113 | 10.1% |
| $50,000 to $74,999 | 25 | 2.2% |
| $75,000 to $99,999 | 261 | 23.4% |
| $100,000 to $149,999 | 16 | 1.4% |
| $150,000 to $199,999 | 0 | 0.0% |
| $200,000+ | 25 | 2.2% |
Household Income by Householder Age in Bluewell
The median household income in Bluewell is $32,763, with the highest median household income of $34,464 found in the 65+ years age bracket for the primary householder. A total of 661 households (59.2%) fall into this category. Meanwhile, the 15 to 24 years age bracket for the primary householder has the lowest median household income of $0, with 97 households (8.7%) in this group.
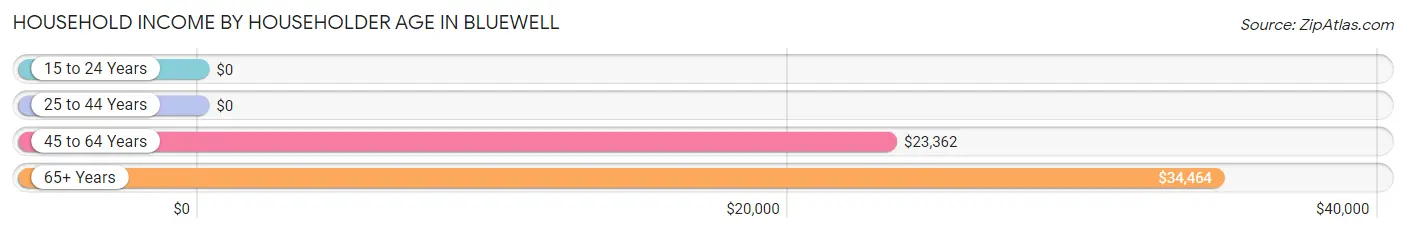
| Income Bracket | # Households | Median Income |
| 15 to 24 Years | 97 (8.7%) | $0 |
| 25 to 44 Years | 110 (9.9%) | $0 |
| 45 to 64 Years | 248 (22.2%) | $23,362 |
| 65+ Years | 661 (59.2%) | $34,464 |
| Total | 1,116 (100.0%) | $32,763 |
Poverty in Bluewell
Income Below Poverty by Sex and Age in Bluewell
With 20.7% poverty level for males and 14.1% for females among the residents of Bluewell, 12 to 14 year old males and 55 to 64 year old females are the most vulnerable to poverty, with 13 males (100.0%) and 86 females (74.1%) in their respective age groups living below the poverty level.
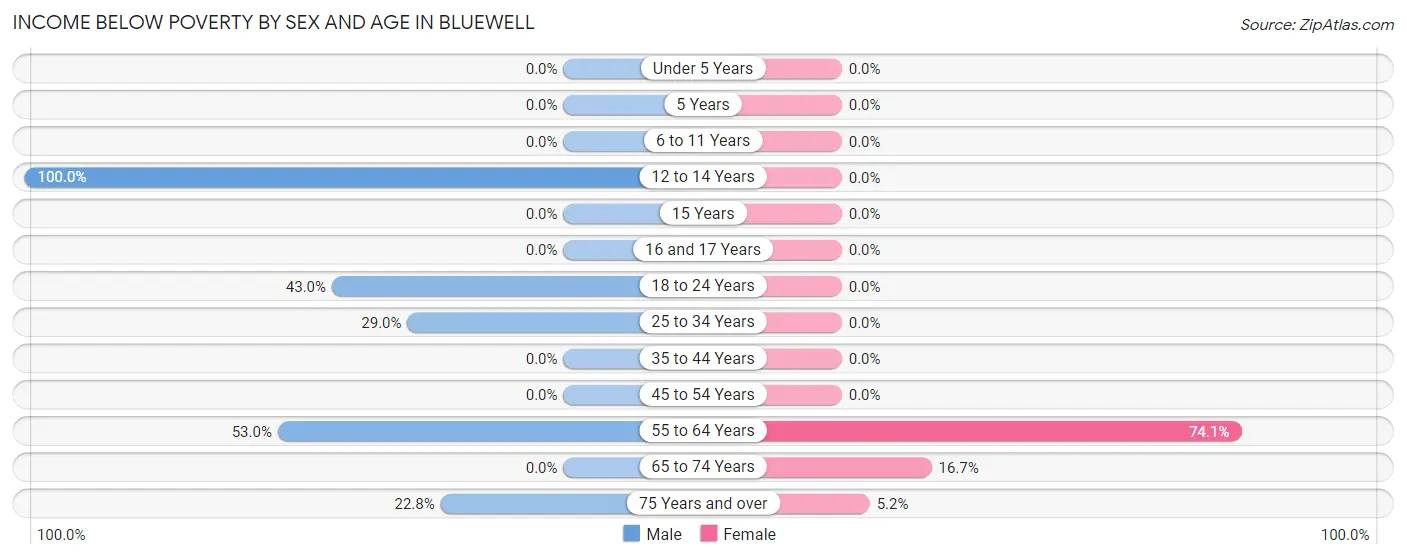
| Age Bracket | Male | Female |
| Under 5 Years | 0 (0.0%) | 0 (0.0%) |
| 5 Years | 0 (0.0%) | 0 (0.0%) |
| 6 to 11 Years | 0 (0.0%) | 0 (0.0%) |
| 12 to 14 Years | 13 (100.0%) | 0 (0.0%) |
| 15 Years | 0 (0.0%) | 0 (0.0%) |
| 16 and 17 Years | 0 (0.0%) | 0 (0.0%) |
| 18 to 24 Years | 107 (43.0%) | 0 (0.0%) |
| 25 to 34 Years | 22 (28.9%) | 0 (0.0%) |
| 35 to 44 Years | 0 (0.0%) | 0 (0.0%) |
| 45 to 54 Years | 0 (0.0%) | 0 (0.0%) |
| 55 to 64 Years | 88 (53.0%) | 86 (74.1%) |
| 65 to 74 Years | 0 (0.0%) | 42 (16.7%) |
| 75 Years and over | 49 (22.8%) | 16 (5.2%) |
| Total | 279 (20.7%) | 144 (14.1%) |
Income Above Poverty by Sex and Age in Bluewell
According to the poverty statistics in Bluewell, males aged under 5 years and females aged 5 years are the age groups that are most secure financially, with 100.0% of males and 100.0% of females in these age groups living above the poverty line.
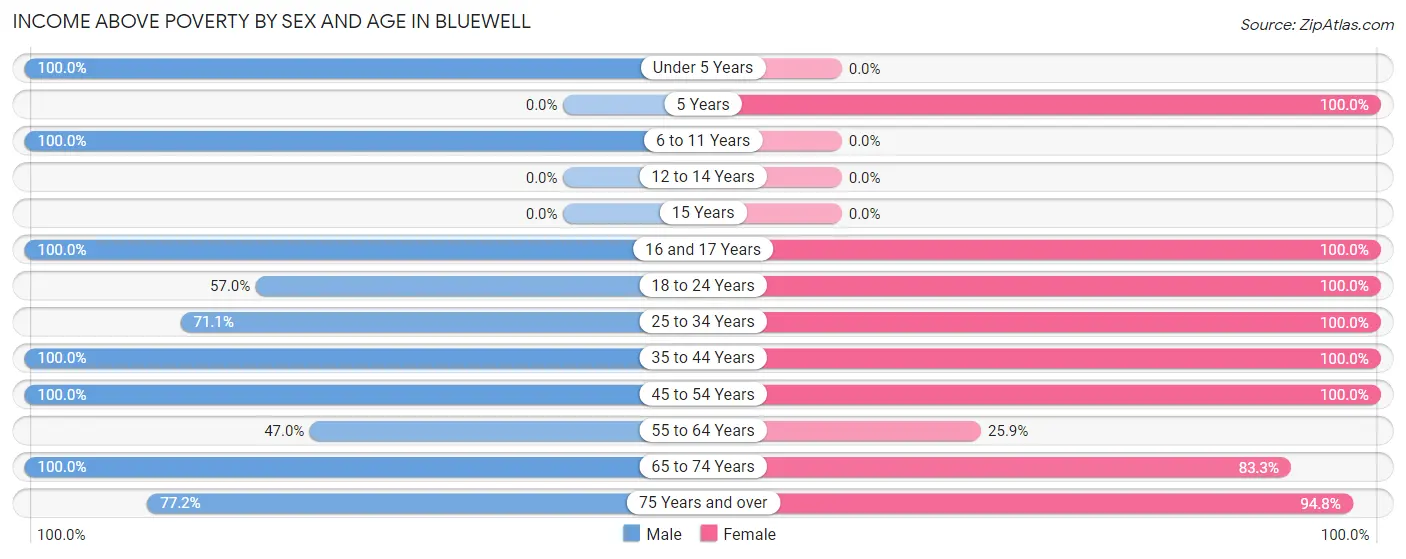
| Age Bracket | Male | Female |
| Under 5 Years | 118 (100.0%) | 0 (0.0%) |
| 5 Years | 0 (0.0%) | 30 (100.0%) |
| 6 to 11 Years | 63 (100.0%) | 0 (0.0%) |
| 12 to 14 Years | 0 (0.0%) | 0 (0.0%) |
| 15 Years | 0 (0.0%) | 0 (0.0%) |
| 16 and 17 Years | 75 (100.0%) | 1 (100.0%) |
| 18 to 24 Years | 142 (57.0%) | 97 (100.0%) |
| 25 to 34 Years | 54 (71.1%) | 47 (100.0%) |
| 35 to 44 Years | 134 (100.0%) | 48 (100.0%) |
| 45 to 54 Years | 43 (100.0%) | 125 (100.0%) |
| 55 to 64 Years | 78 (47.0%) | 30 (25.9%) |
| 65 to 74 Years | 193 (100.0%) | 210 (83.3%) |
| 75 Years and over | 166 (77.2%) | 292 (94.8%) |
| Total | 1,066 (79.3%) | 880 (85.9%) |
Income Below Poverty Among Married-Couple Families in Bluewell
The poverty statistics for married-couple families in Bluewell show that 14.5% or 68 of the total 470 families live below the poverty line. Families with no children have the highest poverty rate of 19.8%, comprising of 68 families. On the other hand, families with 1 or 2 children have the lowest poverty rate of 0.0%, which includes 0 families.
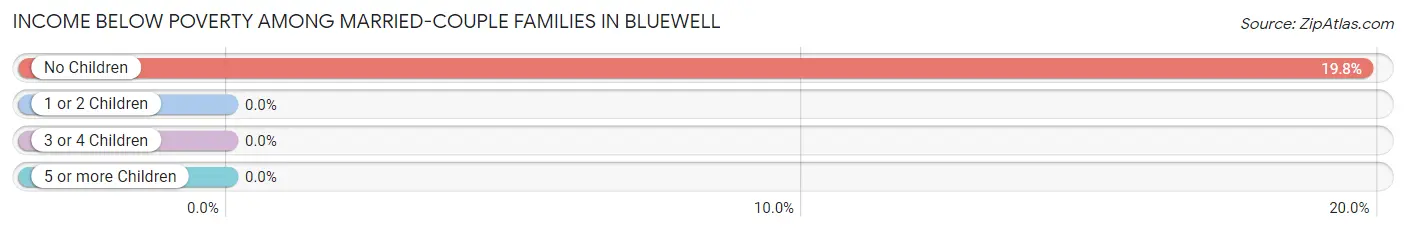
| Children | Above Poverty | Below Poverty |
| No Children | 276 (80.2%) | 68 (19.8%) |
| 1 or 2 Children | 90 (100.0%) | 0 (0.0%) |
| 3 or 4 Children | 36 (100.0%) | 0 (0.0%) |
| 5 or more Children | 0 (0.0%) | 0 (0.0%) |
| Total | 402 (85.5%) | 68 (14.5%) |
Income Below Poverty Among Single-Parent Households in Bluewell
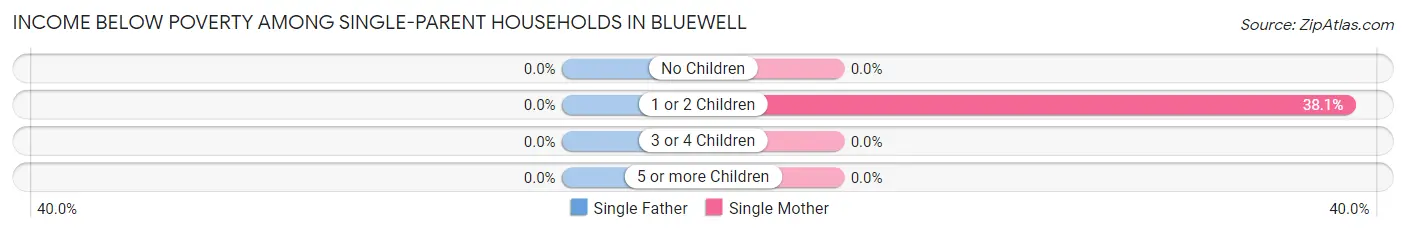
| Children | Single Father | Single Mother |
| No Children | 0 (0.0%) | 0 (0.0%) |
| 1 or 2 Children | 0 (0.0%) | 24 (38.1%) |
| 3 or 4 Children | 0 (0.0%) | 0 (0.0%) |
| 5 or more Children | 0 (0.0%) | 0 (0.0%) |
| Total | 0 (0.0%) | 24 (25.0%) |
Income Below Poverty Among Married-Couple vs Single-Parent Households in Bluewell
The poverty data for Bluewell shows that 68 of the married-couple family households (14.5%) and 24 of the single-parent households (17.5%) are living below the poverty level. Within the married-couple family households, those with no children have the highest poverty rate, with 68 households (19.8%) falling below the poverty line. Among the single-parent households, those with 1 or 2 children have the highest poverty rate, with 24 household (38.1%) living below poverty.
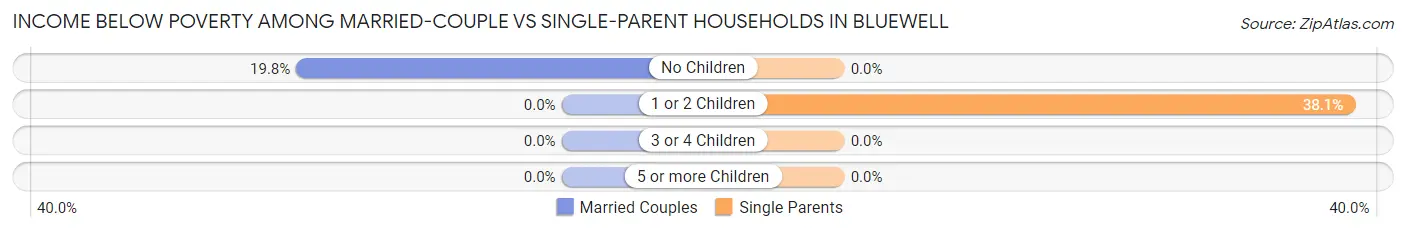
| Children | Married-Couple Families | Single-Parent Households |
| No Children | 68 (19.8%) | 0 (0.0%) |
| 1 or 2 Children | 0 (0.0%) | 24 (38.1%) |
| 3 or 4 Children | 0 (0.0%) | 0 (0.0%) |
| 5 or more Children | 0 (0.0%) | 0 (0.0%) |
| Total | 68 (14.5%) | 24 (17.5%) |
Race in Bluewell
The most populous races in Bluewell are White / Caucasian (2,283 | 96.4%), Two or more Races (49 | 2.1%), and Black / African American (37 | 1.6%).
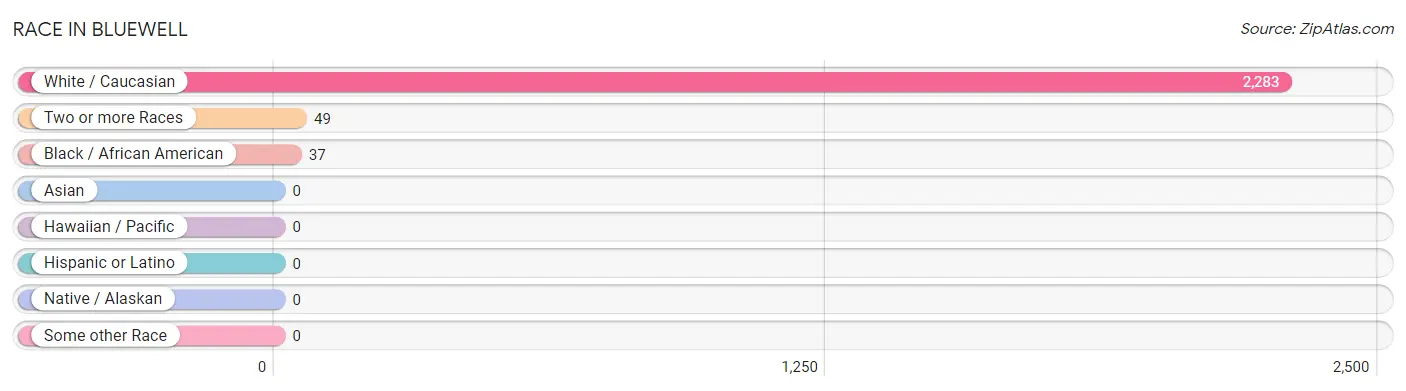
| Race | # Population | % Population |
| Asian | 0 | 0.0% |
| Black / African American | 37 | 1.6% |
| Hawaiian / Pacific | 0 | 0.0% |
| Hispanic or Latino | 0 | 0.0% |
| Native / Alaskan | 0 | 0.0% |
| White / Caucasian | 2,283 | 96.4% |
| Two or more Races | 49 | 2.1% |
| Some other Race | 0 | 0.0% |
| Total | 2,369 | 100.0% |
Ancestry in Bluewell
The most populous ancestries reported in Bluewell are English (603 | 25.5%), German (221 | 9.3%), American (215 | 9.1%), Italian (150 | 6.3%), and Hungarian (121 | 5.1%), together accounting for 55.3% of all Bluewell residents.
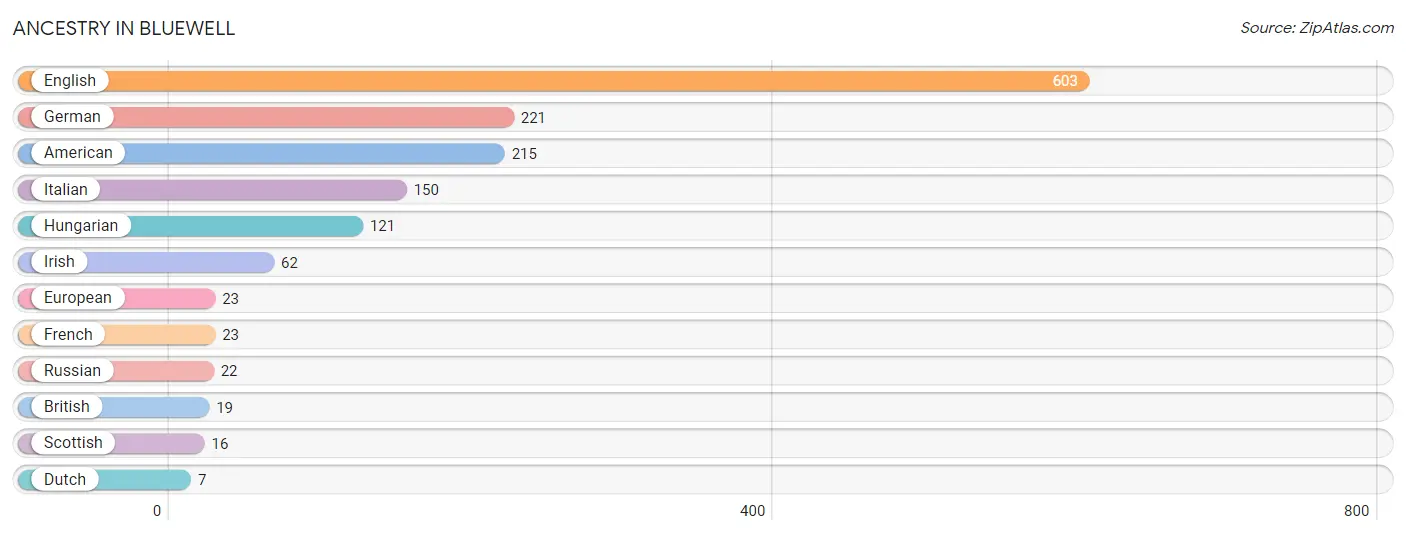
| Ancestry | # Population | % Population |
| American | 215 | 9.1% |
| British | 19 | 0.8% |
| Dutch | 7 | 0.3% |
| English | 603 | 25.5% |
| European | 23 | 1.0% |
| French | 23 | 1.0% |
| German | 221 | 9.3% |
| Hungarian | 121 | 5.1% |
| Irish | 62 | 2.6% |
| Italian | 150 | 6.3% |
| Russian | 22 | 0.9% |
| Scottish | 16 | 0.7% | View All 12 Rows |
Immigrants in Bluewell

| Immigration Origin | # Population | % Population | View All 0 Rows |
Sex and Age in Bluewell
Sex and Age in Bluewell
The most populous age groups in Bluewell are 20 to 24 Years (249 | 18.5%) for men and 85 Years and over (190 | 18.5%) for women.
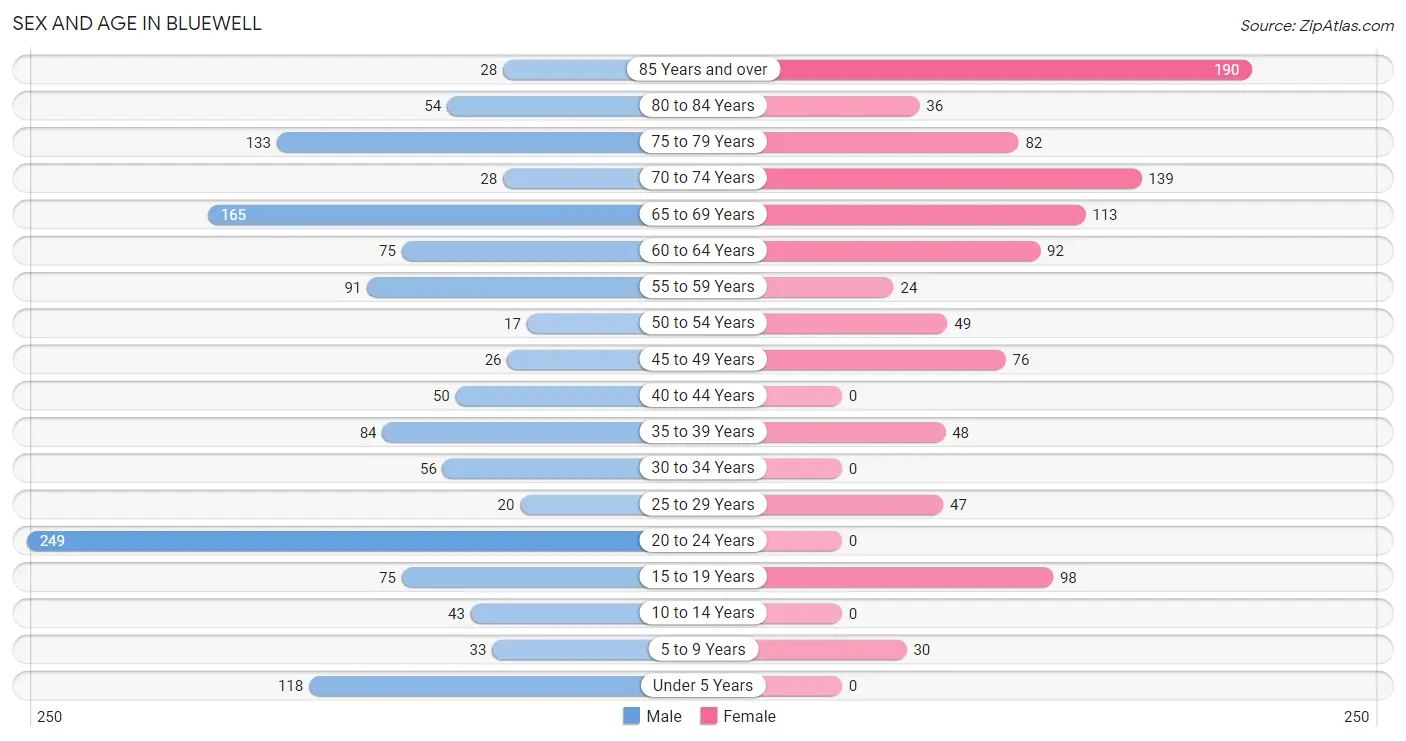
| Age Bracket | Male | Female |
| Under 5 Years | 118 (8.8%) | 0 (0.0%) |
| 5 to 9 Years | 33 (2.5%) | 30 (2.9%) |
| 10 to 14 Years | 43 (3.2%) | 0 (0.0%) |
| 15 to 19 Years | 75 (5.6%) | 98 (9.6%) |
| 20 to 24 Years | 249 (18.5%) | 0 (0.0%) |
| 25 to 29 Years | 20 (1.5%) | 47 (4.6%) |
| 30 to 34 Years | 56 (4.2%) | 0 (0.0%) |
| 35 to 39 Years | 84 (6.2%) | 48 (4.7%) |
| 40 to 44 Years | 50 (3.7%) | 0 (0.0%) |
| 45 to 49 Years | 26 (1.9%) | 76 (7.4%) |
| 50 to 54 Years | 17 (1.3%) | 49 (4.8%) |
| 55 to 59 Years | 91 (6.8%) | 24 (2.3%) |
| 60 to 64 Years | 75 (5.6%) | 92 (9.0%) |
| 65 to 69 Years | 165 (12.3%) | 113 (11.0%) |
| 70 to 74 Years | 28 (2.1%) | 139 (13.6%) |
| 75 to 79 Years | 133 (9.9%) | 82 (8.0%) |
| 80 to 84 Years | 54 (4.0%) | 36 (3.5%) |
| 85 Years and over | 28 (2.1%) | 190 (18.5%) |
| Total | 1,345 (100.0%) | 1,024 (100.0%) |
Families and Households in Bluewell
Median Family Size in Bluewell
The median family size in Bluewell is 2.86 persons per family, with married-couple families (470 | 77.4%) accounting for the largest median family size of 3.11 persons per family. On the other hand, single female/mother families (96 | 15.8%) represent the smallest median family size with 1.95 persons per family.
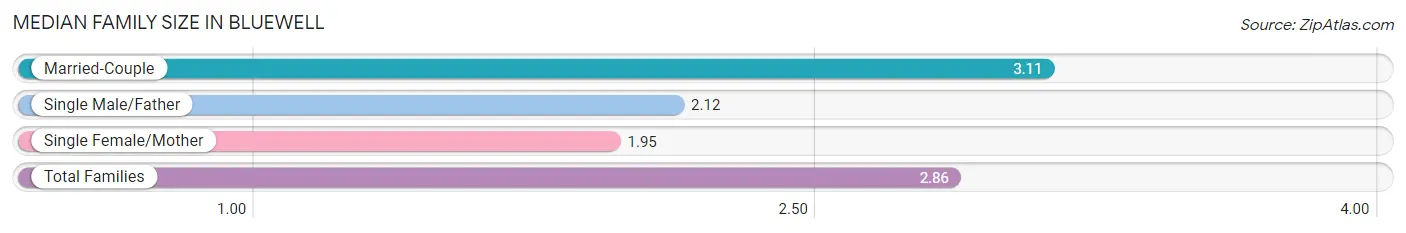
| Family Type | # Families | Family Size |
| Married-Couple | 470 (77.4%) | 3.11 |
| Single Male/Father | 41 (6.8%) | 2.12 |
| Single Female/Mother | 96 (15.8%) | 1.95 |
| Total Families | 607 (100.0%) | 2.86 |
Median Household Size in Bluewell
The median household size in Bluewell is 2.12 persons per household, with married-couple households (470 | 42.1%) accounting for the largest median household size of 3.11 persons per household. non-family households (509 | 45.6%) represent the smallest median household size with 1.25 persons per household.
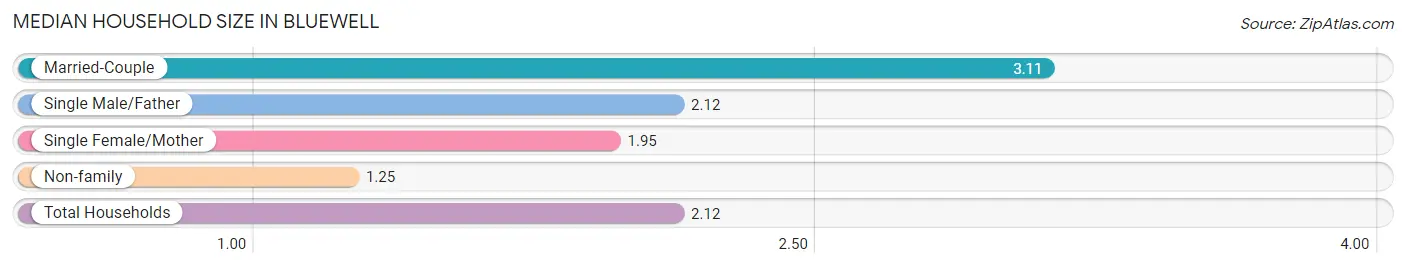
| Household Type | # Households | Household Size |
| Married-Couple | 470 (42.1%) | 3.11 |
| Single Male/Father | 41 (3.7%) | 2.12 |
| Single Female/Mother | 96 (8.6%) | 1.95 |
| Non-family | 509 (45.6%) | 1.25 |
| Total Households | 1,116 (100.0%) | 2.12 |
Household Size by Marriage Status in Bluewell
Out of a total of 1,116 households in Bluewell, 607 (54.4%) are family households, while 509 (45.6%) are nonfamily households. The most numerous type of family households are 2-person households, comprising 409, and the most common type of nonfamily households are 1-person households, comprising 392.
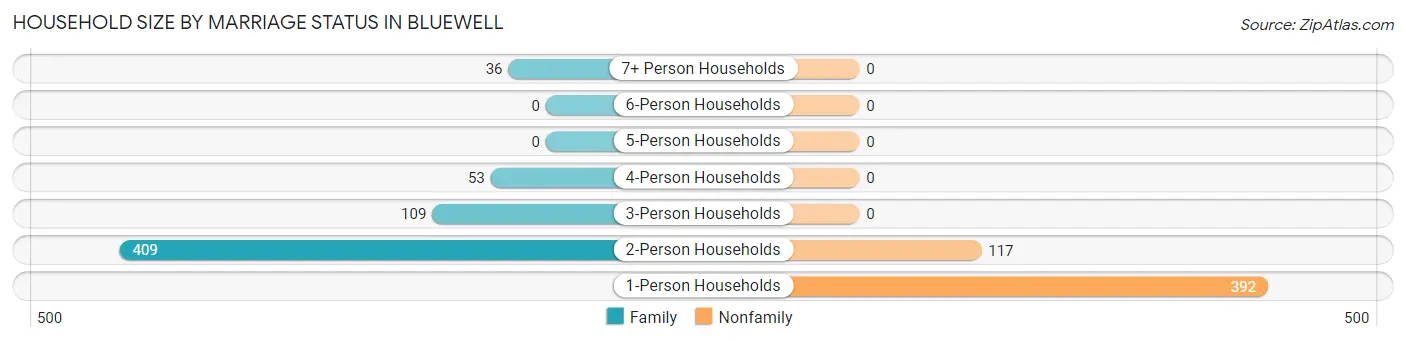
| Household Size | Family Households | Nonfamily Households |
| 1-Person Households | - | 392 (35.1%) |
| 2-Person Households | 409 (36.6%) | 117 (10.5%) |
| 3-Person Households | 109 (9.8%) | 0 (0.0%) |
| 4-Person Households | 53 (4.8%) | 0 (0.0%) |
| 5-Person Households | 0 (0.0%) | 0 (0.0%) |
| 6-Person Households | 0 (0.0%) | 0 (0.0%) |
| 7+ Person Households | 36 (3.2%) | 0 (0.0%) |
| Total | 607 (54.4%) | 509 (45.6%) |
Female Fertility in Bluewell
Fertility by Age in Bluewell
| Age Bracket | Women with Births | Births / 1,000 Women |
| 15 to 19 years | 0 (0.0%) | 0.0 |
| 20 to 34 years | 0 (0.0%) | 0.0 |
| 35 to 50 years | 0 (0.0%) | 0.0 |
| Total | 0 (0.0%) | 0.0 |
Fertility by Age by Marriage Status in Bluewell
| Age Bracket | Married | Unmarried |
| 15 to 19 years | 0 (0.0%) | 0 (0.0%) |
| 20 to 34 years | 0 (0.0%) | 0 (0.0%) |
| 35 to 50 years | 0 (0.0%) | 0 (0.0%) |
| Total | 0 (0.0%) | 0 (0.0%) |
Fertility by Education in Bluewell
| Educational Attainment | Women with Births | Births / 1,000 Women |
| Less than High School | 0 (0.0%) | 0.0 |
| High School Diploma | 0 (0.0%) | 0.0 |
| College or Associate's Degree | 0 (0.0%) | 0.0 |
| Bachelor's Degree | 0 (0.0%) | 0.0 |
| Graduate Degree | 0 (0.0%) | 0.0 |
| Total | 0 (0.0%) | 0.0 |
Fertility by Education by Marriage Status in Bluewell
| Educational Attainment | Married | Unmarried |
| Less than High School | 0 (0.0%) | 0 (0.0%) |
| High School Diploma | 0 (0.0%) | 0 (0.0%) |
| College or Associate's Degree | 0 (0.0%) | 0 (0.0%) |
| Bachelor's Degree | 0 (0.0%) | 0 (0.0%) |
| Graduate Degree | 0 (0.0%) | 0 (0.0%) |
| Total | 0 (0.0%) | 0 (0.0%) |
Employment Characteristics in Bluewell
Employment by Class of Employer in Bluewell
Among the 800 employed individuals in Bluewell, private company employees (469 | 58.6%), state government employees (136 | 17.0%), and not-for-profit organizations (107 | 13.4%) make up the most common classes of employment.
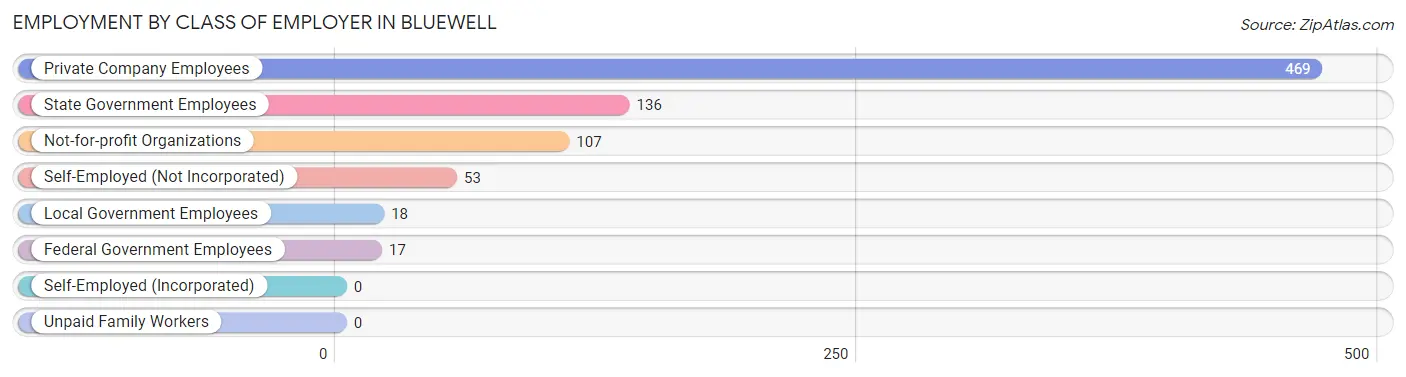
| Employer Class | # Employees | % Employees |
| Private Company Employees | 469 | 58.6% |
| Self-Employed (Incorporated) | 0 | 0.0% |
| Self-Employed (Not Incorporated) | 53 | 6.6% |
| Not-for-profit Organizations | 107 | 13.4% |
| Local Government Employees | 18 | 2.2% |
| State Government Employees | 136 | 17.0% |
| Federal Government Employees | 17 | 2.1% |
| Unpaid Family Workers | 0 | 0.0% |
| Total | 800 | 100.0% |
Employment Status by Age in Bluewell
According to the labor force statistics for Bluewell, out of the total population over 16 years of age (2,145), 38.6% or 828 individuals are in the labor force, with 3.5% or 29 of them unemployed. The age group with the highest labor force participation rate is 25 to 29 years, with 100.0% or 67 individuals in the labor force. Within the labor force, the 20 to 24 years age range has the highest percentage of unemployed individuals, with 13.2% or 29 of them being unemployed.
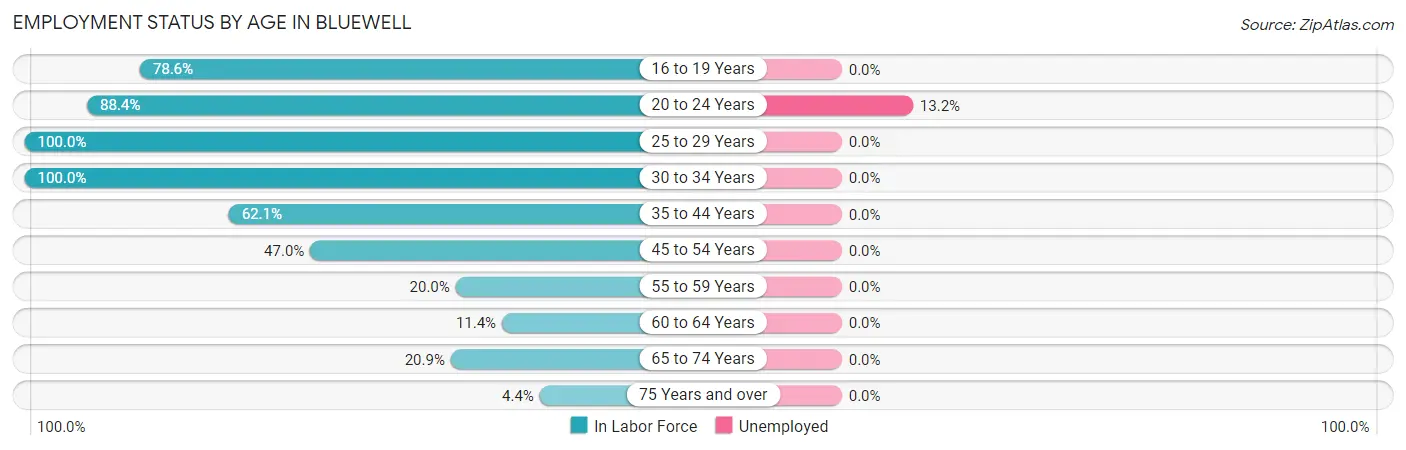
| Age Bracket | In Labor Force | Unemployed |
| 16 to 19 Years | 136 (78.6%) | 0 (0.0%) |
| 20 to 24 Years | 220 (88.4%) | 29 (13.2%) |
| 25 to 29 Years | 67 (100.0%) | 0 (0.0%) |
| 30 to 34 Years | 56 (100.0%) | 0 (0.0%) |
| 35 to 44 Years | 113 (62.1%) | 0 (0.0%) |
| 45 to 54 Years | 79 (47.0%) | 0 (0.0%) |
| 55 to 59 Years | 23 (20.0%) | 0 (0.0%) |
| 60 to 64 Years | 19 (11.4%) | 0 (0.0%) |
| 65 to 74 Years | 93 (20.9%) | 0 (0.0%) |
| 75 Years and over | 23 (4.4%) | 0 (0.0%) |
| Total | 828 (38.6%) | 29 (3.5%) |
Employment Status by Educational Attainment in Bluewell
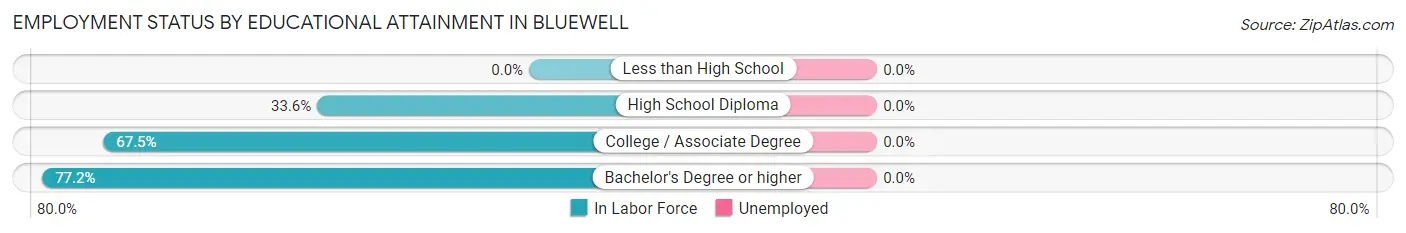
| Educational Attainment | In Labor Force | Unemployed |
| Less than High School | 0 (0.0%) | 0 (0.0%) |
| High School Diploma | 99 (33.6%) | 0 (0.0%) |
| College / Associate Degree | 112 (67.5%) | 0 (0.0%) |
| Bachelor's Degree or higher | 146 (77.2%) | 0 (0.0%) |
| Total | 357 (47.3%) | 0 (0.0%) |
Employment Occupations by Sex in Bluewell
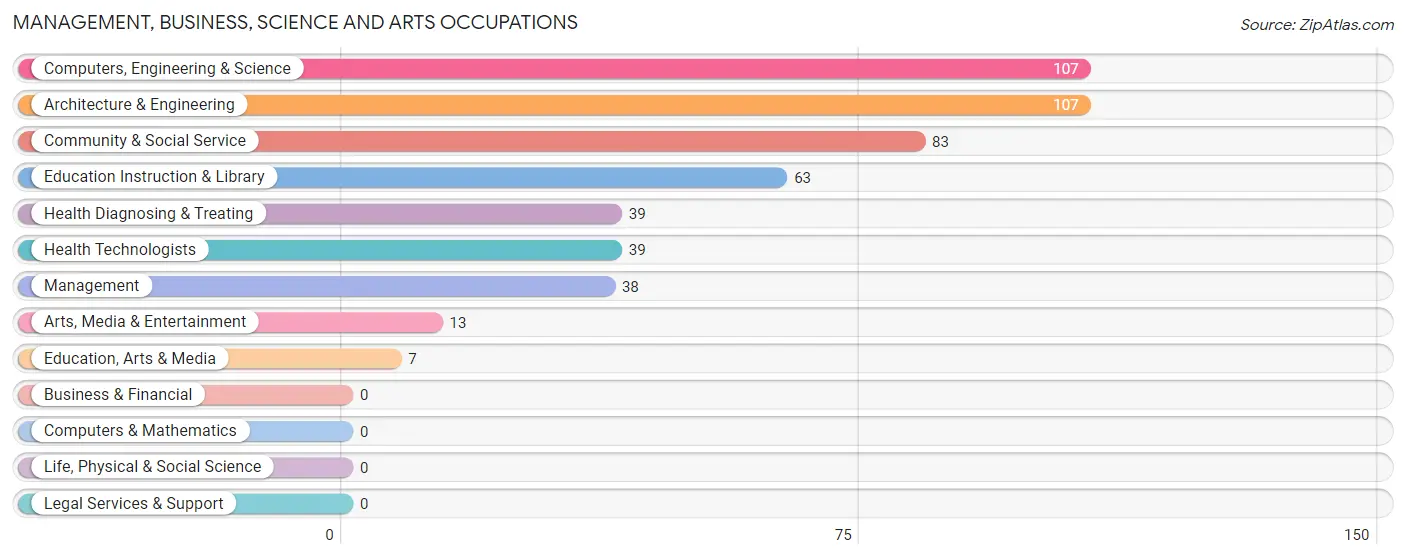
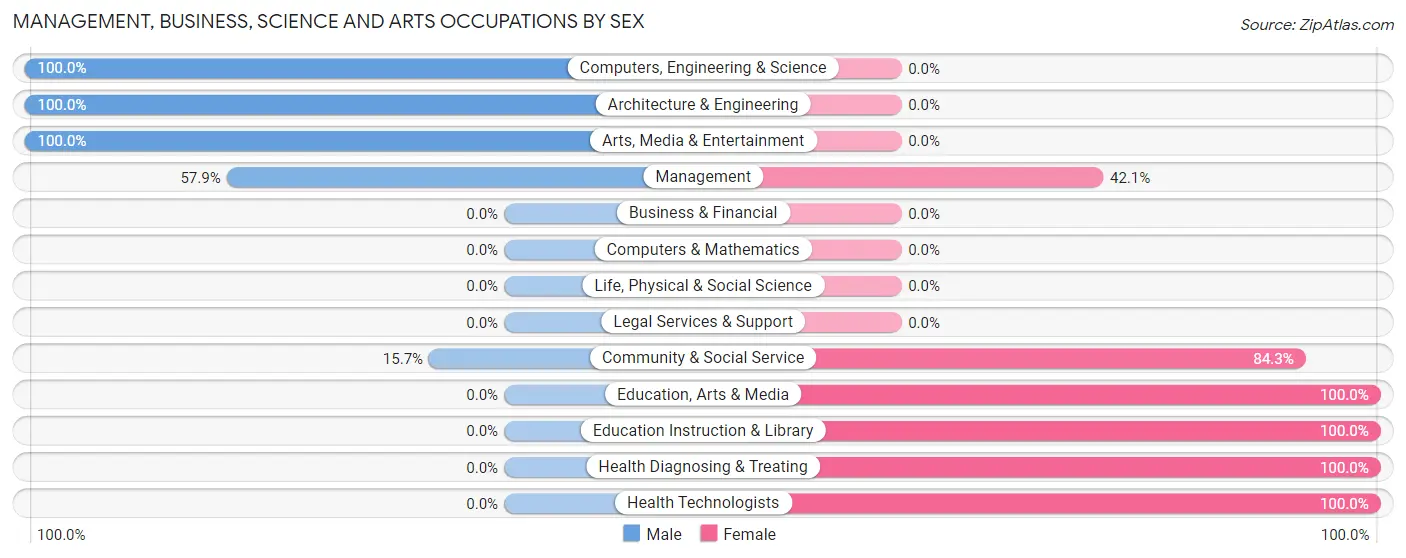
Management, Business, Science and Arts Occupations
The most common Management, Business, Science and Arts occupations in Bluewell are Computers, Engineering & Science (107 | 13.4%), Architecture & Engineering (107 | 13.4%), Community & Social Service (83 | 10.4%), Education Instruction & Library (63 | 7.9%), and Health Diagnosing & Treating (39 | 4.9%).
Management, Business, Science and Arts Occupations by Sex
Within the Management, Business, Science and Arts occupations in Bluewell, the most male-oriented occupations are Computers, Engineering & Science (100.0%), Architecture & Engineering (100.0%), and Arts, Media & Entertainment (100.0%), while the most female-oriented occupations are Education, Arts & Media (100.0%), Education Instruction & Library (100.0%), and Health Diagnosing & Treating (100.0%).
| Occupation | Male | Female |
| Management | 22 (57.9%) | 16 (42.1%) |
| Business & Financial | 0 (0.0%) | 0 (0.0%) |
| Computers, Engineering & Science | 107 (100.0%) | 0 (0.0%) |
| Computers & Mathematics | 0 (0.0%) | 0 (0.0%) |
| Architecture & Engineering | 107 (100.0%) | 0 (0.0%) |
| Life, Physical & Social Science | 0 (0.0%) | 0 (0.0%) |
| Community & Social Service | 13 (15.7%) | 70 (84.3%) |
| Education, Arts & Media | 0 (0.0%) | 7 (100.0%) |
| Legal Services & Support | 0 (0.0%) | 0 (0.0%) |
| Education Instruction & Library | 0 (0.0%) | 63 (100.0%) |
| Arts, Media & Entertainment | 13 (100.0%) | 0 (0.0%) |
| Health Diagnosing & Treating | 0 (0.0%) | 39 (100.0%) |
| Health Technologists | 0 (0.0%) | 39 (100.0%) |
| Total (Category) | 142 (53.2%) | 125 (46.8%) |
| Total (Overall) | 488 (61.0%) | 312 (39.0%) |
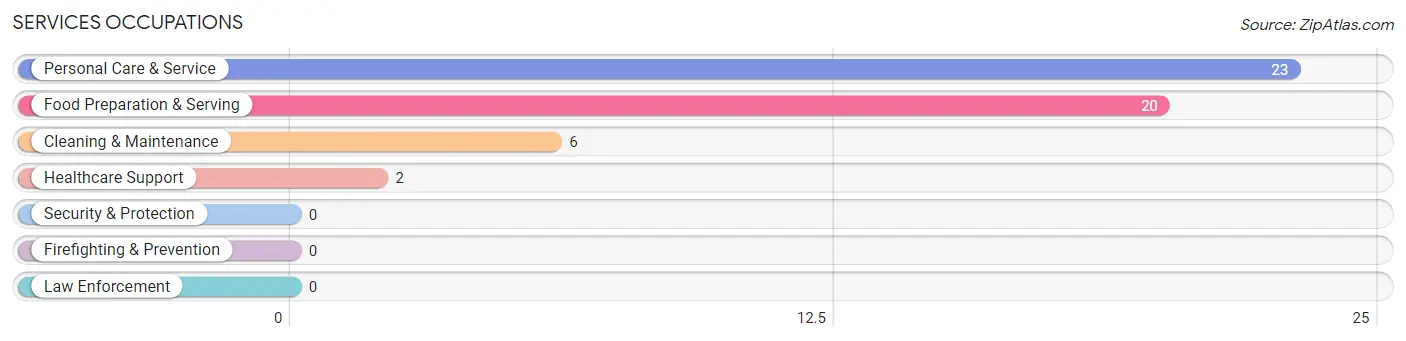
Services Occupations
The most common Services occupations in Bluewell are Personal Care & Service (23 | 2.9%), Food Preparation & Serving (20 | 2.5%), Cleaning & Maintenance (6 | 0.7%), and Healthcare Support (2 | 0.3%).
Services Occupations by Sex
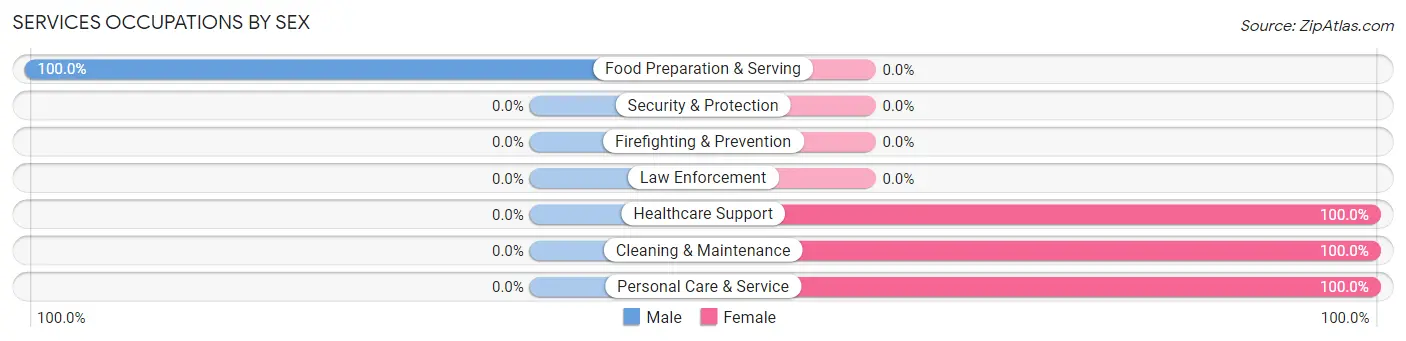
| Occupation | Male | Female |
| Healthcare Support | 0 (0.0%) | 2 (100.0%) |
| Security & Protection | 0 (0.0%) | 0 (0.0%) |
| Firefighting & Prevention | 0 (0.0%) | 0 (0.0%) |
| Law Enforcement | 0 (0.0%) | 0 (0.0%) |
| Food Preparation & Serving | 20 (100.0%) | 0 (0.0%) |
| Cleaning & Maintenance | 0 (0.0%) | 6 (100.0%) |
| Personal Care & Service | 0 (0.0%) | 23 (100.0%) |
| Total (Category) | 20 (39.2%) | 31 (60.8%) |
| Total (Overall) | 488 (61.0%) | 312 (39.0%) |
Sales and Office Occupations
The most common Sales and Office occupations in Bluewell are Office & Administration (169 | 21.1%), and Sales & Related (78 | 9.8%).

Sales and Office Occupations by Sex

| Occupation | Male | Female |
| Sales & Related | 62 (79.5%) | 16 (20.5%) |
| Office & Administration | 29 (17.2%) | 140 (82.8%) |
| Total (Category) | 91 (36.8%) | 156 (63.2%) |
| Total (Overall) | 488 (61.0%) | 312 (39.0%) |
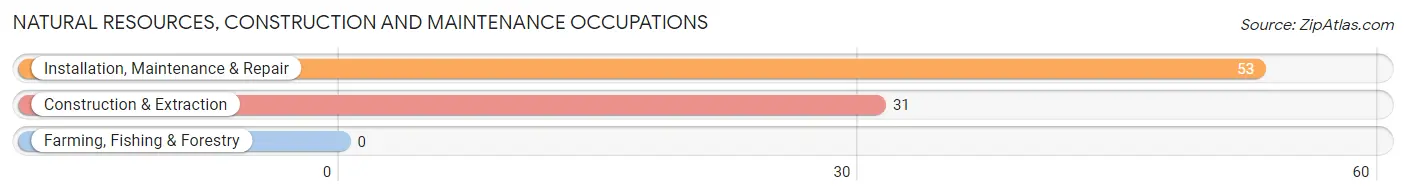
Natural Resources, Construction and Maintenance Occupations
The most common Natural Resources, Construction and Maintenance occupations in Bluewell are Installation, Maintenance & Repair (53 | 6.6%), and Construction & Extraction (31 | 3.9%).
Natural Resources, Construction and Maintenance Occupations by Sex
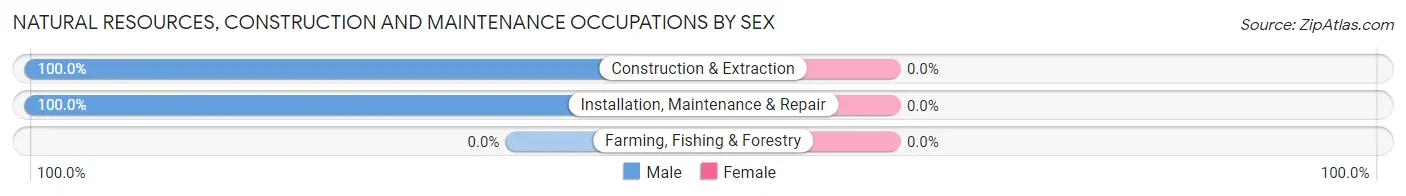
| Occupation | Male | Female |
| Farming, Fishing & Forestry | 0 (0.0%) | 0 (0.0%) |
| Construction & Extraction | 31 (100.0%) | 0 (0.0%) |
| Installation, Maintenance & Repair | 53 (100.0%) | 0 (0.0%) |
| Total (Category) | 84 (100.0%) | 0 (0.0%) |
| Total (Overall) | 488 (61.0%) | 312 (39.0%) |
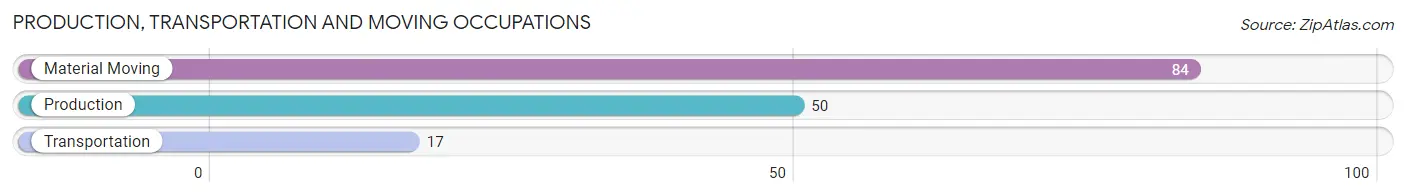
Production, Transportation and Moving Occupations
The most common Production, Transportation and Moving occupations in Bluewell are Material Moving (84 | 10.5%), Production (50 | 6.2%), and Transportation (17 | 2.1%).
Production, Transportation and Moving Occupations by Sex
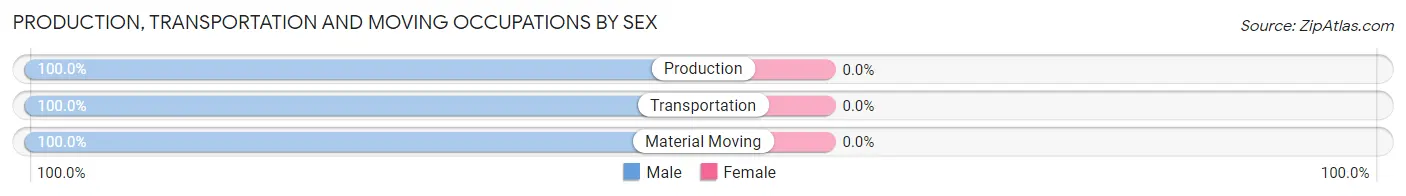
| Occupation | Male | Female |
| Production | 50 (100.0%) | 0 (0.0%) |
| Transportation | 17 (100.0%) | 0 (0.0%) |
| Material Moving | 84 (100.0%) | 0 (0.0%) |
| Total (Category) | 151 (100.0%) | 0 (0.0%) |
| Total (Overall) | 488 (61.0%) | 312 (39.0%) |
Employment Industries by Sex in Bluewell
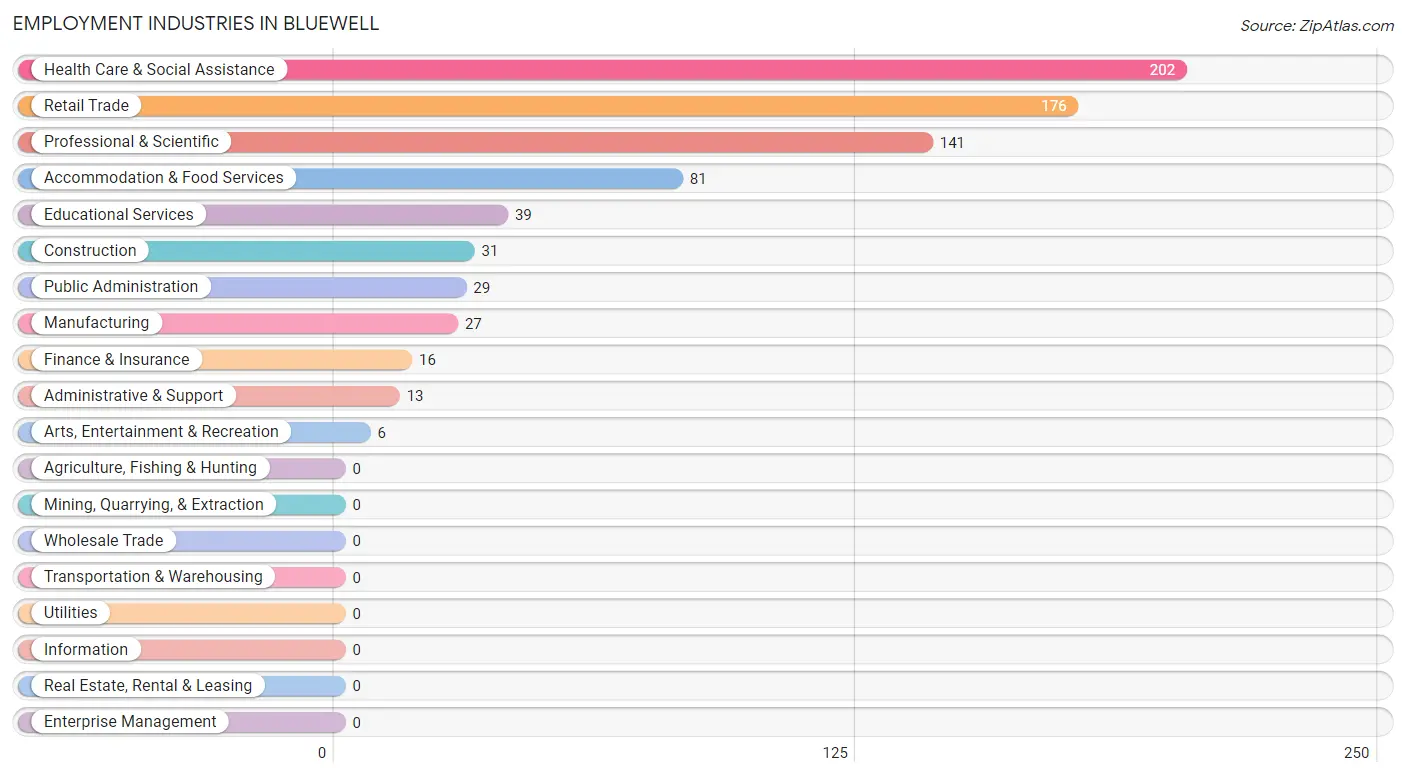
Employment Industries in Bluewell
The major employment industries in Bluewell include Health Care & Social Assistance (202 | 25.3%), Retail Trade (176 | 22.0%), Professional & Scientific (141 | 17.6%), Accommodation & Food Services (81 | 10.1%), and Educational Services (39 | 4.9%).
Employment Industries by Sex in Bluewell
The Bluewell industries that see more men than women are Construction (100.0%), Professional & Scientific (100.0%), and Administrative & Support (100.0%), whereas the industries that tend to have a higher number of women are Manufacturing (100.0%), Finance & Insurance (100.0%), and Arts, Entertainment & Recreation (100.0%).
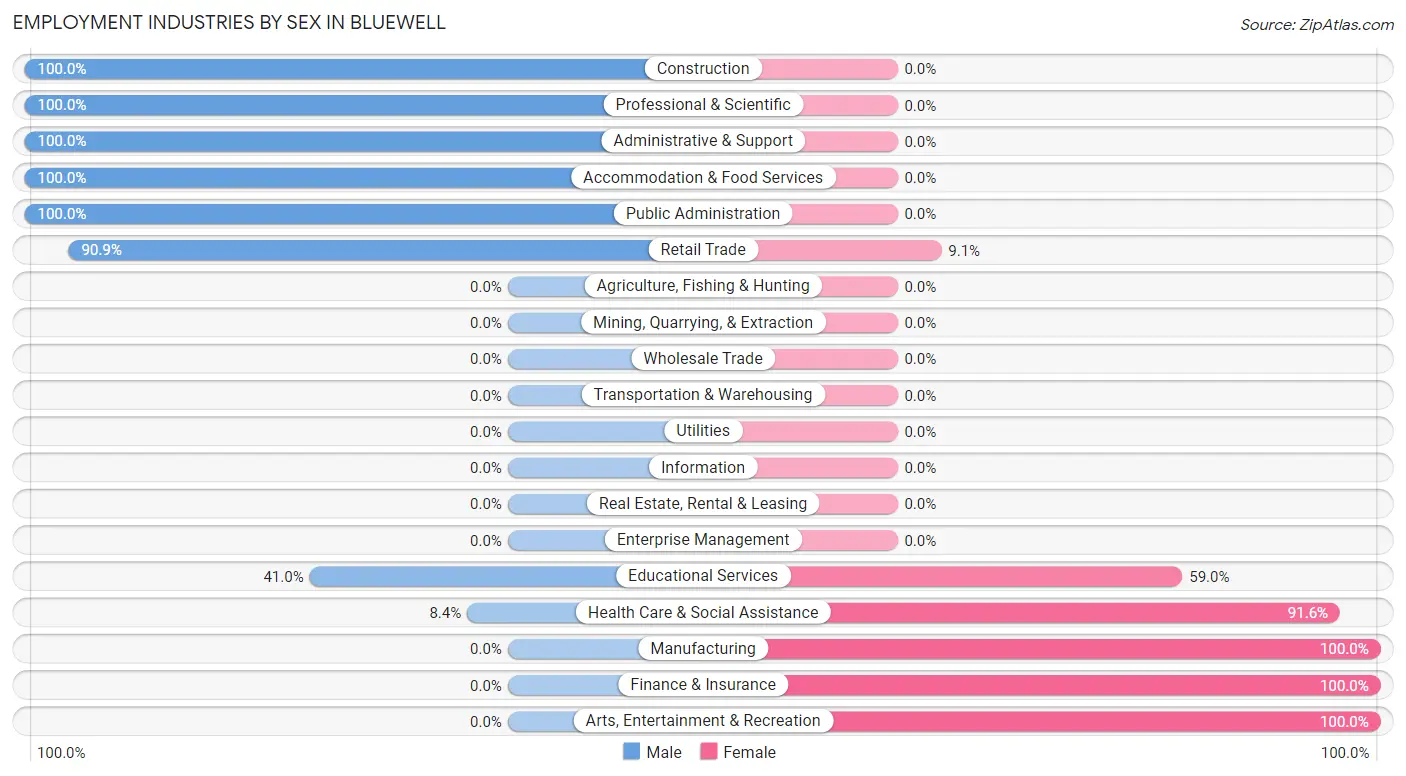
| Industry | Male | Female |
| Agriculture, Fishing & Hunting | 0 (0.0%) | 0 (0.0%) |
| Mining, Quarrying, & Extraction | 0 (0.0%) | 0 (0.0%) |
| Construction | 31 (100.0%) | 0 (0.0%) |
| Manufacturing | 0 (0.0%) | 27 (100.0%) |
| Wholesale Trade | 0 (0.0%) | 0 (0.0%) |
| Retail Trade | 160 (90.9%) | 16 (9.1%) |
| Transportation & Warehousing | 0 (0.0%) | 0 (0.0%) |
| Utilities | 0 (0.0%) | 0 (0.0%) |
| Information | 0 (0.0%) | 0 (0.0%) |
| Finance & Insurance | 0 (0.0%) | 16 (100.0%) |
| Real Estate, Rental & Leasing | 0 (0.0%) | 0 (0.0%) |
| Professional & Scientific | 141 (100.0%) | 0 (0.0%) |
| Enterprise Management | 0 (0.0%) | 0 (0.0%) |
| Administrative & Support | 13 (100.0%) | 0 (0.0%) |
| Educational Services | 16 (41.0%) | 23 (59.0%) |
| Health Care & Social Assistance | 17 (8.4%) | 185 (91.6%) |
| Arts, Entertainment & Recreation | 0 (0.0%) | 6 (100.0%) |
| Accommodation & Food Services | 81 (100.0%) | 0 (0.0%) |
| Public Administration | 29 (100.0%) | 0 (0.0%) |
| Total | 488 (61.0%) | 312 (39.0%) |
Education in Bluewell
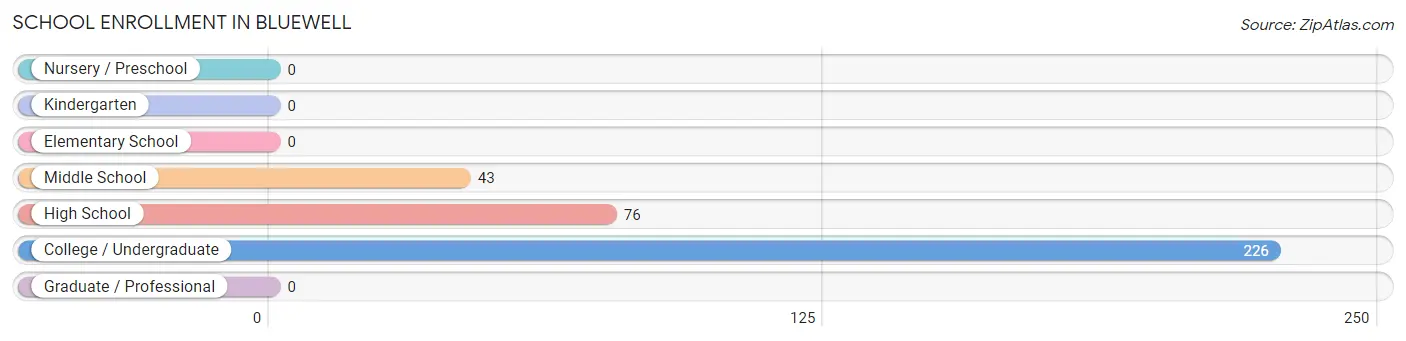
School Enrollment in Bluewell
The most common levels of schooling among the 345 students in Bluewell are college / undergraduate (226 | 65.5%), high school (76 | 22.0%), and middle school (43 | 12.5%).
| School Level | # Students | % Students |
| Nursery / Preschool | 0 | 0.0% |
| Kindergarten | 0 | 0.0% |
| Elementary School | 0 | 0.0% |
| Middle School | 43 | 12.5% |
| High School | 76 | 22.0% |
| College / Undergraduate | 226 | 65.5% |
| Graduate / Professional | 0 | 0.0% |
| Total | 345 | 100.0% |
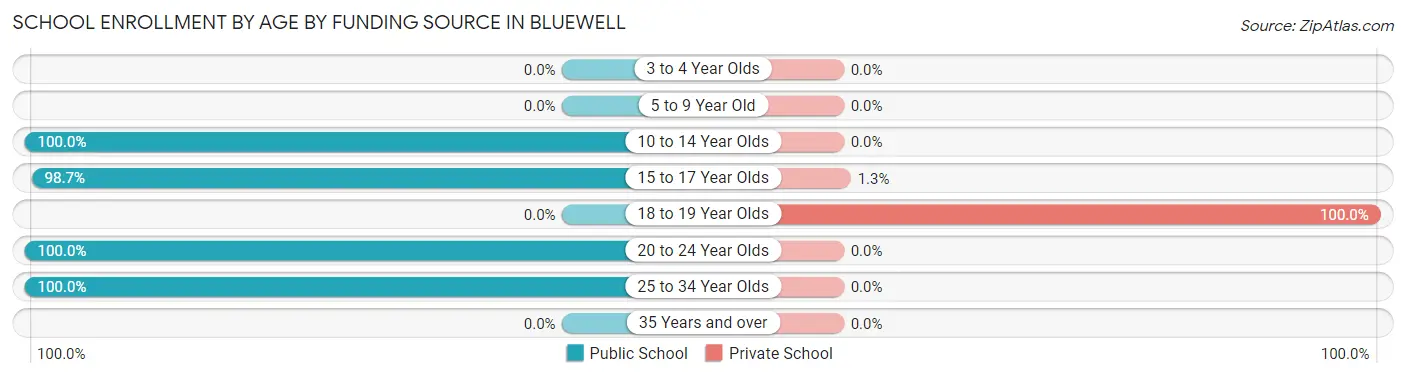
School Enrollment by Age by Funding Source in Bluewell
Out of a total of 345 students who are enrolled in schools in Bluewell, 98 (28.4%) attend a private institution, while the remaining 247 (71.6%) are enrolled in public schools. The age group of 18 to 19 year olds has the highest likelihood of being enrolled in private schools, with 97 (100.0% in the age bracket) enrolled. Conversely, the age group of 10 to 14 year olds has the lowest likelihood of being enrolled in a private school, with 43 (100.0% in the age bracket) attending a public institution.
| Age Bracket | Public School | Private School |
| 3 to 4 Year Olds | 0 (0.0%) | 0 (0.0%) |
| 5 to 9 Year Old | 0 (0.0%) | 0 (0.0%) |
| 10 to 14 Year Olds | 43 (100.0%) | 0 (0.0%) |
| 15 to 17 Year Olds | 75 (98.7%) | 1 (1.3%) |
| 18 to 19 Year Olds | 0 (0.0%) | 97 (100.0%) |
| 20 to 24 Year Olds | 107 (100.0%) | 0 (0.0%) |
| 25 to 34 Year Olds | 22 (100.0%) | 0 (0.0%) |
| 35 Years and over | 0 (0.0%) | 0 (0.0%) |
| Total | 247 (71.6%) | 98 (28.4%) |
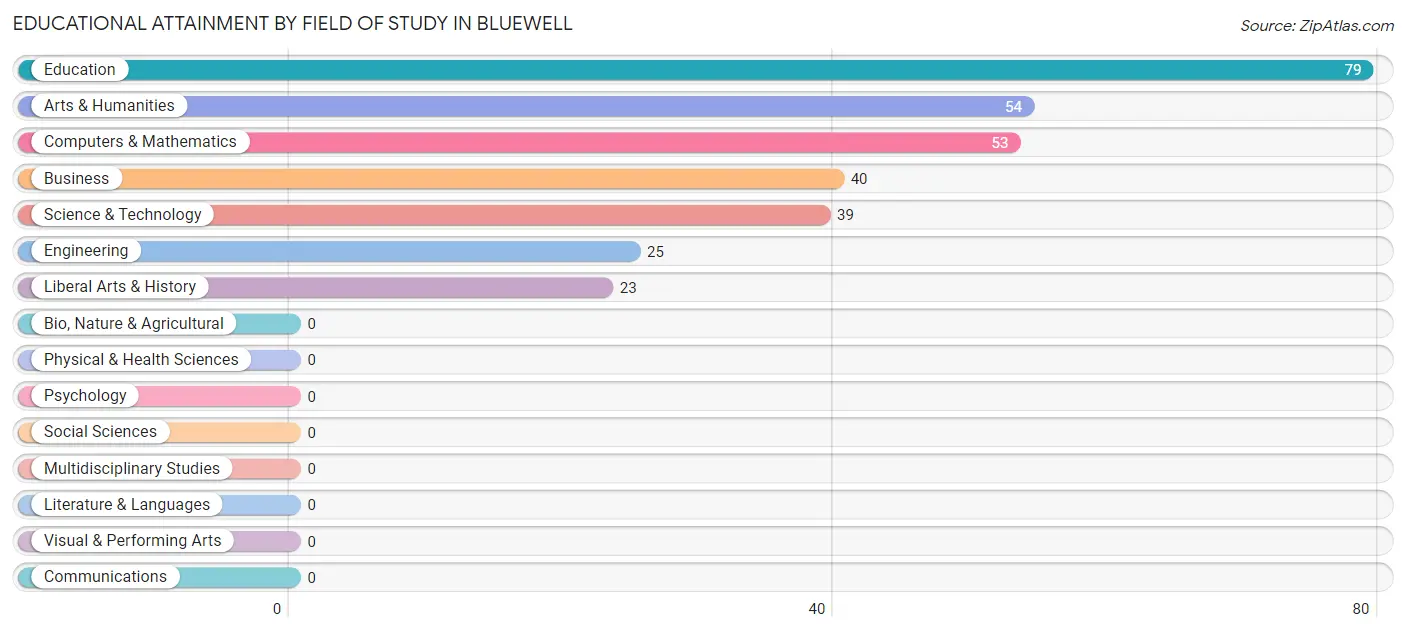
Educational Attainment by Field of Study in Bluewell
Education (79 | 25.2%), arts & humanities (54 | 17.2%), computers & mathematics (53 | 16.9%), business (40 | 12.8%), and science & technology (39 | 12.5%) are the most common fields of study among 313 individuals in Bluewell who have obtained a bachelor's degree or higher.
| Field of Study | # Graduates | % Graduates |
| Computers & Mathematics | 53 | 16.9% |
| Bio, Nature & Agricultural | 0 | 0.0% |
| Physical & Health Sciences | 0 | 0.0% |
| Psychology | 0 | 0.0% |
| Social Sciences | 0 | 0.0% |
| Engineering | 25 | 8.0% |
| Multidisciplinary Studies | 0 | 0.0% |
| Science & Technology | 39 | 12.5% |
| Business | 40 | 12.8% |
| Education | 79 | 25.2% |
| Literature & Languages | 0 | 0.0% |
| Liberal Arts & History | 23 | 7.3% |
| Visual & Performing Arts | 0 | 0.0% |
| Communications | 0 | 0.0% |
| Arts & Humanities | 54 | 17.2% |
| Total | 313 | 100.0% |
Transportation & Commute in Bluewell
Vehicle Availability by Sex in Bluewell
The most prevalent vehicle ownership categories in Bluewell are males with 2 vehicles (189, accounting for 38.7%) and females with 2 vehicles (194, making up 60.6%).
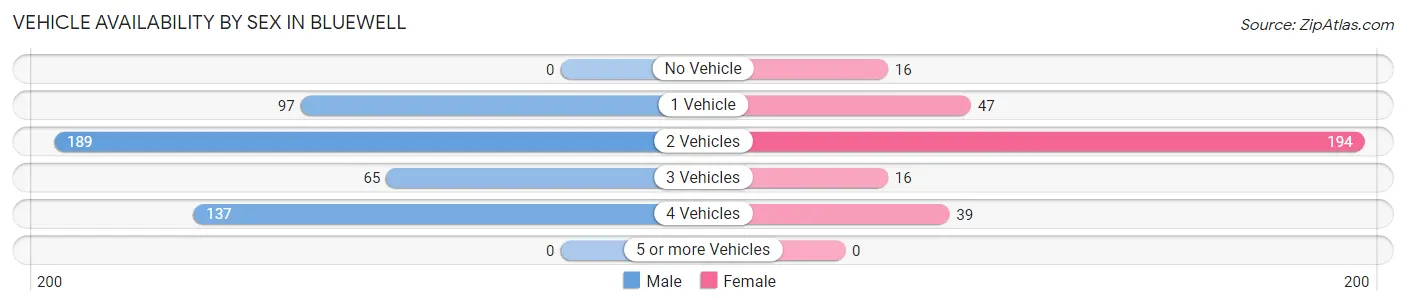
| Vehicles Available | Male | Female |
| No Vehicle | 0 (0.0%) | 16 (5.1%) |
| 1 Vehicle | 97 (19.9%) | 47 (15.1%) |
| 2 Vehicles | 189 (38.7%) | 194 (62.2%) |
| 3 Vehicles | 65 (13.3%) | 16 (5.1%) |
| 4 Vehicles | 137 (28.1%) | 39 (12.5%) |
| 5 or more Vehicles | 0 (0.0%) | 0 (0.0%) |
| Total | 488 (100.0%) | 312 (100.0%) |
Commute Time in Bluewell
The most frequently occuring commute durations in Bluewell are 20 to 24 minutes (209 commuters, 27.0%), 30 to 34 minutes (180 commuters, 23.3%), and 10 to 14 minutes (86 commuters, 11.1%).
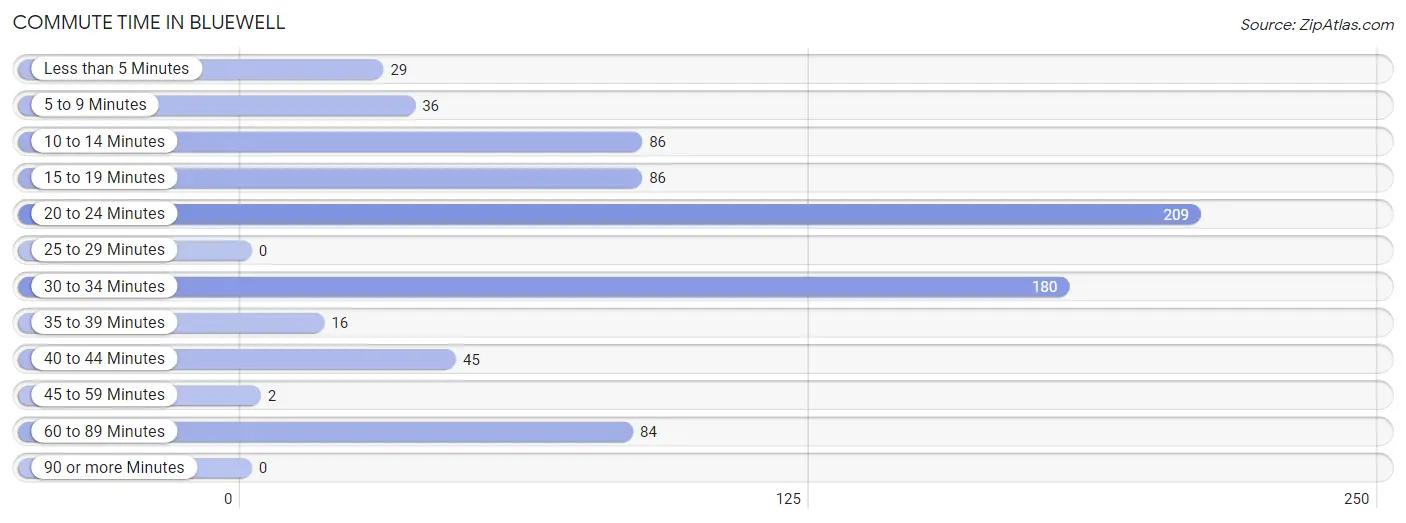
| Commute Time | # Commuters | % Commuters |
| Less than 5 Minutes | 29 | 3.7% |
| 5 to 9 Minutes | 36 | 4.7% |
| 10 to 14 Minutes | 86 | 11.1% |
| 15 to 19 Minutes | 86 | 11.1% |
| 20 to 24 Minutes | 209 | 27.0% |
| 25 to 29 Minutes | 0 | 0.0% |
| 30 to 34 Minutes | 180 | 23.3% |
| 35 to 39 Minutes | 16 | 2.1% |
| 40 to 44 Minutes | 45 | 5.8% |
| 45 to 59 Minutes | 2 | 0.3% |
| 60 to 89 Minutes | 84 | 10.9% |
| 90 or more Minutes | 0 | 0.0% |
Commute Time by Sex in Bluewell
The most common commute times in Bluewell are 30 to 34 minutes (180 commuters, 36.9%) for males and 20 to 24 minutes (97 commuters, 34.0%) for females.
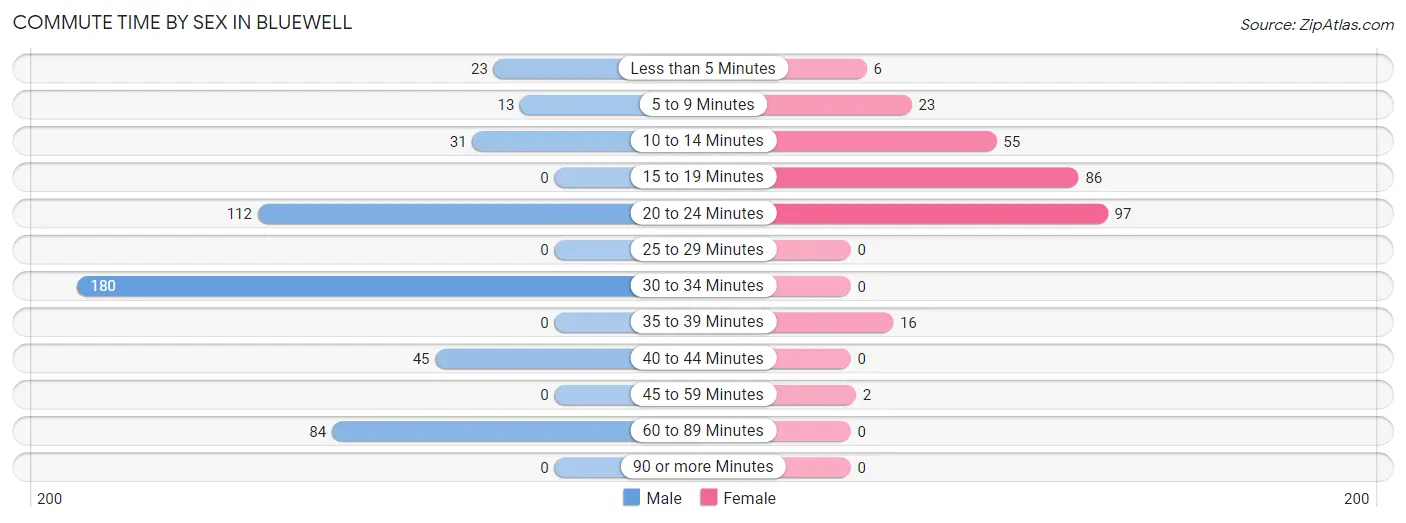
| Commute Time | Male | Female |
| Less than 5 Minutes | 23 (4.7%) | 6 (2.1%) |
| 5 to 9 Minutes | 13 (2.7%) | 23 (8.1%) |
| 10 to 14 Minutes | 31 (6.4%) | 55 (19.3%) |
| 15 to 19 Minutes | 0 (0.0%) | 86 (30.2%) |
| 20 to 24 Minutes | 112 (23.0%) | 97 (34.0%) |
| 25 to 29 Minutes | 0 (0.0%) | 0 (0.0%) |
| 30 to 34 Minutes | 180 (36.9%) | 0 (0.0%) |
| 35 to 39 Minutes | 0 (0.0%) | 16 (5.6%) |
| 40 to 44 Minutes | 45 (9.2%) | 0 (0.0%) |
| 45 to 59 Minutes | 0 (0.0%) | 2 (0.7%) |
| 60 to 89 Minutes | 84 (17.2%) | 0 (0.0%) |
| 90 or more Minutes | 0 (0.0%) | 0 (0.0%) |
Time of Departure to Work by Sex in Bluewell
The most frequent times of departure to work in Bluewell are 12:00 AM to 4:59 AM (159, 32.6%) for males and 7:30 AM to 7:59 AM (97, 34.0%) for females.
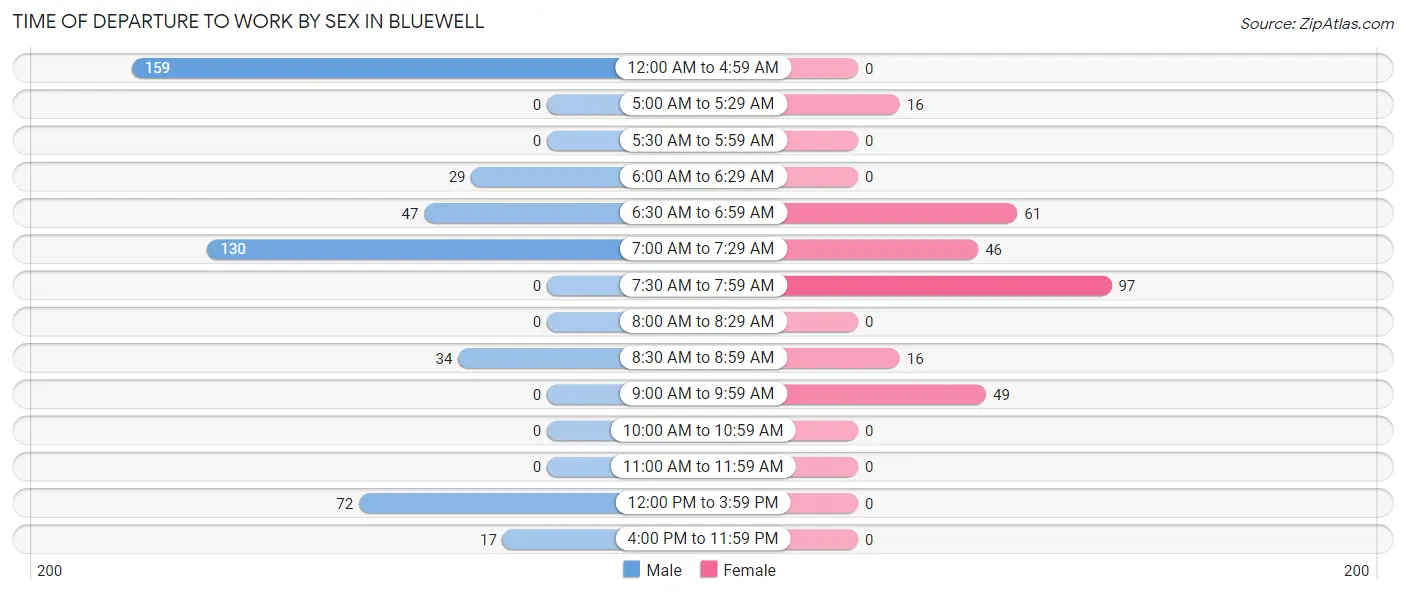
| Time of Departure | Male | Female |
| 12:00 AM to 4:59 AM | 159 (32.6%) | 0 (0.0%) |
| 5:00 AM to 5:29 AM | 0 (0.0%) | 16 (5.6%) |
| 5:30 AM to 5:59 AM | 0 (0.0%) | 0 (0.0%) |
| 6:00 AM to 6:29 AM | 29 (5.9%) | 0 (0.0%) |
| 6:30 AM to 6:59 AM | 47 (9.6%) | 61 (21.4%) |
| 7:00 AM to 7:29 AM | 130 (26.6%) | 46 (16.1%) |
| 7:30 AM to 7:59 AM | 0 (0.0%) | 97 (34.0%) |
| 8:00 AM to 8:29 AM | 0 (0.0%) | 0 (0.0%) |
| 8:30 AM to 8:59 AM | 34 (7.0%) | 16 (5.6%) |
| 9:00 AM to 9:59 AM | 0 (0.0%) | 49 (17.2%) |
| 10:00 AM to 10:59 AM | 0 (0.0%) | 0 (0.0%) |
| 11:00 AM to 11:59 AM | 0 (0.0%) | 0 (0.0%) |
| 12:00 PM to 3:59 PM | 72 (14.7%) | 0 (0.0%) |
| 4:00 PM to 11:59 PM | 17 (3.5%) | 0 (0.0%) |
| Total | 488 (100.0%) | 285 (100.0%) |
Housing Occupancy in Bluewell
Occupancy by Ownership in Bluewell
Of the total 1,116 dwellings in Bluewell, owner-occupied units account for 837 (75.0%), while renter-occupied units make up 279 (25.0%).
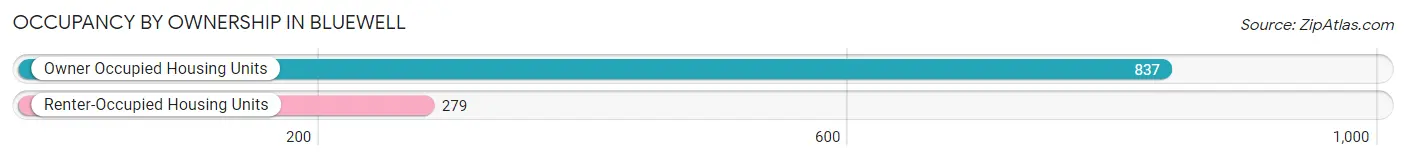
| Occupancy | # Housing Units | % Housing Units |
| Owner Occupied Housing Units | 837 | 75.0% |
| Renter-Occupied Housing Units | 279 | 25.0% |
| Total Occupied Housing Units | 1,116 | 100.0% |
Occupancy by Household Size in Bluewell
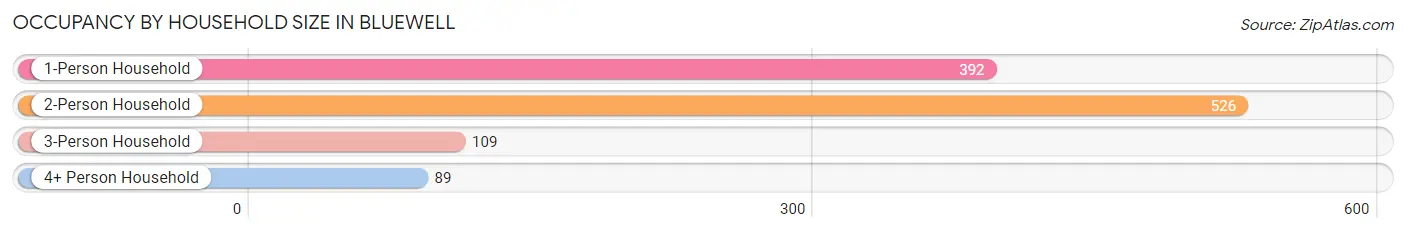
| Household Size | # Housing Units | % Housing Units |
| 1-Person Household | 392 | 35.1% |
| 2-Person Household | 526 | 47.1% |
| 3-Person Household | 109 | 9.8% |
| 4+ Person Household | 89 | 8.0% |
| Total Housing Units | 1,116 | 100.0% |
Occupancy by Ownership by Household Size in Bluewell
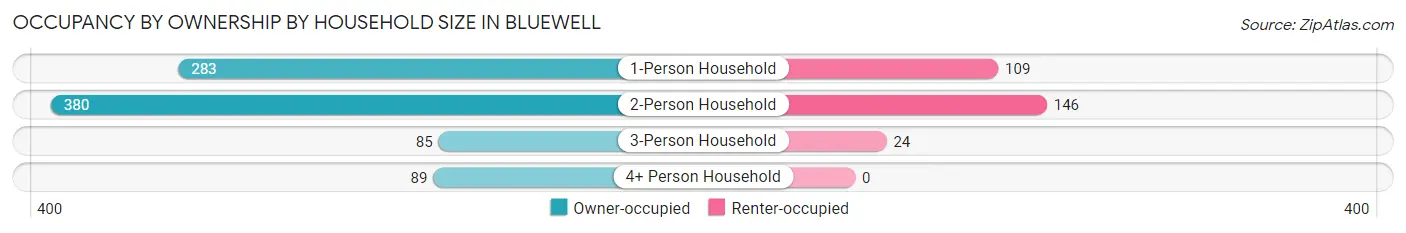
| Household Size | Owner-occupied | Renter-occupied |
| 1-Person Household | 283 (72.2%) | 109 (27.8%) |
| 2-Person Household | 380 (72.2%) | 146 (27.8%) |
| 3-Person Household | 85 (78.0%) | 24 (22.0%) |
| 4+ Person Household | 89 (100.0%) | 0 (0.0%) |
| Total Housing Units | 837 (75.0%) | 279 (25.0%) |
Occupancy by Educational Attainment in Bluewell
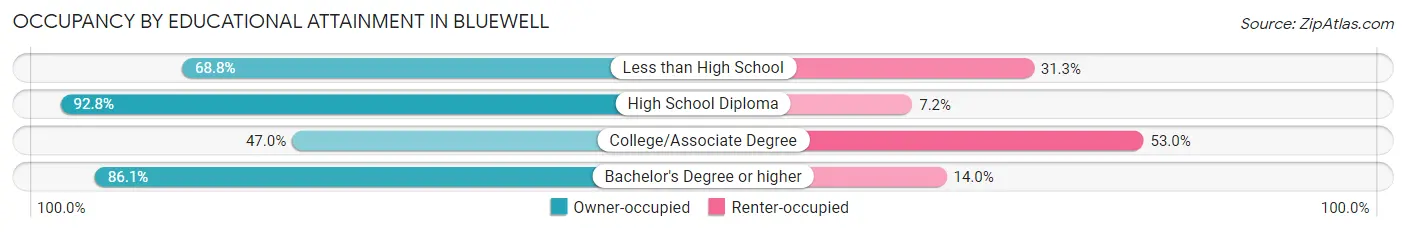
| Household Size | Owner-occupied | Renter-occupied |
| Less than High School | 209 (68.8%) | 95 (31.2%) |
| High School Diploma | 363 (92.8%) | 28 (7.2%) |
| College/Associate Degree | 117 (47.0%) | 132 (53.0%) |
| Bachelor's Degree or higher | 148 (86.1%) | 24 (14.0%) |
Occupancy by Age of Householder in Bluewell
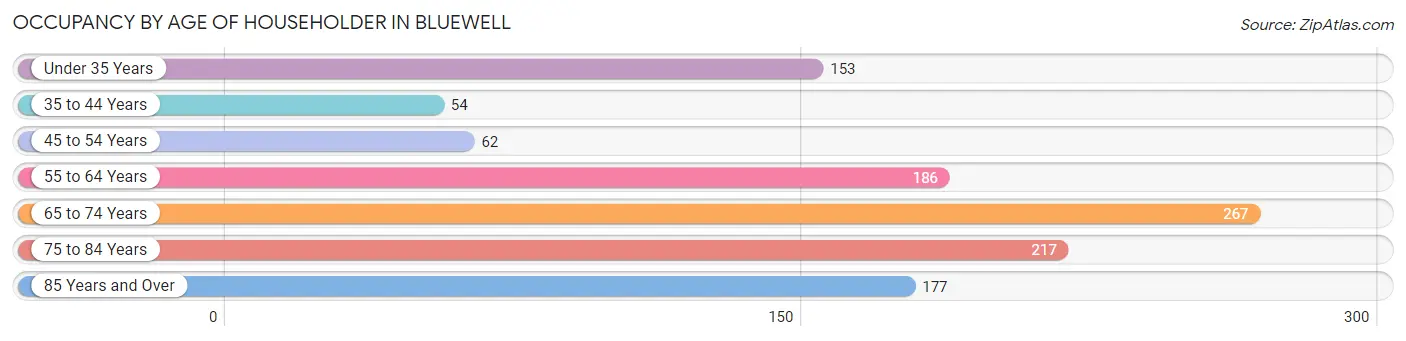
| Age Bracket | # Households | % Households |
| Under 35 Years | 153 | 13.7% |
| 35 to 44 Years | 54 | 4.8% |
| 45 to 54 Years | 62 | 5.6% |
| 55 to 64 Years | 186 | 16.7% |
| 65 to 74 Years | 267 | 23.9% |
| 75 to 84 Years | 217 | 19.4% |
| 85 Years and Over | 177 | 15.9% |
| Total | 1,116 | 100.0% |
Housing Finances in Bluewell
Median Income by Occupancy in Bluewell
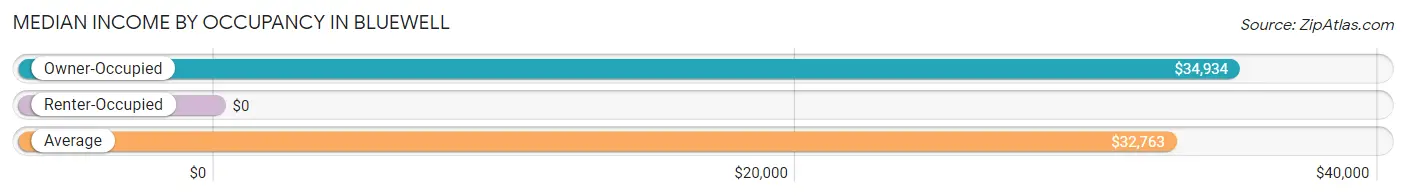
| Occupancy Type | # Households | Median Income |
| Owner-Occupied | 837 (75.0%) | $34,934 |
| Renter-Occupied | 279 (25.0%) | $0 |
| Average | 1,116 (100.0%) | $32,763 |
Occupancy by Householder Income Bracket in Bluewell
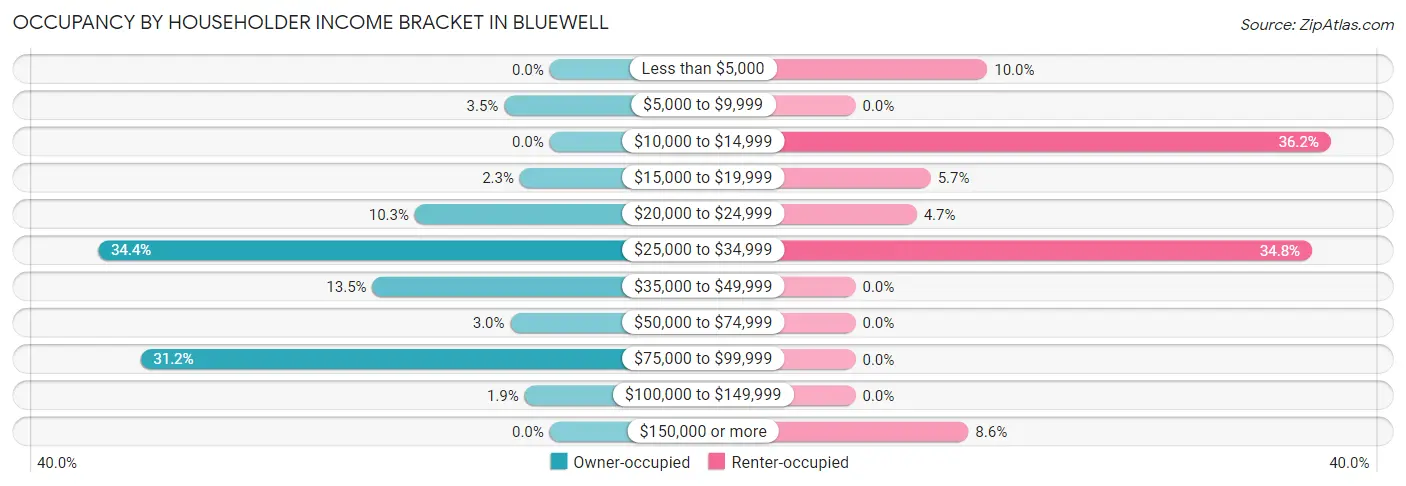
| Income Bracket | Owner-occupied | Renter-occupied |
| Less than $5,000 | 0 (0.0%) | 28 (10.0%) |
| $5,000 to $9,999 | 29 (3.5%) | 0 (0.0%) |
| $10,000 to $14,999 | 0 (0.0%) | 101 (36.2%) |
| $15,000 to $19,999 | 19 (2.3%) | 16 (5.7%) |
| $20,000 to $24,999 | 86 (10.3%) | 13 (4.7%) |
| $25,000 to $34,999 | 288 (34.4%) | 97 (34.8%) |
| $35,000 to $49,999 | 113 (13.5%) | 0 (0.0%) |
| $50,000 to $74,999 | 25 (3.0%) | 0 (0.0%) |
| $75,000 to $99,999 | 261 (31.2%) | 0 (0.0%) |
| $100,000 to $149,999 | 16 (1.9%) | 0 (0.0%) |
| $150,000 or more | 0 (0.0%) | 24 (8.6%) |
| Total | 837 (100.0%) | 279 (100.0%) |
Monthly Housing Cost Tiers in Bluewell
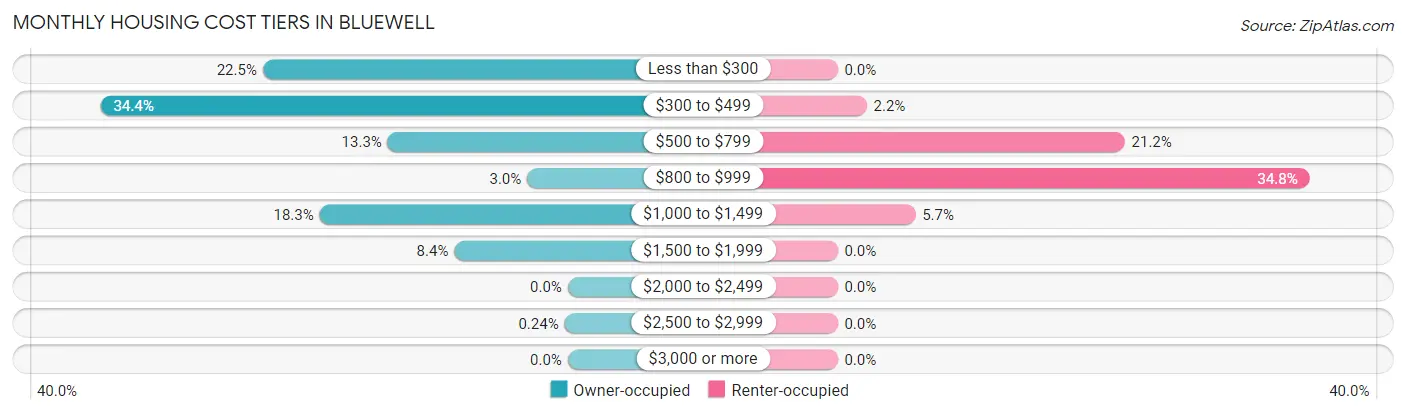
| Monthly Cost | Owner-occupied | Renter-occupied |
| Less than $300 | 188 (22.5%) | 0 (0.0%) |
| $300 to $499 | 288 (34.4%) | 6 (2.1%) |
| $500 to $799 | 111 (13.3%) | 59 (21.1%) |
| $800 to $999 | 25 (3.0%) | 97 (34.8%) |
| $1,000 to $1,499 | 153 (18.3%) | 16 (5.7%) |
| $1,500 to $1,999 | 70 (8.4%) | 0 (0.0%) |
| $2,000 to $2,499 | 0 (0.0%) | 0 (0.0%) |
| $2,500 to $2,999 | 2 (0.2%) | 0 (0.0%) |
| $3,000 or more | 0 (0.0%) | 0 (0.0%) |
| Total | 837 (100.0%) | 279 (100.0%) |
Physical Housing Characteristics in Bluewell
Housing Structures in Bluewell
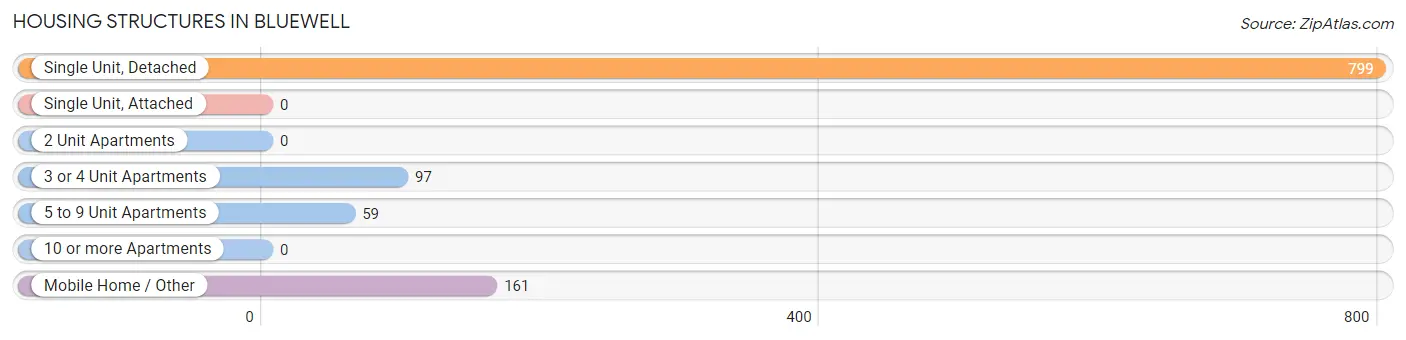
| Structure Type | # Housing Units | % Housing Units |
| Single Unit, Detached | 799 | 71.6% |
| Single Unit, Attached | 0 | 0.0% |
| 2 Unit Apartments | 0 | 0.0% |
| 3 or 4 Unit Apartments | 97 | 8.7% |
| 5 to 9 Unit Apartments | 59 | 5.3% |
| 10 or more Apartments | 0 | 0.0% |
| Mobile Home / Other | 161 | 14.4% |
| Total | 1,116 | 100.0% |
Housing Structures by Occupancy in Bluewell
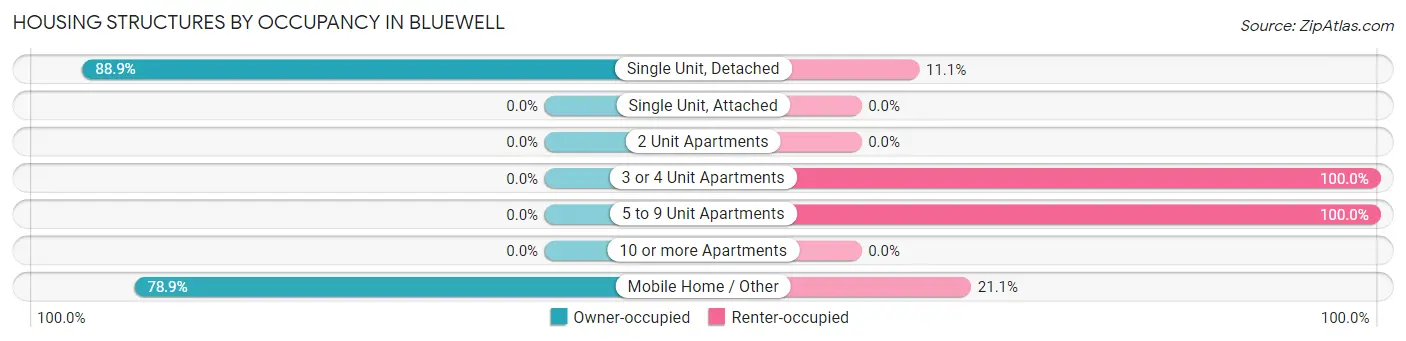
| Structure Type | Owner-occupied | Renter-occupied |
| Single Unit, Detached | 710 (88.9%) | 89 (11.1%) |
| Single Unit, Attached | 0 (0.0%) | 0 (0.0%) |
| 2 Unit Apartments | 0 (0.0%) | 0 (0.0%) |
| 3 or 4 Unit Apartments | 0 (0.0%) | 97 (100.0%) |
| 5 to 9 Unit Apartments | 0 (0.0%) | 59 (100.0%) |
| 10 or more Apartments | 0 (0.0%) | 0 (0.0%) |
| Mobile Home / Other | 127 (78.9%) | 34 (21.1%) |
| Total | 837 (75.0%) | 279 (25.0%) |
Housing Structures by Number of Rooms in Bluewell
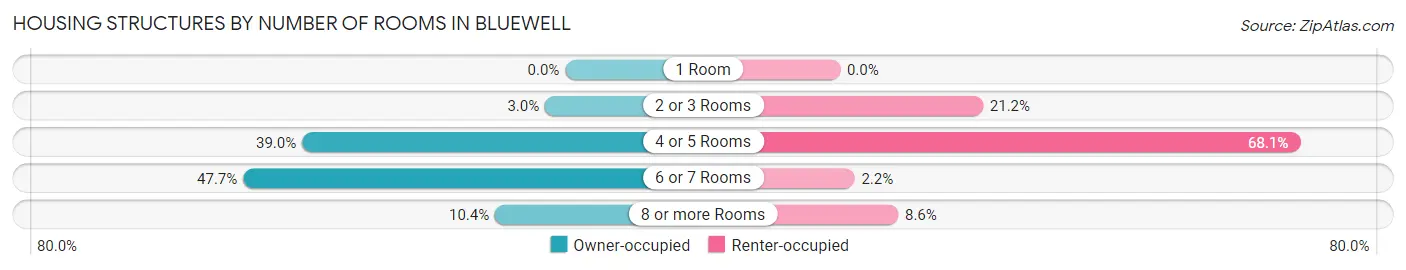
| Number of Rooms | Owner-occupied | Renter-occupied |
| 1 Room | 0 (0.0%) | 0 (0.0%) |
| 2 or 3 Rooms | 25 (3.0%) | 59 (21.1%) |
| 4 or 5 Rooms | 326 (39.0%) | 190 (68.1%) |
| 6 or 7 Rooms | 399 (47.7%) | 6 (2.1%) |
| 8 or more Rooms | 87 (10.4%) | 24 (8.6%) |
| Total | 837 (100.0%) | 279 (100.0%) |
Housing Structure by Heating Type in Bluewell
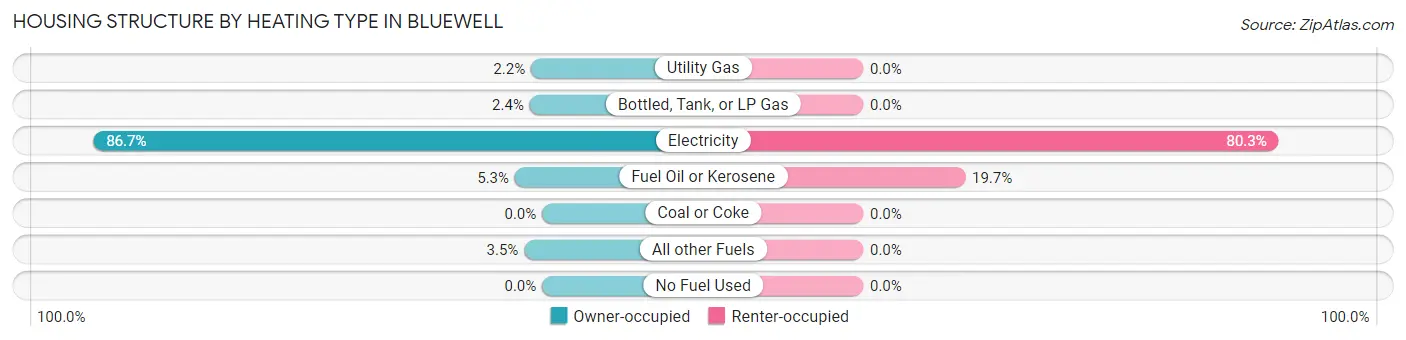
| Heating Type | Owner-occupied | Renter-occupied |
| Utility Gas | 18 (2.1%) | 0 (0.0%) |
| Bottled, Tank, or LP Gas | 20 (2.4%) | 0 (0.0%) |
| Electricity | 726 (86.7%) | 224 (80.3%) |
| Fuel Oil or Kerosene | 44 (5.3%) | 55 (19.7%) |
| Coal or Coke | 0 (0.0%) | 0 (0.0%) |
| All other Fuels | 29 (3.5%) | 0 (0.0%) |
| No Fuel Used | 0 (0.0%) | 0 (0.0%) |
| Total | 837 (100.0%) | 279 (100.0%) |
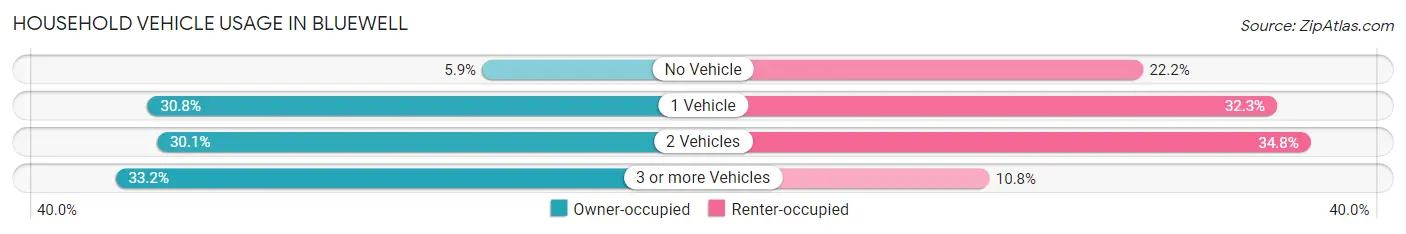
Household Vehicle Usage in Bluewell
| Vehicles per Household | Owner-occupied | Renter-occupied |
| No Vehicle | 49 (5.9%) | 62 (22.2%) |
| 1 Vehicle | 258 (30.8%) | 90 (32.3%) |
| 2 Vehicles | 252 (30.1%) | 97 (34.8%) |
| 3 or more Vehicles | 278 (33.2%) | 30 (10.7%) |
| Total | 837 (100.0%) | 279 (100.0%) |
Real Estate & Mortgages in Bluewell
Real Estate and Mortgage Overview in Bluewell
| Characteristic | Without Mortgage | With Mortgage |
| Housing Units | 507 | 330 |
| Median Property Value | $69,900 | $236,100 |
| Median Household Income | $36,636 | $0 |
| Monthly Housing Costs | $338 | $0 |
| Real Estate Taxes | $467 | $0 |
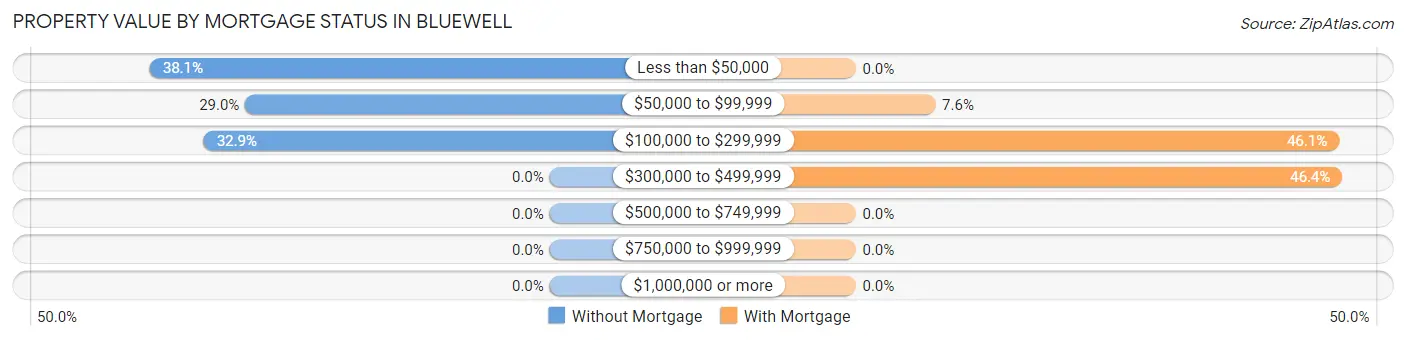
Property Value by Mortgage Status in Bluewell
| Property Value | Without Mortgage | With Mortgage |
| Less than $50,000 | 193 (38.1%) | 0 (0.0%) |
| $50,000 to $99,999 | 147 (29.0%) | 25 (7.6%) |
| $100,000 to $299,999 | 167 (32.9%) | 152 (46.1%) |
| $300,000 to $499,999 | 0 (0.0%) | 153 (46.4%) |
| $500,000 to $749,999 | 0 (0.0%) | 0 (0.0%) |
| $750,000 to $999,999 | 0 (0.0%) | 0 (0.0%) |
| $1,000,000 or more | 0 (0.0%) | 0 (0.0%) |
| Total | 507 (100.0%) | 330 (100.0%) |
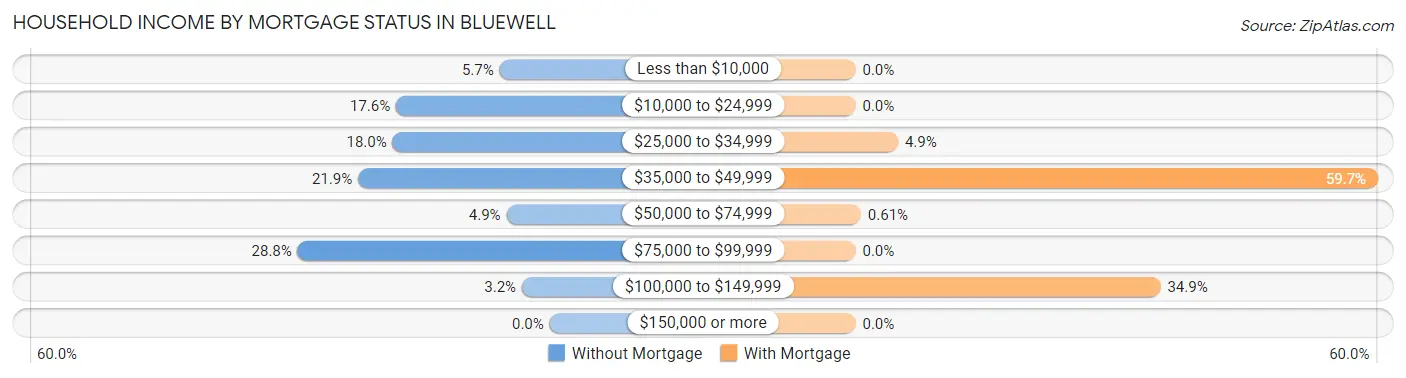
Household Income by Mortgage Status in Bluewell
| Household Income | Without Mortgage | With Mortgage |
| Less than $10,000 | 29 (5.7%) | 0 (0.0%) |
| $10,000 to $24,999 | 89 (17.5%) | 0 (0.0%) |
| $25,000 to $34,999 | 91 (17.9%) | 16 (4.9%) |
| $35,000 to $49,999 | 111 (21.9%) | 197 (59.7%) |
| $50,000 to $74,999 | 25 (4.9%) | 2 (0.6%) |
| $75,000 to $99,999 | 146 (28.8%) | 0 (0.0%) |
| $100,000 to $149,999 | 16 (3.2%) | 115 (34.8%) |
| $150,000 or more | 0 (0.0%) | 0 (0.0%) |
| Total | 507 (100.0%) | 330 (100.0%) |
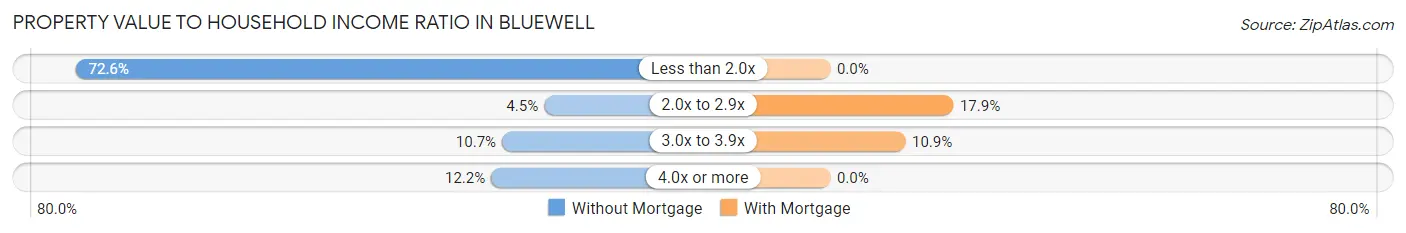
Property Value to Household Income Ratio in Bluewell
| Value-to-Income Ratio | Without Mortgage | With Mortgage |
| Less than 2.0x | 368 (72.6%) | 0 (0.0%) |
| 2.0x to 2.9x | 23 (4.5%) | 59 (17.9%) |
| 3.0x to 3.9x | 54 (10.6%) | 36 (10.9%) |
| 4.0x or more | 62 (12.2%) | 0 (0.0%) |
| Total | 507 (100.0%) | 330 (100.0%) |
Real Estate Taxes by Mortgage Status in Bluewell
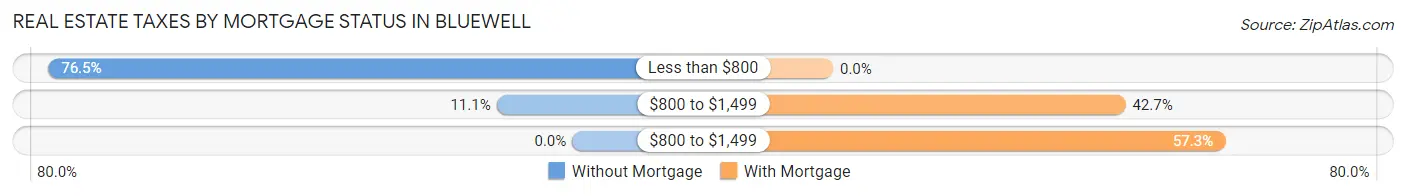
| Property Taxes | Without Mortgage | With Mortgage |
| Less than $800 | 388 (76.5%) | 0 (0.0%) |
| $800 to $1,499 | 56 (11.1%) | 141 (42.7%) |
| $800 to $1,499 | 0 (0.0%) | 189 (57.3%) |
| Total | 507 (100.0%) | 330 (100.0%) |
Health & Disability in Bluewell
Health Insurance Coverage by Age in Bluewell
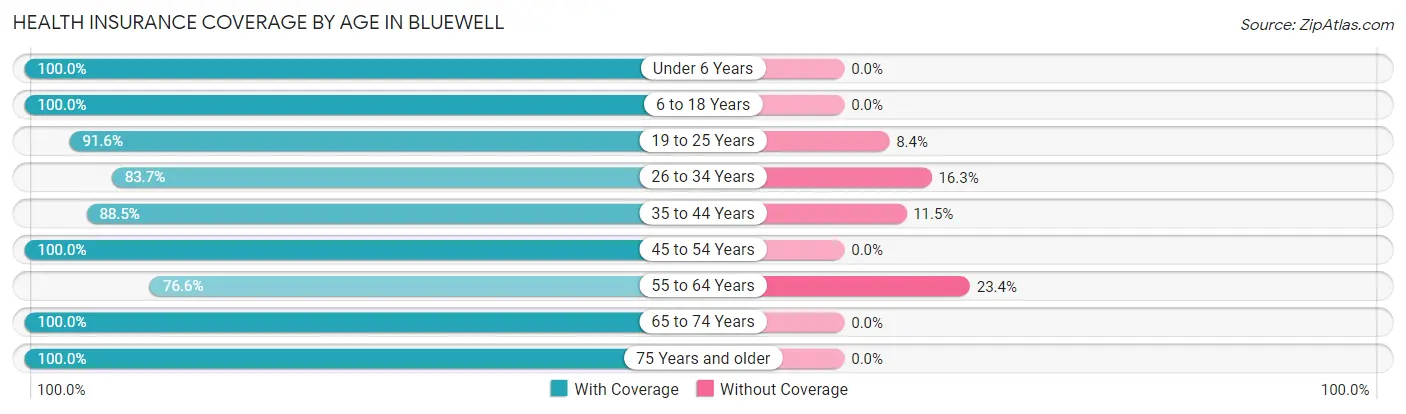
| Age Bracket | With Coverage | Without Coverage |
| Under 6 Years | 148 (100.0%) | 0 (0.0%) |
| 6 to 18 Years | 152 (100.0%) | 0 (0.0%) |
| 19 to 25 Years | 317 (91.6%) | 29 (8.4%) |
| 26 to 34 Years | 103 (83.7%) | 20 (16.3%) |
| 35 to 44 Years | 161 (88.5%) | 21 (11.5%) |
| 45 to 54 Years | 168 (100.0%) | 0 (0.0%) |
| 55 to 64 Years | 216 (76.6%) | 66 (23.4%) |
| 65 to 74 Years | 445 (100.0%) | 0 (0.0%) |
| 75 Years and older | 523 (100.0%) | 0 (0.0%) |
| Total | 2,233 (94.3%) | 136 (5.7%) |
Health Insurance Coverage by Citizenship Status in Bluewell
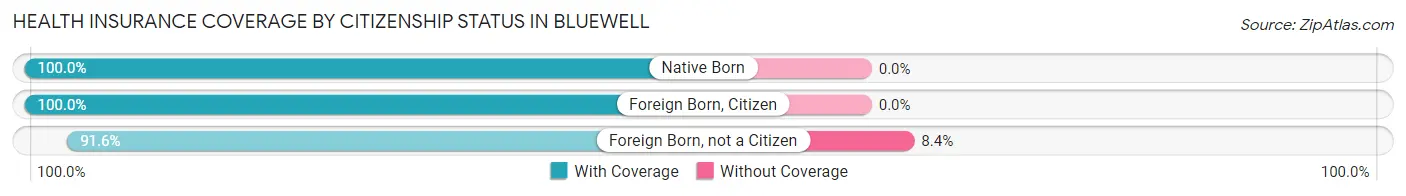
| Citizenship Status | With Coverage | Without Coverage |
| Native Born | 148 (100.0%) | 0 (0.0%) |
| Foreign Born, Citizen | 152 (100.0%) | 0 (0.0%) |
| Foreign Born, not a Citizen | 317 (91.6%) | 29 (8.4%) |
Health Insurance Coverage by Household Income in Bluewell
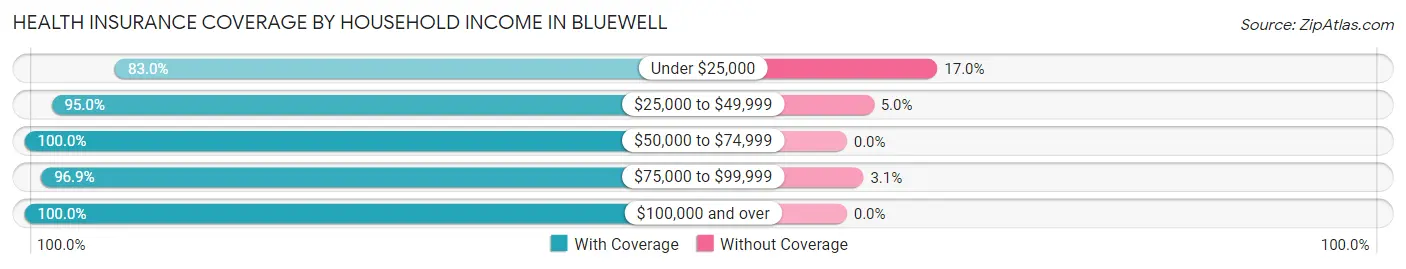
| Household Income | With Coverage | Without Coverage |
| Under $25,000 | 323 (83.0%) | 66 (17.0%) |
| $25,000 to $49,999 | 772 (95.0%) | 41 (5.0%) |
| $50,000 to $74,999 | 121 (100.0%) | 0 (0.0%) |
| $75,000 to $99,999 | 899 (96.9%) | 29 (3.1%) |
| $100,000 and over | 118 (100.0%) | 0 (0.0%) |
Public vs Private Health Insurance Coverage by Age in Bluewell
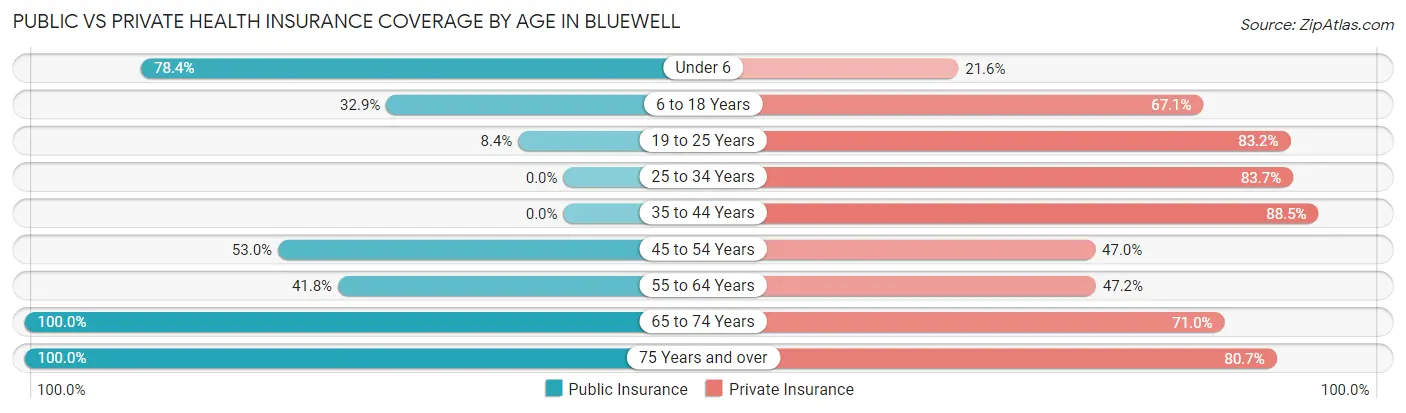
| Age Bracket | Public Insurance | Private Insurance |
| Under 6 | 116 (78.4%) | 32 (21.6%) |
| 6 to 18 Years | 50 (32.9%) | 102 (67.1%) |
| 19 to 25 Years | 29 (8.4%) | 288 (83.2%) |
| 25 to 34 Years | 0 (0.0%) | 103 (83.7%) |
| 35 to 44 Years | 0 (0.0%) | 161 (88.5%) |
| 45 to 54 Years | 89 (53.0%) | 79 (47.0%) |
| 55 to 64 Years | 118 (41.8%) | 133 (47.2%) |
| 65 to 74 Years | 445 (100.0%) | 316 (71.0%) |
| 75 Years and over | 523 (100.0%) | 422 (80.7%) |
| Total | 1,370 (57.8%) | 1,636 (69.1%) |
Disability Status by Sex by Age in Bluewell
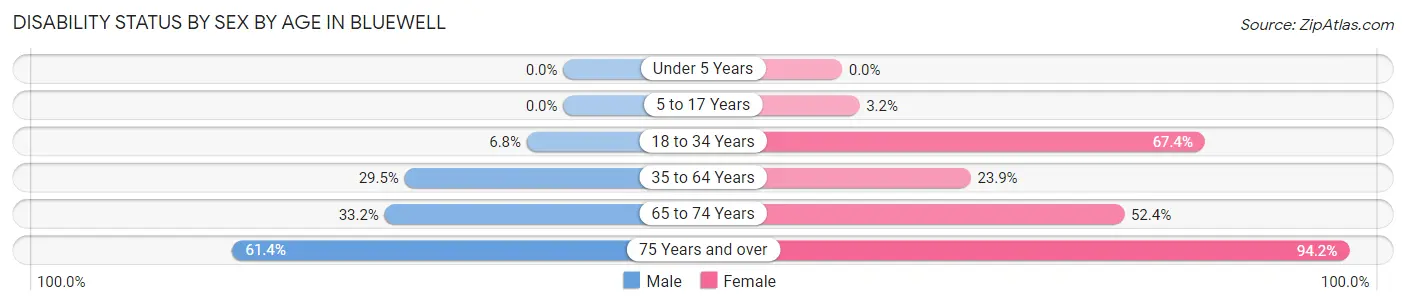
| Age Bracket | Male | Female |
| Under 5 Years | 0 (0.0%) | 0 (0.0%) |
| 5 to 17 Years | 0 (0.0%) | 1 (3.2%) |
| 18 to 34 Years | 22 (6.8%) | 97 (67.4%) |
| 35 to 64 Years | 101 (29.4%) | 69 (23.9%) |
| 65 to 74 Years | 64 (33.2%) | 132 (52.4%) |
| 75 Years and over | 132 (61.4%) | 290 (94.2%) |
Disability Class by Sex by Age in Bluewell
Disability Class: Hearing Difficulty
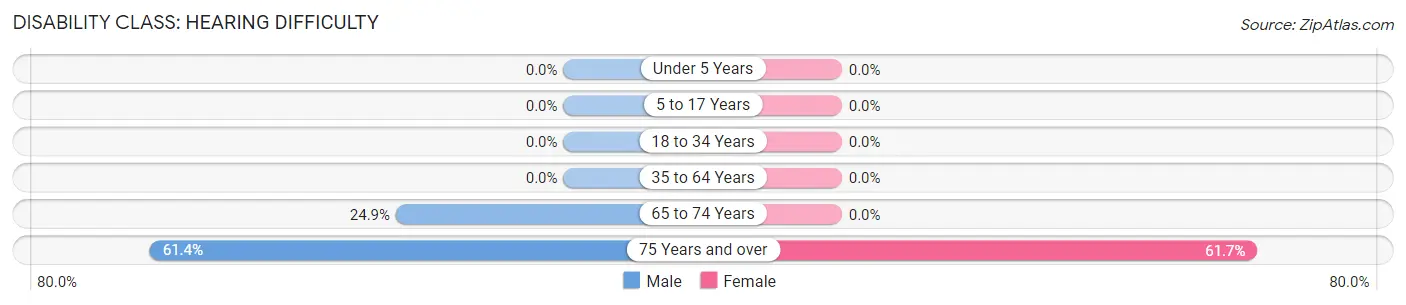
| Age Bracket | Male | Female |
| Under 5 Years | 0 (0.0%) | 0 (0.0%) |
| 5 to 17 Years | 0 (0.0%) | 0 (0.0%) |
| 18 to 34 Years | 0 (0.0%) | 0 (0.0%) |
| 35 to 64 Years | 0 (0.0%) | 0 (0.0%) |
| 65 to 74 Years | 48 (24.9%) | 0 (0.0%) |
| 75 Years and over | 132 (61.4%) | 190 (61.7%) |
Disability Class: Vision Difficulty
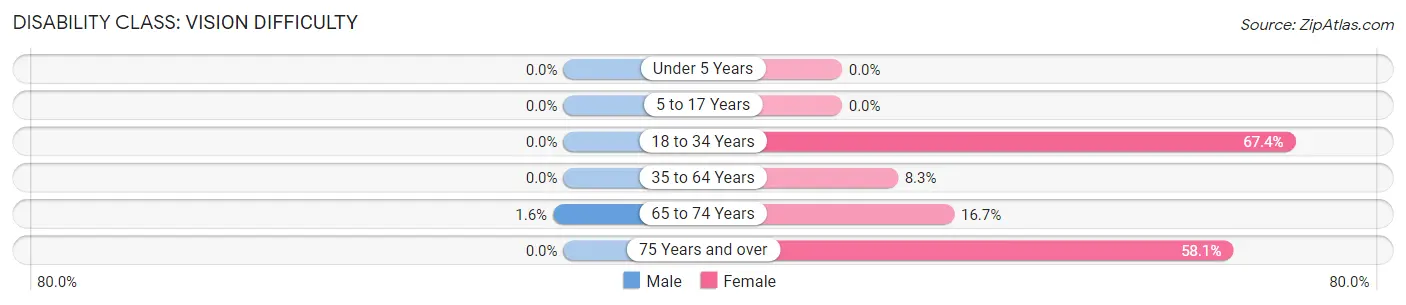
| Age Bracket | Male | Female |
| Under 5 Years | 0 (0.0%) | 0 (0.0%) |
| 5 to 17 Years | 0 (0.0%) | 0 (0.0%) |
| 18 to 34 Years | 0 (0.0%) | 97 (67.4%) |
| 35 to 64 Years | 0 (0.0%) | 24 (8.3%) |
| 65 to 74 Years | 3 (1.5%) | 42 (16.7%) |
| 75 Years and over | 0 (0.0%) | 179 (58.1%) |
Disability Class: Cognitive Difficulty
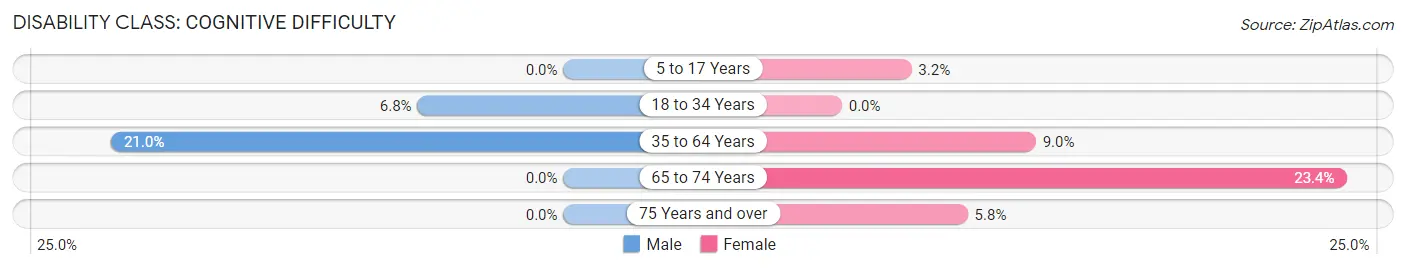
| Age Bracket | Male | Female |
| 5 to 17 Years | 0 (0.0%) | 1 (3.2%) |
| 18 to 34 Years | 22 (6.8%) | 0 (0.0%) |
| 35 to 64 Years | 72 (21.0%) | 26 (9.0%) |
| 65 to 74 Years | 0 (0.0%) | 59 (23.4%) |
| 75 Years and over | 0 (0.0%) | 18 (5.8%) |
Disability Class: Ambulatory Difficulty
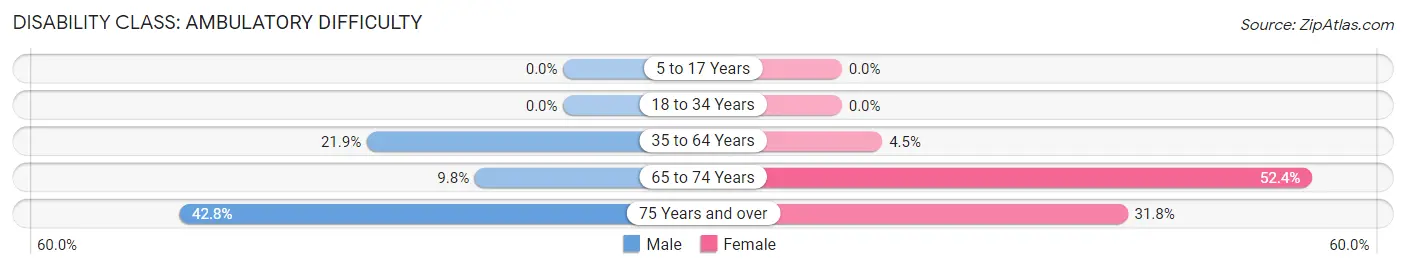
| Age Bracket | Male | Female |
| 5 to 17 Years | 0 (0.0%) | 0 (0.0%) |
| 18 to 34 Years | 0 (0.0%) | 0 (0.0%) |
| 35 to 64 Years | 75 (21.9%) | 13 (4.5%) |
| 65 to 74 Years | 19 (9.8%) | 132 (52.4%) |
| 75 Years and over | 92 (42.8%) | 98 (31.8%) |
Disability Class: Self-Care Difficulty
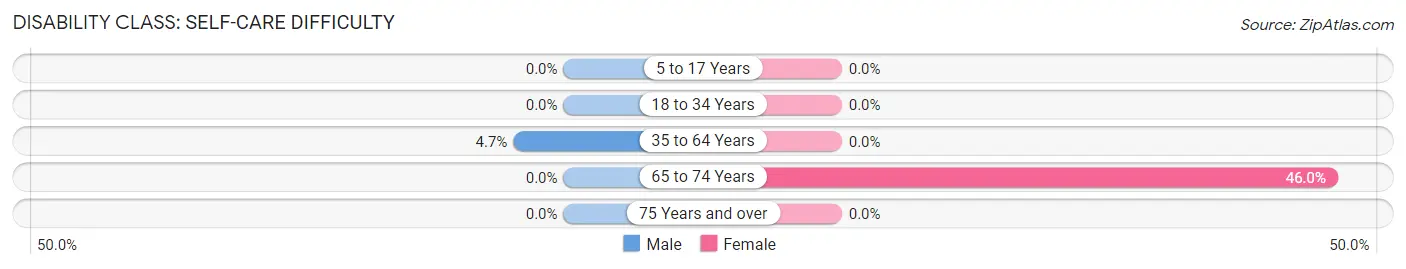
| Age Bracket | Male | Female |
| 5 to 17 Years | 0 (0.0%) | 0 (0.0%) |
| 18 to 34 Years | 0 (0.0%) | 0 (0.0%) |
| 35 to 64 Years | 16 (4.7%) | 0 (0.0%) |
| 65 to 74 Years | 0 (0.0%) | 116 (46.0%) |
| 75 Years and over | 0 (0.0%) | 0 (0.0%) |
Technology Access in Bluewell
Computing Device Access in Bluewell
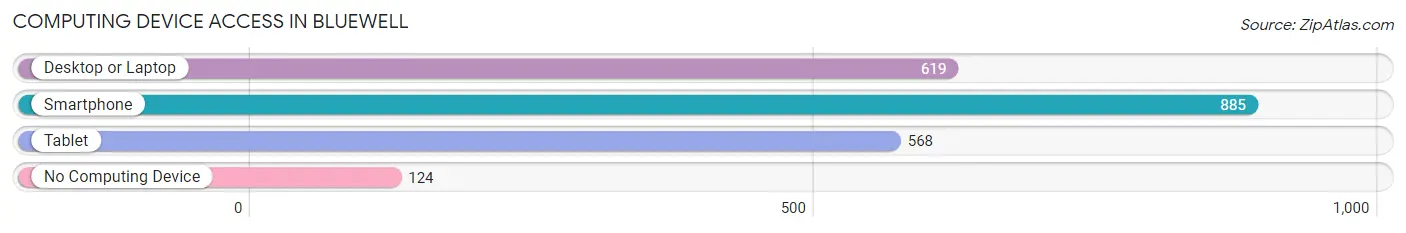
| Device Type | # Households | % Households |
| Desktop or Laptop | 619 | 55.5% |
| Smartphone | 885 | 79.3% |
| Tablet | 568 | 50.9% |
| No Computing Device | 124 | 11.1% |
| Total | 1,116 | 100.0% |
Internet Access in Bluewell
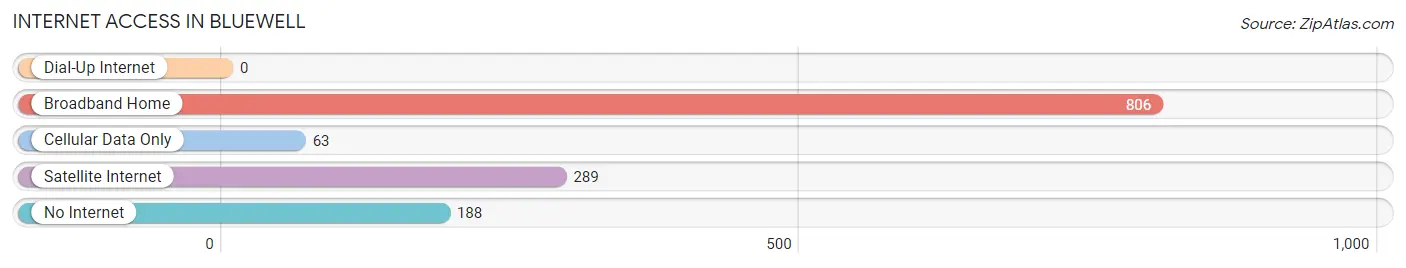
| Internet Type | # Households | % Households |
| Dial-Up Internet | 0 | 0.0% |
| Broadband Home | 806 | 72.2% |
| Cellular Data Only | 63 | 5.7% |
| Satellite Internet | 289 | 25.9% |
| No Internet | 188 | 16.9% |
| Total | 1,116 | 100.0% |
Bluewell Summary
Bluefield, West Virginia is a small city located in the Appalachian Mountains of West Virginia. It is the county seat of Mercer County and is located along the Bluestone River. The city has a population of 10,447 as of the 2010 census.
The area was first settled in the late 1700s by settlers from Virginia and North Carolina. The town was originally known as Pin Hook, but was renamed Bluefield in 1887 after the nearby Bluestone River. The city was incorporated in 1893 and has since grown to become the largest city in Mercer County.
The economy of Bluefield is largely based on the coal industry. The city is home to several coal mines and related industries, including the Bluestone Coal Company, which is the largest employer in the city. The city is also home to several manufacturing companies, including the Bluefield Manufacturing Company, which produces a variety of products, including furniture, clothing, and automotive parts.
The city is also home to several educational institutions, including Bluefield State College, Concord University, and the Appalachian School of Law. The city is also home to several cultural attractions, including the Bluefield Arts Center, the Bluefield Museum of Natural History, and the Bluefield Historical Society.
The geography of Bluefield is characterized by its mountainous terrain. The city is located in the Appalachian Mountains and is surrounded by several mountain ranges, including the Allegheny Mountains, the Blue Ridge Mountains, and the Appalachian Plateau. The city is located at an elevation of 1,890 feet above sea level.
The climate of Bluefield is classified as humid subtropical, with hot, humid summers and cold, wet winters. The average annual temperature is around 54 degrees Fahrenheit, with an average high of around 75 degrees Fahrenheit in the summer and an average low of around 35 degrees Fahrenheit in the winter.
The population of Bluefield is largely white, with a small African American population. The median household income in the city is around $30,000, and the median home value is around $90,000. The city has a poverty rate of around 20%, which is higher than the national average.
Bluefield is a small city with a rich history and a diverse economy. The city is home to several coal mines and related industries, as well as several educational institutions and cultural attractions. The city is also home to a diverse population, with a median household income and home value that are lower than the national average.
Common Questions
What is Per Capita Income in Bluewell?
Per Capita income in Bluewell is $23,442.
What is the Median Family Income in Bluewell?
Median Family Income in Bluewell is $67,250.
What is the Median Household income in Bluewell?
Median Household Income in Bluewell is $32,763.
What is Inequality or Gini Index in Bluewell?
Inequality or Gini Index in Bluewell is 0.40.
What is the Total Population of Bluewell?
Total Population of Bluewell is 2,369.
What is the Total Male Population of Bluewell?
Total Male Population of Bluewell is 1,345.
What is the Total Female Population of Bluewell?
Total Female Population of Bluewell is 1,024.
What is the Ratio of Males per 100 Females in Bluewell?
There are 131.35 Males per 100 Females in Bluewell.
What is the Ratio of Females per 100 Males in Bluewell?
There are 76.13 Females per 100 Males in Bluewell.
What is the Median Population Age in Bluewell?
Median Population Age in Bluewell is 57.9 Years.
What is the Average Family Size in Bluewell
Average Family Size in Bluewell is 2.9 People.
What is the Average Household Size in Bluewell
Average Household Size in Bluewell is 2.1 People.
How Large is the Labor Force in Bluewell?
There are 828 People in the Labor Forcein in Bluewell.
What is the Percentage of People in the Labor Force in Bluewell?
38.6% of People are in the Labor Force in Bluewell.
What is the Unemployment Rate in Bluewell?
Unemployment Rate in Bluewell is 3.5%.