Newell, WV Map & Demographics
Newell Map
Newell Overview
$20,630
PER CAPITA INCOME
$58,482
AVG FAMILY INCOME
$23,808
AVG HOUSEHOLD INCOME
0.47
INEQUALITY / GINI INDEX
1,129
TOTAL POPULATION
546
MALE POPULATION
583
FEMALE POPULATION
93.65
MALES / 100 FEMALES
106.78
FEMALES / 100 MALES
51.0
MEDIAN AGE
3.5
AVG FAMILY SIZE
2.1
AVG HOUSEHOLD SIZE
412
LABOR FORCE [ PEOPLE ]
44.2%
PERCENT IN LABOR FORCE
17.0%
UNEMPLOYMENT RATE
Newell Zip Codes
Newell Area Codes
Income in Newell
Income Overview in Newell
Per Capita Income in Newell is $20,630, while median incomes of families and households are $58,482 and $23,808 respectively.
| Characteristic | Number | Measure |
| Per Capita Income | 1,129 | $20,630 |
| Median Family Income | 195 | $58,482 |
| Mean Family Income | 195 | $70,921 |
| Median Household Income | 529 | $23,808 |
| Mean Household Income | 529 | $42,874 |
| Income Deficit | 195 | $0 |
| Wage / Income Gap (%) | 1,129 | 0.00% |
| Wage / Income Gap ($) | 1,129 | 100.00¢ per $1 |
| Gini / Inequality Index | 1,129 | 0.47 |
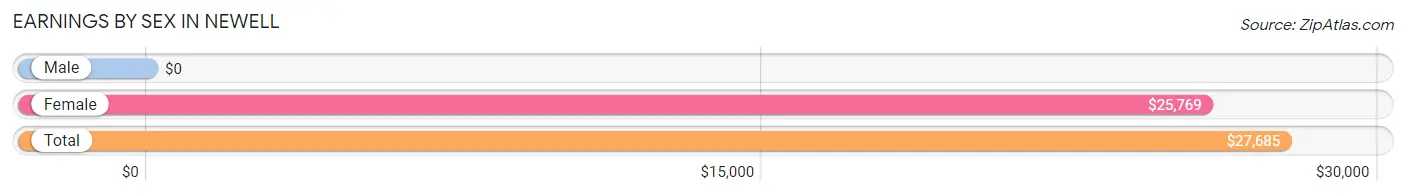
Earnings by Sex in Newell
| Sex | Number | Average Earnings |
| Male | 248 (64.2%) | $0 |
| Female | 138 (35.7%) | $25,769 |
| Total | 386 (100.0%) | $27,685 |
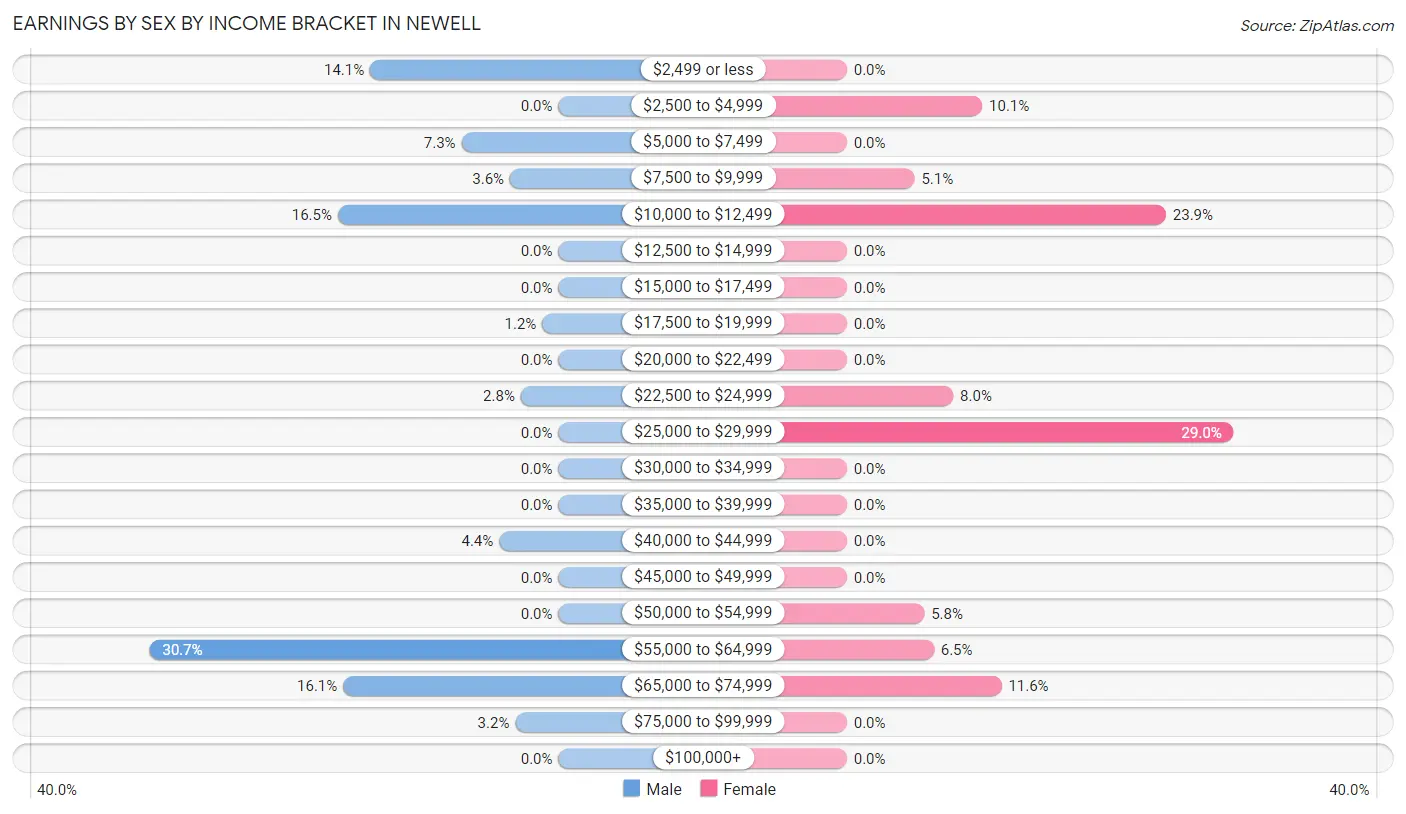
Earnings by Sex by Income Bracket in Newell
The most common earnings brackets in Newell are $55,000 to $64,999 for men (76 | 30.6%) and $25,000 to $29,999 for women (40 | 29.0%).
| Income | Male | Female |
| $2,499 or less | 35 (14.1%) | 0 (0.0%) |
| $2,500 to $4,999 | 0 (0.0%) | 14 (10.1%) |
| $5,000 to $7,499 | 18 (7.3%) | 0 (0.0%) |
| $7,500 to $9,999 | 9 (3.6%) | 7 (5.1%) |
| $10,000 to $12,499 | 41 (16.5%) | 33 (23.9%) |
| $12,500 to $14,999 | 0 (0.0%) | 0 (0.0%) |
| $15,000 to $17,499 | 0 (0.0%) | 0 (0.0%) |
| $17,500 to $19,999 | 3 (1.2%) | 0 (0.0%) |
| $20,000 to $22,499 | 0 (0.0%) | 0 (0.0%) |
| $22,500 to $24,999 | 7 (2.8%) | 11 (8.0%) |
| $25,000 to $29,999 | 0 (0.0%) | 40 (29.0%) |
| $30,000 to $34,999 | 0 (0.0%) | 0 (0.0%) |
| $35,000 to $39,999 | 0 (0.0%) | 0 (0.0%) |
| $40,000 to $44,999 | 11 (4.4%) | 0 (0.0%) |
| $45,000 to $49,999 | 0 (0.0%) | 0 (0.0%) |
| $50,000 to $54,999 | 0 (0.0%) | 8 (5.8%) |
| $55,000 to $64,999 | 76 (30.6%) | 9 (6.5%) |
| $65,000 to $74,999 | 40 (16.1%) | 16 (11.6%) |
| $75,000 to $99,999 | 8 (3.2%) | 0 (0.0%) |
| $100,000+ | 0 (0.0%) | 0 (0.0%) |
| Total | 248 (100.0%) | 138 (100.0%) |
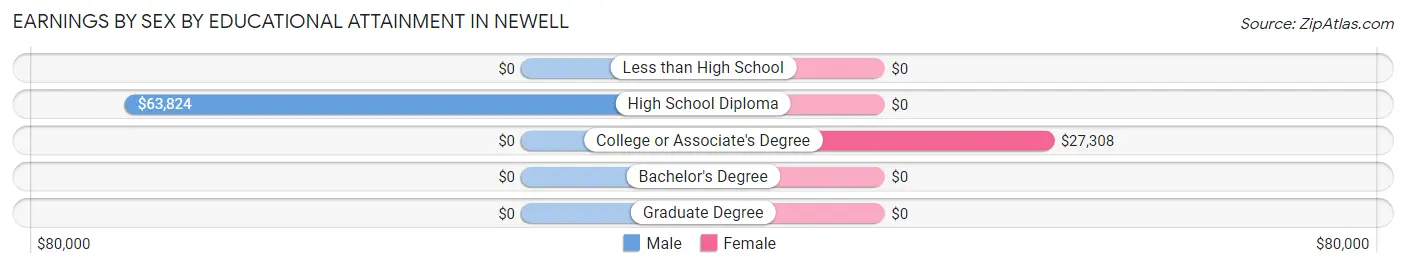
Earnings by Sex by Educational Attainment in Newell
Average earnings in Newell are $58,210 for men and $27,870 for women, a difference of 52.1%. Men with an educational attainment of high school diploma enjoy the highest average annual earnings of $63,824, while those with high school diploma education earn the least with $63,824. Women with an educational attainment of college or associate's degree earn the most with the average annual earnings of $27,308, while those with college or associate's degree education have the smallest earnings of $27,308.
| Educational Attainment | Male Income | Female Income |
| Less than High School | - | - |
| High School Diploma | $63,824 | $0 |
| College or Associate's Degree | - | - |
| Bachelor's Degree | - | - |
| Graduate Degree | - | - |
| Total | $58,210 | $27,870 |
Family Income in Newell
Family Income Brackets in Newell
According to the Newell family income data, there are 48 families falling into the $15,000 to $24,999 income range, which is the most common income bracket and makes up 24.6% of all families.
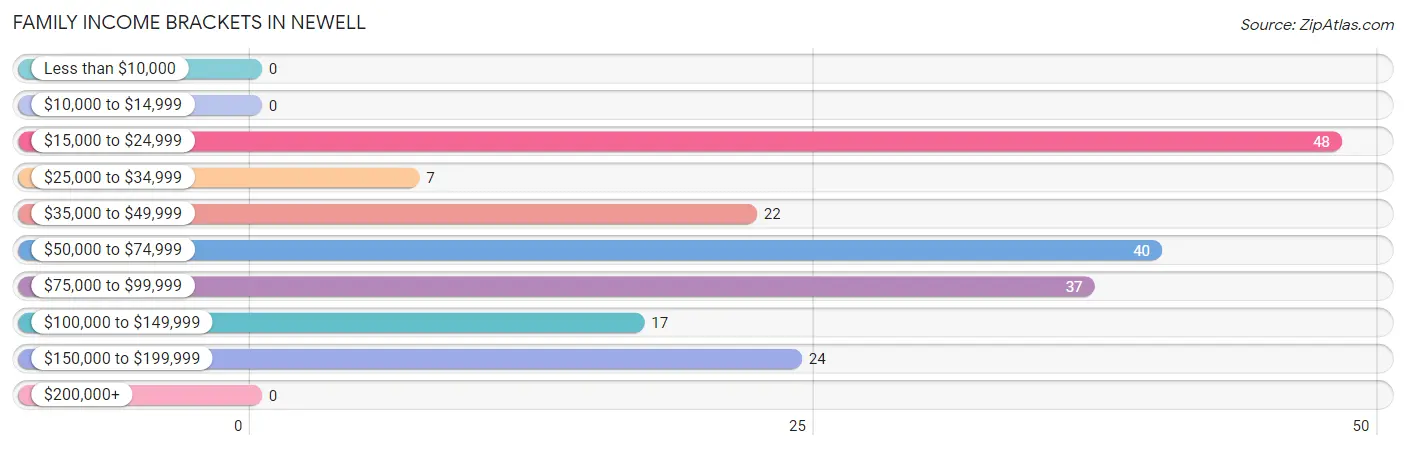
| Income Bracket | # Families | % Families |
| Less than $10,000 | 0 | 0.0% |
| $10,000 to $14,999 | 0 | 0.0% |
| $15,000 to $24,999 | 48 | 24.6% |
| $25,000 to $34,999 | 7 | 3.6% |
| $35,000 to $49,999 | 22 | 11.3% |
| $50,000 to $74,999 | 40 | 20.5% |
| $75,000 to $99,999 | 37 | 19.0% |
| $100,000 to $149,999 | 17 | 8.7% |
| $150,000 to $199,999 | 24 | 12.3% |
| $200,000+ | 0 | 0.0% |
Family Income by Famaliy Size in Newell
2-person families (93 | 47.7%) account for the highest median family income in Newell with $57,946 per family, while 2-person families (93 | 47.7%) have the highest median income of $28,973 per family member.
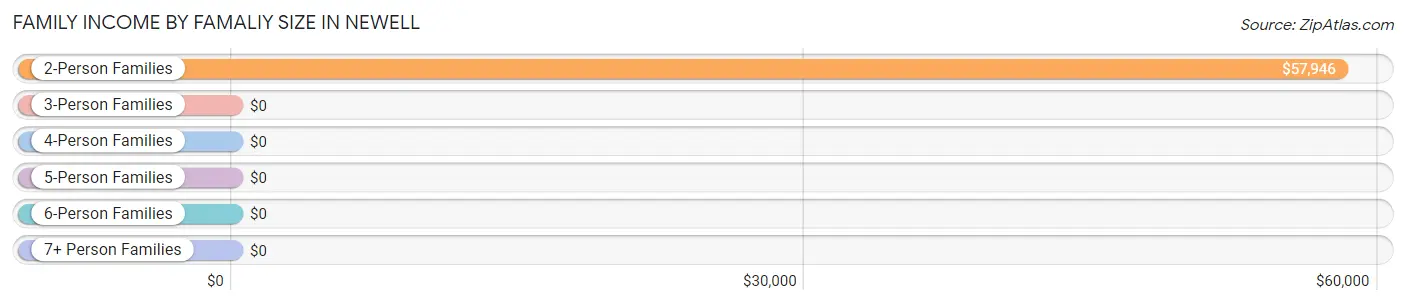
| Income Bracket | # Families | Median Income |
| 2-Person Families | 93 (47.7%) | $57,946 |
| 3-Person Families | 61 (31.3%) | $0 |
| 4-Person Families | 26 (13.3%) | $0 |
| 5-Person Families | 0 (0.0%) | $0 |
| 6-Person Families | 0 (0.0%) | $0 |
| 7+ Person Families | 15 (7.7%) | $0 |
| Total | 195 (100.0%) | $58,482 |
Family Income by Number of Earners in Newell
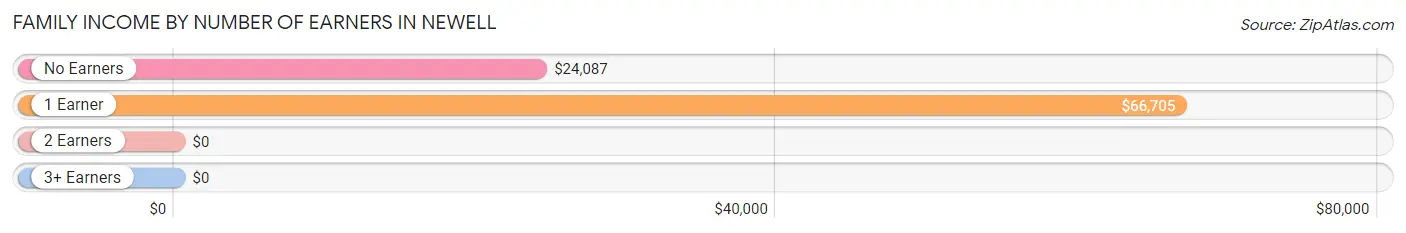
| Number of Earners | # Families | Median Income |
| No Earners | 63 (32.3%) | $24,087 |
| 1 Earner | 59 (30.3%) | $66,705 |
| 2 Earners | 53 (27.2%) | $0 |
| 3+ Earners | 20 (10.3%) | $0 |
| Total | 195 (100.0%) | $58,482 |
Household Income in Newell
Household Income Brackets in Newell
With 168 households falling in the category, the $10,000 to $14,999 income range is the most frequent in Newell, accounting for 31.8% of all households.
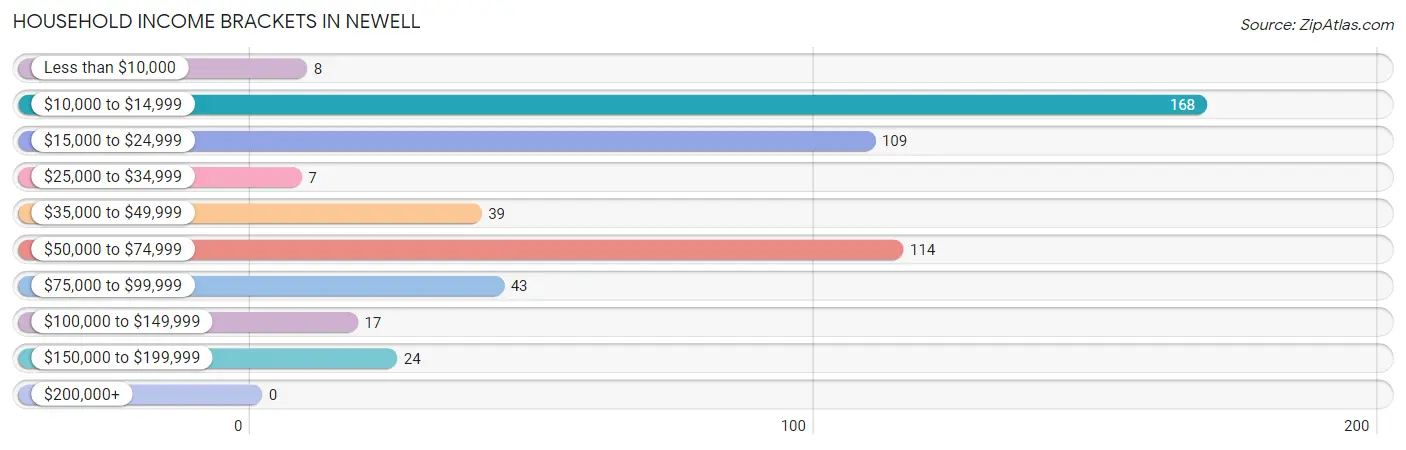
| Income Bracket | # Households | % Households |
| Less than $10,000 | 8 | 1.5% |
| $10,000 to $14,999 | 168 | 31.8% |
| $15,000 to $24,999 | 109 | 20.6% |
| $25,000 to $34,999 | 7 | 1.3% |
| $35,000 to $49,999 | 39 | 7.4% |
| $50,000 to $74,999 | 114 | 21.6% |
| $75,000 to $99,999 | 43 | 8.1% |
| $100,000 to $149,999 | 17 | 3.2% |
| $150,000 to $199,999 | 24 | 4.5% |
| $200,000+ | 0 | 0.0% |
Household Income by Householder Age in Newell
The median household income in Newell is $23,808, with the highest median household income of $24,338 found in the 65+ years age bracket for the primary householder. A total of 189 households (35.7%) fall into this category. Meanwhile, the 15 to 24 years age bracket for the primary householder has the lowest median household income of $0, with 26 households (4.9%) in this group.
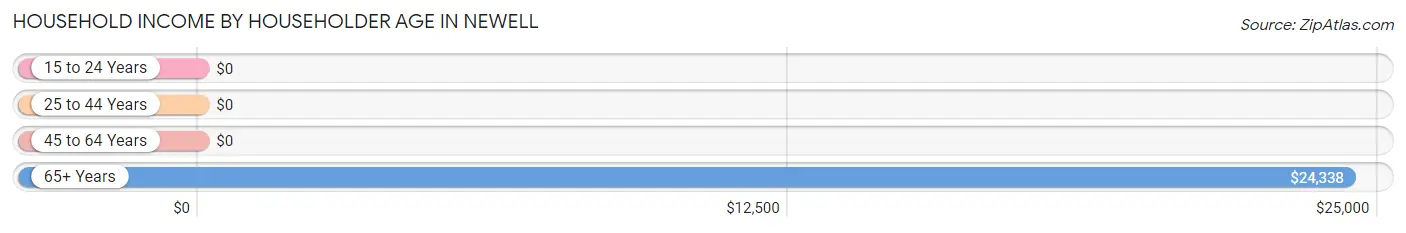
| Income Bracket | # Households | Median Income |
| 15 to 24 Years | 26 (4.9%) | $0 |
| 25 to 44 Years | 70 (13.2%) | $0 |
| 45 to 64 Years | 244 (46.1%) | $0 |
| 65+ Years | 189 (35.7%) | $24,338 |
| Total | 529 (100.0%) | $23,808 |
Poverty in Newell
Income Below Poverty by Sex and Age in Newell
With 39.9% poverty level for males and 44.3% for females among the residents of Newell, 6 to 11 year old males and 18 to 24 year old females are the most vulnerable to poverty, with 88 males (100.0%) and 26 females (100.0%) in their respective age groups living below the poverty level.
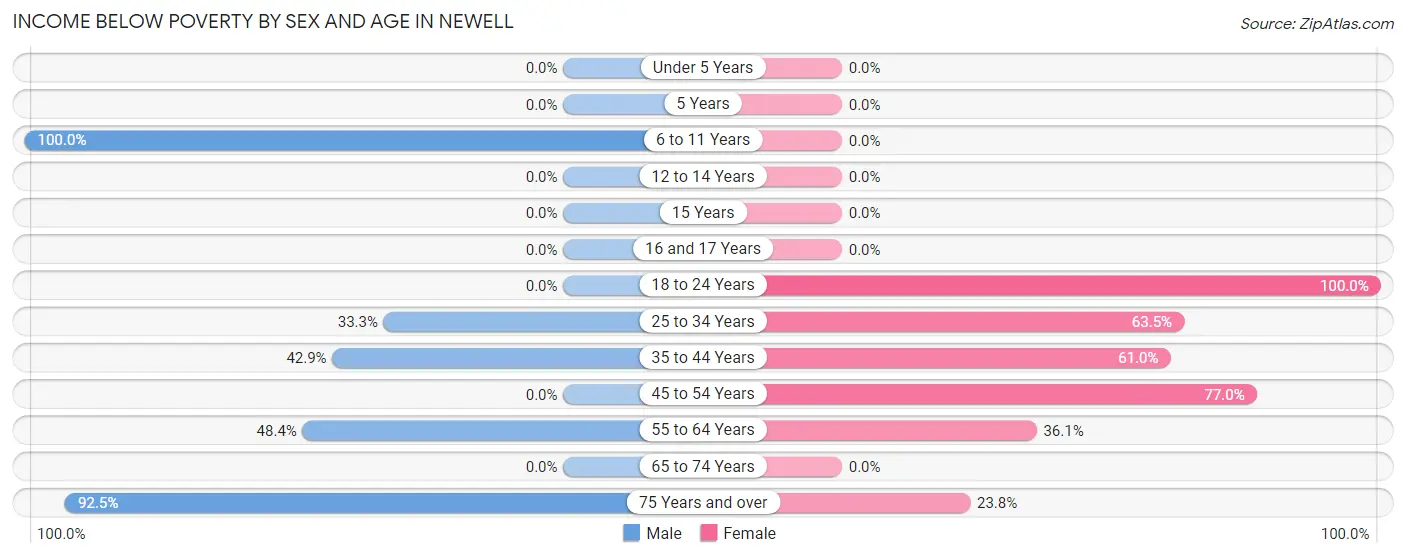
| Age Bracket | Male | Female |
| Under 5 Years | 0 (0.0%) | 0 (0.0%) |
| 5 Years | 0 (0.0%) | 0 (0.0%) |
| 6 to 11 Years | 88 (100.0%) | 0 (0.0%) |
| 12 to 14 Years | 0 (0.0%) | 0 (0.0%) |
| 15 Years | 0 (0.0%) | 0 (0.0%) |
| 16 and 17 Years | 0 (0.0%) | 0 (0.0%) |
| 18 to 24 Years | 0 (0.0%) | 26 (100.0%) |
| 25 to 34 Years | 15 (33.3%) | 40 (63.5%) |
| 35 to 44 Years | 18 (42.9%) | 25 (61.0%) |
| 45 to 54 Years | 0 (0.0%) | 127 (77.0%) |
| 55 to 64 Years | 60 (48.4%) | 30 (36.1%) |
| 65 to 74 Years | 0 (0.0%) | 0 (0.0%) |
| 75 Years and over | 37 (92.5%) | 10 (23.8%) |
| Total | 218 (39.9%) | 258 (44.3%) |
Income Above Poverty by Sex and Age in Newell
According to the poverty statistics in Newell, males aged under 5 years and females aged under 5 years are the age groups that are most secure financially, with 100.0% of males and 100.0% of females in these age groups living above the poverty line.
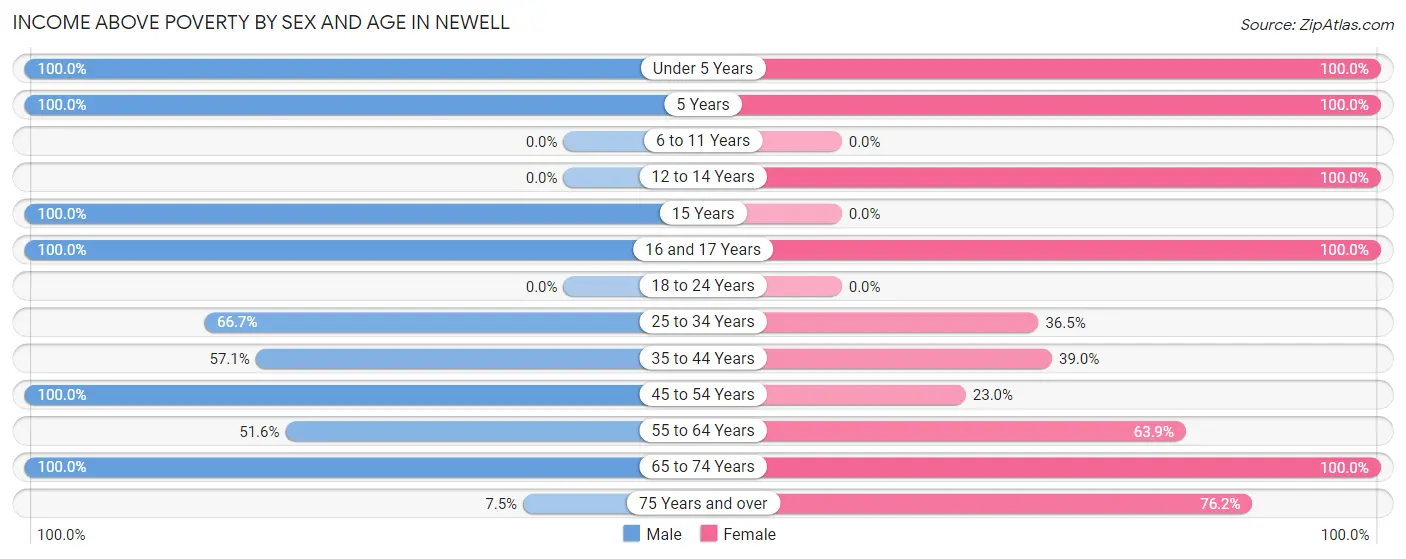
| Age Bracket | Male | Female |
| Under 5 Years | 46 (100.0%) | 11 (100.0%) |
| 5 Years | 7 (100.0%) | 15 (100.0%) |
| 6 to 11 Years | 0 (0.0%) | 0 (0.0%) |
| 12 to 14 Years | 0 (0.0%) | 15 (100.0%) |
| 15 Years | 14 (100.0%) | 0 (0.0%) |
| 16 and 17 Years | 25 (100.0%) | 27 (100.0%) |
| 18 to 24 Years | 0 (0.0%) | 0 (0.0%) |
| 25 to 34 Years | 30 (66.7%) | 23 (36.5%) |
| 35 to 44 Years | 24 (57.1%) | 16 (39.0%) |
| 45 to 54 Years | 78 (100.0%) | 38 (23.0%) |
| 55 to 64 Years | 64 (51.6%) | 53 (63.9%) |
| 65 to 74 Years | 37 (100.0%) | 95 (100.0%) |
| 75 Years and over | 3 (7.5%) | 32 (76.2%) |
| Total | 328 (60.1%) | 325 (55.7%) |
Income Below Poverty Among Married-Couple Families in Newell
The poverty statistics for married-couple families in Newell show that 19.4% or 26 of the total 134 families live below the poverty line. Families with 1 or 2 children have the highest poverty rate of 40.0%, comprising of 26 families. On the other hand, families with no children have the lowest poverty rate of 0.0%, which includes 0 families.
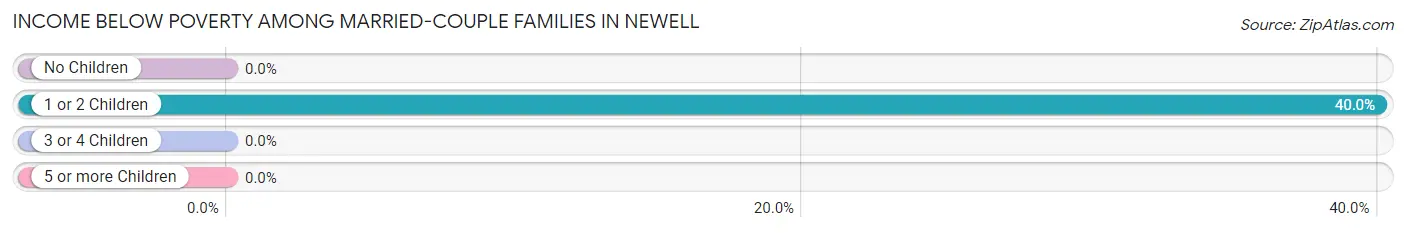
| Children | Above Poverty | Below Poverty |
| No Children | 54 (100.0%) | 0 (0.0%) |
| 1 or 2 Children | 39 (60.0%) | 26 (40.0%) |
| 3 or 4 Children | 0 (0.0%) | 0 (0.0%) |
| 5 or more Children | 15 (100.0%) | 0 (0.0%) |
| Total | 108 (80.6%) | 26 (19.4%) |
Income Below Poverty Among Single-Parent Households in Newell
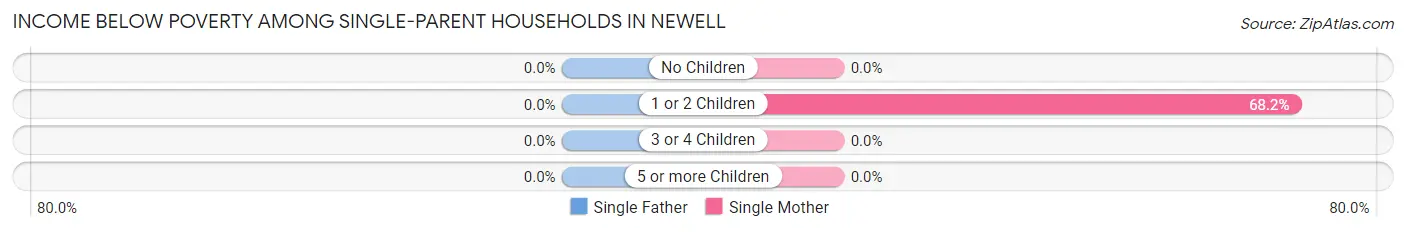
| Children | Single Father | Single Mother |
| No Children | 0 (0.0%) | 0 (0.0%) |
| 1 or 2 Children | 0 (0.0%) | 15 (68.2%) |
| 3 or 4 Children | 0 (0.0%) | 0 (0.0%) |
| 5 or more Children | 0 (0.0%) | 0 (0.0%) |
| Total | 0 (0.0%) | 15 (34.9%) |
Income Below Poverty Among Married-Couple vs Single-Parent Households in Newell
The poverty data for Newell shows that 26 of the married-couple family households (19.4%) and 15 of the single-parent households (24.6%) are living below the poverty level. Within the married-couple family households, those with 1 or 2 children have the highest poverty rate, with 26 households (40.0%) falling below the poverty line. Among the single-parent households, those with 1 or 2 children have the highest poverty rate, with 15 household (68.2%) living below poverty.
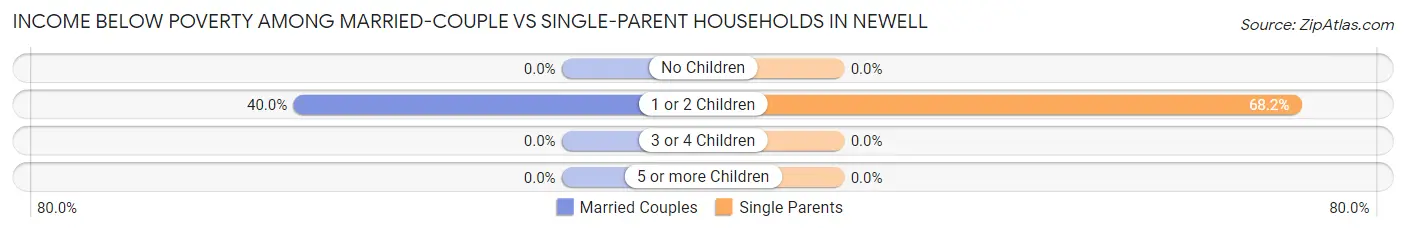
| Children | Married-Couple Families | Single-Parent Households |
| No Children | 0 (0.0%) | 0 (0.0%) |
| 1 or 2 Children | 26 (40.0%) | 15 (68.2%) |
| 3 or 4 Children | 0 (0.0%) | 0 (0.0%) |
| 5 or more Children | 0 (0.0%) | 0 (0.0%) |
| Total | 26 (19.4%) | 15 (24.6%) |
Race in Newell
The most populous races in Newell are White / Caucasian (1,092 | 96.7%), Asian (25 | 2.2%), and Black / African American (9 | 0.8%).
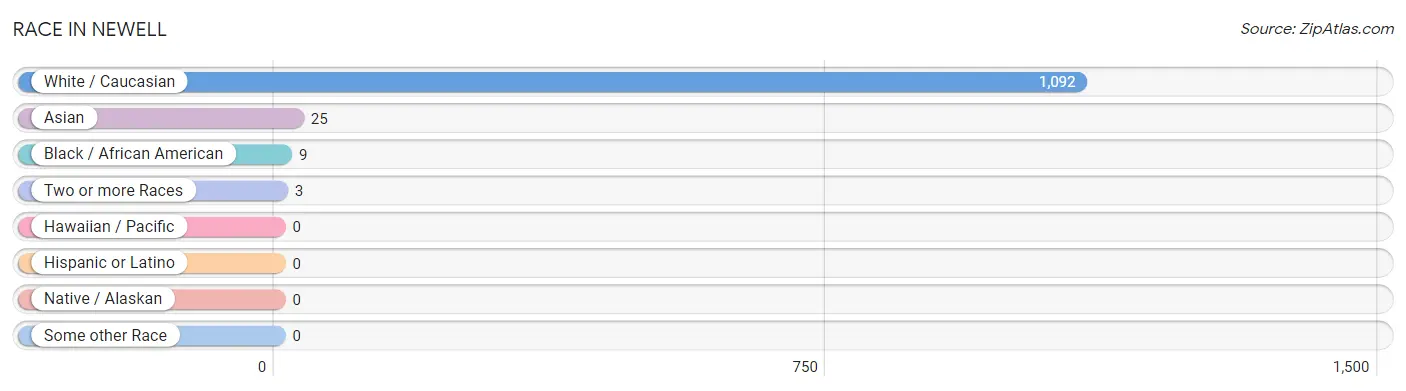
| Race | # Population | % Population |
| Asian | 25 | 2.2% |
| Black / African American | 9 | 0.8% |
| Hawaiian / Pacific | 0 | 0.0% |
| Hispanic or Latino | 0 | 0.0% |
| Native / Alaskan | 0 | 0.0% |
| White / Caucasian | 1,092 | 96.7% |
| Two or more Races | 3 | 0.3% |
| Some other Race | 0 | 0.0% |
| Total | 1,129 | 100.0% |
Ancestry in Newell
The most populous ancestries reported in Newell are Irish (249 | 22.1%), German (217 | 19.2%), American (147 | 13.0%), English (131 | 11.6%), and French Canadian (75 | 6.6%), together accounting for 72.5% of all Newell residents.
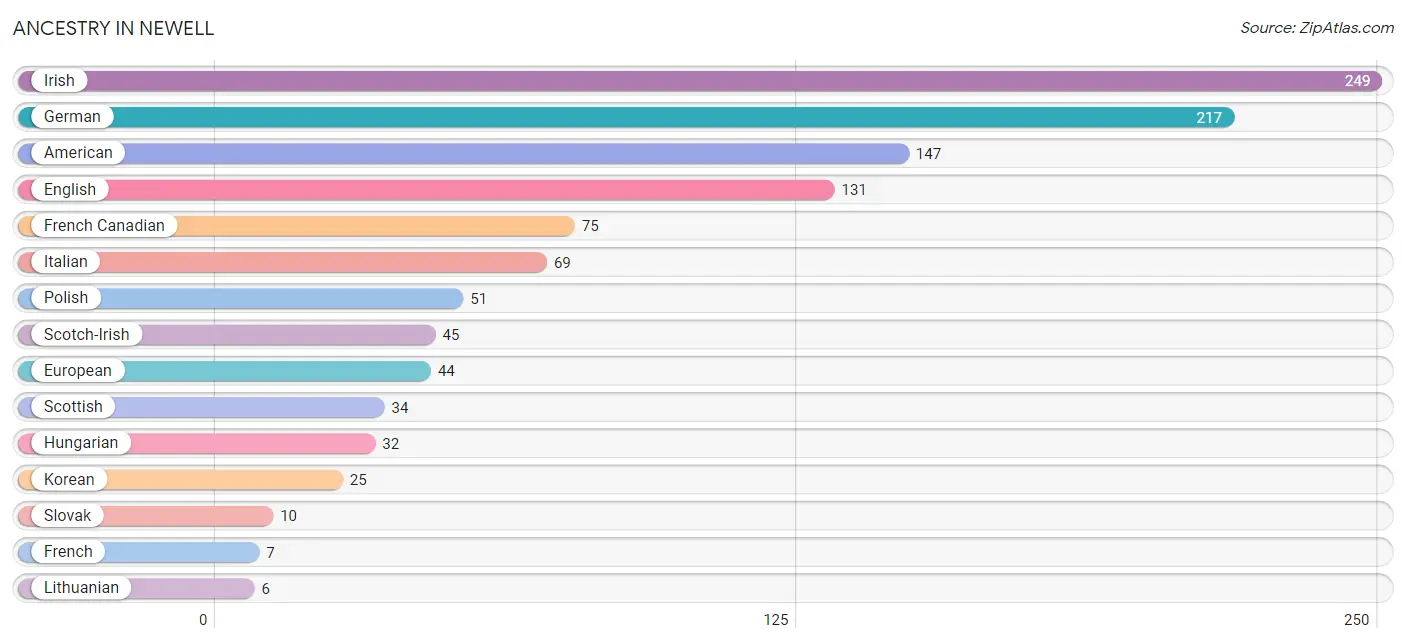
| Ancestry | # Population | % Population |
| American | 147 | 13.0% |
| British | 4 | 0.4% |
| English | 131 | 11.6% |
| European | 44 | 3.9% |
| French | 7 | 0.6% |
| French Canadian | 75 | 6.6% |
| German | 217 | 19.2% |
| Hungarian | 32 | 2.8% |
| Irish | 249 | 22.1% |
| Italian | 69 | 6.1% |
| Korean | 25 | 2.2% |
| Lithuanian | 6 | 0.5% |
| Polish | 51 | 4.5% |
| Scotch-Irish | 45 | 4.0% |
| Scottish | 34 | 3.0% |
| Slovak | 10 | 0.9% | View All 16 Rows |
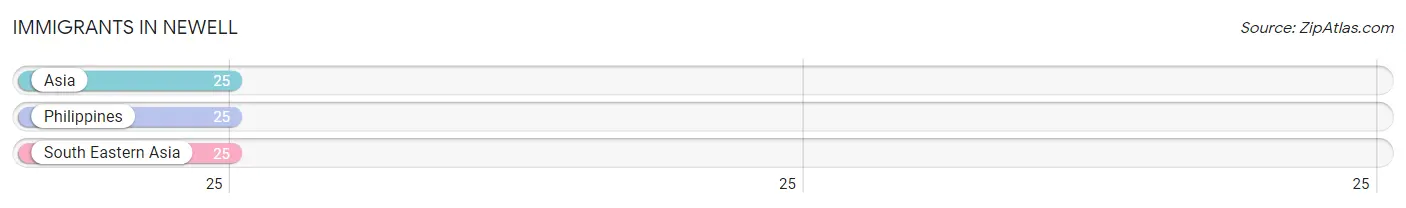
Immigrants in Newell
The most numerous immigrant groups reported in Newell came from Asia (25 | 2.2%), Philippines (25 | 2.2%), and South Eastern Asia (25 | 2.2%), together accounting for 6.6% of all Newell residents.
| Immigration Origin | # Population | % Population |
| Asia | 25 | 2.2% |
| Philippines | 25 | 2.2% |
| South Eastern Asia | 25 | 2.2% | View All 3 Rows |
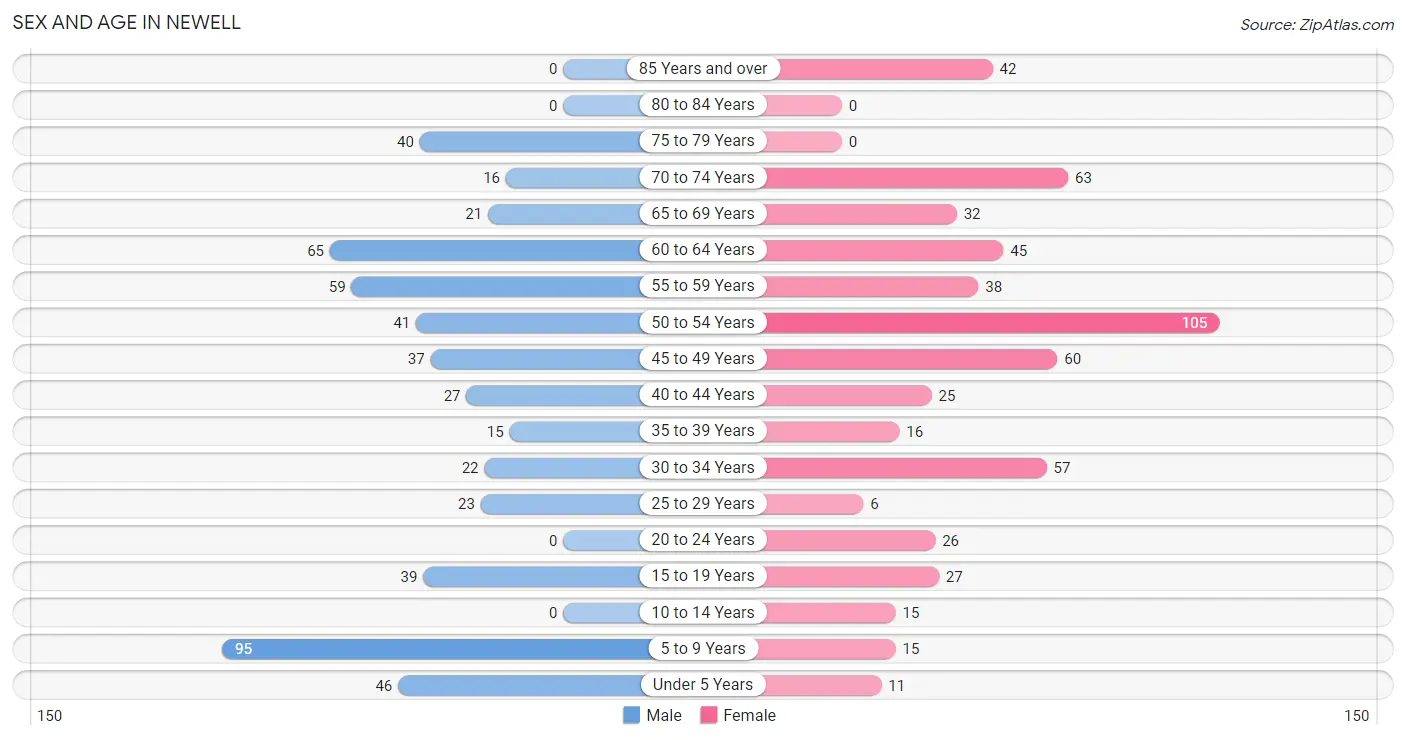
Sex and Age in Newell
Sex and Age in Newell
The most populous age groups in Newell are 5 to 9 Years (95 | 17.4%) for men and 50 to 54 Years (105 | 18.0%) for women.
| Age Bracket | Male | Female |
| Under 5 Years | 46 (8.4%) | 11 (1.9%) |
| 5 to 9 Years | 95 (17.4%) | 15 (2.6%) |
| 10 to 14 Years | 0 (0.0%) | 15 (2.6%) |
| 15 to 19 Years | 39 (7.1%) | 27 (4.6%) |
| 20 to 24 Years | 0 (0.0%) | 26 (4.5%) |
| 25 to 29 Years | 23 (4.2%) | 6 (1.0%) |
| 30 to 34 Years | 22 (4.0%) | 57 (9.8%) |
| 35 to 39 Years | 15 (2.8%) | 16 (2.7%) |
| 40 to 44 Years | 27 (5.0%) | 25 (4.3%) |
| 45 to 49 Years | 37 (6.8%) | 60 (10.3%) |
| 50 to 54 Years | 41 (7.5%) | 105 (18.0%) |
| 55 to 59 Years | 59 (10.8%) | 38 (6.5%) |
| 60 to 64 Years | 65 (11.9%) | 45 (7.7%) |
| 65 to 69 Years | 21 (3.8%) | 32 (5.5%) |
| 70 to 74 Years | 16 (2.9%) | 63 (10.8%) |
| 75 to 79 Years | 40 (7.3%) | 0 (0.0%) |
| 80 to 84 Years | 0 (0.0%) | 0 (0.0%) |
| 85 Years and over | 0 (0.0%) | 42 (7.2%) |
| Total | 546 (100.0%) | 583 (100.0%) |
Families and Households in Newell
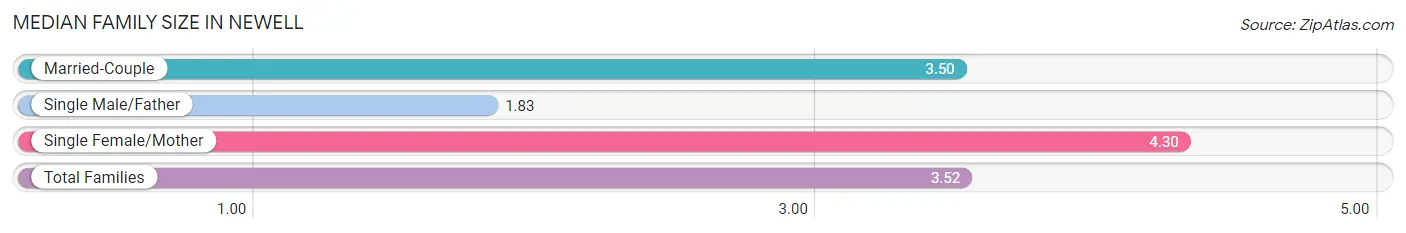
Median Family Size in Newell
The median family size in Newell is 3.52 persons per family, with single female/mother families (43 | 22.1%) accounting for the largest median family size of 4.3 persons per family. On the other hand, single male/father families (18 | 9.2%) represent the smallest median family size with 1.83 persons per family.
| Family Type | # Families | Family Size |
| Married-Couple | 134 (68.7%) | 3.50 |
| Single Male/Father | 18 (9.2%) | 1.83 |
| Single Female/Mother | 43 (22.1%) | 4.30 |
| Total Families | 195 (100.0%) | 3.52 |
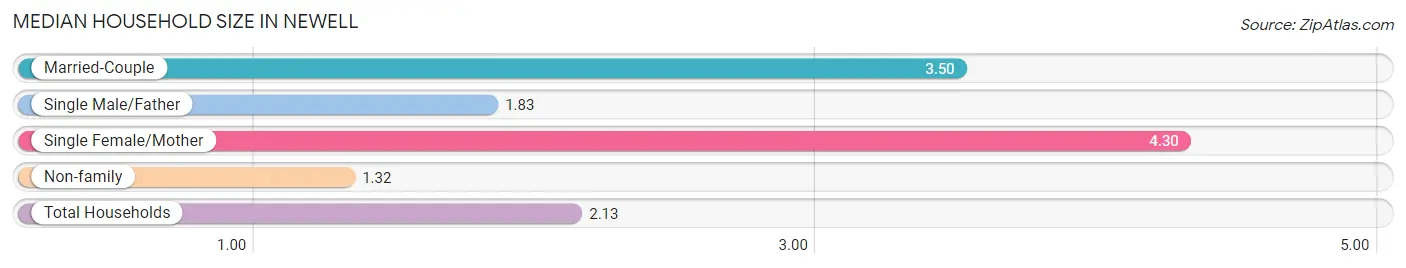
Median Household Size in Newell
The median household size in Newell is 2.13 persons per household, with single female/mother households (43 | 8.1%) accounting for the largest median household size of 4.3 persons per household. non-family households (334 | 63.1%) represent the smallest median household size with 1.32 persons per household.
| Household Type | # Households | Household Size |
| Married-Couple | 134 (25.3%) | 3.50 |
| Single Male/Father | 18 (3.4%) | 1.83 |
| Single Female/Mother | 43 (8.1%) | 4.30 |
| Non-family | 334 (63.1%) | 1.32 |
| Total Households | 529 (100.0%) | 2.13 |
Household Size by Marriage Status in Newell
Out of a total of 529 households in Newell, 195 (36.9%) are family households, while 334 (63.1%) are nonfamily households. The most numerous type of family households are 2-person households, comprising 93, and the most common type of nonfamily households are 1-person households, comprising 283.
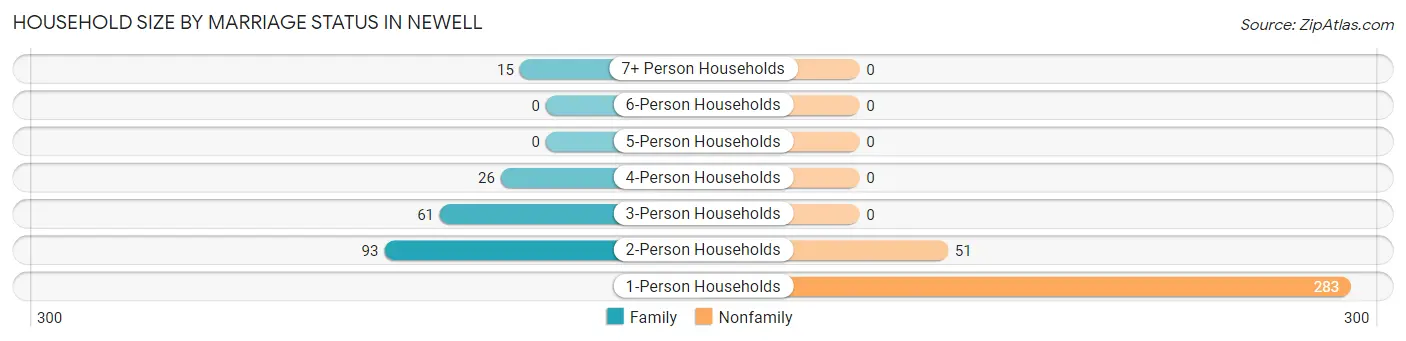
| Household Size | Family Households | Nonfamily Households |
| 1-Person Households | - | 283 (53.5%) |
| 2-Person Households | 93 (17.6%) | 51 (9.6%) |
| 3-Person Households | 61 (11.5%) | 0 (0.0%) |
| 4-Person Households | 26 (4.9%) | 0 (0.0%) |
| 5-Person Households | 0 (0.0%) | 0 (0.0%) |
| 6-Person Households | 0 (0.0%) | 0 (0.0%) |
| 7+ Person Households | 15 (2.8%) | 0 (0.0%) |
| Total | 195 (36.9%) | 334 (63.1%) |
Female Fertility in Newell
Fertility by Age in Newell
Average fertility rate in Newell is 74.0 births per 1,000 women. Women in the age bracket of 35 to 50 years have the highest fertility rate with 158.0 births per 1,000 women. Women in the age bracket of 35 to 50 years acount for 100.0% of all women with births.
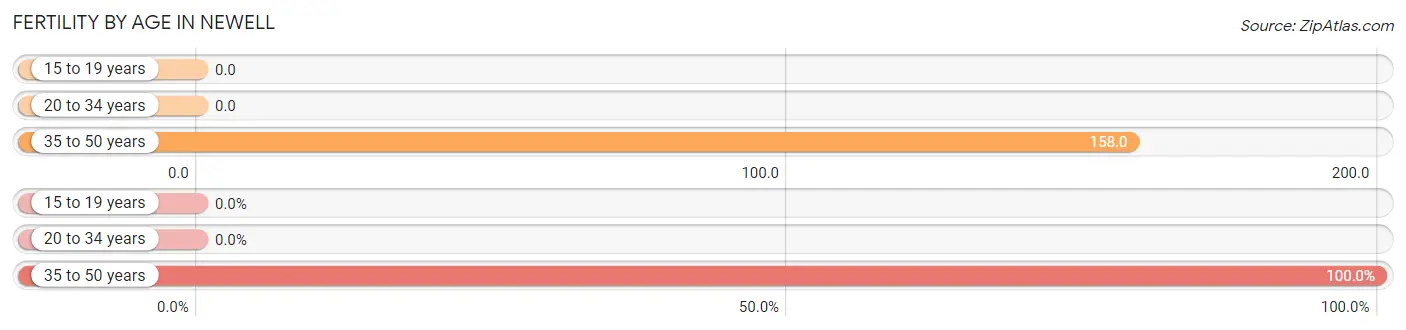
| Age Bracket | Women with Births | Births / 1,000 Women |
| 15 to 19 years | 0 (0.0%) | 0.0 |
| 20 to 34 years | 0 (0.0%) | 0.0 |
| 35 to 50 years | 16 (100.0%) | 158.0 |
| Total | 16 (100.0%) | 74.0 |
Fertility by Age by Marriage Status in Newell
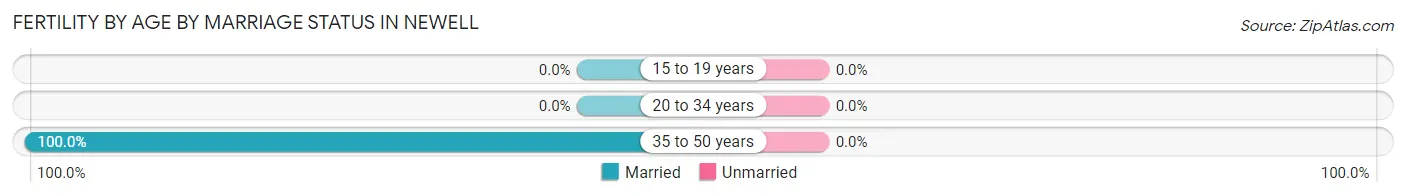
| Age Bracket | Married | Unmarried |
| 15 to 19 years | 0 (0.0%) | 0 (0.0%) |
| 20 to 34 years | 0 (0.0%) | 0 (0.0%) |
| 35 to 50 years | 16 (100.0%) | 0 (0.0%) |
| Total | 16 (100.0%) | 0 (0.0%) |
Fertility by Education in Newell
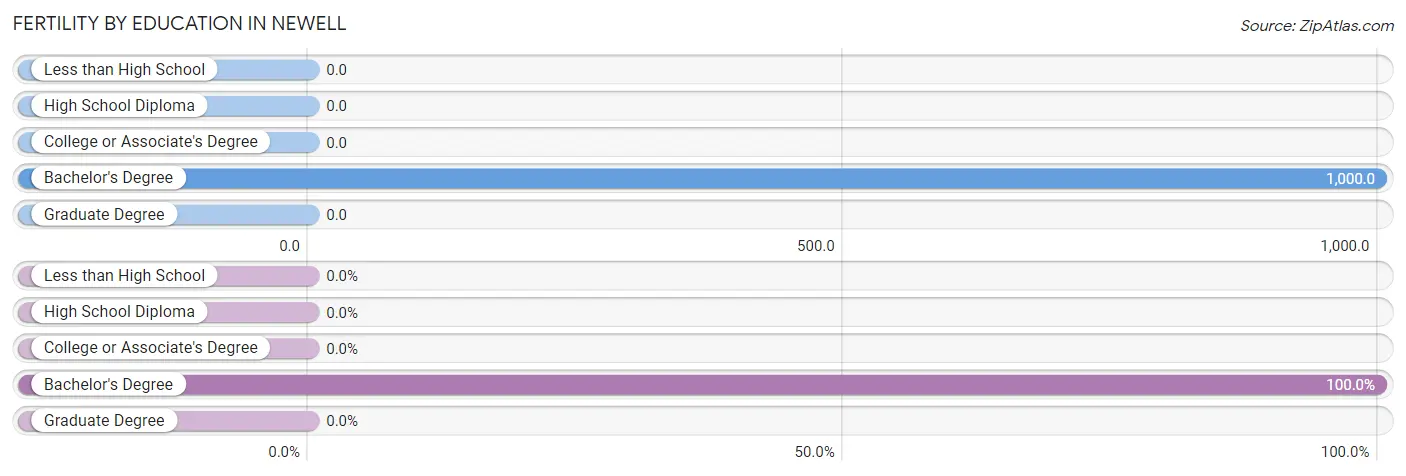
| Educational Attainment | Women with Births | Births / 1,000 Women |
| Less than High School | 0 (0.0%) | 0.0 |
| High School Diploma | 0 (0.0%) | 0.0 |
| College or Associate's Degree | 0 (0.0%) | 0.0 |
| Bachelor's Degree | 16 (100.0%) | 1,000.0 |
| Graduate Degree | 0 (0.0%) | 0.0 |
| Total | 16 (100.0%) | 74.0 |
Fertility by Education by Marriage Status in Newell
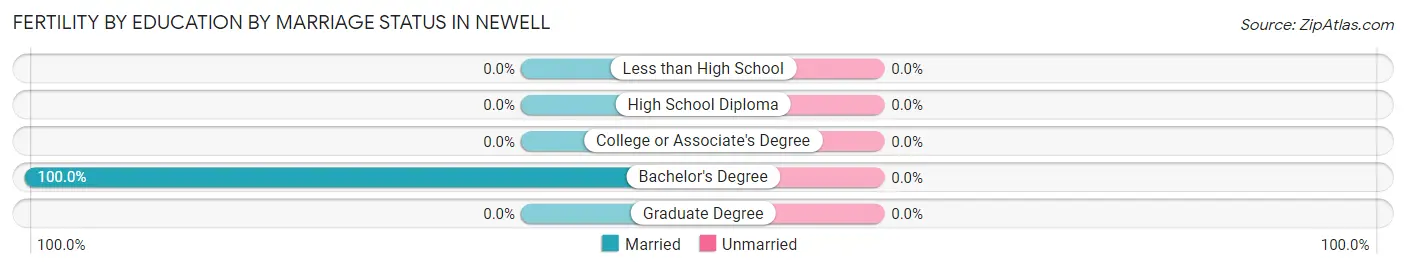
| Educational Attainment | Married | Unmarried |
| Less than High School | 0 (0.0%) | 0 (0.0%) |
| High School Diploma | 0 (0.0%) | 0 (0.0%) |
| College or Associate's Degree | 0 (0.0%) | 0 (0.0%) |
| Bachelor's Degree | 16 (100.0%) | 0 (0.0%) |
| Graduate Degree | 0 (0.0%) | 0 (0.0%) |
| Total | 16 (100.0%) | 0 (0.0%) |
Employment Characteristics in Newell
Employment by Class of Employer in Newell
Among the 342 employed individuals in Newell, private company employees (242 | 70.8%), state government employees (38 | 11.1%), and not-for-profit organizations (33 | 9.7%) make up the most common classes of employment.
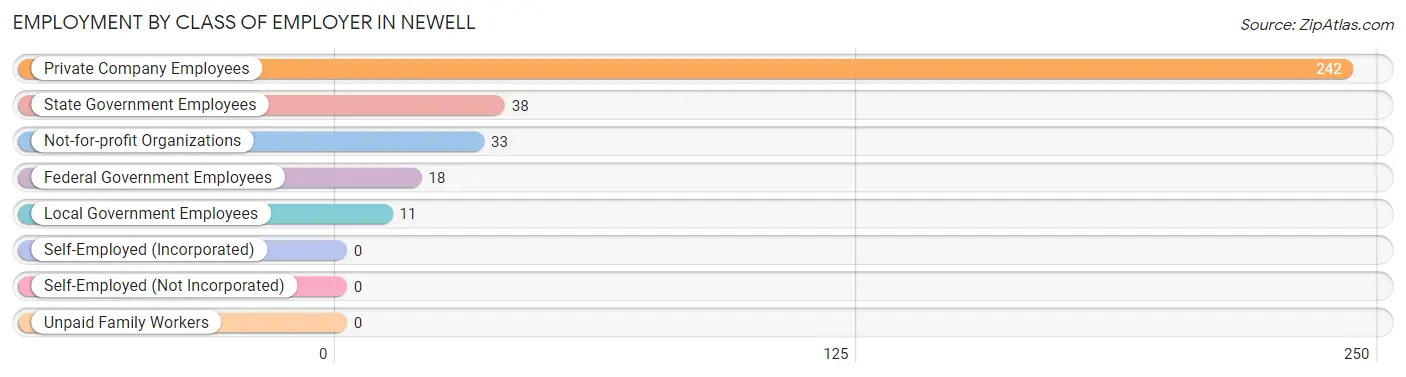
| Employer Class | # Employees | % Employees |
| Private Company Employees | 242 | 70.8% |
| Self-Employed (Incorporated) | 0 | 0.0% |
| Self-Employed (Not Incorporated) | 0 | 0.0% |
| Not-for-profit Organizations | 33 | 9.7% |
| Local Government Employees | 11 | 3.2% |
| State Government Employees | 38 | 11.1% |
| Federal Government Employees | 18 | 5.3% |
| Unpaid Family Workers | 0 | 0.0% |
| Total | 342 | 100.0% |
Employment Status by Age in Newell
According to the labor force statistics for Newell, out of the total population over 16 years of age (933), 44.2% or 412 individuals are in the labor force, with 17.0% or 70 of them unemployed. The age group with the highest labor force participation rate is 20 to 24 years, with 100.0% or 26 individuals in the labor force. Within the labor force, the 75 years and over age range has the highest percentage of unemployed individuals, with 100.0% or 7 of them being unemployed.
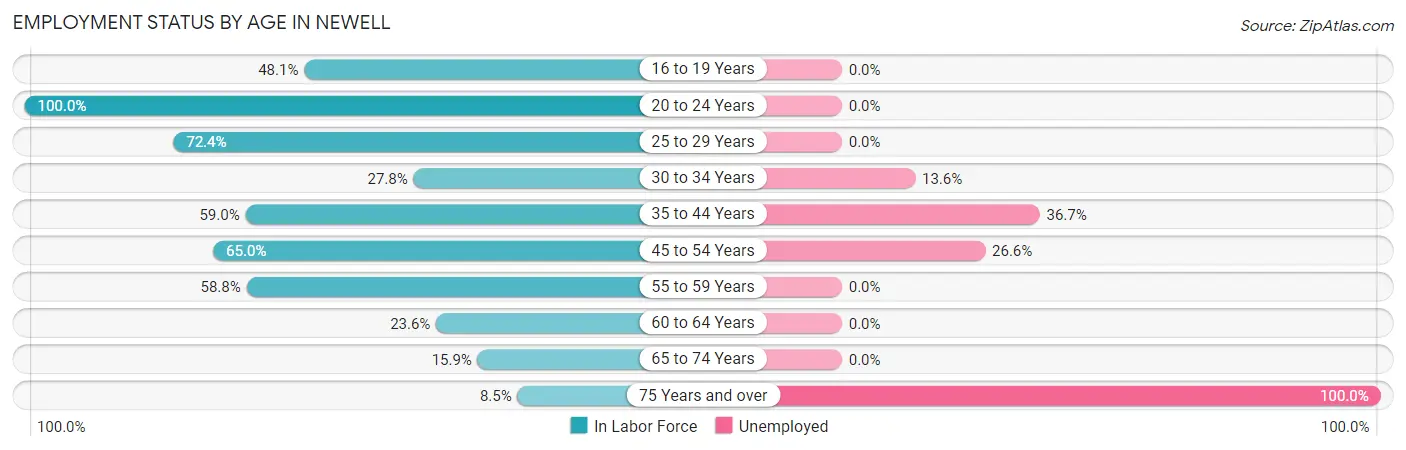
| Age Bracket | In Labor Force | Unemployed |
| 16 to 19 Years | 25 (48.1%) | 0 (0.0%) |
| 20 to 24 Years | 26 (100.0%) | 0 (0.0%) |
| 25 to 29 Years | 21 (72.4%) | 0 (0.0%) |
| 30 to 34 Years | 22 (27.8%) | 3 (13.6%) |
| 35 to 44 Years | 49 (59.0%) | 18 (36.7%) |
| 45 to 54 Years | 158 (65.0%) | 42 (26.6%) |
| 55 to 59 Years | 57 (58.8%) | 0 (0.0%) |
| 60 to 64 Years | 26 (23.6%) | 0 (0.0%) |
| 65 to 74 Years | 21 (15.9%) | 0 (0.0%) |
| 75 Years and over | 7 (8.5%) | 7 (100.0%) |
| Total | 412 (44.2%) | 70 (17.0%) |
Employment Status by Educational Attainment in Newell
According to labor force statistics for Newell, 52.0% of individuals (333) out of the total population between 25 and 64 years of age (641) are in the labor force, with 18.9% or 63 of them being unemployed. The group with the highest labor force participation rate are those with the educational attainment of bachelor's degree or higher, with 71.4% or 55 individuals in the labor force. Within the labor force, individuals with less than high school education have the highest percentage of unemployment, with 53.2% or 42 of them being unemployed.
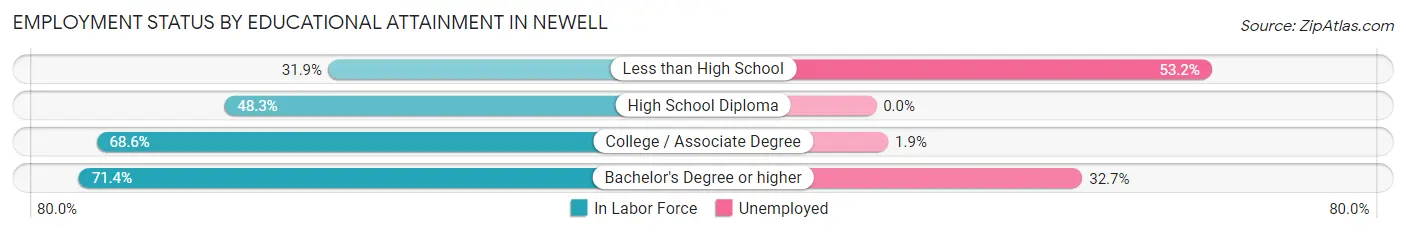
| Educational Attainment | In Labor Force | Unemployed |
| Less than High School | 79 (31.9%) | 132 (53.2%) |
| High School Diploma | 42 (48.3%) | 0 (0.0%) |
| College / Associate Degree | 157 (68.6%) | 4 (1.9%) |
| Bachelor's Degree or higher | 55 (71.4%) | 25 (32.7%) |
| Total | 333 (52.0%) | 121 (18.9%) |
Employment Occupations by Sex in Newell
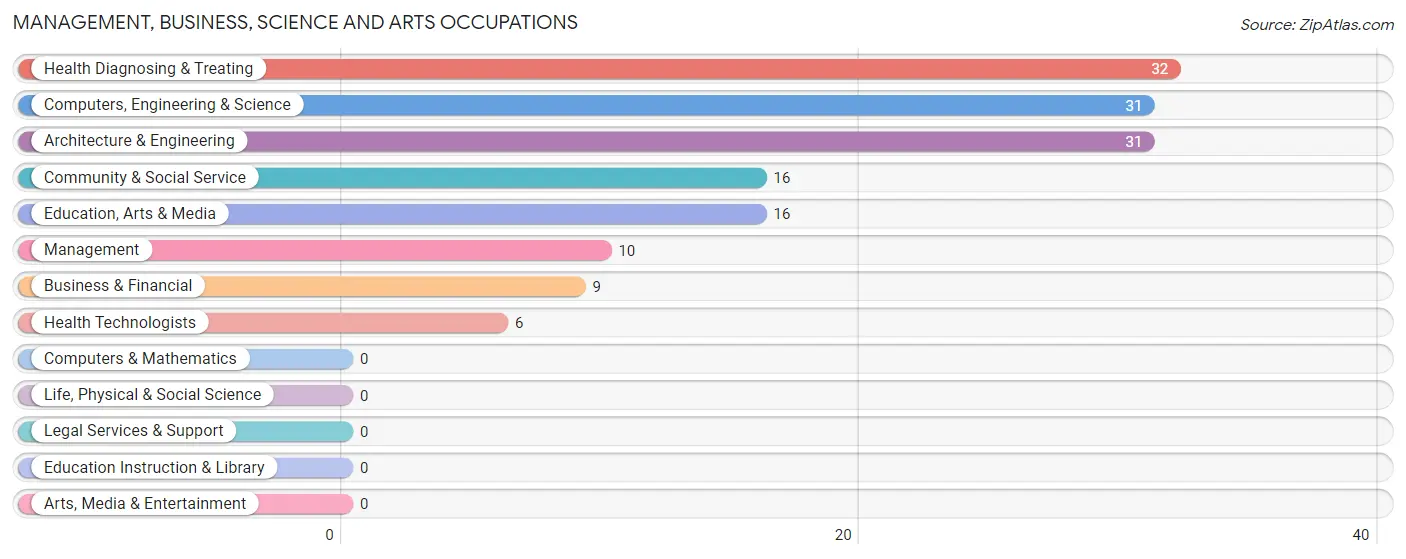
Management, Business, Science and Arts Occupations
The most common Management, Business, Science and Arts occupations in Newell are Health Diagnosing & Treating (32 | 9.4%), Computers, Engineering & Science (31 | 9.1%), Architecture & Engineering (31 | 9.1%), Community & Social Service (16 | 4.7%), and Education, Arts & Media (16 | 4.7%).
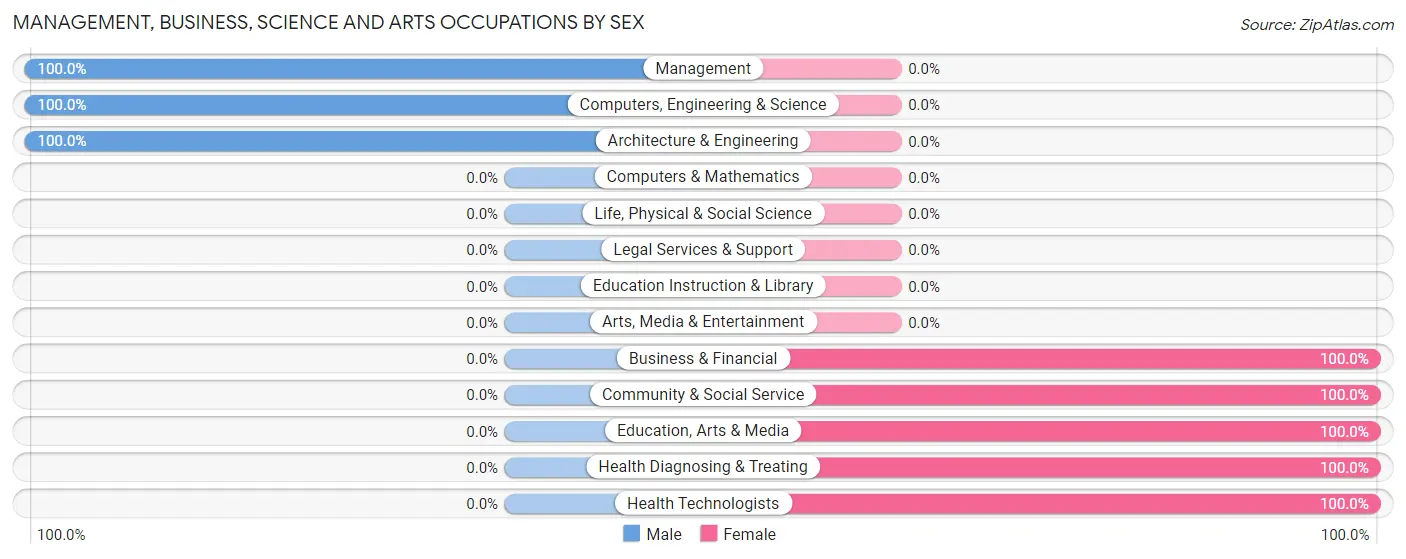
Management, Business, Science and Arts Occupations by Sex
Within the Management, Business, Science and Arts occupations in Newell, the most male-oriented occupations are Management (100.0%), Computers, Engineering & Science (100.0%), and Architecture & Engineering (100.0%), while the most female-oriented occupations are Business & Financial (100.0%), Community & Social Service (100.0%), and Education, Arts & Media (100.0%).
| Occupation | Male | Female |
| Management | 10 (100.0%) | 0 (0.0%) |
| Business & Financial | 0 (0.0%) | 9 (100.0%) |
| Computers, Engineering & Science | 31 (100.0%) | 0 (0.0%) |
| Computers & Mathematics | 0 (0.0%) | 0 (0.0%) |
| Architecture & Engineering | 31 (100.0%) | 0 (0.0%) |
| Life, Physical & Social Science | 0 (0.0%) | 0 (0.0%) |
| Community & Social Service | 0 (0.0%) | 16 (100.0%) |
| Education, Arts & Media | 0 (0.0%) | 16 (100.0%) |
| Legal Services & Support | 0 (0.0%) | 0 (0.0%) |
| Education Instruction & Library | 0 (0.0%) | 0 (0.0%) |
| Arts, Media & Entertainment | 0 (0.0%) | 0 (0.0%) |
| Health Diagnosing & Treating | 0 (0.0%) | 32 (100.0%) |
| Health Technologists | 0 (0.0%) | 6 (100.0%) |
| Total (Category) | 41 (41.8%) | 57 (58.2%) |
| Total (Overall) | 218 (63.7%) | 124 (36.3%) |
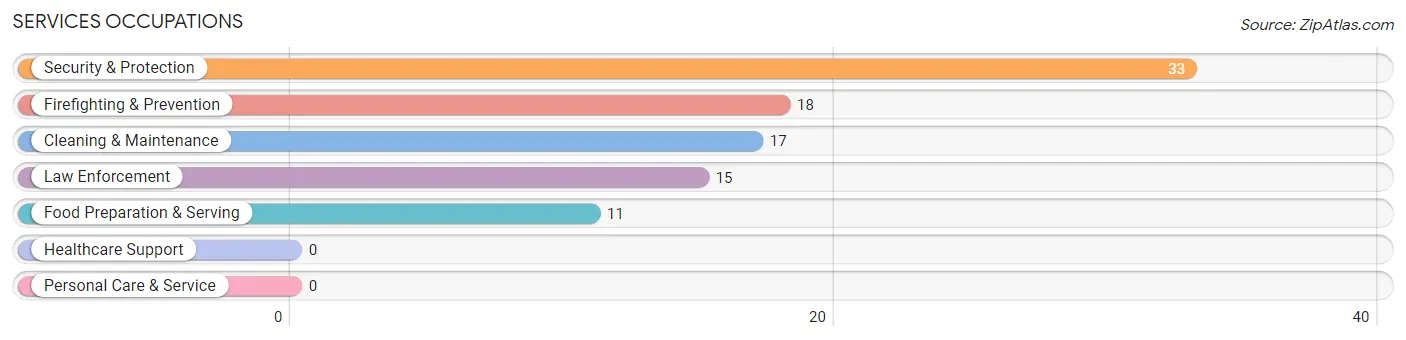
Services Occupations
The most common Services occupations in Newell are Security & Protection (33 | 9.7%), Firefighting & Prevention (18 | 5.3%), Cleaning & Maintenance (17 | 5.0%), Law Enforcement (15 | 4.4%), and Food Preparation & Serving (11 | 3.2%).
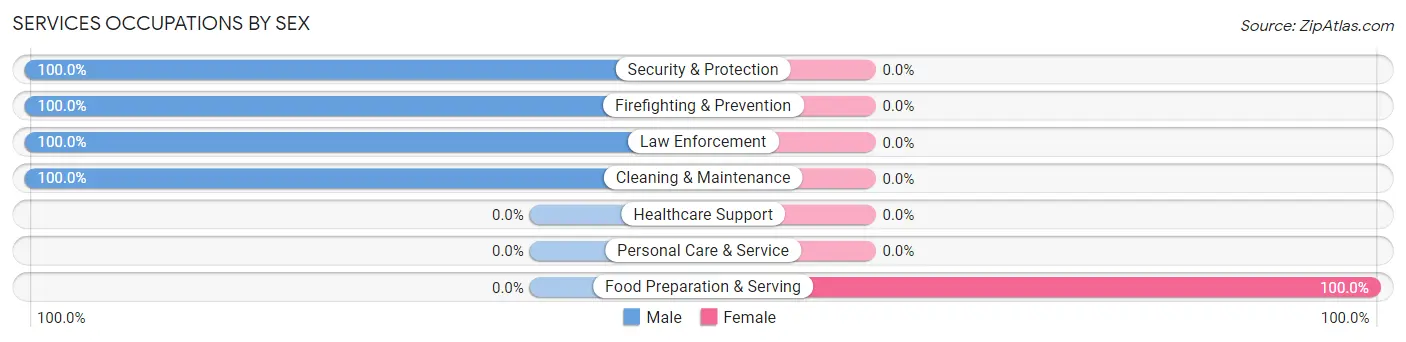
Services Occupations by Sex
| Occupation | Male | Female |
| Healthcare Support | 0 (0.0%) | 0 (0.0%) |
| Security & Protection | 33 (100.0%) | 0 (0.0%) |
| Firefighting & Prevention | 18 (100.0%) | 0 (0.0%) |
| Law Enforcement | 15 (100.0%) | 0 (0.0%) |
| Food Preparation & Serving | 0 (0.0%) | 11 (100.0%) |
| Cleaning & Maintenance | 17 (100.0%) | 0 (0.0%) |
| Personal Care & Service | 0 (0.0%) | 0 (0.0%) |
| Total (Category) | 50 (82.0%) | 11 (18.0%) |
| Total (Overall) | 218 (63.7%) | 124 (36.3%) |
Sales and Office Occupations
The most common Sales and Office occupations in Newell are Office & Administration (48 | 14.0%), and Sales & Related (7 | 2.1%).
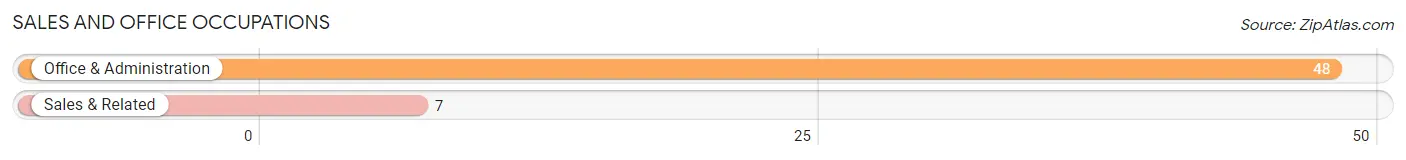
Sales and Office Occupations by Sex
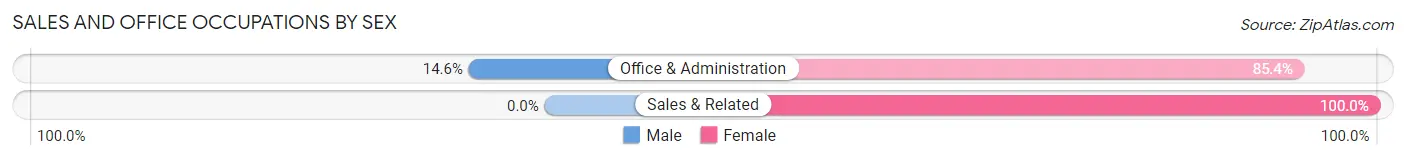
| Occupation | Male | Female |
| Sales & Related | 0 (0.0%) | 7 (100.0%) |
| Office & Administration | 7 (14.6%) | 41 (85.4%) |
| Total (Category) | 7 (12.7%) | 48 (87.3%) |
| Total (Overall) | 218 (63.7%) | 124 (36.3%) |
Natural Resources, Construction and Maintenance Occupations
The most common Natural Resources, Construction and Maintenance occupations in Newell are , and Construction & Extraction (8 | 2.3%).
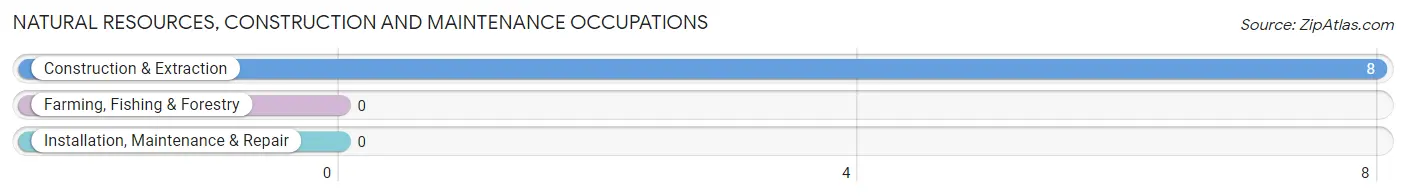
Natural Resources, Construction and Maintenance Occupations by Sex
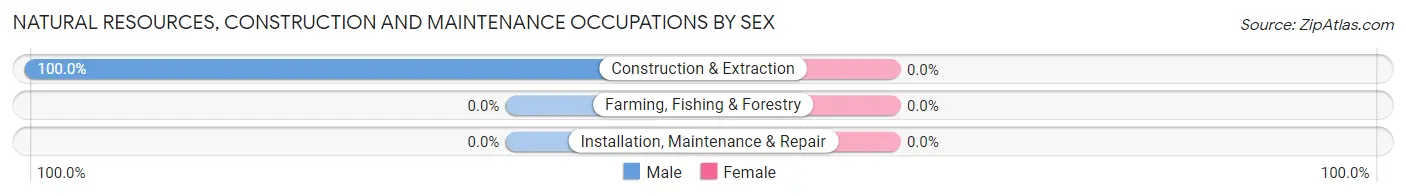
| Occupation | Male | Female |
| Farming, Fishing & Forestry | 0 (0.0%) | 0 (0.0%) |
| Construction & Extraction | 8 (100.0%) | 0 (0.0%) |
| Installation, Maintenance & Repair | 0 (0.0%) | 0 (0.0%) |
| Total (Category) | 8 (100.0%) | 0 (0.0%) |
| Total (Overall) | 218 (63.7%) | 124 (36.3%) |
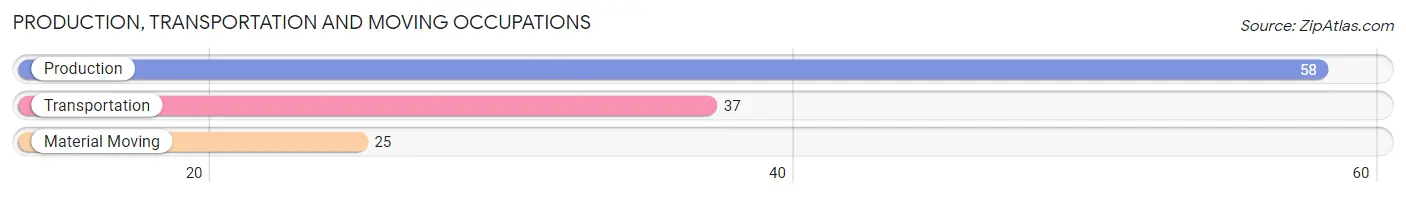
Production, Transportation and Moving Occupations
The most common Production, Transportation and Moving occupations in Newell are Production (58 | 17.0%), Transportation (37 | 10.8%), and Material Moving (25 | 7.3%).
Production, Transportation and Moving Occupations by Sex
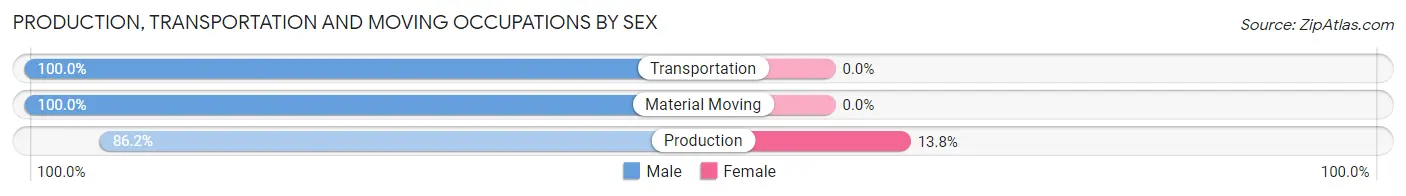
| Occupation | Male | Female |
| Production | 50 (86.2%) | 8 (13.8%) |
| Transportation | 37 (100.0%) | 0 (0.0%) |
| Material Moving | 25 (100.0%) | 0 (0.0%) |
| Total (Category) | 112 (93.3%) | 8 (6.7%) |
| Total (Overall) | 218 (63.7%) | 124 (36.3%) |
Employment Industries by Sex in Newell
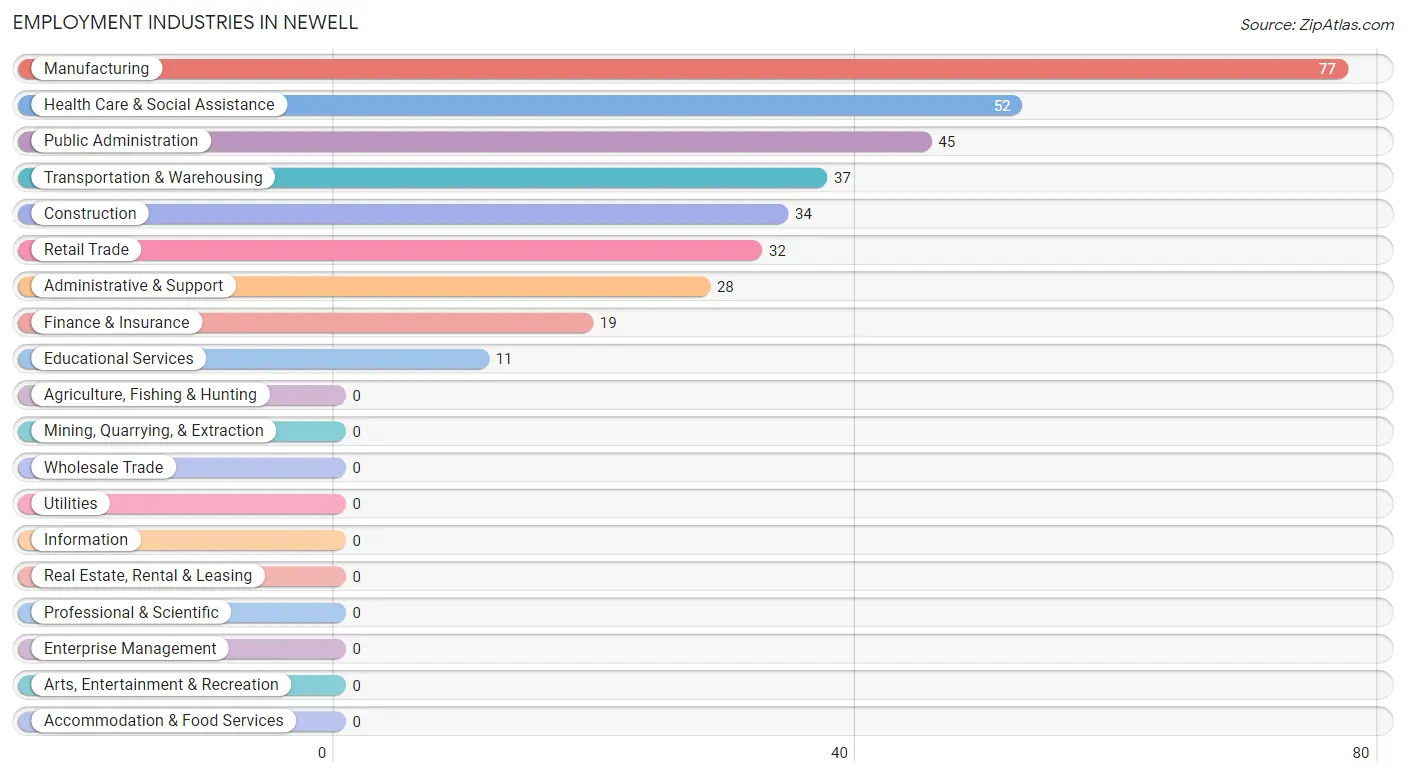
Employment Industries in Newell
The major employment industries in Newell include Manufacturing (77 | 22.5%), Health Care & Social Assistance (52 | 15.2%), Public Administration (45 | 13.2%), Transportation & Warehousing (37 | 10.8%), and Construction (34 | 9.9%).
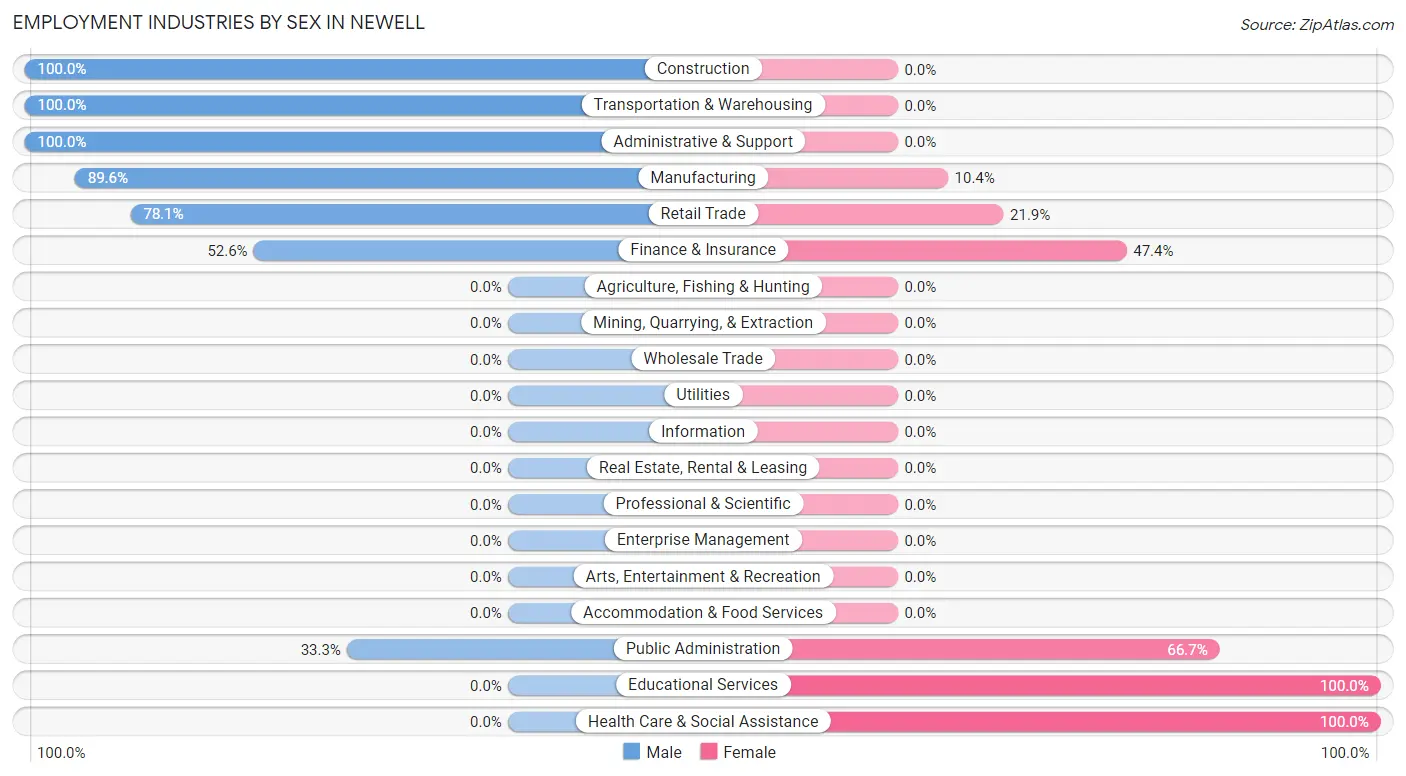
Employment Industries by Sex in Newell
The Newell industries that see more men than women are Construction (100.0%), Transportation & Warehousing (100.0%), and Administrative & Support (100.0%), whereas the industries that tend to have a higher number of women are Educational Services (100.0%), Health Care & Social Assistance (100.0%), and Public Administration (66.7%).
| Industry | Male | Female |
| Agriculture, Fishing & Hunting | 0 (0.0%) | 0 (0.0%) |
| Mining, Quarrying, & Extraction | 0 (0.0%) | 0 (0.0%) |
| Construction | 34 (100.0%) | 0 (0.0%) |
| Manufacturing | 69 (89.6%) | 8 (10.4%) |
| Wholesale Trade | 0 (0.0%) | 0 (0.0%) |
| Retail Trade | 25 (78.1%) | 7 (21.9%) |
| Transportation & Warehousing | 37 (100.0%) | 0 (0.0%) |
| Utilities | 0 (0.0%) | 0 (0.0%) |
| Information | 0 (0.0%) | 0 (0.0%) |
| Finance & Insurance | 10 (52.6%) | 9 (47.4%) |
| Real Estate, Rental & Leasing | 0 (0.0%) | 0 (0.0%) |
| Professional & Scientific | 0 (0.0%) | 0 (0.0%) |
| Enterprise Management | 0 (0.0%) | 0 (0.0%) |
| Administrative & Support | 28 (100.0%) | 0 (0.0%) |
| Educational Services | 0 (0.0%) | 11 (100.0%) |
| Health Care & Social Assistance | 0 (0.0%) | 52 (100.0%) |
| Arts, Entertainment & Recreation | 0 (0.0%) | 0 (0.0%) |
| Accommodation & Food Services | 0 (0.0%) | 0 (0.0%) |
| Public Administration | 15 (33.3%) | 30 (66.7%) |
| Total | 218 (63.7%) | 124 (36.3%) |
Education in Newell
School Enrollment in Newell
The most common levels of schooling among the 204 students in Newell are high school (66 | 32.4%), college / undergraduate (41 | 20.1%), and nursery / preschool (38 | 18.6%).
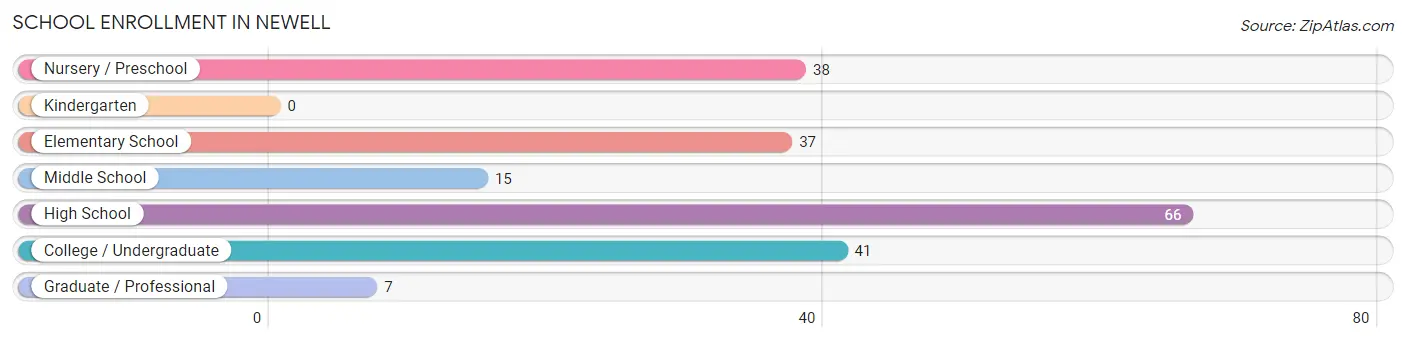
| School Level | # Students | % Students |
| Nursery / Preschool | 38 | 18.6% |
| Kindergarten | 0 | 0.0% |
| Elementary School | 37 | 18.1% |
| Middle School | 15 | 7.3% |
| High School | 66 | 32.4% |
| College / Undergraduate | 41 | 20.1% |
| Graduate / Professional | 7 | 3.4% |
| Total | 204 | 100.0% |
School Enrollment by Age by Funding Source in Newell
Out of a total of 204 students who are enrolled in schools in Newell, 7 (3.4%) attend a private institution, while the remaining 197 (96.6%) are enrolled in public schools. The age group of 35 years and over has the highest likelihood of being enrolled in private schools, with 7 (31.8% in the age bracket) enrolled. Conversely, the age group of 3 to 4 year olds has the lowest likelihood of being enrolled in a private school, with 16 (100.0% in the age bracket) attending a public institution.
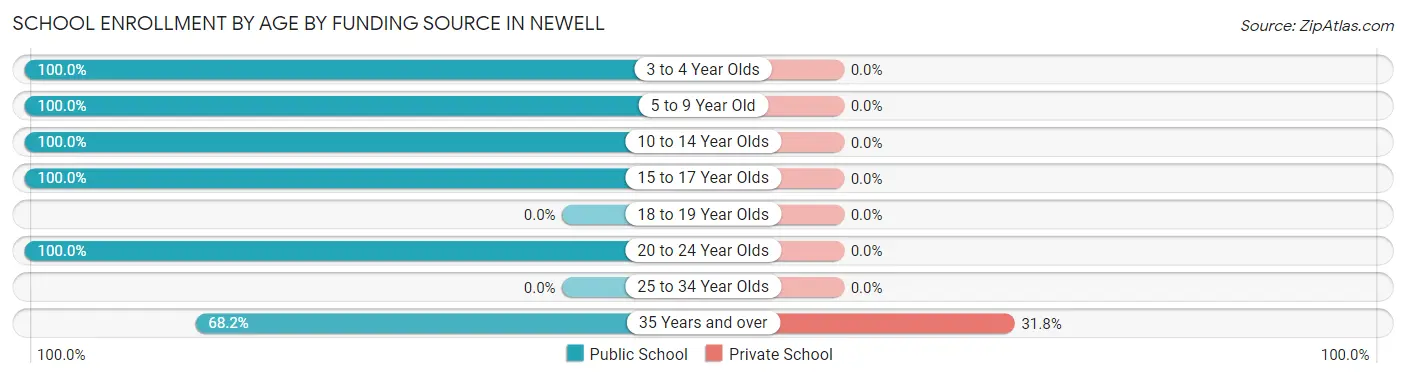
| Age Bracket | Public School | Private School |
| 3 to 4 Year Olds | 16 (100.0%) | 0 (0.0%) |
| 5 to 9 Year Old | 59 (100.0%) | 0 (0.0%) |
| 10 to 14 Year Olds | 15 (100.0%) | 0 (0.0%) |
| 15 to 17 Year Olds | 66 (100.0%) | 0 (0.0%) |
| 18 to 19 Year Olds | 0 (0.0%) | 0 (0.0%) |
| 20 to 24 Year Olds | 26 (100.0%) | 0 (0.0%) |
| 25 to 34 Year Olds | 0 (0.0%) | 0 (0.0%) |
| 35 Years and over | 15 (68.2%) | 7 (31.8%) |
| Total | 197 (96.6%) | 7 (3.4%) |
Educational Attainment by Field of Study in Newell
Education (41 | 26.8%), social sciences (25 | 16.3%), liberal arts & history (24 | 15.7%), science & technology (21 | 13.7%), and psychology (16 | 10.5%) are the most common fields of study among 153 individuals in Newell who have obtained a bachelor's degree or higher.
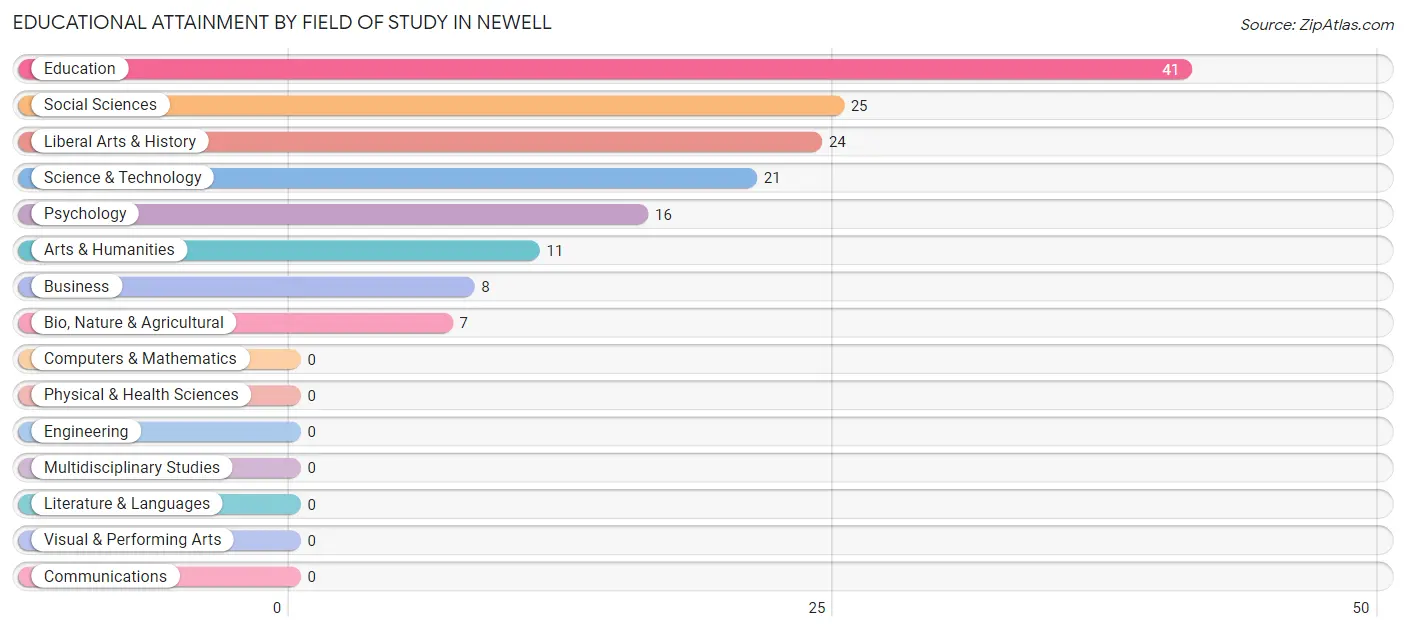
| Field of Study | # Graduates | % Graduates |
| Computers & Mathematics | 0 | 0.0% |
| Bio, Nature & Agricultural | 7 | 4.6% |
| Physical & Health Sciences | 0 | 0.0% |
| Psychology | 16 | 10.5% |
| Social Sciences | 25 | 16.3% |
| Engineering | 0 | 0.0% |
| Multidisciplinary Studies | 0 | 0.0% |
| Science & Technology | 21 | 13.7% |
| Business | 8 | 5.2% |
| Education | 41 | 26.8% |
| Literature & Languages | 0 | 0.0% |
| Liberal Arts & History | 24 | 15.7% |
| Visual & Performing Arts | 0 | 0.0% |
| Communications | 0 | 0.0% |
| Arts & Humanities | 11 | 7.2% |
| Total | 153 | 100.0% |
Transportation & Commute in Newell
Vehicle Availability by Sex in Newell
The most prevalent vehicle ownership categories in Newell are males with 2 vehicles (91, accounting for 41.7%) and females with 2 vehicles (53, making up 73.4%).
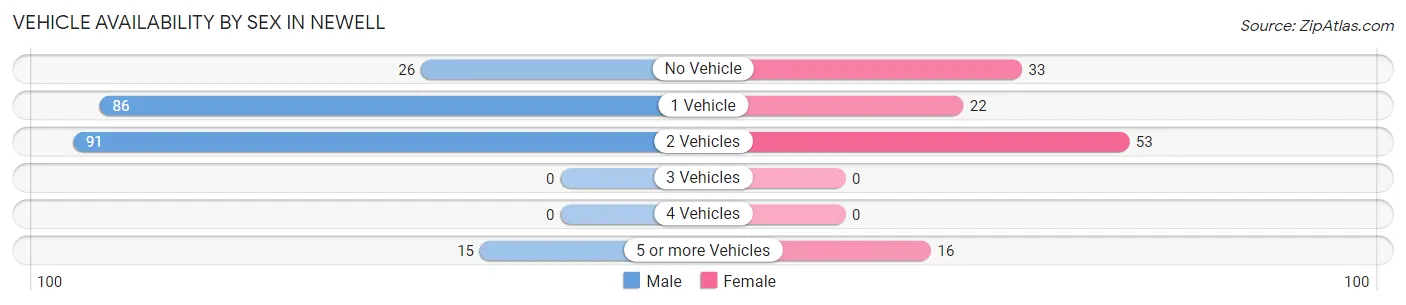
| Vehicles Available | Male | Female |
| No Vehicle | 26 (11.9%) | 33 (26.6%) |
| 1 Vehicle | 86 (39.5%) | 22 (17.7%) |
| 2 Vehicles | 91 (41.7%) | 53 (42.7%) |
| 3 Vehicles | 0 (0.0%) | 0 (0.0%) |
| 4 Vehicles | 0 (0.0%) | 0 (0.0%) |
| 5 or more Vehicles | 15 (6.9%) | 16 (12.9%) |
| Total | 218 (100.0%) | 124 (100.0%) |
Commute Time in Newell
The most frequently occuring commute durations in Newell are 5 to 9 minutes (75 commuters, 22.9%), 25 to 29 minutes (70 commuters, 21.4%), and 20 to 24 minutes (37 commuters, 11.3%).
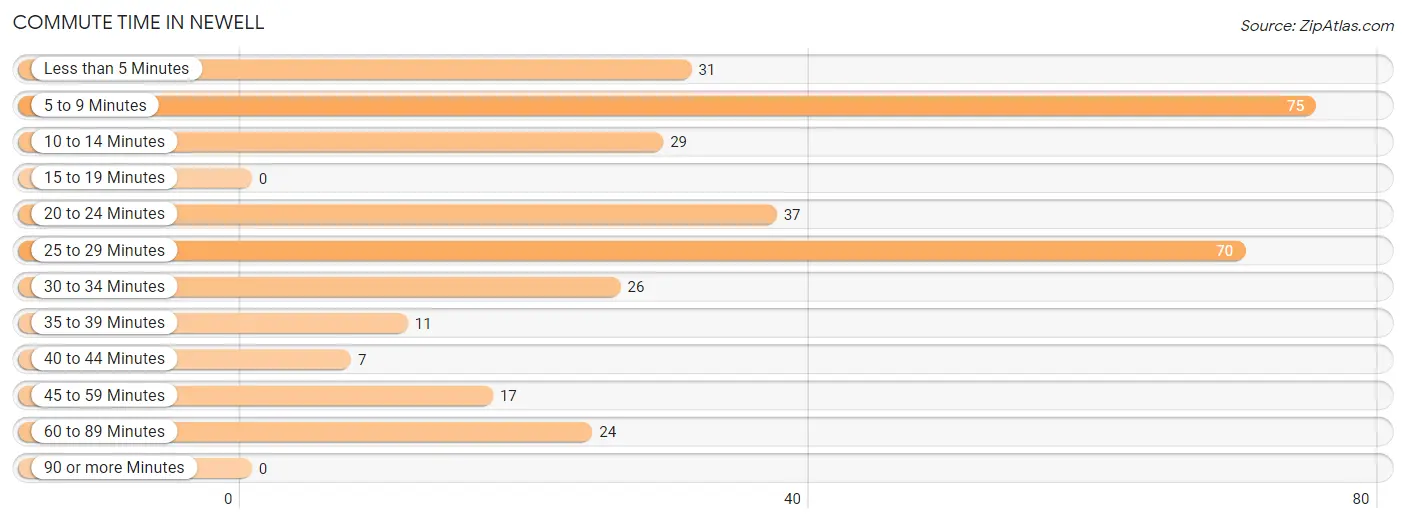
| Commute Time | # Commuters | % Commuters |
| Less than 5 Minutes | 31 | 9.5% |
| 5 to 9 Minutes | 75 | 22.9% |
| 10 to 14 Minutes | 29 | 8.9% |
| 15 to 19 Minutes | 0 | 0.0% |
| 20 to 24 Minutes | 37 | 11.3% |
| 25 to 29 Minutes | 70 | 21.4% |
| 30 to 34 Minutes | 26 | 8.0% |
| 35 to 39 Minutes | 11 | 3.4% |
| 40 to 44 Minutes | 7 | 2.1% |
| 45 to 59 Minutes | 17 | 5.2% |
| 60 to 89 Minutes | 24 | 7.3% |
| 90 or more Minutes | 0 | 0.0% |
Commute Time by Sex in Newell
The most common commute times in Newell are 5 to 9 minutes (58 commuters, 28.6%) for males and 25 to 29 minutes (33 commuters, 26.6%) for females.
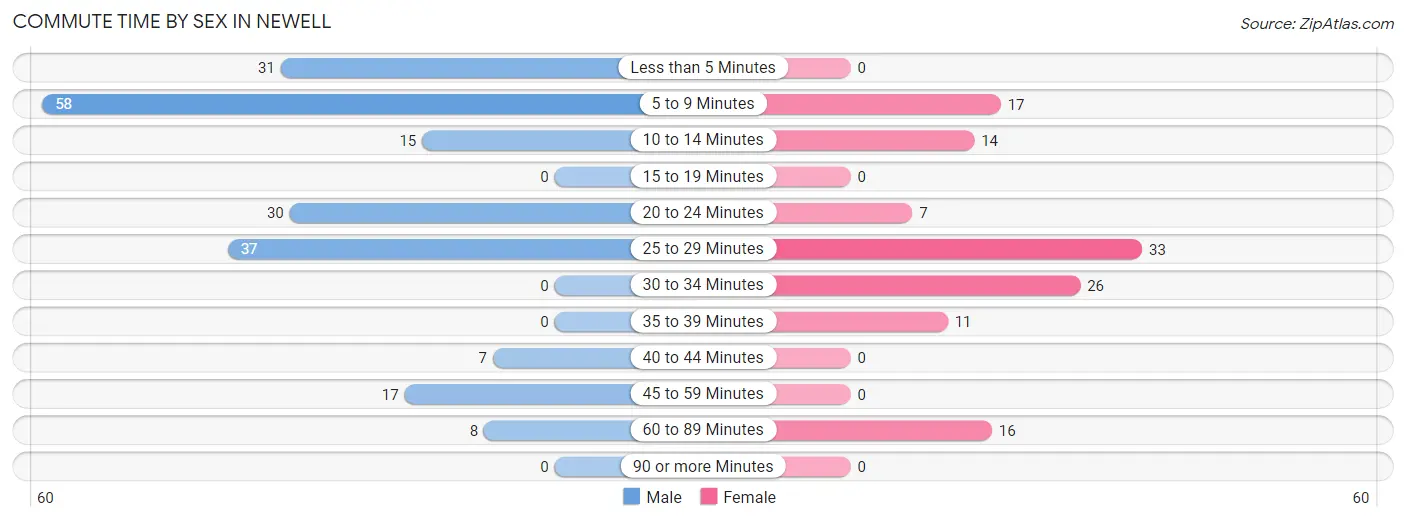
| Commute Time | Male | Female |
| Less than 5 Minutes | 31 (15.3%) | 0 (0.0%) |
| 5 to 9 Minutes | 58 (28.6%) | 17 (13.7%) |
| 10 to 14 Minutes | 15 (7.4%) | 14 (11.3%) |
| 15 to 19 Minutes | 0 (0.0%) | 0 (0.0%) |
| 20 to 24 Minutes | 30 (14.8%) | 7 (5.7%) |
| 25 to 29 Minutes | 37 (18.2%) | 33 (26.6%) |
| 30 to 34 Minutes | 0 (0.0%) | 26 (21.0%) |
| 35 to 39 Minutes | 0 (0.0%) | 11 (8.9%) |
| 40 to 44 Minutes | 7 (3.5%) | 0 (0.0%) |
| 45 to 59 Minutes | 17 (8.4%) | 0 (0.0%) |
| 60 to 89 Minutes | 8 (3.9%) | 16 (12.9%) |
| 90 or more Minutes | 0 (0.0%) | 0 (0.0%) |
Time of Departure to Work by Sex in Newell
The most frequent times of departure to work in Newell are 6:00 AM to 6:29 AM (69, 34.0%) for males and 7:30 AM to 7:59 AM (26, 21.0%) for females.
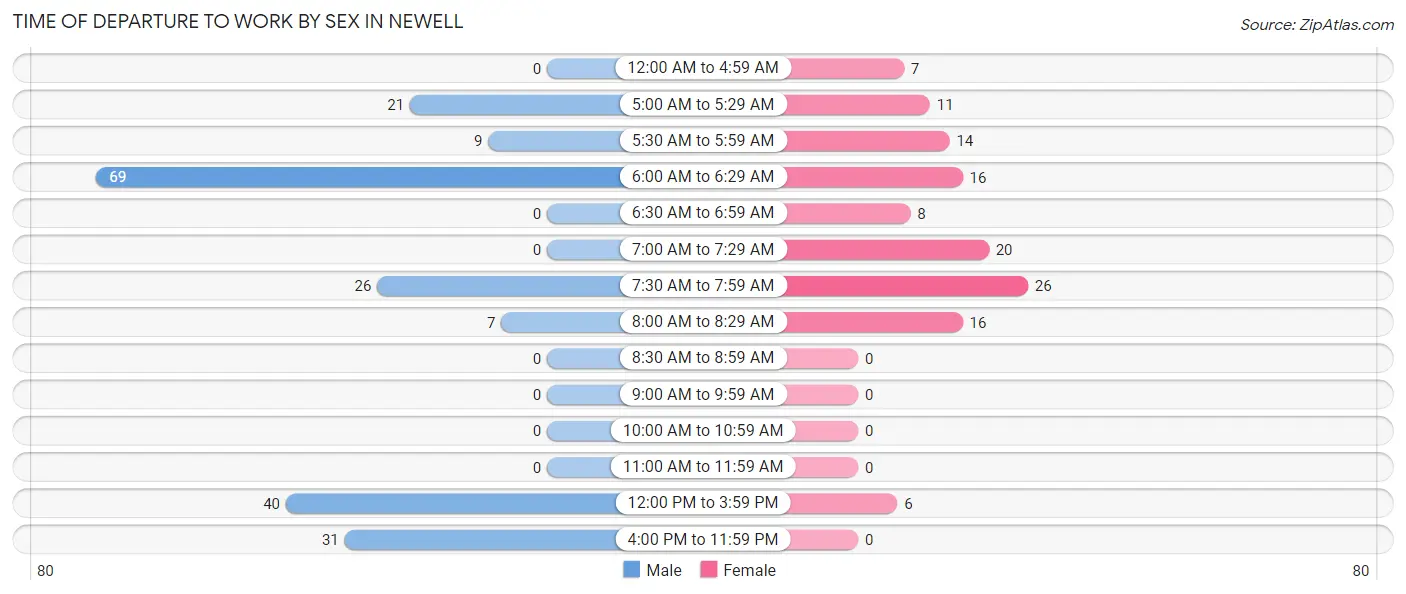
| Time of Departure | Male | Female |
| 12:00 AM to 4:59 AM | 0 (0.0%) | 7 (5.7%) |
| 5:00 AM to 5:29 AM | 21 (10.3%) | 11 (8.9%) |
| 5:30 AM to 5:59 AM | 9 (4.4%) | 14 (11.3%) |
| 6:00 AM to 6:29 AM | 69 (34.0%) | 16 (12.9%) |
| 6:30 AM to 6:59 AM | 0 (0.0%) | 8 (6.5%) |
| 7:00 AM to 7:29 AM | 0 (0.0%) | 20 (16.1%) |
| 7:30 AM to 7:59 AM | 26 (12.8%) | 26 (21.0%) |
| 8:00 AM to 8:29 AM | 7 (3.5%) | 16 (12.9%) |
| 8:30 AM to 8:59 AM | 0 (0.0%) | 0 (0.0%) |
| 9:00 AM to 9:59 AM | 0 (0.0%) | 0 (0.0%) |
| 10:00 AM to 10:59 AM | 0 (0.0%) | 0 (0.0%) |
| 11:00 AM to 11:59 AM | 0 (0.0%) | 0 (0.0%) |
| 12:00 PM to 3:59 PM | 40 (19.7%) | 6 (4.8%) |
| 4:00 PM to 11:59 PM | 31 (15.3%) | 0 (0.0%) |
| Total | 203 (100.0%) | 124 (100.0%) |
Housing Occupancy in Newell
Occupancy by Ownership in Newell
Of the total 529 dwellings in Newell, owner-occupied units account for 282 (53.3%), while renter-occupied units make up 247 (46.7%).
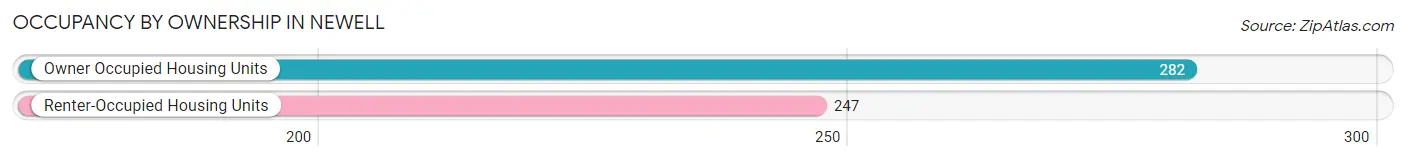
| Occupancy | # Housing Units | % Housing Units |
| Owner Occupied Housing Units | 282 | 53.3% |
| Renter-Occupied Housing Units | 247 | 46.7% |
| Total Occupied Housing Units | 529 | 100.0% |
Occupancy by Household Size in Newell
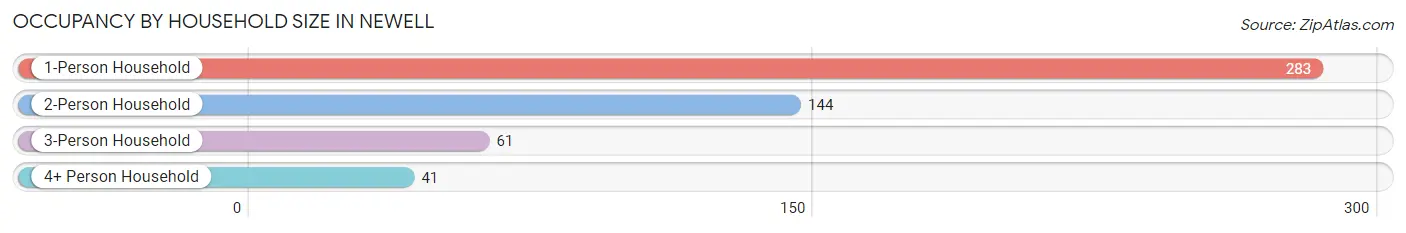
| Household Size | # Housing Units | % Housing Units |
| 1-Person Household | 283 | 53.5% |
| 2-Person Household | 144 | 27.2% |
| 3-Person Household | 61 | 11.5% |
| 4+ Person Household | 41 | 7.7% |
| Total Housing Units | 529 | 100.0% |
Occupancy by Ownership by Household Size in Newell
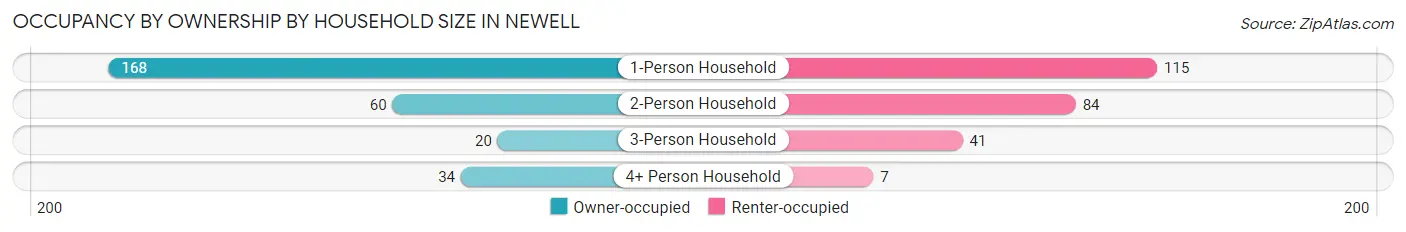
| Household Size | Owner-occupied | Renter-occupied |
| 1-Person Household | 168 (59.4%) | 115 (40.6%) |
| 2-Person Household | 60 (41.7%) | 84 (58.3%) |
| 3-Person Household | 20 (32.8%) | 41 (67.2%) |
| 4+ Person Household | 34 (82.9%) | 7 (17.1%) |
| Total Housing Units | 282 (53.3%) | 247 (46.7%) |
Occupancy by Educational Attainment in Newell
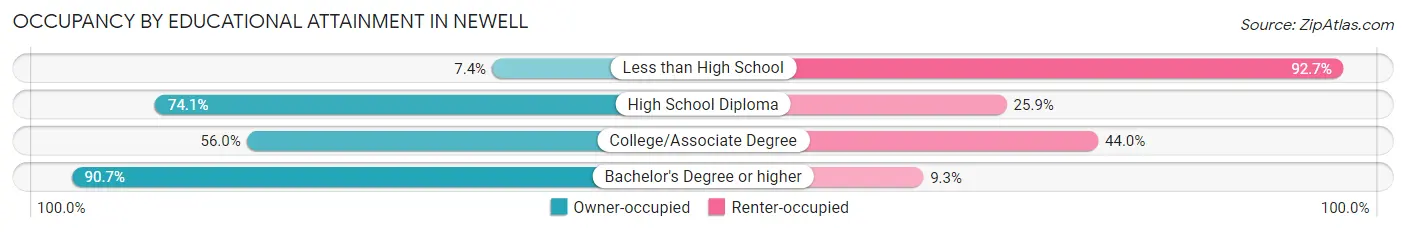
| Household Size | Owner-occupied | Renter-occupied |
| Less than High School | 10 (7.3%) | 126 (92.6%) |
| High School Diploma | 106 (74.1%) | 37 (25.9%) |
| College/Associate Degree | 98 (56.0%) | 77 (44.0%) |
| Bachelor's Degree or higher | 68 (90.7%) | 7 (9.3%) |
Occupancy by Age of Householder in Newell
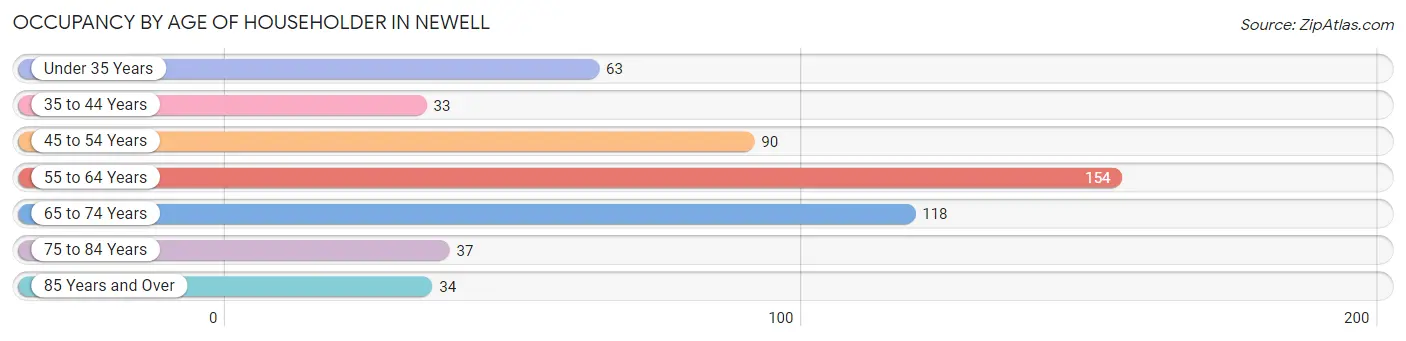
| Age Bracket | # Households | % Households |
| Under 35 Years | 63 | 11.9% |
| 35 to 44 Years | 33 | 6.2% |
| 45 to 54 Years | 90 | 17.0% |
| 55 to 64 Years | 154 | 29.1% |
| 65 to 74 Years | 118 | 22.3% |
| 75 to 84 Years | 37 | 7.0% |
| 85 Years and Over | 34 | 6.4% |
| Total | 529 | 100.0% |
Housing Finances in Newell
Median Income by Occupancy in Newell
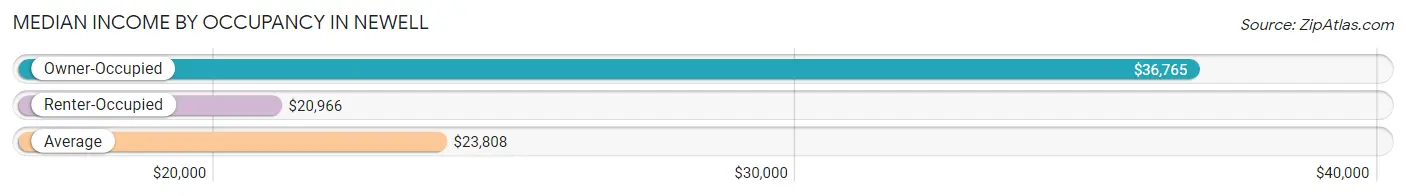
| Occupancy Type | # Households | Median Income |
| Owner-Occupied | 282 (53.3%) | $36,765 |
| Renter-Occupied | 247 (46.7%) | $20,966 |
| Average | 529 (100.0%) | $23,808 |
Occupancy by Householder Income Bracket in Newell
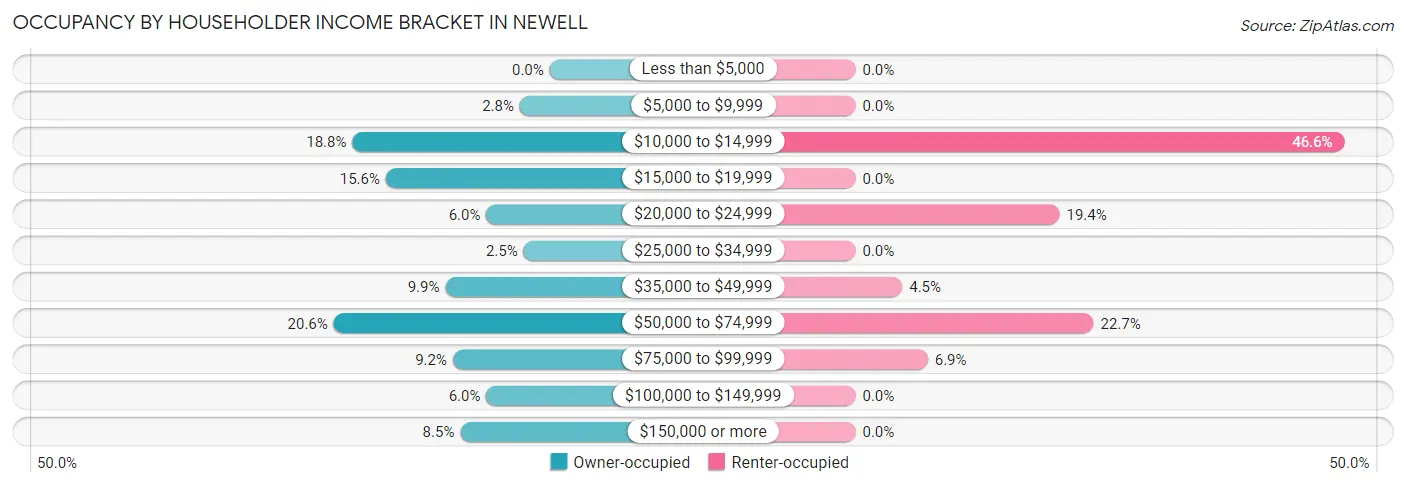
| Income Bracket | Owner-occupied | Renter-occupied |
| Less than $5,000 | 0 (0.0%) | 0 (0.0%) |
| $5,000 to $9,999 | 8 (2.8%) | 0 (0.0%) |
| $10,000 to $14,999 | 53 (18.8%) | 115 (46.6%) |
| $15,000 to $19,999 | 44 (15.6%) | 0 (0.0%) |
| $20,000 to $24,999 | 17 (6.0%) | 48 (19.4%) |
| $25,000 to $34,999 | 7 (2.5%) | 0 (0.0%) |
| $35,000 to $49,999 | 28 (9.9%) | 11 (4.4%) |
| $50,000 to $74,999 | 58 (20.6%) | 56 (22.7%) |
| $75,000 to $99,999 | 26 (9.2%) | 17 (6.9%) |
| $100,000 to $149,999 | 17 (6.0%) | 0 (0.0%) |
| $150,000 or more | 24 (8.5%) | 0 (0.0%) |
| Total | 282 (100.0%) | 247 (100.0%) |
Monthly Housing Cost Tiers in Newell
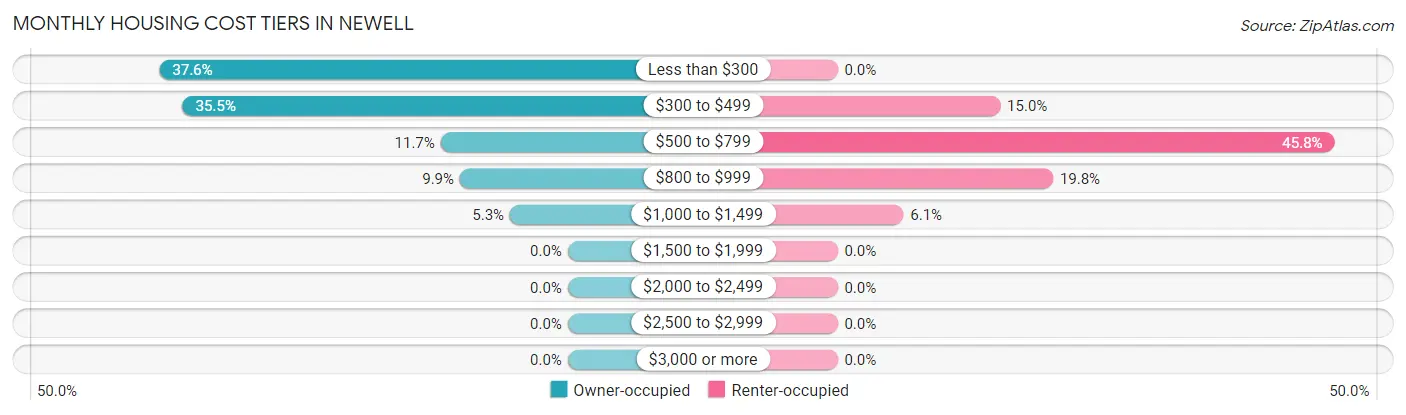
| Monthly Cost | Owner-occupied | Renter-occupied |
| Less than $300 | 106 (37.6%) | 0 (0.0%) |
| $300 to $499 | 100 (35.5%) | 37 (15.0%) |
| $500 to $799 | 33 (11.7%) | 113 (45.8%) |
| $800 to $999 | 28 (9.9%) | 49 (19.8%) |
| $1,000 to $1,499 | 15 (5.3%) | 15 (6.1%) |
| $1,500 to $1,999 | 0 (0.0%) | 0 (0.0%) |
| $2,000 to $2,499 | 0 (0.0%) | 0 (0.0%) |
| $2,500 to $2,999 | 0 (0.0%) | 0 (0.0%) |
| $3,000 or more | 0 (0.0%) | 0 (0.0%) |
| Total | 282 (100.0%) | 247 (100.0%) |
Physical Housing Characteristics in Newell
Housing Structures in Newell
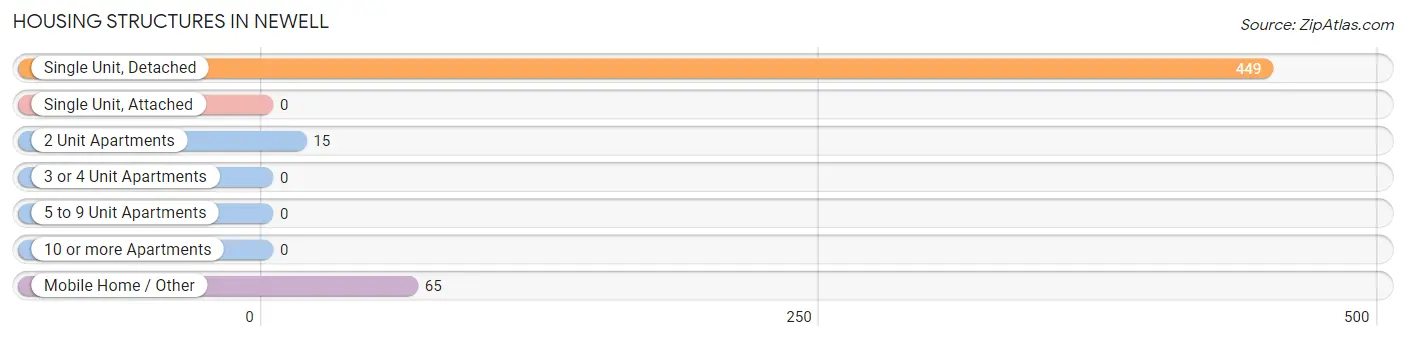
| Structure Type | # Housing Units | % Housing Units |
| Single Unit, Detached | 449 | 84.9% |
| Single Unit, Attached | 0 | 0.0% |
| 2 Unit Apartments | 15 | 2.8% |
| 3 or 4 Unit Apartments | 0 | 0.0% |
| 5 to 9 Unit Apartments | 0 | 0.0% |
| 10 or more Apartments | 0 | 0.0% |
| Mobile Home / Other | 65 | 12.3% |
| Total | 529 | 100.0% |
Housing Structures by Occupancy in Newell
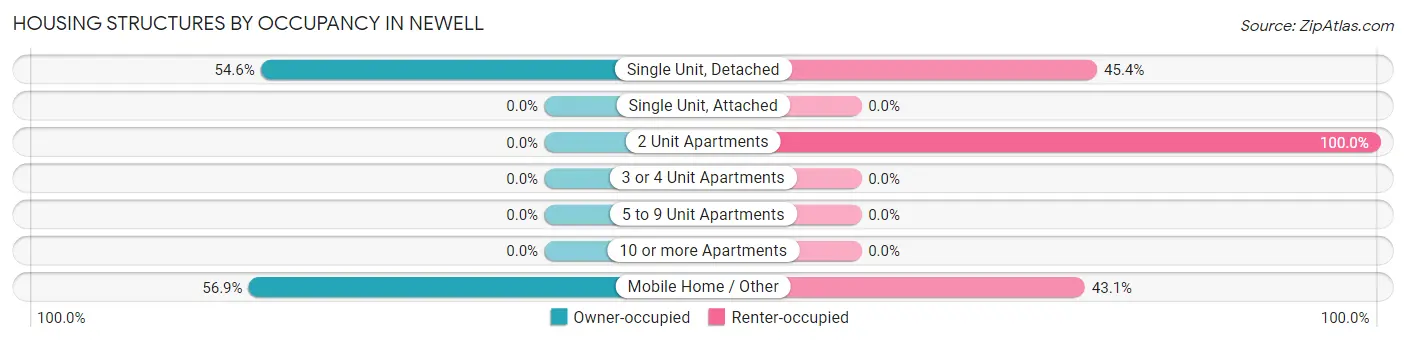
| Structure Type | Owner-occupied | Renter-occupied |
| Single Unit, Detached | 245 (54.6%) | 204 (45.4%) |
| Single Unit, Attached | 0 (0.0%) | 0 (0.0%) |
| 2 Unit Apartments | 0 (0.0%) | 15 (100.0%) |
| 3 or 4 Unit Apartments | 0 (0.0%) | 0 (0.0%) |
| 5 to 9 Unit Apartments | 0 (0.0%) | 0 (0.0%) |
| 10 or more Apartments | 0 (0.0%) | 0 (0.0%) |
| Mobile Home / Other | 37 (56.9%) | 28 (43.1%) |
| Total | 282 (53.3%) | 247 (46.7%) |
Housing Structures by Number of Rooms in Newell
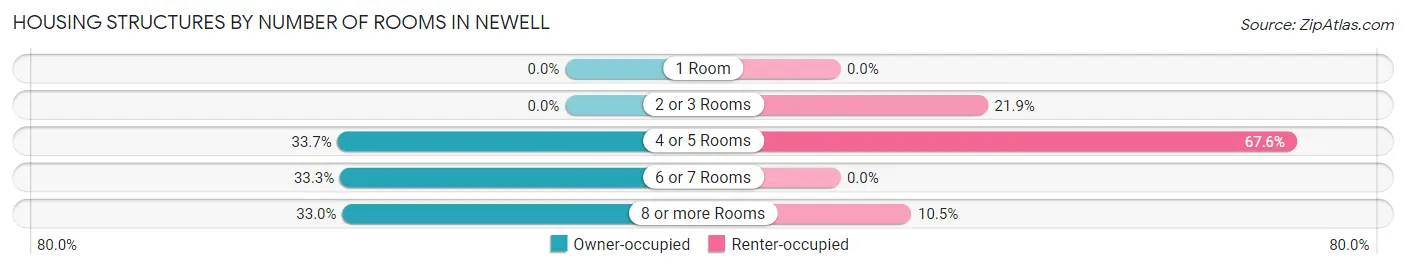
| Number of Rooms | Owner-occupied | Renter-occupied |
| 1 Room | 0 (0.0%) | 0 (0.0%) |
| 2 or 3 Rooms | 0 (0.0%) | 54 (21.9%) |
| 4 or 5 Rooms | 95 (33.7%) | 167 (67.6%) |
| 6 or 7 Rooms | 94 (33.3%) | 0 (0.0%) |
| 8 or more Rooms | 93 (33.0%) | 26 (10.5%) |
| Total | 282 (100.0%) | 247 (100.0%) |
Housing Structure by Heating Type in Newell
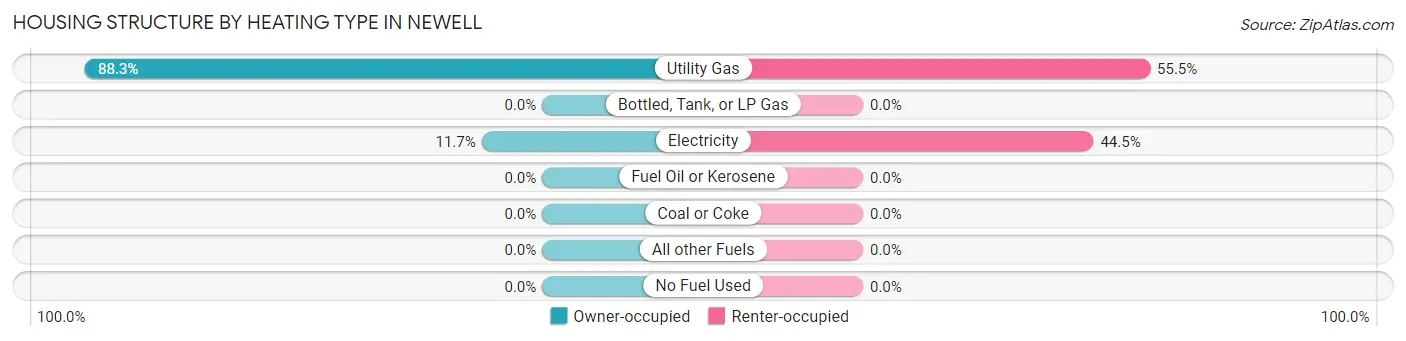
| Heating Type | Owner-occupied | Renter-occupied |
| Utility Gas | 249 (88.3%) | 137 (55.5%) |
| Bottled, Tank, or LP Gas | 0 (0.0%) | 0 (0.0%) |
| Electricity | 33 (11.7%) | 110 (44.5%) |
| Fuel Oil or Kerosene | 0 (0.0%) | 0 (0.0%) |
| Coal or Coke | 0 (0.0%) | 0 (0.0%) |
| All other Fuels | 0 (0.0%) | 0 (0.0%) |
| No Fuel Used | 0 (0.0%) | 0 (0.0%) |
| Total | 282 (100.0%) | 247 (100.0%) |
Household Vehicle Usage in Newell
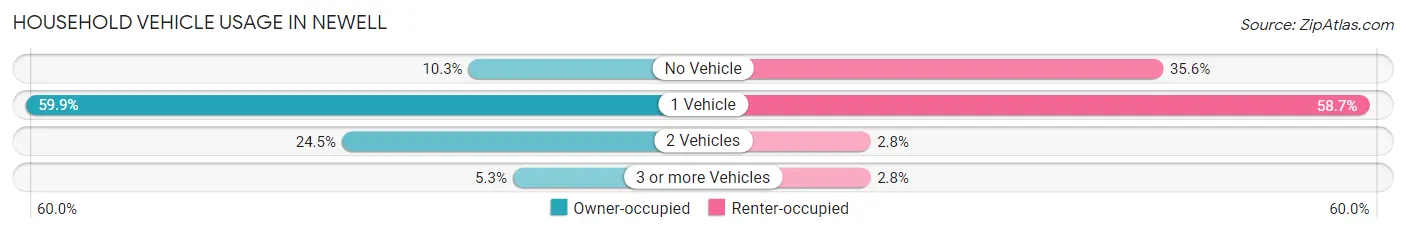
| Vehicles per Household | Owner-occupied | Renter-occupied |
| No Vehicle | 29 (10.3%) | 88 (35.6%) |
| 1 Vehicle | 169 (59.9%) | 145 (58.7%) |
| 2 Vehicles | 69 (24.5%) | 7 (2.8%) |
| 3 or more Vehicles | 15 (5.3%) | 7 (2.8%) |
| Total | 282 (100.0%) | 247 (100.0%) |
Real Estate & Mortgages in Newell
Real Estate and Mortgage Overview in Newell
| Characteristic | Without Mortgage | With Mortgage |
| Housing Units | 196 | 86 |
| Median Property Value | $80,200 | $80,500 |
| Median Household Income | - | - |
| Monthly Housing Costs | $286 | $0 |
| Real Estate Taxes | $199 | $8 |
Property Value by Mortgage Status in Newell
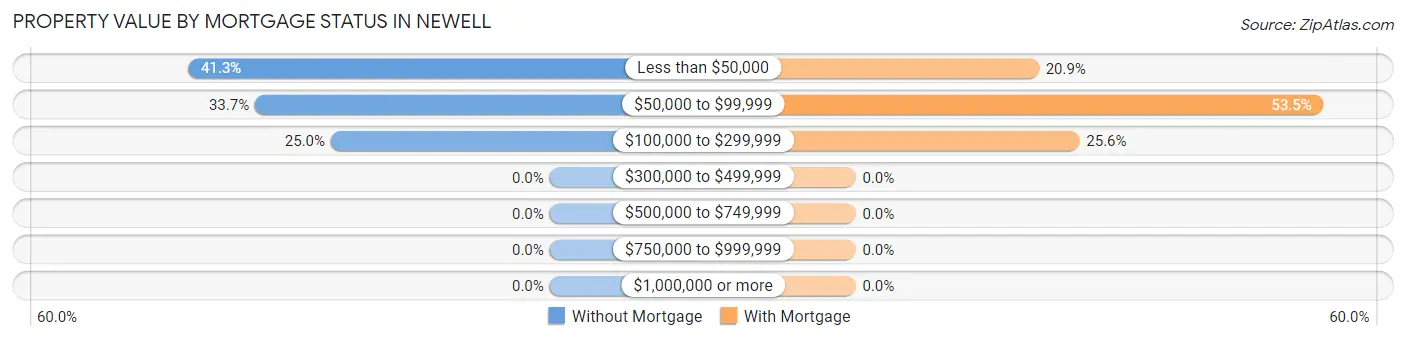
| Property Value | Without Mortgage | With Mortgage |
| Less than $50,000 | 81 (41.3%) | 18 (20.9%) |
| $50,000 to $99,999 | 66 (33.7%) | 46 (53.5%) |
| $100,000 to $299,999 | 49 (25.0%) | 22 (25.6%) |
| $300,000 to $499,999 | 0 (0.0%) | 0 (0.0%) |
| $500,000 to $749,999 | 0 (0.0%) | 0 (0.0%) |
| $750,000 to $999,999 | 0 (0.0%) | 0 (0.0%) |
| $1,000,000 or more | 0 (0.0%) | 0 (0.0%) |
| Total | 196 (100.0%) | 86 (100.0%) |
Household Income by Mortgage Status in Newell
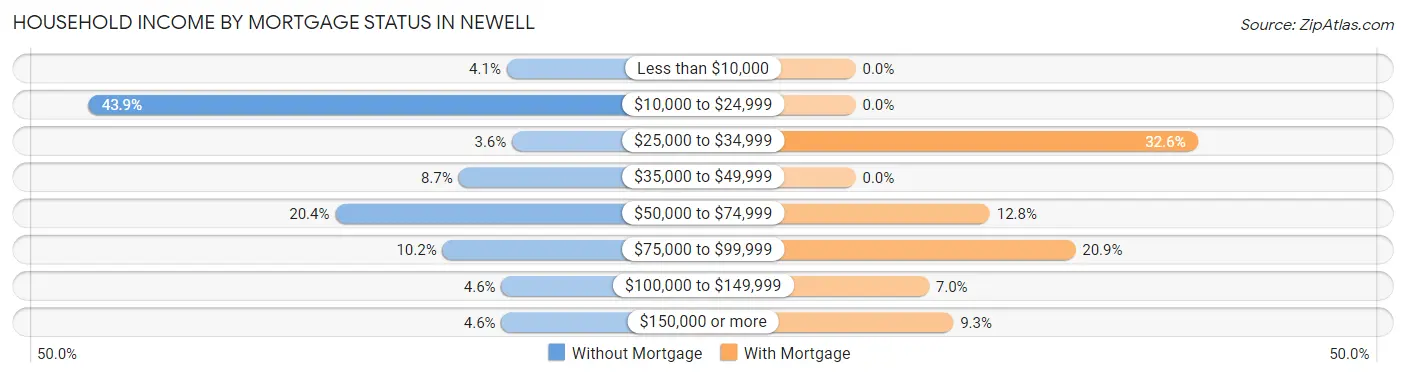
| Household Income | Without Mortgage | With Mortgage |
| Less than $10,000 | 8 (4.1%) | 0 (0.0%) |
| $10,000 to $24,999 | 86 (43.9%) | 0 (0.0%) |
| $25,000 to $34,999 | 7 (3.6%) | 28 (32.6%) |
| $35,000 to $49,999 | 17 (8.7%) | 0 (0.0%) |
| $50,000 to $74,999 | 40 (20.4%) | 11 (12.8%) |
| $75,000 to $99,999 | 20 (10.2%) | 18 (20.9%) |
| $100,000 to $149,999 | 9 (4.6%) | 6 (7.0%) |
| $150,000 or more | 9 (4.6%) | 8 (9.3%) |
| Total | 196 (100.0%) | 86 (100.0%) |
Property Value to Household Income Ratio in Newell
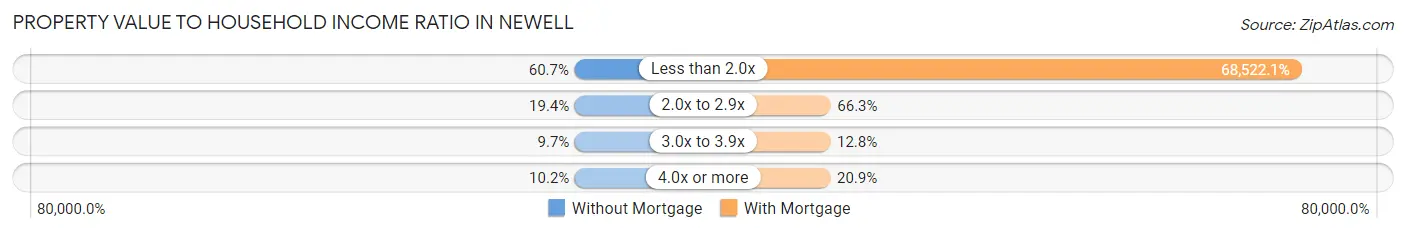
| Value-to-Income Ratio | Without Mortgage | With Mortgage |
| Less than 2.0x | 119 (60.7%) | 58,929 (68,522.1%) |
| 2.0x to 2.9x | 38 (19.4%) | 57 (66.3%) |
| 3.0x to 3.9x | 19 (9.7%) | 11 (12.8%) |
| 4.0x or more | 20 (10.2%) | 18 (20.9%) |
| Total | 196 (100.0%) | 86 (100.0%) |
Real Estate Taxes by Mortgage Status in Newell
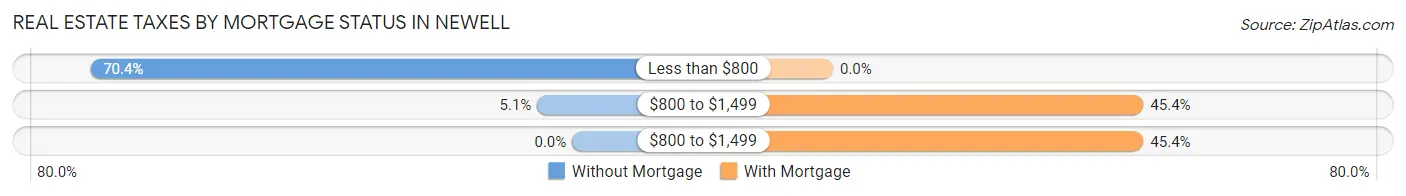
| Property Taxes | Without Mortgage | With Mortgage |
| Less than $800 | 138 (70.4%) | 0 (0.0%) |
| $800 to $1,499 | 10 (5.1%) | 39 (45.4%) |
| $800 to $1,499 | 0 (0.0%) | 39 (45.4%) |
| Total | 196 (100.0%) | 86 (100.0%) |
Health & Disability in Newell
Health Insurance Coverage by Age in Newell
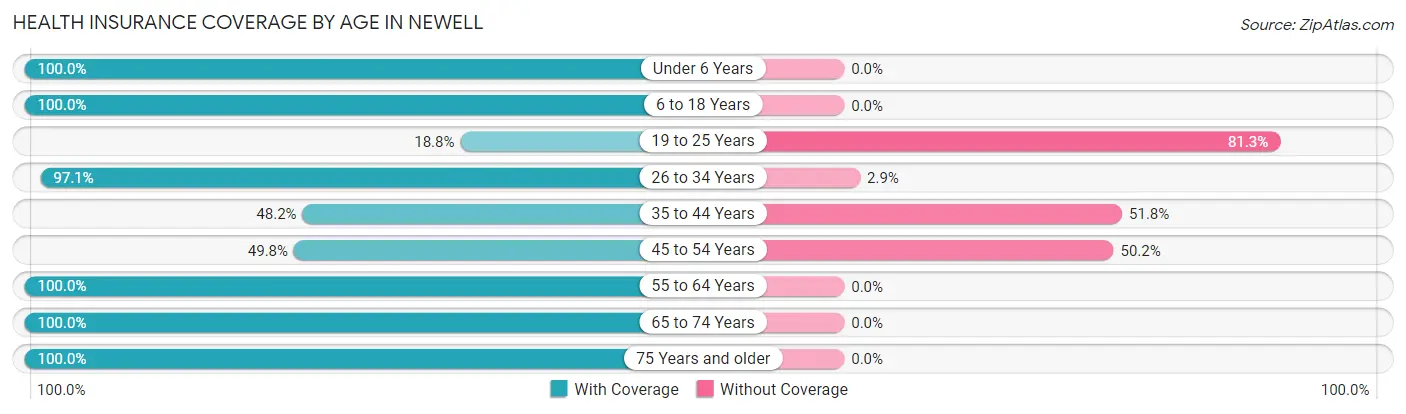
| Age Bracket | With Coverage | Without Coverage |
| Under 6 Years | 79 (100.0%) | 0 (0.0%) |
| 6 to 18 Years | 169 (100.0%) | 0 (0.0%) |
| 19 to 25 Years | 6 (18.8%) | 26 (81.2%) |
| 26 to 34 Years | 99 (97.1%) | 3 (2.9%) |
| 35 to 44 Years | 40 (48.2%) | 43 (51.8%) |
| 45 to 54 Years | 121 (49.8%) | 122 (50.2%) |
| 55 to 64 Years | 207 (100.0%) | 0 (0.0%) |
| 65 to 74 Years | 132 (100.0%) | 0 (0.0%) |
| 75 Years and older | 82 (100.0%) | 0 (0.0%) |
| Total | 935 (82.8%) | 194 (17.2%) |
Health Insurance Coverage by Citizenship Status in Newell
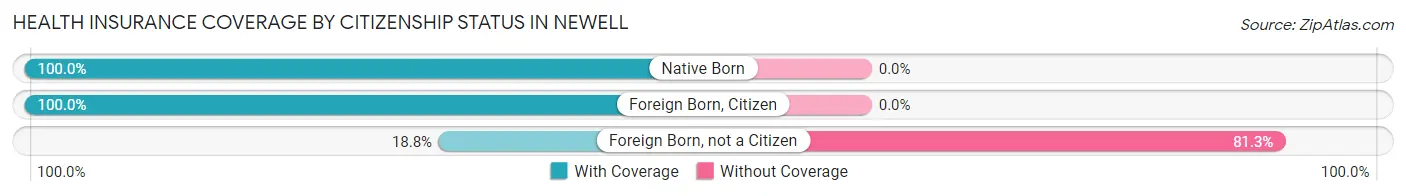
| Citizenship Status | With Coverage | Without Coverage |
| Native Born | 79 (100.0%) | 0 (0.0%) |
| Foreign Born, Citizen | 169 (100.0%) | 0 (0.0%) |
| Foreign Born, not a Citizen | 6 (18.8%) | 26 (81.2%) |
Health Insurance Coverage by Household Income in Newell
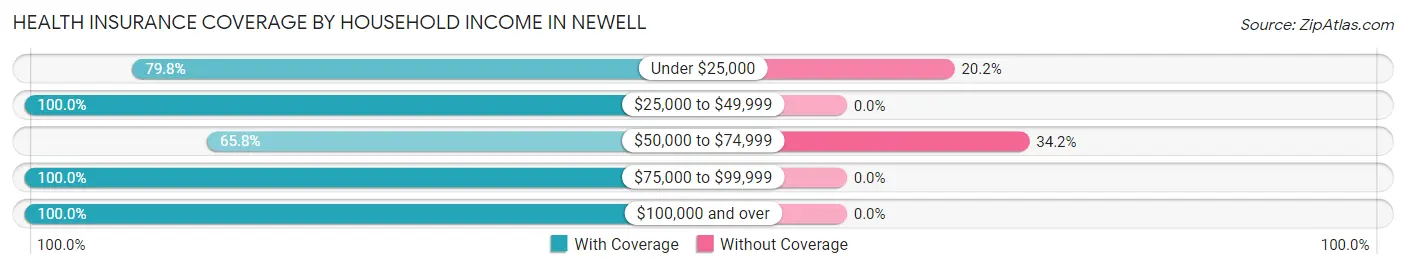
| Household Income | With Coverage | Without Coverage |
| Under $25,000 | 356 (79.8%) | 90 (20.2%) |
| $25,000 to $49,999 | 76 (100.0%) | 0 (0.0%) |
| $50,000 to $74,999 | 200 (65.8%) | 104 (34.2%) |
| $75,000 to $99,999 | 122 (100.0%) | 0 (0.0%) |
| $100,000 and over | 181 (100.0%) | 0 (0.0%) |
Public vs Private Health Insurance Coverage by Age in Newell
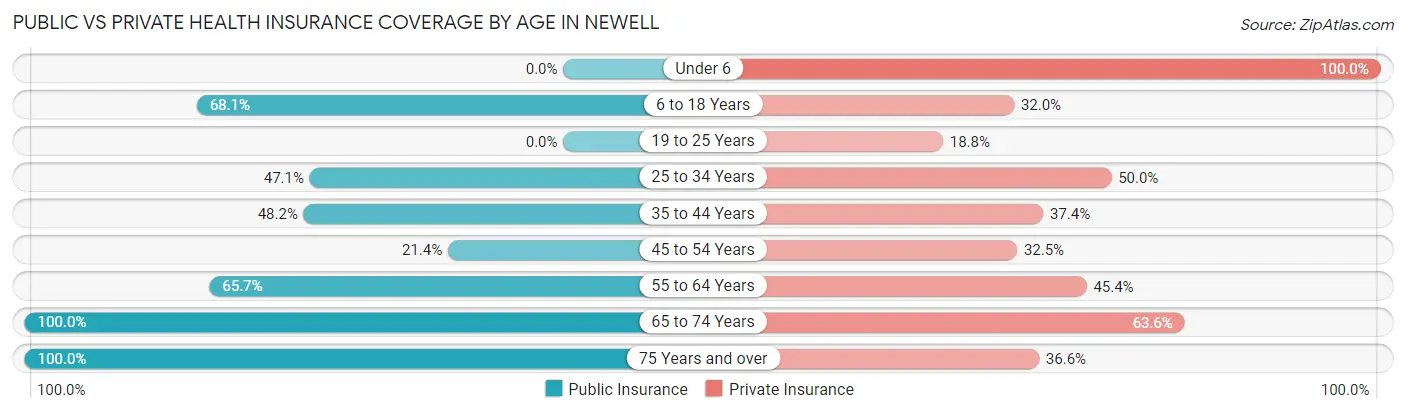
| Age Bracket | Public Insurance | Private Insurance |
| Under 6 | 0 (0.0%) | 79 (100.0%) |
| 6 to 18 Years | 115 (68.0%) | 54 (32.0%) |
| 19 to 25 Years | 0 (0.0%) | 6 (18.8%) |
| 25 to 34 Years | 48 (47.1%) | 51 (50.0%) |
| 35 to 44 Years | 40 (48.2%) | 31 (37.3%) |
| 45 to 54 Years | 52 (21.4%) | 79 (32.5%) |
| 55 to 64 Years | 136 (65.7%) | 94 (45.4%) |
| 65 to 74 Years | 132 (100.0%) | 84 (63.6%) |
| 75 Years and over | 82 (100.0%) | 30 (36.6%) |
| Total | 605 (53.6%) | 508 (45.0%) |
Disability Status by Sex by Age in Newell
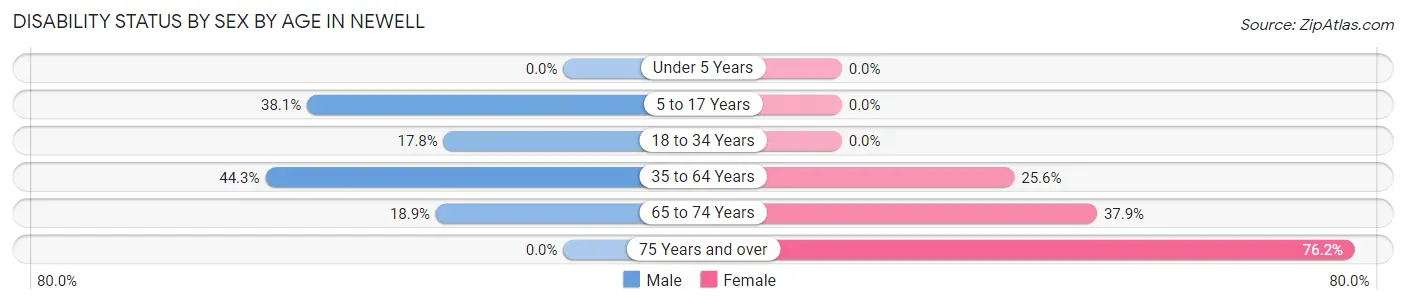
| Age Bracket | Male | Female |
| Under 5 Years | 0 (0.0%) | 0 (0.0%) |
| 5 to 17 Years | 51 (38.1%) | 0 (0.0%) |
| 18 to 34 Years | 8 (17.8%) | 0 (0.0%) |
| 35 to 64 Years | 108 (44.3%) | 74 (25.6%) |
| 65 to 74 Years | 7 (18.9%) | 36 (37.9%) |
| 75 Years and over | 0 (0.0%) | 32 (76.2%) |
Disability Class by Sex by Age in Newell
Disability Class: Hearing Difficulty
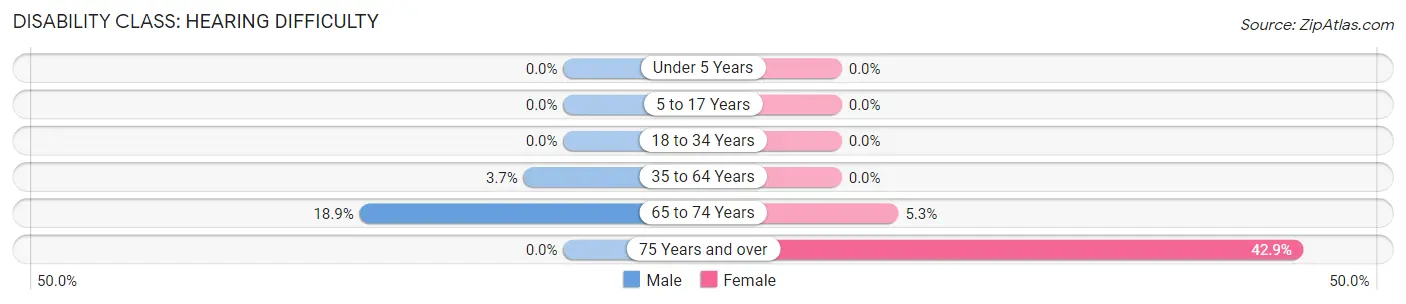
| Age Bracket | Male | Female |
| Under 5 Years | 0 (0.0%) | 0 (0.0%) |
| 5 to 17 Years | 0 (0.0%) | 0 (0.0%) |
| 18 to 34 Years | 0 (0.0%) | 0 (0.0%) |
| 35 to 64 Years | 9 (3.7%) | 0 (0.0%) |
| 65 to 74 Years | 7 (18.9%) | 5 (5.3%) |
| 75 Years and over | 0 (0.0%) | 18 (42.9%) |
Disability Class: Vision Difficulty
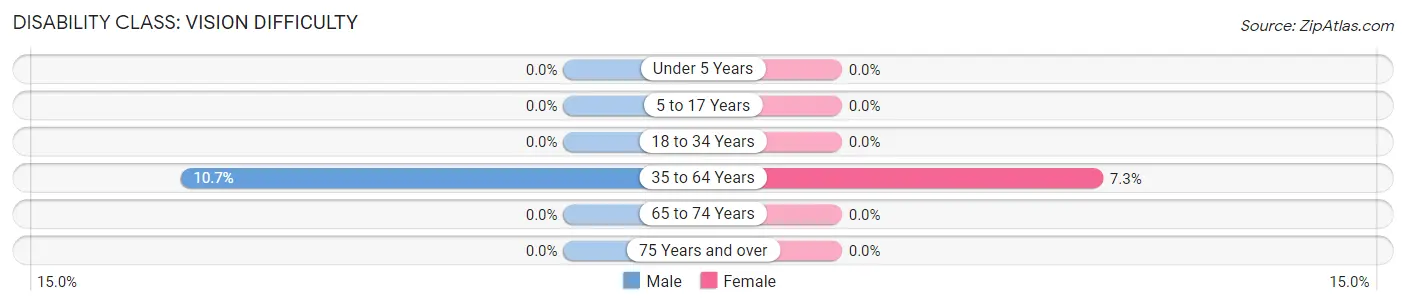
| Age Bracket | Male | Female |
| Under 5 Years | 0 (0.0%) | 0 (0.0%) |
| 5 to 17 Years | 0 (0.0%) | 0 (0.0%) |
| 18 to 34 Years | 0 (0.0%) | 0 (0.0%) |
| 35 to 64 Years | 26 (10.7%) | 21 (7.3%) |
| 65 to 74 Years | 0 (0.0%) | 0 (0.0%) |
| 75 Years and over | 0 (0.0%) | 0 (0.0%) |
Disability Class: Cognitive Difficulty
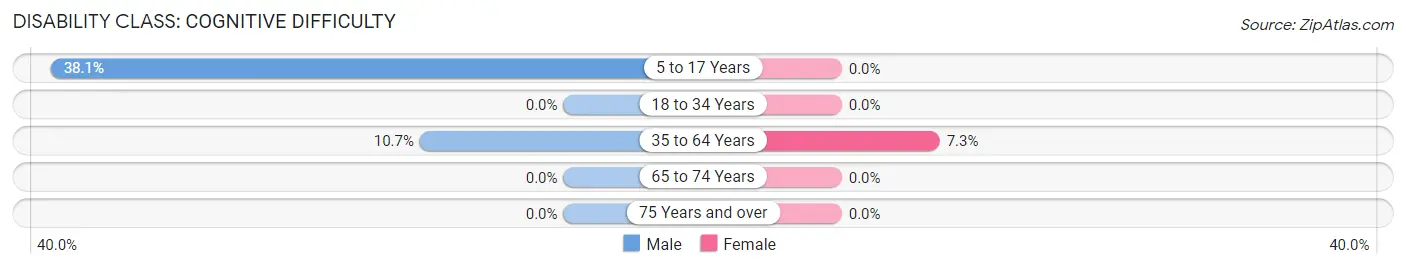
| Age Bracket | Male | Female |
| 5 to 17 Years | 51 (38.1%) | 0 (0.0%) |
| 18 to 34 Years | 0 (0.0%) | 0 (0.0%) |
| 35 to 64 Years | 26 (10.7%) | 21 (7.3%) |
| 65 to 74 Years | 0 (0.0%) | 0 (0.0%) |
| 75 Years and over | 0 (0.0%) | 0 (0.0%) |
Disability Class: Ambulatory Difficulty
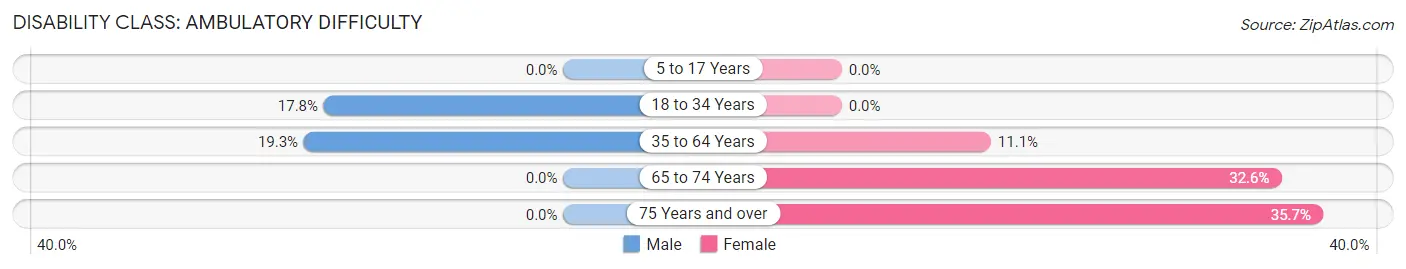
| Age Bracket | Male | Female |
| 5 to 17 Years | 0 (0.0%) | 0 (0.0%) |
| 18 to 34 Years | 8 (17.8%) | 0 (0.0%) |
| 35 to 64 Years | 47 (19.3%) | 32 (11.1%) |
| 65 to 74 Years | 0 (0.0%) | 31 (32.6%) |
| 75 Years and over | 0 (0.0%) | 15 (35.7%) |
Disability Class: Self-Care Difficulty
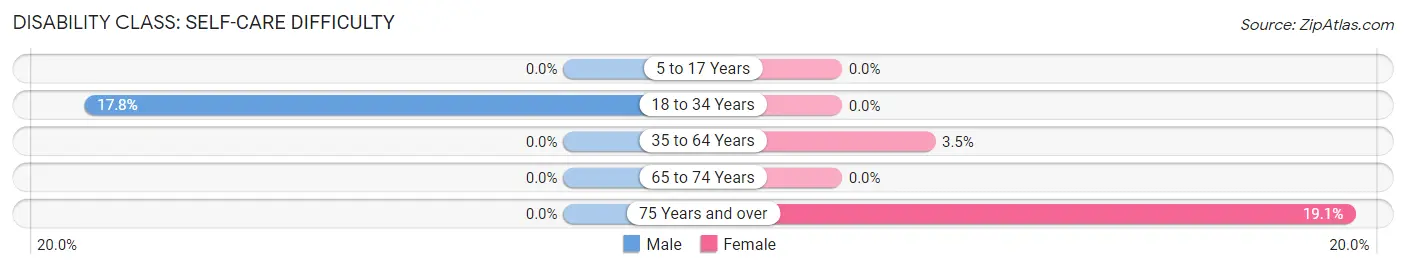
| Age Bracket | Male | Female |
| 5 to 17 Years | 0 (0.0%) | 0 (0.0%) |
| 18 to 34 Years | 8 (17.8%) | 0 (0.0%) |
| 35 to 64 Years | 0 (0.0%) | 10 (3.5%) |
| 65 to 74 Years | 0 (0.0%) | 0 (0.0%) |
| 75 Years and over | 0 (0.0%) | 8 (19.1%) |
Technology Access in Newell
Computing Device Access in Newell
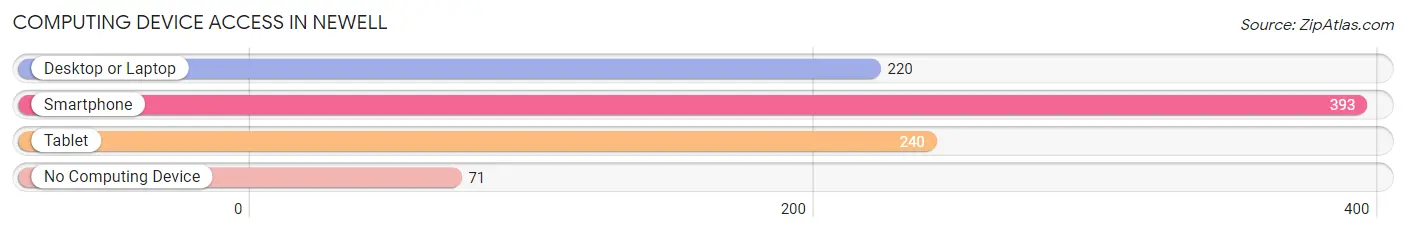
| Device Type | # Households | % Households |
| Desktop or Laptop | 220 | 41.6% |
| Smartphone | 393 | 74.3% |
| Tablet | 240 | 45.4% |
| No Computing Device | 71 | 13.4% |
| Total | 529 | 100.0% |
Internet Access in Newell
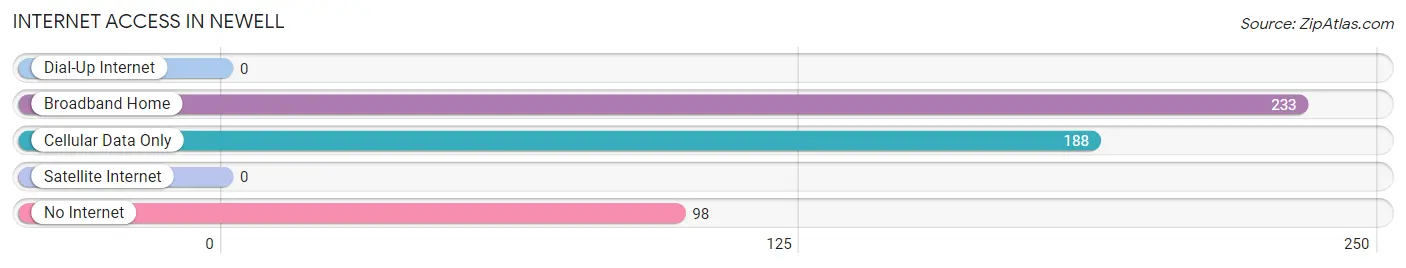
| Internet Type | # Households | % Households |
| Dial-Up Internet | 0 | 0.0% |
| Broadband Home | 233 | 44.1% |
| Cellular Data Only | 188 | 35.5% |
| Satellite Internet | 0 | 0.0% |
| No Internet | 98 | 18.5% |
| Total | 529 | 100.0% |
Newell Summary
Newell is a small town located in Hancock County, West Virginia. It is situated on the Ohio River, just south of the Pennsylvania border. The town was founded in 1891 by the Newell Land and Improvement Company, and was named after the company's president, William Newell. The town has a population of approximately 1,500 people, and is part of the Weirton-Steubenville Metropolitan Statistical Area.
Geography
Newell is located in the northern panhandle of West Virginia, in the Appalachian Mountains. The town is situated on the Ohio River, just south of the Pennsylvania border. The town is surrounded by rolling hills and forests, and is located in the heart of the Appalachian coal region. The town is located approximately 30 miles south of Pittsburgh, Pennsylvania, and is accessible by Interstate 70 and U.S. Route 22.
Economy
Newell's economy is largely based on the coal industry. The town is home to several coal mines, and the coal industry is the primary source of employment for the town's residents. In addition to the coal industry, Newell is also home to several small businesses, including restaurants, retail stores, and service providers.
Demographics
As of the 2010 census, Newell had a population of 1,521 people. The racial makeup of the town was 97.2% White, 0.7% African American, 0.2% Native American, 0.2% Asian, 0.2% from other races, and 1.7% from two or more races. Hispanic or Latino of any race were 0.7% of the population.
The median income for a household in Newell was $30,938, and the median income for a family was $37,917. The per capita income for the town was $15,945. About 16.2% of families and 19.2% of the population were below the poverty line, including 25.2% of those under age 18 and 11.2% of those age 65 or over.
Conclusion
Newell is a small town located in Hancock County, West Virginia. It is situated on the Ohio River, just south of the Pennsylvania border. The town was founded in 1891 by the Newell Land and Improvement Company, and was named after the company's president, William Newell. The town has a population of approximately 1,500 people, and is part of the Weirton-Steubenville Metropolitan Statistical Area. The town's economy is largely based on the coal industry, and the town is home to several small businesses. The racial makeup of the town is predominantly white, with a small percentage of African American, Native American, and Asian residents. The median income for a household in Newell is lower than the national average, and a significant portion of the population is below the poverty line.
Common Questions
What is Per Capita Income in Newell?
Per Capita income in Newell is $20,630.
What is the Median Family Income in Newell?
Median Family Income in Newell is $58,482.
What is the Median Household income in Newell?
Median Household Income in Newell is $23,808.
What is Inequality or Gini Index in Newell?
Inequality or Gini Index in Newell is 0.47.
What is the Total Population of Newell?
Total Population of Newell is 1,129.
What is the Total Male Population of Newell?
Total Male Population of Newell is 546.
What is the Total Female Population of Newell?
Total Female Population of Newell is 583.
What is the Ratio of Males per 100 Females in Newell?
There are 93.65 Males per 100 Females in Newell.
What is the Ratio of Females per 100 Males in Newell?
There are 106.78 Females per 100 Males in Newell.
What is the Median Population Age in Newell?
Median Population Age in Newell is 51.0 Years.
What is the Average Family Size in Newell
Average Family Size in Newell is 3.5 People.
What is the Average Household Size in Newell
Average Household Size in Newell is 2.1 People.
How Large is the Labor Force in Newell?
There are 412 People in the Labor Forcein in Newell.
What is the Percentage of People in the Labor Force in Newell?
44.2% of People are in the Labor Force in Newell.
What is the Unemployment Rate in Newell?
Unemployment Rate in Newell is 17.0%.