Gallipolis Ferry, WV Map & Demographics
Gallipolis Ferry Map
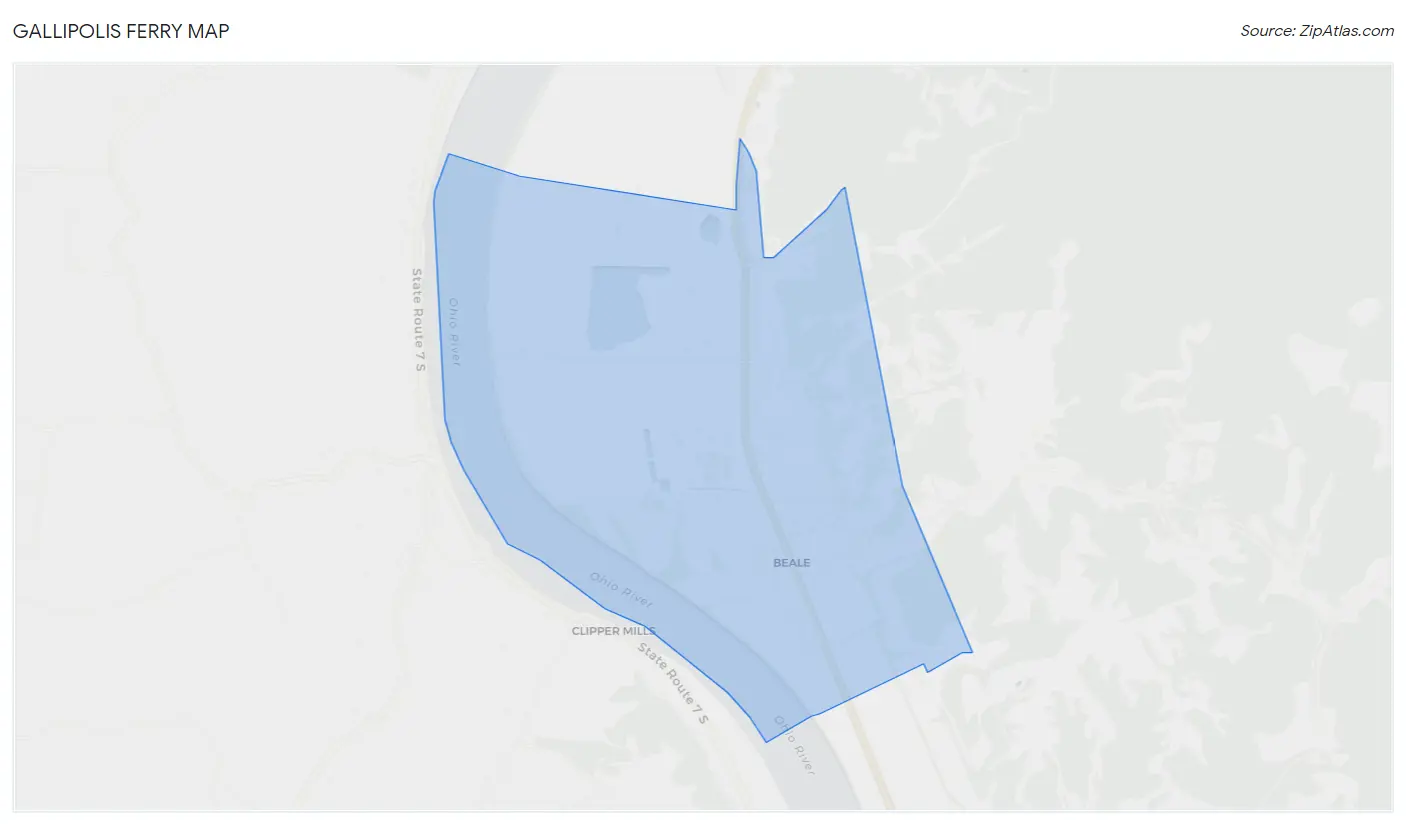
Gallipolis Ferry Overview
$17,931
PER CAPITA INCOME
$44,250
AVG FAMILY INCOME
$26,875
AVG HOUSEHOLD INCOME
0.51
INEQUALITY / GINI INDEX
563
TOTAL POPULATION
286
MALE POPULATION
277
FEMALE POPULATION
103.25
MALES / 100 FEMALES
96.85
FEMALES / 100 MALES
49.0
MEDIAN AGE
3.0
AVG FAMILY SIZE
2.3
AVG HOUSEHOLD SIZE
97
LABOR FORCE [ PEOPLE ]
22.5%
PERCENT IN LABOR FORCE
11.3%
UNEMPLOYMENT RATE
Gallipolis Ferry Zip Codes
Gallipolis Ferry Area Codes
Income in Gallipolis Ferry
Income Overview in Gallipolis Ferry
Per Capita Income in Gallipolis Ferry is $17,931, while median incomes of families and households are $44,250 and $26,875 respectively.
| Characteristic | Number | Measure |
| Per Capita Income | 563 | $17,931 |
| Median Family Income | 141 | $44,250 |
| Mean Family Income | 141 | $48,322 |
| Median Household Income | 249 | $26,875 |
| Mean Household Income | 249 | $38,696 |
| Income Deficit | 141 | $0 |
| Wage / Income Gap (%) | 563 | 0.00% |
| Wage / Income Gap ($) | 563 | 100.00¢ per $1 |
| Gini / Inequality Index | 563 | 0.51 |
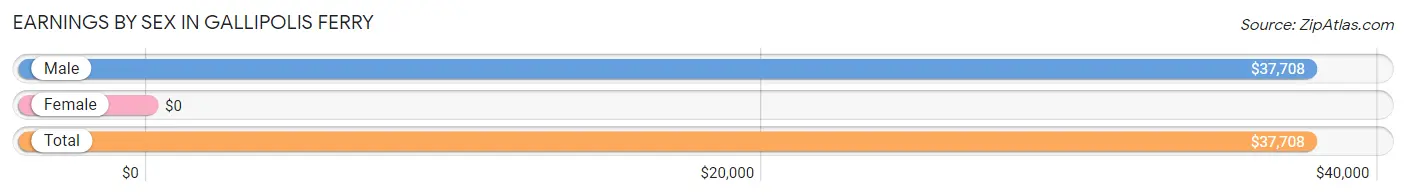
Earnings by Sex in Gallipolis Ferry
| Sex | Number | Average Earnings |
| Male | 66 (56.9%) | $37,708 |
| Female | 50 (43.1%) | $0 |
| Total | 116 (100.0%) | $37,708 |
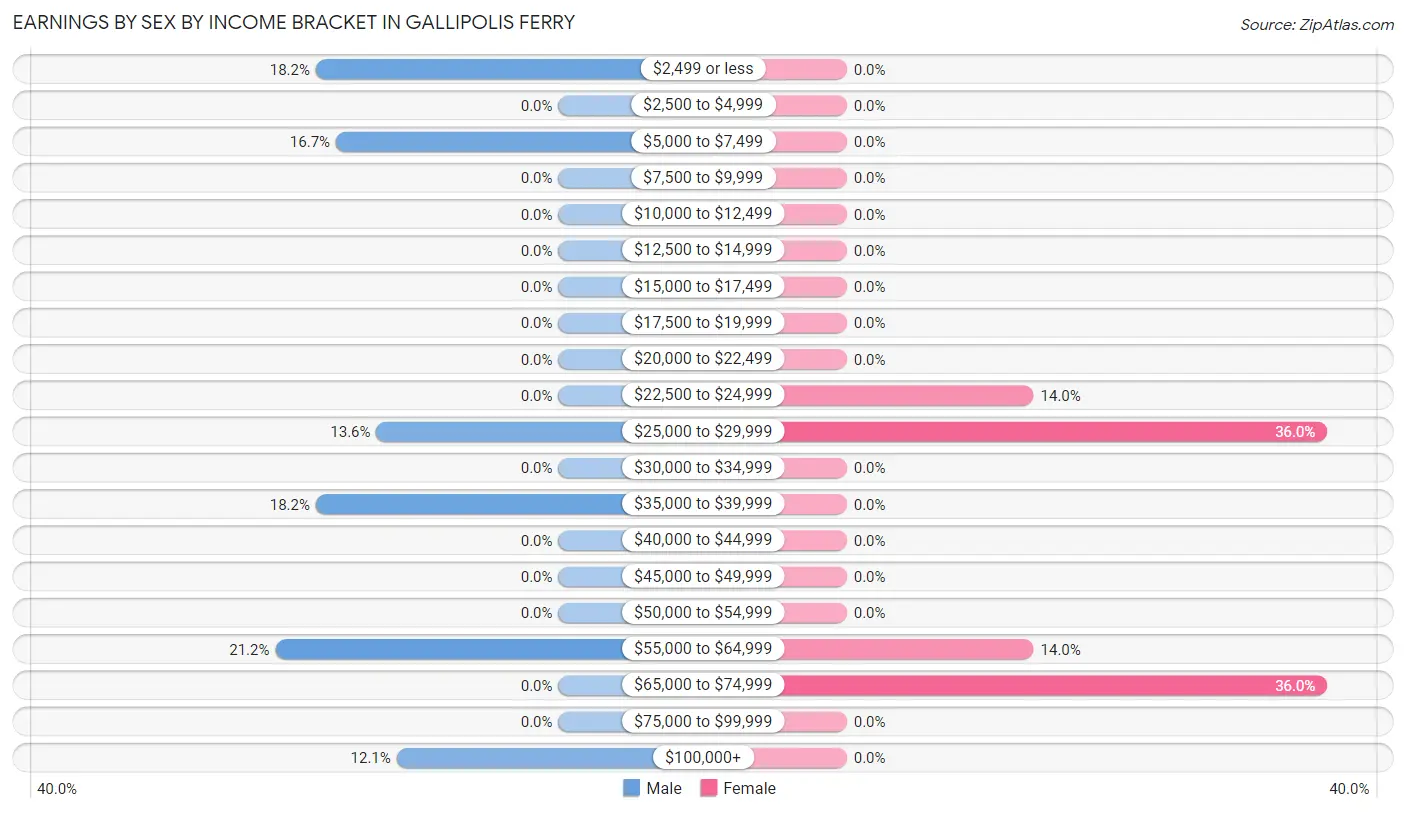
Earnings by Sex by Income Bracket in Gallipolis Ferry
The most common earnings brackets in Gallipolis Ferry are $55,000 to $64,999 for men (14 | 21.2%) and $25,000 to $29,999 for women (18 | 36.0%).
| Income | Male | Female |
| $2,499 or less | 12 (18.2%) | 0 (0.0%) |
| $2,500 to $4,999 | 0 (0.0%) | 0 (0.0%) |
| $5,000 to $7,499 | 11 (16.7%) | 0 (0.0%) |
| $7,500 to $9,999 | 0 (0.0%) | 0 (0.0%) |
| $10,000 to $12,499 | 0 (0.0%) | 0 (0.0%) |
| $12,500 to $14,999 | 0 (0.0%) | 0 (0.0%) |
| $15,000 to $17,499 | 0 (0.0%) | 0 (0.0%) |
| $17,500 to $19,999 | 0 (0.0%) | 0 (0.0%) |
| $20,000 to $22,499 | 0 (0.0%) | 0 (0.0%) |
| $22,500 to $24,999 | 0 (0.0%) | 7 (14.0%) |
| $25,000 to $29,999 | 9 (13.6%) | 18 (36.0%) |
| $30,000 to $34,999 | 0 (0.0%) | 0 (0.0%) |
| $35,000 to $39,999 | 12 (18.2%) | 0 (0.0%) |
| $40,000 to $44,999 | 0 (0.0%) | 0 (0.0%) |
| $45,000 to $49,999 | 0 (0.0%) | 0 (0.0%) |
| $50,000 to $54,999 | 0 (0.0%) | 0 (0.0%) |
| $55,000 to $64,999 | 14 (21.2%) | 7 (14.0%) |
| $65,000 to $74,999 | 0 (0.0%) | 18 (36.0%) |
| $75,000 to $99,999 | 0 (0.0%) | 0 (0.0%) |
| $100,000+ | 8 (12.1%) | 0 (0.0%) |
| Total | 66 (100.0%) | 50 (100.0%) |
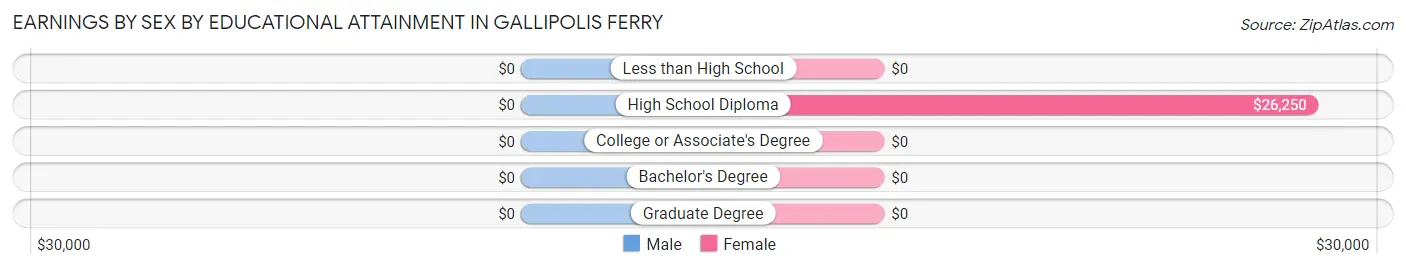
Earnings by Sex by Educational Attainment in Gallipolis Ferry
| Educational Attainment | Male Income | Female Income |
| Less than High School | - | - |
| High School Diploma | - | - |
| College or Associate's Degree | - | - |
| Bachelor's Degree | - | - |
| Graduate Degree | - | - |
| Total | - | - |
Family Income in Gallipolis Ferry
Family Income Brackets in Gallipolis Ferry
According to the Gallipolis Ferry family income data, there are 39 families falling into the less than $10,000 income range, which is the most common income bracket and makes up 27.7% of all families.
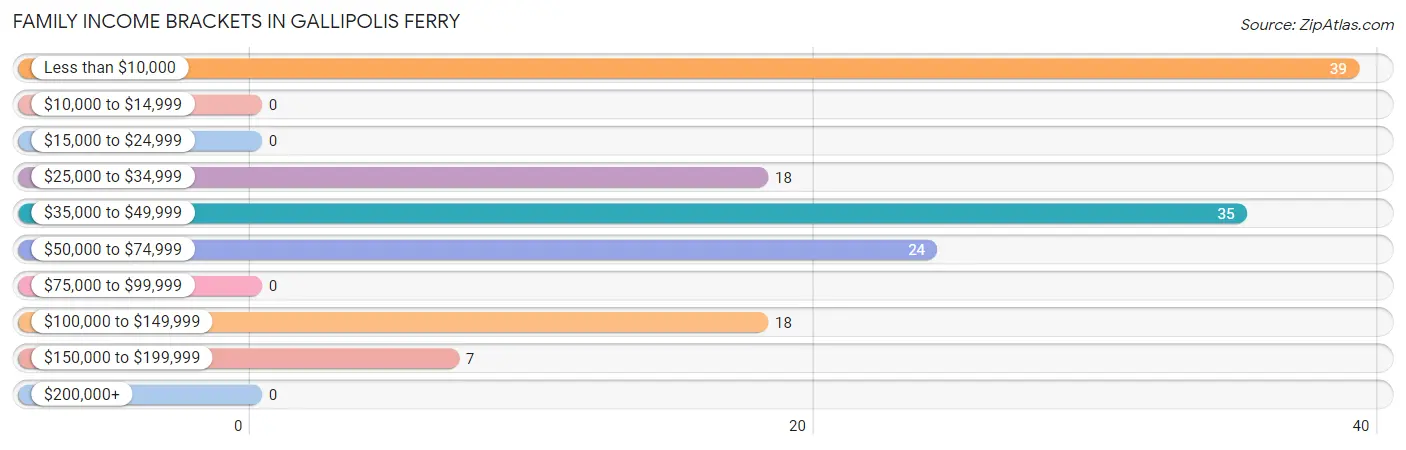
| Income Bracket | # Families | % Families |
| Less than $10,000 | 39 | 27.7% |
| $10,000 to $14,999 | 0 | 0.0% |
| $15,000 to $24,999 | 0 | 0.0% |
| $25,000 to $34,999 | 18 | 12.8% |
| $35,000 to $49,999 | 35 | 24.8% |
| $50,000 to $74,999 | 24 | 17.0% |
| $75,000 to $99,999 | 0 | 0.0% |
| $100,000 to $149,999 | 18 | 12.8% |
| $150,000 to $199,999 | 7 | 5.0% |
| $200,000+ | 0 | 0.0% |
Family Income by Famaliy Size in Gallipolis Ferry
2-person families (83 | 58.9%) account for the highest median family income in Gallipolis Ferry with $47,188 per family, while 2-person families (83 | 58.9%) have the highest median income of $23,594 per family member.
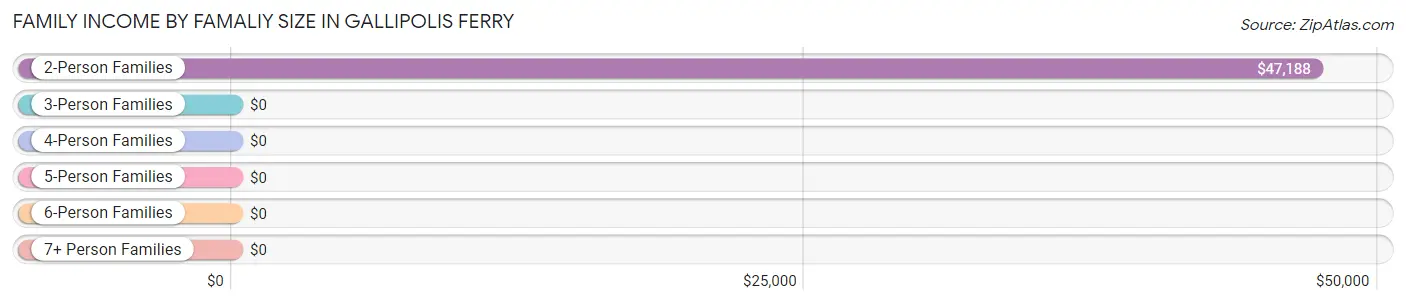
| Income Bracket | # Families | Median Income |
| 2-Person Families | 83 (58.9%) | $47,188 |
| 3-Person Families | 14 (9.9%) | $0 |
| 4-Person Families | 44 (31.2%) | $0 |
| 5-Person Families | 0 (0.0%) | $0 |
| 6-Person Families | 0 (0.0%) | $0 |
| 7+ Person Families | 0 (0.0%) | $0 |
| Total | 141 (100.0%) | $44,250 |
Family Income by Number of Earners in Gallipolis Ferry
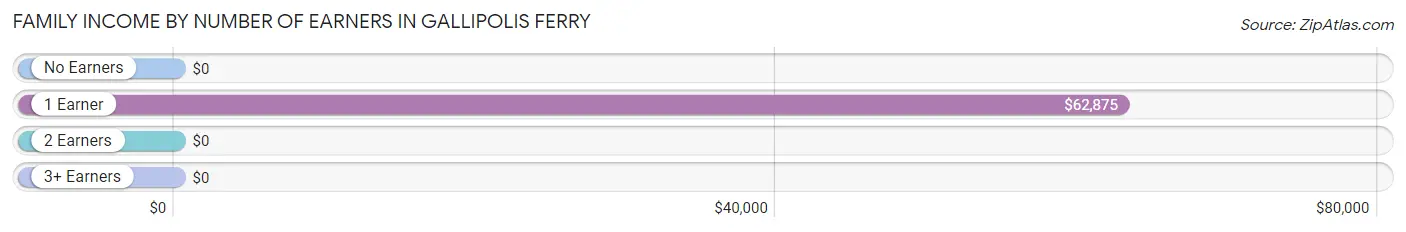
| Number of Earners | # Families | Median Income |
| No Earners | 81 (57.5%) | $0 |
| 1 Earner | 53 (37.6%) | $62,875 |
| 2 Earners | 0 (0.0%) | $0 |
| 3+ Earners | 7 (5.0%) | $0 |
| Total | 141 (100.0%) | $44,250 |
Household Income in Gallipolis Ferry
Household Income Brackets in Gallipolis Ferry
With 62 households falling in the category, the $10,000 to $14,999 income range is the most frequent in Gallipolis Ferry, accounting for 24.9% of all households.
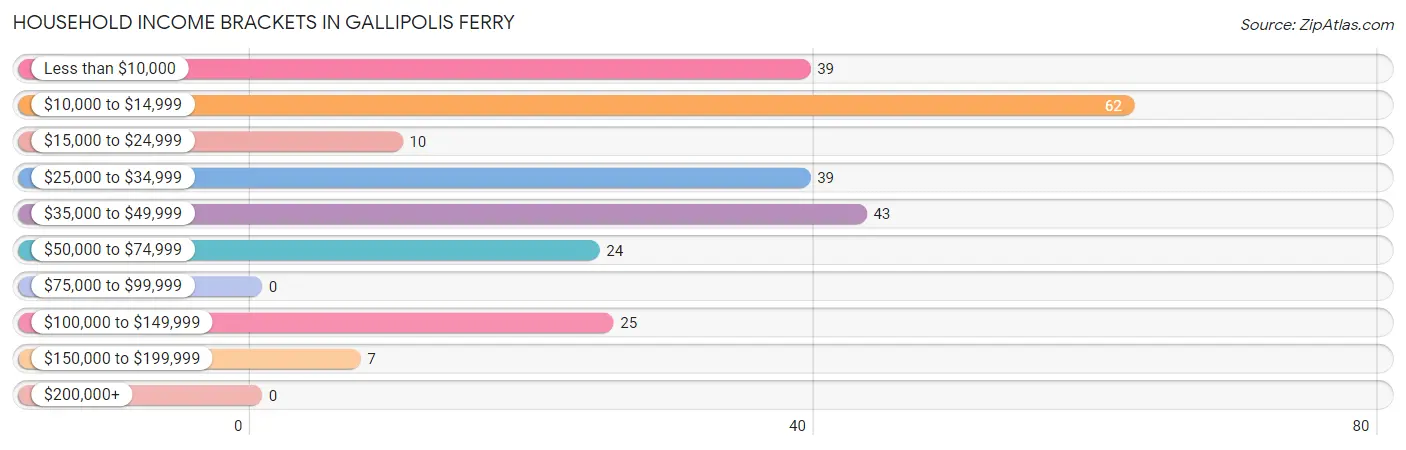
| Income Bracket | # Households | % Households |
| Less than $10,000 | 39 | 15.7% |
| $10,000 to $14,999 | 62 | 24.9% |
| $15,000 to $24,999 | 10 | 4.0% |
| $25,000 to $34,999 | 39 | 15.7% |
| $35,000 to $49,999 | 43 | 17.3% |
| $50,000 to $74,999 | 24 | 9.6% |
| $75,000 to $99,999 | 0 | 0.0% |
| $100,000 to $149,999 | 25 | 10.0% |
| $150,000 to $199,999 | 7 | 2.8% |
| $200,000+ | 0 | 0.0% |
Household Income by Householder Age in Gallipolis Ferry
The median household income in Gallipolis Ferry is $26,875, with the highest median household income of $43,083 found in the 65+ years age bracket for the primary householder. A total of 93 households (37.3%) fall into this category.
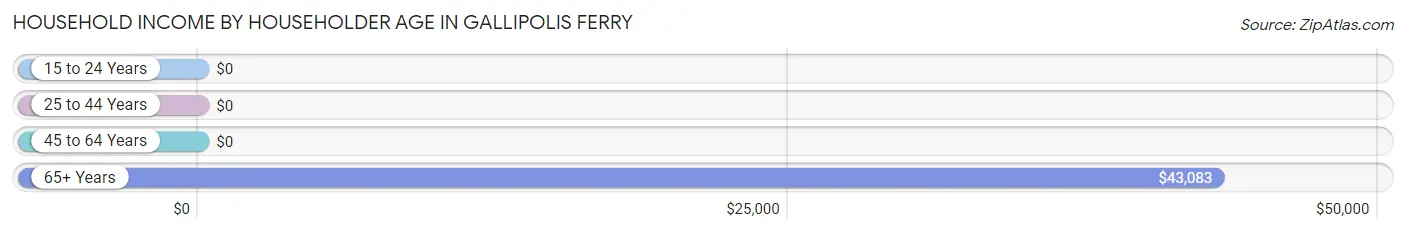
| Income Bracket | # Households | Median Income |
| 15 to 24 Years | 0 (0.0%) | $0 |
| 25 to 44 Years | 25 (10.0%) | $0 |
| 45 to 64 Years | 131 (52.6%) | $0 |
| 65+ Years | 93 (37.3%) | $43,083 |
| Total | 249 (100.0%) | $26,875 |
Poverty in Gallipolis Ferry
Income Below Poverty by Sex and Age in Gallipolis Ferry
With 55.6% poverty level for males and 56.7% for females among the residents of Gallipolis Ferry, under 5 year old males and 12 to 14 year old females are the most vulnerable to poverty, with 52 males (100.0%) and 23 females (100.0%) in their respective age groups living below the poverty level.
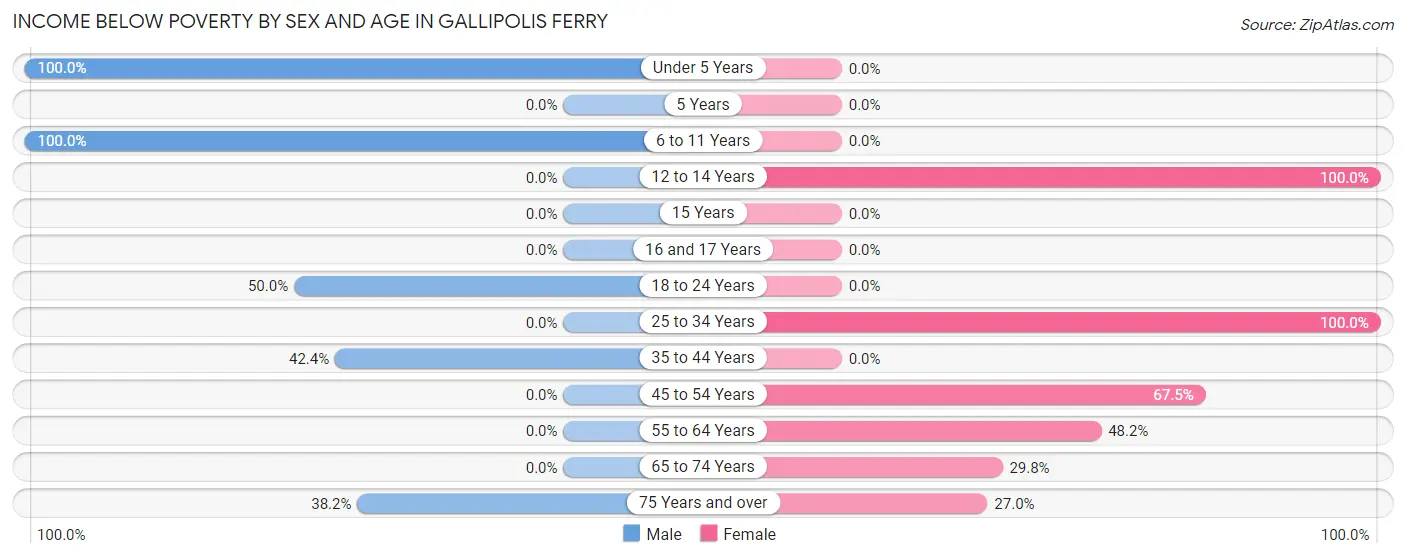
| Age Bracket | Male | Female |
| Under 5 Years | 52 (100.0%) | 0 (0.0%) |
| 5 Years | 0 (0.0%) | 0 (0.0%) |
| 6 to 11 Years | 57 (100.0%) | 0 (0.0%) |
| 12 to 14 Years | 0 (0.0%) | 23 (100.0%) |
| 15 Years | 0 (0.0%) | 0 (0.0%) |
| 16 and 17 Years | 0 (0.0%) | 0 (0.0%) |
| 18 to 24 Years | 12 (50.0%) | 0 (0.0%) |
| 25 to 34 Years | 0 (0.0%) | 29 (100.0%) |
| 35 to 44 Years | 25 (42.4%) | 0 (0.0%) |
| 45 to 54 Years | 0 (0.0%) | 52 (67.5%) |
| 55 to 64 Years | 0 (0.0%) | 26 (48.1%) |
| 65 to 74 Years | 0 (0.0%) | 17 (29.8%) |
| 75 Years and over | 13 (38.2%) | 10 (27.0%) |
| Total | 159 (55.6%) | 157 (56.7%) |
Income Above Poverty by Sex and Age in Gallipolis Ferry
According to the poverty statistics in Gallipolis Ferry, males aged 25 to 34 years and females aged 75 years and over are the age groups that are most secure financially, with 100.0% of males and 73.0% of females in these age groups living above the poverty line.
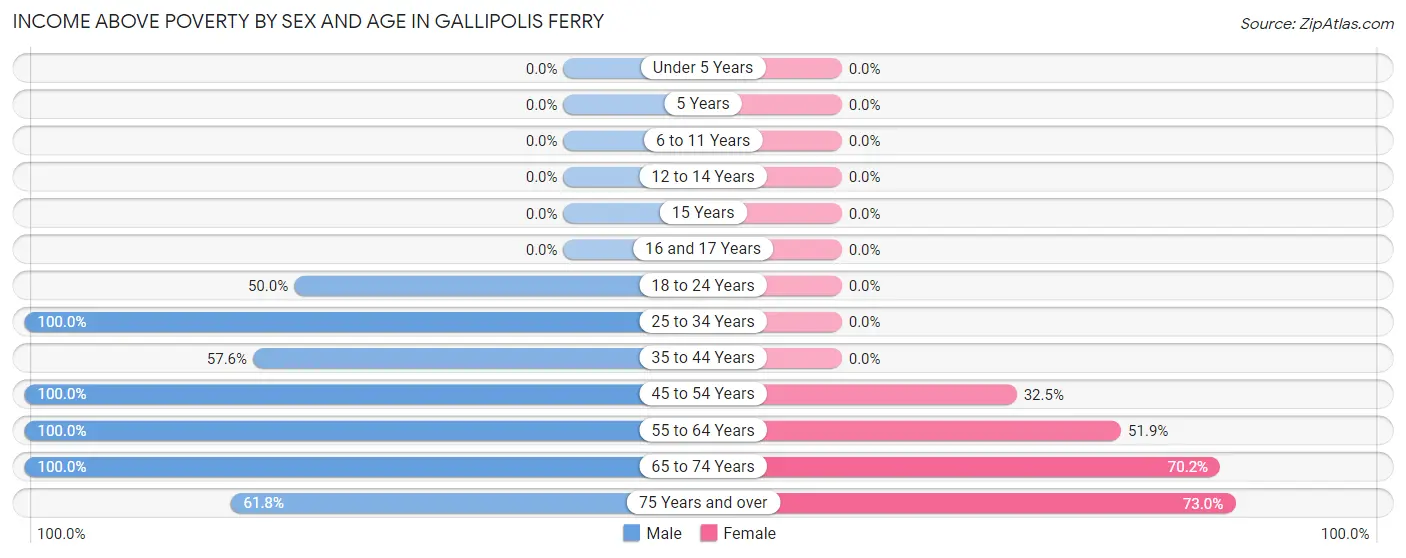
| Age Bracket | Male | Female |
| Under 5 Years | 0 (0.0%) | 0 (0.0%) |
| 5 Years | 0 (0.0%) | 0 (0.0%) |
| 6 to 11 Years | 0 (0.0%) | 0 (0.0%) |
| 12 to 14 Years | 0 (0.0%) | 0 (0.0%) |
| 15 Years | 0 (0.0%) | 0 (0.0%) |
| 16 and 17 Years | 0 (0.0%) | 0 (0.0%) |
| 18 to 24 Years | 12 (50.0%) | 0 (0.0%) |
| 25 to 34 Years | 10 (100.0%) | 0 (0.0%) |
| 35 to 44 Years | 34 (57.6%) | 0 (0.0%) |
| 45 to 54 Years | 9 (100.0%) | 25 (32.5%) |
| 55 to 64 Years | 22 (100.0%) | 28 (51.8%) |
| 65 to 74 Years | 19 (100.0%) | 40 (70.2%) |
| 75 Years and over | 21 (61.8%) | 27 (73.0%) |
| Total | 127 (44.4%) | 120 (43.3%) |
Income Below Poverty Among Married-Couple Families in Gallipolis Ferry
The poverty statistics for married-couple families in Gallipolis Ferry show that 34.5% or 39 of the total 113 families live below the poverty line. Families with 1 or 2 children have the highest poverty rate of 100.0%, comprising of 26 families. On the other hand, families with no children have the lowest poverty rate of 14.9%, which includes 13 families.
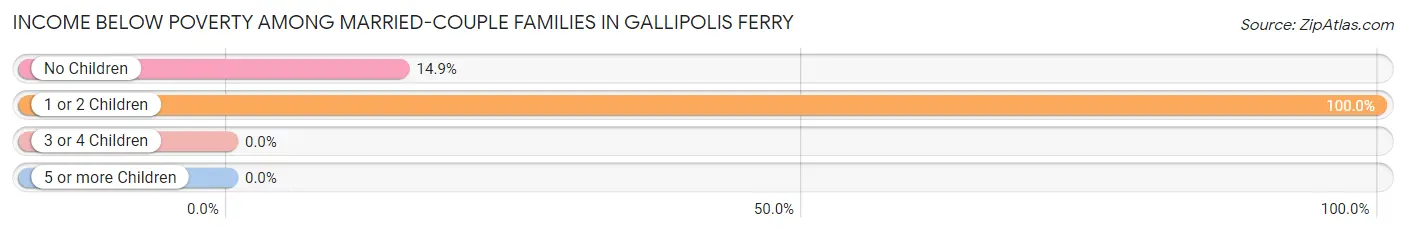
| Children | Above Poverty | Below Poverty |
| No Children | 74 (85.1%) | 13 (14.9%) |
| 1 or 2 Children | 0 (0.0%) | 26 (100.0%) |
| 3 or 4 Children | 0 (0.0%) | 0 (0.0%) |
| 5 or more Children | 0 (0.0%) | 0 (0.0%) |
| Total | 74 (65.5%) | 39 (34.5%) |
Income Below Poverty Among Single-Parent Households in Gallipolis Ferry
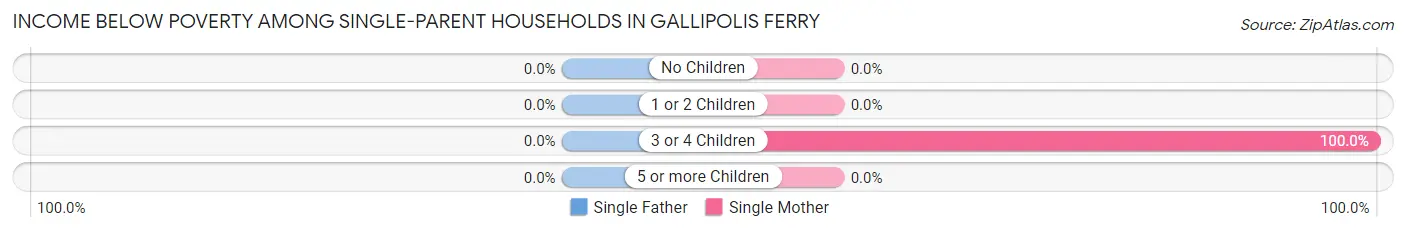
| Children | Single Father | Single Mother |
| No Children | 0 (0.0%) | 0 (0.0%) |
| 1 or 2 Children | 0 (0.0%) | 0 (0.0%) |
| 3 or 4 Children | 0 (0.0%) | 18 (100.0%) |
| 5 or more Children | 0 (0.0%) | 0 (0.0%) |
| Total | 0 (0.0%) | 18 (64.3%) |
Income Below Poverty Among Married-Couple vs Single-Parent Households in Gallipolis Ferry
The poverty data for Gallipolis Ferry shows that 39 of the married-couple family households (34.5%) and 18 of the single-parent households (64.3%) are living below the poverty level. Within the married-couple family households, those with 1 or 2 children have the highest poverty rate, with 26 households (100.0%) falling below the poverty line. Among the single-parent households, those with 3 or 4 children have the highest poverty rate, with 18 household (100.0%) living below poverty.
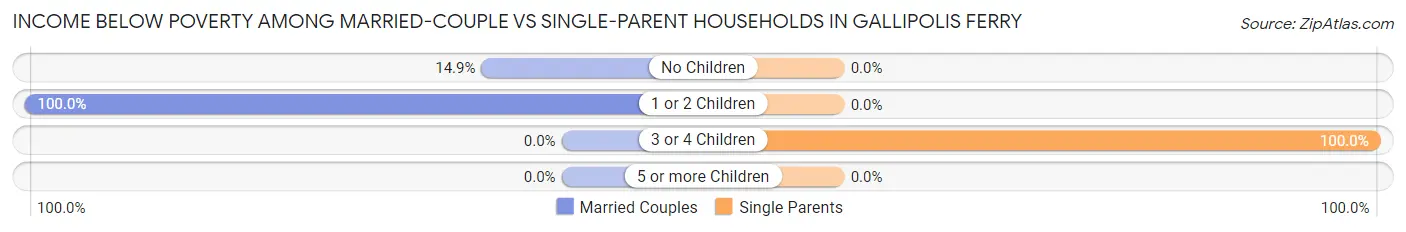
| Children | Married-Couple Families | Single-Parent Households |
| No Children | 13 (14.9%) | 0 (0.0%) |
| 1 or 2 Children | 26 (100.0%) | 0 (0.0%) |
| 3 or 4 Children | 0 (0.0%) | 18 (100.0%) |
| 5 or more Children | 0 (0.0%) | 0 (0.0%) |
| Total | 39 (34.5%) | 18 (64.3%) |
Race in Gallipolis Ferry
The most populous races in Gallipolis Ferry are White / Caucasian (485 | 86.2%), and Two or more Races (78 | 13.9%).
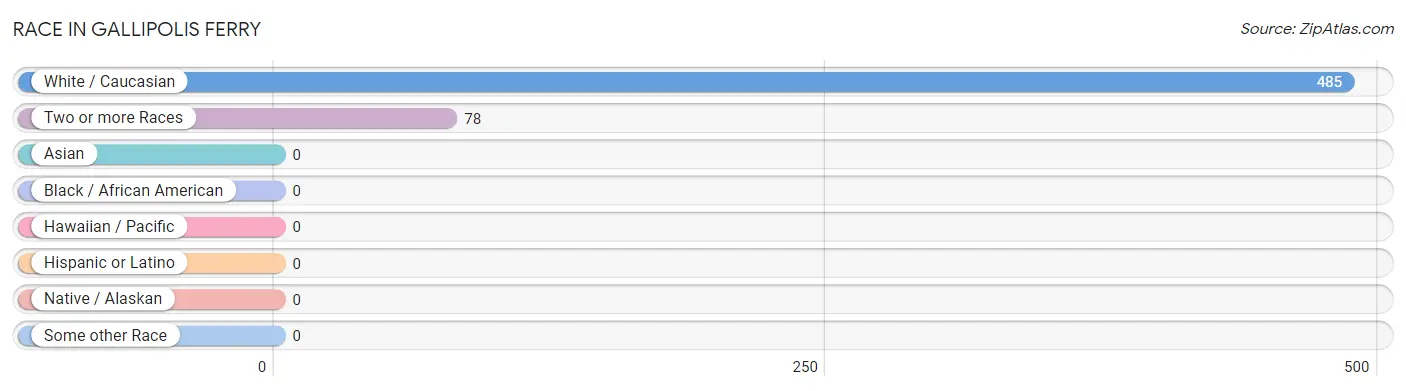
| Race | # Population | % Population |
| Asian | 0 | 0.0% |
| Black / African American | 0 | 0.0% |
| Hawaiian / Pacific | 0 | 0.0% |
| Hispanic or Latino | 0 | 0.0% |
| Native / Alaskan | 0 | 0.0% |
| White / Caucasian | 485 | 86.2% |
| Two or more Races | 78 | 13.9% |
| Some other Race | 0 | 0.0% |
| Total | 563 | 100.0% |
Ancestry in Gallipolis Ferry
The most populous ancestries reported in Gallipolis Ferry are German (91 | 16.2%), Irish (51 | 9.1%), American (34 | 6.0%), Scotch-Irish (24 | 4.3%), and English (22 | 3.9%), together accounting for 39.4% of all Gallipolis Ferry residents.
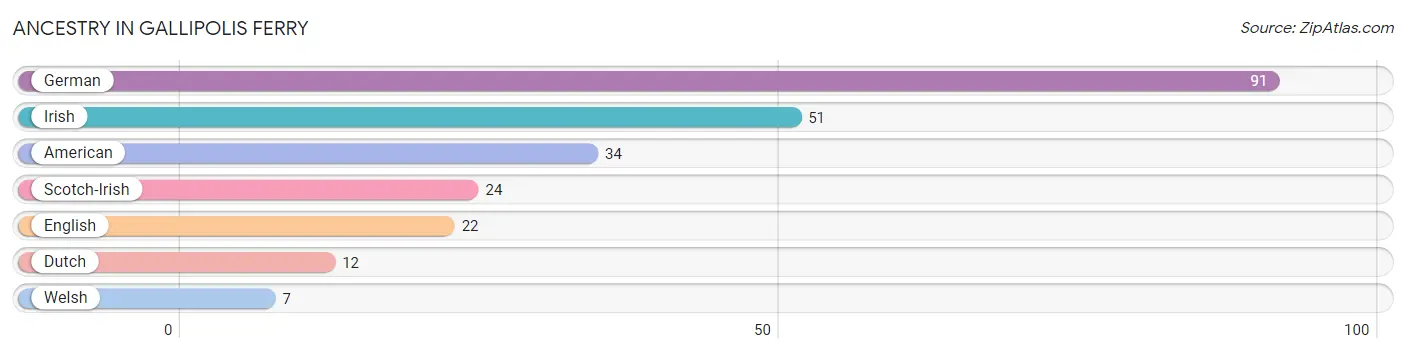
| Ancestry | # Population | % Population |
| American | 34 | 6.0% |
| Dutch | 12 | 2.1% |
| English | 22 | 3.9% |
| German | 91 | 16.2% |
| Irish | 51 | 9.1% |
| Scotch-Irish | 24 | 4.3% |
| Welsh | 7 | 1.2% | View All 7 Rows |
Immigrants in Gallipolis Ferry

| Immigration Origin | # Population | % Population | View All 0 Rows |
Sex and Age in Gallipolis Ferry
Sex and Age in Gallipolis Ferry
The most populous age groups in Gallipolis Ferry are Under 5 Years (52 | 18.2%) for men and 45 to 49 Years (45 | 16.3%) for women.
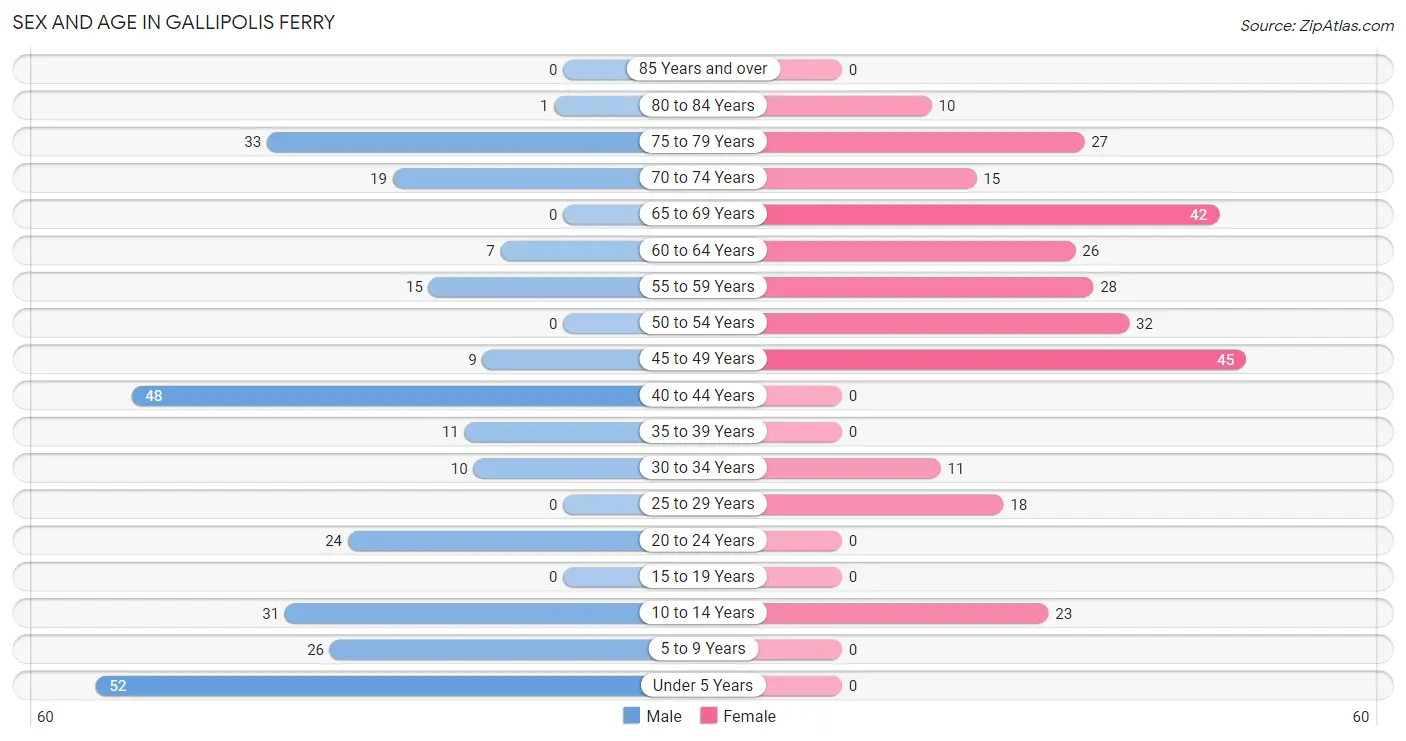
| Age Bracket | Male | Female |
| Under 5 Years | 52 (18.2%) | 0 (0.0%) |
| 5 to 9 Years | 26 (9.1%) | 0 (0.0%) |
| 10 to 14 Years | 31 (10.8%) | 23 (8.3%) |
| 15 to 19 Years | 0 (0.0%) | 0 (0.0%) |
| 20 to 24 Years | 24 (8.4%) | 0 (0.0%) |
| 25 to 29 Years | 0 (0.0%) | 18 (6.5%) |
| 30 to 34 Years | 10 (3.5%) | 11 (4.0%) |
| 35 to 39 Years | 11 (3.8%) | 0 (0.0%) |
| 40 to 44 Years | 48 (16.8%) | 0 (0.0%) |
| 45 to 49 Years | 9 (3.2%) | 45 (16.3%) |
| 50 to 54 Years | 0 (0.0%) | 32 (11.6%) |
| 55 to 59 Years | 15 (5.2%) | 28 (10.1%) |
| 60 to 64 Years | 7 (2.5%) | 26 (9.4%) |
| 65 to 69 Years | 0 (0.0%) | 42 (15.2%) |
| 70 to 74 Years | 19 (6.6%) | 15 (5.4%) |
| 75 to 79 Years | 33 (11.5%) | 27 (9.8%) |
| 80 to 84 Years | 1 (0.4%) | 10 (3.6%) |
| 85 Years and over | 0 (0.0%) | 0 (0.0%) |
| Total | 286 (100.0%) | 277 (100.0%) |
Families and Households in Gallipolis Ferry
Median Family Size in Gallipolis Ferry
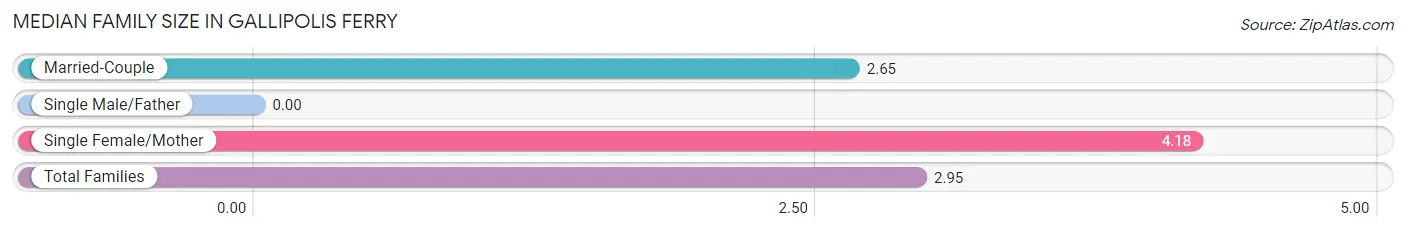
| Family Type | # Families | Family Size |
| Married-Couple | 113 (80.1%) | 2.65 |
| Single Male/Father | 0 (0.0%) | - |
| Single Female/Mother | 28 (19.9%) | 4.18 |
| Total Families | 141 (100.0%) | 2.95 |
Median Household Size in Gallipolis Ferry
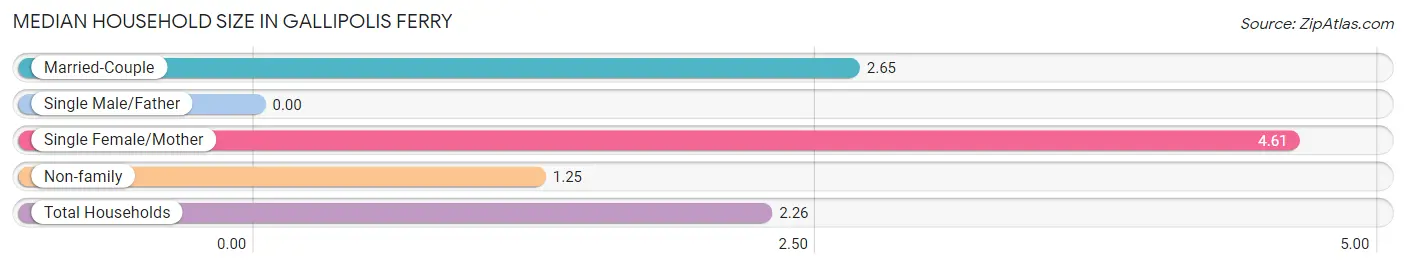
| Household Type | # Households | Household Size |
| Married-Couple | 113 (45.4%) | 2.65 |
| Single Male/Father | 0 (0.0%) | - |
| Single Female/Mother | 28 (11.2%) | 4.61 |
| Non-family | 108 (43.4%) | 1.25 |
| Total Households | 249 (100.0%) | 2.26 |
Household Size by Marriage Status in Gallipolis Ferry
Out of a total of 249 households in Gallipolis Ferry, 141 (56.6%) are family households, while 108 (43.4%) are nonfamily households. The most numerous type of family households are 2-person households, comprising 83, and the most common type of nonfamily households are 1-person households, comprising 94.
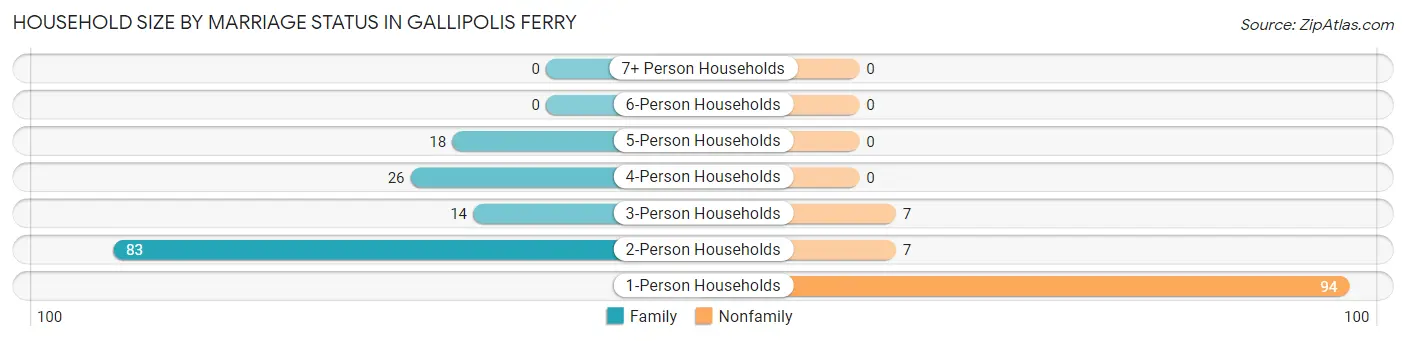
| Household Size | Family Households | Nonfamily Households |
| 1-Person Households | - | 94 (37.8%) |
| 2-Person Households | 83 (33.3%) | 7 (2.8%) |
| 3-Person Households | 14 (5.6%) | 7 (2.8%) |
| 4-Person Households | 26 (10.4%) | 0 (0.0%) |
| 5-Person Households | 18 (7.2%) | 0 (0.0%) |
| 6-Person Households | 0 (0.0%) | 0 (0.0%) |
| 7+ Person Households | 0 (0.0%) | 0 (0.0%) |
| Total | 141 (56.6%) | 108 (43.4%) |
Female Fertility in Gallipolis Ferry
Fertility by Age in Gallipolis Ferry
| Age Bracket | Women with Births | Births / 1,000 Women |
| 15 to 19 years | 0 (0.0%) | 0.0 |
| 20 to 34 years | 0 (0.0%) | 0.0 |
| 35 to 50 years | 0 (0.0%) | 0.0 |
| Total | 0 (0.0%) | 0.0 |
Fertility by Age by Marriage Status in Gallipolis Ferry
| Age Bracket | Married | Unmarried |
| 15 to 19 years | 0 (0.0%) | 0 (0.0%) |
| 20 to 34 years | 0 (0.0%) | 0 (0.0%) |
| 35 to 50 years | 0 (0.0%) | 0 (0.0%) |
| Total | 0 (0.0%) | 0 (0.0%) |
Fertility by Education in Gallipolis Ferry
| Educational Attainment | Women with Births | Births / 1,000 Women |
| Less than High School | 0 (0.0%) | 0.0 |
| High School Diploma | 0 (0.0%) | 0.0 |
| College or Associate's Degree | 0 (0.0%) | 0.0 |
| Bachelor's Degree | 0 (0.0%) | 0.0 |
| Graduate Degree | 0 (0.0%) | 0.0 |
| Total | 0 (0.0%) | 0.0 |
Fertility by Education by Marriage Status in Gallipolis Ferry
| Educational Attainment | Married | Unmarried |
| Less than High School | 0 (0.0%) | 0 (0.0%) |
| High School Diploma | 0 (0.0%) | 0 (0.0%) |
| College or Associate's Degree | 0 (0.0%) | 0 (0.0%) |
| Bachelor's Degree | 0 (0.0%) | 0 (0.0%) |
| Graduate Degree | 0 (0.0%) | 0 (0.0%) |
| Total | 0 (0.0%) | 0 (0.0%) |
Employment Characteristics in Gallipolis Ferry
Employment by Class of Employer in Gallipolis Ferry
Among the 86 employed individuals in Gallipolis Ferry, private company employees (68 | 79.1%), self-employed (not incorporated) (11 | 12.8%), and local government employees (7 | 8.1%) make up the most common classes of employment.
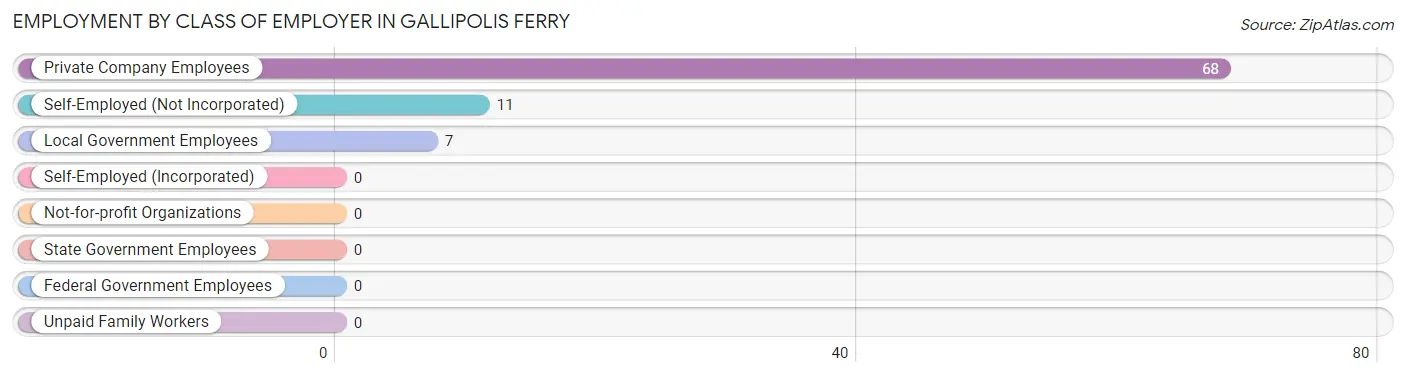
| Employer Class | # Employees | % Employees |
| Private Company Employees | 68 | 79.1% |
| Self-Employed (Incorporated) | 0 | 0.0% |
| Self-Employed (Not Incorporated) | 11 | 12.8% |
| Not-for-profit Organizations | 0 | 0.0% |
| Local Government Employees | 7 | 8.1% |
| State Government Employees | 0 | 0.0% |
| Federal Government Employees | 0 | 0.0% |
| Unpaid Family Workers | 0 | 0.0% |
| Total | 86 | 100.0% |
Employment Status by Age in Gallipolis Ferry
According to the labor force statistics for Gallipolis Ferry, out of the total population over 16 years of age (431), 22.5% or 97 individuals are in the labor force, with 11.3% or 11 of them unemployed. The age group with the highest labor force participation rate is 25 to 29 years, with 100.0% or 18 individuals in the labor force. Within the labor force, the 30 to 34 years age range has the highest percentage of unemployed individuals, with 100.0% or 11 of them being unemployed.
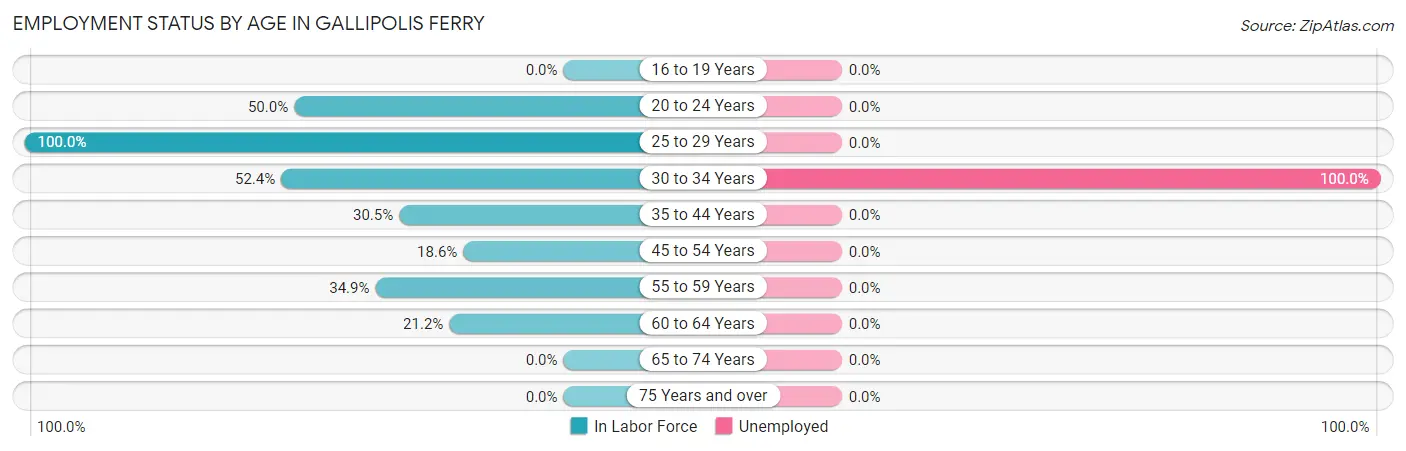
| Age Bracket | In Labor Force | Unemployed |
| 16 to 19 Years | 0 (0.0%) | 0 (0.0%) |
| 20 to 24 Years | 12 (50.0%) | 0 (0.0%) |
| 25 to 29 Years | 18 (100.0%) | 0 (0.0%) |
| 30 to 34 Years | 11 (52.4%) | 11 (100.0%) |
| 35 to 44 Years | 18 (30.5%) | 0 (0.0%) |
| 45 to 54 Years | 16 (18.6%) | 0 (0.0%) |
| 55 to 59 Years | 15 (34.9%) | 0 (0.0%) |
| 60 to 64 Years | 7 (21.2%) | 0 (0.0%) |
| 65 to 74 Years | 0 (0.0%) | 0 (0.0%) |
| 75 Years and over | 0 (0.0%) | 0 (0.0%) |
| Total | 97 (22.5%) | 11 (11.3%) |
Employment Status by Educational Attainment in Gallipolis Ferry
According to labor force statistics for Gallipolis Ferry, 32.7% of individuals (85) out of the total population between 25 and 64 years of age (260) are in the labor force, with 12.9% or 11 of them being unemployed. The group with the highest labor force participation rate are those with the educational attainment of college / associate degree, with 40.8% or 29 individuals in the labor force. Within the labor force, individuals with college / associate degree education have the highest percentage of unemployment, with 37.9% or 11 of them being unemployed.
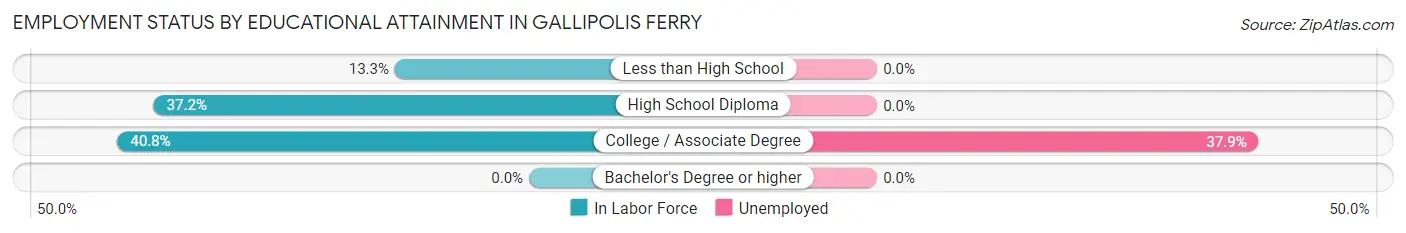
| Educational Attainment | In Labor Force | Unemployed |
| Less than High School | 8 (13.3%) | 0 (0.0%) |
| High School Diploma | 48 (37.2%) | 0 (0.0%) |
| College / Associate Degree | 29 (40.8%) | 27 (37.9%) |
| Bachelor's Degree or higher | 0 (0.0%) | 0 (0.0%) |
| Total | 85 (32.7%) | 34 (12.9%) |
Employment Occupations by Sex in Gallipolis Ferry
Management, Business, Science and Arts Occupations
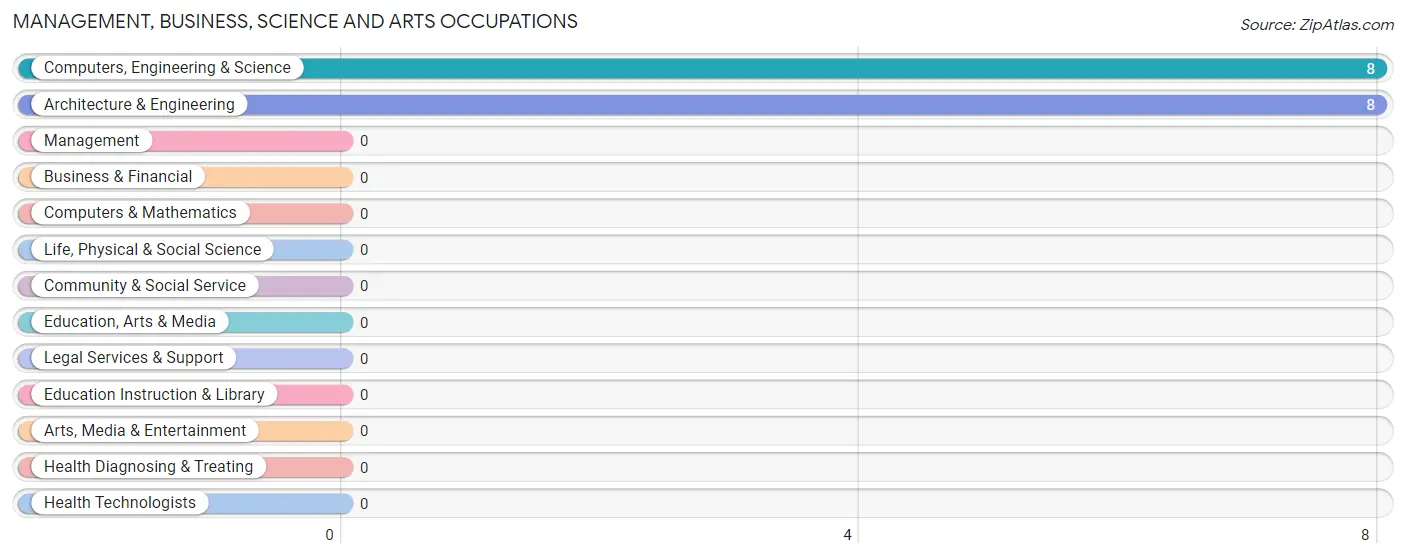
The most common Management, Business, Science and Arts occupations in Gallipolis Ferry are Computers, Engineering & Science (8 | 9.3%), and Architecture & Engineering (8 | 9.3%).
Management, Business, Science and Arts Occupations by Sex
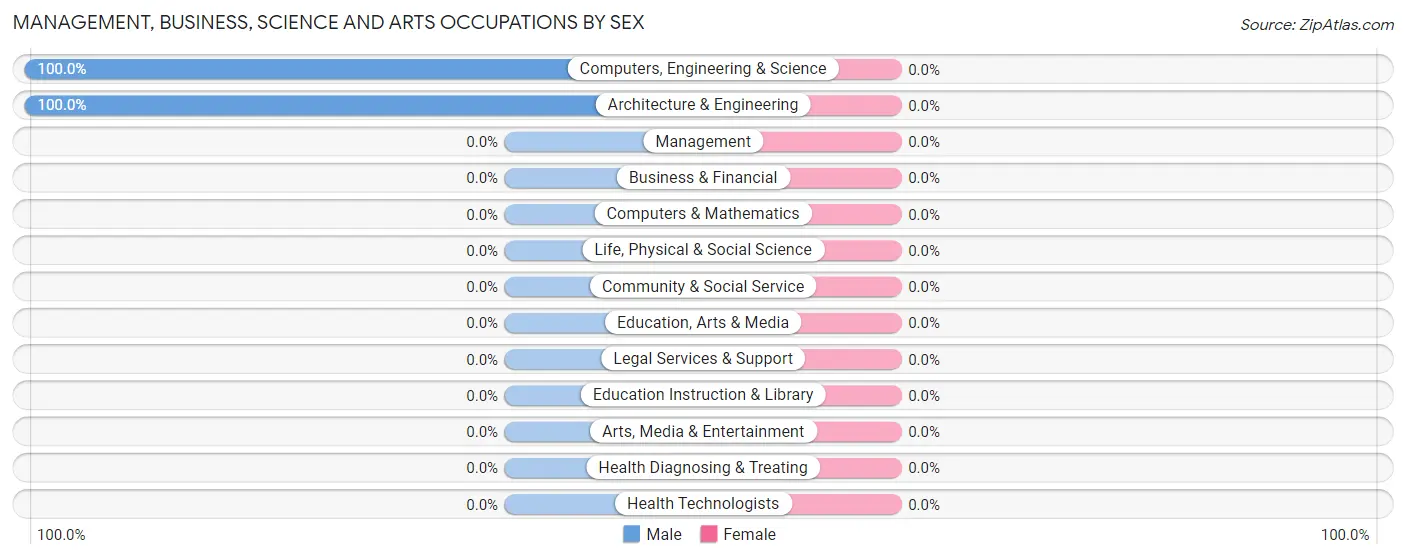
| Occupation | Male | Female |
| Management | 0 (0.0%) | 0 (0.0%) |
| Business & Financial | 0 (0.0%) | 0 (0.0%) |
| Computers, Engineering & Science | 8 (100.0%) | 0 (0.0%) |
| Computers & Mathematics | 0 (0.0%) | 0 (0.0%) |
| Architecture & Engineering | 8 (100.0%) | 0 (0.0%) |
| Life, Physical & Social Science | 0 (0.0%) | 0 (0.0%) |
| Community & Social Service | 0 (0.0%) | 0 (0.0%) |
| Education, Arts & Media | 0 (0.0%) | 0 (0.0%) |
| Legal Services & Support | 0 (0.0%) | 0 (0.0%) |
| Education Instruction & Library | 0 (0.0%) | 0 (0.0%) |
| Arts, Media & Entertainment | 0 (0.0%) | 0 (0.0%) |
| Health Diagnosing & Treating | 0 (0.0%) | 0 (0.0%) |
| Health Technologists | 0 (0.0%) | 0 (0.0%) |
| Total (Category) | 8 (100.0%) | 0 (0.0%) |
| Total (Overall) | 54 (62.8%) | 32 (37.2%) |
Services Occupations
Services Occupations by Sex
| Occupation | Male | Female |
| Healthcare Support | 0 (0.0%) | 0 (0.0%) |
| Security & Protection | 0 (0.0%) | 0 (0.0%) |
| Firefighting & Prevention | 0 (0.0%) | 0 (0.0%) |
| Law Enforcement | 0 (0.0%) | 0 (0.0%) |
| Food Preparation & Serving | 0 (0.0%) | 0 (0.0%) |
| Cleaning & Maintenance | 0 (0.0%) | 0 (0.0%) |
| Personal Care & Service | 0 (0.0%) | 0 (0.0%) |
| Total (Category) | 0 (0.0%) | 0 (0.0%) |
| Total (Overall) | 54 (62.8%) | 32 (37.2%) |
Sales and Office Occupations
The most common Sales and Office occupations in Gallipolis Ferry are , and Office & Administration (7 | 8.1%).

Sales and Office Occupations by Sex

| Occupation | Male | Female |
| Sales & Related | 0 (0.0%) | 0 (0.0%) |
| Office & Administration | 0 (0.0%) | 7 (100.0%) |
| Total (Category) | 0 (0.0%) | 7 (100.0%) |
| Total (Overall) | 54 (62.8%) | 32 (37.2%) |
Natural Resources, Construction and Maintenance Occupations
The most common Natural Resources, Construction and Maintenance occupations in Gallipolis Ferry are , and Construction & Extraction (11 | 12.8%).

Natural Resources, Construction and Maintenance Occupations by Sex

| Occupation | Male | Female |
| Farming, Fishing & Forestry | 0 (0.0%) | 0 (0.0%) |
| Construction & Extraction | 11 (100.0%) | 0 (0.0%) |
| Installation, Maintenance & Repair | 0 (0.0%) | 0 (0.0%) |
| Total (Category) | 11 (100.0%) | 0 (0.0%) |
| Total (Overall) | 54 (62.8%) | 32 (37.2%) |
Production, Transportation and Moving Occupations
The most common Production, Transportation and Moving occupations in Gallipolis Ferry are Production (48 | 55.8%), and Transportation (12 | 14.0%).
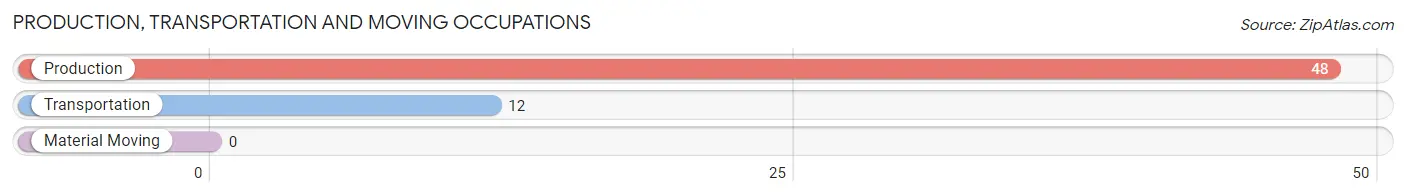
Production, Transportation and Moving Occupations by Sex
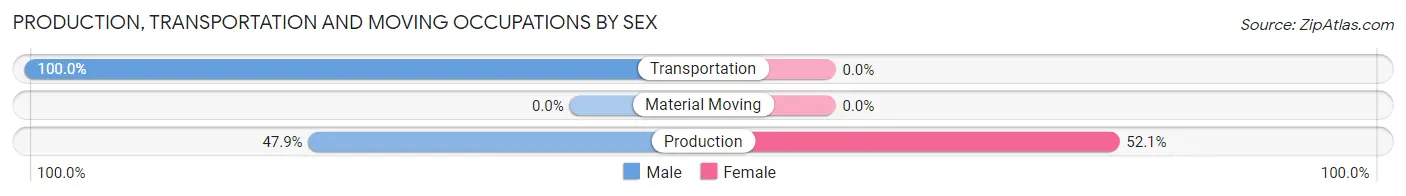
| Occupation | Male | Female |
| Production | 23 (47.9%) | 25 (52.1%) |
| Transportation | 12 (100.0%) | 0 (0.0%) |
| Material Moving | 0 (0.0%) | 0 (0.0%) |
| Total (Category) | 35 (58.3%) | 25 (41.7%) |
| Total (Overall) | 54 (62.8%) | 32 (37.2%) |
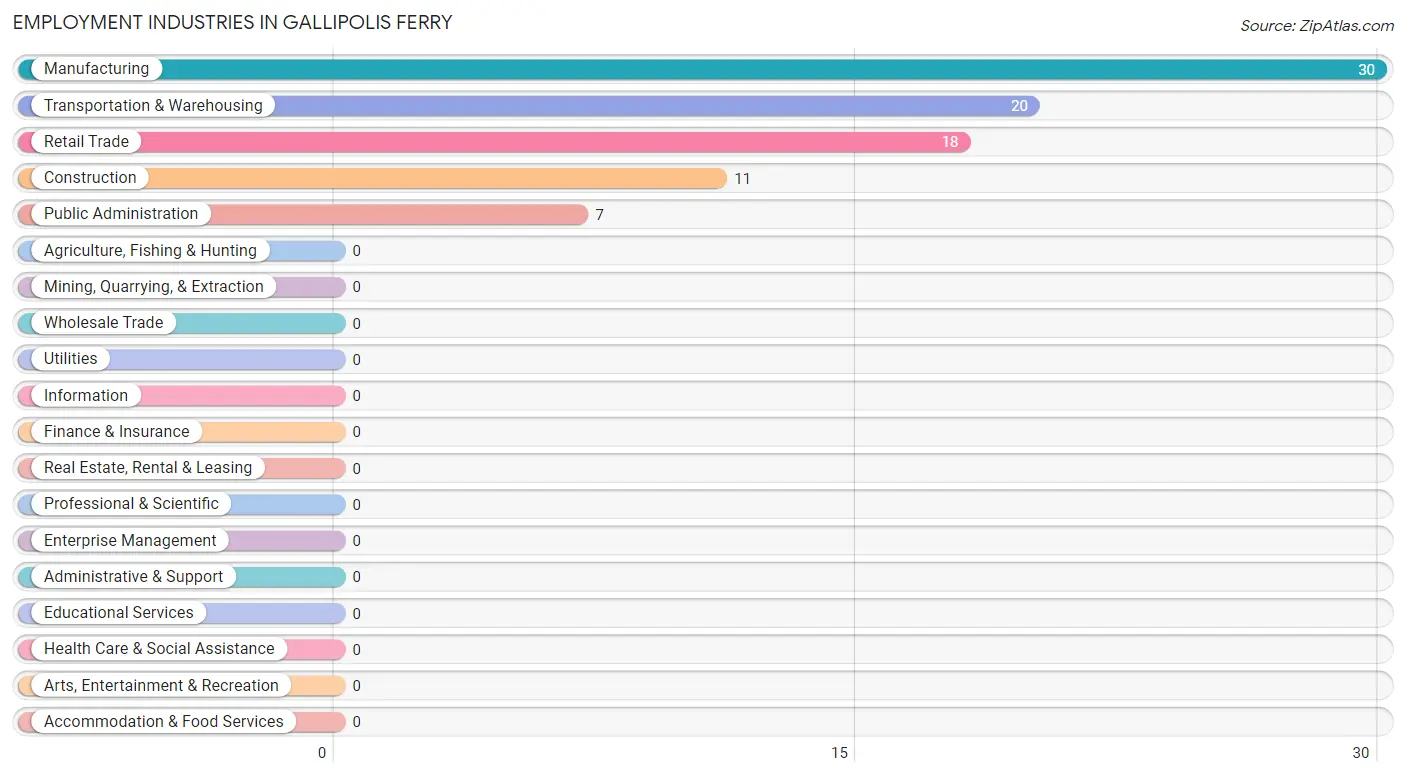
Employment Industries by Sex in Gallipolis Ferry
Employment Industries in Gallipolis Ferry
The major employment industries in Gallipolis Ferry include Manufacturing (30 | 34.9%), Transportation & Warehousing (20 | 23.3%), Retail Trade (18 | 20.9%), Construction (11 | 12.8%), and Public Administration (7 | 8.1%).
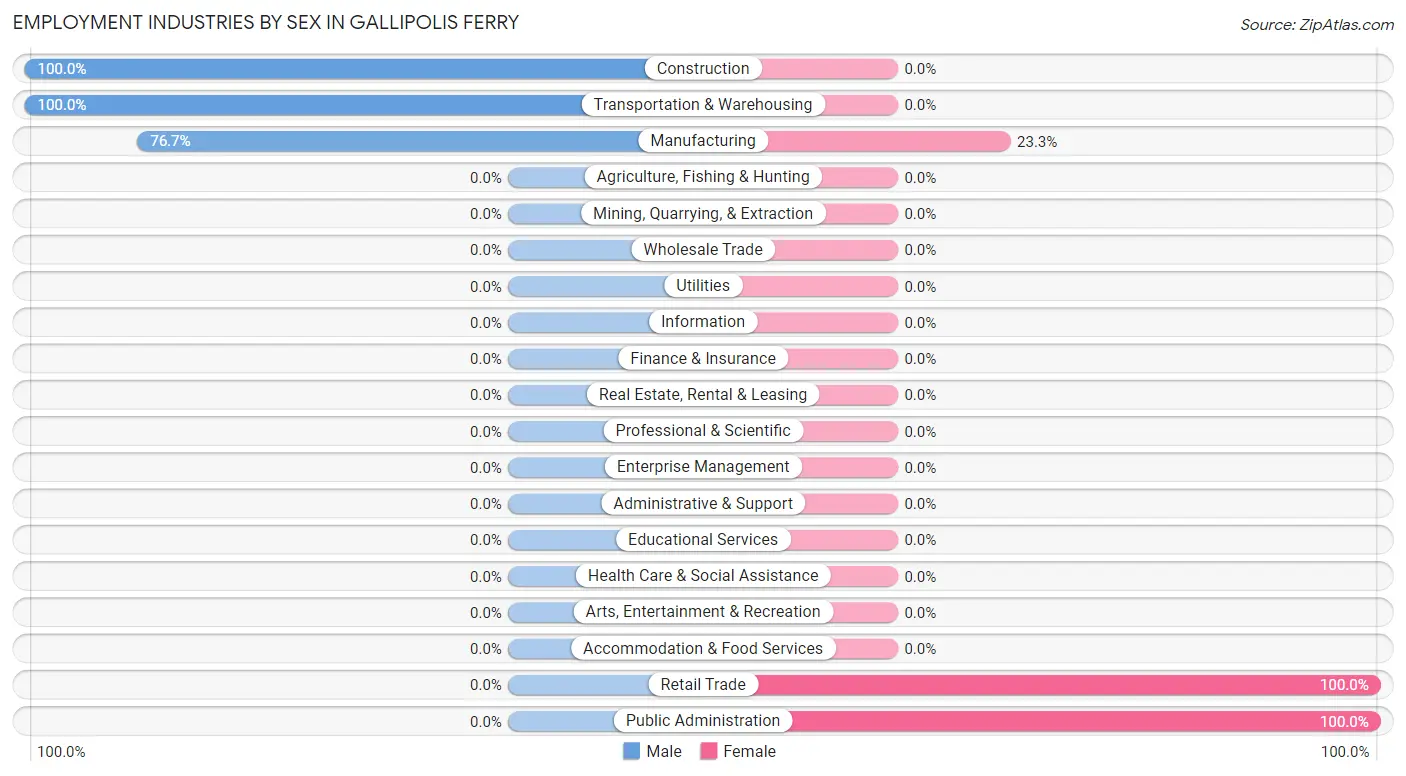
Employment Industries by Sex in Gallipolis Ferry
The Gallipolis Ferry industries that see more men than women are Construction (100.0%), Transportation & Warehousing (100.0%), and Manufacturing (76.7%), whereas the industries that tend to have a higher number of women are Retail Trade (100.0%), Public Administration (100.0%), and Manufacturing (23.3%).
| Industry | Male | Female |
| Agriculture, Fishing & Hunting | 0 (0.0%) | 0 (0.0%) |
| Mining, Quarrying, & Extraction | 0 (0.0%) | 0 (0.0%) |
| Construction | 11 (100.0%) | 0 (0.0%) |
| Manufacturing | 23 (76.7%) | 7 (23.3%) |
| Wholesale Trade | 0 (0.0%) | 0 (0.0%) |
| Retail Trade | 0 (0.0%) | 18 (100.0%) |
| Transportation & Warehousing | 20 (100.0%) | 0 (0.0%) |
| Utilities | 0 (0.0%) | 0 (0.0%) |
| Information | 0 (0.0%) | 0 (0.0%) |
| Finance & Insurance | 0 (0.0%) | 0 (0.0%) |
| Real Estate, Rental & Leasing | 0 (0.0%) | 0 (0.0%) |
| Professional & Scientific | 0 (0.0%) | 0 (0.0%) |
| Enterprise Management | 0 (0.0%) | 0 (0.0%) |
| Administrative & Support | 0 (0.0%) | 0 (0.0%) |
| Educational Services | 0 (0.0%) | 0 (0.0%) |
| Health Care & Social Assistance | 0 (0.0%) | 0 (0.0%) |
| Arts, Entertainment & Recreation | 0 (0.0%) | 0 (0.0%) |
| Accommodation & Food Services | 0 (0.0%) | 0 (0.0%) |
| Public Administration | 0 (0.0%) | 7 (100.0%) |
| Total | 54 (62.8%) | 32 (37.2%) |
Education in Gallipolis Ferry
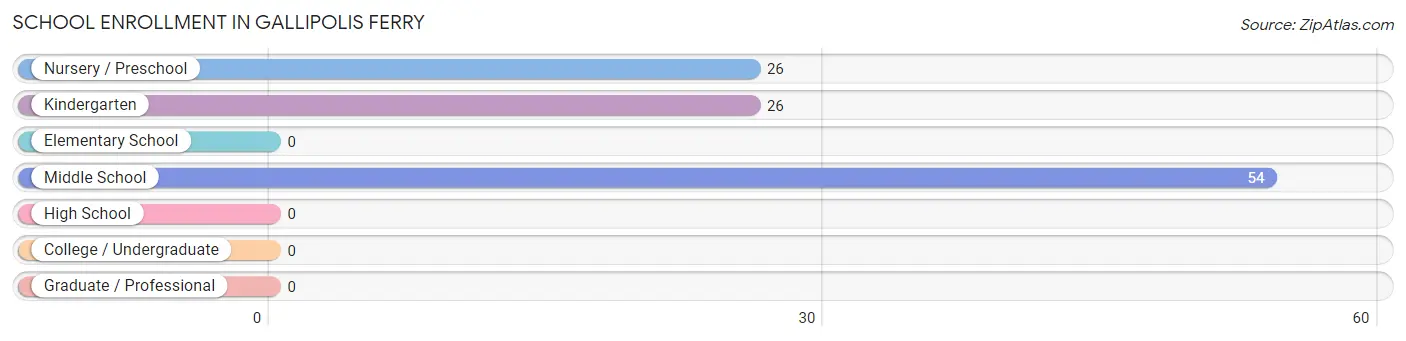
School Enrollment in Gallipolis Ferry
The most common levels of schooling among the 106 students in Gallipolis Ferry are middle school (54 | 50.9%), nursery / preschool (26 | 24.5%), and kindergarten (26 | 24.5%).
| School Level | # Students | % Students |
| Nursery / Preschool | 26 | 24.5% |
| Kindergarten | 26 | 24.5% |
| Elementary School | 0 | 0.0% |
| Middle School | 54 | 50.9% |
| High School | 0 | 0.0% |
| College / Undergraduate | 0 | 0.0% |
| Graduate / Professional | 0 | 0.0% |
| Total | 106 | 100.0% |
School Enrollment by Age by Funding Source in Gallipolis Ferry
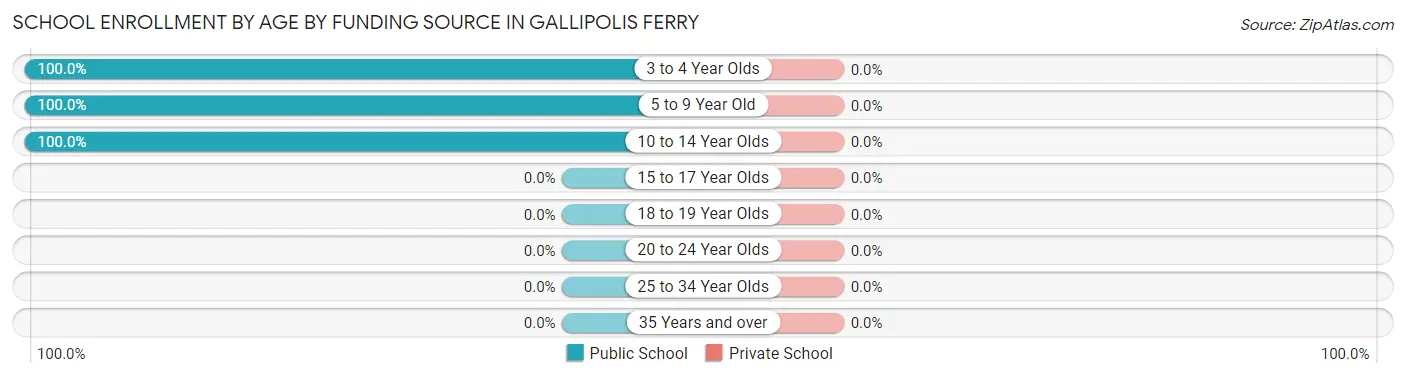
| Age Bracket | Public School | Private School |
| 3 to 4 Year Olds | 26 (100.0%) | 0 (0.0%) |
| 5 to 9 Year Old | 26 (100.0%) | 0 (0.0%) |
| 10 to 14 Year Olds | 54 (100.0%) | 0 (0.0%) |
| 15 to 17 Year Olds | 0 (0.0%) | 0 (0.0%) |
| 18 to 19 Year Olds | 0 (0.0%) | 0 (0.0%) |
| 20 to 24 Year Olds | 0 (0.0%) | 0 (0.0%) |
| 25 to 34 Year Olds | 0 (0.0%) | 0 (0.0%) |
| 35 Years and over | 0 (0.0%) | 0 (0.0%) |
| Total | 106 (100.0%) | 0 (0.0%) |
Educational Attainment by Field of Study in Gallipolis Ferry
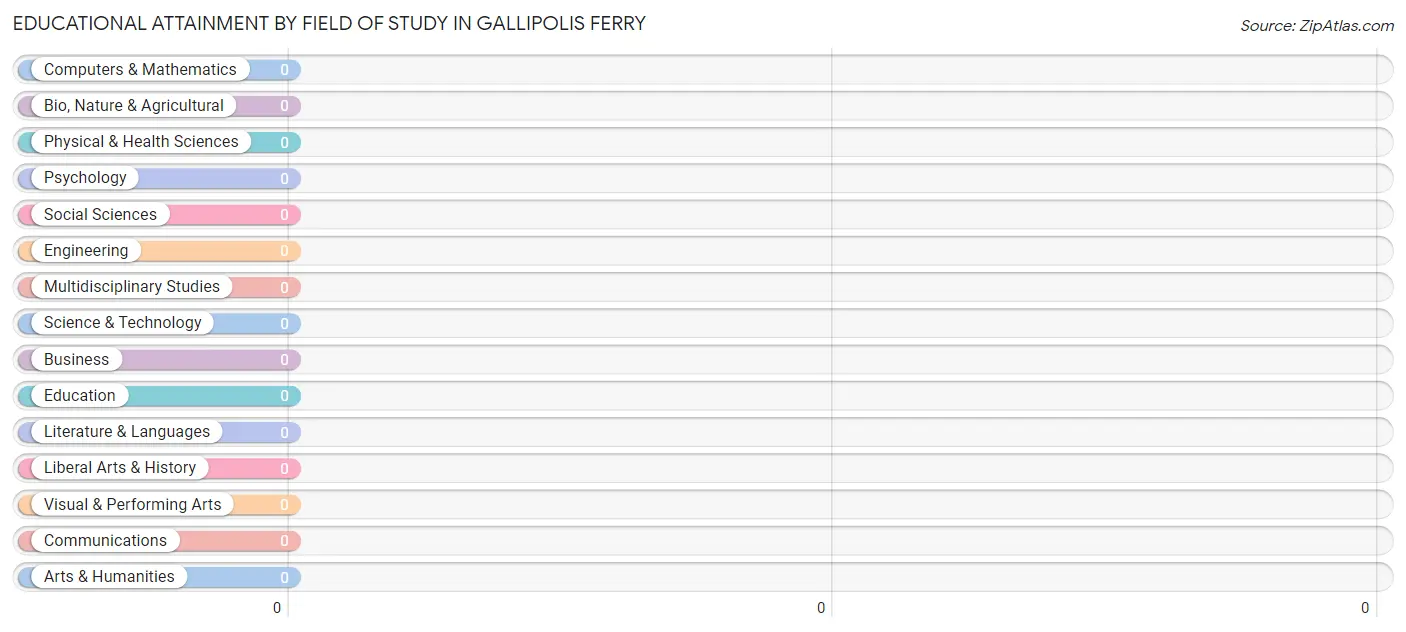
| Field of Study | # Graduates | % Graduates |
| Computers & Mathematics | 0 | 0.0% |
| Bio, Nature & Agricultural | 0 | 0.0% |
| Physical & Health Sciences | 0 | 0.0% |
| Psychology | 0 | 0.0% |
| Social Sciences | 0 | 0.0% |
| Engineering | 0 | 0.0% |
| Multidisciplinary Studies | 0 | 0.0% |
| Science & Technology | 0 | 0.0% |
| Business | 0 | 0.0% |
| Education | 0 | 0.0% |
| Literature & Languages | 0 | 0.0% |
| Liberal Arts & History | 0 | 0.0% |
| Visual & Performing Arts | 0 | 0.0% |
| Communications | 0 | 0.0% |
| Arts & Humanities | 0 | 0.0% |
| Total | 0 | 0.0% |
Transportation & Commute in Gallipolis Ferry
Vehicle Availability by Sex in Gallipolis Ferry
The most prevalent vehicle ownership categories in Gallipolis Ferry are males with 2 vehicles (25, accounting for 46.3%) and females with 2 vehicles (7, making up 78.1%).
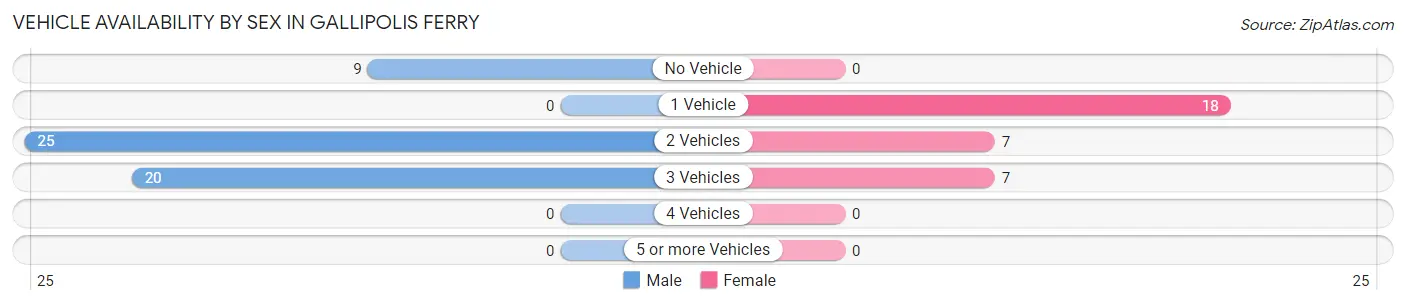
| Vehicles Available | Male | Female |
| No Vehicle | 9 (16.7%) | 0 (0.0%) |
| 1 Vehicle | 0 (0.0%) | 18 (56.2%) |
| 2 Vehicles | 25 (46.3%) | 7 (21.9%) |
| 3 Vehicles | 20 (37.0%) | 7 (21.9%) |
| 4 Vehicles | 0 (0.0%) | 0 (0.0%) |
| 5 or more Vehicles | 0 (0.0%) | 0 (0.0%) |
| Total | 54 (100.0%) | 32 (100.0%) |
Commute Time in Gallipolis Ferry
The most frequently occuring commute durations in Gallipolis Ferry are 15 to 19 minutes (34 commuters, 39.5%), 10 to 14 minutes (19 commuters, 22.1%), and 40 to 44 minutes (14 commuters, 16.3%).
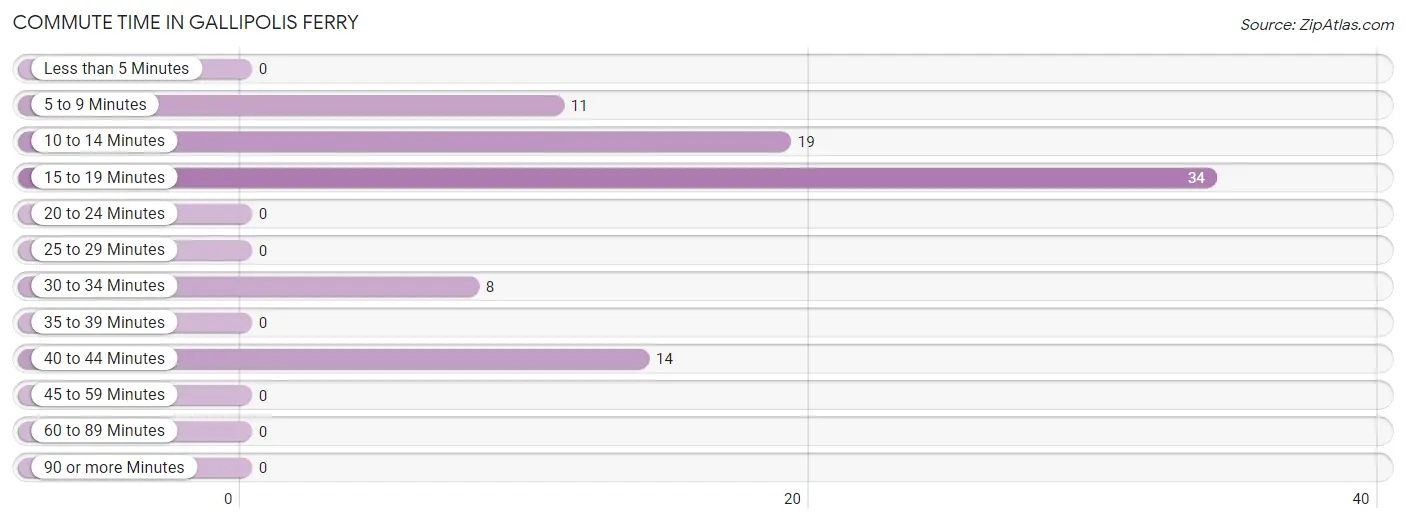
| Commute Time | # Commuters | % Commuters |
| Less than 5 Minutes | 0 | 0.0% |
| 5 to 9 Minutes | 11 | 12.8% |
| 10 to 14 Minutes | 19 | 22.1% |
| 15 to 19 Minutes | 34 | 39.5% |
| 20 to 24 Minutes | 0 | 0.0% |
| 25 to 29 Minutes | 0 | 0.0% |
| 30 to 34 Minutes | 8 | 9.3% |
| 35 to 39 Minutes | 0 | 0.0% |
| 40 to 44 Minutes | 14 | 16.3% |
| 45 to 59 Minutes | 0 | 0.0% |
| 60 to 89 Minutes | 0 | 0.0% |
| 90 or more Minutes | 0 | 0.0% |
Commute Time by Sex in Gallipolis Ferry
The most common commute times in Gallipolis Ferry are 10 to 14 minutes (19 commuters, 35.2%) for males and 15 to 19 minutes (25 commuters, 78.1%) for females.
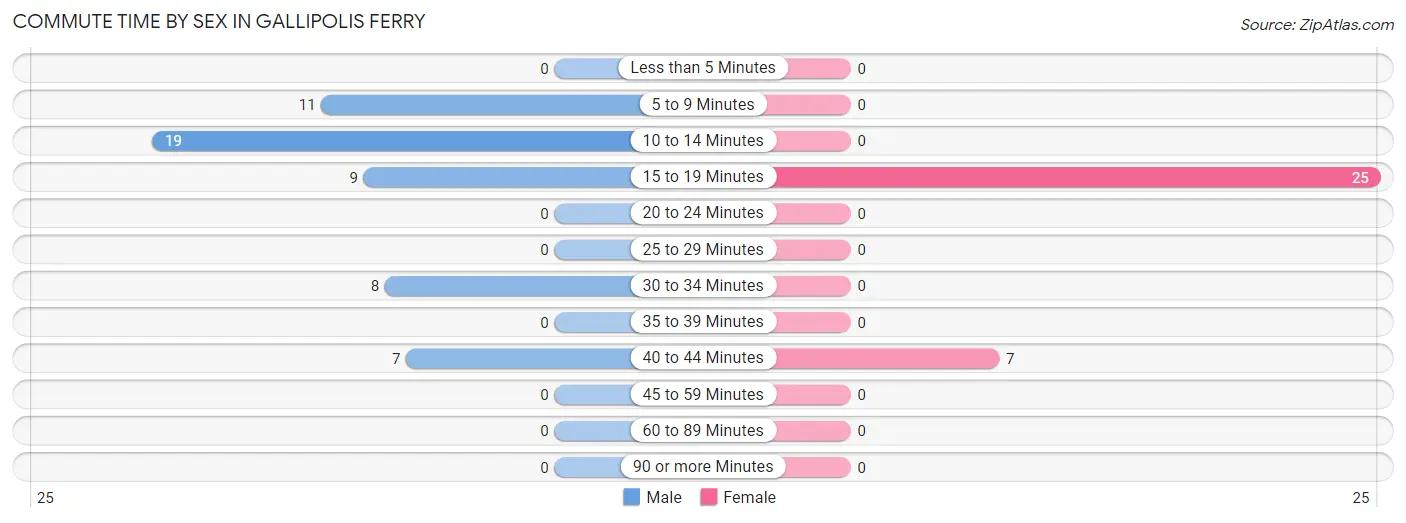
| Commute Time | Male | Female |
| Less than 5 Minutes | 0 (0.0%) | 0 (0.0%) |
| 5 to 9 Minutes | 11 (20.4%) | 0 (0.0%) |
| 10 to 14 Minutes | 19 (35.2%) | 0 (0.0%) |
| 15 to 19 Minutes | 9 (16.7%) | 25 (78.1%) |
| 20 to 24 Minutes | 0 (0.0%) | 0 (0.0%) |
| 25 to 29 Minutes | 0 (0.0%) | 0 (0.0%) |
| 30 to 34 Minutes | 8 (14.8%) | 0 (0.0%) |
| 35 to 39 Minutes | 0 (0.0%) | 0 (0.0%) |
| 40 to 44 Minutes | 7 (13.0%) | 7 (21.9%) |
| 45 to 59 Minutes | 0 (0.0%) | 0 (0.0%) |
| 60 to 89 Minutes | 0 (0.0%) | 0 (0.0%) |
| 90 or more Minutes | 0 (0.0%) | 0 (0.0%) |
Time of Departure to Work by Sex in Gallipolis Ferry
The most frequent times of departure to work in Gallipolis Ferry are 6:30 AM to 6:59 AM (15, 27.8%) for males and 7:30 AM to 7:59 AM (25, 78.1%) for females.
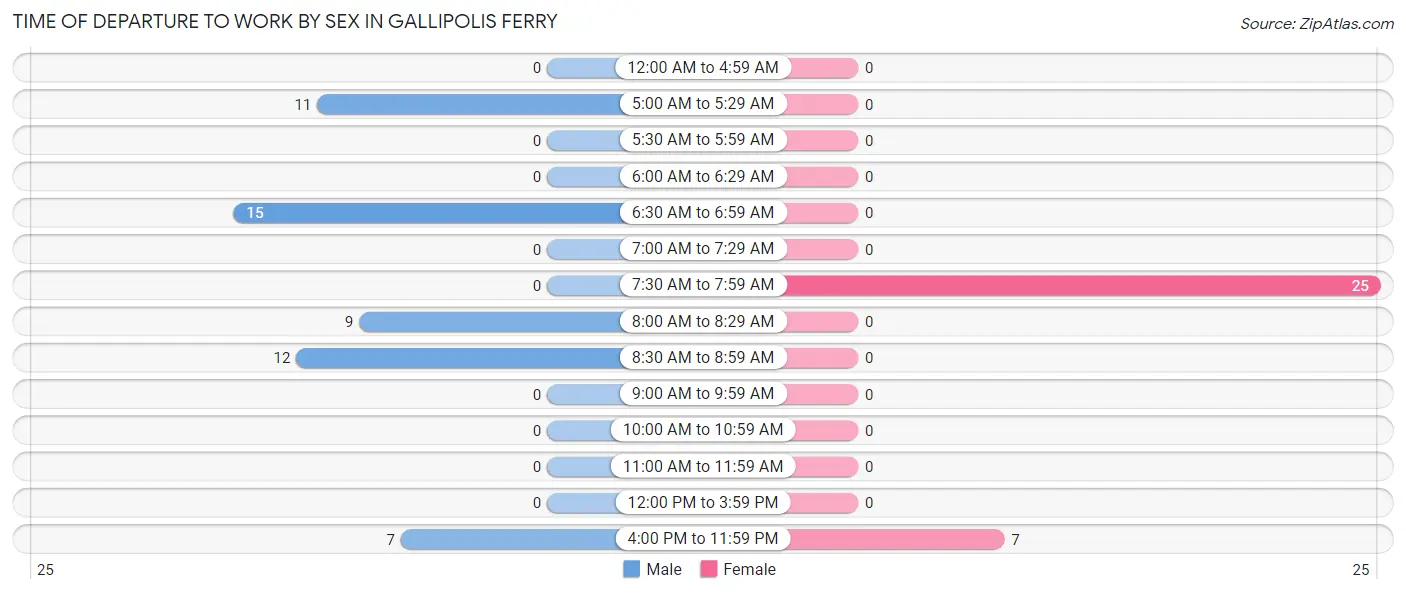
| Time of Departure | Male | Female |
| 12:00 AM to 4:59 AM | 0 (0.0%) | 0 (0.0%) |
| 5:00 AM to 5:29 AM | 11 (20.4%) | 0 (0.0%) |
| 5:30 AM to 5:59 AM | 0 (0.0%) | 0 (0.0%) |
| 6:00 AM to 6:29 AM | 0 (0.0%) | 0 (0.0%) |
| 6:30 AM to 6:59 AM | 15 (27.8%) | 0 (0.0%) |
| 7:00 AM to 7:29 AM | 0 (0.0%) | 0 (0.0%) |
| 7:30 AM to 7:59 AM | 0 (0.0%) | 25 (78.1%) |
| 8:00 AM to 8:29 AM | 9 (16.7%) | 0 (0.0%) |
| 8:30 AM to 8:59 AM | 12 (22.2%) | 0 (0.0%) |
| 9:00 AM to 9:59 AM | 0 (0.0%) | 0 (0.0%) |
| 10:00 AM to 10:59 AM | 0 (0.0%) | 0 (0.0%) |
| 11:00 AM to 11:59 AM | 0 (0.0%) | 0 (0.0%) |
| 12:00 PM to 3:59 PM | 0 (0.0%) | 0 (0.0%) |
| 4:00 PM to 11:59 PM | 7 (13.0%) | 7 (21.9%) |
| Total | 54 (100.0%) | 32 (100.0%) |
Housing Occupancy in Gallipolis Ferry
Occupancy by Ownership in Gallipolis Ferry
Of the total 249 dwellings in Gallipolis Ferry, owner-occupied units account for 239 (96.0%), while renter-occupied units make up 10 (4.0%).
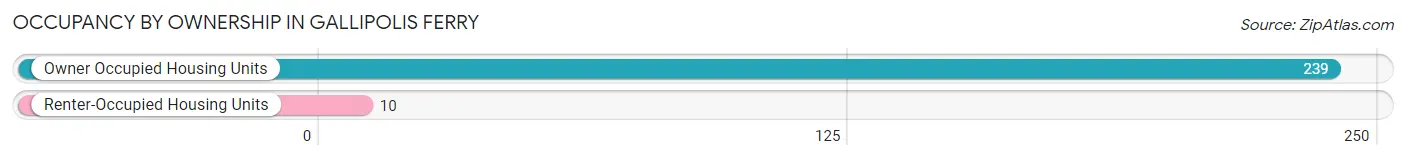
| Occupancy | # Housing Units | % Housing Units |
| Owner Occupied Housing Units | 239 | 96.0% |
| Renter-Occupied Housing Units | 10 | 4.0% |
| Total Occupied Housing Units | 249 | 100.0% |
Occupancy by Household Size in Gallipolis Ferry
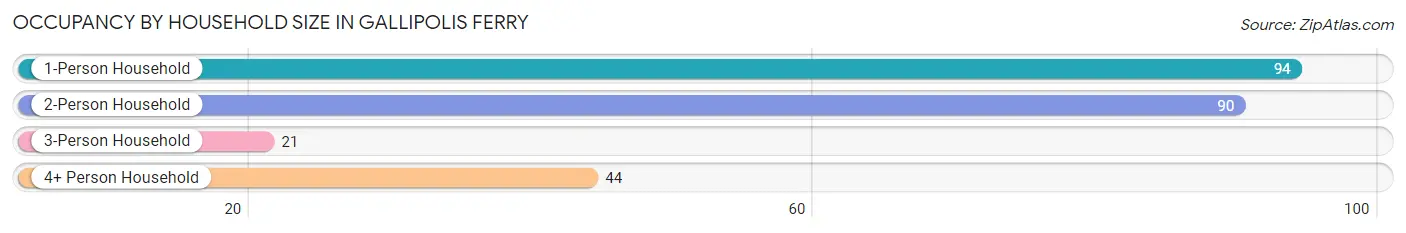
| Household Size | # Housing Units | % Housing Units |
| 1-Person Household | 94 | 37.8% |
| 2-Person Household | 90 | 36.1% |
| 3-Person Household | 21 | 8.4% |
| 4+ Person Household | 44 | 17.7% |
| Total Housing Units | 249 | 100.0% |
Occupancy by Ownership by Household Size in Gallipolis Ferry
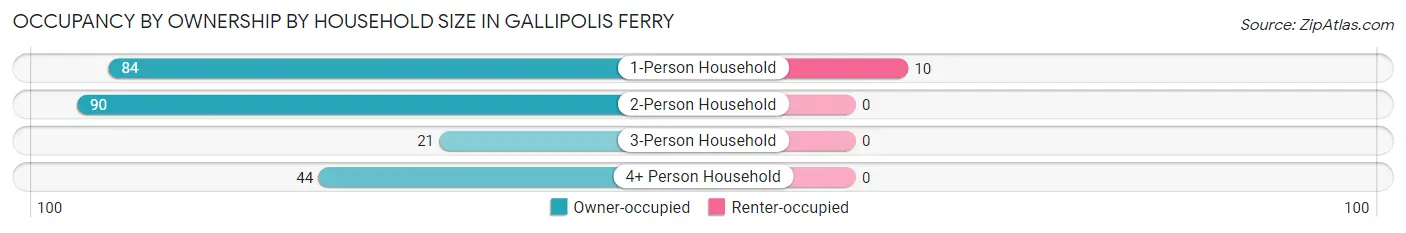
| Household Size | Owner-occupied | Renter-occupied |
| 1-Person Household | 84 (89.4%) | 10 (10.6%) |
| 2-Person Household | 90 (100.0%) | 0 (0.0%) |
| 3-Person Household | 21 (100.0%) | 0 (0.0%) |
| 4+ Person Household | 44 (100.0%) | 0 (0.0%) |
| Total Housing Units | 239 (96.0%) | 10 (4.0%) |
Occupancy by Educational Attainment in Gallipolis Ferry
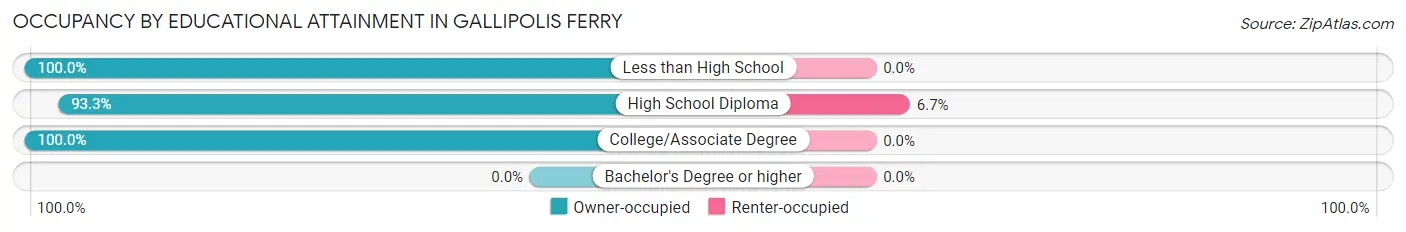
| Household Size | Owner-occupied | Renter-occupied |
| Less than High School | 27 (100.0%) | 0 (0.0%) |
| High School Diploma | 140 (93.3%) | 10 (6.7%) |
| College/Associate Degree | 72 (100.0%) | 0 (0.0%) |
| Bachelor's Degree or higher | 0 (0.0%) | 0 (0.0%) |
Occupancy by Age of Householder in Gallipolis Ferry
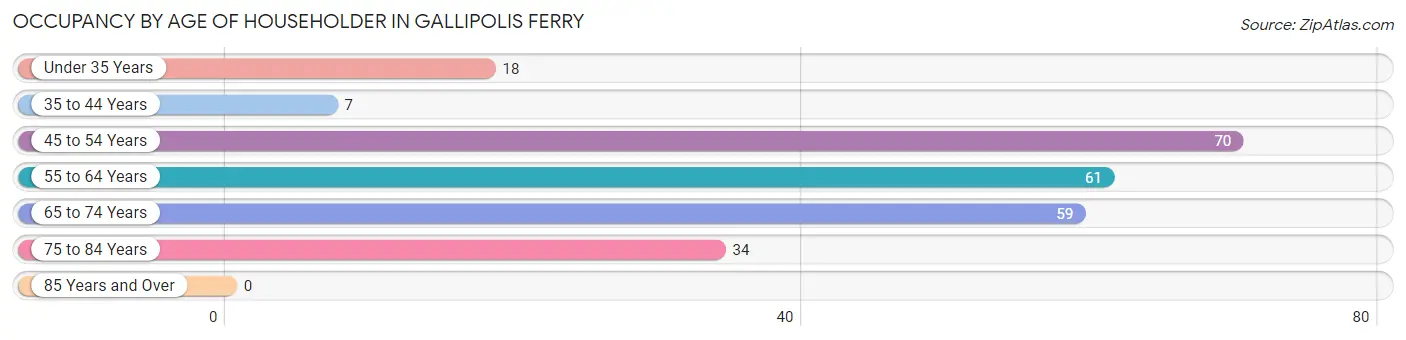
| Age Bracket | # Households | % Households |
| Under 35 Years | 18 | 7.2% |
| 35 to 44 Years | 7 | 2.8% |
| 45 to 54 Years | 70 | 28.1% |
| 55 to 64 Years | 61 | 24.5% |
| 65 to 74 Years | 59 | 23.7% |
| 75 to 84 Years | 34 | 13.7% |
| 85 Years and Over | 0 | 0.0% |
| Total | 249 | 100.0% |
Housing Finances in Gallipolis Ferry
Median Income by Occupancy in Gallipolis Ferry
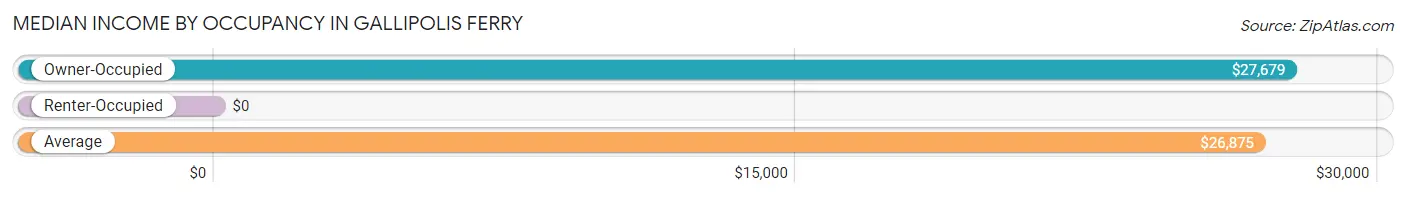
| Occupancy Type | # Households | Median Income |
| Owner-Occupied | 239 (96.0%) | $27,679 |
| Renter-Occupied | 10 (4.0%) | $0 |
| Average | 249 (100.0%) | $26,875 |
Occupancy by Householder Income Bracket in Gallipolis Ferry
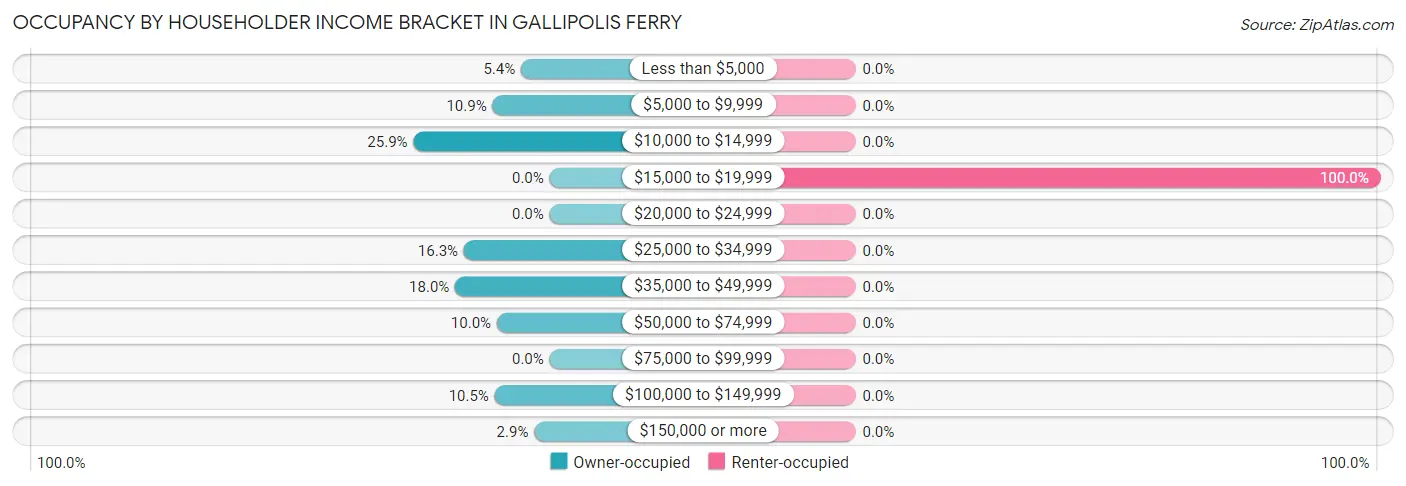
| Income Bracket | Owner-occupied | Renter-occupied |
| Less than $5,000 | 13 (5.4%) | 0 (0.0%) |
| $5,000 to $9,999 | 26 (10.9%) | 0 (0.0%) |
| $10,000 to $14,999 | 62 (25.9%) | 0 (0.0%) |
| $15,000 to $19,999 | 0 (0.0%) | 10 (100.0%) |
| $20,000 to $24,999 | 0 (0.0%) | 0 (0.0%) |
| $25,000 to $34,999 | 39 (16.3%) | 0 (0.0%) |
| $35,000 to $49,999 | 43 (18.0%) | 0 (0.0%) |
| $50,000 to $74,999 | 24 (10.0%) | 0 (0.0%) |
| $75,000 to $99,999 | 0 (0.0%) | 0 (0.0%) |
| $100,000 to $149,999 | 25 (10.5%) | 0 (0.0%) |
| $150,000 or more | 7 (2.9%) | 0 (0.0%) |
| Total | 239 (100.0%) | 10 (100.0%) |
Monthly Housing Cost Tiers in Gallipolis Ferry
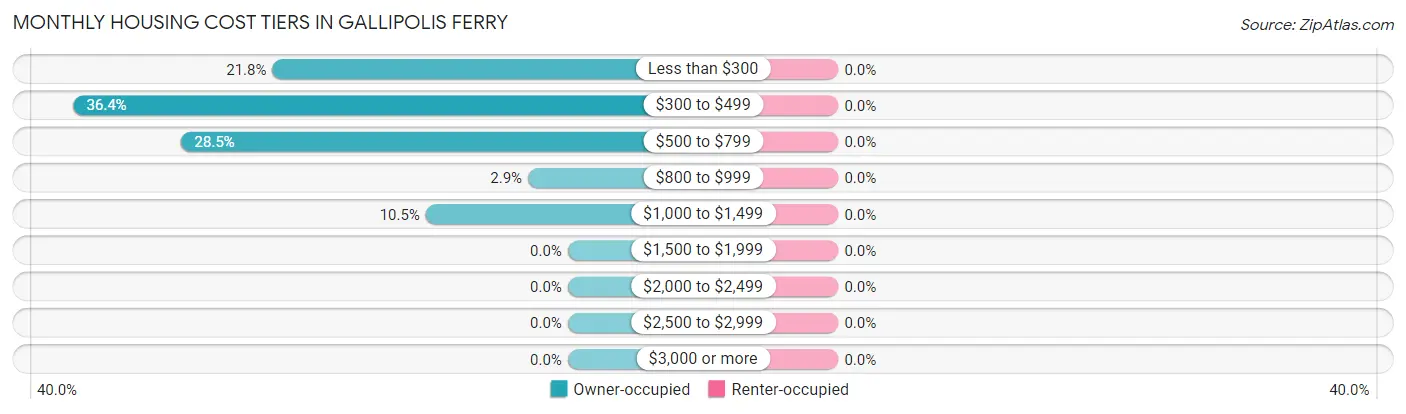
| Monthly Cost | Owner-occupied | Renter-occupied |
| Less than $300 | 52 (21.8%) | 0 (0.0%) |
| $300 to $499 | 87 (36.4%) | 0 (0.0%) |
| $500 to $799 | 68 (28.4%) | 0 (0.0%) |
| $800 to $999 | 7 (2.9%) | 0 (0.0%) |
| $1,000 to $1,499 | 25 (10.5%) | 0 (0.0%) |
| $1,500 to $1,999 | 0 (0.0%) | 0 (0.0%) |
| $2,000 to $2,499 | 0 (0.0%) | 0 (0.0%) |
| $2,500 to $2,999 | 0 (0.0%) | 0 (0.0%) |
| $3,000 or more | 0 (0.0%) | 0 (0.0%) |
| Total | 239 (100.0%) | 10 (100.0%) |
Physical Housing Characteristics in Gallipolis Ferry
Housing Structures in Gallipolis Ferry
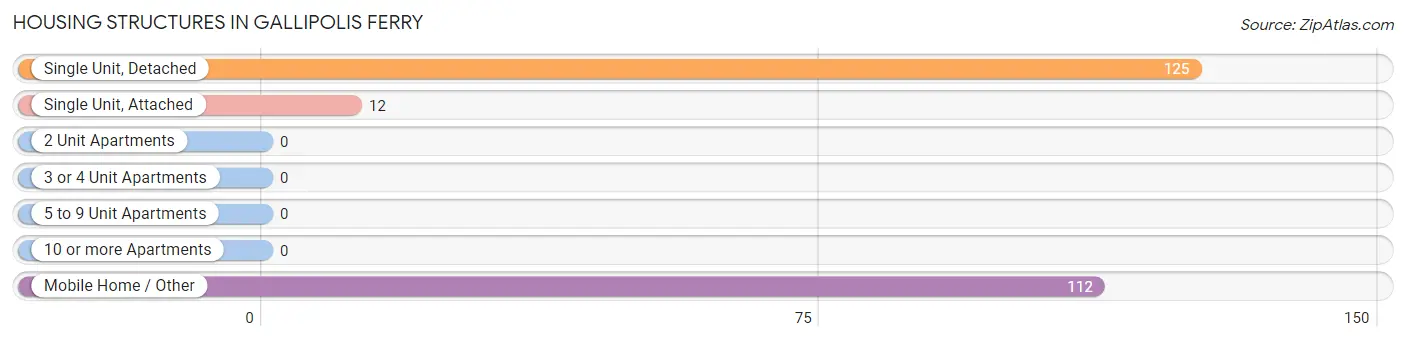
| Structure Type | # Housing Units | % Housing Units |
| Single Unit, Detached | 125 | 50.2% |
| Single Unit, Attached | 12 | 4.8% |
| 2 Unit Apartments | 0 | 0.0% |
| 3 or 4 Unit Apartments | 0 | 0.0% |
| 5 to 9 Unit Apartments | 0 | 0.0% |
| 10 or more Apartments | 0 | 0.0% |
| Mobile Home / Other | 112 | 45.0% |
| Total | 249 | 100.0% |
Housing Structures by Occupancy in Gallipolis Ferry
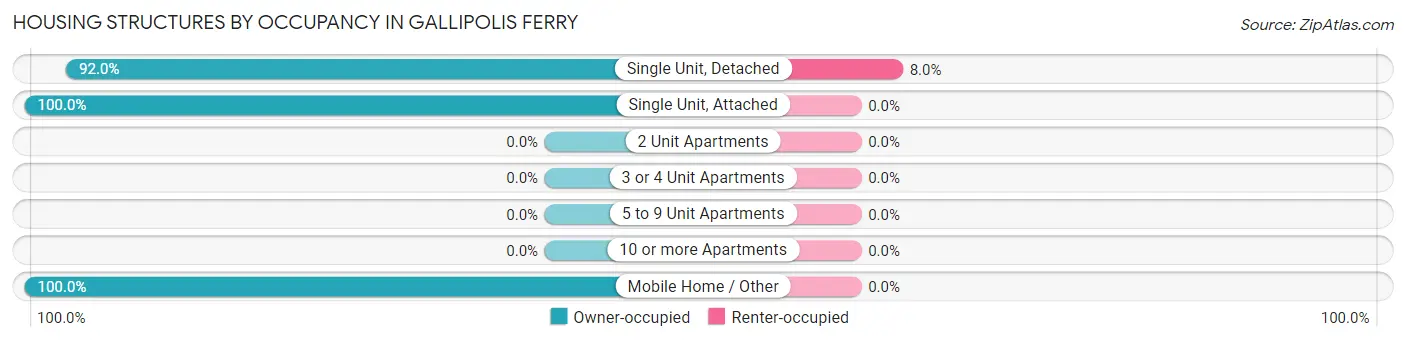
| Structure Type | Owner-occupied | Renter-occupied |
| Single Unit, Detached | 115 (92.0%) | 10 (8.0%) |
| Single Unit, Attached | 12 (100.0%) | 0 (0.0%) |
| 2 Unit Apartments | 0 (0.0%) | 0 (0.0%) |
| 3 or 4 Unit Apartments | 0 (0.0%) | 0 (0.0%) |
| 5 to 9 Unit Apartments | 0 (0.0%) | 0 (0.0%) |
| 10 or more Apartments | 0 (0.0%) | 0 (0.0%) |
| Mobile Home / Other | 112 (100.0%) | 0 (0.0%) |
| Total | 239 (96.0%) | 10 (4.0%) |
Housing Structures by Number of Rooms in Gallipolis Ferry
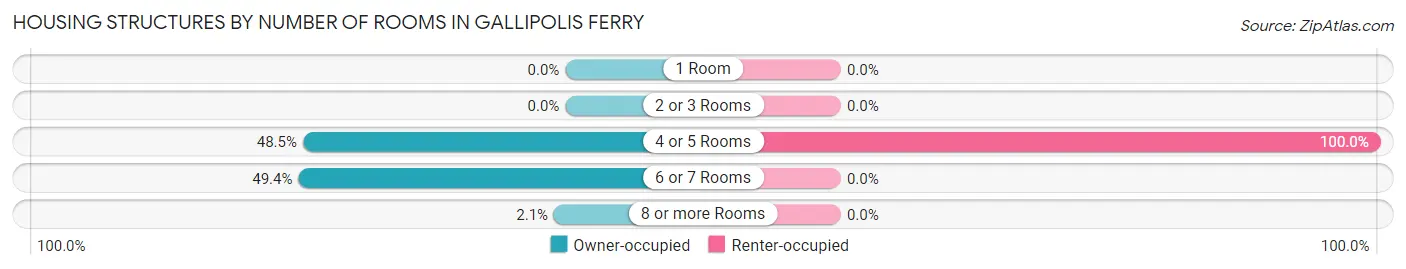
| Number of Rooms | Owner-occupied | Renter-occupied |
| 1 Room | 0 (0.0%) | 0 (0.0%) |
| 2 or 3 Rooms | 0 (0.0%) | 0 (0.0%) |
| 4 or 5 Rooms | 116 (48.5%) | 10 (100.0%) |
| 6 or 7 Rooms | 118 (49.4%) | 0 (0.0%) |
| 8 or more Rooms | 5 (2.1%) | 0 (0.0%) |
| Total | 239 (100.0%) | 10 (100.0%) |
Housing Structure by Heating Type in Gallipolis Ferry
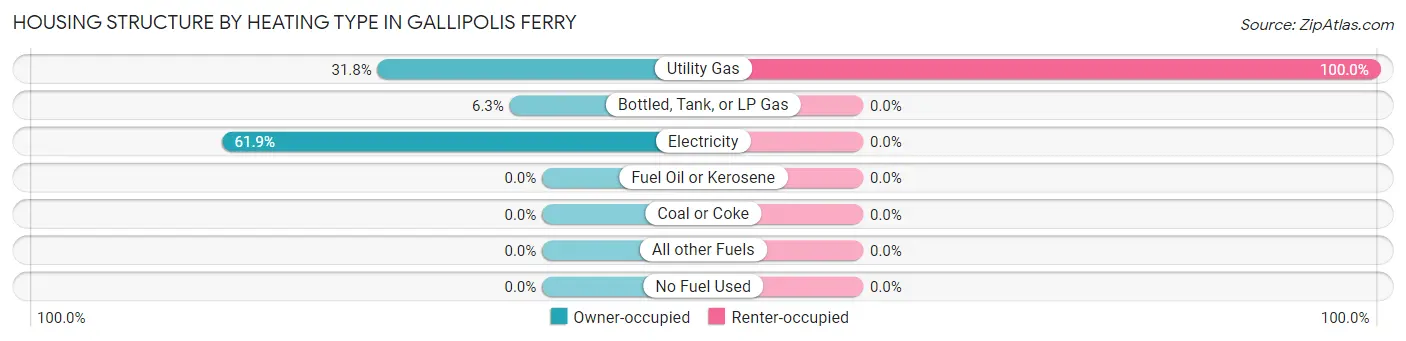
| Heating Type | Owner-occupied | Renter-occupied |
| Utility Gas | 76 (31.8%) | 10 (100.0%) |
| Bottled, Tank, or LP Gas | 15 (6.3%) | 0 (0.0%) |
| Electricity | 148 (61.9%) | 0 (0.0%) |
| Fuel Oil or Kerosene | 0 (0.0%) | 0 (0.0%) |
| Coal or Coke | 0 (0.0%) | 0 (0.0%) |
| All other Fuels | 0 (0.0%) | 0 (0.0%) |
| No Fuel Used | 0 (0.0%) | 0 (0.0%) |
| Total | 239 (100.0%) | 10 (100.0%) |
Household Vehicle Usage in Gallipolis Ferry
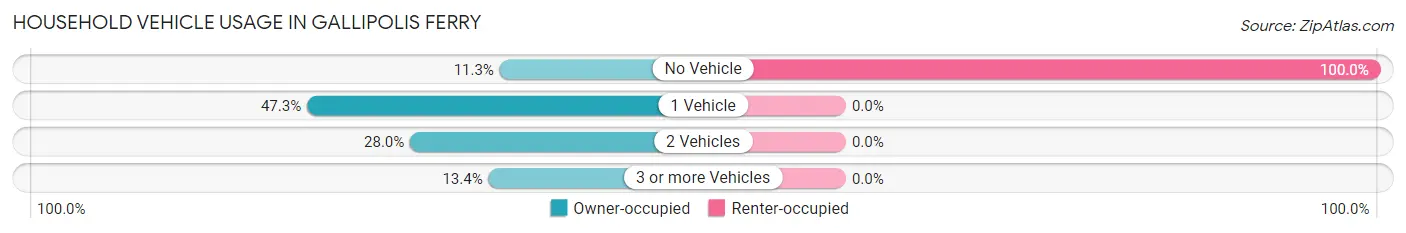
| Vehicles per Household | Owner-occupied | Renter-occupied |
| No Vehicle | 27 (11.3%) | 10 (100.0%) |
| 1 Vehicle | 113 (47.3%) | 0 (0.0%) |
| 2 Vehicles | 67 (28.0%) | 0 (0.0%) |
| 3 or more Vehicles | 32 (13.4%) | 0 (0.0%) |
| Total | 239 (100.0%) | 10 (100.0%) |
Real Estate & Mortgages in Gallipolis Ferry
Real Estate and Mortgage Overview in Gallipolis Ferry
| Characteristic | Without Mortgage | With Mortgage |
| Housing Units | 185 | 54 |
| Median Property Value | $58,400 | $98,600 |
| Median Household Income | - | - |
| Monthly Housing Costs | $450 | $0 |
| Real Estate Taxes | - | - |
Property Value by Mortgage Status in Gallipolis Ferry
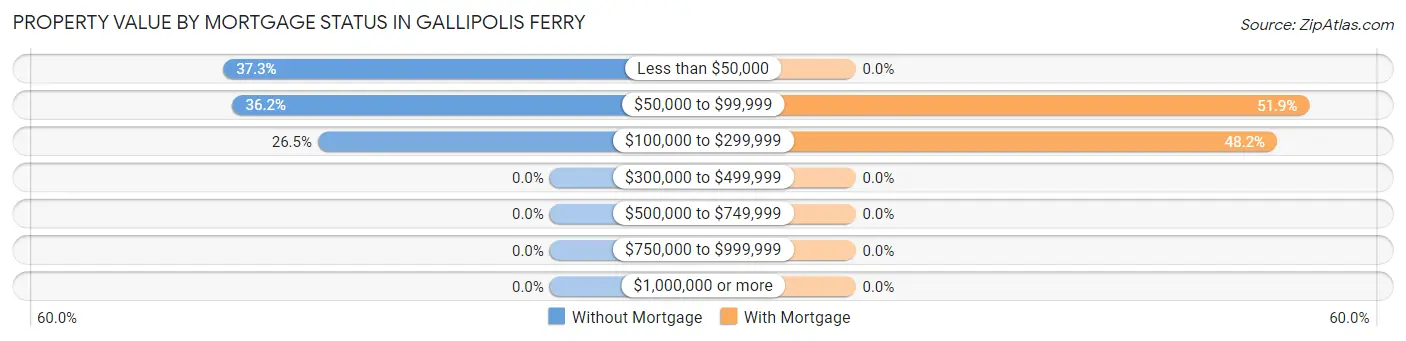
| Property Value | Without Mortgage | With Mortgage |
| Less than $50,000 | 69 (37.3%) | 0 (0.0%) |
| $50,000 to $99,999 | 67 (36.2%) | 28 (51.8%) |
| $100,000 to $299,999 | 49 (26.5%) | 26 (48.1%) |
| $300,000 to $499,999 | 0 (0.0%) | 0 (0.0%) |
| $500,000 to $749,999 | 0 (0.0%) | 0 (0.0%) |
| $750,000 to $999,999 | 0 (0.0%) | 0 (0.0%) |
| $1,000,000 or more | 0 (0.0%) | 0 (0.0%) |
| Total | 185 (100.0%) | 54 (100.0%) |
Household Income by Mortgage Status in Gallipolis Ferry
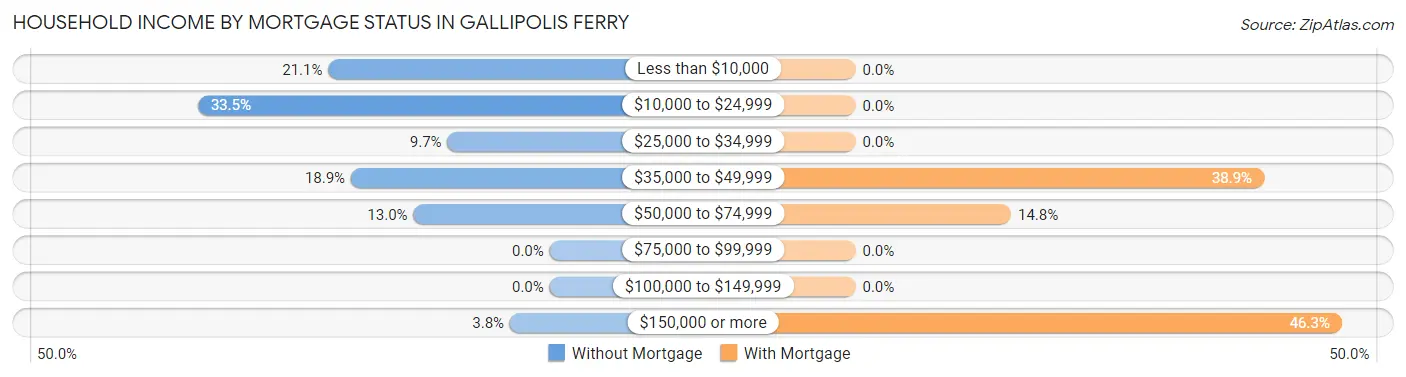
| Household Income | Without Mortgage | With Mortgage |
| Less than $10,000 | 39 (21.1%) | 0 (0.0%) |
| $10,000 to $24,999 | 62 (33.5%) | 0 (0.0%) |
| $25,000 to $34,999 | 18 (9.7%) | 0 (0.0%) |
| $35,000 to $49,999 | 35 (18.9%) | 21 (38.9%) |
| $50,000 to $74,999 | 24 (13.0%) | 8 (14.8%) |
| $75,000 to $99,999 | 0 (0.0%) | 0 (0.0%) |
| $100,000 to $149,999 | 0 (0.0%) | 0 (0.0%) |
| $150,000 or more | 7 (3.8%) | 25 (46.3%) |
| Total | 185 (100.0%) | 54 (100.0%) |
Property Value to Household Income Ratio in Gallipolis Ferry
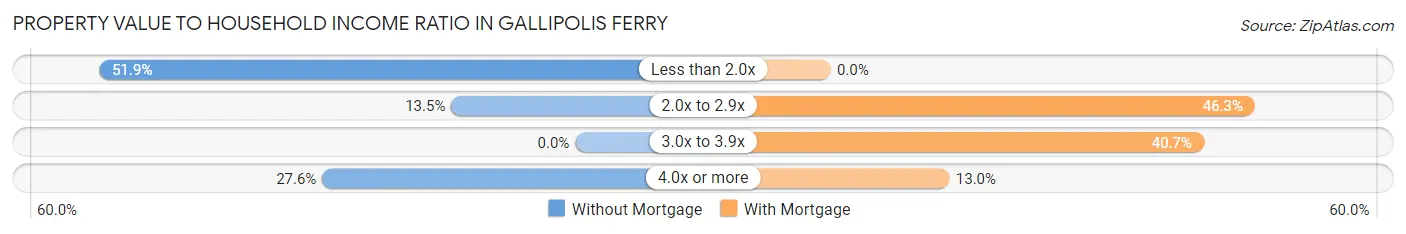
| Value-to-Income Ratio | Without Mortgage | With Mortgage |
| Less than 2.0x | 96 (51.9%) | 0 (0.0%) |
| 2.0x to 2.9x | 25 (13.5%) | 25 (46.3%) |
| 3.0x to 3.9x | 0 (0.0%) | 22 (40.7%) |
| 4.0x or more | 51 (27.6%) | 7 (13.0%) |
| Total | 185 (100.0%) | 54 (100.0%) |
Real Estate Taxes by Mortgage Status in Gallipolis Ferry
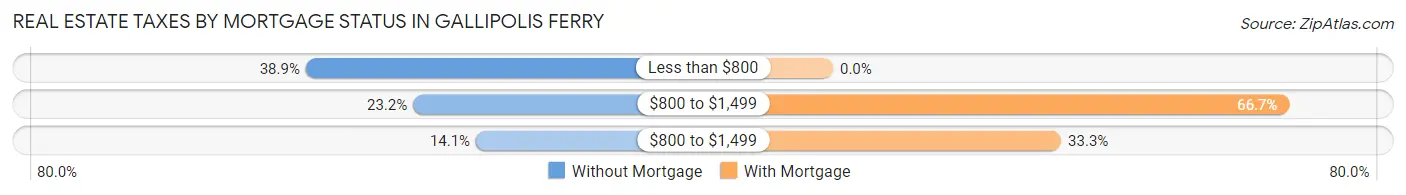
| Property Taxes | Without Mortgage | With Mortgage |
| Less than $800 | 72 (38.9%) | 0 (0.0%) |
| $800 to $1,499 | 43 (23.2%) | 36 (66.7%) |
| $800 to $1,499 | 26 (14.1%) | 18 (33.3%) |
| Total | 185 (100.0%) | 54 (100.0%) |
Health & Disability in Gallipolis Ferry
Health Insurance Coverage by Age in Gallipolis Ferry
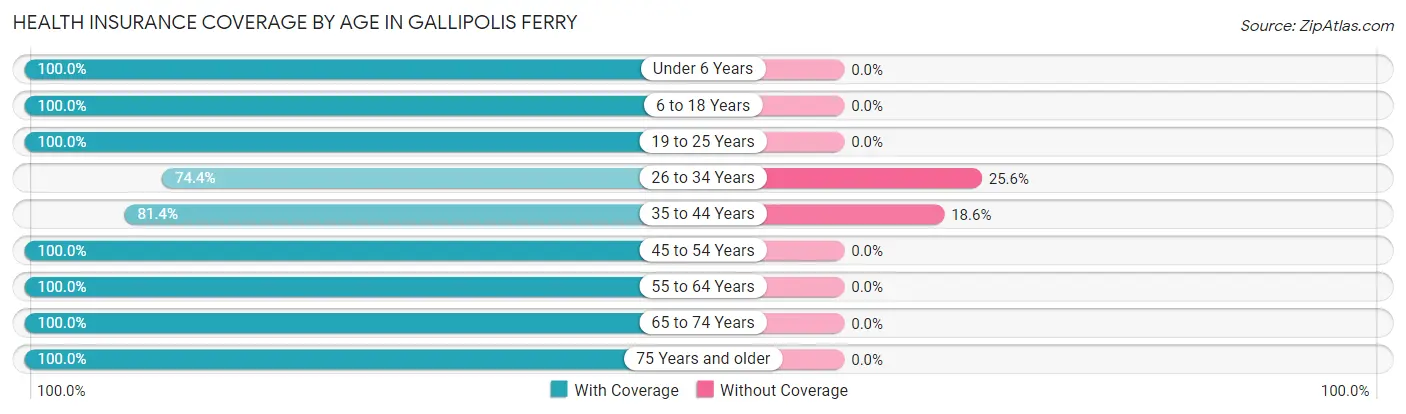
| Age Bracket | With Coverage | Without Coverage |
| Under 6 Years | 52 (100.0%) | 0 (0.0%) |
| 6 to 18 Years | 80 (100.0%) | 0 (0.0%) |
| 19 to 25 Years | 24 (100.0%) | 0 (0.0%) |
| 26 to 34 Years | 29 (74.4%) | 10 (25.6%) |
| 35 to 44 Years | 48 (81.4%) | 11 (18.6%) |
| 45 to 54 Years | 86 (100.0%) | 0 (0.0%) |
| 55 to 64 Years | 76 (100.0%) | 0 (0.0%) |
| 65 to 74 Years | 76 (100.0%) | 0 (0.0%) |
| 75 Years and older | 71 (100.0%) | 0 (0.0%) |
| Total | 542 (96.3%) | 21 (3.7%) |
Health Insurance Coverage by Citizenship Status in Gallipolis Ferry
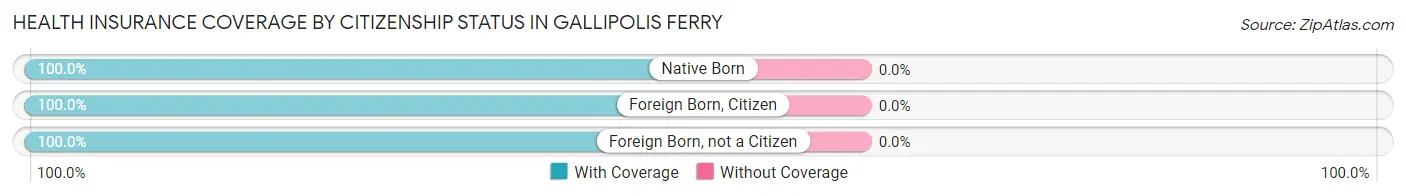
| Citizenship Status | With Coverage | Without Coverage |
| Native Born | 52 (100.0%) | 0 (0.0%) |
| Foreign Born, Citizen | 80 (100.0%) | 0 (0.0%) |
| Foreign Born, not a Citizen | 24 (100.0%) | 0 (0.0%) |
Health Insurance Coverage by Household Income in Gallipolis Ferry
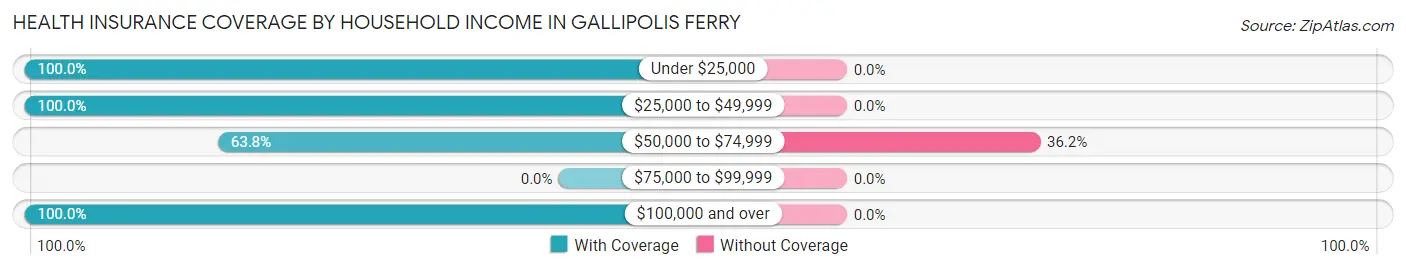
| Household Income | With Coverage | Without Coverage |
| Under $25,000 | 200 (100.0%) | 0 (0.0%) |
| $25,000 to $49,999 | 219 (100.0%) | 0 (0.0%) |
| $50,000 to $74,999 | 37 (63.8%) | 21 (36.2%) |
| $75,000 to $99,999 | 0 (0.0%) | 0 (0.0%) |
| $100,000 and over | 86 (100.0%) | 0 (0.0%) |
Public vs Private Health Insurance Coverage by Age in Gallipolis Ferry
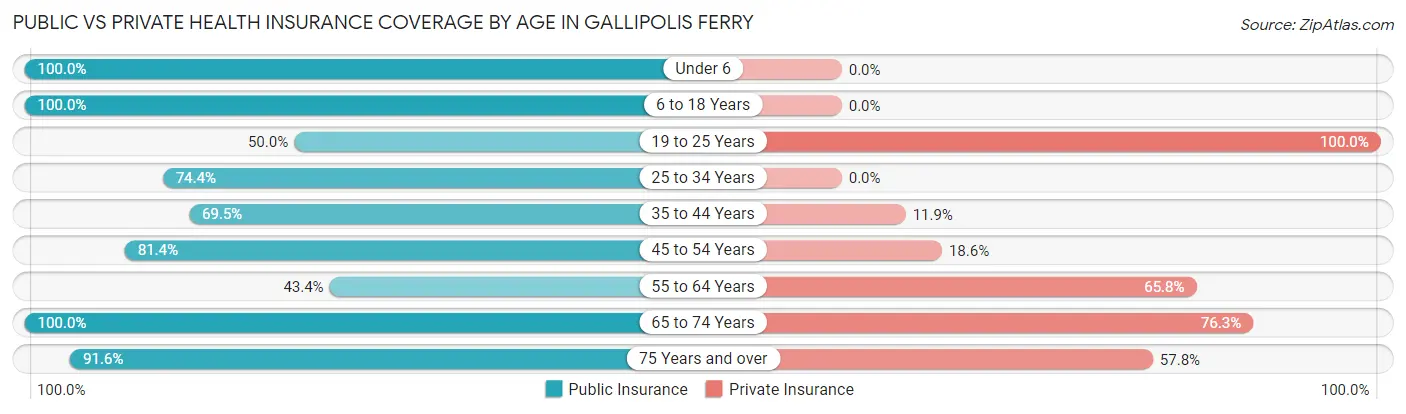
| Age Bracket | Public Insurance | Private Insurance |
| Under 6 | 52 (100.0%) | 0 (0.0%) |
| 6 to 18 Years | 80 (100.0%) | 0 (0.0%) |
| 19 to 25 Years | 12 (50.0%) | 24 (100.0%) |
| 25 to 34 Years | 29 (74.4%) | 0 (0.0%) |
| 35 to 44 Years | 41 (69.5%) | 7 (11.9%) |
| 45 to 54 Years | 70 (81.4%) | 16 (18.6%) |
| 55 to 64 Years | 33 (43.4%) | 50 (65.8%) |
| 65 to 74 Years | 76 (100.0%) | 58 (76.3%) |
| 75 Years and over | 65 (91.5%) | 41 (57.8%) |
| Total | 458 (81.4%) | 196 (34.8%) |
Disability Status by Sex by Age in Gallipolis Ferry
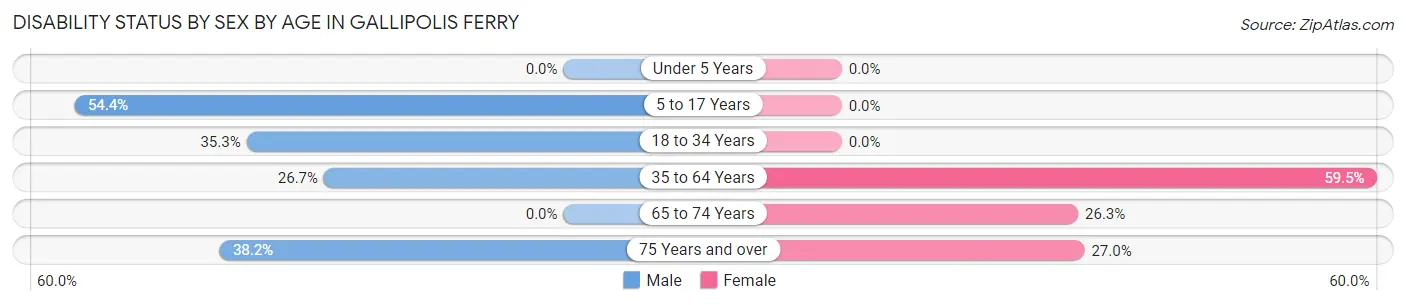
| Age Bracket | Male | Female |
| Under 5 Years | 0 (0.0%) | 0 (0.0%) |
| 5 to 17 Years | 31 (54.4%) | 0 (0.0%) |
| 18 to 34 Years | 12 (35.3%) | 0 (0.0%) |
| 35 to 64 Years | 24 (26.7%) | 78 (59.5%) |
| 65 to 74 Years | 0 (0.0%) | 15 (26.3%) |
| 75 Years and over | 13 (38.2%) | 10 (27.0%) |
Disability Class by Sex by Age in Gallipolis Ferry
Disability Class: Hearing Difficulty
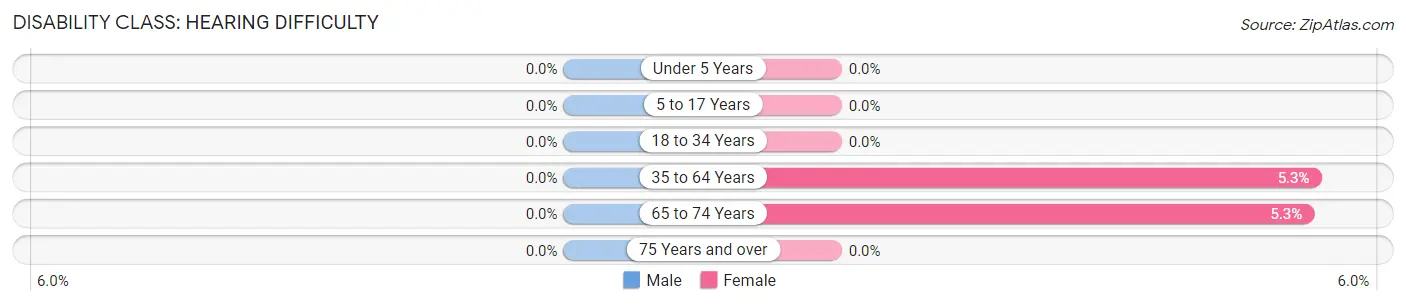
| Age Bracket | Male | Female |
| Under 5 Years | 0 (0.0%) | 0 (0.0%) |
| 5 to 17 Years | 0 (0.0%) | 0 (0.0%) |
| 18 to 34 Years | 0 (0.0%) | 0 (0.0%) |
| 35 to 64 Years | 0 (0.0%) | 7 (5.3%) |
| 65 to 74 Years | 0 (0.0%) | 3 (5.3%) |
| 75 Years and over | 0 (0.0%) | 0 (0.0%) |
Disability Class: Vision Difficulty
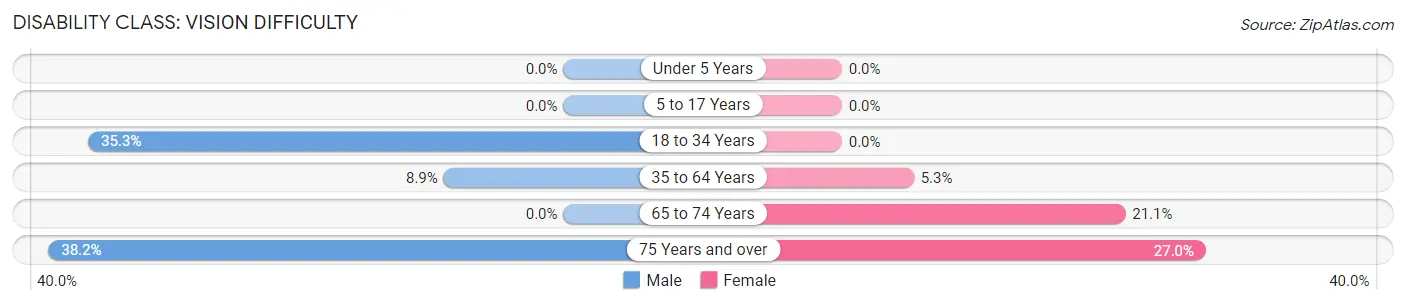
| Age Bracket | Male | Female |
| Under 5 Years | 0 (0.0%) | 0 (0.0%) |
| 5 to 17 Years | 0 (0.0%) | 0 (0.0%) |
| 18 to 34 Years | 12 (35.3%) | 0 (0.0%) |
| 35 to 64 Years | 8 (8.9%) | 7 (5.3%) |
| 65 to 74 Years | 0 (0.0%) | 12 (21.0%) |
| 75 Years and over | 13 (38.2%) | 10 (27.0%) |
Disability Class: Cognitive Difficulty
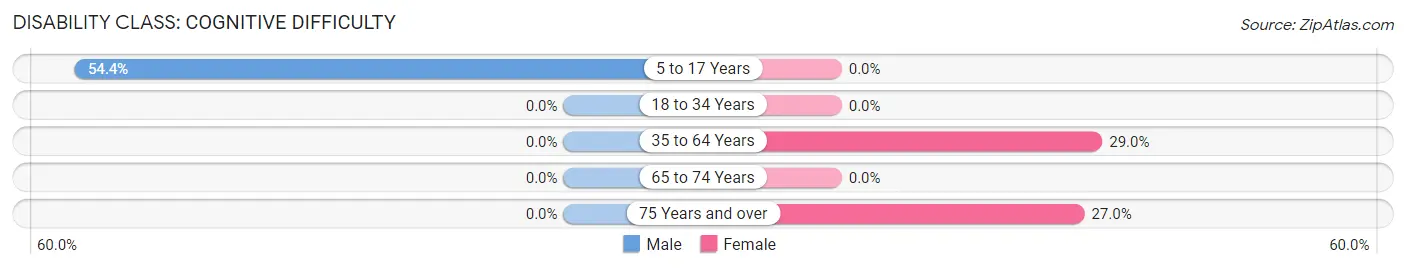
| Age Bracket | Male | Female |
| 5 to 17 Years | 31 (54.4%) | 0 (0.0%) |
| 18 to 34 Years | 0 (0.0%) | 0 (0.0%) |
| 35 to 64 Years | 0 (0.0%) | 38 (29.0%) |
| 65 to 74 Years | 0 (0.0%) | 0 (0.0%) |
| 75 Years and over | 0 (0.0%) | 10 (27.0%) |
Disability Class: Ambulatory Difficulty
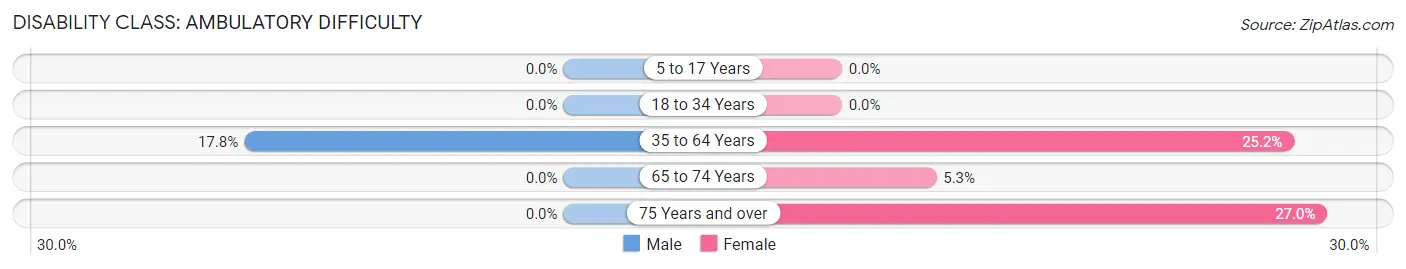
| Age Bracket | Male | Female |
| 5 to 17 Years | 0 (0.0%) | 0 (0.0%) |
| 18 to 34 Years | 0 (0.0%) | 0 (0.0%) |
| 35 to 64 Years | 16 (17.8%) | 33 (25.2%) |
| 65 to 74 Years | 0 (0.0%) | 3 (5.3%) |
| 75 Years and over | 0 (0.0%) | 10 (27.0%) |
Disability Class: Self-Care Difficulty
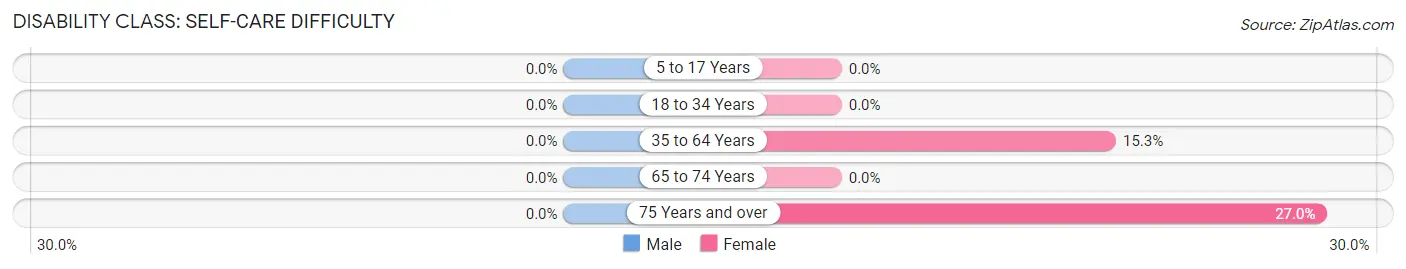
| Age Bracket | Male | Female |
| 5 to 17 Years | 0 (0.0%) | 0 (0.0%) |
| 18 to 34 Years | 0 (0.0%) | 0 (0.0%) |
| 35 to 64 Years | 0 (0.0%) | 20 (15.3%) |
| 65 to 74 Years | 0 (0.0%) | 0 (0.0%) |
| 75 Years and over | 0 (0.0%) | 10 (27.0%) |
Technology Access in Gallipolis Ferry
Computing Device Access in Gallipolis Ferry
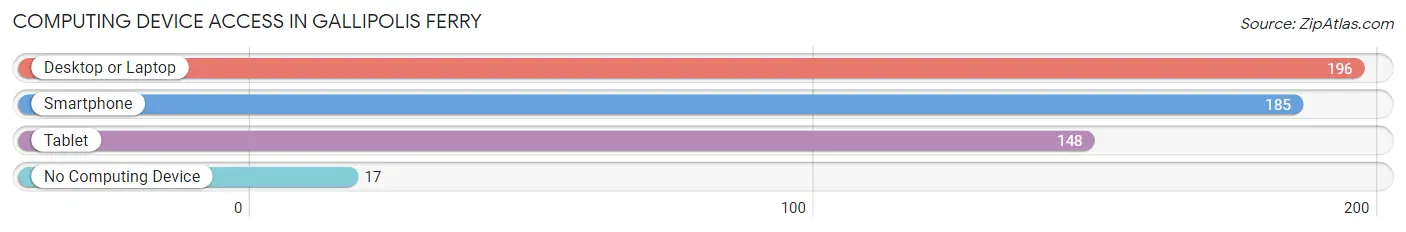
| Device Type | # Households | % Households |
| Desktop or Laptop | 196 | 78.7% |
| Smartphone | 185 | 74.3% |
| Tablet | 148 | 59.4% |
| No Computing Device | 17 | 6.8% |
| Total | 249 | 100.0% |
Internet Access in Gallipolis Ferry
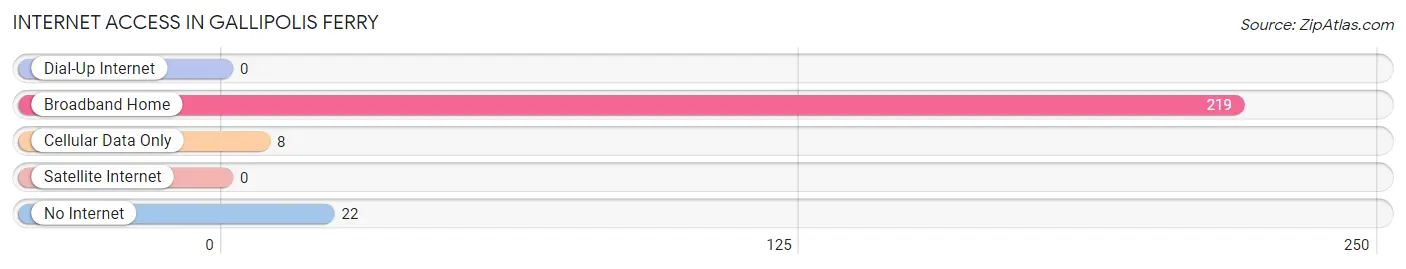
| Internet Type | # Households | % Households |
| Dial-Up Internet | 0 | 0.0% |
| Broadband Home | 219 | 87.9% |
| Cellular Data Only | 8 | 3.2% |
| Satellite Internet | 0 | 0.0% |
| No Internet | 22 | 8.8% |
| Total | 249 | 100.0% |
Gallipolis Ferry Summary
Gallipolis Ferry is a small unincorporated community located in Mason County, West Virginia. It is situated on the Ohio River, just across from the city of Gallipolis, Ohio. The community is part of the Point Pleasant Micropolitan Statistical Area and has a population of approximately 1,000 people.
History
Gallipolis Ferry was first settled in the late 1700s by French settlers who had come to the area to establish a trading post. The settlement was originally known as “Gallipolis”, after the French word for “city of the Gauls”. The settlement was later renamed “Gallipolis Ferry” after the ferry that was used to cross the Ohio River between the two towns.
The community was officially incorporated in 1848 and was home to a variety of businesses, including a sawmill, a gristmill, a blacksmith shop, and a general store. The town also had a post office, a school, and a church.
In the late 1800s, the town began to decline as the railroad bypassed it and the ferry service was discontinued. The town was eventually abandoned in the early 1900s.
Geography
Gallipolis Ferry is located in Mason County, West Virginia, on the Ohio River. It is situated just across from the city of Gallipolis, Ohio. The community is part of the Point Pleasant Micropolitan Statistical Area and has a population of approximately 1,000 people.
The town is located in a rural area and is surrounded by rolling hills and farmland. The nearest major city is Charleston, which is located about 40 miles to the south.
Economy
The economy of Gallipolis Ferry is largely based on agriculture and tourism. The town is home to several small farms, which produce a variety of crops, including corn, soybeans, and hay. The town also has several small businesses, including a general store, a gas station, and a restaurant.
The town is also a popular tourist destination, as it is located on the Ohio River and is close to several state parks and recreational areas. The town is also home to several historic sites, including the Gallipolis Ferry Bridge, which was built in 1848 and is the oldest bridge in West Virginia.
Demographics
As of the 2010 census, the population of Gallipolis Ferry was 1,000 people. The racial makeup of the town was 97.2% White, 0.7% African American, 0.2% Native American, 0.2% Asian, 0.1% Pacific Islander, 0.2% from other races, and 1.0% from two or more races. Hispanic or Latino of any race were 0.7% of the population.
The median household income in Gallipolis Ferry was $37,500, and the median family income was $41,250. The per capita income for the town was $17,857. About 11.2% of families and 13.2% of the population were below the poverty line, including 17.2% of those under age 18 and 8.3% of those age 65 or over.
Common Questions
What is Per Capita Income in Gallipolis Ferry?
Per Capita income in Gallipolis Ferry is $17,931.
What is the Median Family Income in Gallipolis Ferry?
Median Family Income in Gallipolis Ferry is $44,250.
What is the Median Household income in Gallipolis Ferry?
Median Household Income in Gallipolis Ferry is $26,875.
What is Inequality or Gini Index in Gallipolis Ferry?
Inequality or Gini Index in Gallipolis Ferry is 0.51.
What is the Total Population of Gallipolis Ferry?
Total Population of Gallipolis Ferry is 563.
What is the Total Male Population of Gallipolis Ferry?
Total Male Population of Gallipolis Ferry is 286.
What is the Total Female Population of Gallipolis Ferry?
Total Female Population of Gallipolis Ferry is 277.
What is the Ratio of Males per 100 Females in Gallipolis Ferry?
There are 103.25 Males per 100 Females in Gallipolis Ferry.
What is the Ratio of Females per 100 Males in Gallipolis Ferry?
There are 96.85 Females per 100 Males in Gallipolis Ferry.
What is the Median Population Age in Gallipolis Ferry?
Median Population Age in Gallipolis Ferry is 49.0 Years.
What is the Average Family Size in Gallipolis Ferry
Average Family Size in Gallipolis Ferry is 3.0 People.
What is the Average Household Size in Gallipolis Ferry
Average Household Size in Gallipolis Ferry is 2.3 People.
How Large is the Labor Force in Gallipolis Ferry?
There are 97 People in the Labor Forcein in Gallipolis Ferry.
What is the Percentage of People in the Labor Force in Gallipolis Ferry?
22.5% of People are in the Labor Force in Gallipolis Ferry.
What is the Unemployment Rate in Gallipolis Ferry?
Unemployment Rate in Gallipolis Ferry is 11.3%.