Falling Spring, WV Map & Demographics
Falling Spring Map
Falling Spring Overview
$32,569
PER CAPITA INCOME
$47,500
AVG FAMILY INCOME
$42,321
AVG HOUSEHOLD INCOME
48.9%
WAGE / INCOME GAP [ % ]
51.1¢/ $1
WAGE / INCOME GAP [ $ ]
0.43
INEQUALITY / GINI INDEX
124
TOTAL POPULATION
55
MALE POPULATION
69
FEMALE POPULATION
79.71
MALES / 100 FEMALES
125.45
FEMALES / 100 MALES
56.3
MEDIAN AGE
2.6
AVG FAMILY SIZE
2.2
AVG HOUSEHOLD SIZE
60
LABOR FORCE [ PEOPLE ]
55.0%
PERCENT IN LABOR FORCE
Income in Falling Spring
Income Overview in Falling Spring
Per Capita Income in Falling Spring is $32,569, while median incomes of families and households are $47,500 and $42,321 respectively.
| Characteristic | Number | Measure |
| Per Capita Income | 124 | $32,569 |
| Median Family Income | 42 | $47,500 |
| Mean Family Income | 42 | $80,924 |
| Median Household Income | 57 | $42,321 |
| Mean Household Income | 57 | $69,021 |
| Income Deficit | 42 | $0 |
| Wage / Income Gap (%) | 124 | 48.89% |
| Wage / Income Gap ($) | 124 | 51.11¢ per $1 |
| Gini / Inequality Index | 124 | 0.43 |
Earnings by Sex in Falling Spring
Average Earnings in Falling Spring are $37,500, $42,188 for men and $21,563 for women, a difference of 48.9%.
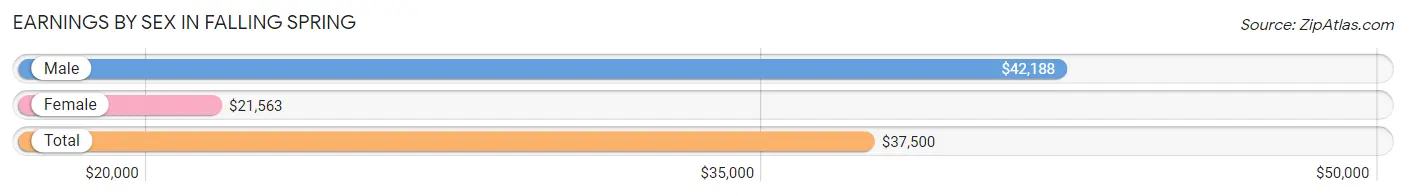
| Sex | Number | Average Earnings |
| Male | 27 (43.5%) | $42,188 |
| Female | 35 (56.5%) | $21,563 |
| Total | 62 (100.0%) | $37,500 |
Earnings by Sex by Income Bracket in Falling Spring
The most common earnings brackets in Falling Spring are $55,000 to $64,999 for men (7 | 25.9%) and $100,000+ for women (5 | 14.3%).
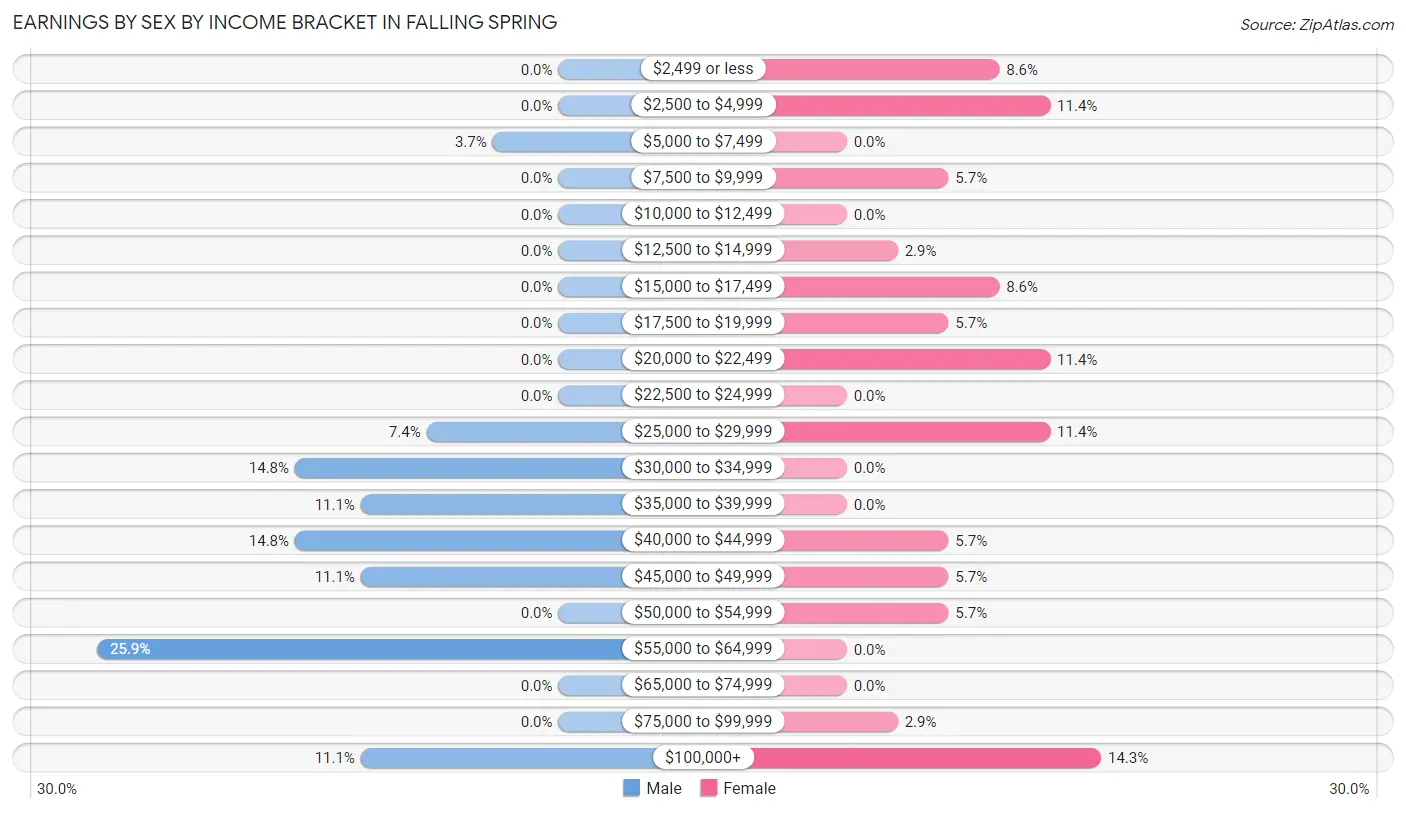
| Income | Male | Female |
| $2,499 or less | 0 (0.0%) | 3 (8.6%) |
| $2,500 to $4,999 | 0 (0.0%) | 4 (11.4%) |
| $5,000 to $7,499 | 1 (3.7%) | 0 (0.0%) |
| $7,500 to $9,999 | 0 (0.0%) | 2 (5.7%) |
| $10,000 to $12,499 | 0 (0.0%) | 0 (0.0%) |
| $12,500 to $14,999 | 0 (0.0%) | 1 (2.9%) |
| $15,000 to $17,499 | 0 (0.0%) | 3 (8.6%) |
| $17,500 to $19,999 | 0 (0.0%) | 2 (5.7%) |
| $20,000 to $22,499 | 0 (0.0%) | 4 (11.4%) |
| $22,500 to $24,999 | 0 (0.0%) | 0 (0.0%) |
| $25,000 to $29,999 | 2 (7.4%) | 4 (11.4%) |
| $30,000 to $34,999 | 4 (14.8%) | 0 (0.0%) |
| $35,000 to $39,999 | 3 (11.1%) | 0 (0.0%) |
| $40,000 to $44,999 | 4 (14.8%) | 2 (5.7%) |
| $45,000 to $49,999 | 3 (11.1%) | 2 (5.7%) |
| $50,000 to $54,999 | 0 (0.0%) | 2 (5.7%) |
| $55,000 to $64,999 | 7 (25.9%) | 0 (0.0%) |
| $65,000 to $74,999 | 0 (0.0%) | 0 (0.0%) |
| $75,000 to $99,999 | 0 (0.0%) | 1 (2.9%) |
| $100,000+ | 3 (11.1%) | 5 (14.3%) |
| Total | 27 (100.0%) | 35 (100.0%) |
Earnings by Sex by Educational Attainment in Falling Spring
Average earnings in Falling Spring are $42,188 for men and $27,500 for women, a difference of 34.8%. Men with an educational attainment of high school diploma enjoy the highest average annual earnings of $43,750, while those with high school diploma education earn the least with $43,750. Women with an educational attainment of college or associate's degree earn the most with the average annual earnings of $27,500, while those with college or associate's degree education have the smallest earnings of $27,500.
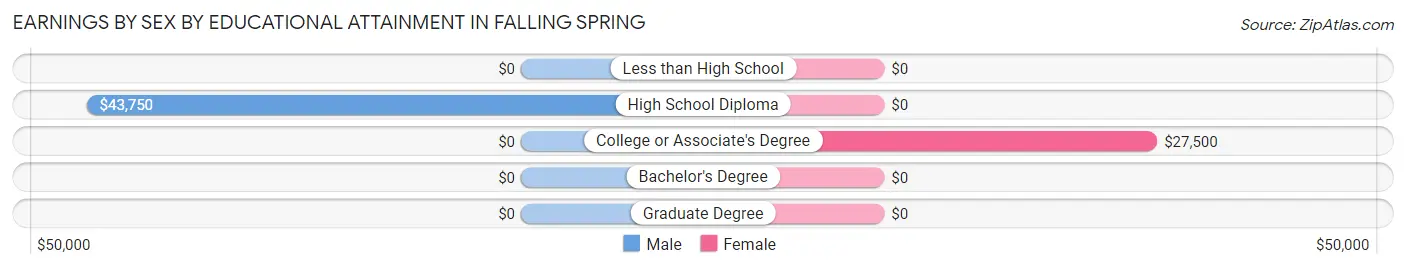
| Educational Attainment | Male Income | Female Income |
| Less than High School | - | - |
| High School Diploma | $43,750 | $0 |
| College or Associate's Degree | - | - |
| Bachelor's Degree | - | - |
| Graduate Degree | - | - |
| Total | $42,188 | $27,500 |
Family Income in Falling Spring
Family Income Brackets in Falling Spring
According to the Falling Spring family income data, there are 16 families falling into the $35,000 to $49,999 income range, which is the most common income bracket and makes up 38.1% of all families.
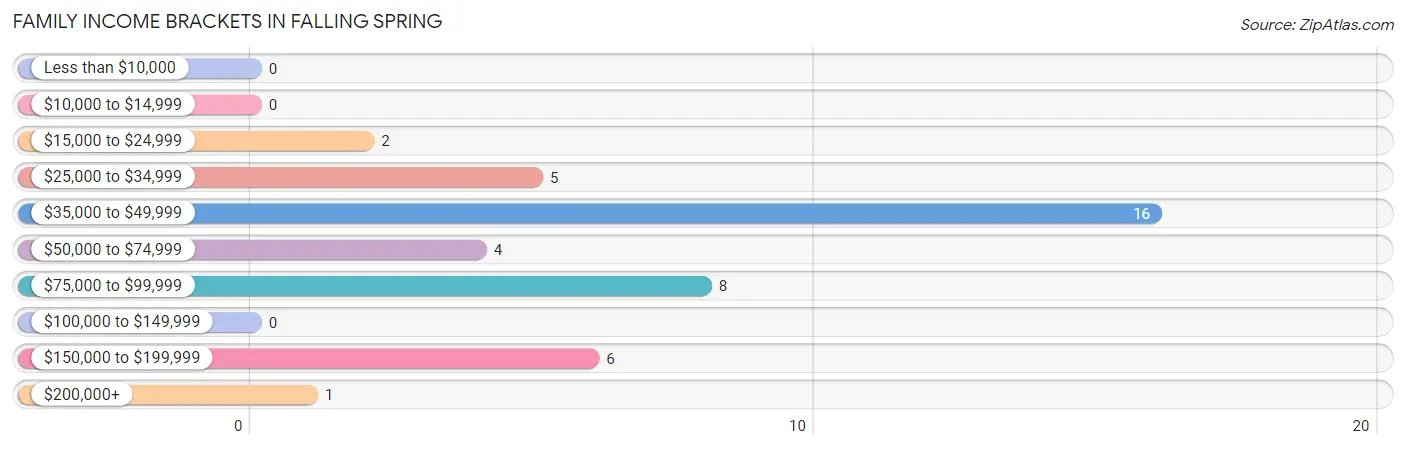
| Income Bracket | # Families | % Families |
| Less than $10,000 | 0 | 0.0% |
| $10,000 to $14,999 | 0 | 0.0% |
| $15,000 to $24,999 | 2 | 4.8% |
| $25,000 to $34,999 | 5 | 11.9% |
| $35,000 to $49,999 | 16 | 38.1% |
| $50,000 to $74,999 | 4 | 9.5% |
| $75,000 to $99,999 | 8 | 19.0% |
| $100,000 to $149,999 | 0 | 0.0% |
| $150,000 to $199,999 | 6 | 14.3% |
| $200,000+ | 1 | 2.4% |
Family Income by Famaliy Size in Falling Spring
4-person families (8 | 19.1%) account for the highest median family income in Falling Spring with $173,500 per family, while 4-person families (8 | 19.1%) have the highest median income of $43,375 per family member.
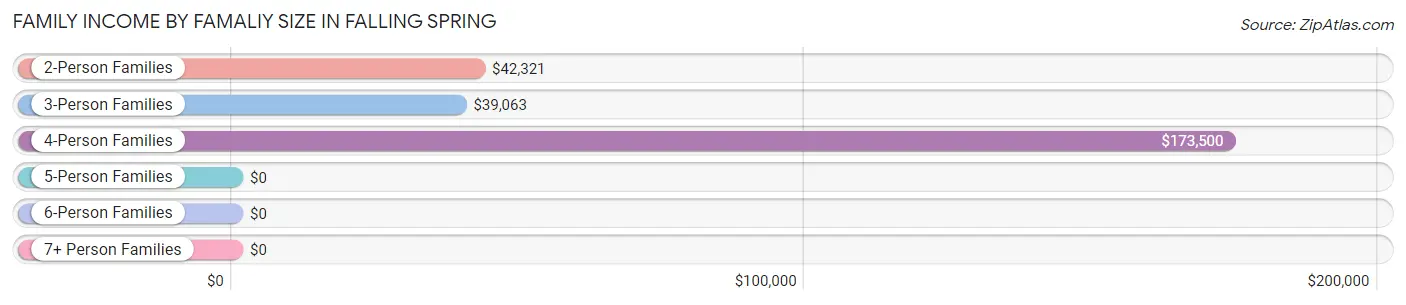
| Income Bracket | # Families | Median Income |
| 2-Person Families | 25 (59.5%) | $42,321 |
| 3-Person Families | 9 (21.4%) | $39,063 |
| 4-Person Families | 8 (19.1%) | $173,500 |
| 5-Person Families | 0 (0.0%) | $0 |
| 6-Person Families | 0 (0.0%) | $0 |
| 7+ Person Families | 0 (0.0%) | $0 |
| Total | 42 (100.0%) | $47,500 |
Family Income by Number of Earners in Falling Spring
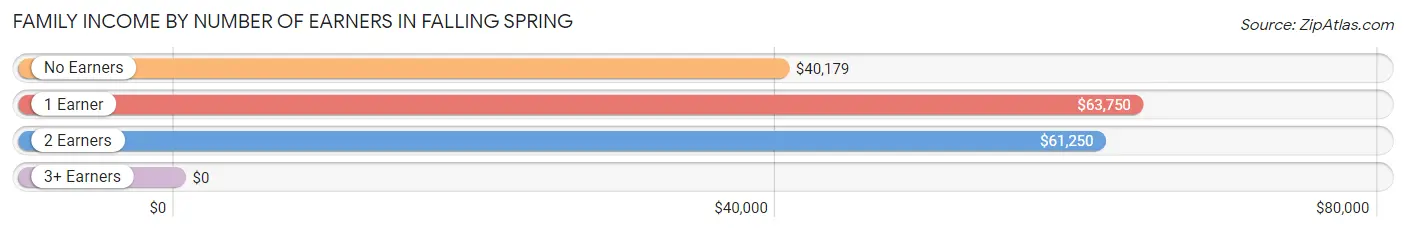
| Number of Earners | # Families | Median Income |
| No Earners | 13 (30.9%) | $40,179 |
| 1 Earner | 10 (23.8%) | $63,750 |
| 2 Earners | 13 (30.9%) | $61,250 |
| 3+ Earners | 6 (14.3%) | $0 |
| Total | 42 (100.0%) | $47,500 |
Household Income in Falling Spring
Household Income Brackets in Falling Spring
With 18 households falling in the category, the $35,000 to $49,999 income range is the most frequent in Falling Spring, accounting for 31.6% of all households.
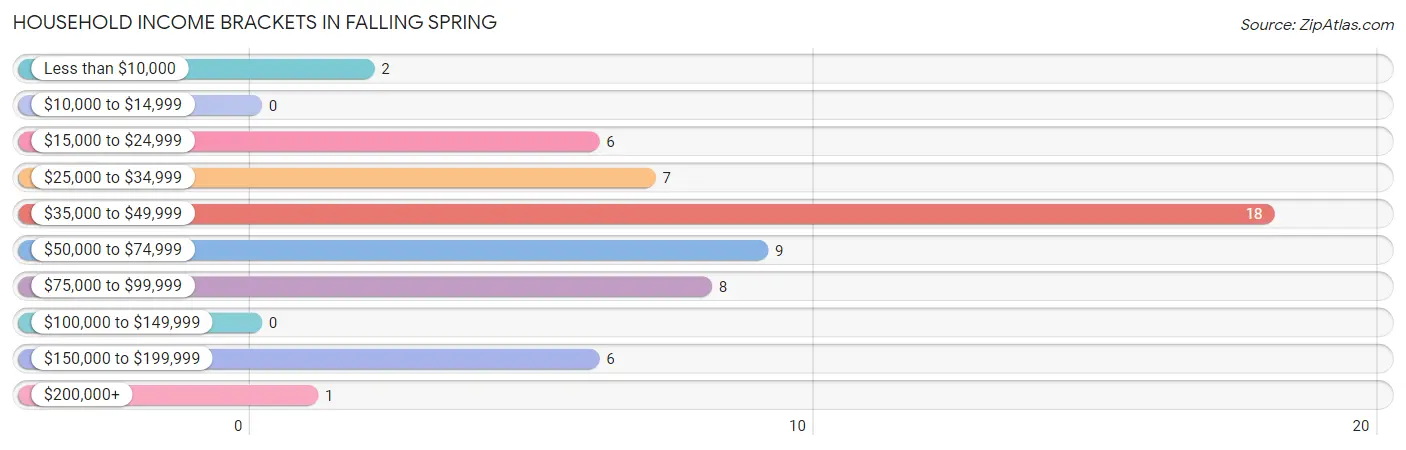
| Income Bracket | # Households | % Households |
| Less than $10,000 | 2 | 3.5% |
| $10,000 to $14,999 | 0 | 0.0% |
| $15,000 to $24,999 | 6 | 10.5% |
| $25,000 to $34,999 | 7 | 12.3% |
| $35,000 to $49,999 | 18 | 31.6% |
| $50,000 to $74,999 | 9 | 15.8% |
| $75,000 to $99,999 | 8 | 14.0% |
| $100,000 to $149,999 | 0 | 0.0% |
| $150,000 to $199,999 | 6 | 10.5% |
| $200,000+ | 1 | 1.8% |
Household Income by Householder Age in Falling Spring
The median household income in Falling Spring is $42,321, with the highest median household income of $45,625 found in the 45 to 64 years age bracket for the primary householder. A total of 39 households (68.4%) fall into this category.
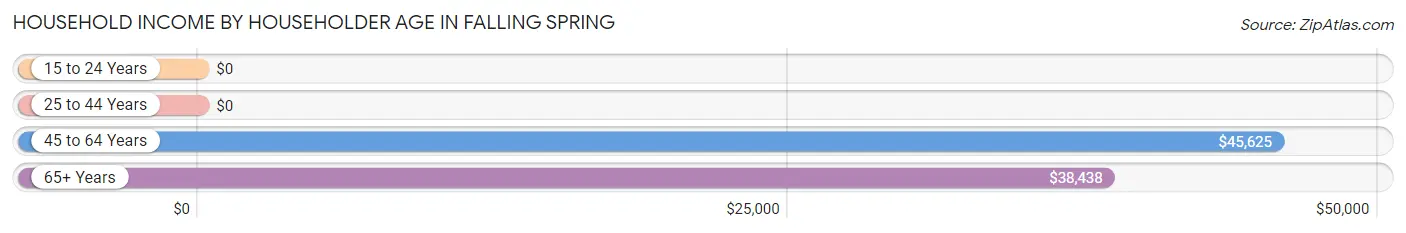
| Income Bracket | # Households | Median Income |
| 15 to 24 Years | 0 (0.0%) | $0 |
| 25 to 44 Years | 3 (5.3%) | $0 |
| 45 to 64 Years | 39 (68.4%) | $45,625 |
| 65+ Years | 15 (26.3%) | $38,438 |
| Total | 57 (100.0%) | $42,321 |
Poverty in Falling Spring
Income Below Poverty by Sex and Age in Falling Spring
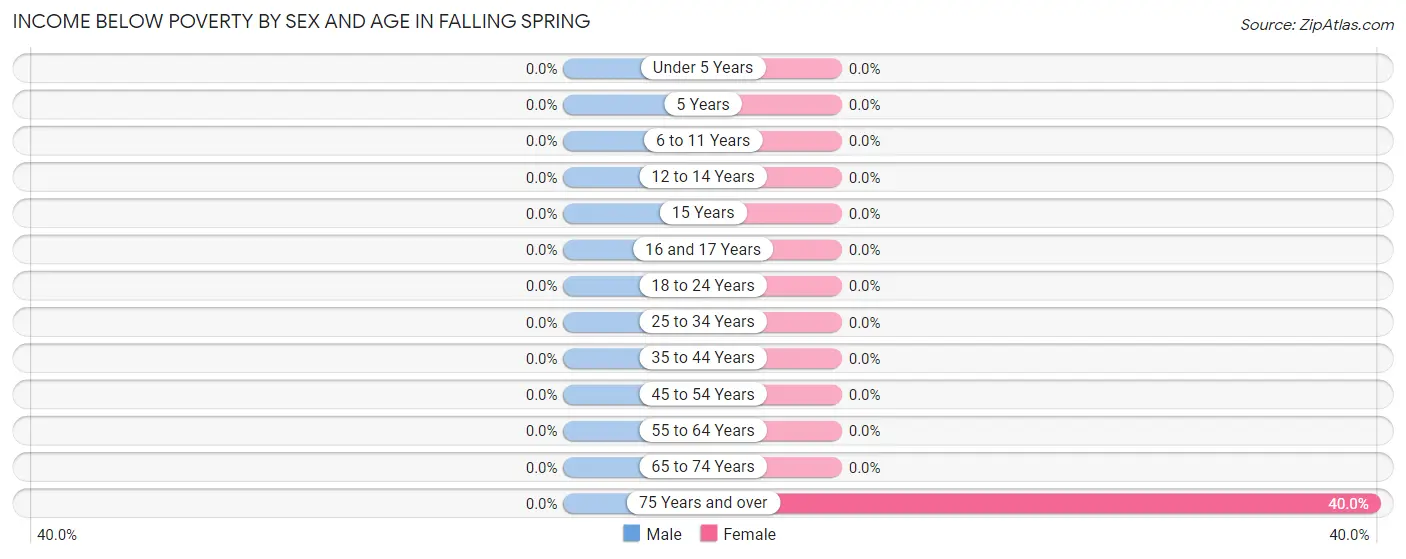
| Age Bracket | Male | Female |
| Under 5 Years | 0 (0.0%) | 0 (0.0%) |
| 5 Years | 0 (0.0%) | 0 (0.0%) |
| 6 to 11 Years | 0 (0.0%) | 0 (0.0%) |
| 12 to 14 Years | 0 (0.0%) | 0 (0.0%) |
| 15 Years | 0 (0.0%) | 0 (0.0%) |
| 16 and 17 Years | 0 (0.0%) | 0 (0.0%) |
| 18 to 24 Years | 0 (0.0%) | 0 (0.0%) |
| 25 to 34 Years | 0 (0.0%) | 0 (0.0%) |
| 35 to 44 Years | 0 (0.0%) | 0 (0.0%) |
| 45 to 54 Years | 0 (0.0%) | 0 (0.0%) |
| 55 to 64 Years | 0 (0.0%) | 0 (0.0%) |
| 65 to 74 Years | 0 (0.0%) | 0 (0.0%) |
| 75 Years and over | 0 (0.0%) | 2 (40.0%) |
| Total | 0 (0.0%) | 2 (2.9%) |
Income Above Poverty by Sex and Age in Falling Spring
According to the poverty statistics in Falling Spring, males aged under 5 years and females aged under 5 years are the age groups that are most secure financially, with 100.0% of males and 100.0% of females in these age groups living above the poverty line.
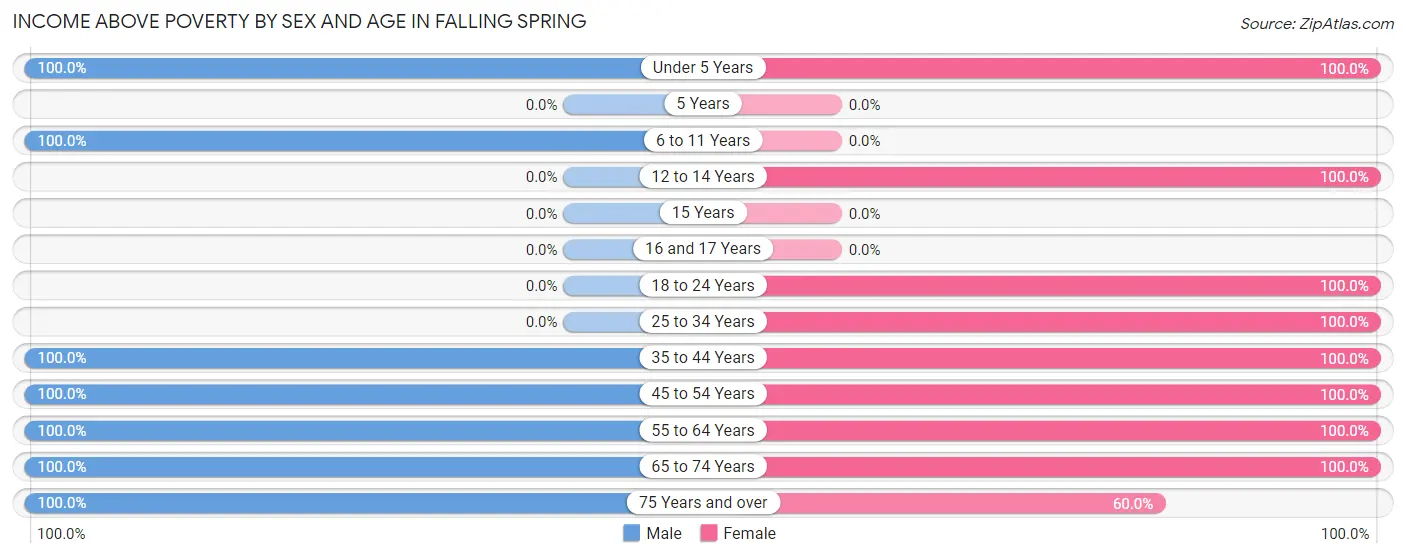
| Age Bracket | Male | Female |
| Under 5 Years | 2 (100.0%) | 2 (100.0%) |
| 5 Years | 0 (0.0%) | 0 (0.0%) |
| 6 to 11 Years | 7 (100.0%) | 0 (0.0%) |
| 12 to 14 Years | 0 (0.0%) | 4 (100.0%) |
| 15 Years | 0 (0.0%) | 0 (0.0%) |
| 16 and 17 Years | 0 (0.0%) | 0 (0.0%) |
| 18 to 24 Years | 0 (0.0%) | 7 (100.0%) |
| 25 to 34 Years | 0 (0.0%) | 2 (100.0%) |
| 35 to 44 Years | 5 (100.0%) | 1 (100.0%) |
| 45 to 54 Years | 12 (100.0%) | 17 (100.0%) |
| 55 to 64 Years | 20 (100.0%) | 19 (100.0%) |
| 65 to 74 Years | 7 (100.0%) | 12 (100.0%) |
| 75 Years and over | 2 (100.0%) | 3 (60.0%) |
| Total | 55 (100.0%) | 67 (97.1%) |
Income Below Poverty Among Married-Couple Families in Falling Spring
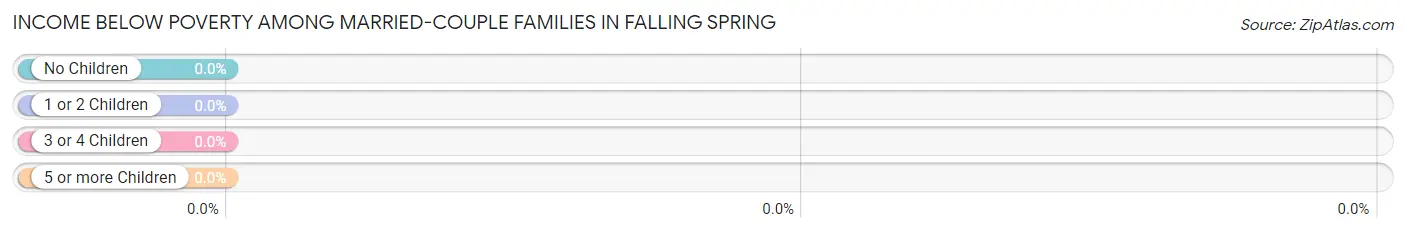
| Children | Above Poverty | Below Poverty |
| No Children | 31 (100.0%) | 0 (0.0%) |
| 1 or 2 Children | 10 (100.0%) | 0 (0.0%) |
| 3 or 4 Children | 0 (0.0%) | 0 (0.0%) |
| 5 or more Children | 0 (0.0%) | 0 (0.0%) |
| Total | 41 (100.0%) | 0 (0.0%) |
Income Below Poverty Among Single-Parent Households in Falling Spring
| Children | Single Father | Single Mother |
| No Children | 0 (0.0%) | 0 (0.0%) |
| 1 or 2 Children | 0 (0.0%) | 0 (0.0%) |
| 3 or 4 Children | 0 (0.0%) | 0 (0.0%) |
| 5 or more Children | 0 (0.0%) | 0 (0.0%) |
| Total | 0 (0.0%) | 0 (0.0%) |
Income Below Poverty Among Married-Couple vs Single-Parent Households in Falling Spring
| Children | Married-Couple Families | Single-Parent Households |
| No Children | 0 (0.0%) | 0 (0.0%) |
| 1 or 2 Children | 0 (0.0%) | 0 (0.0%) |
| 3 or 4 Children | 0 (0.0%) | 0 (0.0%) |
| 5 or more Children | 0 (0.0%) | 0 (0.0%) |
| Total | 0 (0.0%) | 0 (0.0%) |
Race in Falling Spring
The most populous races in Falling Spring are , and White / Caucasian (124 | 100.0%).
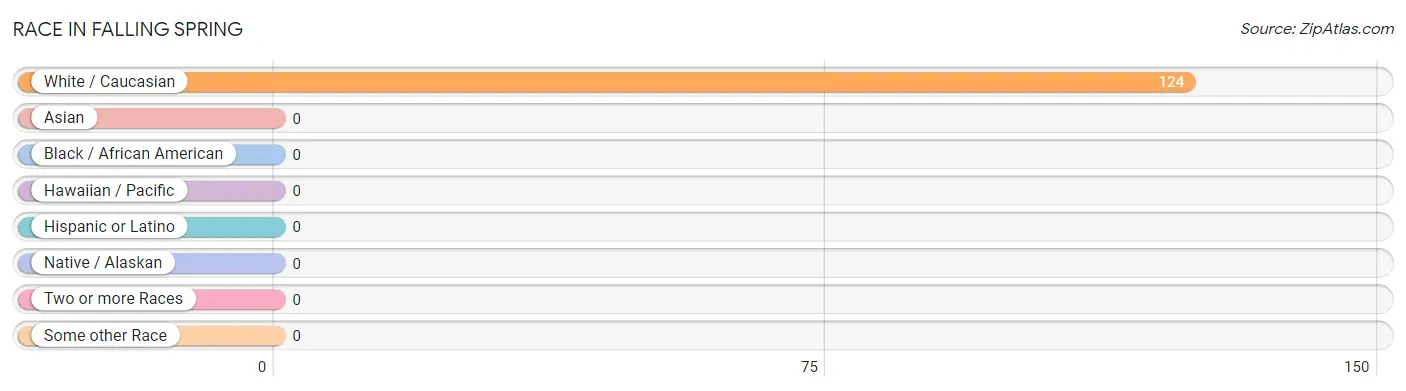
| Race | # Population | % Population |
| Asian | 0 | 0.0% |
| Black / African American | 0 | 0.0% |
| Hawaiian / Pacific | 0 | 0.0% |
| Hispanic or Latino | 0 | 0.0% |
| Native / Alaskan | 0 | 0.0% |
| White / Caucasian | 124 | 100.0% |
| Two or more Races | 0 | 0.0% |
| Some other Race | 0 | 0.0% |
| Total | 124 | 100.0% |
Ancestry in Falling Spring
The most populous ancestries reported in Falling Spring are American (29 | 23.4%), Irish (23 | 18.5%), Scotch-Irish (19 | 15.3%), German (13 | 10.5%), and English (11 | 8.9%), together accounting for 76.6% of all Falling Spring residents.
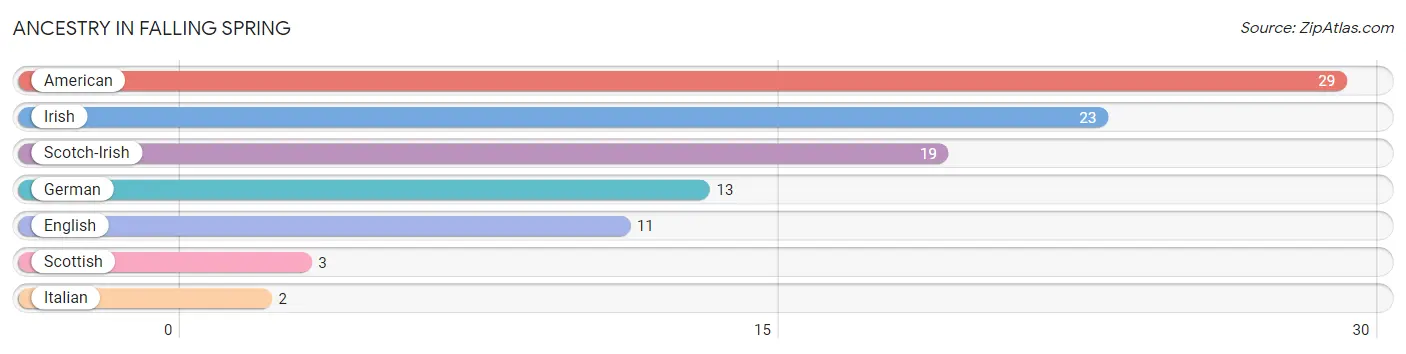
| Ancestry | # Population | % Population |
| American | 29 | 23.4% |
| English | 11 | 8.9% |
| German | 13 | 10.5% |
| Irish | 23 | 18.5% |
| Italian | 2 | 1.6% |
| Scotch-Irish | 19 | 15.3% |
| Scottish | 3 | 2.4% | View All 7 Rows |
Immigrants in Falling Spring

| Immigration Origin | # Population | % Population | View All 0 Rows |
Sex and Age in Falling Spring
Sex and Age in Falling Spring
The most populous age groups in Falling Spring are 60 to 64 Years (18 | 32.7%) for men and 55 to 59 Years (12 | 17.4%) for women.
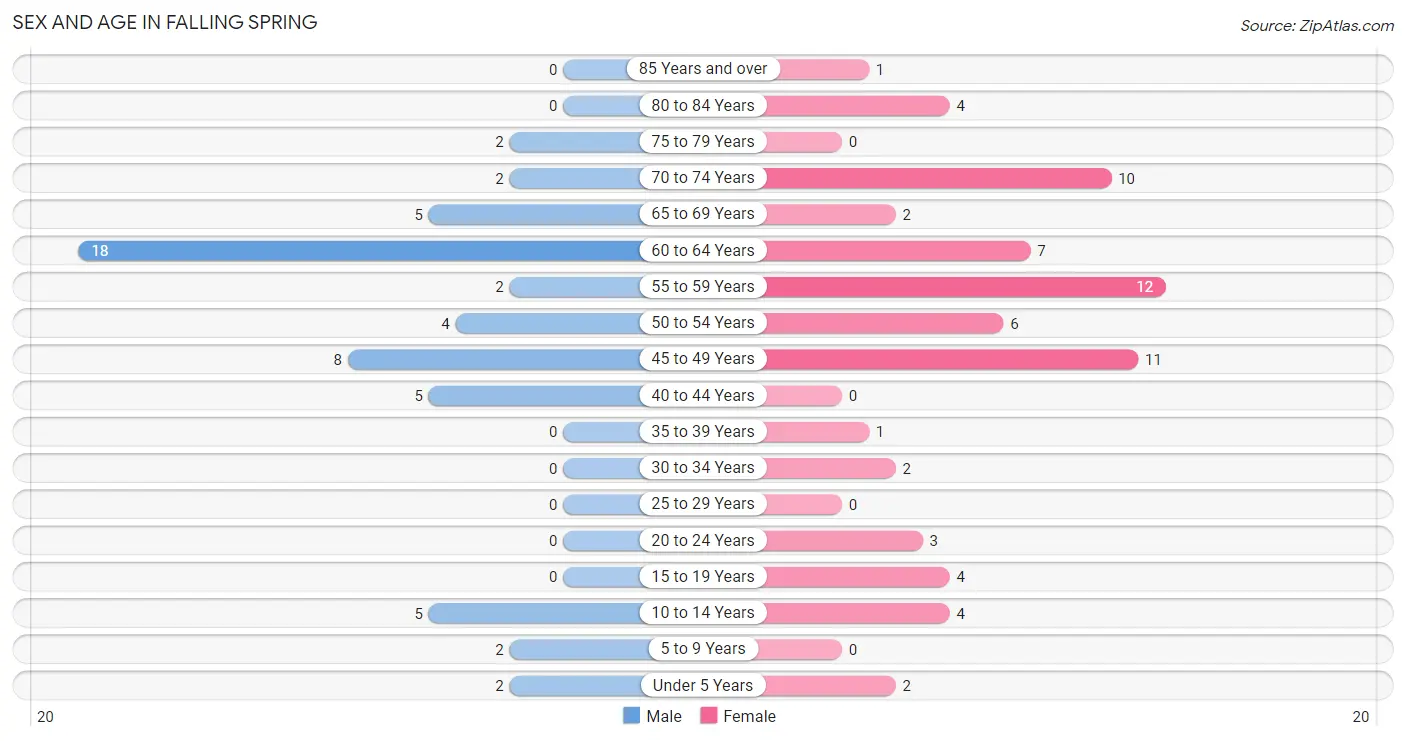
| Age Bracket | Male | Female |
| Under 5 Years | 2 (3.6%) | 2 (2.9%) |
| 5 to 9 Years | 2 (3.6%) | 0 (0.0%) |
| 10 to 14 Years | 5 (9.1%) | 4 (5.8%) |
| 15 to 19 Years | 0 (0.0%) | 4 (5.8%) |
| 20 to 24 Years | 0 (0.0%) | 3 (4.3%) |
| 25 to 29 Years | 0 (0.0%) | 0 (0.0%) |
| 30 to 34 Years | 0 (0.0%) | 2 (2.9%) |
| 35 to 39 Years | 0 (0.0%) | 1 (1.5%) |
| 40 to 44 Years | 5 (9.1%) | 0 (0.0%) |
| 45 to 49 Years | 8 (14.5%) | 11 (15.9%) |
| 50 to 54 Years | 4 (7.3%) | 6 (8.7%) |
| 55 to 59 Years | 2 (3.6%) | 12 (17.4%) |
| 60 to 64 Years | 18 (32.7%) | 7 (10.1%) |
| 65 to 69 Years | 5 (9.1%) | 2 (2.9%) |
| 70 to 74 Years | 2 (3.6%) | 10 (14.5%) |
| 75 to 79 Years | 2 (3.6%) | 0 (0.0%) |
| 80 to 84 Years | 0 (0.0%) | 4 (5.8%) |
| 85 Years and over | 0 (0.0%) | 1 (1.5%) |
| Total | 55 (100.0%) | 69 (100.0%) |
Families and Households in Falling Spring
Median Family Size in Falling Spring
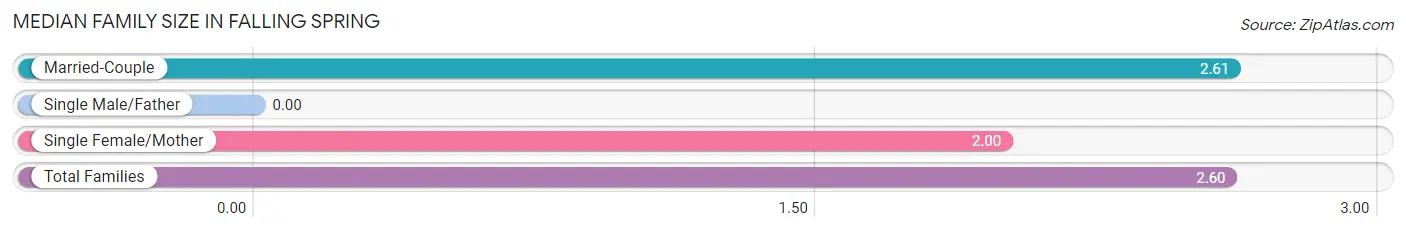
| Family Type | # Families | Family Size |
| Married-Couple | 41 (97.6%) | 2.61 |
| Single Male/Father | 0 (0.0%) | - |
| Single Female/Mother | 1 (2.4%) | 2.00 |
| Total Families | 42 (100.0%) | 2.60 |
Median Household Size in Falling Spring
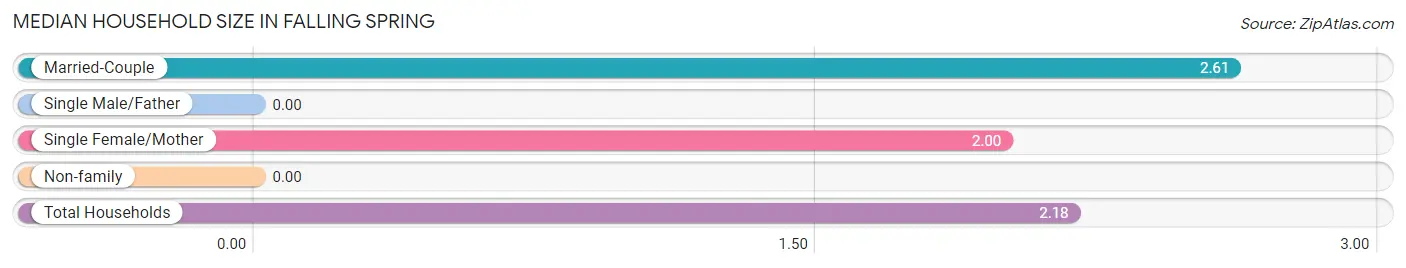
| Household Type | # Households | Household Size |
| Married-Couple | 41 (71.9%) | 2.61 |
| Single Male/Father | 0 (0.0%) | - |
| Single Female/Mother | 1 (1.8%) | 2.00 |
| Non-family | 15 (26.3%) | - |
| Total Households | 57 (100.0%) | 2.18 |
Household Size by Marriage Status in Falling Spring
Out of a total of 57 households in Falling Spring, 42 (73.7%) are family households, while 15 (26.3%) are nonfamily households. The most numerous type of family households are 2-person households, comprising 25, and the most common type of nonfamily households are 1-person households, comprising 15.
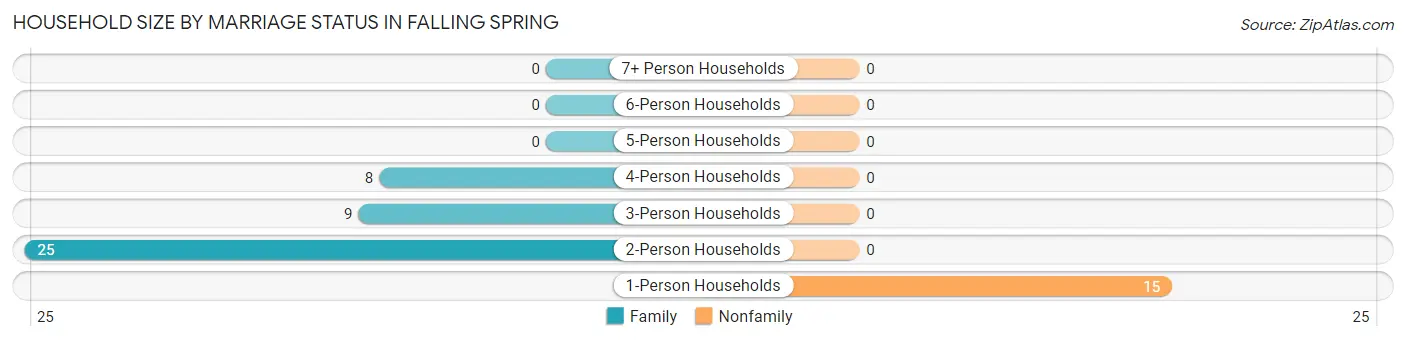
| Household Size | Family Households | Nonfamily Households |
| 1-Person Households | - | 15 (26.3%) |
| 2-Person Households | 25 (43.9%) | 0 (0.0%) |
| 3-Person Households | 9 (15.8%) | 0 (0.0%) |
| 4-Person Households | 8 (14.0%) | 0 (0.0%) |
| 5-Person Households | 0 (0.0%) | 0 (0.0%) |
| 6-Person Households | 0 (0.0%) | 0 (0.0%) |
| 7+ Person Households | 0 (0.0%) | 0 (0.0%) |
| Total | 42 (73.7%) | 15 (26.3%) |
Female Fertility in Falling Spring
Fertility by Age in Falling Spring
| Age Bracket | Women with Births | Births / 1,000 Women |
| 15 to 19 years | 0 (0.0%) | 0.0 |
| 20 to 34 years | 0 (0.0%) | 0.0 |
| 35 to 50 years | 0 (0.0%) | 0.0 |
| Total | 0 (0.0%) | 0.0 |
Fertility by Age by Marriage Status in Falling Spring
| Age Bracket | Married | Unmarried |
| 15 to 19 years | 0 (0.0%) | 0 (0.0%) |
| 20 to 34 years | 0 (0.0%) | 0 (0.0%) |
| 35 to 50 years | 0 (0.0%) | 0 (0.0%) |
| Total | 0 (0.0%) | 0 (0.0%) |
Fertility by Education in Falling Spring
| Educational Attainment | Women with Births | Births / 1,000 Women |
| Less than High School | 0 (0.0%) | 0.0 |
| High School Diploma | 0 (0.0%) | 0.0 |
| College or Associate's Degree | 0 (0.0%) | 0.0 |
| Bachelor's Degree | 0 (0.0%) | 0.0 |
| Graduate Degree | 0 (0.0%) | 0.0 |
| Total | 0 (0.0%) | 0.0 |
Fertility by Education by Marriage Status in Falling Spring
| Educational Attainment | Married | Unmarried |
| Less than High School | 0 (0.0%) | 0 (0.0%) |
| High School Diploma | 0 (0.0%) | 0 (0.0%) |
| College or Associate's Degree | 0 (0.0%) | 0 (0.0%) |
| Bachelor's Degree | 0 (0.0%) | 0 (0.0%) |
| Graduate Degree | 0 (0.0%) | 0 (0.0%) |
| Total | 0 (0.0%) | 0 (0.0%) |
Employment Characteristics in Falling Spring
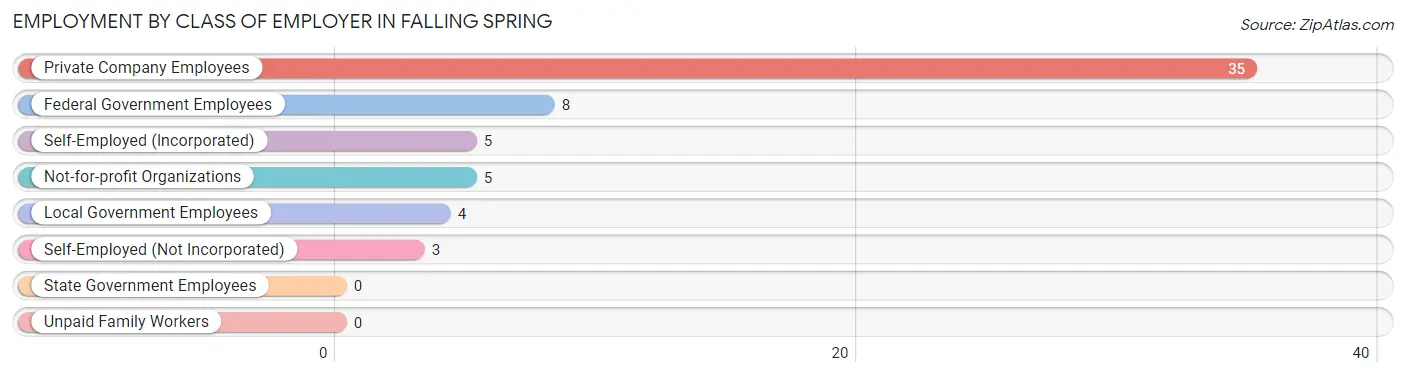
Employment by Class of Employer in Falling Spring
Among the 60 employed individuals in Falling Spring, private company employees (35 | 58.3%), federal government employees (8 | 13.3%), and self-employed (incorporated) (5 | 8.3%) make up the most common classes of employment.
| Employer Class | # Employees | % Employees |
| Private Company Employees | 35 | 58.3% |
| Self-Employed (Incorporated) | 5 | 8.3% |
| Self-Employed (Not Incorporated) | 3 | 5.0% |
| Not-for-profit Organizations | 5 | 8.3% |
| Local Government Employees | 4 | 6.7% |
| State Government Employees | 0 | 0.0% |
| Federal Government Employees | 8 | 13.3% |
| Unpaid Family Workers | 0 | 0.0% |
| Total | 60 | 100.0% |
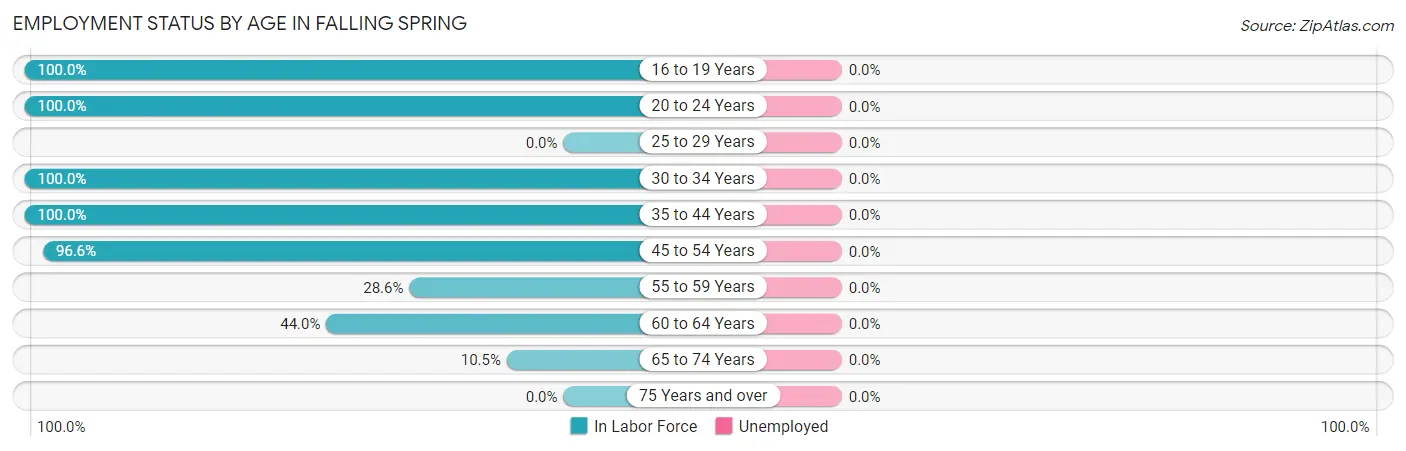
Employment Status by Age in Falling Spring
| Age Bracket | In Labor Force | Unemployed |
| 16 to 19 Years | 4 (100.0%) | 0 (0.0%) |
| 20 to 24 Years | 3 (100.0%) | 0 (0.0%) |
| 25 to 29 Years | 0 (0.0%) | 0 (0.0%) |
| 30 to 34 Years | 2 (100.0%) | 0 (0.0%) |
| 35 to 44 Years | 6 (100.0%) | 0 (0.0%) |
| 45 to 54 Years | 28 (96.6%) | 0 (0.0%) |
| 55 to 59 Years | 4 (28.6%) | 0 (0.0%) |
| 60 to 64 Years | 11 (44.0%) | 0 (0.0%) |
| 65 to 74 Years | 2 (10.5%) | 0 (0.0%) |
| 75 Years and over | 0 (0.0%) | 0 (0.0%) |
| Total | 60 (55.0%) | 0 (0.0%) |
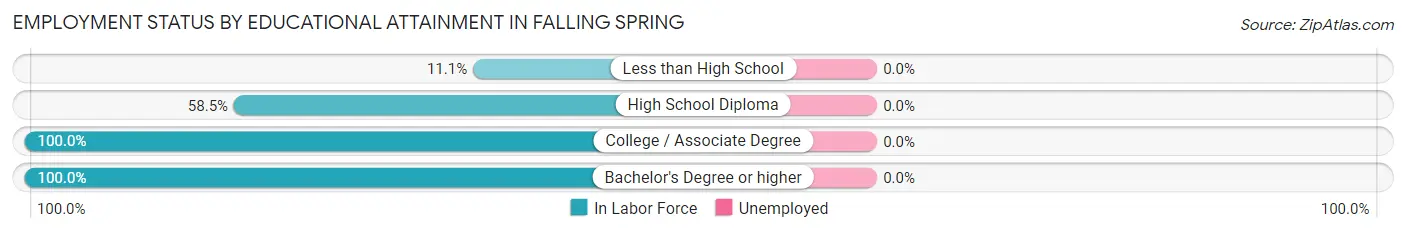
Employment Status by Educational Attainment in Falling Spring
| Educational Attainment | In Labor Force | Unemployed |
| Less than High School | 1 (11.1%) | 0 (0.0%) |
| High School Diploma | 24 (58.5%) | 0 (0.0%) |
| College / Associate Degree | 14 (100.0%) | 0 (0.0%) |
| Bachelor's Degree or higher | 12 (100.0%) | 0 (0.0%) |
| Total | 51 (67.1%) | 0 (0.0%) |
Employment Occupations by Sex in Falling Spring
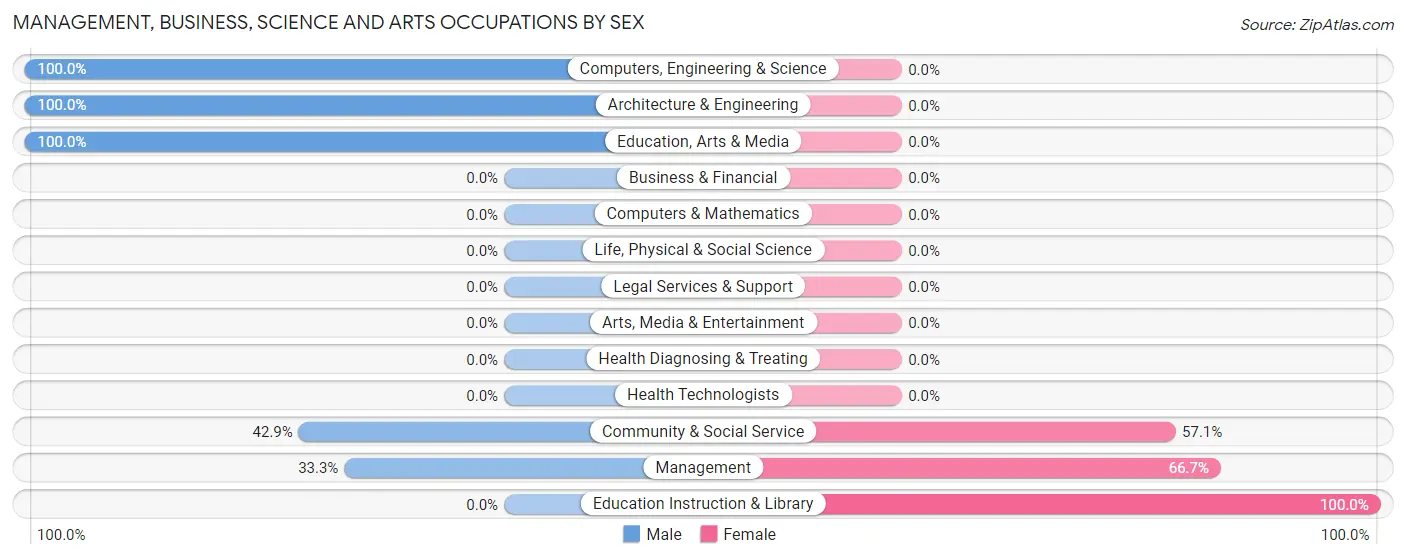
Management, Business, Science and Arts Occupations
The most common Management, Business, Science and Arts occupations in Falling Spring are Community & Social Service (7 | 11.7%), Management (6 | 10.0%), Education Instruction & Library (4 | 6.7%), Education, Arts & Media (3 | 5.0%), and Computers, Engineering & Science (2 | 3.3%).
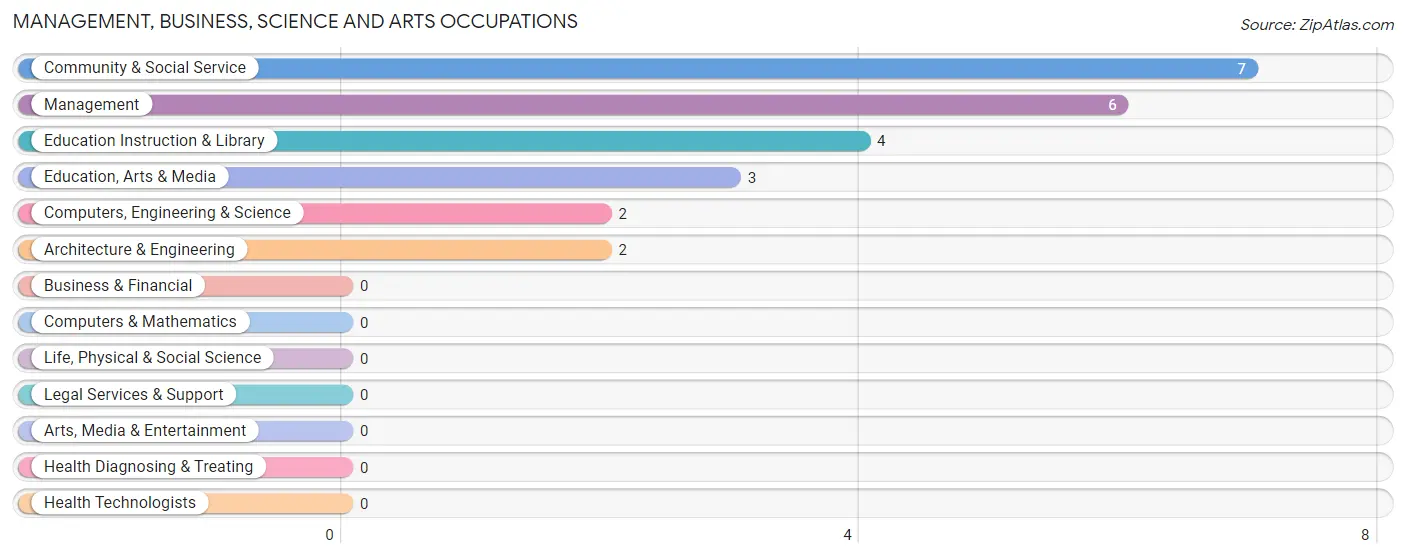
Management, Business, Science and Arts Occupations by Sex
Within the Management, Business, Science and Arts occupations in Falling Spring, the most male-oriented occupations are Computers, Engineering & Science (100.0%), Architecture & Engineering (100.0%), and Education, Arts & Media (100.0%), while the most female-oriented occupations are Education Instruction & Library (100.0%), Management (66.7%), and Community & Social Service (57.1%).
| Occupation | Male | Female |
| Management | 2 (33.3%) | 4 (66.7%) |
| Business & Financial | 0 (0.0%) | 0 (0.0%) |
| Computers, Engineering & Science | 2 (100.0%) | 0 (0.0%) |
| Computers & Mathematics | 0 (0.0%) | 0 (0.0%) |
| Architecture & Engineering | 2 (100.0%) | 0 (0.0%) |
| Life, Physical & Social Science | 0 (0.0%) | 0 (0.0%) |
| Community & Social Service | 3 (42.9%) | 4 (57.1%) |
| Education, Arts & Media | 3 (100.0%) | 0 (0.0%) |
| Legal Services & Support | 0 (0.0%) | 0 (0.0%) |
| Education Instruction & Library | 0 (0.0%) | 4 (100.0%) |
| Arts, Media & Entertainment | 0 (0.0%) | 0 (0.0%) |
| Health Diagnosing & Treating | 0 (0.0%) | 0 (0.0%) |
| Health Technologists | 0 (0.0%) | 0 (0.0%) |
| Total (Category) | 7 (46.7%) | 8 (53.3%) |
| Total (Overall) | 27 (45.0%) | 33 (55.0%) |
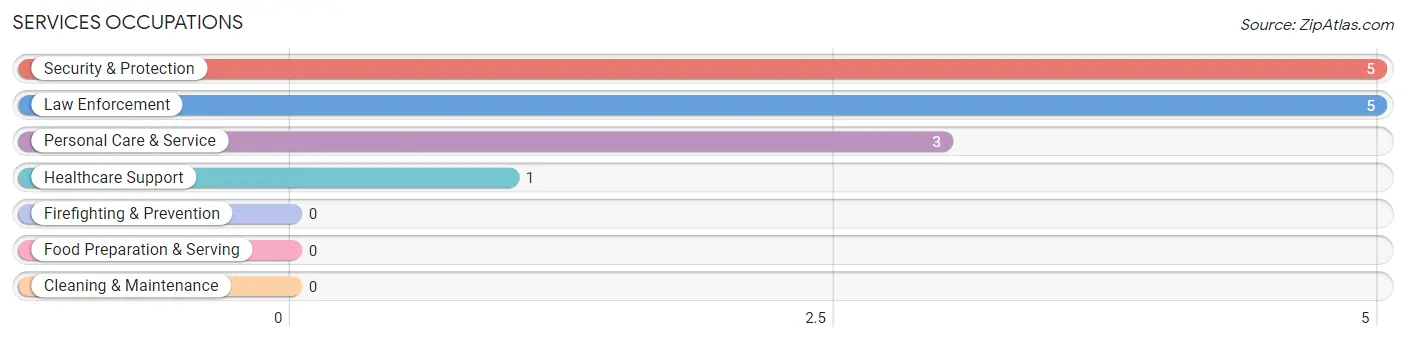
Services Occupations
The most common Services occupations in Falling Spring are Security & Protection (5 | 8.3%), Law Enforcement (5 | 8.3%), Personal Care & Service (3 | 5.0%), and Healthcare Support (1 | 1.7%).
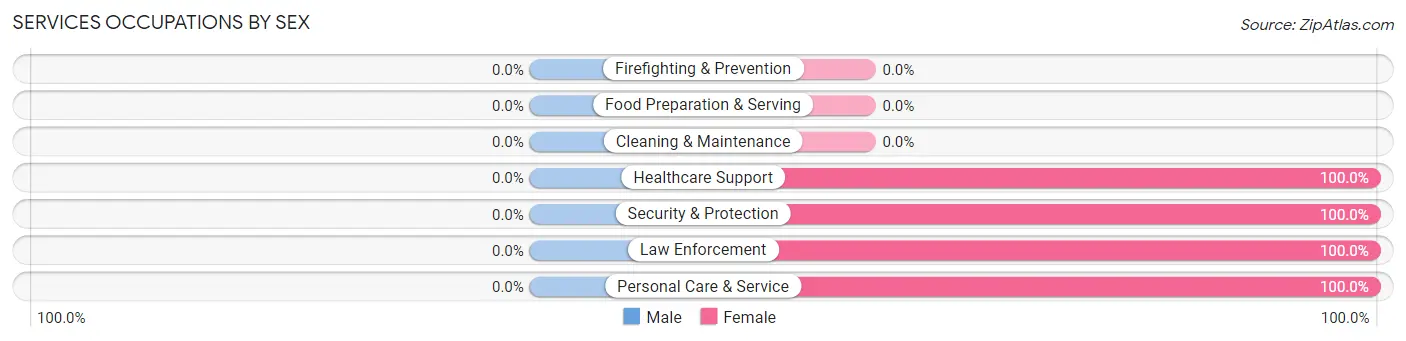
Services Occupations by Sex
| Occupation | Male | Female |
| Healthcare Support | 0 (0.0%) | 1 (100.0%) |
| Security & Protection | 0 (0.0%) | 5 (100.0%) |
| Firefighting & Prevention | 0 (0.0%) | 0 (0.0%) |
| Law Enforcement | 0 (0.0%) | 5 (100.0%) |
| Food Preparation & Serving | 0 (0.0%) | 0 (0.0%) |
| Cleaning & Maintenance | 0 (0.0%) | 0 (0.0%) |
| Personal Care & Service | 0 (0.0%) | 3 (100.0%) |
| Total (Category) | 0 (0.0%) | 9 (100.0%) |
| Total (Overall) | 27 (45.0%) | 33 (55.0%) |
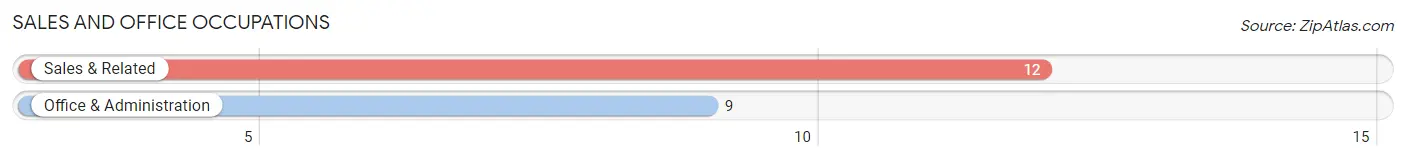
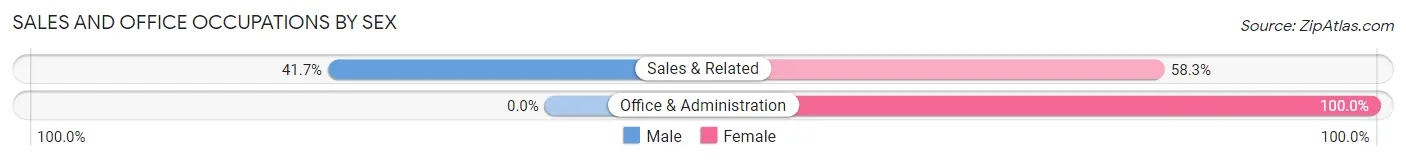
Sales and Office Occupations
The most common Sales and Office occupations in Falling Spring are Sales & Related (12 | 20.0%), and Office & Administration (9 | 15.0%).
Sales and Office Occupations by Sex
| Occupation | Male | Female |
| Sales & Related | 5 (41.7%) | 7 (58.3%) |
| Office & Administration | 0 (0.0%) | 9 (100.0%) |
| Total (Category) | 5 (23.8%) | 16 (76.2%) |
| Total (Overall) | 27 (45.0%) | 33 (55.0%) |
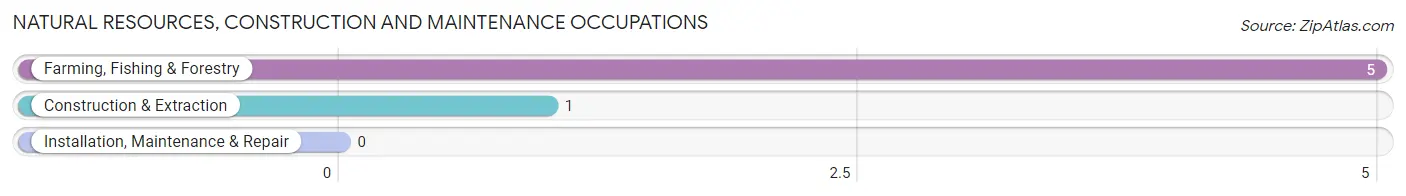
Natural Resources, Construction and Maintenance Occupations
The most common Natural Resources, Construction and Maintenance occupations in Falling Spring are Farming, Fishing & Forestry (5 | 8.3%), and Construction & Extraction (1 | 1.7%).
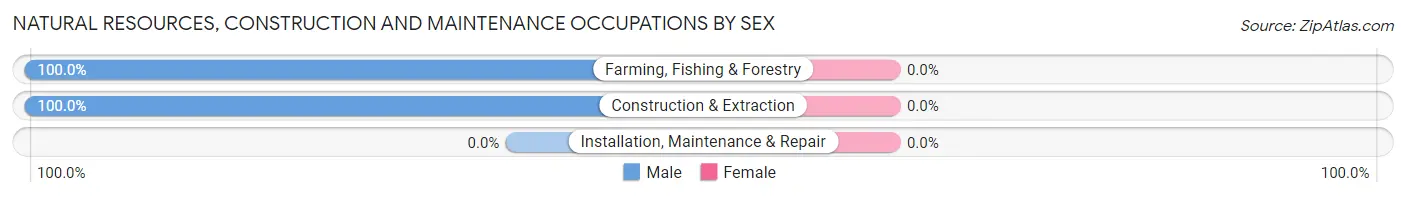
Natural Resources, Construction and Maintenance Occupations by Sex
| Occupation | Male | Female |
| Farming, Fishing & Forestry | 5 (100.0%) | 0 (0.0%) |
| Construction & Extraction | 1 (100.0%) | 0 (0.0%) |
| Installation, Maintenance & Repair | 0 (0.0%) | 0 (0.0%) |
| Total (Category) | 6 (100.0%) | 0 (0.0%) |
| Total (Overall) | 27 (45.0%) | 33 (55.0%) |
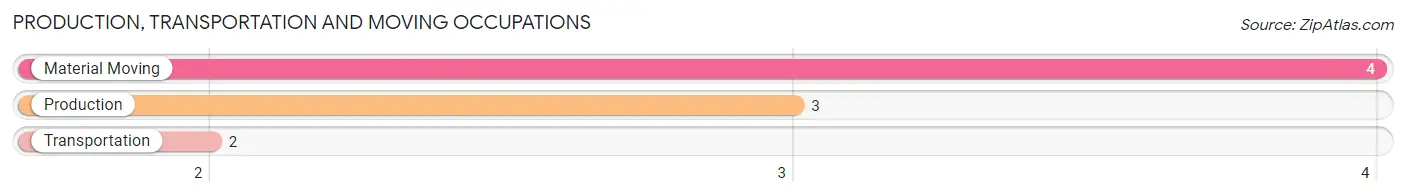
Production, Transportation and Moving Occupations
The most common Production, Transportation and Moving occupations in Falling Spring are Material Moving (4 | 6.7%), Production (3 | 5.0%), and Transportation (2 | 3.3%).
Production, Transportation and Moving Occupations by Sex
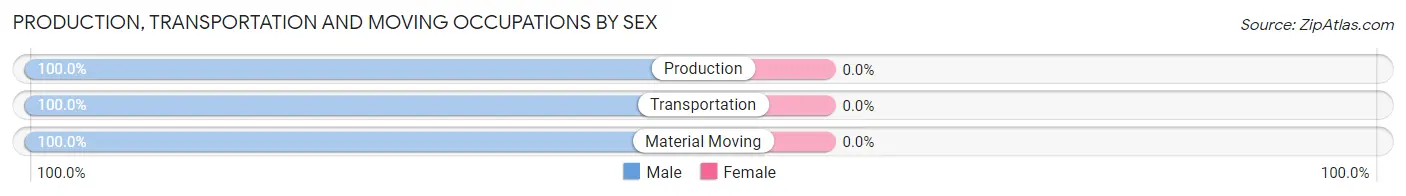
| Occupation | Male | Female |
| Production | 3 (100.0%) | 0 (0.0%) |
| Transportation | 2 (100.0%) | 0 (0.0%) |
| Material Moving | 4 (100.0%) | 0 (0.0%) |
| Total (Category) | 9 (100.0%) | 0 (0.0%) |
| Total (Overall) | 27 (45.0%) | 33 (55.0%) |
Employment Industries by Sex in Falling Spring
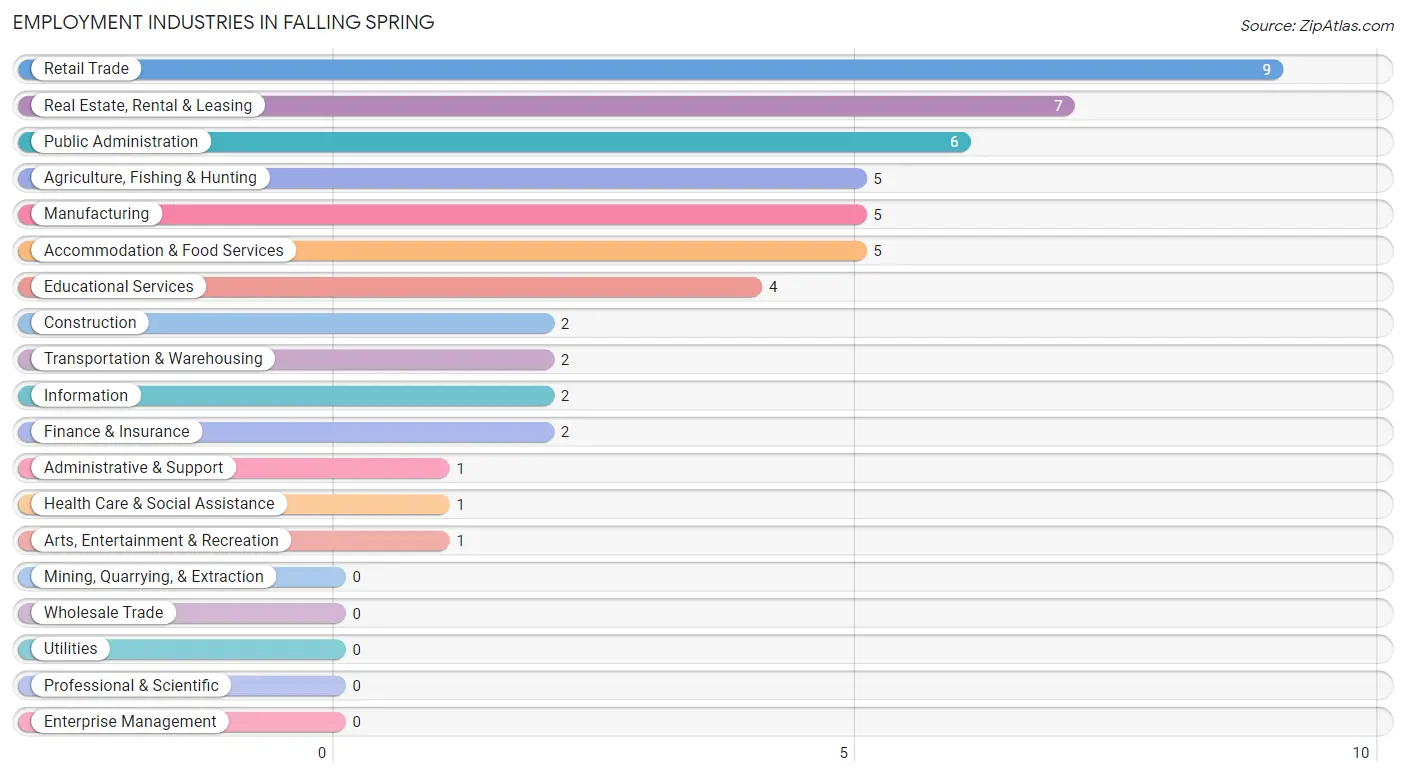
Employment Industries in Falling Spring
The major employment industries in Falling Spring include Retail Trade (9 | 15.0%), Real Estate, Rental & Leasing (7 | 11.7%), Public Administration (6 | 10.0%), Agriculture, Fishing & Hunting (5 | 8.3%), and Manufacturing (5 | 8.3%).
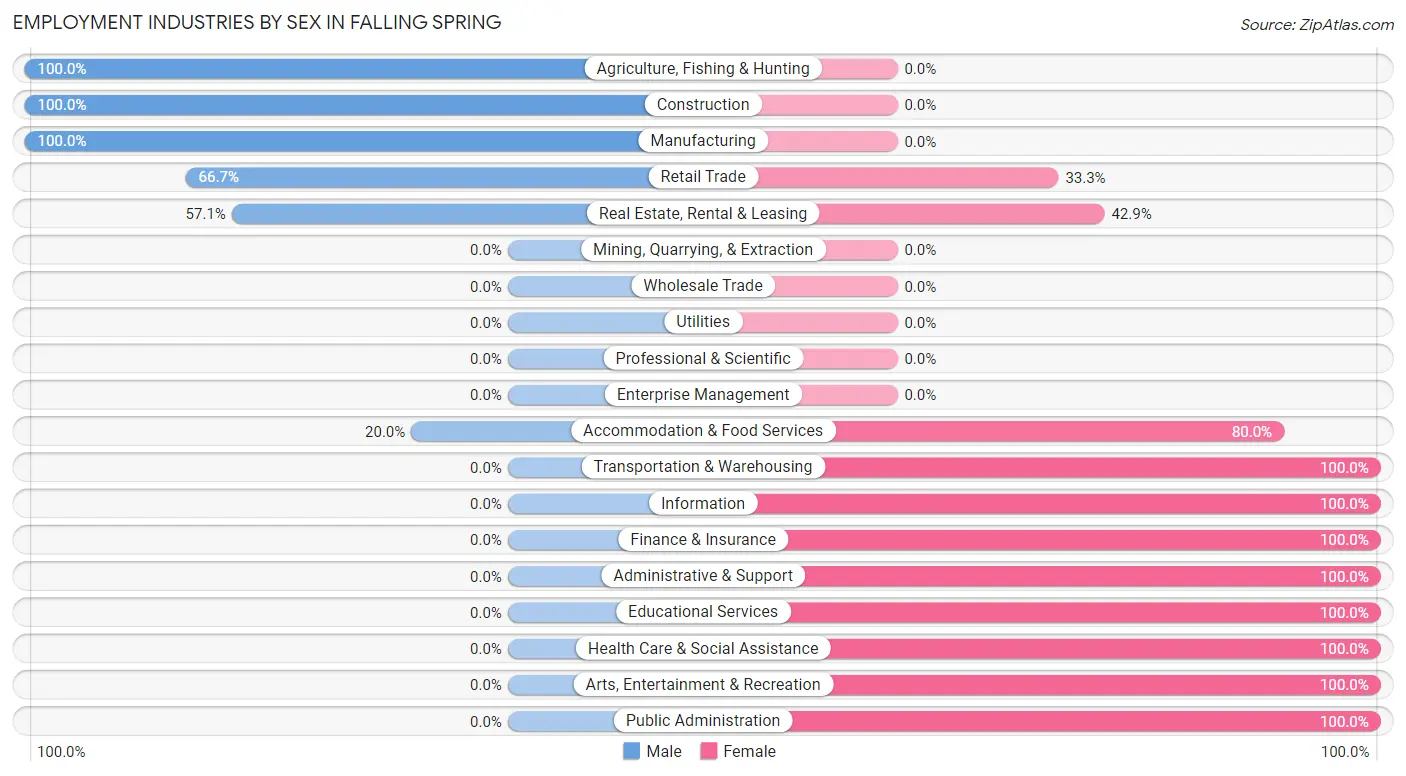
Employment Industries by Sex in Falling Spring
The Falling Spring industries that see more men than women are Agriculture, Fishing & Hunting (100.0%), Construction (100.0%), and Manufacturing (100.0%), whereas the industries that tend to have a higher number of women are Transportation & Warehousing (100.0%), Information (100.0%), and Finance & Insurance (100.0%).
| Industry | Male | Female |
| Agriculture, Fishing & Hunting | 5 (100.0%) | 0 (0.0%) |
| Mining, Quarrying, & Extraction | 0 (0.0%) | 0 (0.0%) |
| Construction | 2 (100.0%) | 0 (0.0%) |
| Manufacturing | 5 (100.0%) | 0 (0.0%) |
| Wholesale Trade | 0 (0.0%) | 0 (0.0%) |
| Retail Trade | 6 (66.7%) | 3 (33.3%) |
| Transportation & Warehousing | 0 (0.0%) | 2 (100.0%) |
| Utilities | 0 (0.0%) | 0 (0.0%) |
| Information | 0 (0.0%) | 2 (100.0%) |
| Finance & Insurance | 0 (0.0%) | 2 (100.0%) |
| Real Estate, Rental & Leasing | 4 (57.1%) | 3 (42.9%) |
| Professional & Scientific | 0 (0.0%) | 0 (0.0%) |
| Enterprise Management | 0 (0.0%) | 0 (0.0%) |
| Administrative & Support | 0 (0.0%) | 1 (100.0%) |
| Educational Services | 0 (0.0%) | 4 (100.0%) |
| Health Care & Social Assistance | 0 (0.0%) | 1 (100.0%) |
| Arts, Entertainment & Recreation | 0 (0.0%) | 1 (100.0%) |
| Accommodation & Food Services | 1 (20.0%) | 4 (80.0%) |
| Public Administration | 0 (0.0%) | 6 (100.0%) |
| Total | 27 (45.0%) | 33 (55.0%) |
Education in Falling Spring
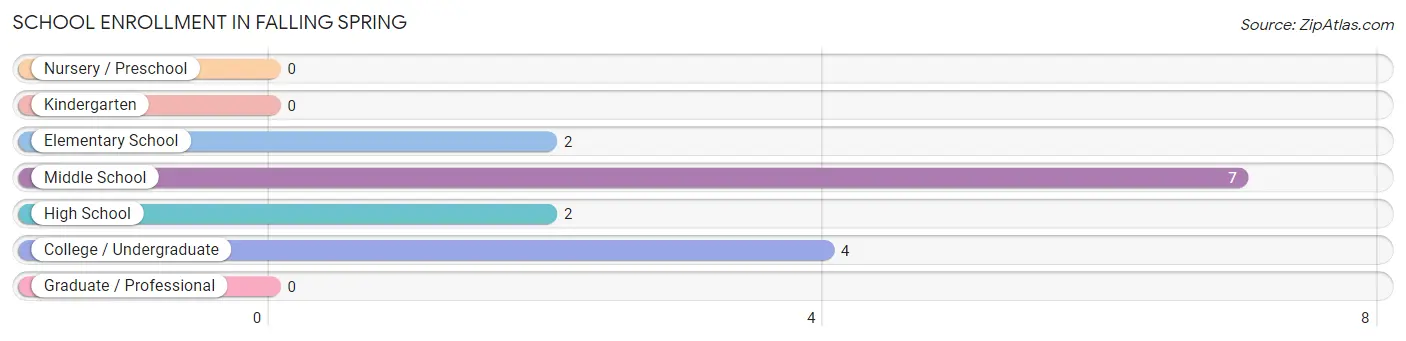
School Enrollment in Falling Spring
The most common levels of schooling among the 15 students in Falling Spring are middle school (7 | 46.7%), college / undergraduate (4 | 26.7%), and elementary school (2 | 13.3%).
| School Level | # Students | % Students |
| Nursery / Preschool | 0 | 0.0% |
| Kindergarten | 0 | 0.0% |
| Elementary School | 2 | 13.3% |
| Middle School | 7 | 46.7% |
| High School | 2 | 13.3% |
| College / Undergraduate | 4 | 26.7% |
| Graduate / Professional | 0 | 0.0% |
| Total | 15 | 100.0% |
School Enrollment by Age by Funding Source in Falling Spring
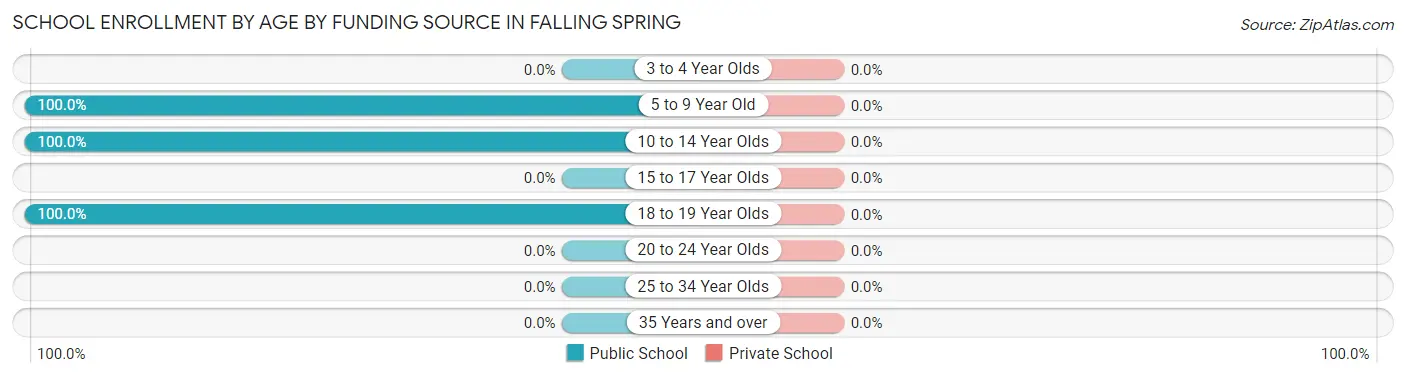
| Age Bracket | Public School | Private School |
| 3 to 4 Year Olds | 0 (0.0%) | 0 (0.0%) |
| 5 to 9 Year Old | 2 (100.0%) | 0 (0.0%) |
| 10 to 14 Year Olds | 9 (100.0%) | 0 (0.0%) |
| 15 to 17 Year Olds | 0 (0.0%) | 0 (0.0%) |
| 18 to 19 Year Olds | 4 (100.0%) | 0 (0.0%) |
| 20 to 24 Year Olds | 0 (0.0%) | 0 (0.0%) |
| 25 to 34 Year Olds | 0 (0.0%) | 0 (0.0%) |
| 35 Years and over | 0 (0.0%) | 0 (0.0%) |
| Total | 15 (100.0%) | 0 (0.0%) |
Educational Attainment by Field of Study in Falling Spring
Science & technology (5 | 33.3%), multidisciplinary studies (2 | 13.3%), business (2 | 13.3%), education (2 | 13.3%), and liberal arts & history (2 | 13.3%) are the most common fields of study among 15 individuals in Falling Spring who have obtained a bachelor's degree or higher.
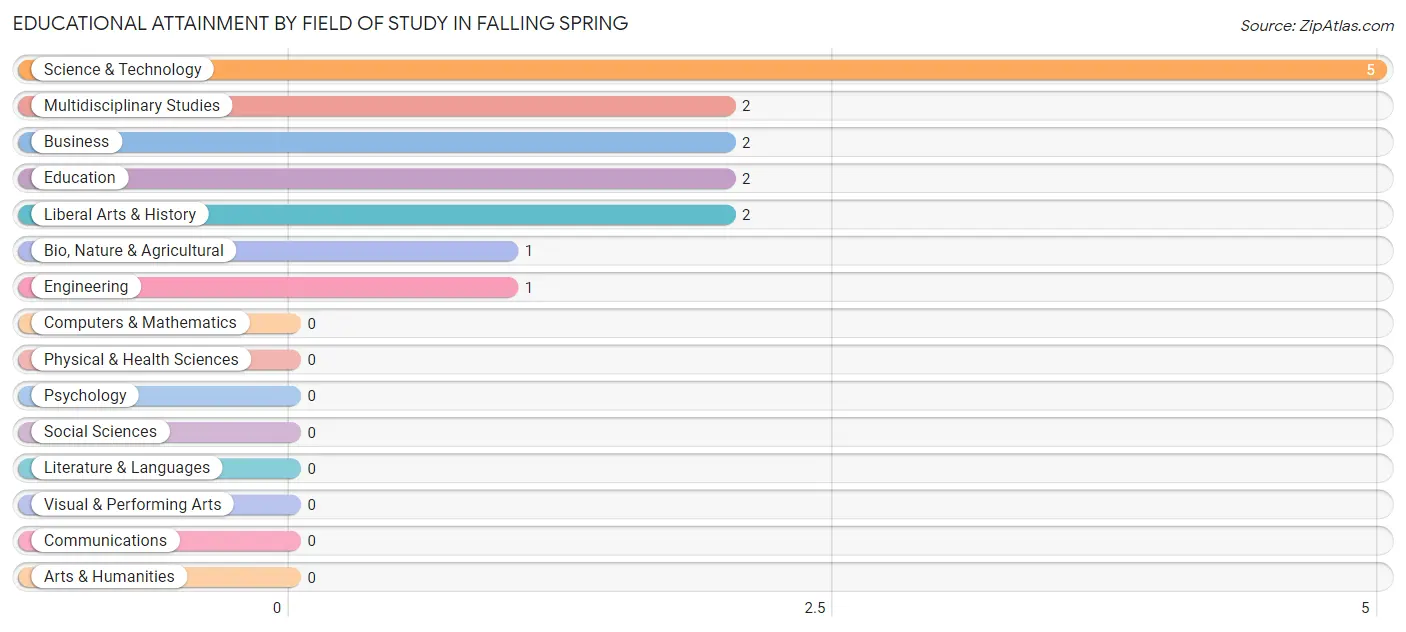
| Field of Study | # Graduates | % Graduates |
| Computers & Mathematics | 0 | 0.0% |
| Bio, Nature & Agricultural | 1 | 6.7% |
| Physical & Health Sciences | 0 | 0.0% |
| Psychology | 0 | 0.0% |
| Social Sciences | 0 | 0.0% |
| Engineering | 1 | 6.7% |
| Multidisciplinary Studies | 2 | 13.3% |
| Science & Technology | 5 | 33.3% |
| Business | 2 | 13.3% |
| Education | 2 | 13.3% |
| Literature & Languages | 0 | 0.0% |
| Liberal Arts & History | 2 | 13.3% |
| Visual & Performing Arts | 0 | 0.0% |
| Communications | 0 | 0.0% |
| Arts & Humanities | 0 | 0.0% |
| Total | 15 | 100.0% |
Transportation & Commute in Falling Spring
Vehicle Availability by Sex in Falling Spring
The most prevalent vehicle ownership categories in Falling Spring are males with 3 vehicles (11, accounting for 40.7%) and females with 3 vehicles (14, making up 33.3%).
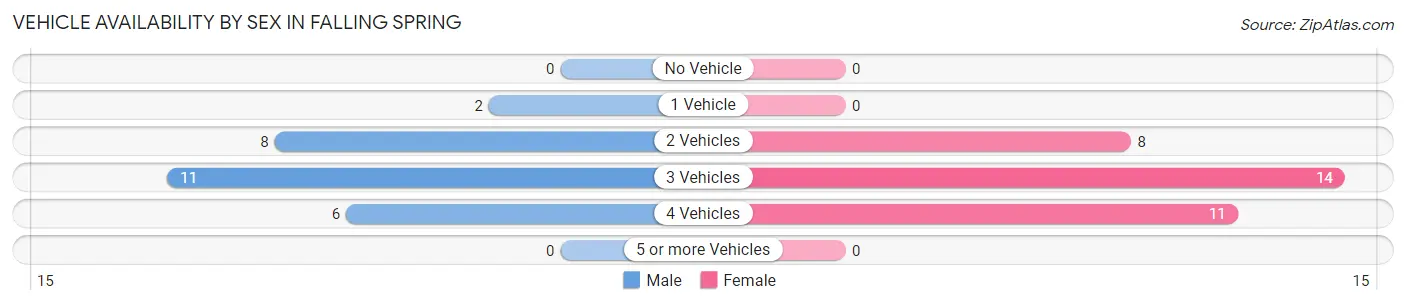
| Vehicles Available | Male | Female |
| No Vehicle | 0 (0.0%) | 0 (0.0%) |
| 1 Vehicle | 2 (7.4%) | 0 (0.0%) |
| 2 Vehicles | 8 (29.6%) | 8 (24.2%) |
| 3 Vehicles | 11 (40.7%) | 14 (42.4%) |
| 4 Vehicles | 6 (22.2%) | 11 (33.3%) |
| 5 or more Vehicles | 0 (0.0%) | 0 (0.0%) |
| Total | 27 (100.0%) | 33 (100.0%) |
Commute Time in Falling Spring
The most frequently occuring commute durations in Falling Spring are 30 to 34 minutes (21 commuters, 39.6%), 45 to 59 minutes (11 commuters, 20.7%), and 10 to 14 minutes (5 commuters, 9.4%).
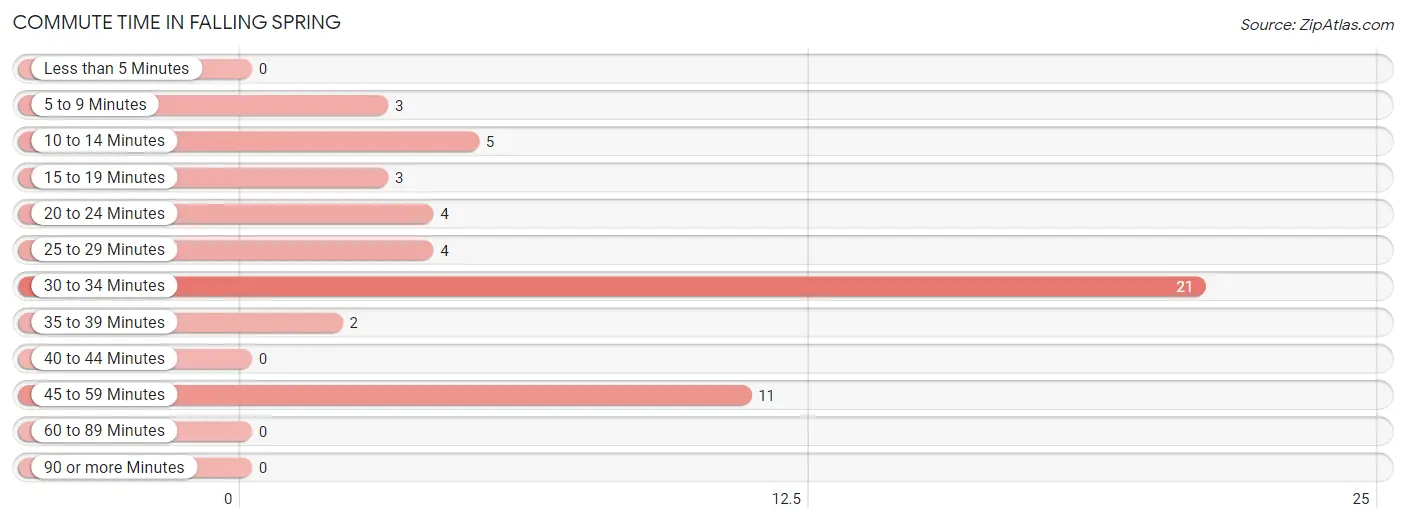
| Commute Time | # Commuters | % Commuters |
| Less than 5 Minutes | 0 | 0.0% |
| 5 to 9 Minutes | 3 | 5.7% |
| 10 to 14 Minutes | 5 | 9.4% |
| 15 to 19 Minutes | 3 | 5.7% |
| 20 to 24 Minutes | 4 | 7.5% |
| 25 to 29 Minutes | 4 | 7.5% |
| 30 to 34 Minutes | 21 | 39.6% |
| 35 to 39 Minutes | 2 | 3.8% |
| 40 to 44 Minutes | 0 | 0.0% |
| 45 to 59 Minutes | 11 | 20.7% |
| 60 to 89 Minutes | 0 | 0.0% |
| 90 or more Minutes | 0 | 0.0% |
Commute Time by Sex in Falling Spring
The most common commute times in Falling Spring are 30 to 34 minutes (10 commuters, 45.5%) for males and 30 to 34 minutes (11 commuters, 35.5%) for females.
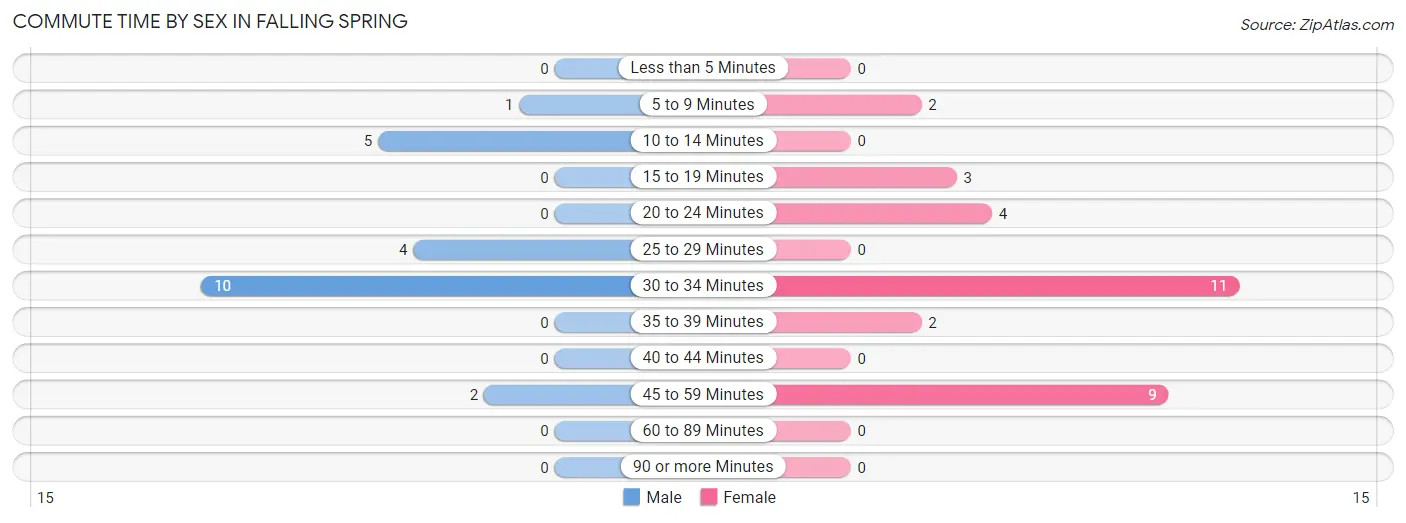
| Commute Time | Male | Female |
| Less than 5 Minutes | 0 (0.0%) | 0 (0.0%) |
| 5 to 9 Minutes | 1 (4.5%) | 2 (6.5%) |
| 10 to 14 Minutes | 5 (22.7%) | 0 (0.0%) |
| 15 to 19 Minutes | 0 (0.0%) | 3 (9.7%) |
| 20 to 24 Minutes | 0 (0.0%) | 4 (12.9%) |
| 25 to 29 Minutes | 4 (18.2%) | 0 (0.0%) |
| 30 to 34 Minutes | 10 (45.5%) | 11 (35.5%) |
| 35 to 39 Minutes | 0 (0.0%) | 2 (6.5%) |
| 40 to 44 Minutes | 0 (0.0%) | 0 (0.0%) |
| 45 to 59 Minutes | 2 (9.1%) | 9 (29.0%) |
| 60 to 89 Minutes | 0 (0.0%) | 0 (0.0%) |
| 90 or more Minutes | 0 (0.0%) | 0 (0.0%) |
Time of Departure to Work by Sex in Falling Spring
The most frequent times of departure to work in Falling Spring are 7:30 AM to 7:59 AM (6, 27.3%) for males and 6:30 AM to 6:59 AM (8, 25.8%) for females.
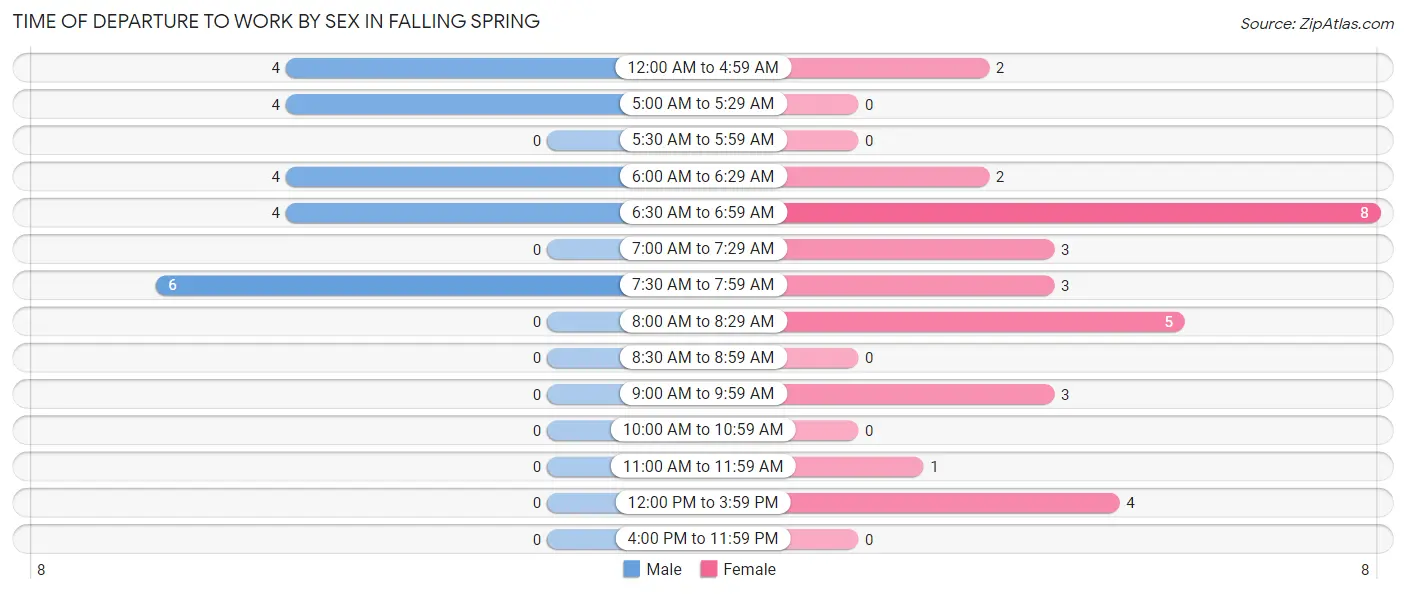
| Time of Departure | Male | Female |
| 12:00 AM to 4:59 AM | 4 (18.2%) | 2 (6.5%) |
| 5:00 AM to 5:29 AM | 4 (18.2%) | 0 (0.0%) |
| 5:30 AM to 5:59 AM | 0 (0.0%) | 0 (0.0%) |
| 6:00 AM to 6:29 AM | 4 (18.2%) | 2 (6.5%) |
| 6:30 AM to 6:59 AM | 4 (18.2%) | 8 (25.8%) |
| 7:00 AM to 7:29 AM | 0 (0.0%) | 3 (9.7%) |
| 7:30 AM to 7:59 AM | 6 (27.3%) | 3 (9.7%) |
| 8:00 AM to 8:29 AM | 0 (0.0%) | 5 (16.1%) |
| 8:30 AM to 8:59 AM | 0 (0.0%) | 0 (0.0%) |
| 9:00 AM to 9:59 AM | 0 (0.0%) | 3 (9.7%) |
| 10:00 AM to 10:59 AM | 0 (0.0%) | 0 (0.0%) |
| 11:00 AM to 11:59 AM | 0 (0.0%) | 1 (3.2%) |
| 12:00 PM to 3:59 PM | 0 (0.0%) | 4 (12.9%) |
| 4:00 PM to 11:59 PM | 0 (0.0%) | 0 (0.0%) |
| Total | 22 (100.0%) | 31 (100.0%) |
Housing Occupancy in Falling Spring
Occupancy by Ownership in Falling Spring
Of the total 57 dwellings in Falling Spring, owner-occupied units account for 51 (89.5%), while renter-occupied units make up 6 (10.5%).
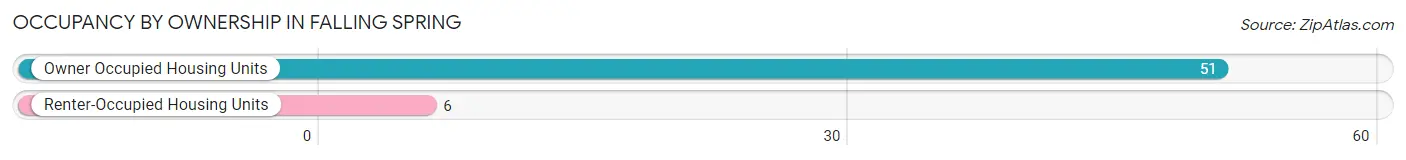
| Occupancy | # Housing Units | % Housing Units |
| Owner Occupied Housing Units | 51 | 89.5% |
| Renter-Occupied Housing Units | 6 | 10.5% |
| Total Occupied Housing Units | 57 | 100.0% |
Occupancy by Household Size in Falling Spring
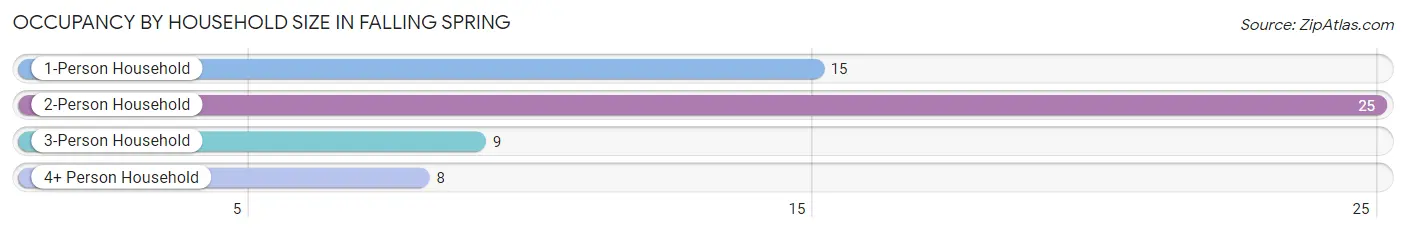
| Household Size | # Housing Units | % Housing Units |
| 1-Person Household | 15 | 26.3% |
| 2-Person Household | 25 | 43.9% |
| 3-Person Household | 9 | 15.8% |
| 4+ Person Household | 8 | 14.0% |
| Total Housing Units | 57 | 100.0% |
Occupancy by Ownership by Household Size in Falling Spring
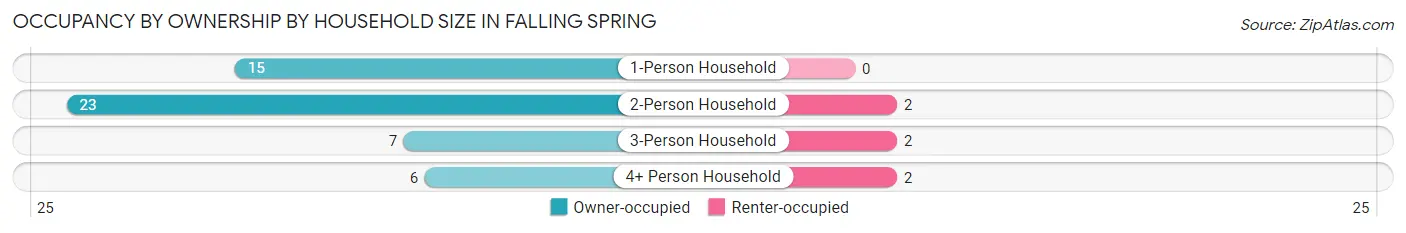
| Household Size | Owner-occupied | Renter-occupied |
| 1-Person Household | 15 (100.0%) | 0 (0.0%) |
| 2-Person Household | 23 (92.0%) | 2 (8.0%) |
| 3-Person Household | 7 (77.8%) | 2 (22.2%) |
| 4+ Person Household | 6 (75.0%) | 2 (25.0%) |
| Total Housing Units | 51 (89.5%) | 6 (10.5%) |
Occupancy by Educational Attainment in Falling Spring
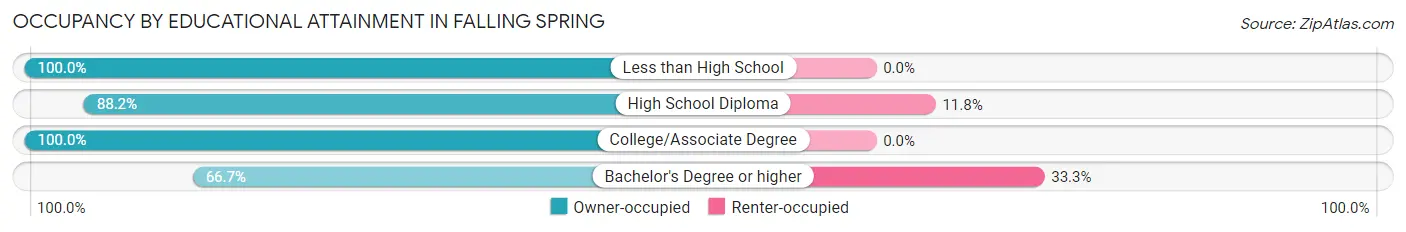
| Household Size | Owner-occupied | Renter-occupied |
| Less than High School | 1 (100.0%) | 0 (0.0%) |
| High School Diploma | 30 (88.2%) | 4 (11.8%) |
| College/Associate Degree | 16 (100.0%) | 0 (0.0%) |
| Bachelor's Degree or higher | 4 (66.7%) | 2 (33.3%) |
Occupancy by Age of Householder in Falling Spring
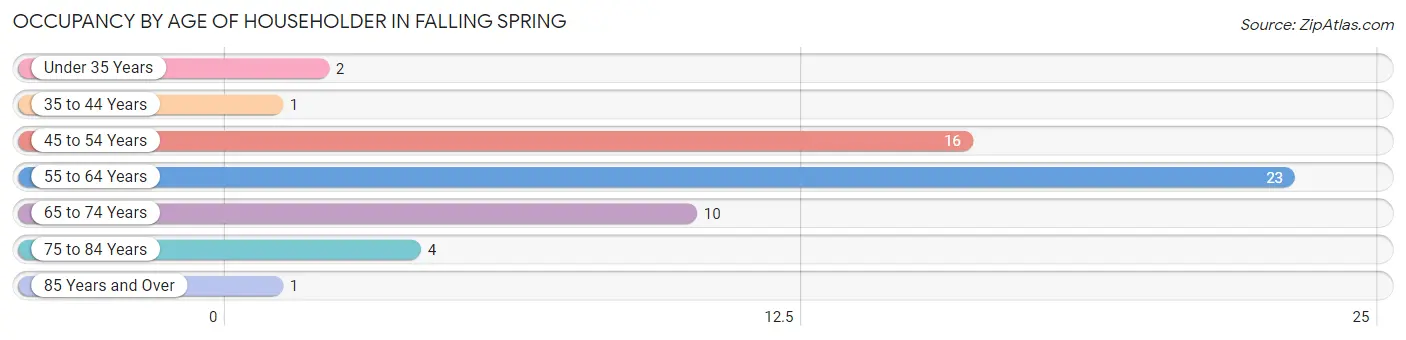
| Age Bracket | # Households | % Households |
| Under 35 Years | 2 | 3.5% |
| 35 to 44 Years | 1 | 1.8% |
| 45 to 54 Years | 16 | 28.1% |
| 55 to 64 Years | 23 | 40.4% |
| 65 to 74 Years | 10 | 17.5% |
| 75 to 84 Years | 4 | 7.0% |
| 85 Years and Over | 1 | 1.8% |
| Total | 57 | 100.0% |
Housing Finances in Falling Spring
Median Income by Occupancy in Falling Spring
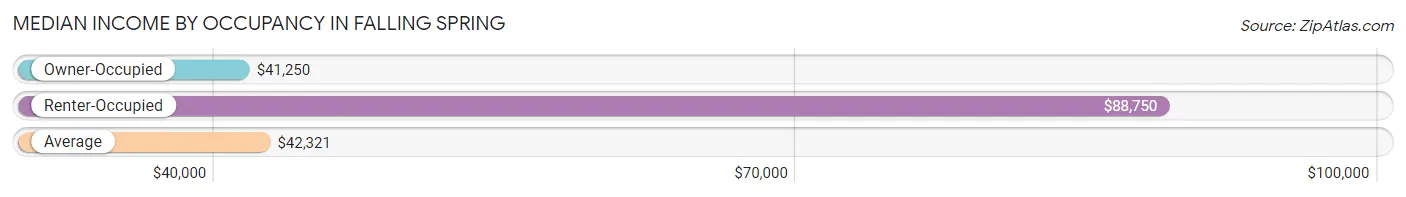
| Occupancy Type | # Households | Median Income |
| Owner-Occupied | 51 (89.5%) | $41,250 |
| Renter-Occupied | 6 (10.5%) | $88,750 |
| Average | 57 (100.0%) | $42,321 |
Occupancy by Householder Income Bracket in Falling Spring
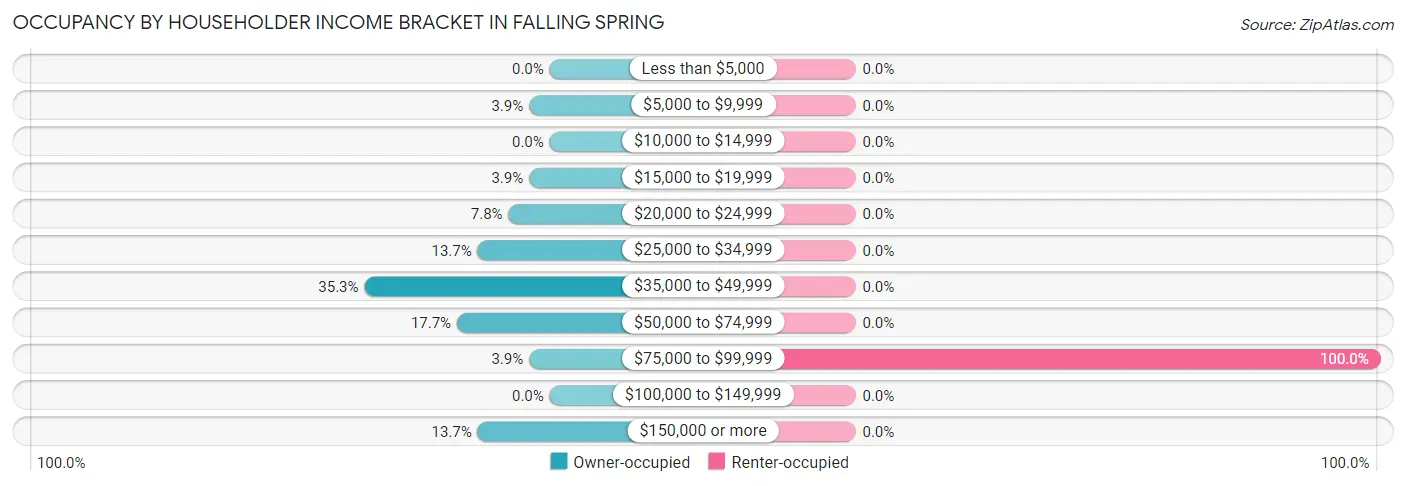
| Income Bracket | Owner-occupied | Renter-occupied |
| Less than $5,000 | 0 (0.0%) | 0 (0.0%) |
| $5,000 to $9,999 | 2 (3.9%) | 0 (0.0%) |
| $10,000 to $14,999 | 0 (0.0%) | 0 (0.0%) |
| $15,000 to $19,999 | 2 (3.9%) | 0 (0.0%) |
| $20,000 to $24,999 | 4 (7.8%) | 0 (0.0%) |
| $25,000 to $34,999 | 7 (13.7%) | 0 (0.0%) |
| $35,000 to $49,999 | 18 (35.3%) | 0 (0.0%) |
| $50,000 to $74,999 | 9 (17.6%) | 0 (0.0%) |
| $75,000 to $99,999 | 2 (3.9%) | 6 (100.0%) |
| $100,000 to $149,999 | 0 (0.0%) | 0 (0.0%) |
| $150,000 or more | 7 (13.7%) | 0 (0.0%) |
| Total | 51 (100.0%) | 6 (100.0%) |
Monthly Housing Cost Tiers in Falling Spring
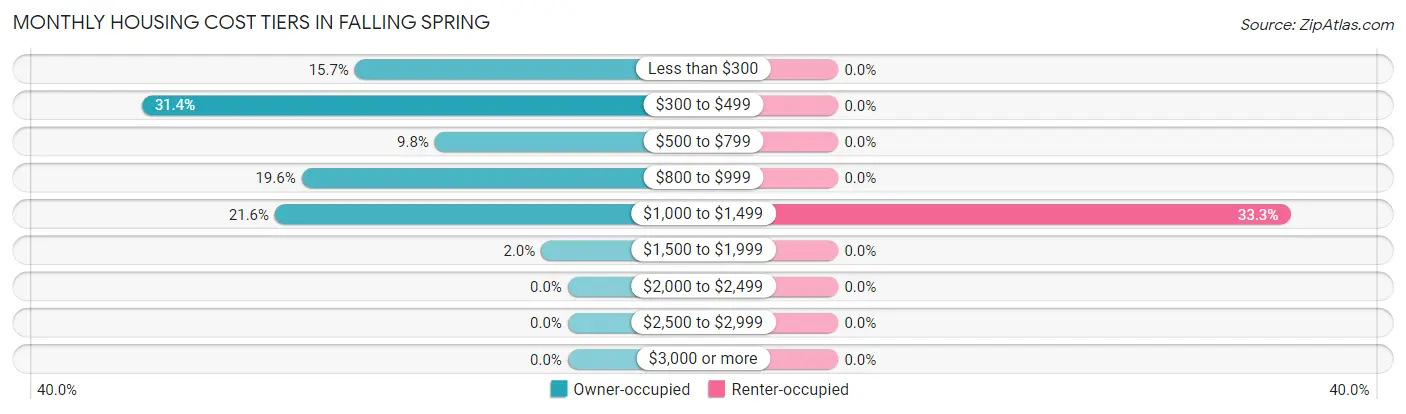
| Monthly Cost | Owner-occupied | Renter-occupied |
| Less than $300 | 8 (15.7%) | 0 (0.0%) |
| $300 to $499 | 16 (31.4%) | 0 (0.0%) |
| $500 to $799 | 5 (9.8%) | 0 (0.0%) |
| $800 to $999 | 10 (19.6%) | 0 (0.0%) |
| $1,000 to $1,499 | 11 (21.6%) | 2 (33.3%) |
| $1,500 to $1,999 | 1 (2.0%) | 0 (0.0%) |
| $2,000 to $2,499 | 0 (0.0%) | 0 (0.0%) |
| $2,500 to $2,999 | 0 (0.0%) | 0 (0.0%) |
| $3,000 or more | 0 (0.0%) | 0 (0.0%) |
| Total | 51 (100.0%) | 6 (100.0%) |
Physical Housing Characteristics in Falling Spring
Housing Structures in Falling Spring
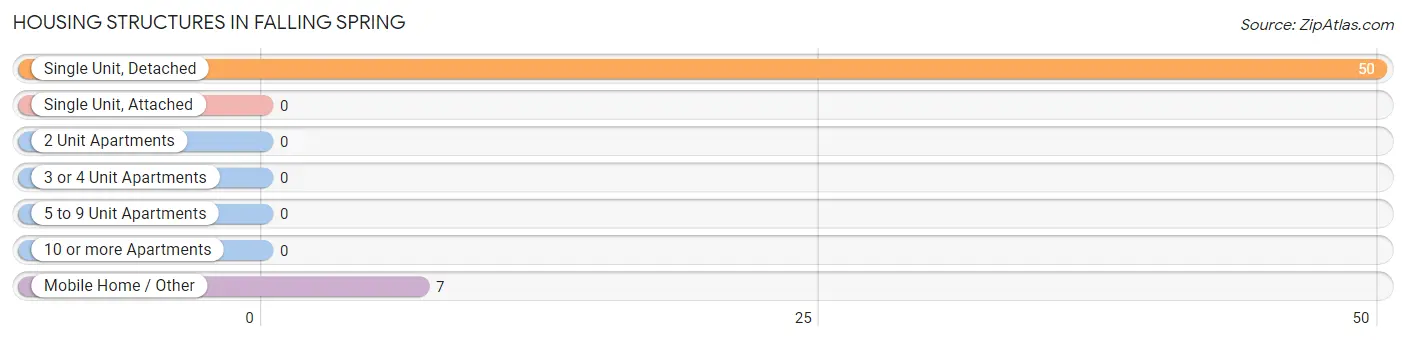
| Structure Type | # Housing Units | % Housing Units |
| Single Unit, Detached | 50 | 87.7% |
| Single Unit, Attached | 0 | 0.0% |
| 2 Unit Apartments | 0 | 0.0% |
| 3 or 4 Unit Apartments | 0 | 0.0% |
| 5 to 9 Unit Apartments | 0 | 0.0% |
| 10 or more Apartments | 0 | 0.0% |
| Mobile Home / Other | 7 | 12.3% |
| Total | 57 | 100.0% |
Housing Structures by Occupancy in Falling Spring
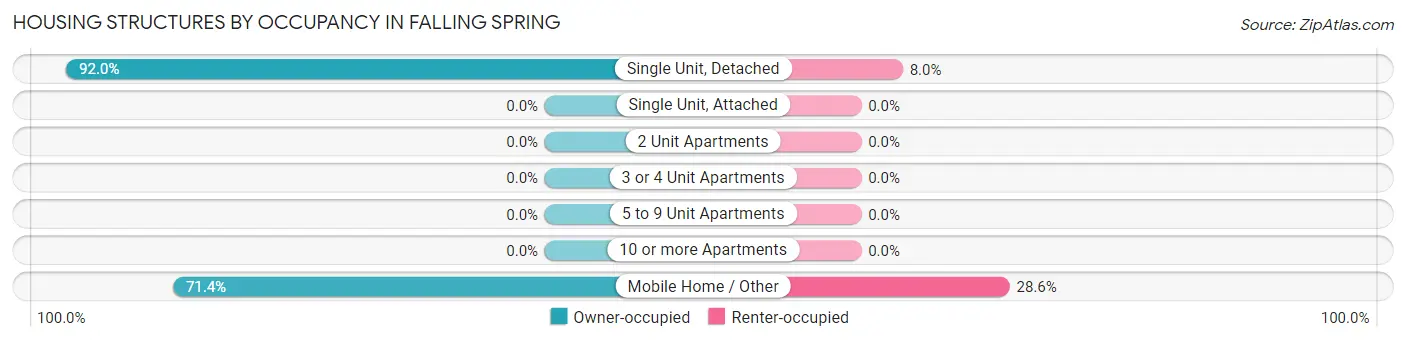
| Structure Type | Owner-occupied | Renter-occupied |
| Single Unit, Detached | 46 (92.0%) | 4 (8.0%) |
| Single Unit, Attached | 0 (0.0%) | 0 (0.0%) |
| 2 Unit Apartments | 0 (0.0%) | 0 (0.0%) |
| 3 or 4 Unit Apartments | 0 (0.0%) | 0 (0.0%) |
| 5 to 9 Unit Apartments | 0 (0.0%) | 0 (0.0%) |
| 10 or more Apartments | 0 (0.0%) | 0 (0.0%) |
| Mobile Home / Other | 5 (71.4%) | 2 (28.6%) |
| Total | 51 (89.5%) | 6 (10.5%) |
Housing Structures by Number of Rooms in Falling Spring
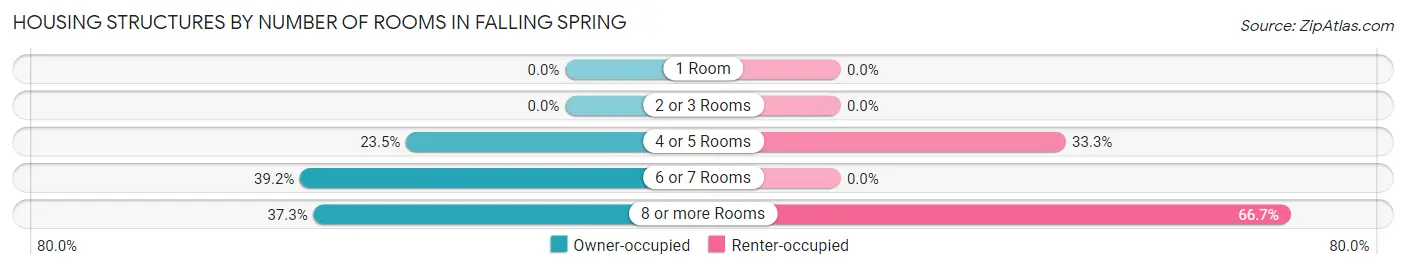
| Number of Rooms | Owner-occupied | Renter-occupied |
| 1 Room | 0 (0.0%) | 0 (0.0%) |
| 2 or 3 Rooms | 0 (0.0%) | 0 (0.0%) |
| 4 or 5 Rooms | 12 (23.5%) | 2 (33.3%) |
| 6 or 7 Rooms | 20 (39.2%) | 0 (0.0%) |
| 8 or more Rooms | 19 (37.2%) | 4 (66.7%) |
| Total | 51 (100.0%) | 6 (100.0%) |
Housing Structure by Heating Type in Falling Spring
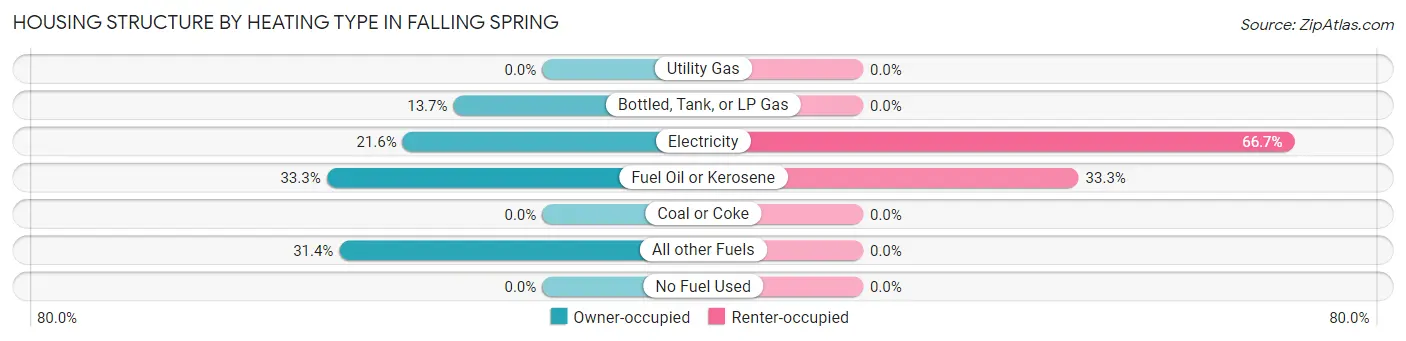
| Heating Type | Owner-occupied | Renter-occupied |
| Utility Gas | 0 (0.0%) | 0 (0.0%) |
| Bottled, Tank, or LP Gas | 7 (13.7%) | 0 (0.0%) |
| Electricity | 11 (21.6%) | 4 (66.7%) |
| Fuel Oil or Kerosene | 17 (33.3%) | 2 (33.3%) |
| Coal or Coke | 0 (0.0%) | 0 (0.0%) |
| All other Fuels | 16 (31.4%) | 0 (0.0%) |
| No Fuel Used | 0 (0.0%) | 0 (0.0%) |
| Total | 51 (100.0%) | 6 (100.0%) |
Household Vehicle Usage in Falling Spring
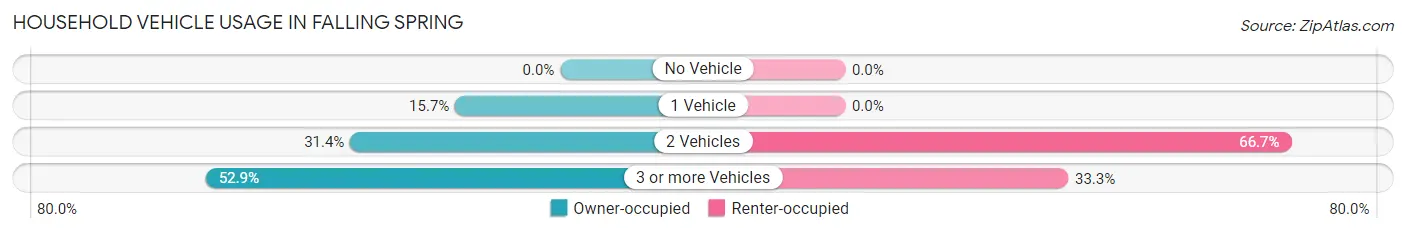
| Vehicles per Household | Owner-occupied | Renter-occupied |
| No Vehicle | 0 (0.0%) | 0 (0.0%) |
| 1 Vehicle | 8 (15.7%) | 0 (0.0%) |
| 2 Vehicles | 16 (31.4%) | 4 (66.7%) |
| 3 or more Vehicles | 27 (52.9%) | 2 (33.3%) |
| Total | 51 (100.0%) | 6 (100.0%) |
Real Estate & Mortgages in Falling Spring
Real Estate and Mortgage Overview in Falling Spring
| Characteristic | Without Mortgage | With Mortgage |
| Housing Units | 25 | 26 |
| Median Property Value | $79,300 | $105,000 |
| Median Household Income | $40,893 | $7 |
| Monthly Housing Costs | $395 | $0 |
| Real Estate Taxes | $450 | $1 |
Property Value by Mortgage Status in Falling Spring
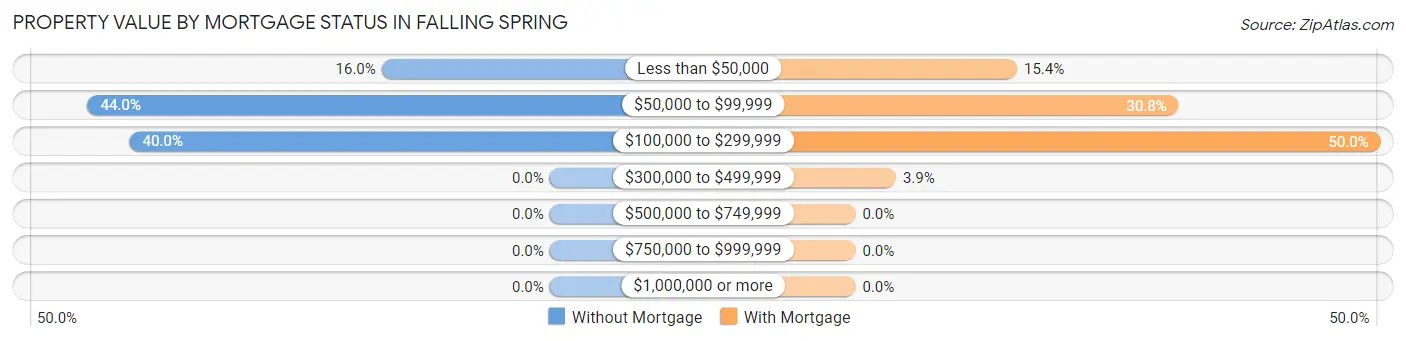
| Property Value | Without Mortgage | With Mortgage |
| Less than $50,000 | 4 (16.0%) | 4 (15.4%) |
| $50,000 to $99,999 | 11 (44.0%) | 8 (30.8%) |
| $100,000 to $299,999 | 10 (40.0%) | 13 (50.0%) |
| $300,000 to $499,999 | 0 (0.0%) | 1 (3.8%) |
| $500,000 to $749,999 | 0 (0.0%) | 0 (0.0%) |
| $750,000 to $999,999 | 0 (0.0%) | 0 (0.0%) |
| $1,000,000 or more | 0 (0.0%) | 0 (0.0%) |
| Total | 25 (100.0%) | 26 (100.0%) |
Household Income by Mortgage Status in Falling Spring
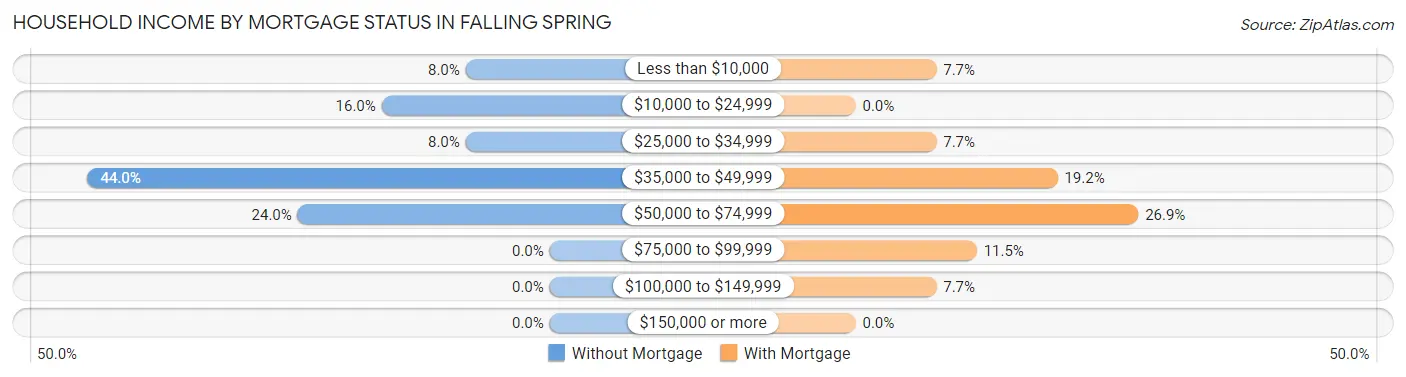
| Household Income | Without Mortgage | With Mortgage |
| Less than $10,000 | 2 (8.0%) | 2 (7.7%) |
| $10,000 to $24,999 | 4 (16.0%) | 0 (0.0%) |
| $25,000 to $34,999 | 2 (8.0%) | 2 (7.7%) |
| $35,000 to $49,999 | 11 (44.0%) | 5 (19.2%) |
| $50,000 to $74,999 | 6 (24.0%) | 7 (26.9%) |
| $75,000 to $99,999 | 0 (0.0%) | 3 (11.5%) |
| $100,000 to $149,999 | 0 (0.0%) | 2 (7.7%) |
| $150,000 or more | 0 (0.0%) | 0 (0.0%) |
| Total | 25 (100.0%) | 26 (100.0%) |
Property Value to Household Income Ratio in Falling Spring
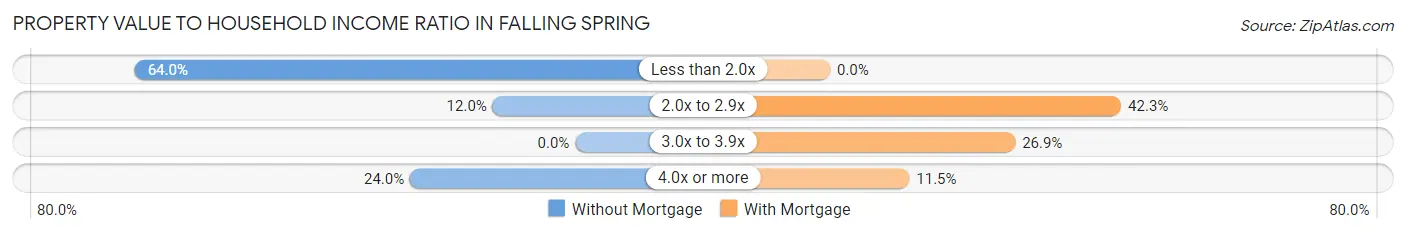
| Value-to-Income Ratio | Without Mortgage | With Mortgage |
| Less than 2.0x | 16 (64.0%) | 0 (0.0%) |
| 2.0x to 2.9x | 3 (12.0%) | 11 (42.3%) |
| 3.0x to 3.9x | 0 (0.0%) | 7 (26.9%) |
| 4.0x or more | 6 (24.0%) | 3 (11.5%) |
| Total | 25 (100.0%) | 26 (100.0%) |
Real Estate Taxes by Mortgage Status in Falling Spring
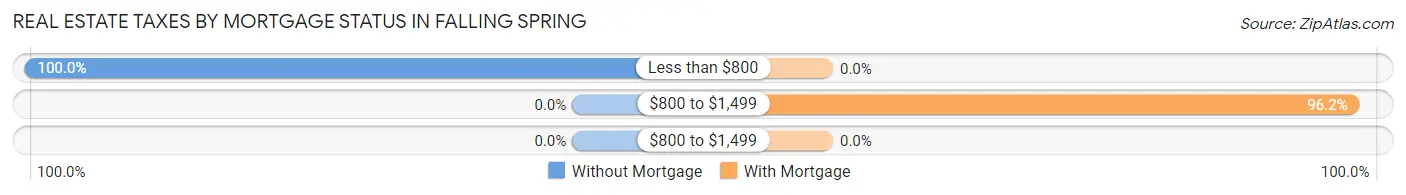
| Property Taxes | Without Mortgage | With Mortgage |
| Less than $800 | 25 (100.0%) | 0 (0.0%) |
| $800 to $1,499 | 0 (0.0%) | 25 (96.2%) |
| $800 to $1,499 | 0 (0.0%) | 0 (0.0%) |
| Total | 25 (100.0%) | 26 (100.0%) |
Health & Disability in Falling Spring
Health Insurance Coverage by Age in Falling Spring
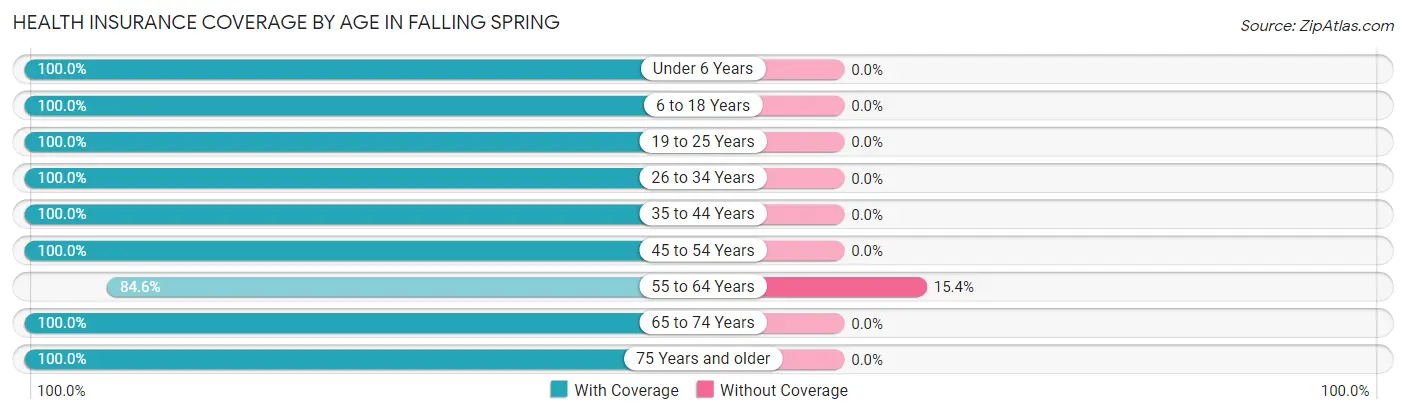
| Age Bracket | With Coverage | Without Coverage |
| Under 6 Years | 4 (100.0%) | 0 (0.0%) |
| 6 to 18 Years | 15 (100.0%) | 0 (0.0%) |
| 19 to 25 Years | 3 (100.0%) | 0 (0.0%) |
| 26 to 34 Years | 2 (100.0%) | 0 (0.0%) |
| 35 to 44 Years | 6 (100.0%) | 0 (0.0%) |
| 45 to 54 Years | 29 (100.0%) | 0 (0.0%) |
| 55 to 64 Years | 33 (84.6%) | 6 (15.4%) |
| 65 to 74 Years | 19 (100.0%) | 0 (0.0%) |
| 75 Years and older | 7 (100.0%) | 0 (0.0%) |
| Total | 118 (95.2%) | 6 (4.8%) |
Health Insurance Coverage by Citizenship Status in Falling Spring
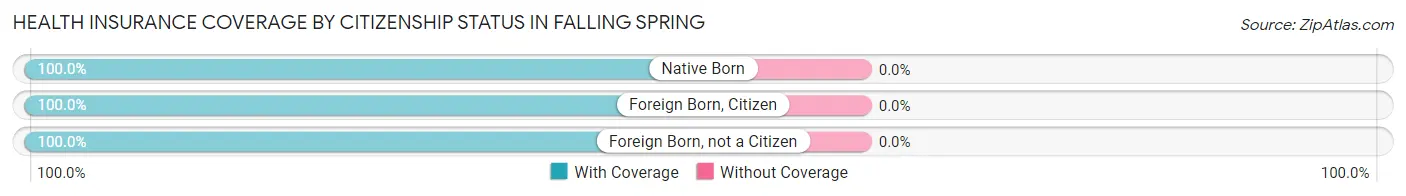
| Citizenship Status | With Coverage | Without Coverage |
| Native Born | 4 (100.0%) | 0 (0.0%) |
| Foreign Born, Citizen | 15 (100.0%) | 0 (0.0%) |
| Foreign Born, not a Citizen | 3 (100.0%) | 0 (0.0%) |
Health Insurance Coverage by Household Income in Falling Spring
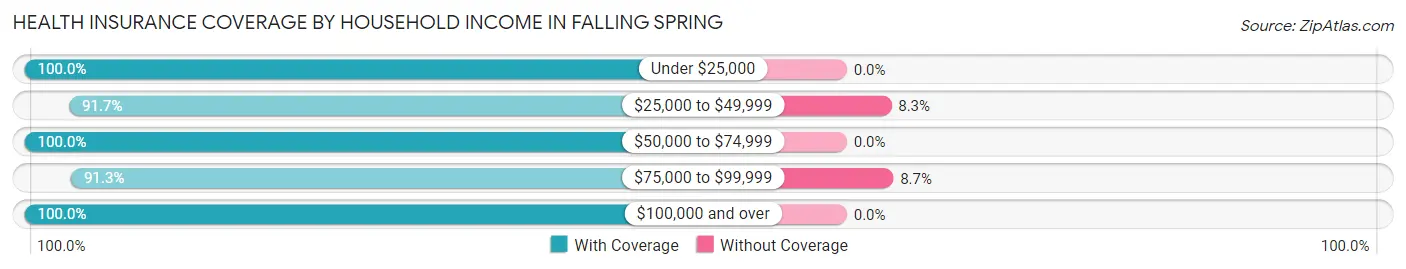
| Household Income | With Coverage | Without Coverage |
| Under $25,000 | 10 (100.0%) | 0 (0.0%) |
| $25,000 to $49,999 | 44 (91.7%) | 4 (8.3%) |
| $50,000 to $74,999 | 15 (100.0%) | 0 (0.0%) |
| $75,000 to $99,999 | 21 (91.3%) | 2 (8.7%) |
| $100,000 and over | 28 (100.0%) | 0 (0.0%) |
Public vs Private Health Insurance Coverage by Age in Falling Spring
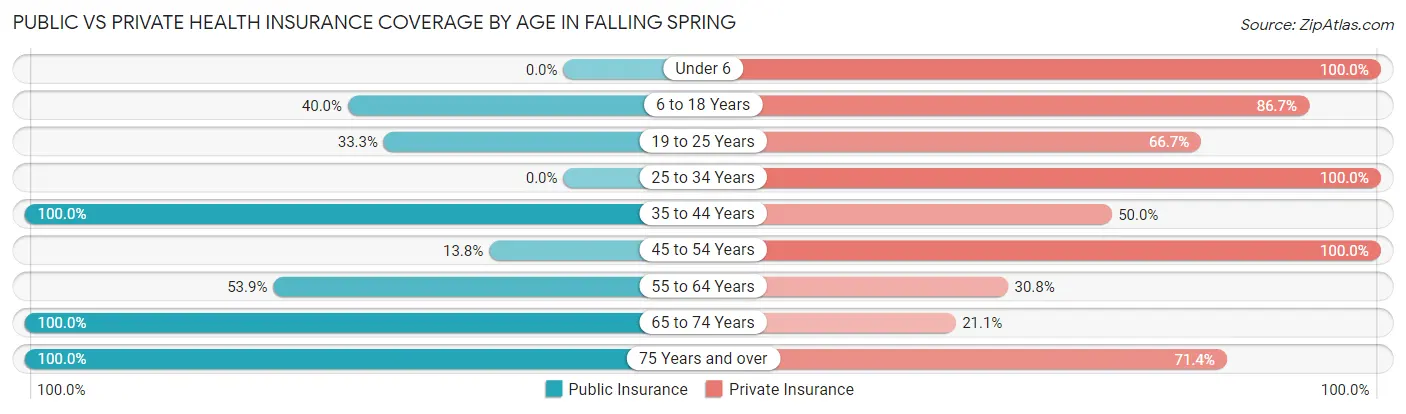
| Age Bracket | Public Insurance | Private Insurance |
| Under 6 | 0 (0.0%) | 4 (100.0%) |
| 6 to 18 Years | 6 (40.0%) | 13 (86.7%) |
| 19 to 25 Years | 1 (33.3%) | 2 (66.7%) |
| 25 to 34 Years | 0 (0.0%) | 2 (100.0%) |
| 35 to 44 Years | 6 (100.0%) | 3 (50.0%) |
| 45 to 54 Years | 4 (13.8%) | 29 (100.0%) |
| 55 to 64 Years | 21 (53.8%) | 12 (30.8%) |
| 65 to 74 Years | 19 (100.0%) | 4 (21.0%) |
| 75 Years and over | 7 (100.0%) | 5 (71.4%) |
| Total | 64 (51.6%) | 74 (59.7%) |
Disability Status by Sex by Age in Falling Spring
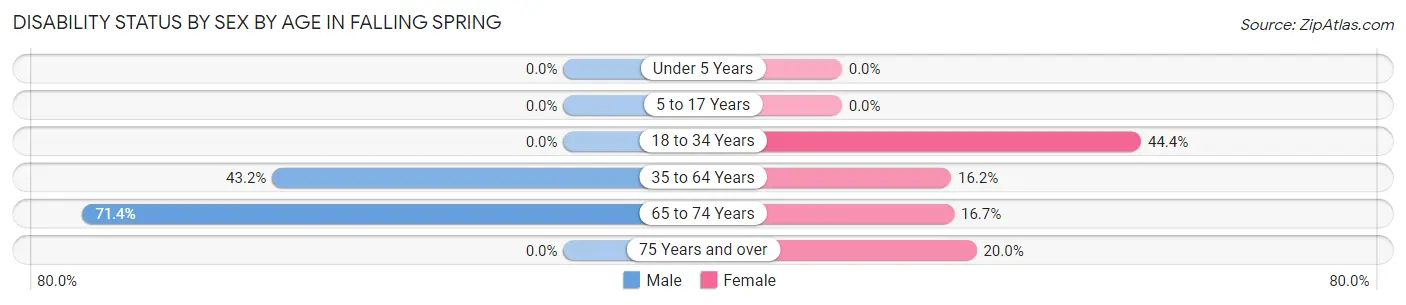
| Age Bracket | Male | Female |
| Under 5 Years | 0 (0.0%) | 0 (0.0%) |
| 5 to 17 Years | 0 (0.0%) | 0 (0.0%) |
| 18 to 34 Years | 0 (0.0%) | 4 (44.4%) |
| 35 to 64 Years | 16 (43.2%) | 6 (16.2%) |
| 65 to 74 Years | 5 (71.4%) | 2 (16.7%) |
| 75 Years and over | 0 (0.0%) | 1 (20.0%) |
Disability Class by Sex by Age in Falling Spring
Disability Class: Hearing Difficulty
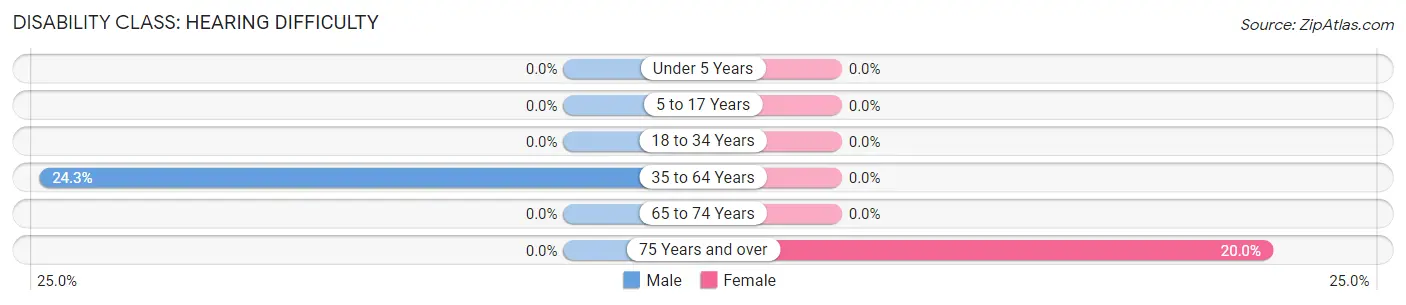
| Age Bracket | Male | Female |
| Under 5 Years | 0 (0.0%) | 0 (0.0%) |
| 5 to 17 Years | 0 (0.0%) | 0 (0.0%) |
| 18 to 34 Years | 0 (0.0%) | 0 (0.0%) |
| 35 to 64 Years | 9 (24.3%) | 0 (0.0%) |
| 65 to 74 Years | 0 (0.0%) | 0 (0.0%) |
| 75 Years and over | 0 (0.0%) | 1 (20.0%) |
Disability Class: Vision Difficulty
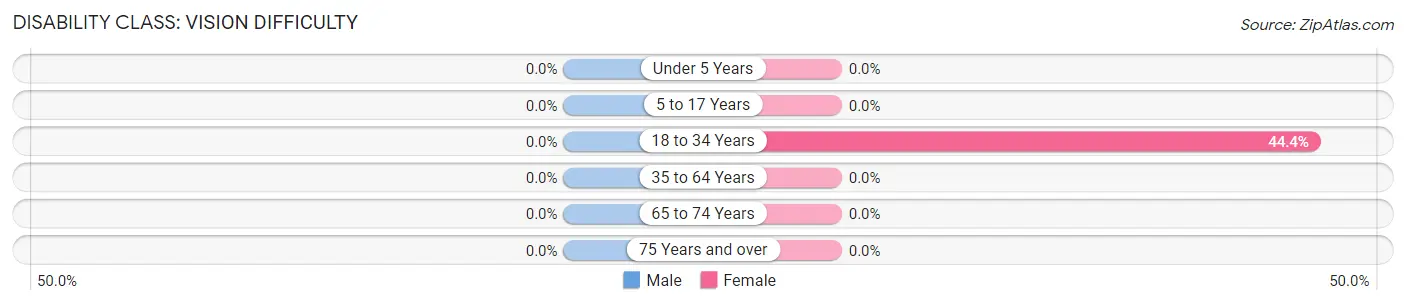
| Age Bracket | Male | Female |
| Under 5 Years | 0 (0.0%) | 0 (0.0%) |
| 5 to 17 Years | 0 (0.0%) | 0 (0.0%) |
| 18 to 34 Years | 0 (0.0%) | 4 (44.4%) |
| 35 to 64 Years | 0 (0.0%) | 0 (0.0%) |
| 65 to 74 Years | 0 (0.0%) | 0 (0.0%) |
| 75 Years and over | 0 (0.0%) | 0 (0.0%) |
Disability Class: Cognitive Difficulty
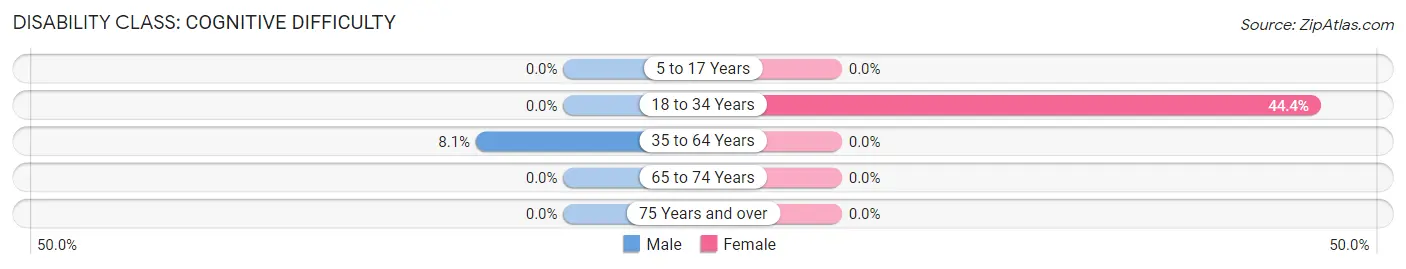
| Age Bracket | Male | Female |
| 5 to 17 Years | 0 (0.0%) | 0 (0.0%) |
| 18 to 34 Years | 0 (0.0%) | 4 (44.4%) |
| 35 to 64 Years | 3 (8.1%) | 0 (0.0%) |
| 65 to 74 Years | 0 (0.0%) | 0 (0.0%) |
| 75 Years and over | 0 (0.0%) | 0 (0.0%) |
Disability Class: Ambulatory Difficulty
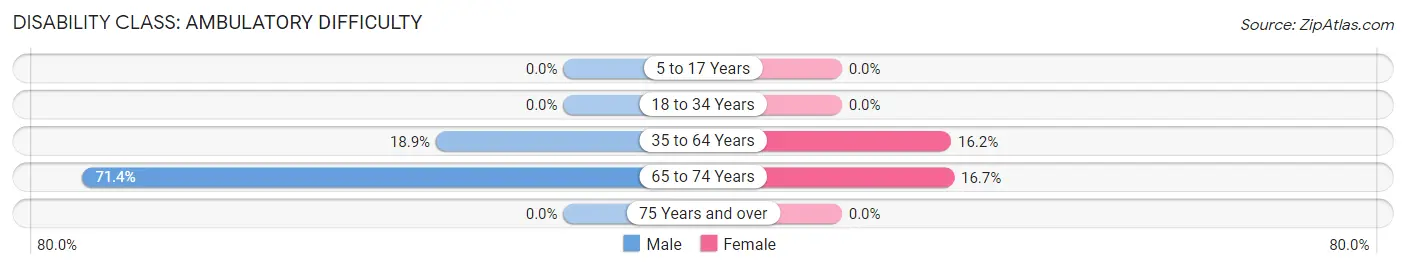
| Age Bracket | Male | Female |
| 5 to 17 Years | 0 (0.0%) | 0 (0.0%) |
| 18 to 34 Years | 0 (0.0%) | 0 (0.0%) |
| 35 to 64 Years | 7 (18.9%) | 6 (16.2%) |
| 65 to 74 Years | 5 (71.4%) | 2 (16.7%) |
| 75 Years and over | 0 (0.0%) | 0 (0.0%) |
Disability Class: Self-Care Difficulty
| Age Bracket | Male | Female |
| 5 to 17 Years | 0 (0.0%) | 0 (0.0%) |
| 18 to 34 Years | 0 (0.0%) | 0 (0.0%) |
| 35 to 64 Years | 0 (0.0%) | 0 (0.0%) |
| 65 to 74 Years | 0 (0.0%) | 0 (0.0%) |
| 75 Years and over | 0 (0.0%) | 0 (0.0%) |
Technology Access in Falling Spring
Computing Device Access in Falling Spring
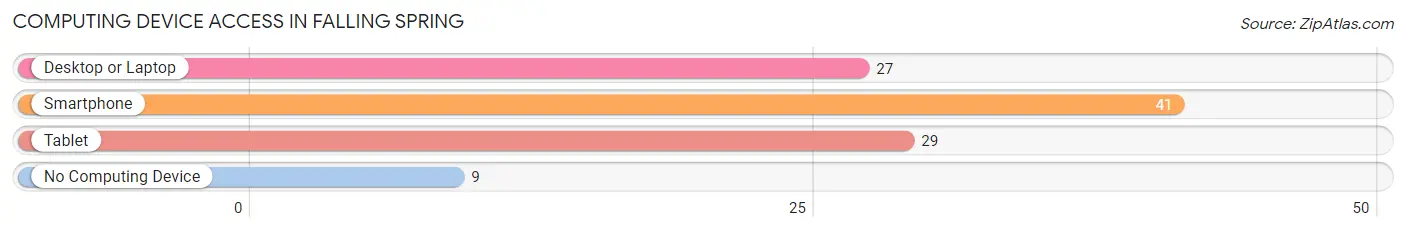
| Device Type | # Households | % Households |
| Desktop or Laptop | 27 | 47.4% |
| Smartphone | 41 | 71.9% |
| Tablet | 29 | 50.9% |
| No Computing Device | 9 | 15.8% |
| Total | 57 | 100.0% |
Internet Access in Falling Spring
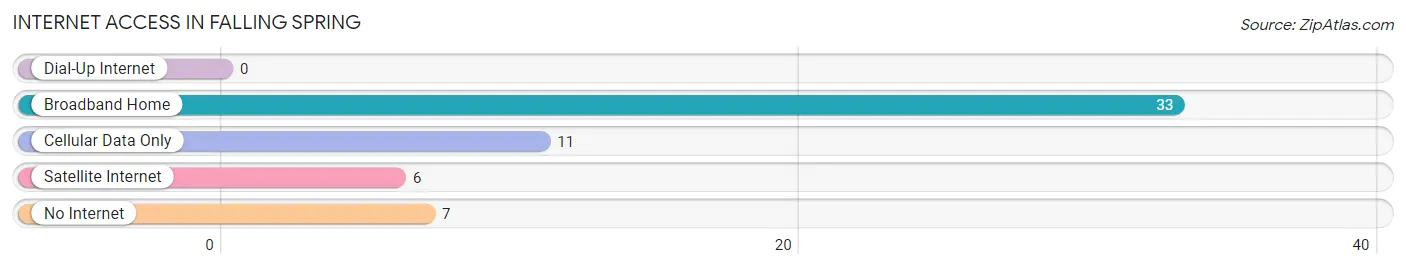
| Internet Type | # Households | % Households |
| Dial-Up Internet | 0 | 0.0% |
| Broadband Home | 33 | 57.9% |
| Cellular Data Only | 11 | 19.3% |
| Satellite Internet | 6 | 10.5% |
| No Internet | 7 | 12.3% |
| Total | 57 | 100.0% |
Falling Spring Summary
Falling Spring is a small unincorporated community located in the eastern panhandle of West Virginia. It is situated in the northern part of Berkeley County, near the Potomac River. The community is located approximately 10 miles south of Martinsburg, the county seat. Falling Spring is a rural area with a population of approximately 1,000 people.
History
Falling Spring was first settled in the late 1700s by German immigrants. The community was named after a nearby waterfall, which was known as the “Falling Spring”. The area was primarily used for farming and the production of timber. In the early 1800s, the community began to grow and develop. The first post office was established in 1820 and the first school was built in 1825.
In the late 1800s, the area began to experience a period of industrialization. The Baltimore and Ohio Railroad was built through the area in 1872, connecting Falling Spring to the larger cities of the region. This allowed for the transportation of goods and services, which helped to spur economic growth in the area.
In the early 1900s, the area experienced a period of population growth. This was due to the influx of new immigrants from Europe, as well as the growth of the railroad industry. The population of Falling Spring peaked in the 1950s, with a population of over 1,500 people.
Geography
Falling Spring is located in the northern part of Berkeley County, near the Potomac River. The community is situated in a rural area, with rolling hills and forests. The area is known for its scenic beauty and is a popular destination for outdoor recreation.
The climate in Falling Spring is temperate, with hot summers and cold winters. The average annual temperature is around 50 degrees Fahrenheit. The area receives an average of 40 inches of precipitation per year.
Economy
Falling Spring is a rural area with a small economy. The primary industries in the area are agriculture and timber production. The area is also home to several small businesses, including restaurants, retail stores, and service providers.
The area is also home to several large employers, including the Berkeley County School System, the Berkeley County Sheriff’s Office, and the Berkeley County Health Department. The area is also home to several manufacturing companies, including the Berkeley County Glass Company and the Berkeley County Paper Company.
Demographics
As of the 2010 census, the population of Falling Spring was 1,000 people. The racial makeup of the area was 94.2% White, 2.7% African American, 0.3% Native American, 0.3% Asian, and 2.5% from other races. The median household income in the area was $41,250.
Falling Spring is a small, rural community with a diverse population. The area is home to a variety of cultures and backgrounds, which makes it a unique and interesting place to live. The area is known for its scenic beauty and is a popular destination for outdoor recreation.
Common Questions
What is Per Capita Income in Falling Spring?
Per Capita income in Falling Spring is $32,569.
What is the Median Family Income in Falling Spring?
Median Family Income in Falling Spring is $47,500.
What is the Median Household income in Falling Spring?
Median Household Income in Falling Spring is $42,321.
What is Income or Wage Gap in Falling Spring?
Income or Wage Gap in Falling Spring is 48.9%.
Women in Falling Spring earn 51.1 cents for every dollar earned by a man.
What is Inequality or Gini Index in Falling Spring?
Inequality or Gini Index in Falling Spring is 0.43.
What is the Total Population of Falling Spring?
Total Population of Falling Spring is 124.
What is the Total Male Population of Falling Spring?
Total Male Population of Falling Spring is 55.
What is the Total Female Population of Falling Spring?
Total Female Population of Falling Spring is 69.
What is the Ratio of Males per 100 Females in Falling Spring?
There are 79.71 Males per 100 Females in Falling Spring.
What is the Ratio of Females per 100 Males in Falling Spring?
There are 125.45 Females per 100 Males in Falling Spring.
What is the Median Population Age in Falling Spring?
Median Population Age in Falling Spring is 56.3 Years.
What is the Average Family Size in Falling Spring
Average Family Size in Falling Spring is 2.6 People.
What is the Average Household Size in Falling Spring
Average Household Size in Falling Spring is 2.2 People.
How Large is the Labor Force in Falling Spring?
There are 60 People in the Labor Forcein in Falling Spring.
What is the Percentage of People in the Labor Force in Falling Spring?
55.0% of People are in the Labor Force in Falling Spring.