Cross Lanes, WV Map & Demographics
Cross Lanes Map
Cross Lanes Overview
$34,779
PER CAPITA INCOME
$76,250
AVG FAMILY INCOME
$58,696
AVG HOUSEHOLD INCOME
26.7%
WAGE / INCOME GAP [ % ]
73.3¢/ $1
WAGE / INCOME GAP [ $ ]
$11,841
FAMILY INCOME DEFICIT
0.38
INEQUALITY / GINI INDEX
10,037
TOTAL POPULATION
4,950
MALE POPULATION
5,087
FEMALE POPULATION
97.31
MALES / 100 FEMALES
102.77
FEMALES / 100 MALES
43.9
MEDIAN AGE
2.7
AVG FAMILY SIZE
2.2
AVG HOUSEHOLD SIZE
5,350
LABOR FORCE [ PEOPLE ]
62.7%
PERCENT IN LABOR FORCE
5.2%
UNEMPLOYMENT RATE
Cross Lanes Area Codes
Income in Cross Lanes
Income Overview in Cross Lanes
Per Capita Income in Cross Lanes is $34,779, while median incomes of families and households are $76,250 and $58,696 respectively.
| Characteristic | Number | Measure |
| Per Capita Income | 10,037 | $34,779 |
| Median Family Income | 3,018 | $76,250 |
| Mean Family Income | 3,018 | $89,889 |
| Median Household Income | 4,626 | $58,696 |
| Mean Household Income | 4,626 | $77,205 |
| Income Deficit | 3,018 | $11,841 |
| Wage / Income Gap (%) | 10,037 | 26.69% |
| Wage / Income Gap ($) | 10,037 | 73.31¢ per $1 |
| Gini / Inequality Index | 10,037 | 0.38 |
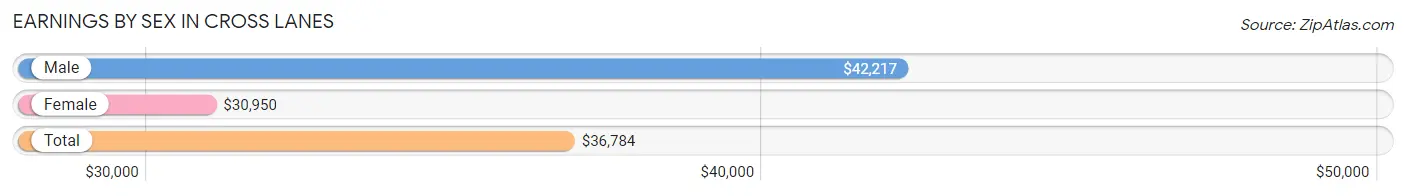
Earnings by Sex in Cross Lanes
Average Earnings in Cross Lanes are $36,784, $42,217 for men and $30,950 for women, a difference of 26.7%.
| Sex | Number | Average Earnings |
| Male | 2,691 (49.1%) | $42,217 |
| Female | 2,794 (50.9%) | $30,950 |
| Total | 5,485 (100.0%) | $36,784 |
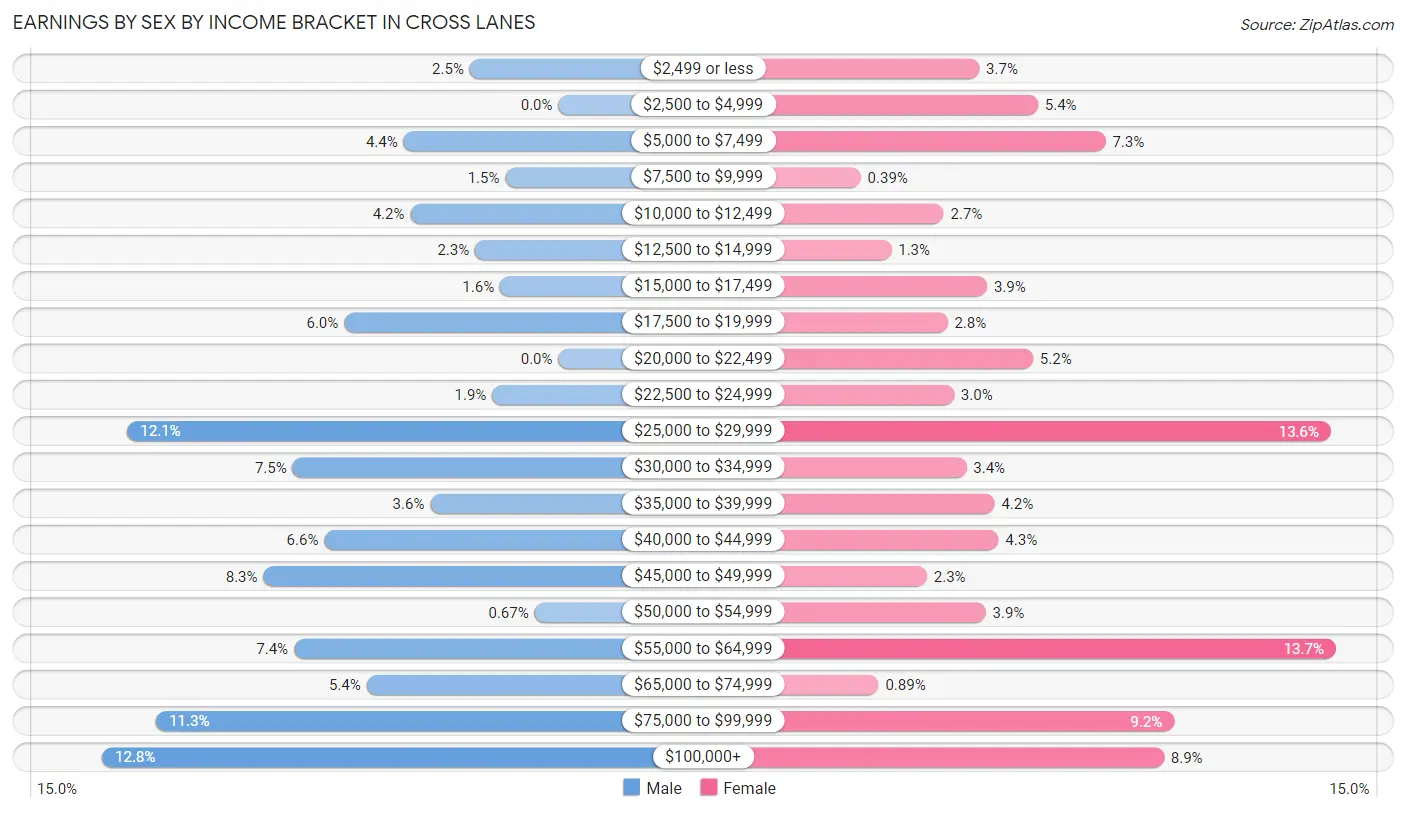
Earnings by Sex by Income Bracket in Cross Lanes
The most common earnings brackets in Cross Lanes are $100,000+ for men (345 | 12.8%) and $55,000 to $64,999 for women (384 | 13.7%).
| Income | Male | Female |
| $2,499 or less | 67 (2.5%) | 104 (3.7%) |
| $2,500 to $4,999 | 0 (0.0%) | 150 (5.4%) |
| $5,000 to $7,499 | 117 (4.3%) | 203 (7.3%) |
| $7,500 to $9,999 | 40 (1.5%) | 11 (0.4%) |
| $10,000 to $12,499 | 112 (4.2%) | 76 (2.7%) |
| $12,500 to $14,999 | 63 (2.3%) | 35 (1.3%) |
| $15,000 to $17,499 | 44 (1.6%) | 110 (3.9%) |
| $17,500 to $19,999 | 162 (6.0%) | 79 (2.8%) |
| $20,000 to $22,499 | 0 (0.0%) | 146 (5.2%) |
| $22,500 to $24,999 | 50 (1.9%) | 84 (3.0%) |
| $25,000 to $29,999 | 326 (12.1%) | 380 (13.6%) |
| $30,000 to $34,999 | 201 (7.5%) | 94 (3.4%) |
| $35,000 to $39,999 | 97 (3.6%) | 116 (4.2%) |
| $40,000 to $44,999 | 177 (6.6%) | 119 (4.3%) |
| $45,000 to $49,999 | 223 (8.3%) | 63 (2.2%) |
| $50,000 to $54,999 | 18 (0.7%) | 109 (3.9%) |
| $55,000 to $64,999 | 200 (7.4%) | 384 (13.7%) |
| $65,000 to $74,999 | 145 (5.4%) | 25 (0.9%) |
| $75,000 to $99,999 | 304 (11.3%) | 257 (9.2%) |
| $100,000+ | 345 (12.8%) | 249 (8.9%) |
| Total | 2,691 (100.0%) | 2,794 (100.0%) |
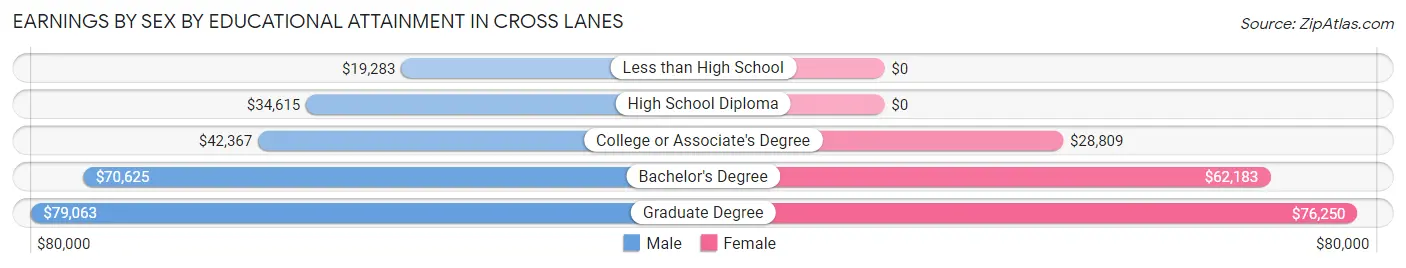
Earnings by Sex by Educational Attainment in Cross Lanes
Average earnings in Cross Lanes are $45,705 for men and $37,484 for women, a difference of 18.0%. Men with an educational attainment of graduate degree enjoy the highest average annual earnings of $79,063, while those with less than high school education earn the least with $19,283. Women with an educational attainment of graduate degree earn the most with the average annual earnings of $76,250, while those with college or associate's degree education have the smallest earnings of $28,809.
| Educational Attainment | Male Income | Female Income |
| Less than High School | $19,283 | $0 |
| High School Diploma | $34,615 | $0 |
| College or Associate's Degree | $42,367 | $28,809 |
| Bachelor's Degree | $70,625 | $62,183 |
| Graduate Degree | $79,063 | $76,250 |
| Total | $45,705 | $37,484 |
Family Income in Cross Lanes
Family Income Brackets in Cross Lanes
According to the Cross Lanes family income data, there are 857 families falling into the $50,000 to $74,999 income range, which is the most common income bracket and makes up 28.4% of all families. Conversely, the $10,000 to $14,999 income bracket is the least frequent group with only 24 families (0.8%) belonging to this category.
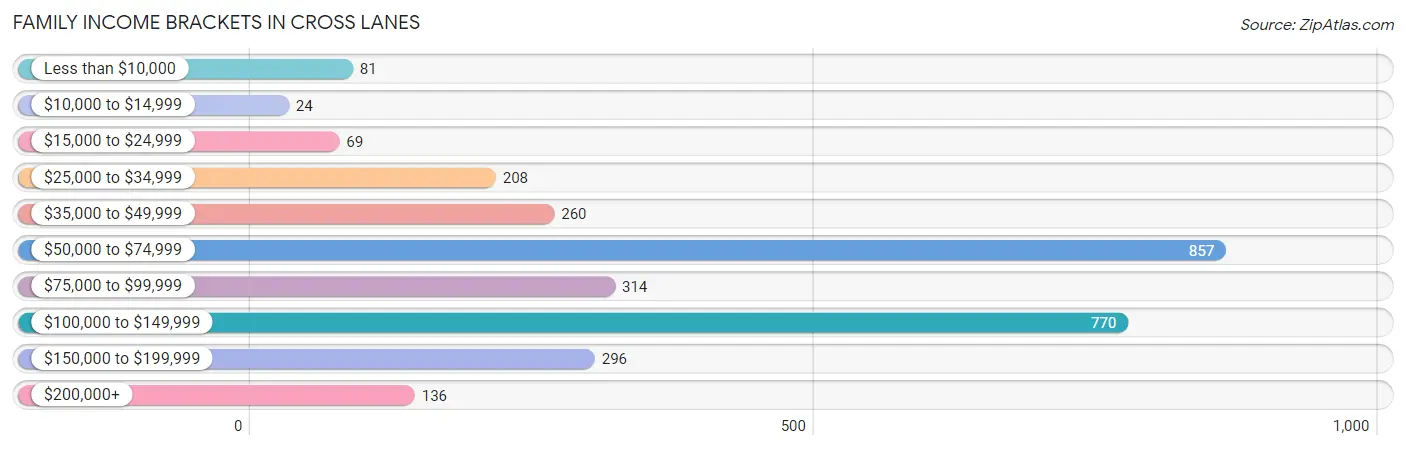
| Income Bracket | # Families | % Families |
| Less than $10,000 | 81 | 2.7% |
| $10,000 to $14,999 | 24 | 0.8% |
| $15,000 to $24,999 | 69 | 2.3% |
| $25,000 to $34,999 | 208 | 6.9% |
| $35,000 to $49,999 | 260 | 8.6% |
| $50,000 to $74,999 | 857 | 28.4% |
| $75,000 to $99,999 | 314 | 10.4% |
| $100,000 to $149,999 | 770 | 25.5% |
| $150,000 to $199,999 | 296 | 9.8% |
| $200,000+ | 136 | 4.5% |
Family Income by Famaliy Size in Cross Lanes
5-person families (81 | 2.7%) account for the highest median family income in Cross Lanes with $110,844 per family, while 2-person families (1,551 | 51.4%) have the highest median income of $35,625 per family member.
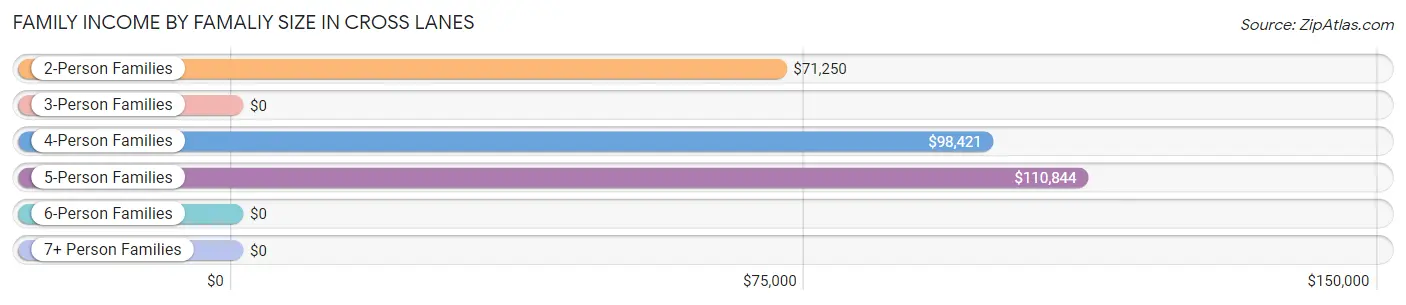
| Income Bracket | # Families | Median Income |
| 2-Person Families | 1,551 (51.4%) | $71,250 |
| 3-Person Families | 937 (31.0%) | $0 |
| 4-Person Families | 400 (13.3%) | $98,421 |
| 5-Person Families | 81 (2.7%) | $110,844 |
| 6-Person Families | 0 (0.0%) | $0 |
| 7+ Person Families | 49 (1.6%) | $0 |
| Total | 3,018 (100.0%) | $76,250 |
Family Income by Number of Earners in Cross Lanes
The median family income in Cross Lanes is $76,250, with families comprising 3+ earners (127) having the highest median family income of $170,685, while families with no earners (713) have the lowest median family income of $54,047, accounting for 4.2% and 23.6% of families, respectively.
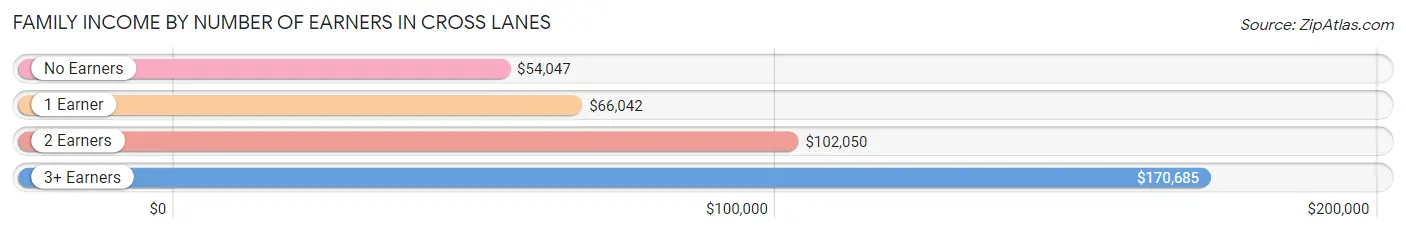
| Number of Earners | # Families | Median Income |
| No Earners | 713 (23.6%) | $54,047 |
| 1 Earner | 451 (14.9%) | $66,042 |
| 2 Earners | 1,727 (57.2%) | $102,050 |
| 3+ Earners | 127 (4.2%) | $170,685 |
| Total | 3,018 (100.0%) | $76,250 |
Household Income in Cross Lanes
Household Income Brackets in Cross Lanes
With 1,263 households falling in the category, the $50,000 to $74,999 income range is the most frequent in Cross Lanes, accounting for 27.3% of all households. In contrast, only 97 households (2.1%) fall into the less than $10,000 income bracket, making it the least populous group.
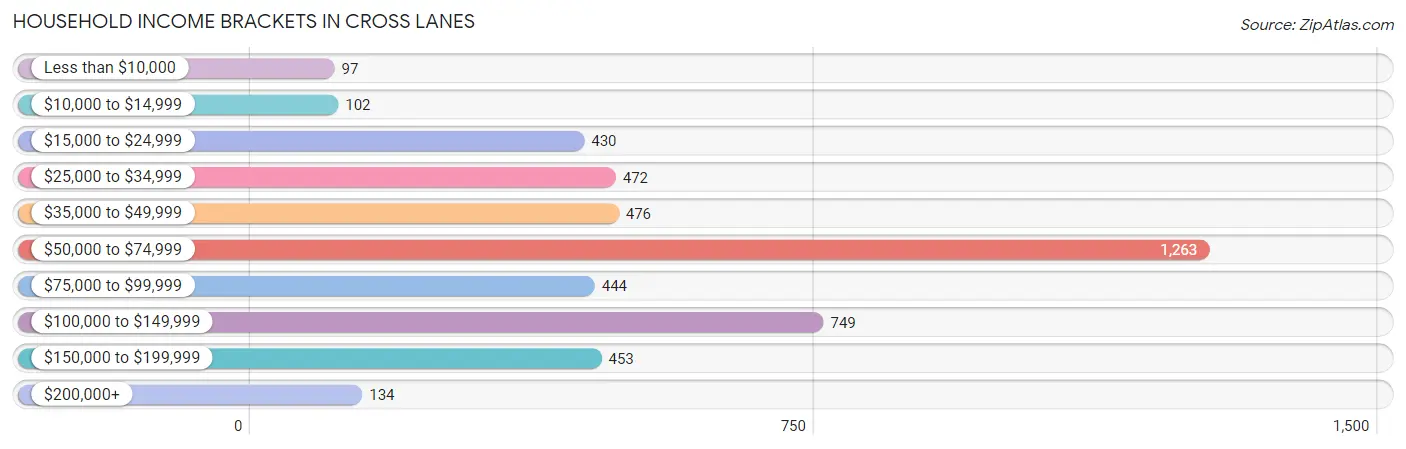
| Income Bracket | # Households | % Households |
| Less than $10,000 | 97 | 2.1% |
| $10,000 to $14,999 | 102 | 2.2% |
| $15,000 to $24,999 | 430 | 9.3% |
| $25,000 to $34,999 | 472 | 10.2% |
| $35,000 to $49,999 | 476 | 10.3% |
| $50,000 to $74,999 | 1,263 | 27.3% |
| $75,000 to $99,999 | 444 | 9.6% |
| $100,000 to $149,999 | 749 | 16.2% |
| $150,000 to $199,999 | 453 | 9.8% |
| $200,000+ | 134 | 2.9% |
Household Income by Householder Age in Cross Lanes
The median household income in Cross Lanes is $58,696, with the highest median household income of $91,250 found in the 25 to 44 years age bracket for the primary householder. A total of 1,276 households (27.6%) fall into this category. Meanwhile, the 15 to 24 years age bracket for the primary householder has the lowest median household income of $0, with 202 households (4.4%) in this group.
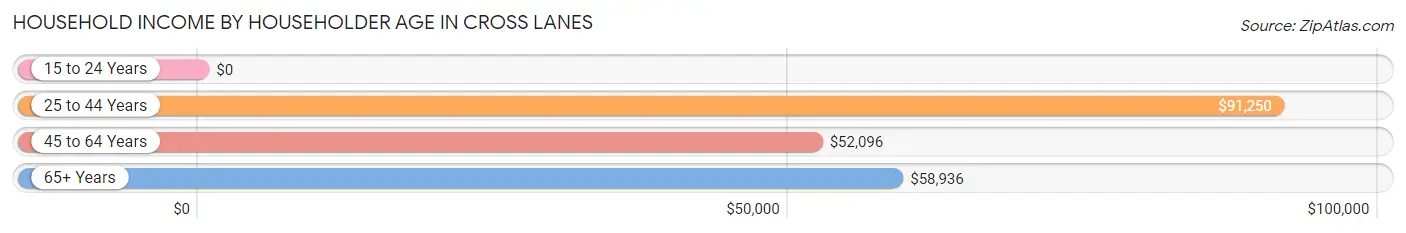
| Income Bracket | # Households | Median Income |
| 15 to 24 Years | 202 (4.4%) | $0 |
| 25 to 44 Years | 1,276 (27.6%) | $91,250 |
| 45 to 64 Years | 1,817 (39.3%) | $52,096 |
| 65+ Years | 1,331 (28.8%) | $58,936 |
| Total | 4,626 (100.0%) | $58,696 |
Poverty in Cross Lanes
Income Below Poverty by Sex and Age in Cross Lanes
With 5.7% poverty level for males and 9.7% for females among the residents of Cross Lanes, 18 to 24 year old males and 25 to 34 year old females are the most vulnerable to poverty, with 59 males (16.9%) and 126 females (17.7%) in their respective age groups living below the poverty level.
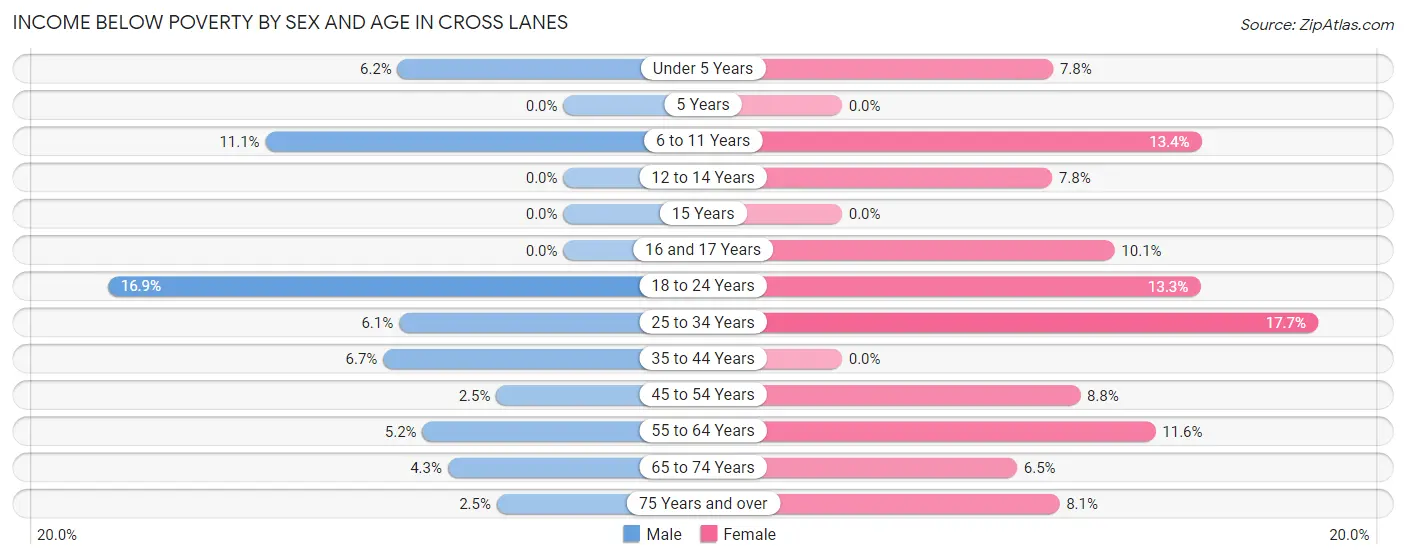
| Age Bracket | Male | Female |
| Under 5 Years | 23 (6.1%) | 20 (7.8%) |
| 5 Years | 0 (0.0%) | 0 (0.0%) |
| 6 to 11 Years | 23 (11.1%) | 43 (13.4%) |
| 12 to 14 Years | 0 (0.0%) | 11 (7.8%) |
| 15 Years | 0 (0.0%) | 0 (0.0%) |
| 16 and 17 Years | 0 (0.0%) | 17 (10.1%) |
| 18 to 24 Years | 59 (16.9%) | 50 (13.3%) |
| 25 to 34 Years | 48 (6.1%) | 126 (17.7%) |
| 35 to 44 Years | 47 (6.7%) | 0 (0.0%) |
| 45 to 54 Years | 19 (2.5%) | 78 (8.8%) |
| 55 to 64 Years | 29 (5.2%) | 74 (11.6%) |
| 65 to 74 Years | 30 (4.3%) | 50 (6.5%) |
| 75 Years and over | 6 (2.5%) | 26 (8.1%) |
| Total | 284 (5.7%) | 495 (9.7%) |
Income Above Poverty by Sex and Age in Cross Lanes
According to the poverty statistics in Cross Lanes, males aged 5 years and females aged 5 years are the age groups that are most secure financially, with 100.0% of males and 100.0% of females in these age groups living above the poverty line.
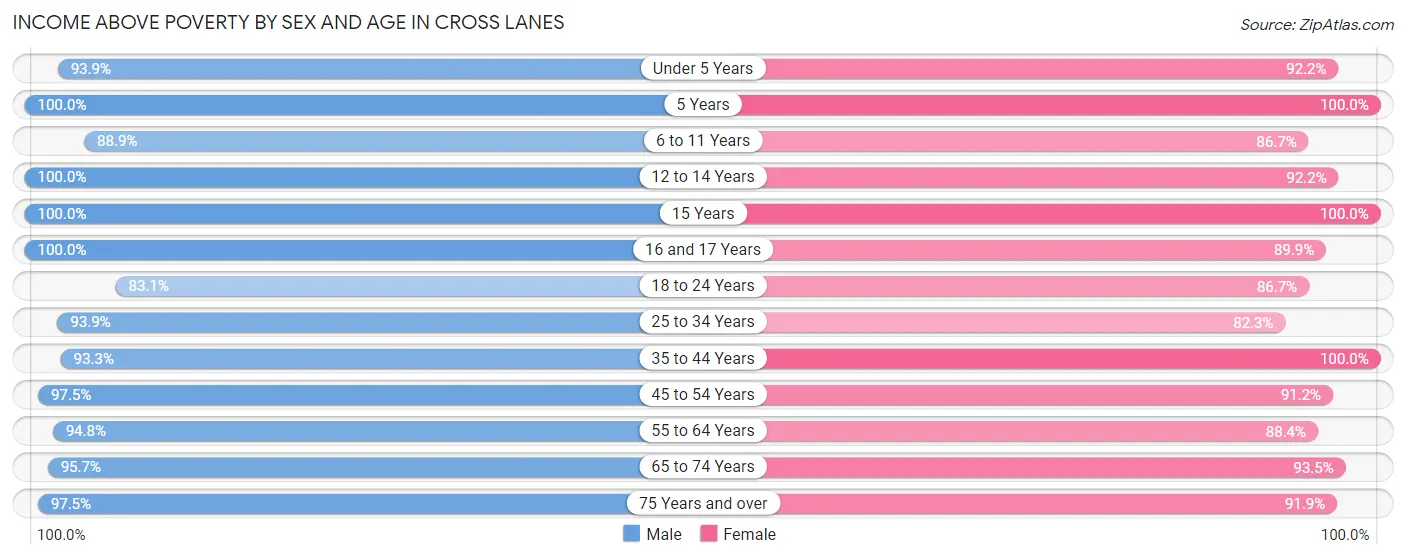
| Age Bracket | Male | Female |
| Under 5 Years | 351 (93.9%) | 235 (92.2%) |
| 5 Years | 54 (100.0%) | 19 (100.0%) |
| 6 to 11 Years | 185 (88.9%) | 279 (86.7%) |
| 12 to 14 Years | 93 (100.0%) | 130 (92.2%) |
| 15 Years | 29 (100.0%) | 10 (100.0%) |
| 16 and 17 Years | 93 (100.0%) | 151 (89.9%) |
| 18 to 24 Years | 290 (83.1%) | 326 (86.7%) |
| 25 to 34 Years | 739 (93.9%) | 587 (82.3%) |
| 35 to 44 Years | 656 (93.3%) | 474 (100.0%) |
| 45 to 54 Years | 743 (97.5%) | 804 (91.2%) |
| 55 to 64 Years | 526 (94.8%) | 562 (88.4%) |
| 65 to 74 Years | 670 (95.7%) | 719 (93.5%) |
| 75 Years and over | 237 (97.5%) | 296 (91.9%) |
| Total | 4,666 (94.3%) | 4,592 (90.3%) |
Income Below Poverty Among Married-Couple Families in Cross Lanes
The poverty statistics for married-couple families in Cross Lanes show that 2.6% or 70 of the total 2,641 families live below the poverty line. Families with no children have the highest poverty rate of 4.0%, comprising of 70 families. On the other hand, families with 1 or 2 children have the lowest poverty rate of 0.0%, which includes 0 families.
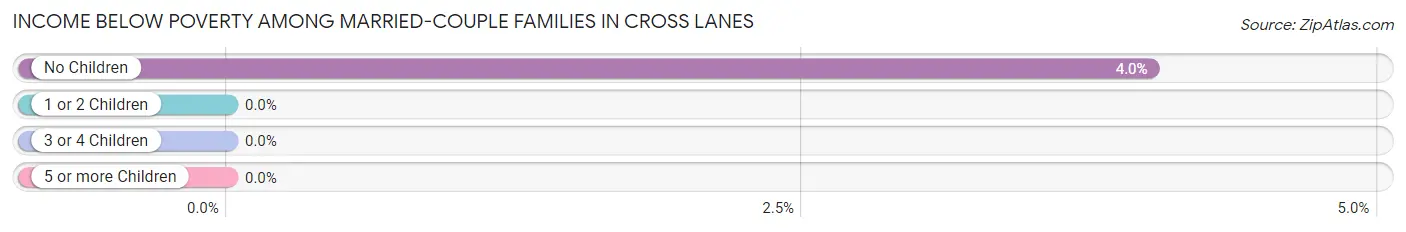
| Children | Above Poverty | Below Poverty |
| No Children | 1,674 (96.0%) | 70 (4.0%) |
| 1 or 2 Children | 781 (100.0%) | 0 (0.0%) |
| 3 or 4 Children | 67 (100.0%) | 0 (0.0%) |
| 5 or more Children | 49 (100.0%) | 0 (0.0%) |
| Total | 2,571 (97.4%) | 70 (2.6%) |
Income Below Poverty Among Single-Parent Households in Cross Lanes
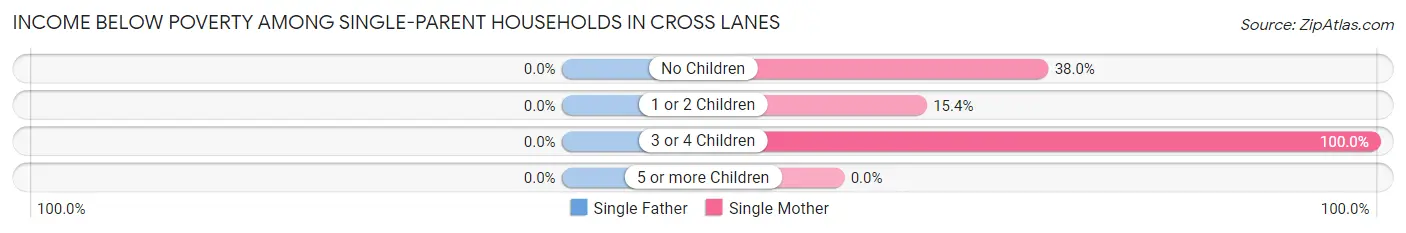
| Children | Single Father | Single Mother |
| No Children | 0 (0.0%) | 57 (38.0%) |
| 1 or 2 Children | 0 (0.0%) | 28 (15.4%) |
| 3 or 4 Children | 0 (0.0%) | 19 (100.0%) |
| 5 or more Children | 0 (0.0%) | 0 (0.0%) |
| Total | 0 (0.0%) | 104 (29.6%) |
Income Below Poverty Among Married-Couple vs Single-Parent Households in Cross Lanes
The poverty data for Cross Lanes shows that 70 of the married-couple family households (2.6%) and 104 of the single-parent households (27.6%) are living below the poverty level. Within the married-couple family households, those with no children have the highest poverty rate, with 70 households (4.0%) falling below the poverty line. Among the single-parent households, those with 3 or 4 children have the highest poverty rate, with 19 household (57.6%) living below poverty.
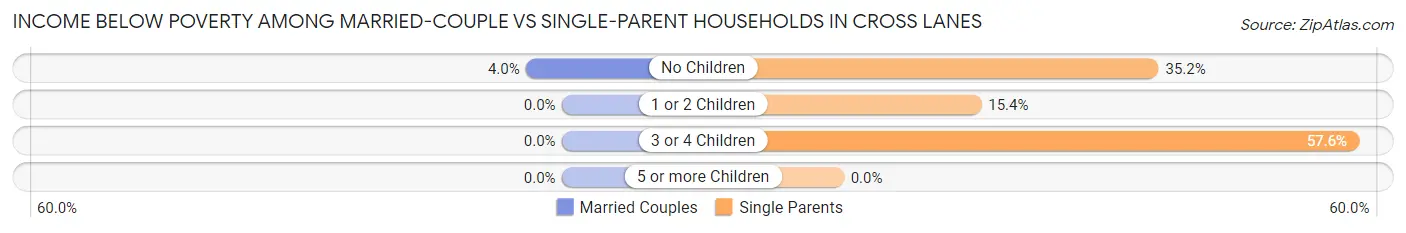
| Children | Married-Couple Families | Single-Parent Households |
| No Children | 70 (4.0%) | 57 (35.2%) |
| 1 or 2 Children | 0 (0.0%) | 28 (15.4%) |
| 3 or 4 Children | 0 (0.0%) | 19 (57.6%) |
| 5 or more Children | 0 (0.0%) | 0 (0.0%) |
| Total | 70 (2.6%) | 104 (27.6%) |
Race in Cross Lanes
The most populous races in Cross Lanes are White / Caucasian (9,404 | 93.7%), Black / African American (341 | 3.4%), and Hispanic or Latino (234 | 2.3%).
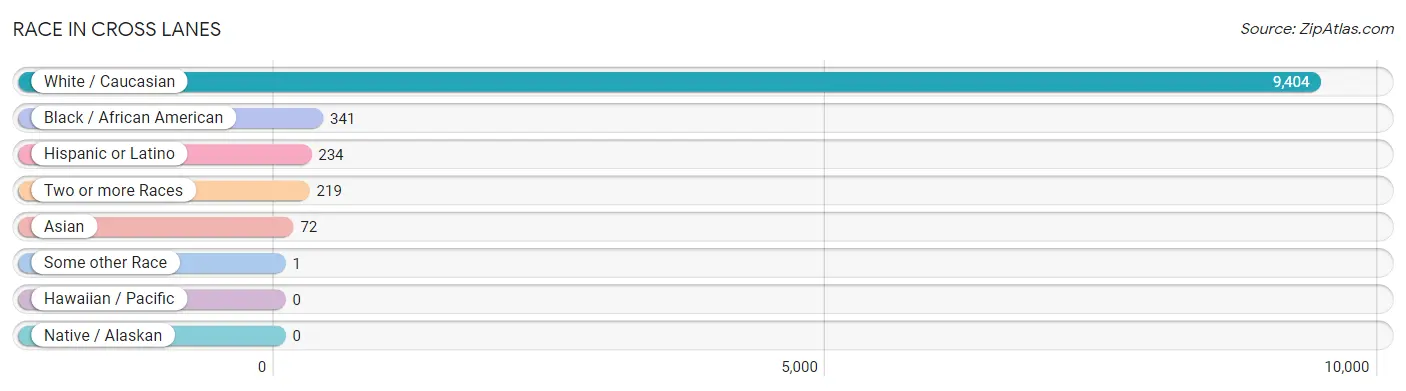
| Race | # Population | % Population |
| Asian | 72 | 0.7% |
| Black / African American | 341 | 3.4% |
| Hawaiian / Pacific | 0 | 0.0% |
| Hispanic or Latino | 234 | 2.3% |
| Native / Alaskan | 0 | 0.0% |
| White / Caucasian | 9,404 | 93.7% |
| Two or more Races | 219 | 2.2% |
| Some other Race | 1 | 0.0% |
| Total | 10,037 | 100.0% |
Ancestry in Cross Lanes
The most populous ancestries reported in Cross Lanes are English (2,232 | 22.2%), German (2,039 | 20.3%), Irish (1,163 | 11.6%), American (935 | 9.3%), and Scottish (259 | 2.6%), together accounting for 66.0% of all Cross Lanes residents.
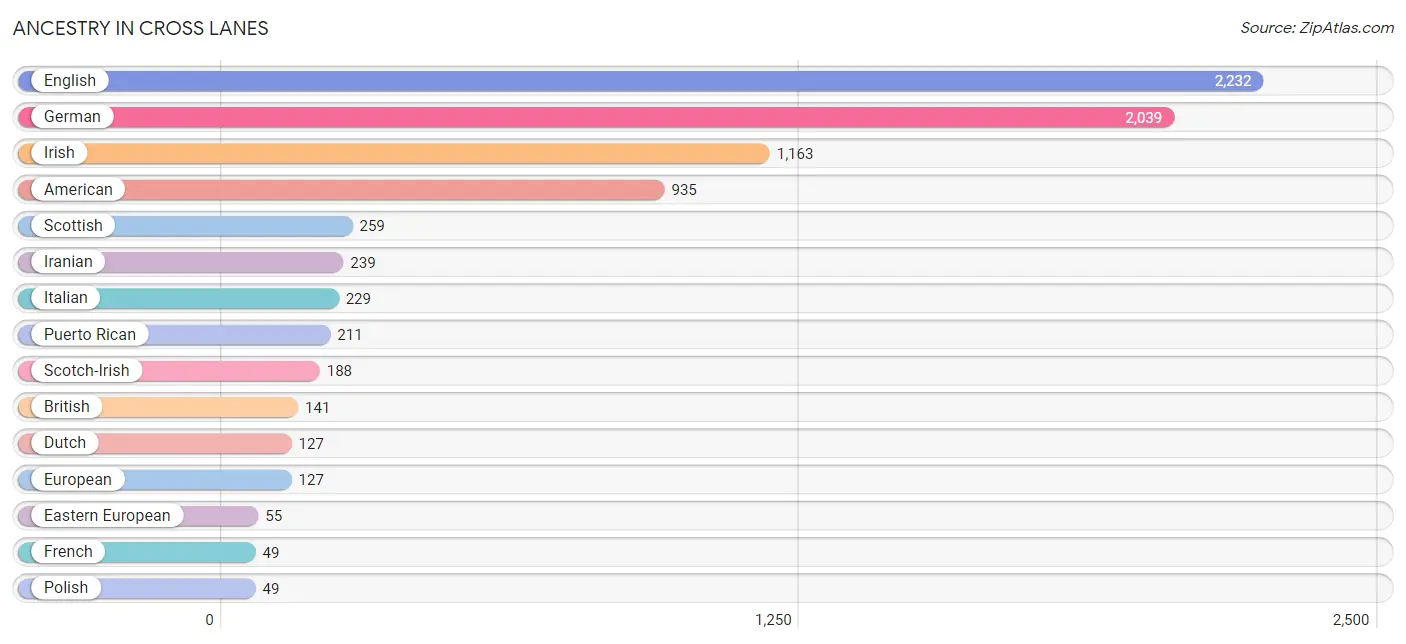
| Ancestry | # Population | % Population |
| African | 11 | 0.1% |
| American | 935 | 9.3% |
| Arab | 27 | 0.3% |
| British | 141 | 1.4% |
| Cherokee | 3 | 0.0% |
| Cuban | 6 | 0.1% |
| Dutch | 127 | 1.3% |
| Eastern European | 55 | 0.5% |
| English | 2,232 | 22.2% |
| European | 127 | 1.3% |
| French | 49 | 0.5% |
| German | 2,039 | 20.3% |
| Haitian | 1 | 0.0% |
| Hungarian | 14 | 0.1% |
| Iranian | 239 | 2.4% |
| Irish | 1,163 | 11.6% |
| Italian | 229 | 2.3% |
| Jamaican | 24 | 0.2% |
| Lebanese | 27 | 0.3% |
| Mexican | 17 | 0.2% |
| Norwegian | 32 | 0.3% |
| Pakistani | 33 | 0.3% |
| Polish | 49 | 0.5% |
| Puerto Rican | 211 | 2.1% |
| Scotch-Irish | 188 | 1.9% |
| Scottish | 259 | 2.6% |
| Subsaharan African | 11 | 0.1% |
| Swedish | 19 | 0.2% |
| Thai | 37 | 0.4% |
| Ukrainian | 21 | 0.2% |
| Welsh | 25 | 0.3% | View All 31 Rows |
Immigrants in Cross Lanes
The most numerous immigrant groups reported in Cross Lanes came from Asia (126 | 1.3%), Eastern Asia (54 | 0.5%), South Central Asia (39 | 0.4%), China (37 | 0.4%), and Africa (35 | 0.4%), together accounting for 2.9% of all Cross Lanes residents.
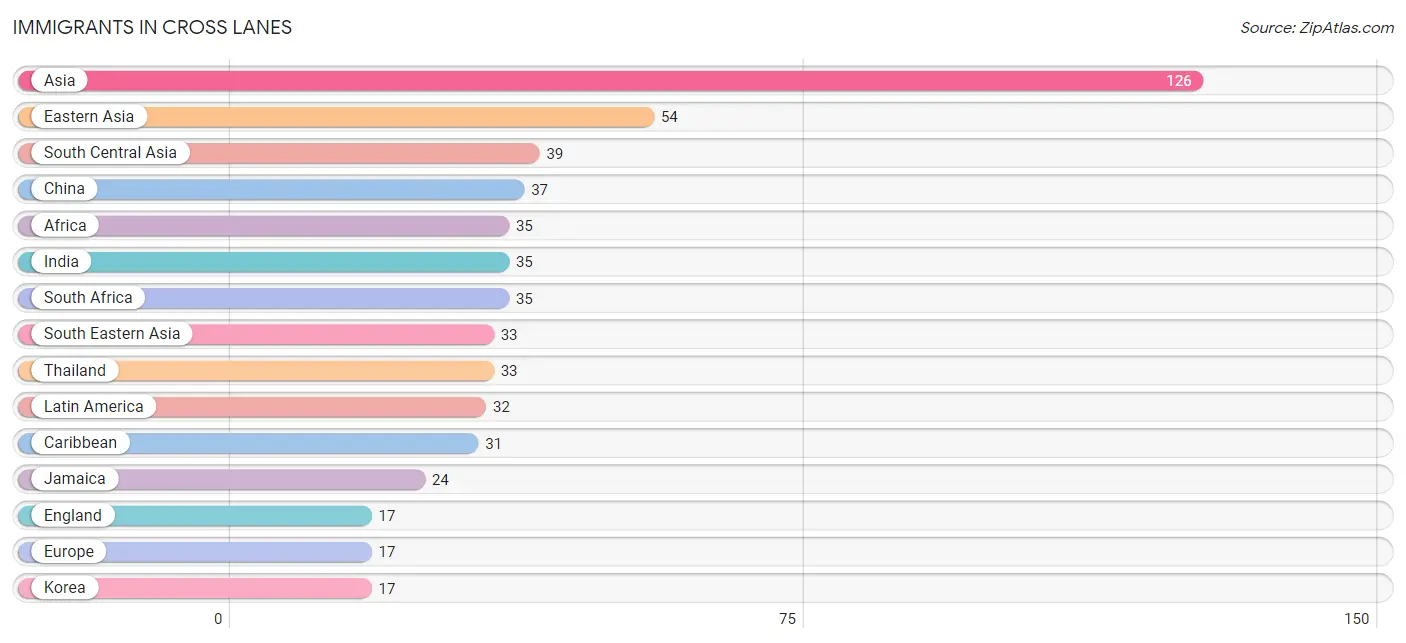
| Immigration Origin | # Population | % Population |
| Africa | 35 | 0.4% |
| Asia | 126 | 1.3% |
| Caribbean | 31 | 0.3% |
| Central America | 1 | 0.0% |
| China | 37 | 0.4% |
| Cuba | 6 | 0.1% |
| Eastern Asia | 54 | 0.5% |
| England | 17 | 0.2% |
| Europe | 17 | 0.2% |
| Haiti | 1 | 0.0% |
| India | 35 | 0.4% |
| Jamaica | 24 | 0.2% |
| Korea | 17 | 0.2% |
| Latin America | 32 | 0.3% |
| Mexico | 1 | 0.0% |
| Northern Europe | 17 | 0.2% |
| Pakistan | 4 | 0.0% |
| South Africa | 35 | 0.4% |
| South Central Asia | 39 | 0.4% |
| South Eastern Asia | 33 | 0.3% |
| Thailand | 33 | 0.3% | View All 21 Rows |
Sex and Age in Cross Lanes
Sex and Age in Cross Lanes
The most populous age groups in Cross Lanes are 25 to 29 Years (582 | 11.8%) for men and 45 to 49 Years (446 | 8.8%) for women.
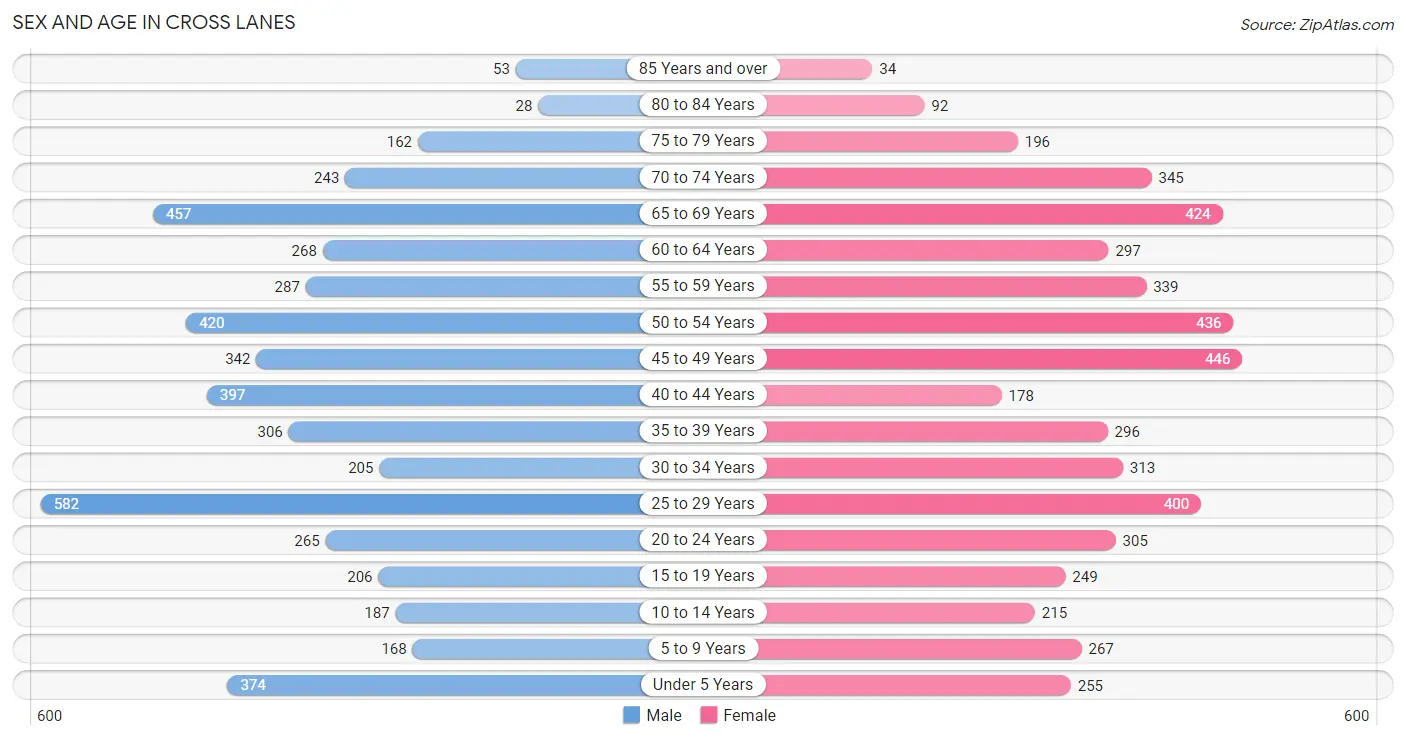
| Age Bracket | Male | Female |
| Under 5 Years | 374 (7.6%) | 255 (5.0%) |
| 5 to 9 Years | 168 (3.4%) | 267 (5.2%) |
| 10 to 14 Years | 187 (3.8%) | 215 (4.2%) |
| 15 to 19 Years | 206 (4.2%) | 249 (4.9%) |
| 20 to 24 Years | 265 (5.3%) | 305 (6.0%) |
| 25 to 29 Years | 582 (11.8%) | 400 (7.9%) |
| 30 to 34 Years | 205 (4.1%) | 313 (6.1%) |
| 35 to 39 Years | 306 (6.2%) | 296 (5.8%) |
| 40 to 44 Years | 397 (8.0%) | 178 (3.5%) |
| 45 to 49 Years | 342 (6.9%) | 446 (8.8%) |
| 50 to 54 Years | 420 (8.5%) | 436 (8.6%) |
| 55 to 59 Years | 287 (5.8%) | 339 (6.7%) |
| 60 to 64 Years | 268 (5.4%) | 297 (5.8%) |
| 65 to 69 Years | 457 (9.2%) | 424 (8.3%) |
| 70 to 74 Years | 243 (4.9%) | 345 (6.8%) |
| 75 to 79 Years | 162 (3.3%) | 196 (3.8%) |
| 80 to 84 Years | 28 (0.6%) | 92 (1.8%) |
| 85 Years and over | 53 (1.1%) | 34 (0.7%) |
| Total | 4,950 (100.0%) | 5,087 (100.0%) |
Families and Households in Cross Lanes
Median Family Size in Cross Lanes
The median family size in Cross Lanes is 2.66 persons per family, with single male/father families (26 | 0.9%) accounting for the largest median family size of 3.96 persons per family. On the other hand, married-couple families (2,641 | 87.5%) represent the smallest median family size with 2.55 persons per family.
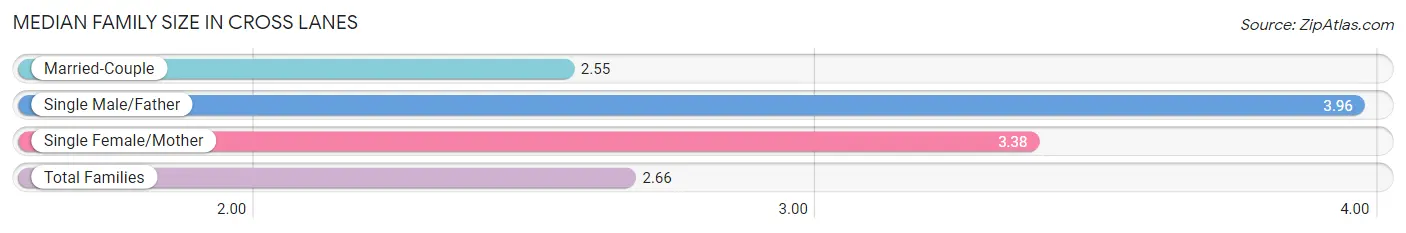
| Family Type | # Families | Family Size |
| Married-Couple | 2,641 (87.5%) | 2.55 |
| Single Male/Father | 26 (0.9%) | 3.96 |
| Single Female/Mother | 351 (11.6%) | 3.38 |
| Total Families | 3,018 (100.0%) | 2.66 |
Median Household Size in Cross Lanes
The median household size in Cross Lanes is 2.17 persons per household, with single male/father households (26 | 0.6%) accounting for the largest median household size of 3.96 persons per household. non-family households (1,608 | 34.8%) represent the smallest median household size with 1.14 persons per household.
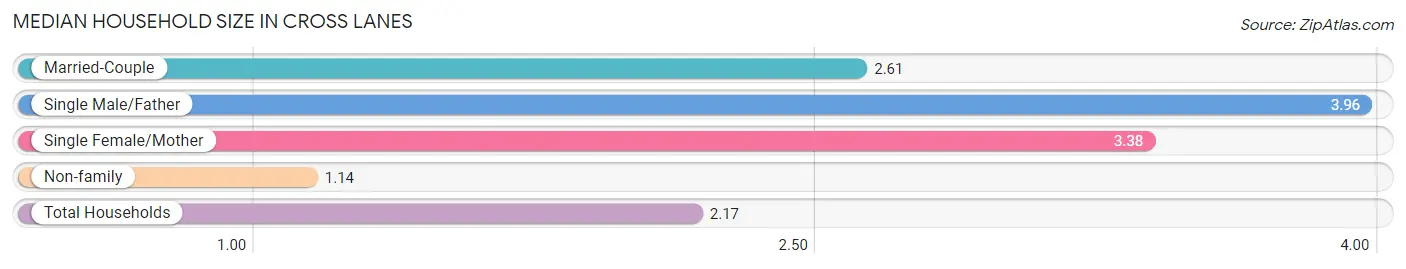
| Household Type | # Households | Household Size |
| Married-Couple | 2,641 (57.1%) | 2.61 |
| Single Male/Father | 26 (0.6%) | 3.96 |
| Single Female/Mother | 351 (7.6%) | 3.38 |
| Non-family | 1,608 (34.8%) | 1.14 |
| Total Households | 4,626 (100.0%) | 2.17 |
Household Size by Marriage Status in Cross Lanes
Out of a total of 4,626 households in Cross Lanes, 3,018 (65.2%) are family households, while 1,608 (34.8%) are nonfamily households. The most numerous type of family households are 2-person households, comprising 1,471, and the most common type of nonfamily households are 1-person households, comprising 1,362.
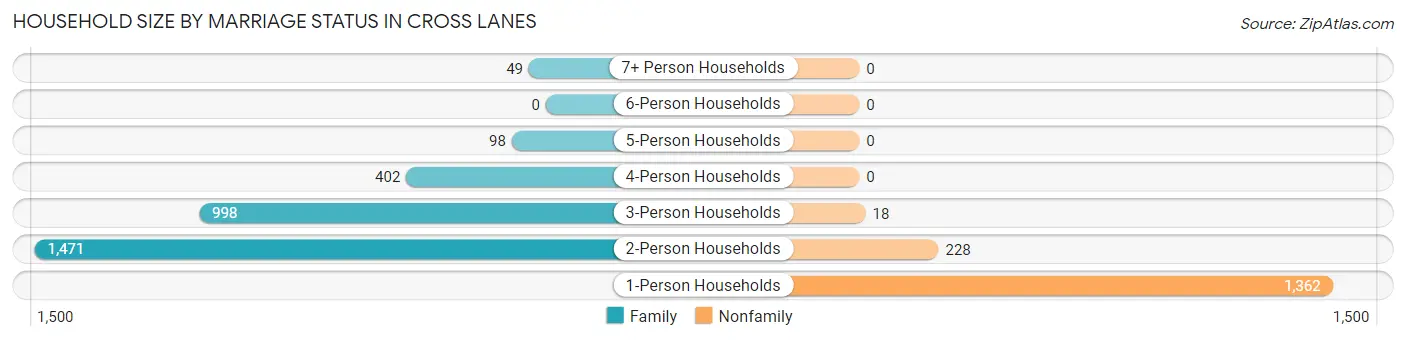
| Household Size | Family Households | Nonfamily Households |
| 1-Person Households | - | 1,362 (29.4%) |
| 2-Person Households | 1,471 (31.8%) | 228 (4.9%) |
| 3-Person Households | 998 (21.6%) | 18 (0.4%) |
| 4-Person Households | 402 (8.7%) | 0 (0.0%) |
| 5-Person Households | 98 (2.1%) | 0 (0.0%) |
| 6-Person Households | 0 (0.0%) | 0 (0.0%) |
| 7+ Person Households | 49 (1.1%) | 0 (0.0%) |
| Total | 3,018 (65.2%) | 1,608 (34.8%) |
Female Fertility in Cross Lanes
Fertility by Age in Cross Lanes
Average fertility rate in Cross Lanes is 95.0 births per 1,000 women. Women in the age bracket of 20 to 34 years have the highest fertility rate with 126.0 births per 1,000 women. Women in the age bracket of 20 to 34 years acount for 61.5% of all women with births.
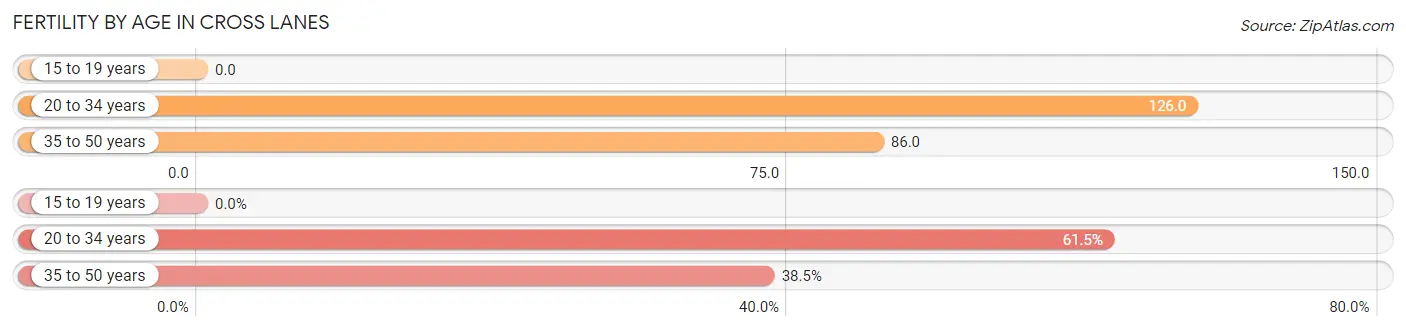
| Age Bracket | Women with Births | Births / 1,000 Women |
| 15 to 19 years | 0 (0.0%) | 0.0 |
| 20 to 34 years | 128 (61.5%) | 126.0 |
| 35 to 50 years | 80 (38.5%) | 86.0 |
| Total | 208 (100.0%) | 95.0 |
Fertility by Age by Marriage Status in Cross Lanes
90.9% of women with births (208) in Cross Lanes are married. The highest percentage of unmarried women with births falls into 20 to 34 years age bracket with 14.8% of them unmarried at the time of birth, while the lowest percentage of unmarried women with births belong to 35 to 50 years age bracket with 0.0% of them unmarried.
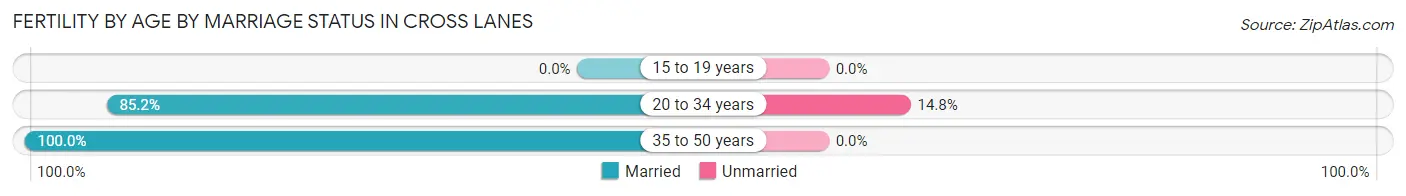
| Age Bracket | Married | Unmarried |
| 15 to 19 years | 0 (0.0%) | 0 (0.0%) |
| 20 to 34 years | 109 (85.2%) | 19 (14.8%) |
| 35 to 50 years | 80 (100.0%) | 0 (0.0%) |
| Total | 189 (90.9%) | 19 (9.1%) |
Fertility by Education in Cross Lanes
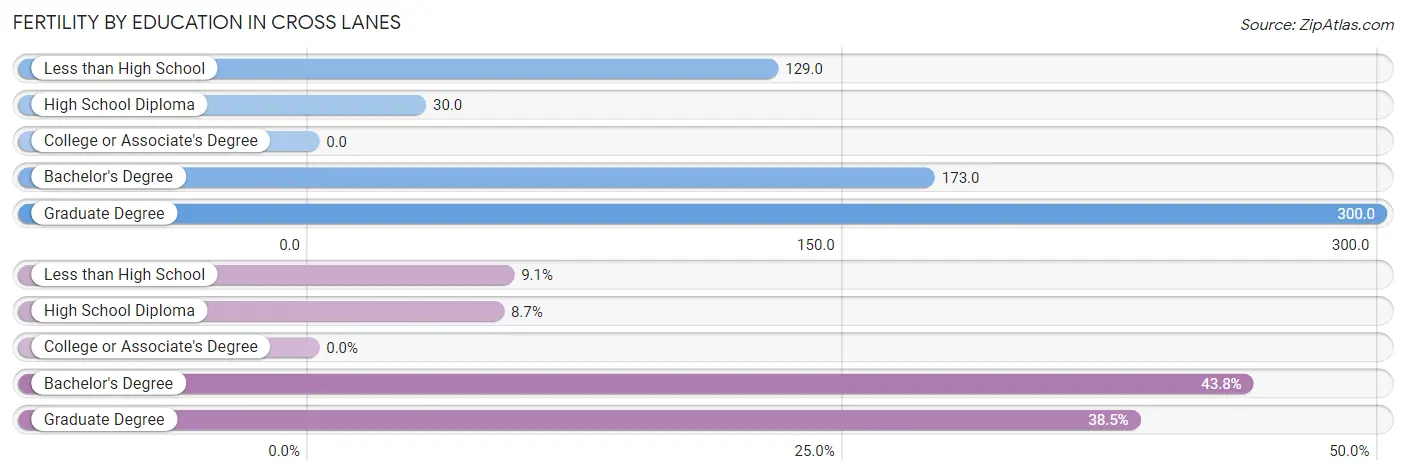
| Educational Attainment | Women with Births | Births / 1,000 Women |
| Less than High School | 19 (9.1%) | 129.0 |
| High School Diploma | 18 (8.6%) | 30.0 |
| College or Associate's Degree | 0 (0.0%) | 0.0 |
| Bachelor's Degree | 91 (43.8%) | 173.0 |
| Graduate Degree | 80 (38.5%) | 300.0 |
| Total | 208 (100.0%) | 95.0 |
Fertility by Education by Marriage Status in Cross Lanes
9.1% of women with births in Cross Lanes are unmarried. Women with the educational attainment of high school diploma are most likely to be married with 100.0% of them married at childbirth, while women with the educational attainment of less than high school are least likely to be married with 100.0% of them unmarried at childbirth.
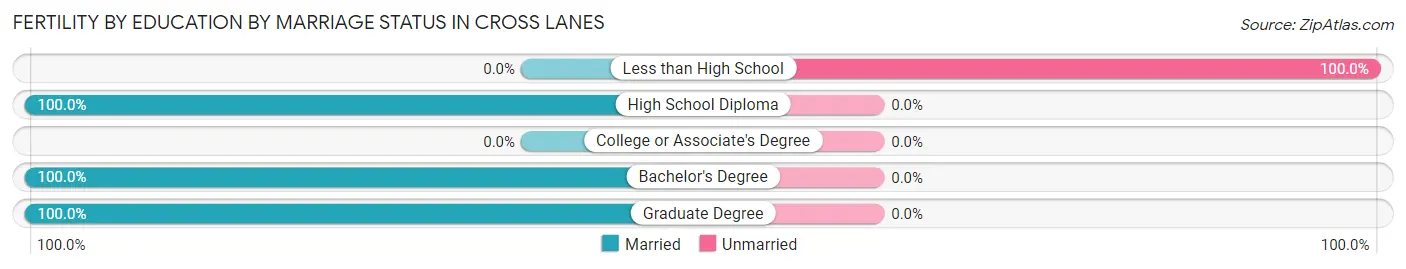
| Educational Attainment | Married | Unmarried |
| Less than High School | 0 (0.0%) | 19 (100.0%) |
| High School Diploma | 18 (100.0%) | 0 (0.0%) |
| College or Associate's Degree | 0 (0.0%) | 0 (0.0%) |
| Bachelor's Degree | 91 (100.0%) | 0 (0.0%) |
| Graduate Degree | 80 (100.0%) | 0 (0.0%) |
| Total | 189 (90.9%) | 19 (9.1%) |
Employment Characteristics in Cross Lanes
Employment by Class of Employer in Cross Lanes
Among the 4,995 employed individuals in Cross Lanes, private company employees (3,409 | 68.2%), not-for-profit organizations (608 | 12.2%), and state government employees (374 | 7.5%) make up the most common classes of employment.
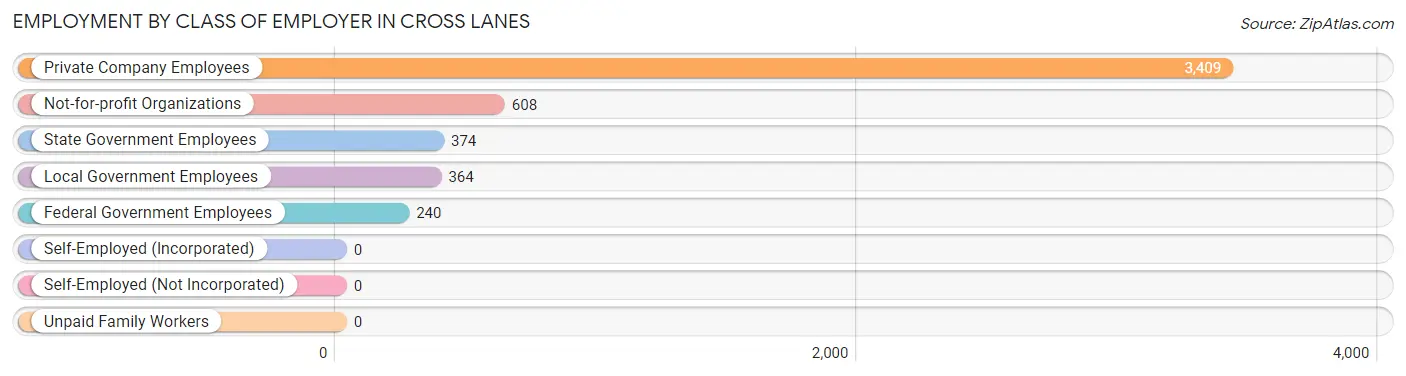
| Employer Class | # Employees | % Employees |
| Private Company Employees | 3,409 | 68.2% |
| Self-Employed (Incorporated) | 0 | 0.0% |
| Self-Employed (Not Incorporated) | 0 | 0.0% |
| Not-for-profit Organizations | 608 | 12.2% |
| Local Government Employees | 364 | 7.3% |
| State Government Employees | 374 | 7.5% |
| Federal Government Employees | 240 | 4.8% |
| Unpaid Family Workers | 0 | 0.0% |
| Total | 4,995 | 100.0% |
Employment Status by Age in Cross Lanes
According to the labor force statistics for Cross Lanes, out of the total population over 16 years of age (8,532), 62.7% or 5,350 individuals are in the labor force, with 5.2% or 278 of them unemployed. The age group with the highest labor force participation rate is 20 to 24 years, with 95.3% or 543 individuals in the labor force. Within the labor force, the 16 to 19 years age range has the highest percentage of unemployed individuals, with 25.0% or 36 of them being unemployed.
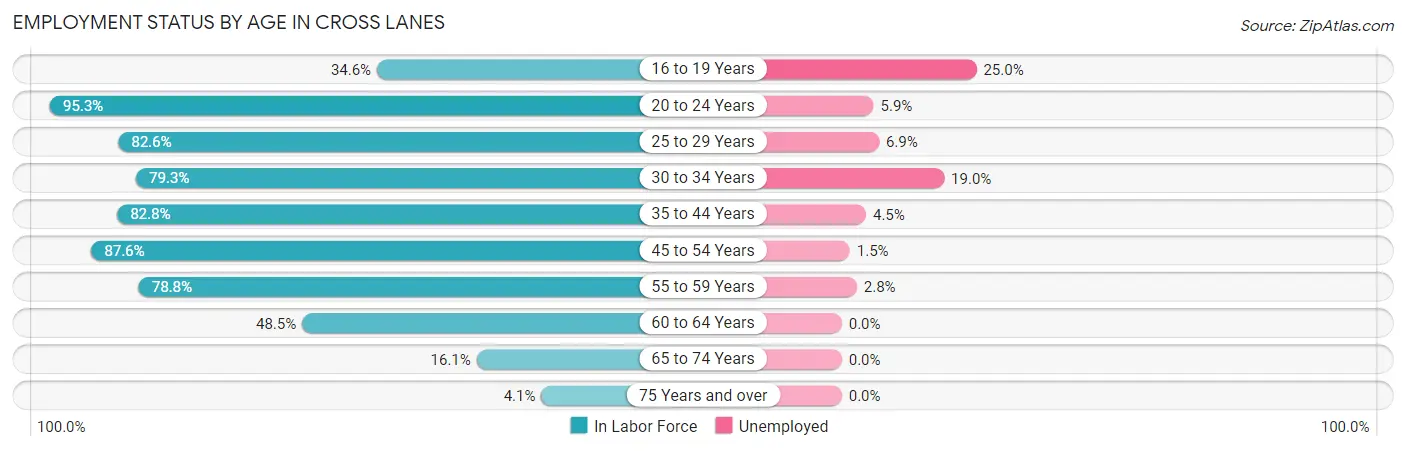
| Age Bracket | In Labor Force | Unemployed |
| 16 to 19 Years | 144 (34.6%) | 36 (25.0%) |
| 20 to 24 Years | 543 (95.3%) | 32 (5.9%) |
| 25 to 29 Years | 811 (82.6%) | 56 (6.9%) |
| 30 to 34 Years | 411 (79.3%) | 78 (19.0%) |
| 35 to 44 Years | 975 (82.8%) | 44 (4.5%) |
| 45 to 54 Years | 1,440 (87.6%) | 22 (1.5%) |
| 55 to 59 Years | 493 (78.8%) | 14 (2.8%) |
| 60 to 64 Years | 274 (48.5%) | 0 (0.0%) |
| 65 to 74 Years | 237 (16.1%) | 0 (0.0%) |
| 75 Years and over | 23 (4.1%) | 0 (0.0%) |
| Total | 5,350 (62.7%) | 278 (5.2%) |
Employment Status by Educational Attainment in Cross Lanes
According to labor force statistics for Cross Lanes, 79.9% of individuals (4,404) out of the total population between 25 and 64 years of age (5,512) are in the labor force, with 4.8% or 211 of them being unemployed. The group with the highest labor force participation rate are those with the educational attainment of bachelor's degree or higher, with 94.1% or 1,669 individuals in the labor force. Within the labor force, individuals with high school diploma education have the highest percentage of unemployment, with 10.9% or 169 of them being unemployed.
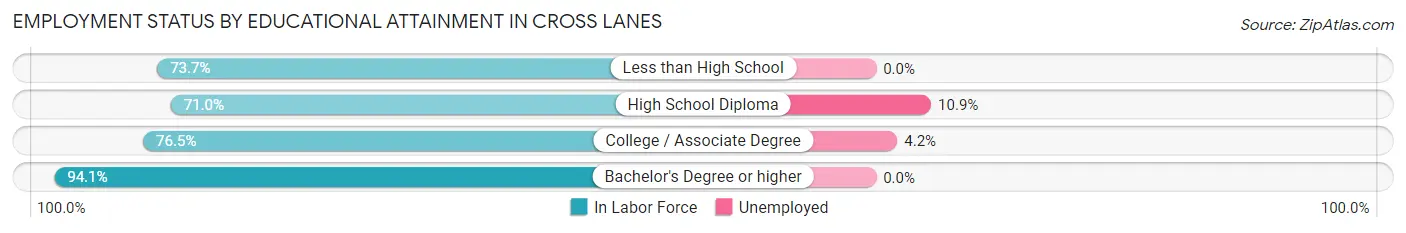
| Educational Attainment | In Labor Force | Unemployed |
| Less than High School | 129 (73.7%) | 0 (0.0%) |
| High School Diploma | 1,547 (71.0%) | 238 (10.9%) |
| College / Associate Degree | 1,059 (76.5%) | 58 (4.2%) |
| Bachelor's Degree or higher | 1,669 (94.1%) | 0 (0.0%) |
| Total | 4,404 (79.9%) | 265 (4.8%) |
Employment Occupations by Sex in Cross Lanes
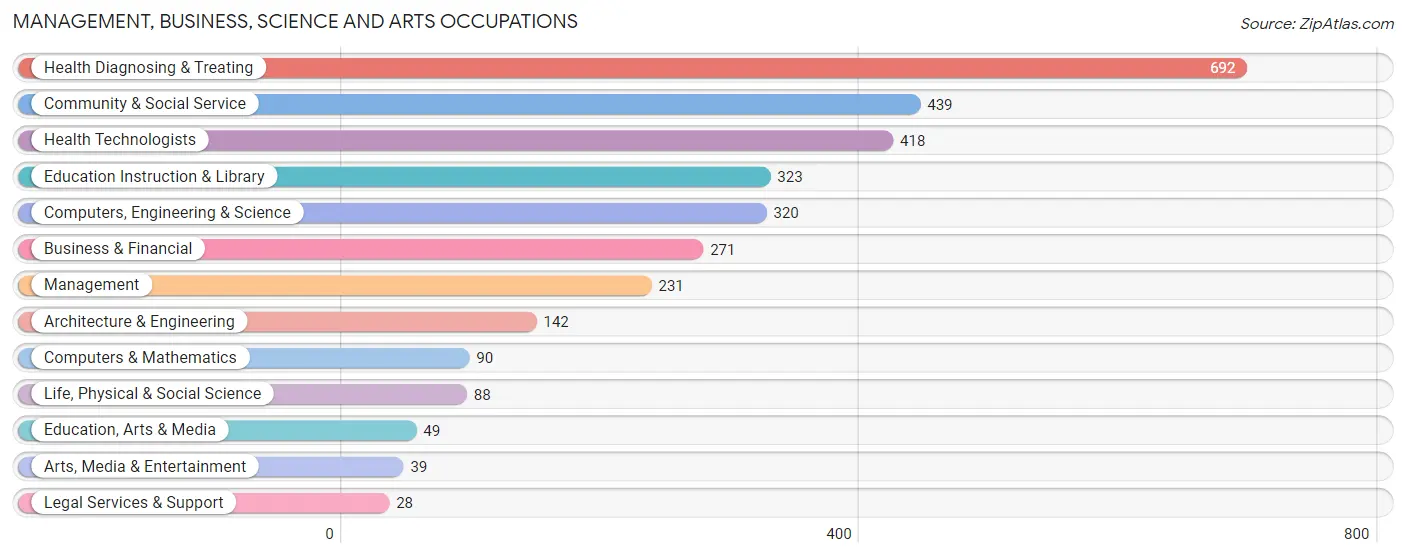
Management, Business, Science and Arts Occupations
The most common Management, Business, Science and Arts occupations in Cross Lanes are Health Diagnosing & Treating (692 | 13.7%), Community & Social Service (439 | 8.7%), Health Technologists (418 | 8.3%), Education Instruction & Library (323 | 6.4%), and Computers, Engineering & Science (320 | 6.3%).
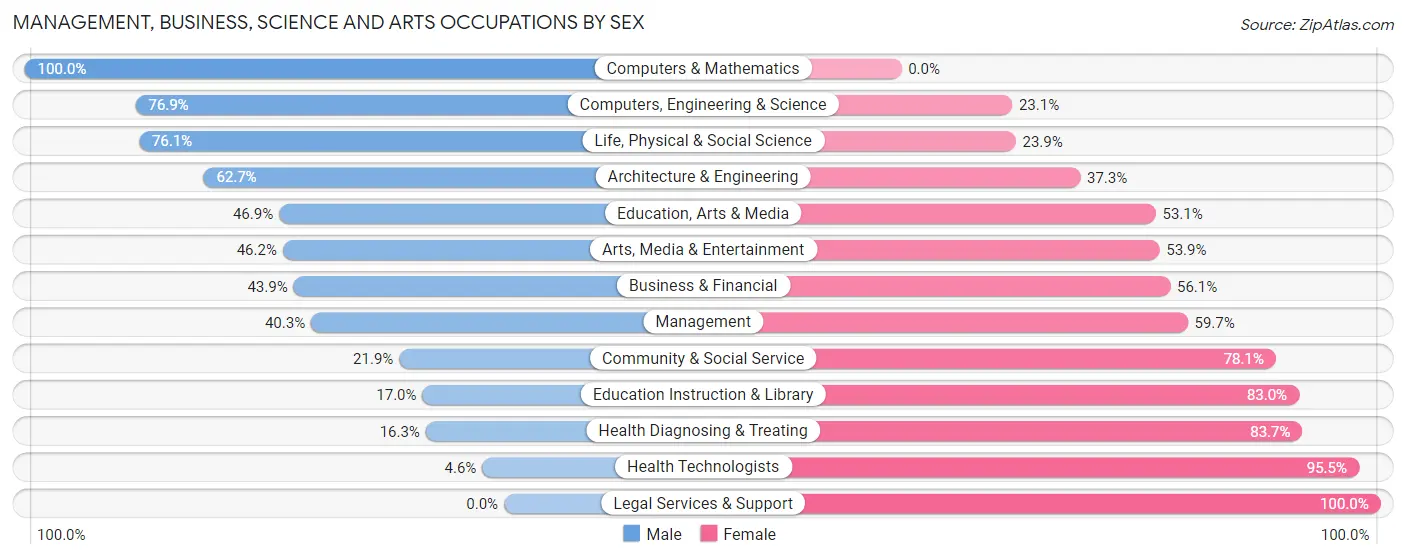
Management, Business, Science and Arts Occupations by Sex
Within the Management, Business, Science and Arts occupations in Cross Lanes, the most male-oriented occupations are Computers & Mathematics (100.0%), Computers, Engineering & Science (76.9%), and Life, Physical & Social Science (76.1%), while the most female-oriented occupations are Legal Services & Support (100.0%), Health Technologists (95.5%), and Health Diagnosing & Treating (83.7%).
| Occupation | Male | Female |
| Management | 93 (40.3%) | 138 (59.7%) |
| Business & Financial | 119 (43.9%) | 152 (56.1%) |
| Computers, Engineering & Science | 246 (76.9%) | 74 (23.1%) |
| Computers & Mathematics | 90 (100.0%) | 0 (0.0%) |
| Architecture & Engineering | 89 (62.7%) | 53 (37.3%) |
| Life, Physical & Social Science | 67 (76.1%) | 21 (23.9%) |
| Community & Social Service | 96 (21.9%) | 343 (78.1%) |
| Education, Arts & Media | 23 (46.9%) | 26 (53.1%) |
| Legal Services & Support | 0 (0.0%) | 28 (100.0%) |
| Education Instruction & Library | 55 (17.0%) | 268 (83.0%) |
| Arts, Media & Entertainment | 18 (46.2%) | 21 (53.8%) |
| Health Diagnosing & Treating | 113 (16.3%) | 579 (83.7%) |
| Health Technologists | 19 (4.5%) | 399 (95.5%) |
| Total (Category) | 667 (34.2%) | 1,286 (65.8%) |
| Total (Overall) | 2,475 (48.9%) | 2,582 (51.1%) |
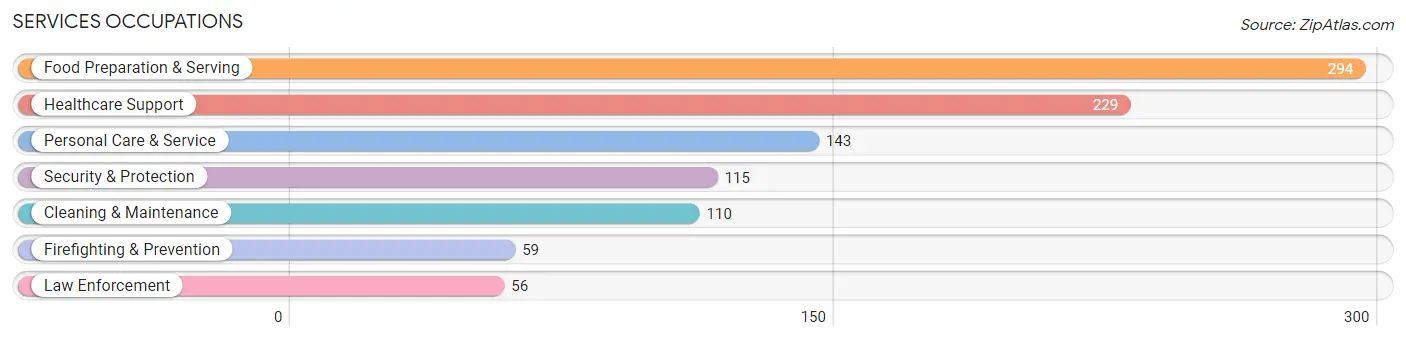
Services Occupations
The most common Services occupations in Cross Lanes are Food Preparation & Serving (294 | 5.8%), Healthcare Support (229 | 4.5%), Personal Care & Service (143 | 2.8%), Security & Protection (115 | 2.3%), and Cleaning & Maintenance (110 | 2.2%).
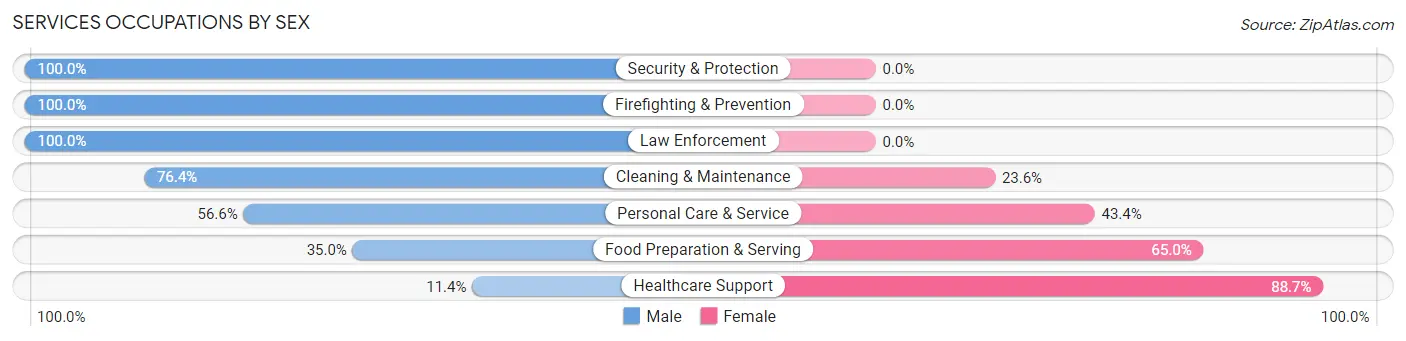
Services Occupations by Sex
Within the Services occupations in Cross Lanes, the most male-oriented occupations are Security & Protection (100.0%), Firefighting & Prevention (100.0%), and Law Enforcement (100.0%), while the most female-oriented occupations are Healthcare Support (88.6%), Food Preparation & Serving (65.0%), and Personal Care & Service (43.4%).
| Occupation | Male | Female |
| Healthcare Support | 26 (11.4%) | 203 (88.6%) |
| Security & Protection | 115 (100.0%) | 0 (0.0%) |
| Firefighting & Prevention | 59 (100.0%) | 0 (0.0%) |
| Law Enforcement | 56 (100.0%) | 0 (0.0%) |
| Food Preparation & Serving | 103 (35.0%) | 191 (65.0%) |
| Cleaning & Maintenance | 84 (76.4%) | 26 (23.6%) |
| Personal Care & Service | 81 (56.6%) | 62 (43.4%) |
| Total (Category) | 409 (45.9%) | 482 (54.1%) |
| Total (Overall) | 2,475 (48.9%) | 2,582 (51.1%) |
Sales and Office Occupations
The most common Sales and Office occupations in Cross Lanes are Office & Administration (824 | 16.3%), and Sales & Related (465 | 9.2%).
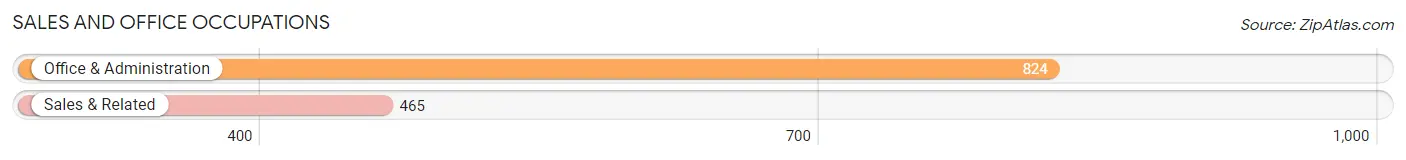
Sales and Office Occupations by Sex
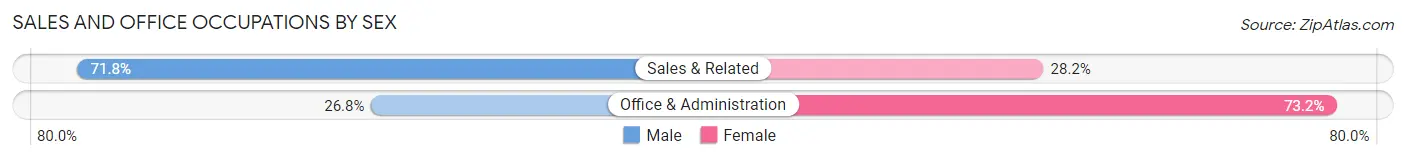
| Occupation | Male | Female |
| Sales & Related | 334 (71.8%) | 131 (28.2%) |
| Office & Administration | 221 (26.8%) | 603 (73.2%) |
| Total (Category) | 555 (43.1%) | 734 (56.9%) |
| Total (Overall) | 2,475 (48.9%) | 2,582 (51.1%) |
Natural Resources, Construction and Maintenance Occupations
The most common Natural Resources, Construction and Maintenance occupations in Cross Lanes are Construction & Extraction (224 | 4.4%), and Installation, Maintenance & Repair (125 | 2.5%).
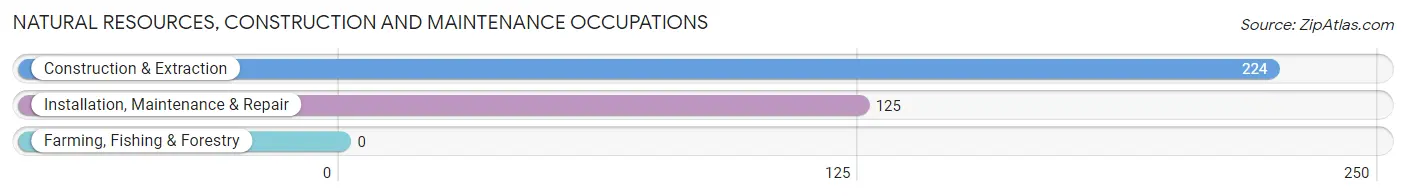
Natural Resources, Construction and Maintenance Occupations by Sex
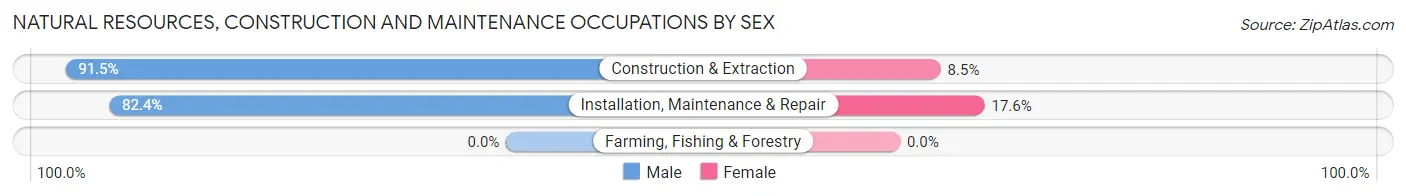
| Occupation | Male | Female |
| Farming, Fishing & Forestry | 0 (0.0%) | 0 (0.0%) |
| Construction & Extraction | 205 (91.5%) | 19 (8.5%) |
| Installation, Maintenance & Repair | 103 (82.4%) | 22 (17.6%) |
| Total (Category) | 308 (88.2%) | 41 (11.7%) |
| Total (Overall) | 2,475 (48.9%) | 2,582 (51.1%) |
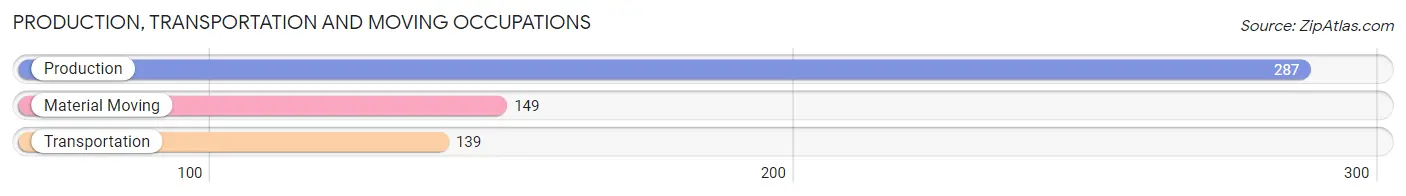
Production, Transportation and Moving Occupations
The most common Production, Transportation and Moving occupations in Cross Lanes are Production (287 | 5.7%), Material Moving (149 | 2.9%), and Transportation (139 | 2.8%).
Production, Transportation and Moving Occupations by Sex
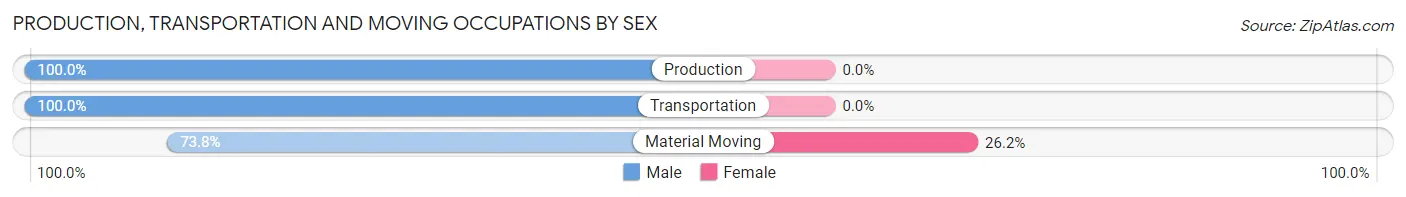
| Occupation | Male | Female |
| Production | 287 (100.0%) | 0 (0.0%) |
| Transportation | 139 (100.0%) | 0 (0.0%) |
| Material Moving | 110 (73.8%) | 39 (26.2%) |
| Total (Category) | 536 (93.2%) | 39 (6.8%) |
| Total (Overall) | 2,475 (48.9%) | 2,582 (51.1%) |
Employment Industries by Sex in Cross Lanes
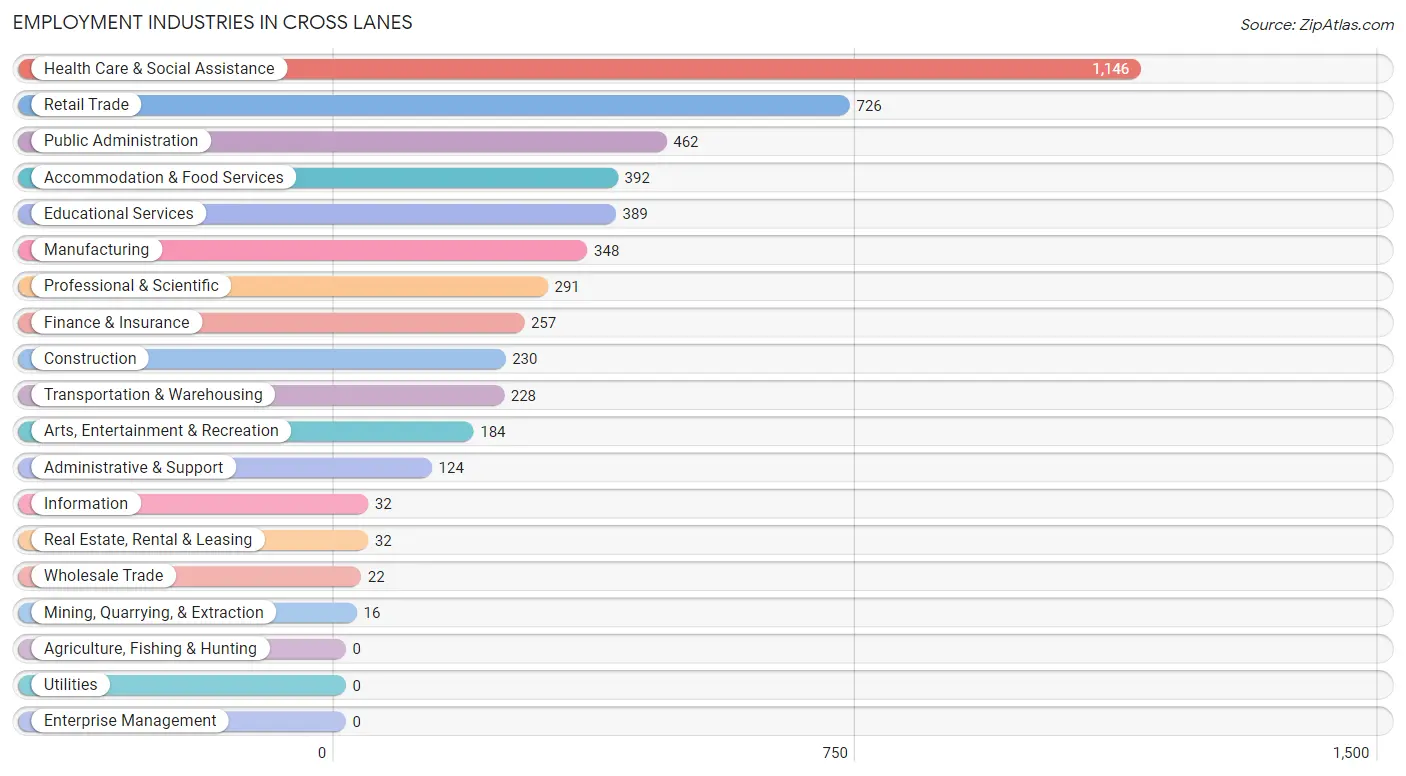
Employment Industries in Cross Lanes
The major employment industries in Cross Lanes include Health Care & Social Assistance (1,146 | 22.7%), Retail Trade (726 | 14.4%), Public Administration (462 | 9.1%), Accommodation & Food Services (392 | 7.7%), and Educational Services (389 | 7.7%).
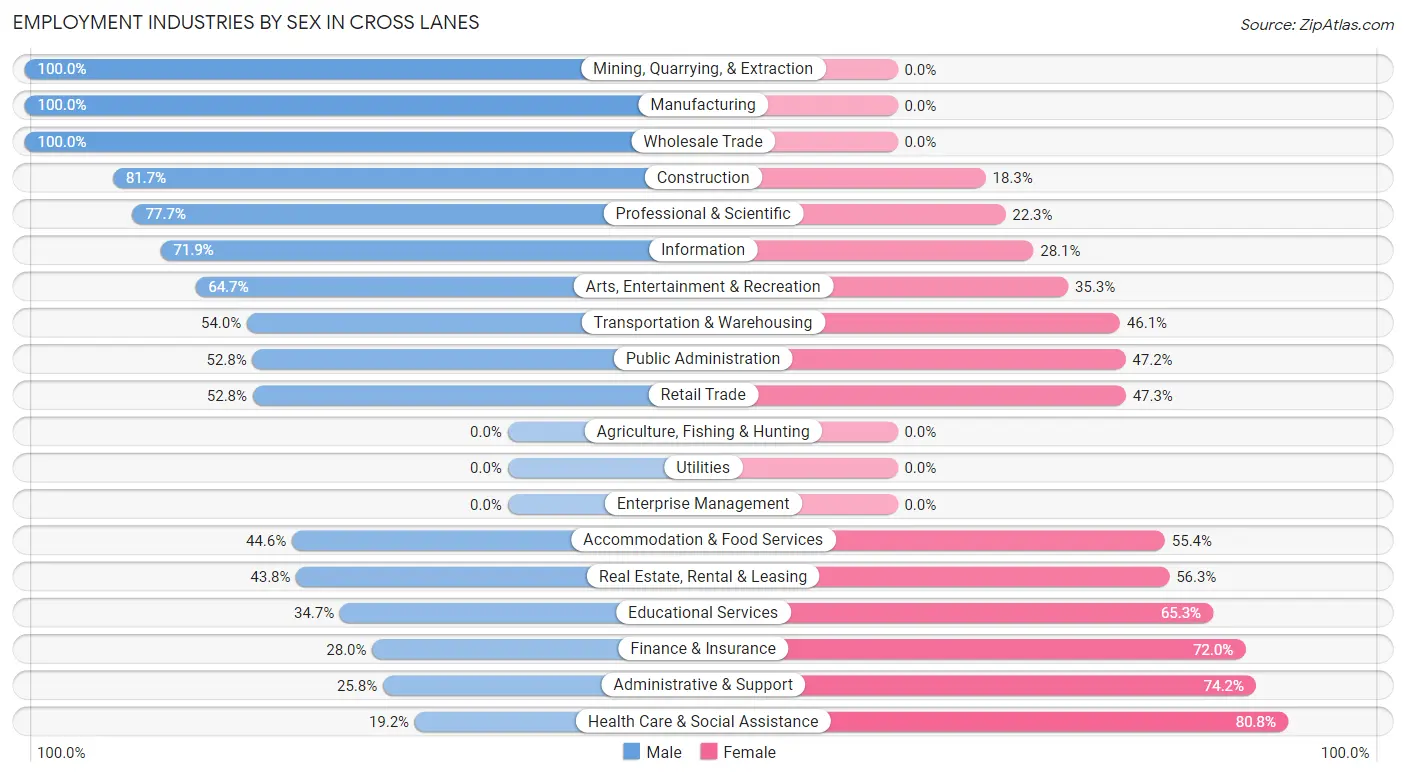
Employment Industries by Sex in Cross Lanes
The Cross Lanes industries that see more men than women are Mining, Quarrying, & Extraction (100.0%), Manufacturing (100.0%), and Wholesale Trade (100.0%), whereas the industries that tend to have a higher number of women are Health Care & Social Assistance (80.8%), Administrative & Support (74.2%), and Finance & Insurance (72.0%).
| Industry | Male | Female |
| Agriculture, Fishing & Hunting | 0 (0.0%) | 0 (0.0%) |
| Mining, Quarrying, & Extraction | 16 (100.0%) | 0 (0.0%) |
| Construction | 188 (81.7%) | 42 (18.3%) |
| Manufacturing | 348 (100.0%) | 0 (0.0%) |
| Wholesale Trade | 22 (100.0%) | 0 (0.0%) |
| Retail Trade | 383 (52.7%) | 343 (47.2%) |
| Transportation & Warehousing | 123 (53.9%) | 105 (46.1%) |
| Utilities | 0 (0.0%) | 0 (0.0%) |
| Information | 23 (71.9%) | 9 (28.1%) |
| Finance & Insurance | 72 (28.0%) | 185 (72.0%) |
| Real Estate, Rental & Leasing | 14 (43.8%) | 18 (56.2%) |
| Professional & Scientific | 226 (77.7%) | 65 (22.3%) |
| Enterprise Management | 0 (0.0%) | 0 (0.0%) |
| Administrative & Support | 32 (25.8%) | 92 (74.2%) |
| Educational Services | 135 (34.7%) | 254 (65.3%) |
| Health Care & Social Assistance | 220 (19.2%) | 926 (80.8%) |
| Arts, Entertainment & Recreation | 119 (64.7%) | 65 (35.3%) |
| Accommodation & Food Services | 175 (44.6%) | 217 (55.4%) |
| Public Administration | 244 (52.8%) | 218 (47.2%) |
| Total | 2,475 (48.9%) | 2,582 (51.1%) |
Education in Cross Lanes
School Enrollment in Cross Lanes
The most common levels of schooling among the 1,477 students in Cross Lanes are college / undergraduate (344 | 23.3%), high school (343 | 23.2%), and middle school (304 | 20.6%).
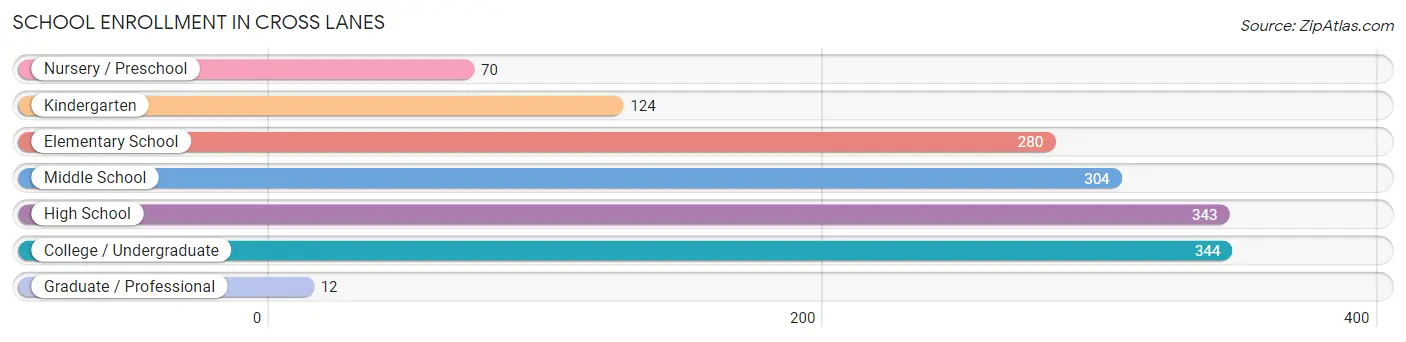
| School Level | # Students | % Students |
| Nursery / Preschool | 70 | 4.7% |
| Kindergarten | 124 | 8.4% |
| Elementary School | 280 | 19.0% |
| Middle School | 304 | 20.6% |
| High School | 343 | 23.2% |
| College / Undergraduate | 344 | 23.3% |
| Graduate / Professional | 12 | 0.8% |
| Total | 1,477 | 100.0% |
School Enrollment by Age by Funding Source in Cross Lanes
Out of a total of 1,477 students who are enrolled in schools in Cross Lanes, 343 (23.2%) attend a private institution, while the remaining 1,134 (76.8%) are enrolled in public schools. The age group of 3 to 4 year olds has the highest likelihood of being enrolled in private schools, with 26 (100.0% in the age bracket) enrolled. Conversely, the age group of 25 to 34 year olds has the lowest likelihood of being enrolled in a private school, with 21 (100.0% in the age bracket) attending a public institution.
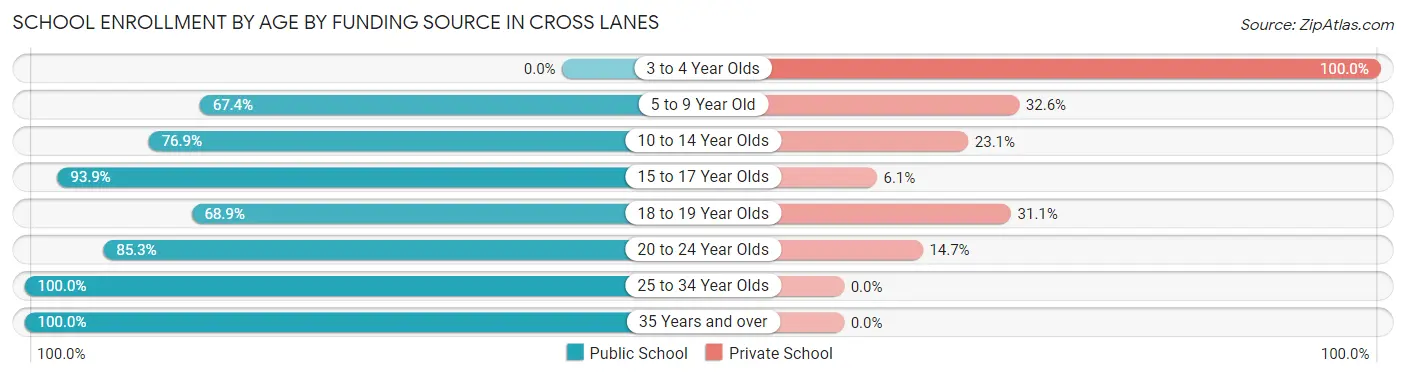
| Age Bracket | Public School | Private School |
| 3 to 4 Year Olds | 0 (0.0%) | 26 (100.0%) |
| 5 to 9 Year Old | 293 (67.4%) | 142 (32.6%) |
| 10 to 14 Year Olds | 309 (76.9%) | 93 (23.1%) |
| 15 to 17 Year Olds | 261 (93.9%) | 17 (6.1%) |
| 18 to 19 Year Olds | 82 (68.9%) | 37 (31.1%) |
| 20 to 24 Year Olds | 157 (85.3%) | 27 (14.7%) |
| 25 to 34 Year Olds | 21 (100.0%) | 0 (0.0%) |
| 35 Years and over | 12 (100.0%) | 0 (0.0%) |
| Total | 1,134 (76.8%) | 343 (23.2%) |
Educational Attainment by Field of Study in Cross Lanes
Science & technology (449 | 17.1%), business (437 | 16.6%), computers & mathematics (279 | 10.6%), social sciences (274 | 10.4%), and engineering (246 | 9.3%) are the most common fields of study among 2,631 individuals in Cross Lanes who have obtained a bachelor's degree or higher.
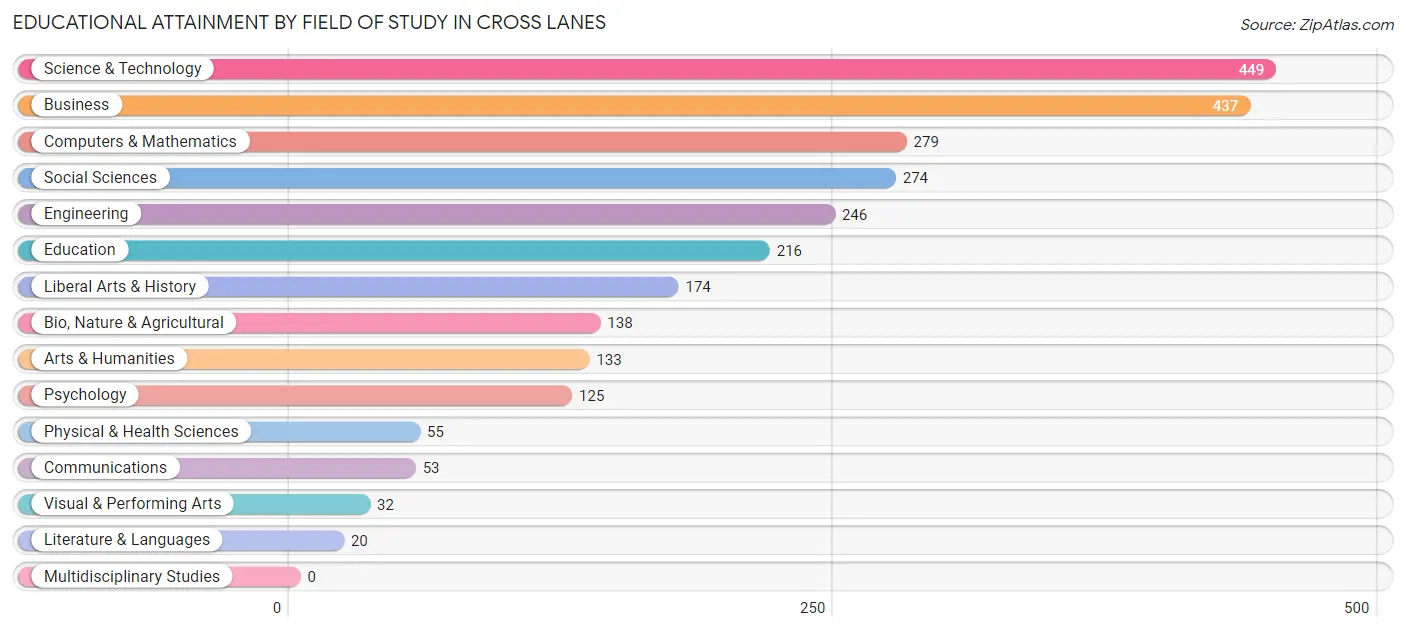
| Field of Study | # Graduates | % Graduates |
| Computers & Mathematics | 279 | 10.6% |
| Bio, Nature & Agricultural | 138 | 5.2% |
| Physical & Health Sciences | 55 | 2.1% |
| Psychology | 125 | 4.8% |
| Social Sciences | 274 | 10.4% |
| Engineering | 246 | 9.3% |
| Multidisciplinary Studies | 0 | 0.0% |
| Science & Technology | 449 | 17.1% |
| Business | 437 | 16.6% |
| Education | 216 | 8.2% |
| Literature & Languages | 20 | 0.8% |
| Liberal Arts & History | 174 | 6.6% |
| Visual & Performing Arts | 32 | 1.2% |
| Communications | 53 | 2.0% |
| Arts & Humanities | 133 | 5.1% |
| Total | 2,631 | 100.0% |
Transportation & Commute in Cross Lanes
Vehicle Availability by Sex in Cross Lanes
The most prevalent vehicle ownership categories in Cross Lanes are males with 2 vehicles (1,406, accounting for 57.8%) and females with 2 vehicles (1,305, making up 54.9%).
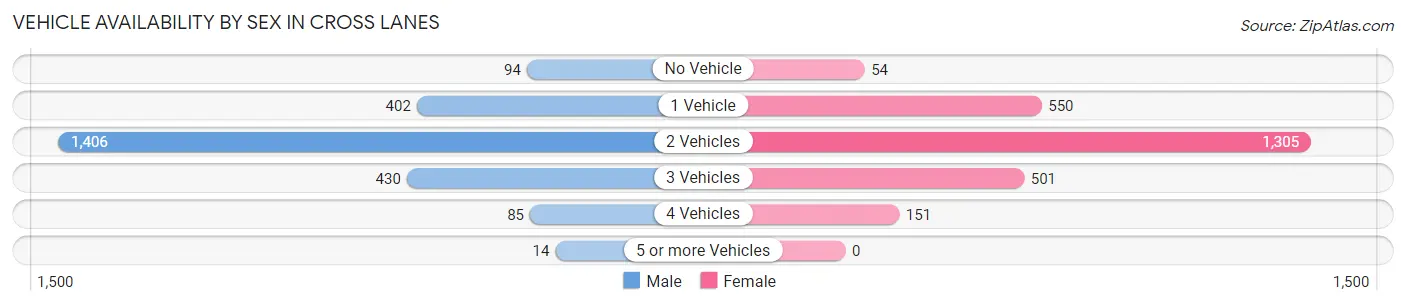
| Vehicles Available | Male | Female |
| No Vehicle | 94 (3.9%) | 54 (2.1%) |
| 1 Vehicle | 402 (16.5%) | 550 (21.5%) |
| 2 Vehicles | 1,406 (57.8%) | 1,305 (51.0%) |
| 3 Vehicles | 430 (17.7%) | 501 (19.6%) |
| 4 Vehicles | 85 (3.5%) | 151 (5.9%) |
| 5 or more Vehicles | 14 (0.6%) | 0 (0.0%) |
| Total | 2,431 (100.0%) | 2,561 (100.0%) |
Commute Time in Cross Lanes
The most frequently occuring commute durations in Cross Lanes are 20 to 24 minutes (1,138 commuters, 24.6%), 30 to 34 minutes (1,028 commuters, 22.2%), and 15 to 19 minutes (878 commuters, 19.0%).
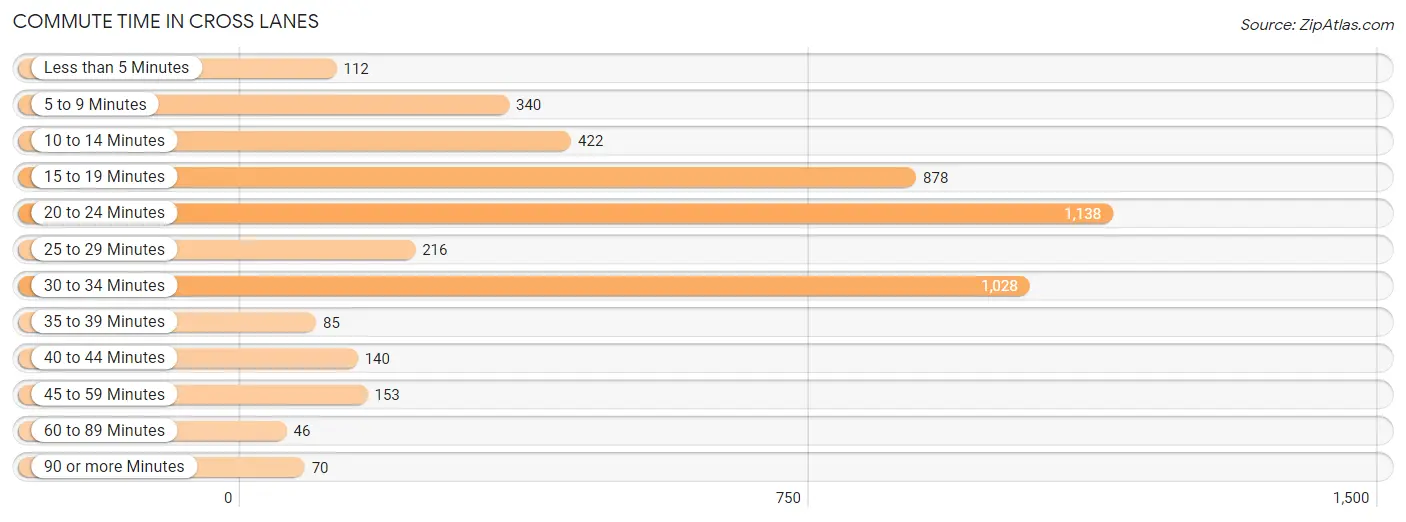
| Commute Time | # Commuters | % Commuters |
| Less than 5 Minutes | 112 | 2.4% |
| 5 to 9 Minutes | 340 | 7.3% |
| 10 to 14 Minutes | 422 | 9.1% |
| 15 to 19 Minutes | 878 | 19.0% |
| 20 to 24 Minutes | 1,138 | 24.6% |
| 25 to 29 Minutes | 216 | 4.7% |
| 30 to 34 Minutes | 1,028 | 22.2% |
| 35 to 39 Minutes | 85 | 1.8% |
| 40 to 44 Minutes | 140 | 3.0% |
| 45 to 59 Minutes | 153 | 3.3% |
| 60 to 89 Minutes | 46 | 1.0% |
| 90 or more Minutes | 70 | 1.5% |
Commute Time by Sex in Cross Lanes
The most common commute times in Cross Lanes are 30 to 34 minutes (685 commuters, 29.8%) for males and 20 to 24 minutes (597 commuters, 25.6%) for females.
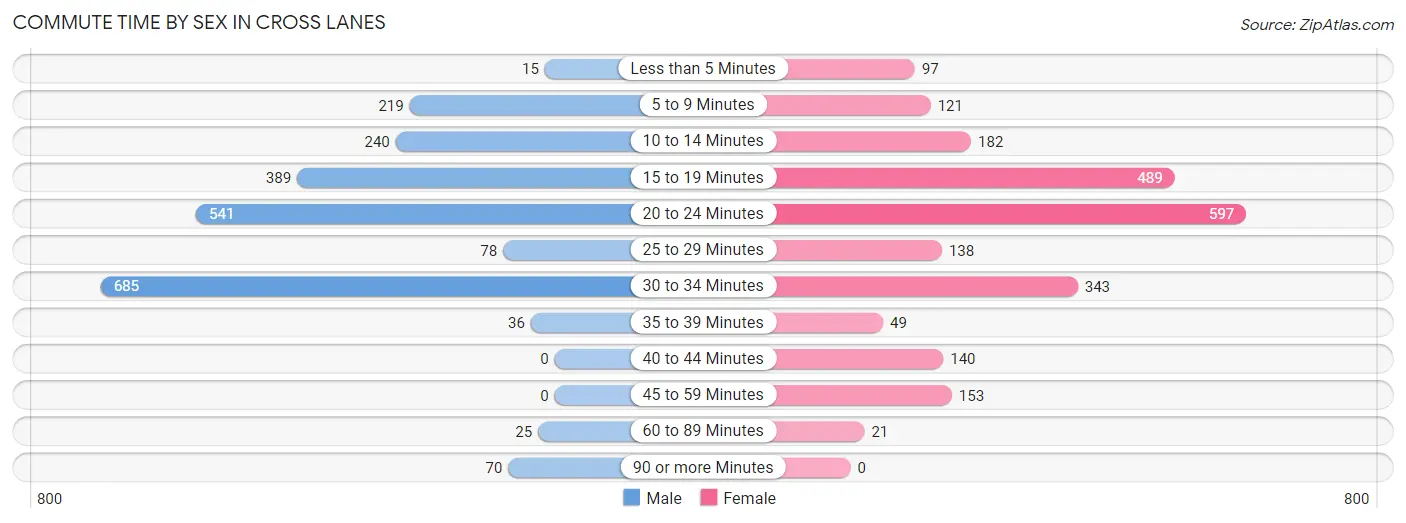
| Commute Time | Male | Female |
| Less than 5 Minutes | 15 (0.6%) | 97 (4.2%) |
| 5 to 9 Minutes | 219 (9.5%) | 121 (5.2%) |
| 10 to 14 Minutes | 240 (10.4%) | 182 (7.8%) |
| 15 to 19 Minutes | 389 (16.9%) | 489 (21.0%) |
| 20 to 24 Minutes | 541 (23.5%) | 597 (25.6%) |
| 25 to 29 Minutes | 78 (3.4%) | 138 (5.9%) |
| 30 to 34 Minutes | 685 (29.8%) | 343 (14.7%) |
| 35 to 39 Minutes | 36 (1.6%) | 49 (2.1%) |
| 40 to 44 Minutes | 0 (0.0%) | 140 (6.0%) |
| 45 to 59 Minutes | 0 (0.0%) | 153 (6.6%) |
| 60 to 89 Minutes | 25 (1.1%) | 21 (0.9%) |
| 90 or more Minutes | 70 (3.0%) | 0 (0.0%) |
Time of Departure to Work by Sex in Cross Lanes
The most frequent times of departure to work in Cross Lanes are 4:00 PM to 11:59 PM (540, 23.5%) for males and 7:00 AM to 7:29 AM (485, 20.8%) for females.
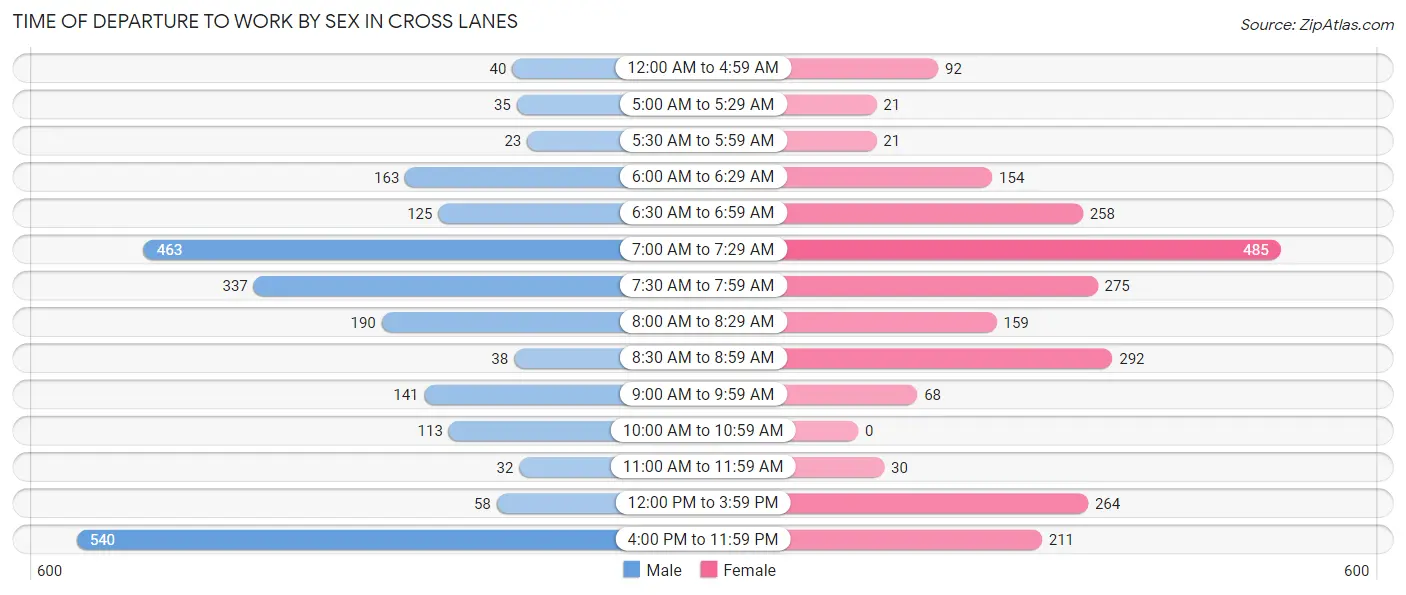
| Time of Departure | Male | Female |
| 12:00 AM to 4:59 AM | 40 (1.7%) | 92 (4.0%) |
| 5:00 AM to 5:29 AM | 35 (1.5%) | 21 (0.9%) |
| 5:30 AM to 5:59 AM | 23 (1.0%) | 21 (0.9%) |
| 6:00 AM to 6:29 AM | 163 (7.1%) | 154 (6.6%) |
| 6:30 AM to 6:59 AM | 125 (5.4%) | 258 (11.1%) |
| 7:00 AM to 7:29 AM | 463 (20.2%) | 485 (20.8%) |
| 7:30 AM to 7:59 AM | 337 (14.7%) | 275 (11.8%) |
| 8:00 AM to 8:29 AM | 190 (8.3%) | 159 (6.8%) |
| 8:30 AM to 8:59 AM | 38 (1.7%) | 292 (12.5%) |
| 9:00 AM to 9:59 AM | 141 (6.1%) | 68 (2.9%) |
| 10:00 AM to 10:59 AM | 113 (4.9%) | 0 (0.0%) |
| 11:00 AM to 11:59 AM | 32 (1.4%) | 30 (1.3%) |
| 12:00 PM to 3:59 PM | 58 (2.5%) | 264 (11.3%) |
| 4:00 PM to 11:59 PM | 540 (23.5%) | 211 (9.1%) |
| Total | 2,298 (100.0%) | 2,330 (100.0%) |
Housing Occupancy in Cross Lanes
Occupancy by Ownership in Cross Lanes
Of the total 4,626 dwellings in Cross Lanes, owner-occupied units account for 3,425 (74.0%), while renter-occupied units make up 1,201 (26.0%).
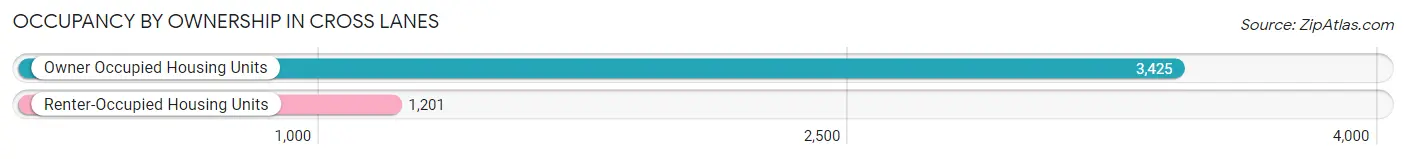
| Occupancy | # Housing Units | % Housing Units |
| Owner Occupied Housing Units | 3,425 | 74.0% |
| Renter-Occupied Housing Units | 1,201 | 26.0% |
| Total Occupied Housing Units | 4,626 | 100.0% |
Occupancy by Household Size in Cross Lanes
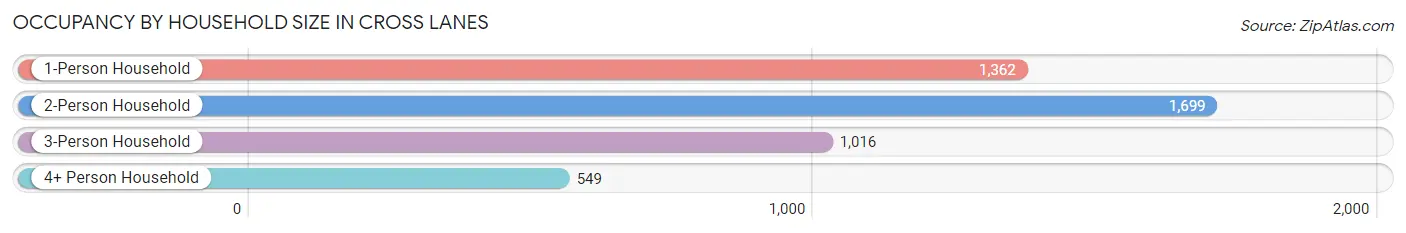
| Household Size | # Housing Units | % Housing Units |
| 1-Person Household | 1,362 | 29.4% |
| 2-Person Household | 1,699 | 36.7% |
| 3-Person Household | 1,016 | 22.0% |
| 4+ Person Household | 549 | 11.9% |
| Total Housing Units | 4,626 | 100.0% |
Occupancy by Ownership by Household Size in Cross Lanes
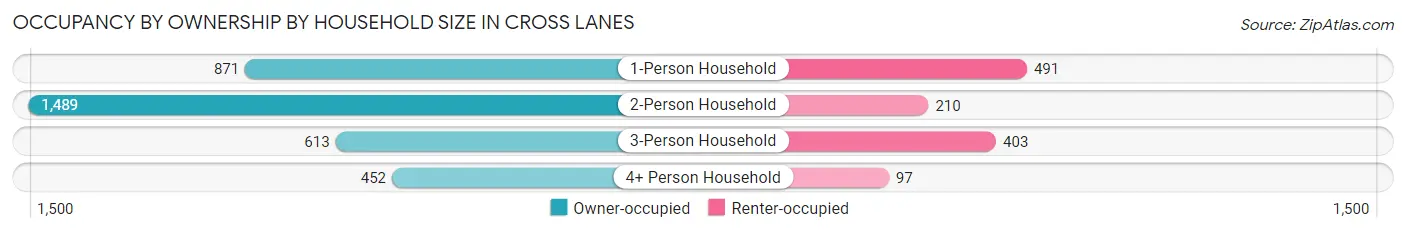
| Household Size | Owner-occupied | Renter-occupied |
| 1-Person Household | 871 (63.9%) | 491 (36.0%) |
| 2-Person Household | 1,489 (87.6%) | 210 (12.4%) |
| 3-Person Household | 613 (60.3%) | 403 (39.7%) |
| 4+ Person Household | 452 (82.3%) | 97 (17.7%) |
| Total Housing Units | 3,425 (74.0%) | 1,201 (26.0%) |
Occupancy by Educational Attainment in Cross Lanes
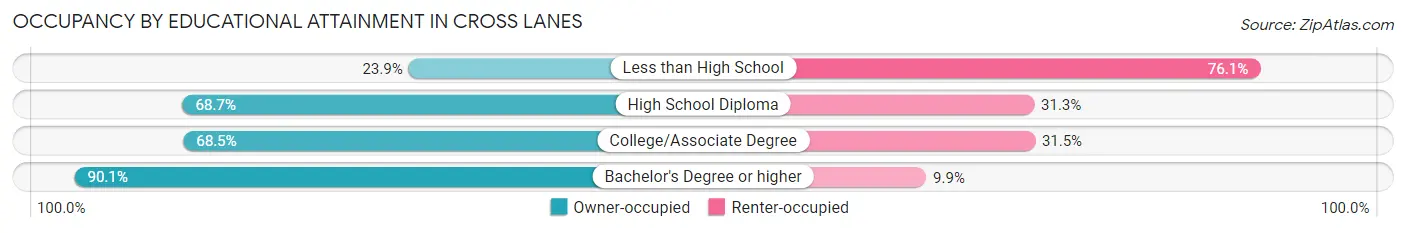
| Household Size | Owner-occupied | Renter-occupied |
| Less than High School | 43 (23.9%) | 137 (76.1%) |
| High School Diploma | 1,053 (68.7%) | 480 (31.3%) |
| College/Associate Degree | 938 (68.5%) | 431 (31.5%) |
| Bachelor's Degree or higher | 1,391 (90.1%) | 153 (9.9%) |
Occupancy by Age of Householder in Cross Lanes
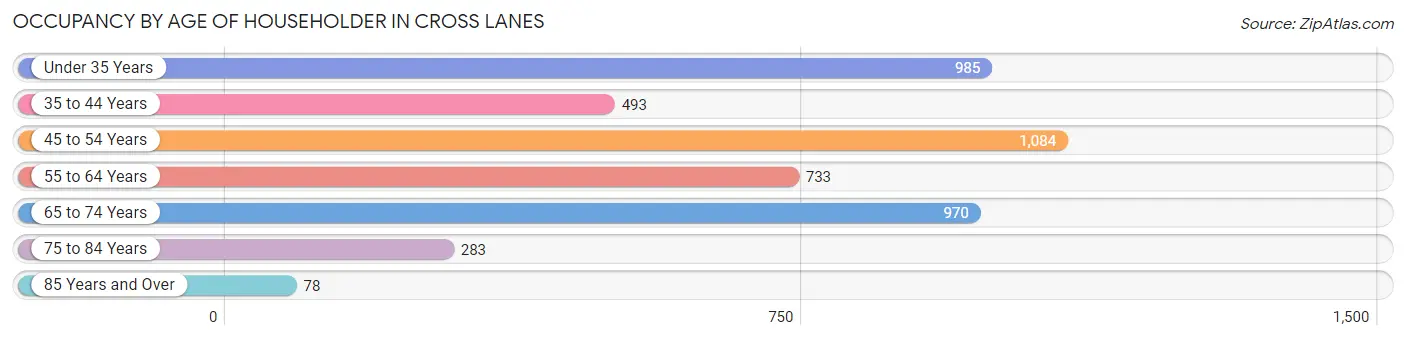
| Age Bracket | # Households | % Households |
| Under 35 Years | 985 | 21.3% |
| 35 to 44 Years | 493 | 10.7% |
| 45 to 54 Years | 1,084 | 23.4% |
| 55 to 64 Years | 733 | 15.9% |
| 65 to 74 Years | 970 | 21.0% |
| 75 to 84 Years | 283 | 6.1% |
| 85 Years and Over | 78 | 1.7% |
| Total | 4,626 | 100.0% |
Housing Finances in Cross Lanes
Median Income by Occupancy in Cross Lanes
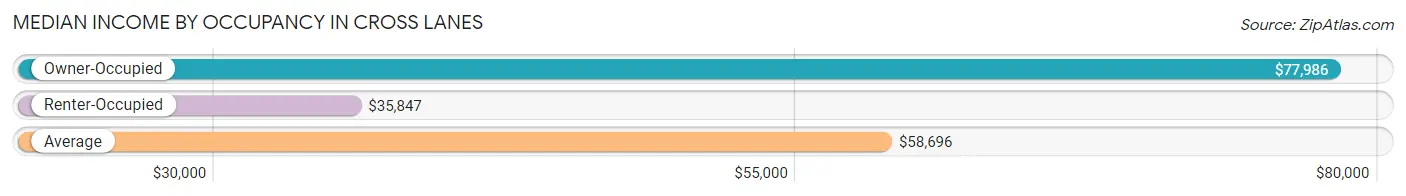
| Occupancy Type | # Households | Median Income |
| Owner-Occupied | 3,425 (74.0%) | $77,986 |
| Renter-Occupied | 1,201 (26.0%) | $35,847 |
| Average | 4,626 (100.0%) | $58,696 |
Occupancy by Householder Income Bracket in Cross Lanes
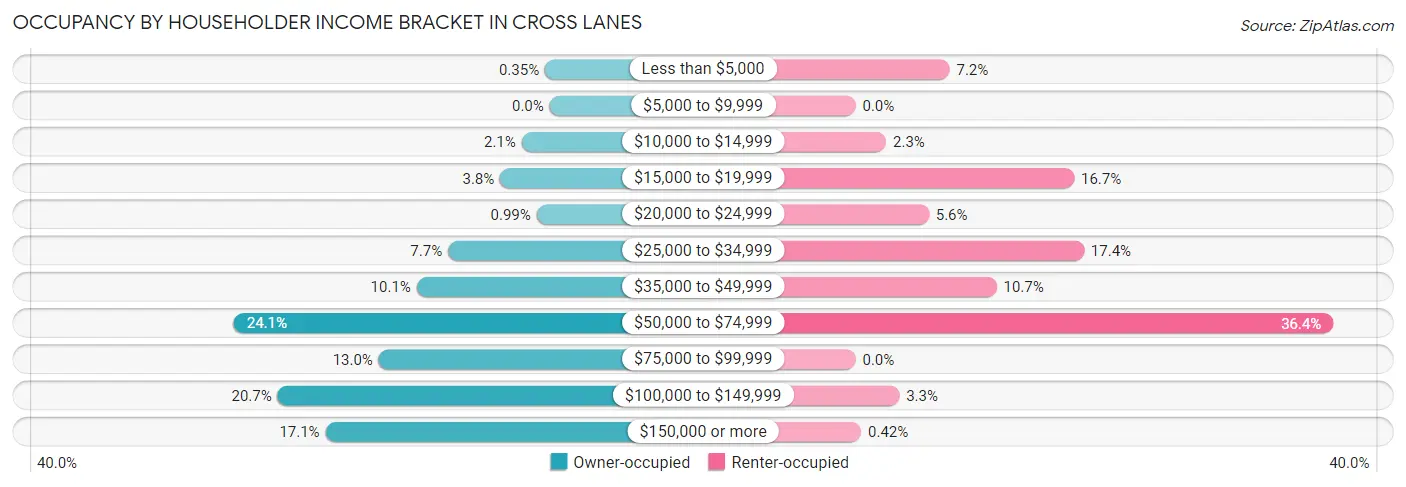
| Income Bracket | Owner-occupied | Renter-occupied |
| Less than $5,000 | 12 (0.4%) | 86 (7.2%) |
| $5,000 to $9,999 | 0 (0.0%) | 0 (0.0%) |
| $10,000 to $14,999 | 73 (2.1%) | 28 (2.3%) |
| $15,000 to $19,999 | 129 (3.8%) | 200 (16.7%) |
| $20,000 to $24,999 | 34 (1.0%) | 67 (5.6%) |
| $25,000 to $34,999 | 265 (7.7%) | 209 (17.4%) |
| $35,000 to $49,999 | 347 (10.1%) | 129 (10.7%) |
| $50,000 to $74,999 | 824 (24.1%) | 437 (36.4%) |
| $75,000 to $99,999 | 446 (13.0%) | 0 (0.0%) |
| $100,000 to $149,999 | 710 (20.7%) | 40 (3.3%) |
| $150,000 or more | 585 (17.1%) | 5 (0.4%) |
| Total | 3,425 (100.0%) | 1,201 (100.0%) |
Monthly Housing Cost Tiers in Cross Lanes
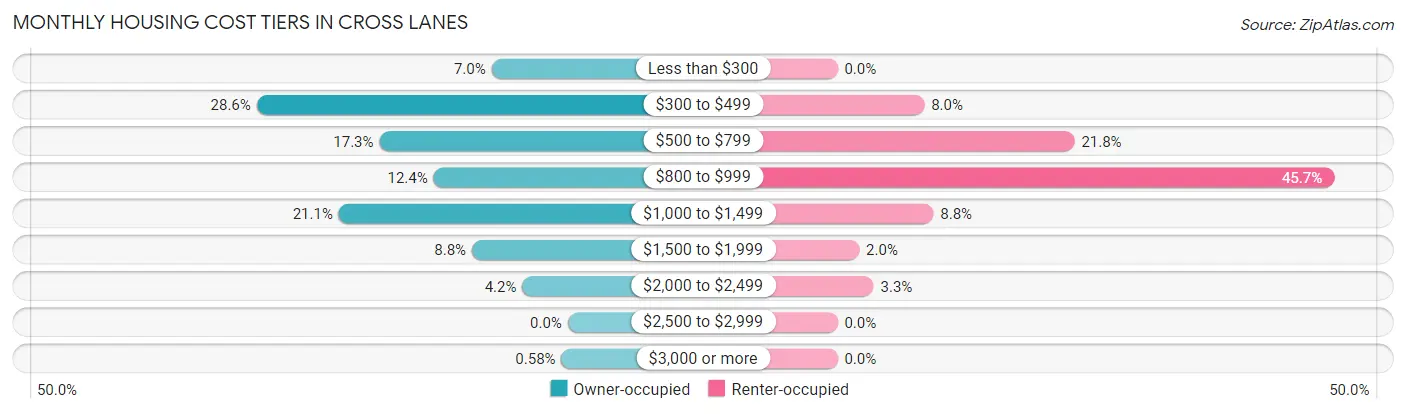
| Monthly Cost | Owner-occupied | Renter-occupied |
| Less than $300 | 240 (7.0%) | 0 (0.0%) |
| $300 to $499 | 981 (28.6%) | 96 (8.0%) |
| $500 to $799 | 594 (17.3%) | 262 (21.8%) |
| $800 to $999 | 423 (12.3%) | 549 (45.7%) |
| $1,000 to $1,499 | 722 (21.1%) | 106 (8.8%) |
| $1,500 to $1,999 | 302 (8.8%) | 24 (2.0%) |
| $2,000 to $2,499 | 143 (4.2%) | 40 (3.3%) |
| $2,500 to $2,999 | 0 (0.0%) | 0 (0.0%) |
| $3,000 or more | 20 (0.6%) | 0 (0.0%) |
| Total | 3,425 (100.0%) | 1,201 (100.0%) |
Physical Housing Characteristics in Cross Lanes
Housing Structures in Cross Lanes
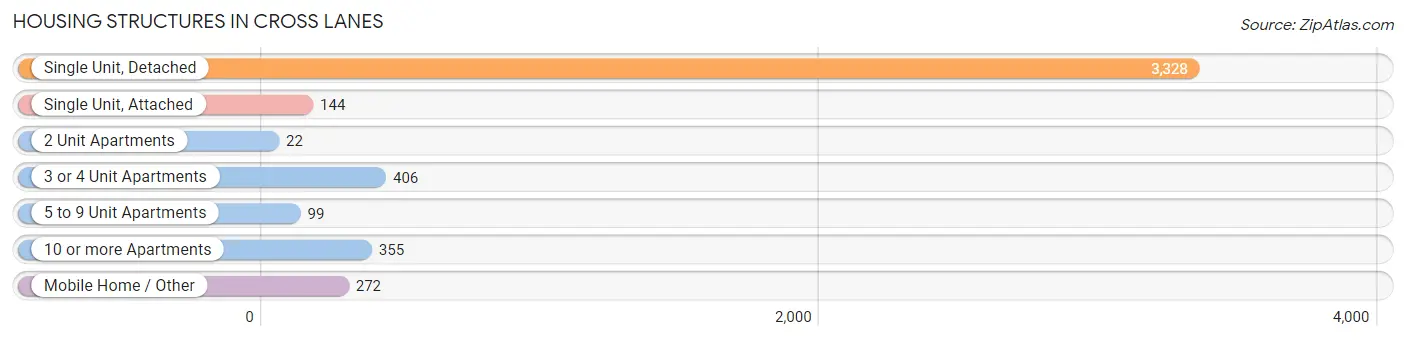
| Structure Type | # Housing Units | % Housing Units |
| Single Unit, Detached | 3,328 | 71.9% |
| Single Unit, Attached | 144 | 3.1% |
| 2 Unit Apartments | 22 | 0.5% |
| 3 or 4 Unit Apartments | 406 | 8.8% |
| 5 to 9 Unit Apartments | 99 | 2.1% |
| 10 or more Apartments | 355 | 7.7% |
| Mobile Home / Other | 272 | 5.9% |
| Total | 4,626 | 100.0% |
Housing Structures by Occupancy in Cross Lanes
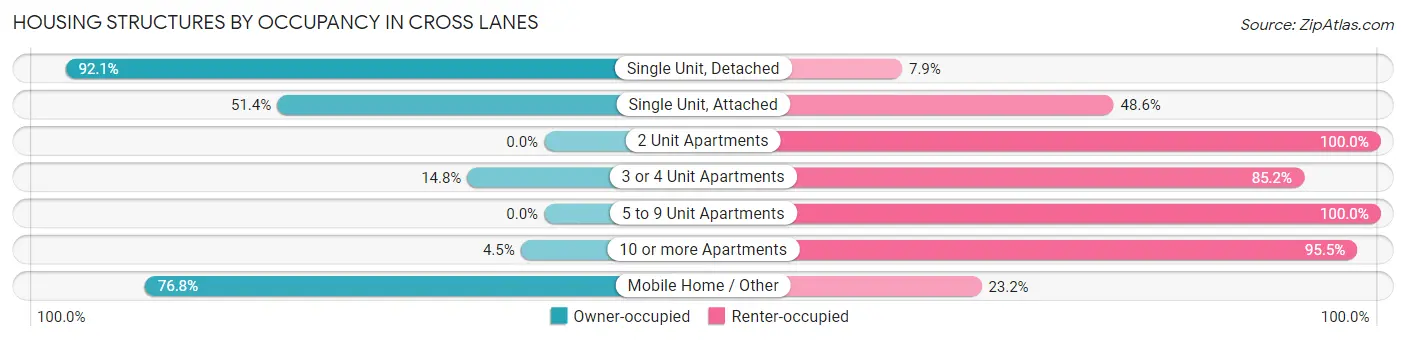
| Structure Type | Owner-occupied | Renter-occupied |
| Single Unit, Detached | 3,066 (92.1%) | 262 (7.9%) |
| Single Unit, Attached | 74 (51.4%) | 70 (48.6%) |
| 2 Unit Apartments | 0 (0.0%) | 22 (100.0%) |
| 3 or 4 Unit Apartments | 60 (14.8%) | 346 (85.2%) |
| 5 to 9 Unit Apartments | 0 (0.0%) | 99 (100.0%) |
| 10 or more Apartments | 16 (4.5%) | 339 (95.5%) |
| Mobile Home / Other | 209 (76.8%) | 63 (23.2%) |
| Total | 3,425 (74.0%) | 1,201 (26.0%) |
Housing Structures by Number of Rooms in Cross Lanes
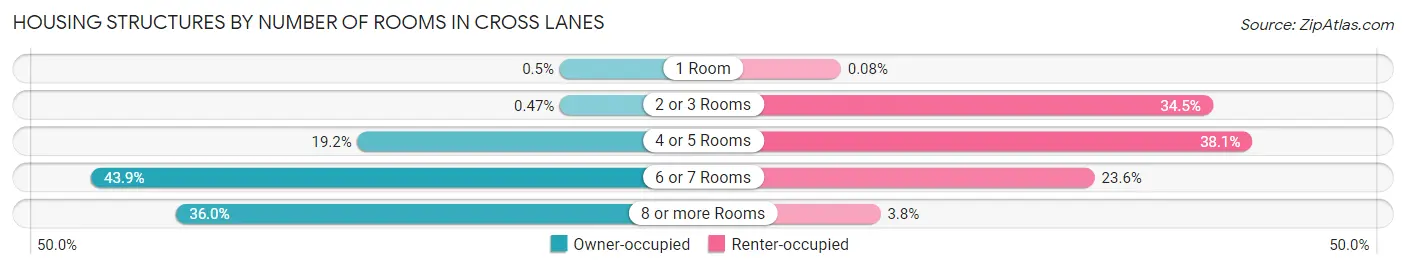
| Number of Rooms | Owner-occupied | Renter-occupied |
| 1 Room | 17 (0.5%) | 1 (0.1%) |
| 2 or 3 Rooms | 16 (0.5%) | 414 (34.5%) |
| 4 or 5 Rooms | 658 (19.2%) | 458 (38.1%) |
| 6 or 7 Rooms | 1,502 (43.9%) | 283 (23.6%) |
| 8 or more Rooms | 1,232 (36.0%) | 45 (3.7%) |
| Total | 3,425 (100.0%) | 1,201 (100.0%) |
Housing Structure by Heating Type in Cross Lanes
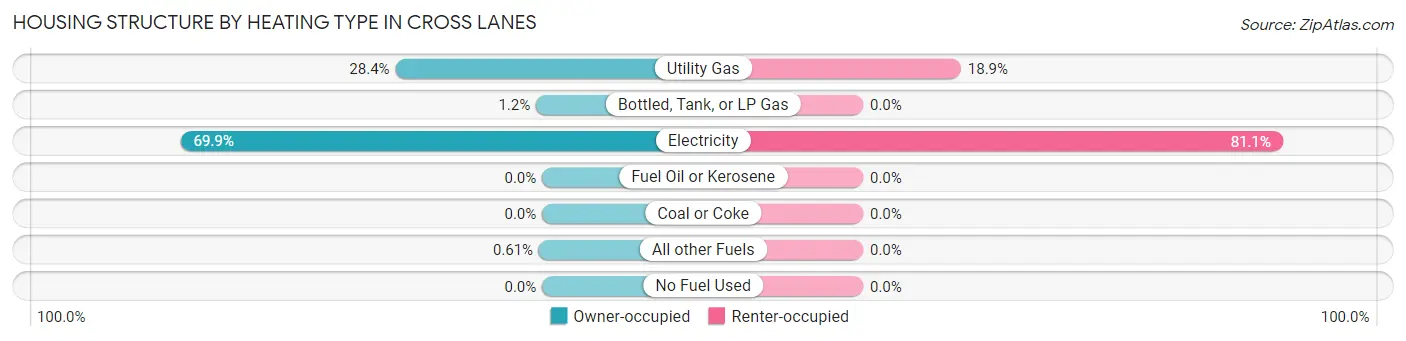
| Heating Type | Owner-occupied | Renter-occupied |
| Utility Gas | 971 (28.3%) | 227 (18.9%) |
| Bottled, Tank, or LP Gas | 40 (1.2%) | 0 (0.0%) |
| Electricity | 2,393 (69.9%) | 974 (81.1%) |
| Fuel Oil or Kerosene | 0 (0.0%) | 0 (0.0%) |
| Coal or Coke | 0 (0.0%) | 0 (0.0%) |
| All other Fuels | 21 (0.6%) | 0 (0.0%) |
| No Fuel Used | 0 (0.0%) | 0 (0.0%) |
| Total | 3,425 (100.0%) | 1,201 (100.0%) |
Household Vehicle Usage in Cross Lanes
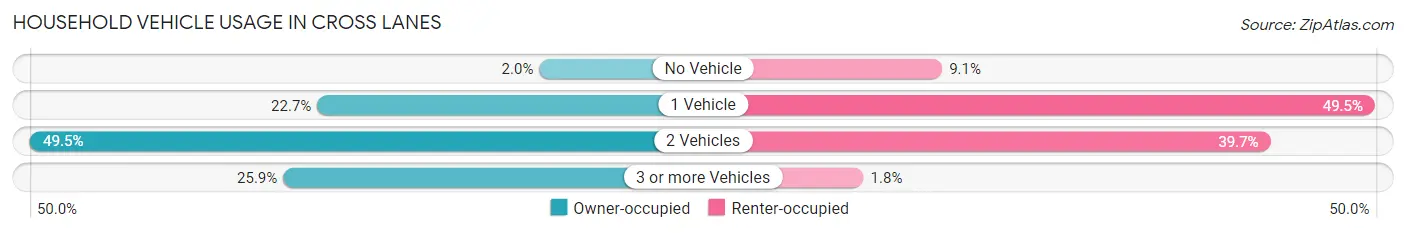
| Vehicles per Household | Owner-occupied | Renter-occupied |
| No Vehicle | 67 (2.0%) | 109 (9.1%) |
| 1 Vehicle | 777 (22.7%) | 594 (49.5%) |
| 2 Vehicles | 1,695 (49.5%) | 477 (39.7%) |
| 3 or more Vehicles | 886 (25.9%) | 21 (1.8%) |
| Total | 3,425 (100.0%) | 1,201 (100.0%) |
Real Estate & Mortgages in Cross Lanes
Real Estate and Mortgage Overview in Cross Lanes
| Characteristic | Without Mortgage | With Mortgage |
| Housing Units | 1,616 | 1,809 |
| Median Property Value | $111,300 | $154,100 |
| Median Household Income | $56,439 | $542 |
| Monthly Housing Costs | $397 | $20 |
| Real Estate Taxes | $759 | $18 |
Property Value by Mortgage Status in Cross Lanes
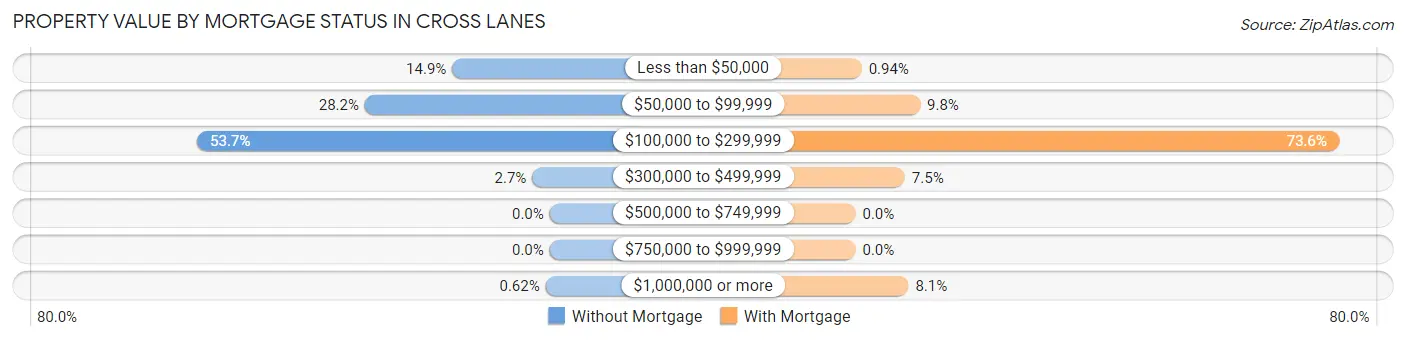
| Property Value | Without Mortgage | With Mortgage |
| Less than $50,000 | 240 (14.8%) | 17 (0.9%) |
| $50,000 to $99,999 | 455 (28.2%) | 178 (9.8%) |
| $100,000 to $299,999 | 868 (53.7%) | 1,332 (73.6%) |
| $300,000 to $499,999 | 43 (2.7%) | 136 (7.5%) |
| $500,000 to $749,999 | 0 (0.0%) | 0 (0.0%) |
| $750,000 to $999,999 | 0 (0.0%) | 0 (0.0%) |
| $1,000,000 or more | 10 (0.6%) | 146 (8.1%) |
| Total | 1,616 (100.0%) | 1,809 (100.0%) |
Household Income by Mortgage Status in Cross Lanes
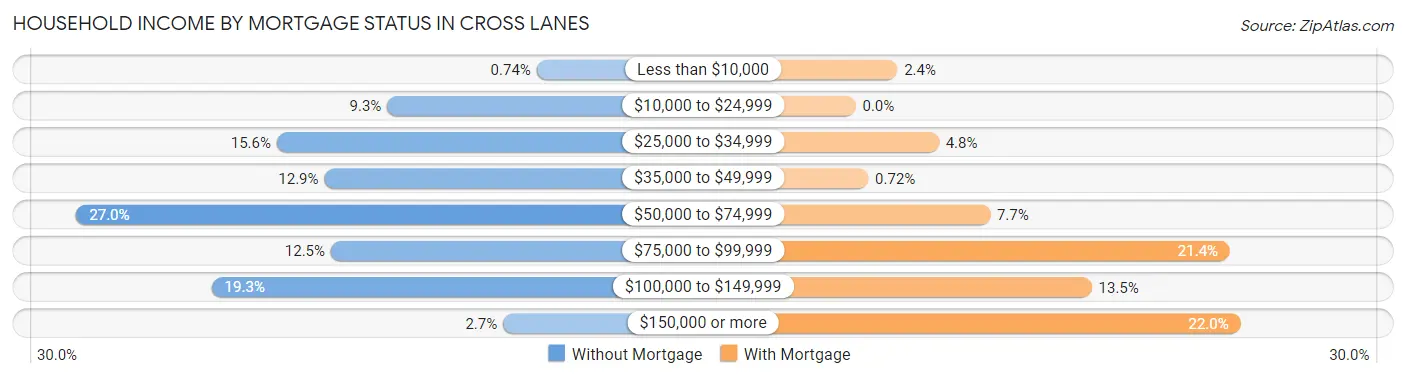
| Household Income | Without Mortgage | With Mortgage |
| Less than $10,000 | 12 (0.7%) | 43 (2.4%) |
| $10,000 to $24,999 | 150 (9.3%) | 0 (0.0%) |
| $25,000 to $34,999 | 252 (15.6%) | 86 (4.8%) |
| $35,000 to $49,999 | 208 (12.9%) | 13 (0.7%) |
| $50,000 to $74,999 | 437 (27.0%) | 139 (7.7%) |
| $75,000 to $99,999 | 202 (12.5%) | 387 (21.4%) |
| $100,000 to $149,999 | 312 (19.3%) | 244 (13.5%) |
| $150,000 or more | 43 (2.7%) | 398 (22.0%) |
| Total | 1,616 (100.0%) | 1,809 (100.0%) |
Property Value to Household Income Ratio in Cross Lanes
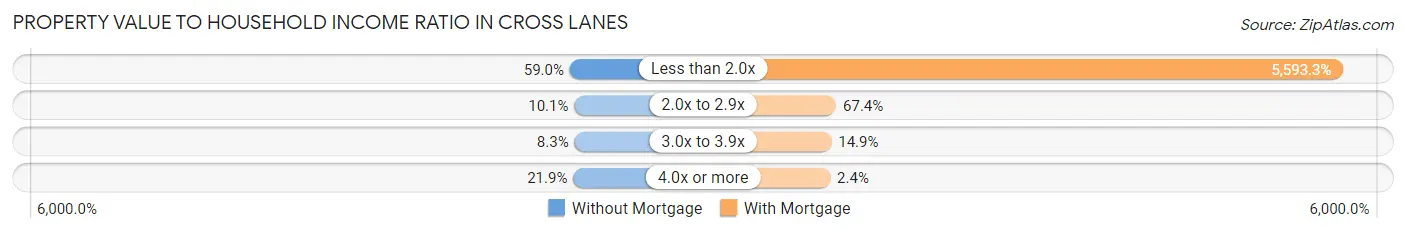
| Value-to-Income Ratio | Without Mortgage | With Mortgage |
| Less than 2.0x | 953 (59.0%) | 101,183 (5,593.3%) |
| 2.0x to 2.9x | 163 (10.1%) | 1,220 (67.4%) |
| 3.0x to 3.9x | 134 (8.3%) | 270 (14.9%) |
| 4.0x or more | 354 (21.9%) | 43 (2.4%) |
| Total | 1,616 (100.0%) | 1,809 (100.0%) |
Real Estate Taxes by Mortgage Status in Cross Lanes
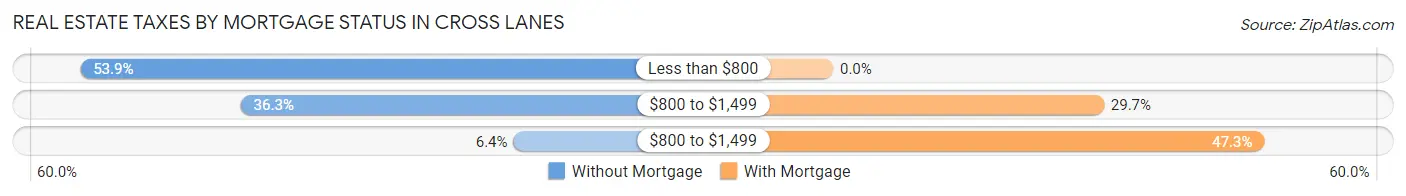
| Property Taxes | Without Mortgage | With Mortgage |
| Less than $800 | 871 (53.9%) | 0 (0.0%) |
| $800 to $1,499 | 587 (36.3%) | 537 (29.7%) |
| $800 to $1,499 | 104 (6.4%) | 855 (47.3%) |
| Total | 1,616 (100.0%) | 1,809 (100.0%) |
Health & Disability in Cross Lanes
Health Insurance Coverage by Age in Cross Lanes
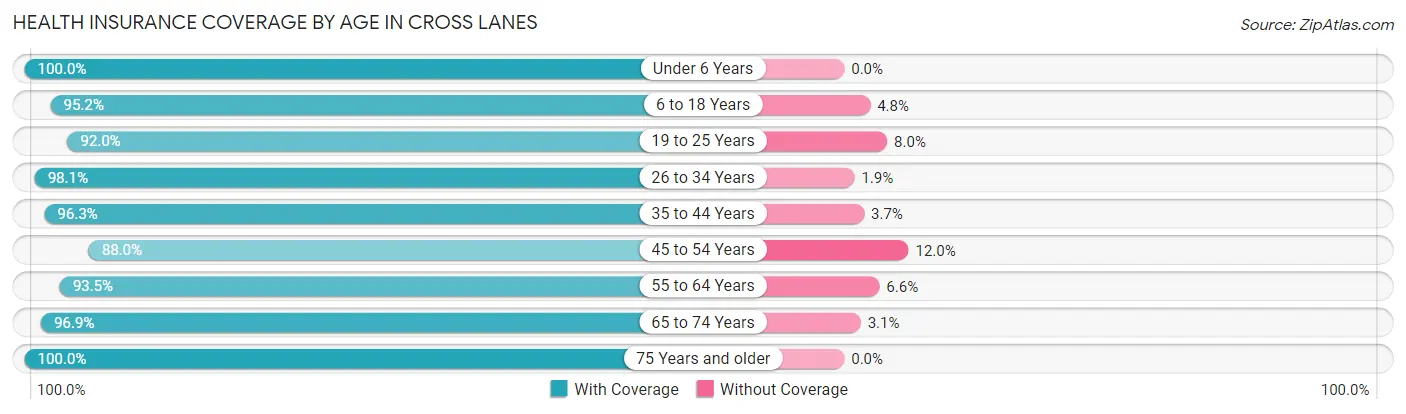
| Age Bracket | With Coverage | Without Coverage |
| Under 6 Years | 702 (100.0%) | 0 (0.0%) |
| 6 to 18 Years | 1,102 (95.2%) | 56 (4.8%) |
| 19 to 25 Years | 991 (92.0%) | 86 (8.0%) |
| 26 to 34 Years | 1,034 (98.1%) | 20 (1.9%) |
| 35 to 44 Years | 1,120 (96.3%) | 43 (3.7%) |
| 45 to 54 Years | 1,447 (88.0%) | 197 (12.0%) |
| 55 to 64 Years | 1,113 (93.4%) | 78 (6.6%) |
| 65 to 74 Years | 1,424 (96.9%) | 45 (3.1%) |
| 75 Years and older | 565 (100.0%) | 0 (0.0%) |
| Total | 9,498 (94.8%) | 525 (5.2%) |
Health Insurance Coverage by Citizenship Status in Cross Lanes
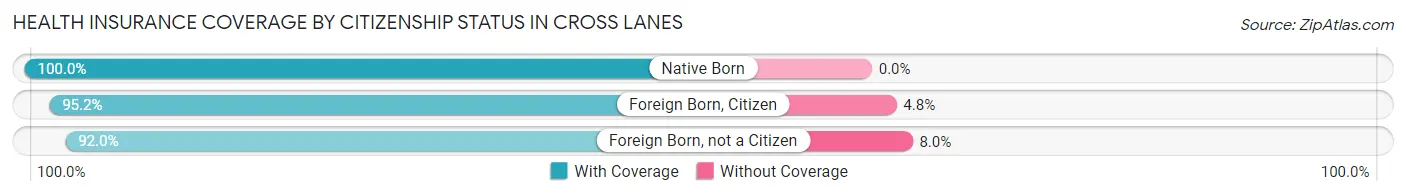
| Citizenship Status | With Coverage | Without Coverage |
| Native Born | 702 (100.0%) | 0 (0.0%) |
| Foreign Born, Citizen | 1,102 (95.2%) | 56 (4.8%) |
| Foreign Born, not a Citizen | 991 (92.0%) | 86 (8.0%) |
Health Insurance Coverage by Household Income in Cross Lanes
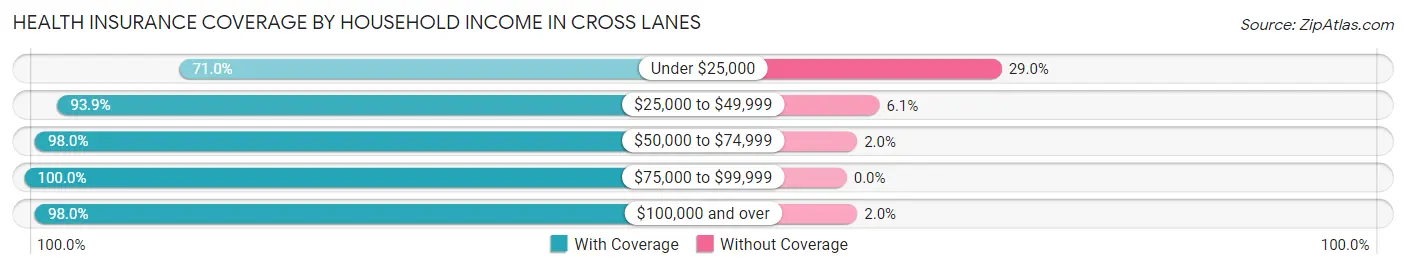
| Household Income | With Coverage | Without Coverage |
| Under $25,000 | 702 (71.0%) | 287 (29.0%) |
| $25,000 to $49,999 | 1,787 (93.9%) | 117 (6.1%) |
| $50,000 to $74,999 | 2,001 (98.0%) | 40 (2.0%) |
| $75,000 to $99,999 | 1,019 (100.0%) | 0 (0.0%) |
| $100,000 and over | 3,976 (98.0%) | 80 (2.0%) |
Public vs Private Health Insurance Coverage by Age in Cross Lanes
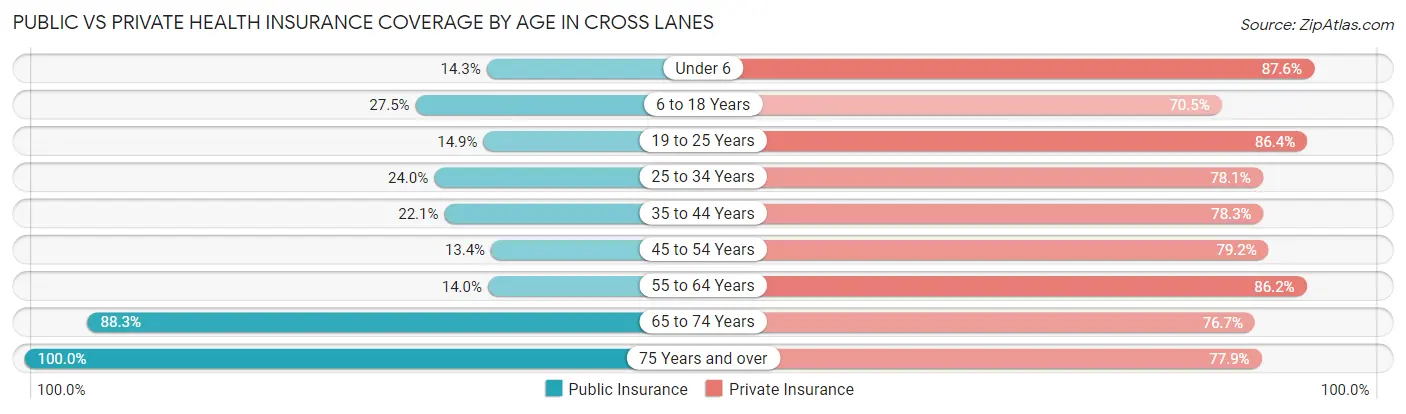
| Age Bracket | Public Insurance | Private Insurance |
| Under 6 | 100 (14.2%) | 615 (87.6%) |
| 6 to 18 Years | 318 (27.5%) | 816 (70.5%) |
| 19 to 25 Years | 160 (14.9%) | 930 (86.4%) |
| 25 to 34 Years | 253 (24.0%) | 823 (78.1%) |
| 35 to 44 Years | 257 (22.1%) | 910 (78.2%) |
| 45 to 54 Years | 221 (13.4%) | 1,302 (79.2%) |
| 55 to 64 Years | 167 (14.0%) | 1,027 (86.2%) |
| 65 to 74 Years | 1,297 (88.3%) | 1,126 (76.6%) |
| 75 Years and over | 565 (100.0%) | 440 (77.9%) |
| Total | 3,338 (33.3%) | 7,989 (79.7%) |
Disability Status by Sex by Age in Cross Lanes
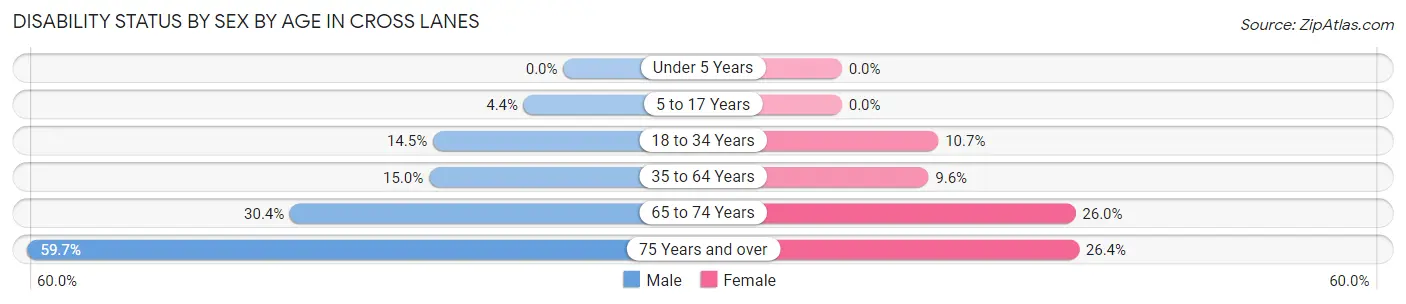
| Age Bracket | Male | Female |
| Under 5 Years | 0 (0.0%) | 0 (0.0%) |
| 5 to 17 Years | 21 (4.4%) | 0 (0.0%) |
| 18 to 34 Years | 165 (14.5%) | 117 (10.7%) |
| 35 to 64 Years | 300 (15.0%) | 192 (9.6%) |
| 65 to 74 Years | 213 (30.4%) | 200 (26.0%) |
| 75 Years and over | 145 (59.7%) | 85 (26.4%) |
Disability Class by Sex by Age in Cross Lanes
Disability Class: Hearing Difficulty
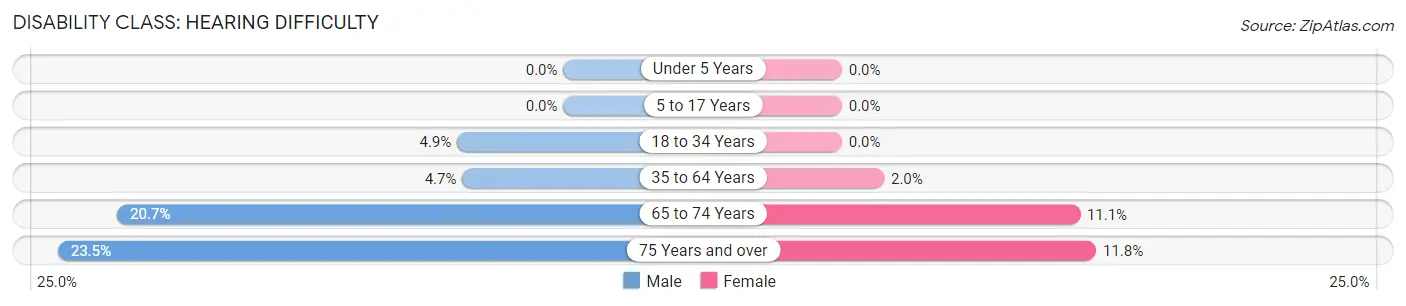
| Age Bracket | Male | Female |
| Under 5 Years | 0 (0.0%) | 0 (0.0%) |
| 5 to 17 Years | 0 (0.0%) | 0 (0.0%) |
| 18 to 34 Years | 56 (4.9%) | 0 (0.0%) |
| 35 to 64 Years | 94 (4.7%) | 39 (2.0%) |
| 65 to 74 Years | 145 (20.7%) | 85 (11.1%) |
| 75 Years and over | 57 (23.5%) | 38 (11.8%) |
Disability Class: Vision Difficulty
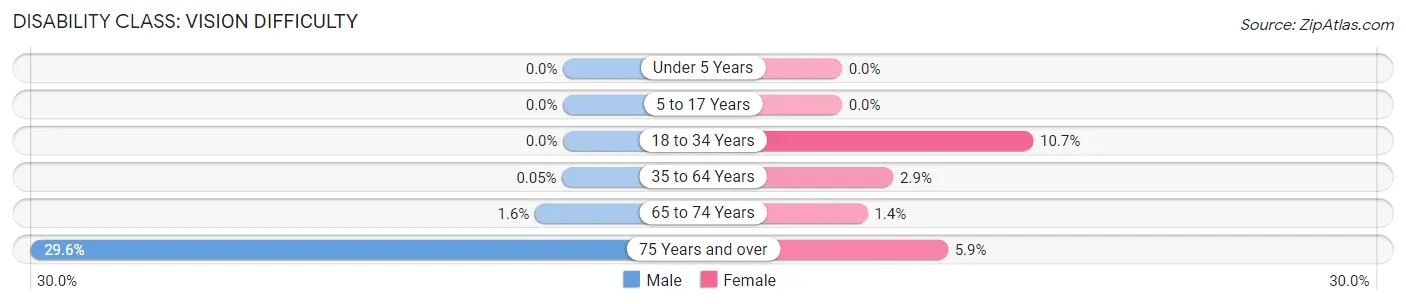
| Age Bracket | Male | Female |
| Under 5 Years | 0 (0.0%) | 0 (0.0%) |
| 5 to 17 Years | 0 (0.0%) | 0 (0.0%) |
| 18 to 34 Years | 0 (0.0%) | 116 (10.6%) |
| 35 to 64 Years | 1 (0.1%) | 57 (2.9%) |
| 65 to 74 Years | 11 (1.6%) | 11 (1.4%) |
| 75 Years and over | 72 (29.6%) | 19 (5.9%) |
Disability Class: Cognitive Difficulty
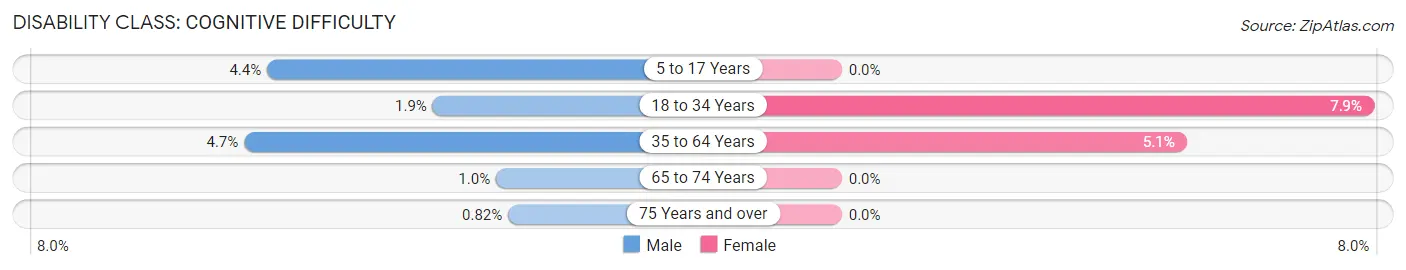
| Age Bracket | Male | Female |
| 5 to 17 Years | 21 (4.4%) | 0 (0.0%) |
| 18 to 34 Years | 22 (1.9%) | 86 (7.9%) |
| 35 to 64 Years | 95 (4.7%) | 102 (5.1%) |
| 65 to 74 Years | 7 (1.0%) | 0 (0.0%) |
| 75 Years and over | 2 (0.8%) | 0 (0.0%) |
Disability Class: Ambulatory Difficulty
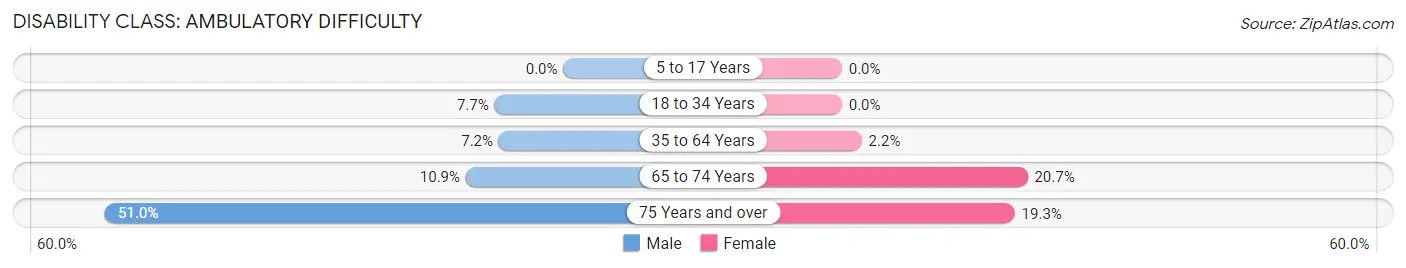
| Age Bracket | Male | Female |
| 5 to 17 Years | 0 (0.0%) | 0 (0.0%) |
| 18 to 34 Years | 87 (7.7%) | 0 (0.0%) |
| 35 to 64 Years | 144 (7.2%) | 44 (2.2%) |
| 65 to 74 Years | 76 (10.9%) | 159 (20.7%) |
| 75 Years and over | 124 (51.0%) | 62 (19.3%) |
Disability Class: Self-Care Difficulty
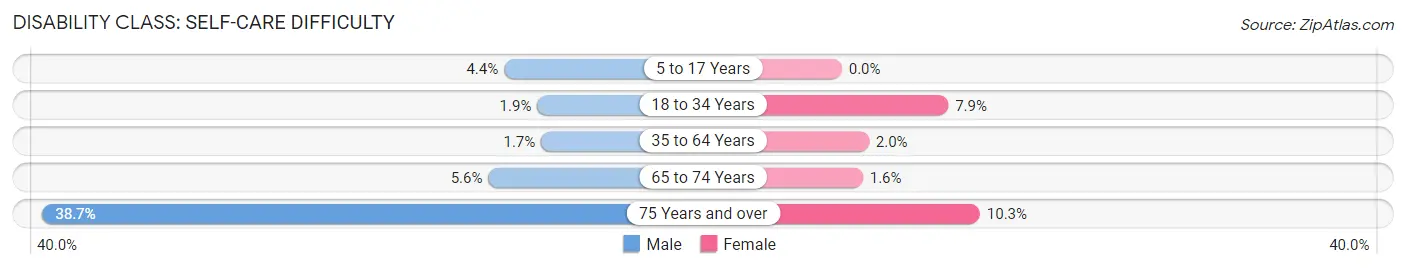
| Age Bracket | Male | Female |
| 5 to 17 Years | 21 (4.4%) | 0 (0.0%) |
| 18 to 34 Years | 22 (1.9%) | 86 (7.9%) |
| 35 to 64 Years | 33 (1.7%) | 40 (2.0%) |
| 65 to 74 Years | 39 (5.6%) | 12 (1.6%) |
| 75 Years and over | 94 (38.7%) | 33 (10.2%) |
Technology Access in Cross Lanes
Computing Device Access in Cross Lanes
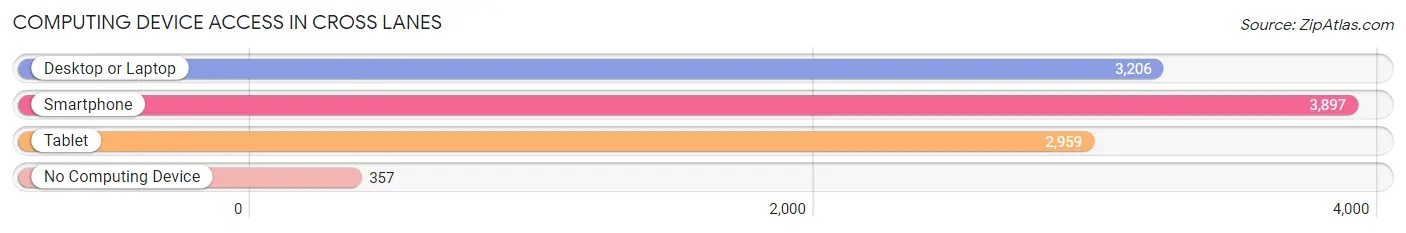
| Device Type | # Households | % Households |
| Desktop or Laptop | 3,206 | 69.3% |
| Smartphone | 3,897 | 84.2% |
| Tablet | 2,959 | 64.0% |
| No Computing Device | 357 | 7.7% |
| Total | 4,626 | 100.0% |
Internet Access in Cross Lanes
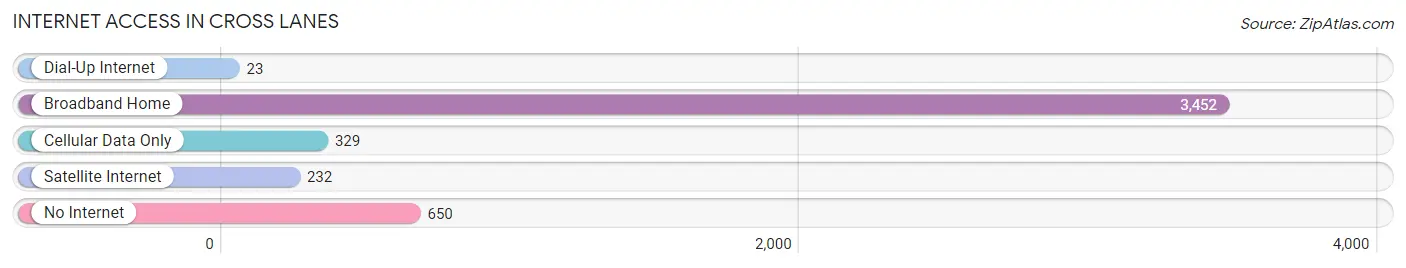
| Internet Type | # Households | % Households |
| Dial-Up Internet | 23 | 0.5% |
| Broadband Home | 3,452 | 74.6% |
| Cellular Data Only | 329 | 7.1% |
| Satellite Internet | 232 | 5.0% |
| No Internet | 650 | 14.1% |
| Total | 4,626 | 100.0% |
Cross Lanes Summary
Cross Lanes is a census-designated place (CDP) located in Kanawha County, West Virginia. It is located just outside of Charleston, the state capital, and is part of the Charleston metropolitan area. As of the 2010 census, the population of Cross Lanes was 8,743.
History
Cross Lanes was first settled in the late 1700s by a group of settlers from Pennsylvania. The area was originally known as “Crossroads” due to its location at the intersection of two major roads. The name was later changed to “Cross Lanes” when a post office was established in the area in 1845.
The area was primarily agricultural until the 1950s, when the population began to grow rapidly due to the development of the nearby Charleston metropolitan area. The population of Cross Lanes has continued to grow since then, and the area is now home to a variety of businesses and services.
Geography
Cross Lanes is located in Kanawha County, West Virginia, at the intersection of two major roads: Interstate 64 and U.S. Route 60. The area is located just outside of Charleston, the state capital, and is part of the Charleston metropolitan area.
The terrain of Cross Lanes is mostly flat, with some rolling hills in the area. The area is located in the Appalachian Mountains, and is surrounded by forests and woodlands. The climate of Cross Lanes is humid subtropical, with hot, humid summers and mild winters.
Economy
Cross Lanes is primarily a residential area, but it is also home to a variety of businesses and services. The area is home to several retail stores, restaurants, and other businesses. The area is also home to several medical facilities, including a hospital and several clinics.
The economy of Cross Lanes is largely driven by the nearby Charleston metropolitan area. The area is home to several large employers, including the Charleston Area Medical Center, the University of Charleston, and the West Virginia State University.
Demographics
As of the 2010 census, the population of Cross Lanes was 8,743. The population is primarily white (90.2%), with a small percentage of African Americans (4.2%) and Hispanics (2.3%). The median household income in Cross Lanes is $45,945, and the median age is 38.
Cross Lanes is a diverse community, with a variety of religious denominations represented. The largest religious group in Cross Lanes is the Catholic Church, followed by the United Methodist Church and the Church of Jesus Christ of Latter-day Saints.
Conclusion
Cross Lanes is a census-designated place located in Kanawha County, West Virginia. It is located just outside of Charleston, the state capital, and is part of the Charleston metropolitan area. The area was first settled in the late 1700s, and has since grown to become a residential area with a variety of businesses and services. The population of Cross Lanes is primarily white, with a small percentage of African Americans and Hispanics. The economy of Cross Lanes is largely driven by the nearby Charleston metropolitan area, and the area is home to several large employers.
Common Questions
What is Per Capita Income in Cross Lanes?
Per Capita income in Cross Lanes is $34,779.
What is the Median Family Income in Cross Lanes?
Median Family Income in Cross Lanes is $76,250.
What is the Median Household income in Cross Lanes?
Median Household Income in Cross Lanes is $58,696.
What is Income or Wage Gap in Cross Lanes?
Income or Wage Gap in Cross Lanes is 26.7%.
Women in Cross Lanes earn 73.3 cents for every dollar earned by a man.
What is Family Income Deficit in Cross Lanes?
Family Income Deficit in Cross Lanes is $11,841.
Families that are below poverty line in Cross Lanes earn $11,841 less on average than the poverty threshold level.
What is Inequality or Gini Index in Cross Lanes?
Inequality or Gini Index in Cross Lanes is 0.38.
What is the Total Population of Cross Lanes?
Total Population of Cross Lanes is 10,037.
What is the Total Male Population of Cross Lanes?
Total Male Population of Cross Lanes is 4,950.
What is the Total Female Population of Cross Lanes?
Total Female Population of Cross Lanes is 5,087.
What is the Ratio of Males per 100 Females in Cross Lanes?
There are 97.31 Males per 100 Females in Cross Lanes.
What is the Ratio of Females per 100 Males in Cross Lanes?
There are 102.77 Females per 100 Males in Cross Lanes.
What is the Median Population Age in Cross Lanes?
Median Population Age in Cross Lanes is 43.9 Years.
What is the Average Family Size in Cross Lanes
Average Family Size in Cross Lanes is 2.7 People.
What is the Average Household Size in Cross Lanes
Average Household Size in Cross Lanes is 2.2 People.
How Large is the Labor Force in Cross Lanes?
There are 5,350 People in the Labor Forcein in Cross Lanes.
What is the Percentage of People in the Labor Force in Cross Lanes?
62.7% of People are in the Labor Force in Cross Lanes.
What is the Unemployment Rate in Cross Lanes?
Unemployment Rate in Cross Lanes is 5.2%.