Ravenswood, WV Map & Demographics
Ravenswood Map
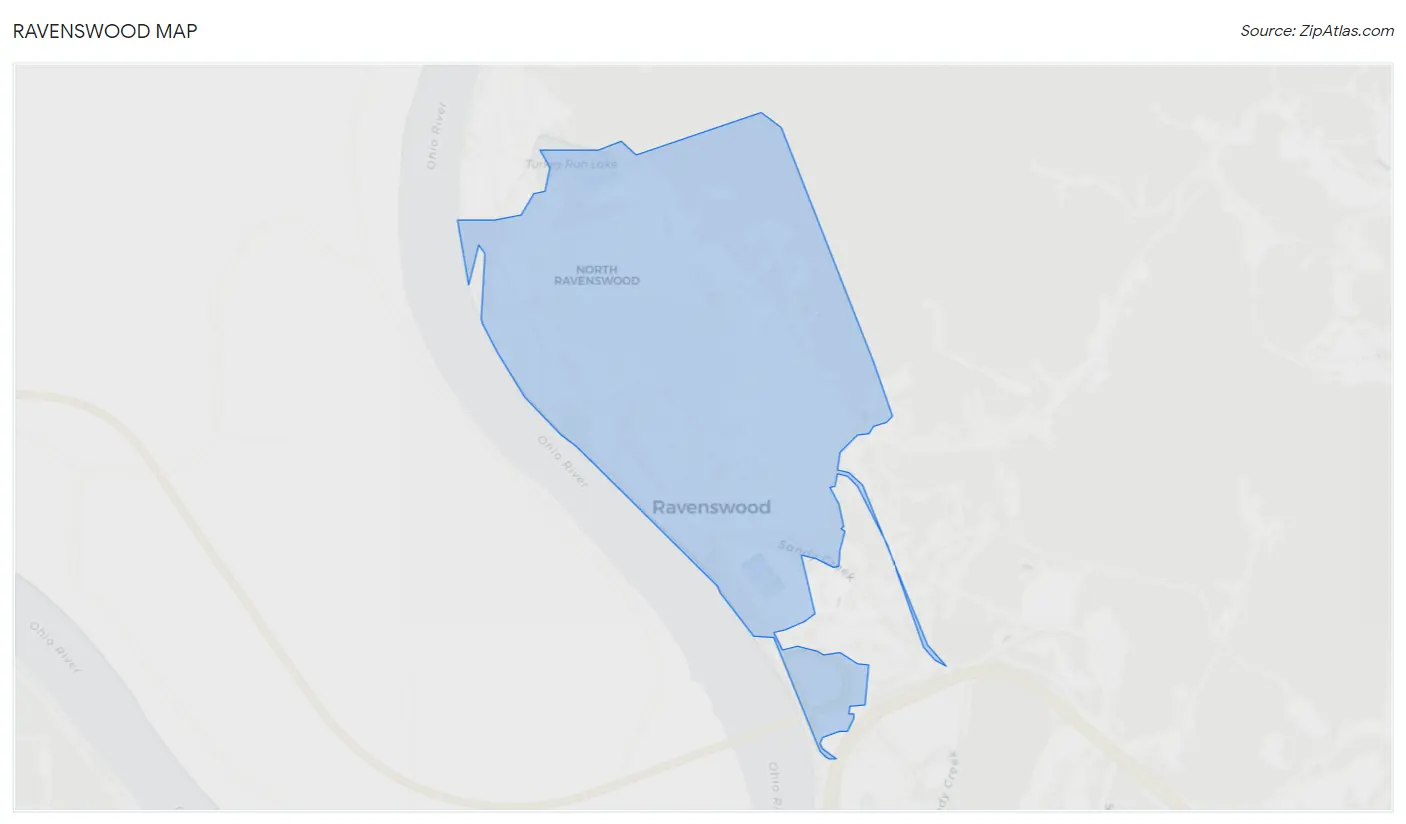
Ravenswood Overview
$35,031
PER CAPITA INCOME
$63,004
AVG FAMILY INCOME
$31,818
AVG HOUSEHOLD INCOME
2.2%
WAGE / INCOME GAP [ % ]
97.8¢/ $1
WAGE / INCOME GAP [ $ ]
0.64
INEQUALITY / GINI INDEX
3,853
TOTAL POPULATION
1,694
MALE POPULATION
2,159
FEMALE POPULATION
78.46
MALES / 100 FEMALES
127.45
FEMALES / 100 MALES
39.8
MEDIAN AGE
3.2
AVG FAMILY SIZE
2.5
AVG HOUSEHOLD SIZE
1,571
LABOR FORCE [ PEOPLE ]
51.0%
PERCENT IN LABOR FORCE
6.4%
UNEMPLOYMENT RATE
Ravenswood Zip Codes
Ravenswood Area Codes
Income in Ravenswood
Income Overview in Ravenswood
Per Capita Income in Ravenswood is $35,031, while median incomes of families and households are $63,004 and $31,818 respectively.
| Characteristic | Number | Measure |
| Per Capita Income | 3,853 | $35,031 |
| Median Family Income | 887 | $63,004 |
| Mean Family Income | 887 | $77,864 |
| Median Household Income | 1,510 | $31,818 |
| Mean Household Income | 1,510 | $80,482 |
| Income Deficit | 887 | $0 |
| Wage / Income Gap (%) | 3,853 | 2.17% |
| Wage / Income Gap ($) | 3,853 | 97.83¢ per $1 |
| Gini / Inequality Index | 3,853 | 0.64 |
Earnings by Sex in Ravenswood
Average Earnings in Ravenswood are $31,354, $31,528 for men and $30,844 for women, a difference of 2.2%.
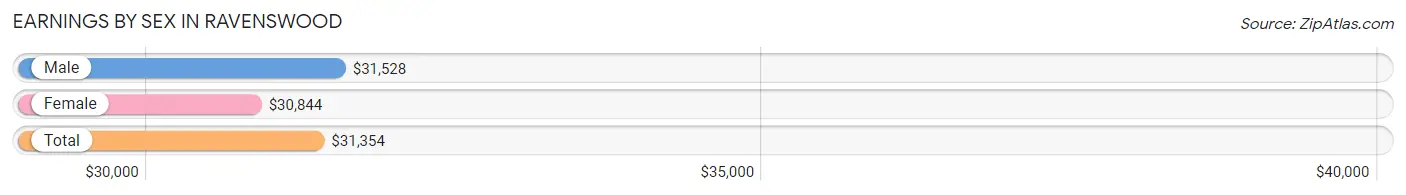
| Sex | Number | Average Earnings |
| Male | 759 (48.8%) | $31,528 |
| Female | 797 (51.2%) | $30,844 |
| Total | 1,556 (100.0%) | $31,354 |
Earnings by Sex by Income Bracket in Ravenswood
The most common earnings brackets in Ravenswood are $30,000 to $34,999 for men (133 | 17.5%) and $75,000 to $99,999 for women (173 | 21.7%).
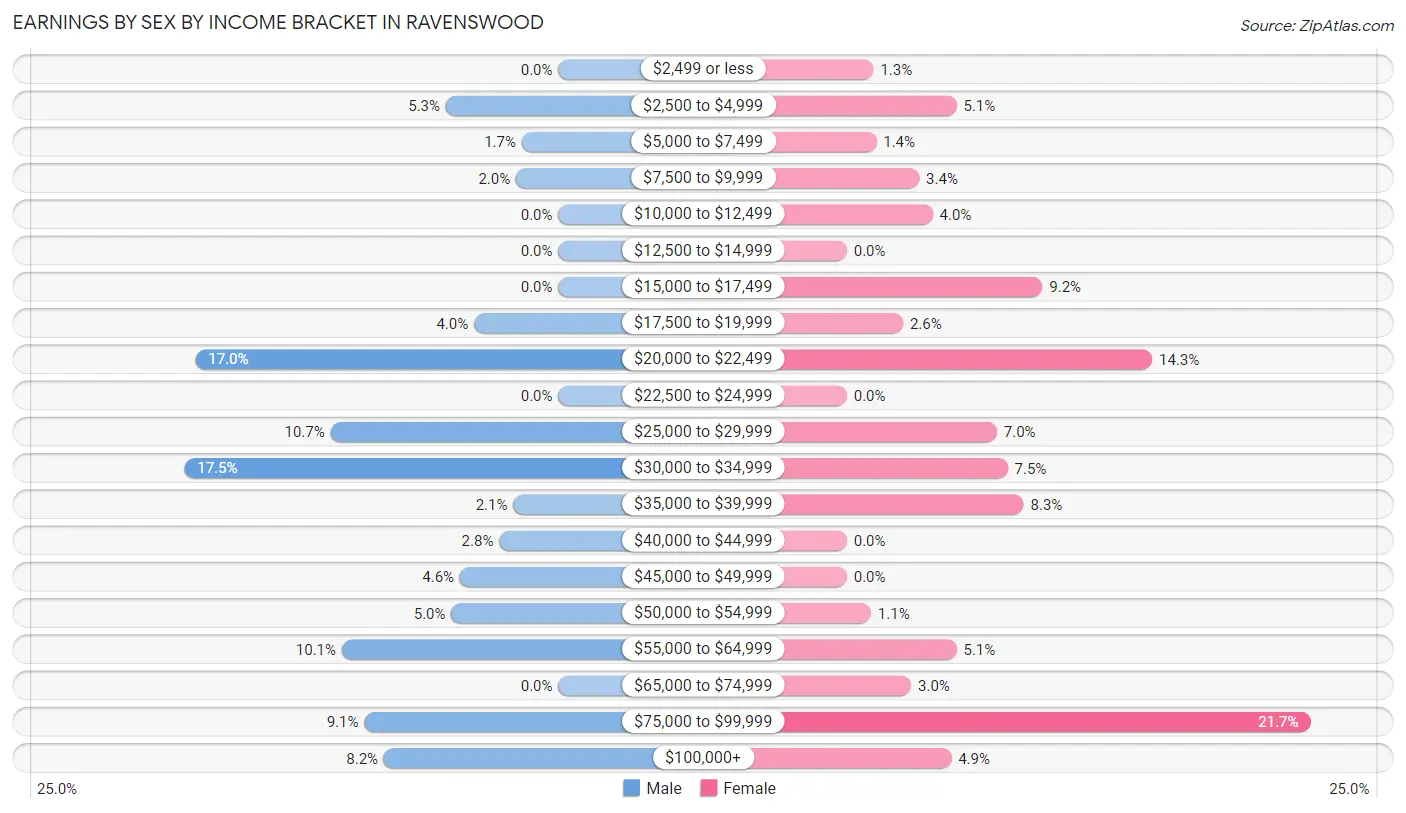
| Income | Male | Female |
| $2,499 or less | 0 (0.0%) | 10 (1.3%) |
| $2,500 to $4,999 | 40 (5.3%) | 41 (5.1%) |
| $5,000 to $7,499 | 13 (1.7%) | 11 (1.4%) |
| $7,500 to $9,999 | 15 (2.0%) | 27 (3.4%) |
| $10,000 to $12,499 | 0 (0.0%) | 32 (4.0%) |
| $12,500 to $14,999 | 0 (0.0%) | 0 (0.0%) |
| $15,000 to $17,499 | 0 (0.0%) | 73 (9.2%) |
| $17,500 to $19,999 | 30 (4.0%) | 21 (2.6%) |
| $20,000 to $22,499 | 129 (17.0%) | 114 (14.3%) |
| $22,500 to $24,999 | 0 (0.0%) | 0 (0.0%) |
| $25,000 to $29,999 | 81 (10.7%) | 56 (7.0%) |
| $30,000 to $34,999 | 133 (17.5%) | 60 (7.5%) |
| $35,000 to $39,999 | 16 (2.1%) | 66 (8.3%) |
| $40,000 to $44,999 | 21 (2.8%) | 0 (0.0%) |
| $45,000 to $49,999 | 35 (4.6%) | 0 (0.0%) |
| $50,000 to $54,999 | 38 (5.0%) | 9 (1.1%) |
| $55,000 to $64,999 | 77 (10.1%) | 41 (5.1%) |
| $65,000 to $74,999 | 0 (0.0%) | 24 (3.0%) |
| $75,000 to $99,999 | 69 (9.1%) | 173 (21.7%) |
| $100,000+ | 62 (8.2%) | 39 (4.9%) |
| Total | 759 (100.0%) | 797 (100.0%) |
Earnings by Sex by Educational Attainment in Ravenswood
Average earnings in Ravenswood are $33,672 for men and $33,938 for women, a difference of 0.8%. Men with an educational attainment of bachelor's degree enjoy the highest average annual earnings of $57,188, while those with bachelor's degree education earn the least with $57,188. Women with an educational attainment of graduate degree earn the most with the average annual earnings of $99,722, while those with bachelor's degree education have the smallest earnings of $39,053.
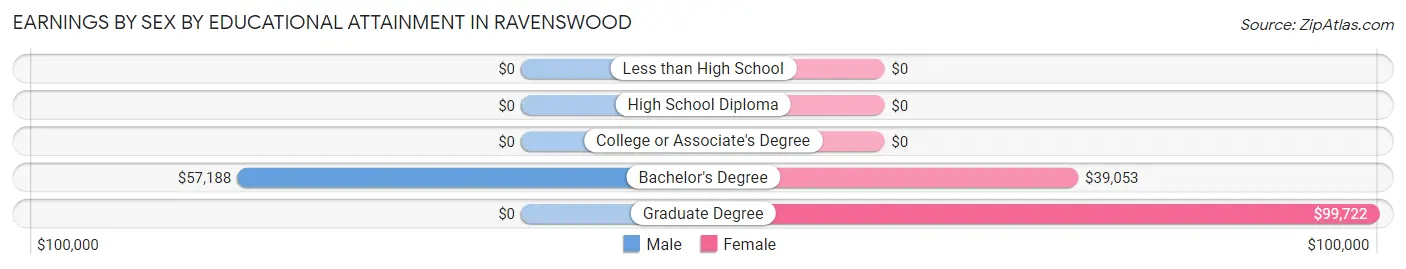
| Educational Attainment | Male Income | Female Income |
| Less than High School | - | - |
| High School Diploma | - | - |
| College or Associate's Degree | - | - |
| Bachelor's Degree | $57,188 | $39,053 |
| Graduate Degree | - | - |
| Total | $33,672 | $33,938 |
Family Income in Ravenswood
Family Income Brackets in Ravenswood
According to the Ravenswood family income data, there are 215 families falling into the $50,000 to $74,999 income range, which is the most common income bracket and makes up 24.2% of all families. Conversely, the $35,000 to $49,999 income bracket is the least frequent group with only 14 families (1.6%) belonging to this category.
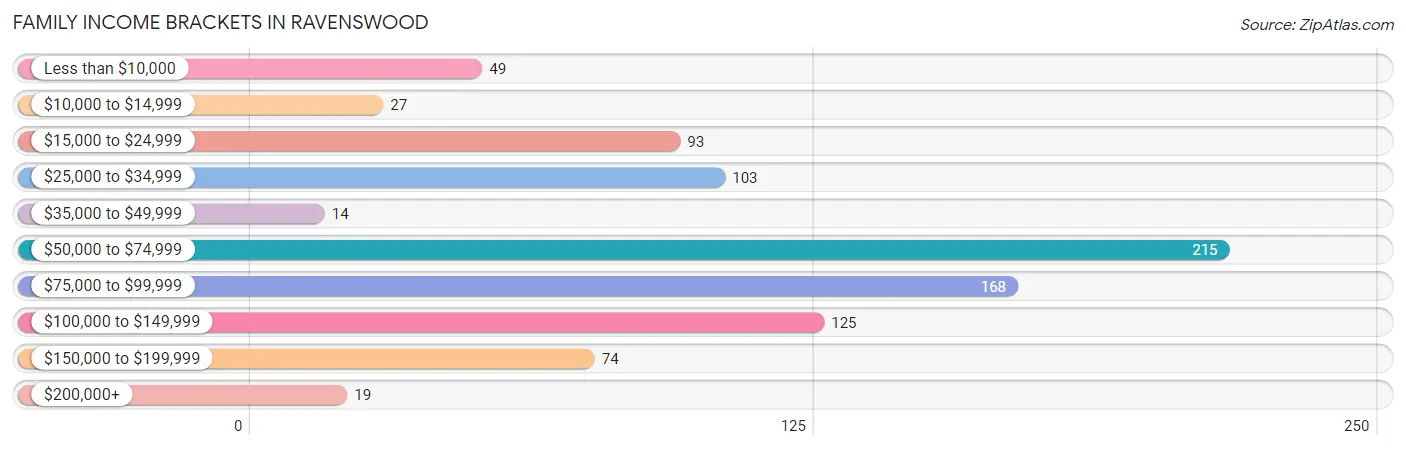
| Income Bracket | # Families | % Families |
| Less than $10,000 | 49 | 5.5% |
| $10,000 to $14,999 | 27 | 3.0% |
| $15,000 to $24,999 | 93 | 10.5% |
| $25,000 to $34,999 | 103 | 11.6% |
| $35,000 to $49,999 | 14 | 1.6% |
| $50,000 to $74,999 | 215 | 24.2% |
| $75,000 to $99,999 | 168 | 18.9% |
| $100,000 to $149,999 | 125 | 14.1% |
| $150,000 to $199,999 | 74 | 8.3% |
| $200,000+ | 19 | 2.1% |
Family Income by Famaliy Size in Ravenswood
2-person families (451 | 50.8%) account for the highest median family income in Ravenswood with $64,617 per family, while 2-person families (451 | 50.8%) have the highest median income of $32,308 per family member.
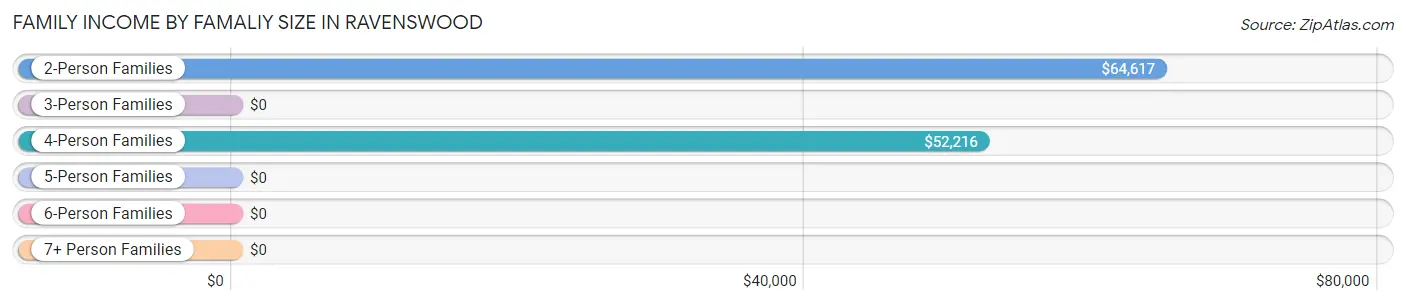
| Income Bracket | # Families | Median Income |
| 2-Person Families | 451 (50.8%) | $64,617 |
| 3-Person Families | 215 (24.2%) | $0 |
| 4-Person Families | 119 (13.4%) | $52,216 |
| 5-Person Families | 93 (10.5%) | $0 |
| 6-Person Families | 9 (1.0%) | $0 |
| 7+ Person Families | 0 (0.0%) | $0 |
| Total | 887 (100.0%) | $63,004 |
Family Income by Number of Earners in Ravenswood
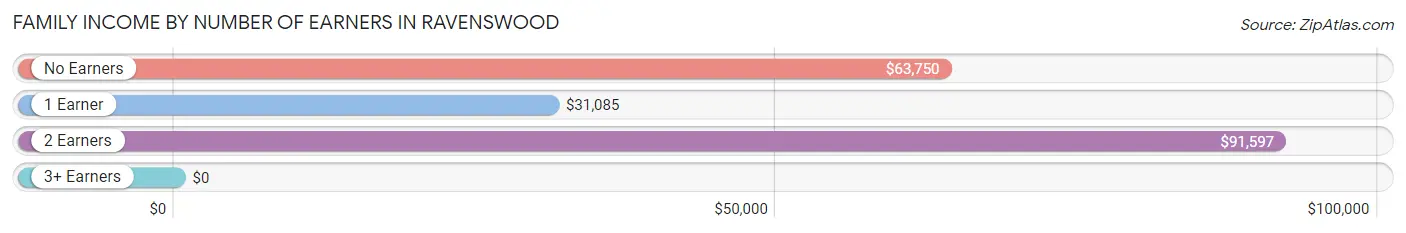
| Number of Earners | # Families | Median Income |
| No Earners | 196 (22.1%) | $63,750 |
| 1 Earner | 287 (32.4%) | $31,085 |
| 2 Earners | 387 (43.6%) | $91,597 |
| 3+ Earners | 17 (1.9%) | $0 |
| Total | 887 (100.0%) | $63,004 |
Household Income in Ravenswood
Household Income Brackets in Ravenswood
With 239 households falling in the category, the $75,000 to $99,999 income range is the most frequent in Ravenswood, accounting for 15.8% of all households. In contrast, only 57 households (3.8%) fall into the $35,000 to $49,999 income bracket, making it the least populous group.
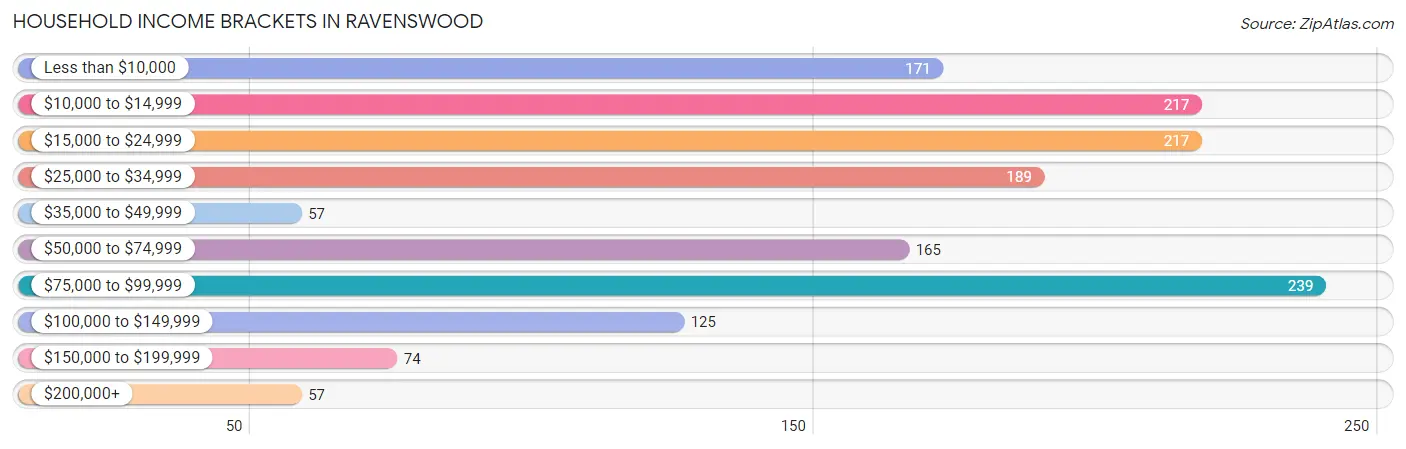
| Income Bracket | # Households | % Households |
| Less than $10,000 | 171 | 11.3% |
| $10,000 to $14,999 | 217 | 14.4% |
| $15,000 to $24,999 | 217 | 14.4% |
| $25,000 to $34,999 | 189 | 12.5% |
| $35,000 to $49,999 | 57 | 3.8% |
| $50,000 to $74,999 | 165 | 10.9% |
| $75,000 to $99,999 | 239 | 15.8% |
| $100,000 to $149,999 | 125 | 8.3% |
| $150,000 to $199,999 | 74 | 4.9% |
| $200,000+ | 57 | 3.8% |
Household Income by Householder Age in Ravenswood
| Income Bracket | # Households | Median Income |
| 15 to 24 Years | 89 (5.9%) | $0 |
| 25 to 44 Years | 370 (24.5%) | $0 |
| 45 to 64 Years | 572 (37.9%) | $0 |
| 65+ Years | 479 (31.7%) | $0 |
| Total | 1,510 (100.0%) | $31,818 |
Poverty in Ravenswood
Income Below Poverty by Sex and Age in Ravenswood
With 29.6% poverty level for males and 36.1% for females among the residents of Ravenswood, 6 to 11 year old males and 16 and 17 year old females are the most vulnerable to poverty, with 72 males (67.9%) and 10 females (100.0%) in their respective age groups living below the poverty level.
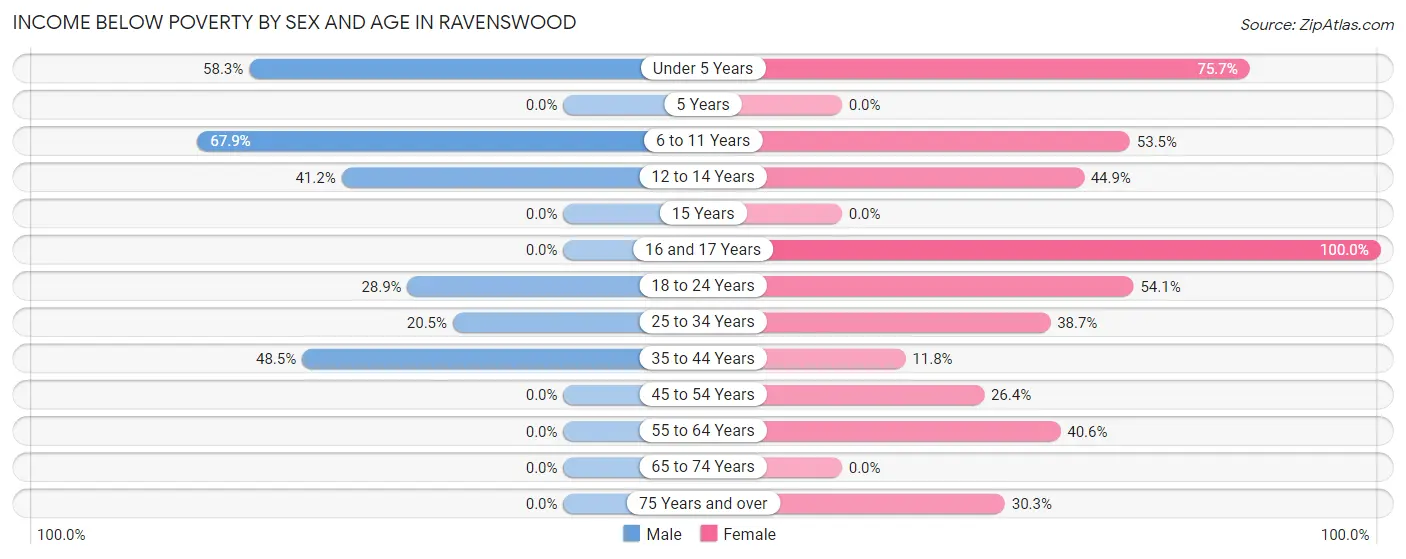
| Age Bracket | Male | Female |
| Under 5 Years | 133 (58.3%) | 140 (75.7%) |
| 5 Years | 0 (0.0%) | 0 (0.0%) |
| 6 to 11 Years | 72 (67.9%) | 54 (53.5%) |
| 12 to 14 Years | 7 (41.2%) | 44 (44.9%) |
| 15 Years | 0 (0.0%) | 0 (0.0%) |
| 16 and 17 Years | 0 (0.0%) | 10 (100.0%) |
| 18 to 24 Years | 68 (28.9%) | 72 (54.1%) |
| 25 to 34 Years | 40 (20.5%) | 82 (38.7%) |
| 35 to 44 Years | 179 (48.5%) | 30 (11.8%) |
| 45 to 54 Years | 0 (0.0%) | 57 (26.4%) |
| 55 to 64 Years | 0 (0.0%) | 202 (40.6%) |
| 65 to 74 Years | 0 (0.0%) | 0 (0.0%) |
| 75 Years and over | 0 (0.0%) | 69 (30.3%) |
| Total | 499 (29.6%) | 760 (36.1%) |
Income Above Poverty by Sex and Age in Ravenswood
According to the poverty statistics in Ravenswood, males aged 16 and 17 years and females aged 5 years are the age groups that are most secure financially, with 100.0% of males and 100.0% of females in these age groups living above the poverty line.
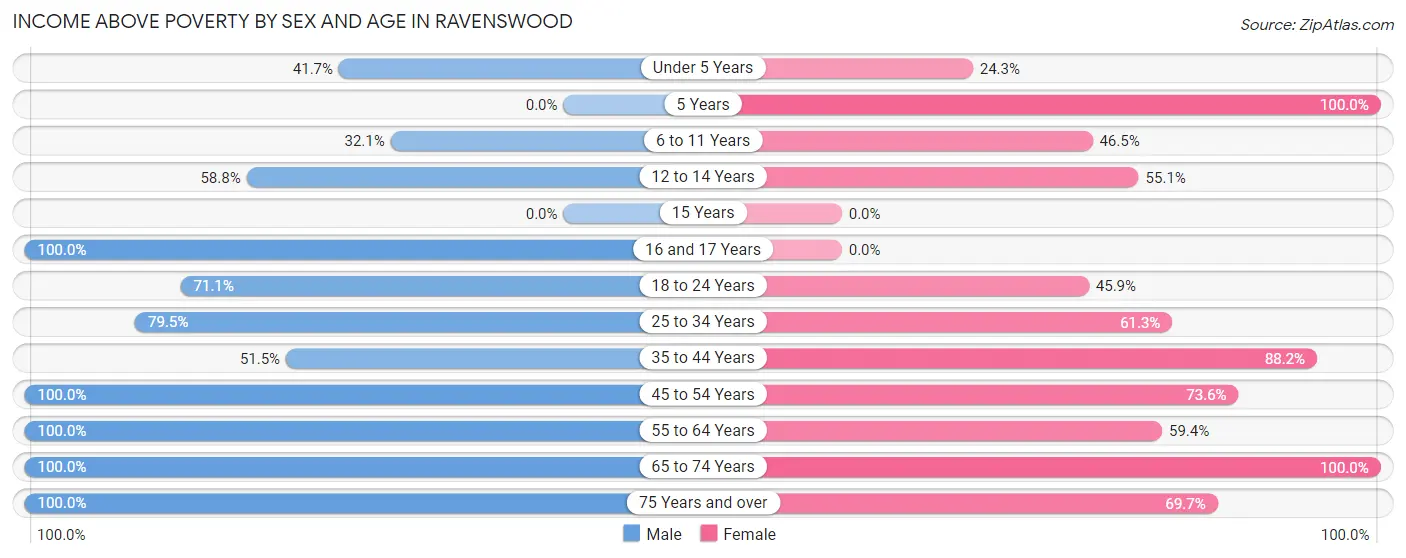
| Age Bracket | Male | Female |
| Under 5 Years | 95 (41.7%) | 45 (24.3%) |
| 5 Years | 0 (0.0%) | 37 (100.0%) |
| 6 to 11 Years | 34 (32.1%) | 47 (46.5%) |
| 12 to 14 Years | 10 (58.8%) | 54 (55.1%) |
| 15 Years | 0 (0.0%) | 0 (0.0%) |
| 16 and 17 Years | 50 (100.0%) | 0 (0.0%) |
| 18 to 24 Years | 167 (71.1%) | 61 (45.9%) |
| 25 to 34 Years | 155 (79.5%) | 130 (61.3%) |
| 35 to 44 Years | 190 (51.5%) | 224 (88.2%) |
| 45 to 54 Years | 80 (100.0%) | 159 (73.6%) |
| 55 to 64 Years | 177 (100.0%) | 296 (59.4%) |
| 65 to 74 Years | 138 (100.0%) | 134 (100.0%) |
| 75 Years and over | 88 (100.0%) | 159 (69.7%) |
| Total | 1,184 (70.4%) | 1,346 (63.9%) |
Income Below Poverty Among Married-Couple Families in Ravenswood
The poverty statistics for married-couple families in Ravenswood show that 17.8% or 108 of the total 608 families live below the poverty line. Families with 3 or 4 children have the highest poverty rate of 100.0%, comprising of 68 families. On the other hand, families with no children have the lowest poverty rate of 0.0%, which includes 0 families.
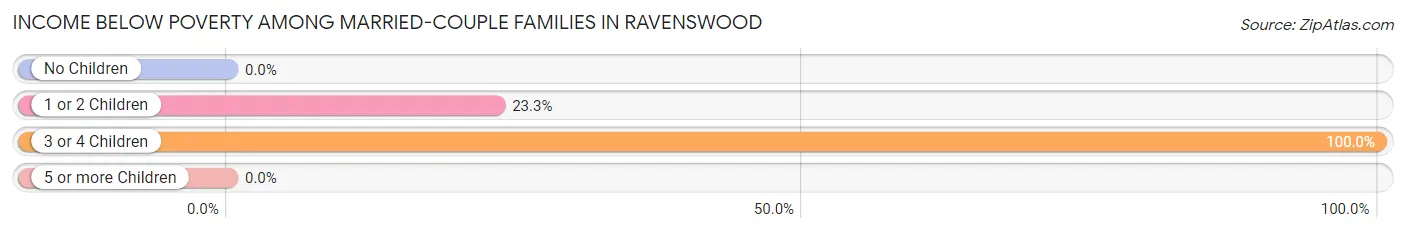
| Children | Above Poverty | Below Poverty |
| No Children | 368 (100.0%) | 0 (0.0%) |
| 1 or 2 Children | 132 (76.7%) | 40 (23.3%) |
| 3 or 4 Children | 0 (0.0%) | 68 (100.0%) |
| 5 or more Children | 0 (0.0%) | 0 (0.0%) |
| Total | 500 (82.2%) | 108 (17.8%) |
Income Below Poverty Among Single-Parent Households in Ravenswood
According to the poverty data in Ravenswood, 65.6% or 42 single-father households and 35.3% or 76 single-mother households are living below the poverty line. Among single-father households, those with 1 or 2 children have the highest poverty rate, with 42 households (100.0%) experiencing poverty. Likewise, among single-mother households, those with 1 or 2 children have the highest poverty rate, with 35 households (53.8%) falling below the poverty line.
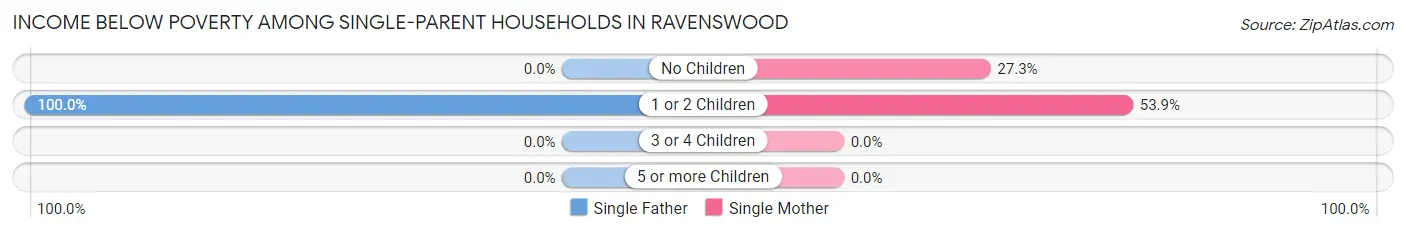
| Children | Single Father | Single Mother |
| No Children | 0 (0.0%) | 41 (27.3%) |
| 1 or 2 Children | 42 (100.0%) | 35 (53.8%) |
| 3 or 4 Children | 0 (0.0%) | 0 (0.0%) |
| 5 or more Children | 0 (0.0%) | 0 (0.0%) |
| Total | 42 (65.6%) | 76 (35.3%) |
Income Below Poverty Among Married-Couple vs Single-Parent Households in Ravenswood
The poverty data for Ravenswood shows that 108 of the married-couple family households (17.8%) and 118 of the single-parent households (42.3%) are living below the poverty level. Within the married-couple family households, those with 3 or 4 children have the highest poverty rate, with 68 households (100.0%) falling below the poverty line. Among the single-parent households, those with 1 or 2 children have the highest poverty rate, with 77 household (72.0%) living below poverty.
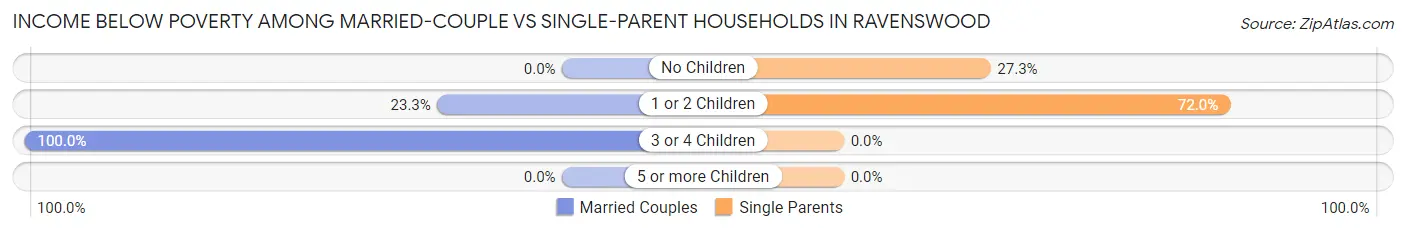
| Children | Married-Couple Families | Single-Parent Households |
| No Children | 0 (0.0%) | 41 (27.3%) |
| 1 or 2 Children | 40 (23.3%) | 77 (72.0%) |
| 3 or 4 Children | 68 (100.0%) | 0 (0.0%) |
| 5 or more Children | 0 (0.0%) | 0 (0.0%) |
| Total | 108 (17.8%) | 118 (42.3%) |
Race in Ravenswood
The most populous races in Ravenswood are White / Caucasian (3,696 | 95.9%), Two or more Races (140 | 3.6%), and Hispanic or Latino (23 | 0.6%).
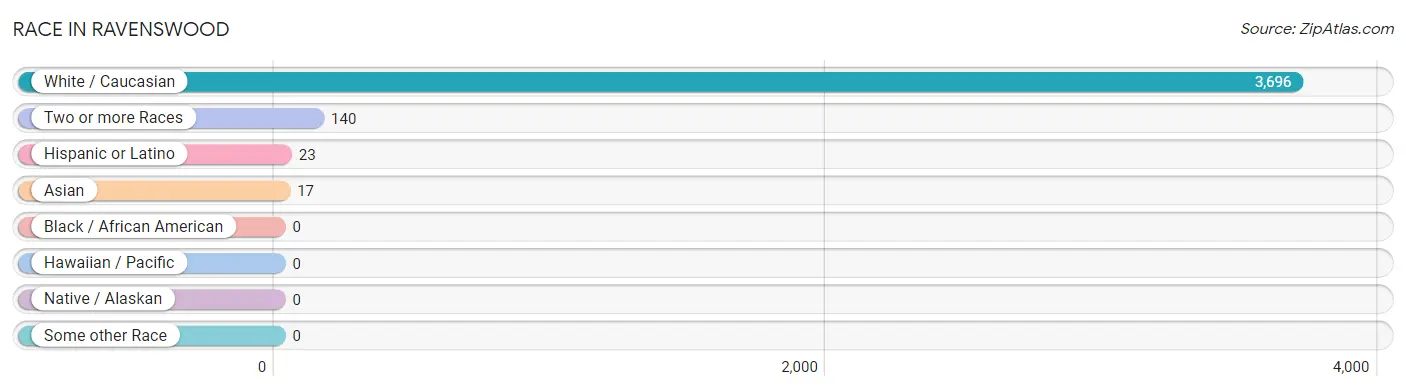
| Race | # Population | % Population |
| Asian | 17 | 0.4% |
| Black / African American | 0 | 0.0% |
| Hawaiian / Pacific | 0 | 0.0% |
| Hispanic or Latino | 23 | 0.6% |
| Native / Alaskan | 0 | 0.0% |
| White / Caucasian | 3,696 | 95.9% |
| Two or more Races | 140 | 3.6% |
| Some other Race | 0 | 0.0% |
| Total | 3,853 | 100.0% |
Ancestry in Ravenswood
The most populous ancestries reported in Ravenswood are Irish (536 | 13.9%), English (510 | 13.2%), German (459 | 11.9%), American (345 | 8.9%), and Italian (294 | 7.6%), together accounting for 55.6% of all Ravenswood residents.
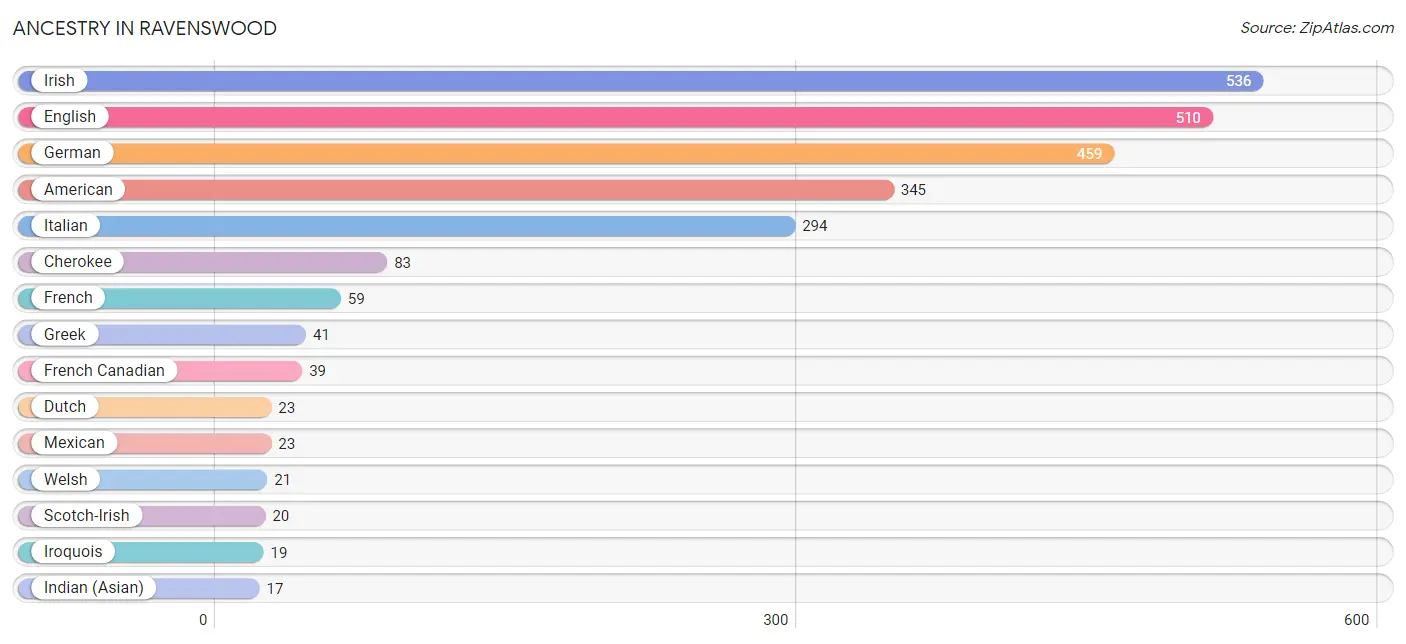
| Ancestry | # Population | % Population |
| American | 345 | 8.9% |
| Cherokee | 83 | 2.1% |
| Dutch | 23 | 0.6% |
| English | 510 | 13.2% |
| French | 59 | 1.5% |
| French Canadian | 39 | 1.0% |
| German | 459 | 11.9% |
| Greek | 41 | 1.1% |
| Indian (Asian) | 17 | 0.4% |
| Irish | 536 | 13.9% |
| Iroquois | 19 | 0.5% |
| Italian | 294 | 7.6% |
| Mexican | 23 | 0.6% |
| Pennsylvania German | 14 | 0.4% |
| Scotch-Irish | 20 | 0.5% |
| Scottish | 16 | 0.4% |
| Welsh | 21 | 0.5% | View All 17 Rows |
Immigrants in Ravenswood
The most numerous immigrant groups reported in Ravenswood came from Asia (131 | 3.4%), Philippines (114 | 3.0%), South Eastern Asia (114 | 3.0%), Central America (23 | 0.6%), and Latin America (23 | 0.6%), together accounting for 10.5% of all Ravenswood residents.
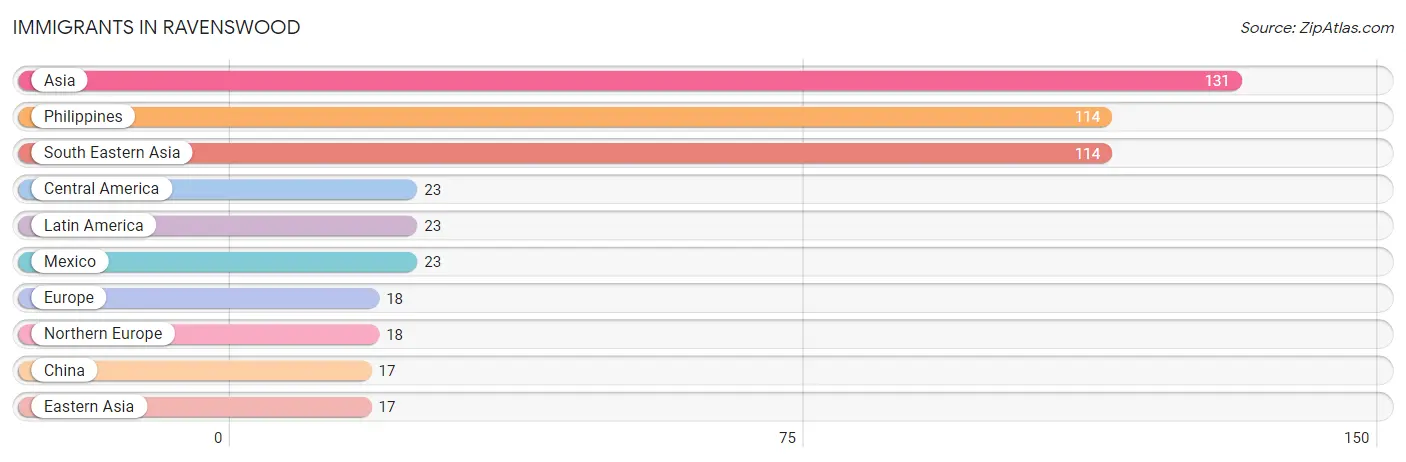
| Immigration Origin | # Population | % Population |
| Asia | 131 | 3.4% |
| Central America | 23 | 0.6% |
| China | 17 | 0.4% |
| Eastern Asia | 17 | 0.4% |
| Europe | 18 | 0.5% |
| Latin America | 23 | 0.6% |
| Mexico | 23 | 0.6% |
| Northern Europe | 18 | 0.5% |
| Philippines | 114 | 3.0% |
| South Eastern Asia | 114 | 3.0% | View All 10 Rows |
Sex and Age in Ravenswood
Sex and Age in Ravenswood
The most populous age groups in Ravenswood are 35 to 39 Years (237 | 14.0%) for men and 55 to 59 Years (438 | 20.3%) for women.
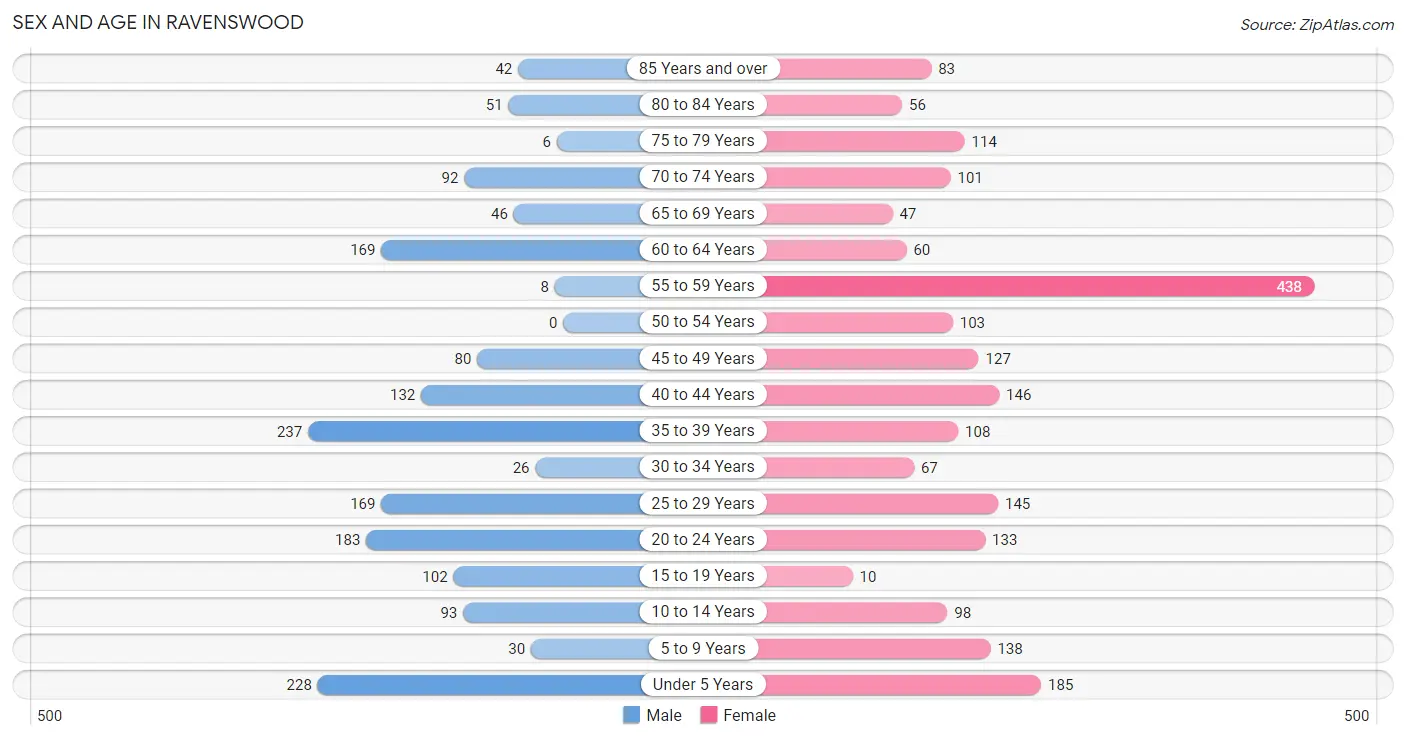
| Age Bracket | Male | Female |
| Under 5 Years | 228 (13.5%) | 185 (8.6%) |
| 5 to 9 Years | 30 (1.8%) | 138 (6.4%) |
| 10 to 14 Years | 93 (5.5%) | 98 (4.5%) |
| 15 to 19 Years | 102 (6.0%) | 10 (0.5%) |
| 20 to 24 Years | 183 (10.8%) | 133 (6.2%) |
| 25 to 29 Years | 169 (10.0%) | 145 (6.7%) |
| 30 to 34 Years | 26 (1.5%) | 67 (3.1%) |
| 35 to 39 Years | 237 (14.0%) | 108 (5.0%) |
| 40 to 44 Years | 132 (7.8%) | 146 (6.8%) |
| 45 to 49 Years | 80 (4.7%) | 127 (5.9%) |
| 50 to 54 Years | 0 (0.0%) | 103 (4.8%) |
| 55 to 59 Years | 8 (0.5%) | 438 (20.3%) |
| 60 to 64 Years | 169 (10.0%) | 60 (2.8%) |
| 65 to 69 Years | 46 (2.7%) | 47 (2.2%) |
| 70 to 74 Years | 92 (5.4%) | 101 (4.7%) |
| 75 to 79 Years | 6 (0.4%) | 114 (5.3%) |
| 80 to 84 Years | 51 (3.0%) | 56 (2.6%) |
| 85 Years and over | 42 (2.5%) | 83 (3.8%) |
| Total | 1,694 (100.0%) | 2,159 (100.0%) |
Families and Households in Ravenswood
Median Family Size in Ravenswood
The median family size in Ravenswood is 3.18 persons per family, with single male/father families (64 | 7.2%) accounting for the largest median family size of 4.09 persons per family. On the other hand, married-couple families (608 | 68.5%) represent the smallest median family size with 3.07 persons per family.
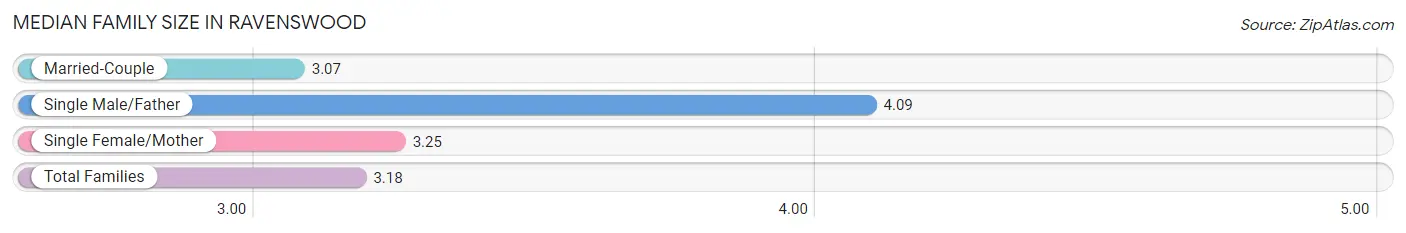
| Family Type | # Families | Family Size |
| Married-Couple | 608 (68.5%) | 3.07 |
| Single Male/Father | 64 (7.2%) | 4.09 |
| Single Female/Mother | 215 (24.2%) | 3.25 |
| Total Families | 887 (100.0%) | 3.18 |
Median Household Size in Ravenswood
The median household size in Ravenswood is 2.51 persons per household, with single male/father households (64 | 4.2%) accounting for the largest median household size of 4.53 persons per household. non-family households (623 | 41.3%) represent the smallest median household size with 1.26 persons per household.
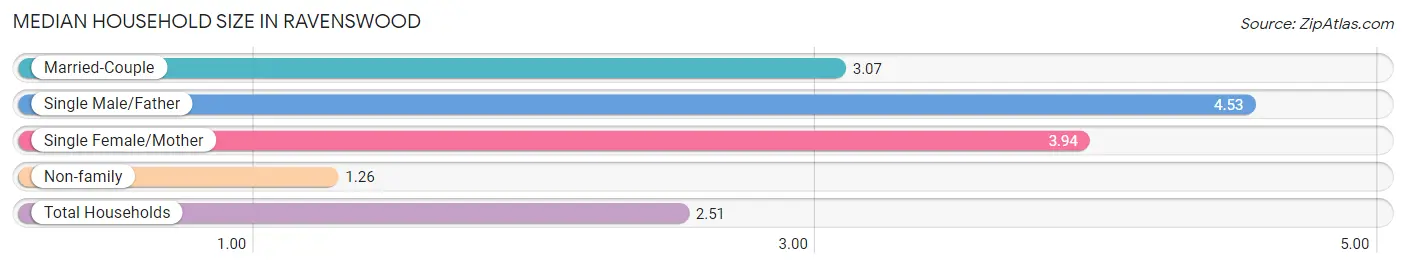
| Household Type | # Households | Household Size |
| Married-Couple | 608 (40.3%) | 3.07 |
| Single Male/Father | 64 (4.2%) | 4.53 |
| Single Female/Mother | 215 (14.2%) | 3.94 |
| Non-family | 623 (41.3%) | 1.26 |
| Total Households | 1,510 (100.0%) | 2.51 |
Household Size by Marriage Status in Ravenswood
Out of a total of 1,510 households in Ravenswood, 887 (58.7%) are family households, while 623 (41.3%) are nonfamily households. The most numerous type of family households are 2-person households, comprising 385, and the most common type of nonfamily households are 1-person households, comprising 557.
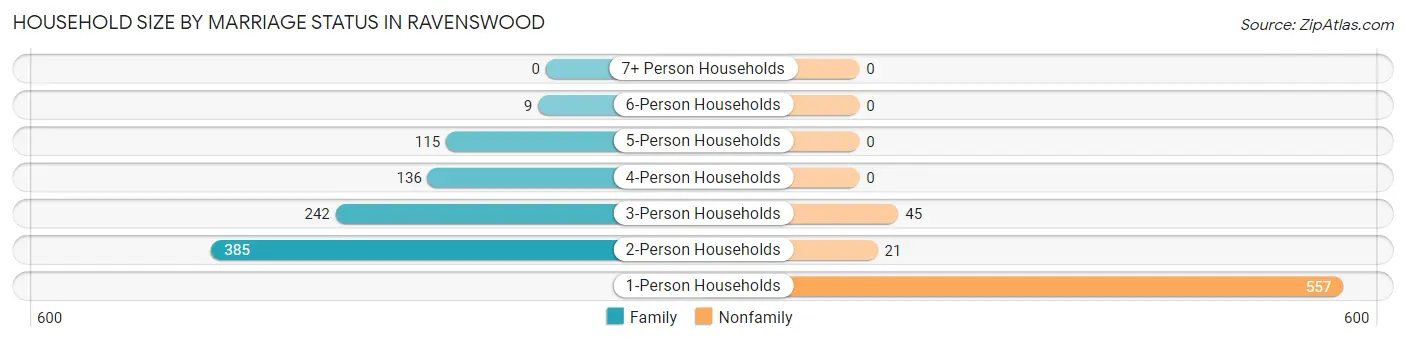
| Household Size | Family Households | Nonfamily Households |
| 1-Person Households | - | 557 (36.9%) |
| 2-Person Households | 385 (25.5%) | 21 (1.4%) |
| 3-Person Households | 242 (16.0%) | 45 (3.0%) |
| 4-Person Households | 136 (9.0%) | 0 (0.0%) |
| 5-Person Households | 115 (7.6%) | 0 (0.0%) |
| 6-Person Households | 9 (0.6%) | 0 (0.0%) |
| 7+ Person Households | 0 (0.0%) | 0 (0.0%) |
| Total | 887 (58.7%) | 623 (41.3%) |
Female Fertility in Ravenswood
Fertility by Age in Ravenswood
Average fertility rate in Ravenswood is 87.0 births per 1,000 women. Women in the age bracket of 20 to 34 years have the highest fertility rate with 186.0 births per 1,000 women. Women in the age bracket of 20 to 34 years acount for 100.0% of all women with births.
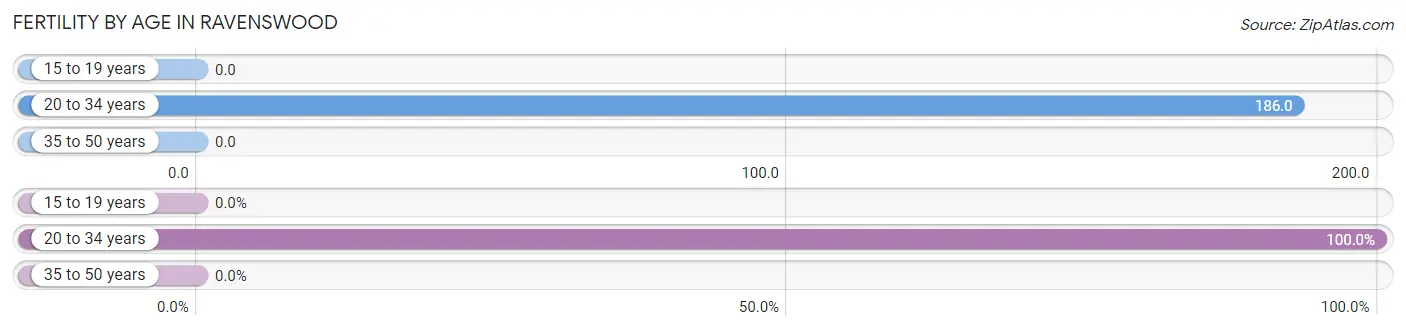
| Age Bracket | Women with Births | Births / 1,000 Women |
| 15 to 19 years | 0 (0.0%) | 0.0 |
| 20 to 34 years | 64 (100.0%) | 186.0 |
| 35 to 50 years | 0 (0.0%) | 0.0 |
| Total | 64 (100.0%) | 87.0 |
Fertility by Age by Marriage Status in Ravenswood
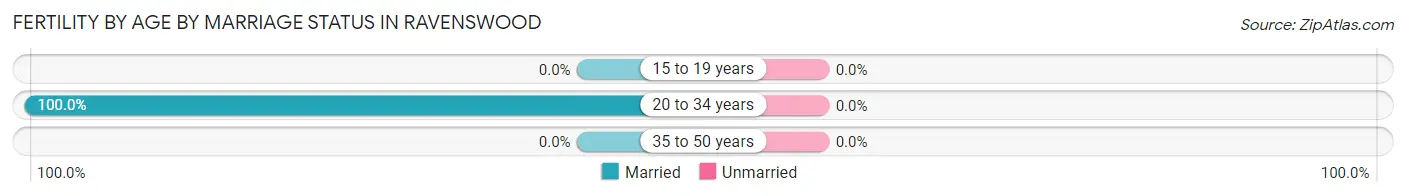
| Age Bracket | Married | Unmarried |
| 15 to 19 years | 0 (0.0%) | 0 (0.0%) |
| 20 to 34 years | 64 (100.0%) | 0 (0.0%) |
| 35 to 50 years | 0 (0.0%) | 0 (0.0%) |
| Total | 64 (100.0%) | 0 (0.0%) |
Fertility by Education in Ravenswood
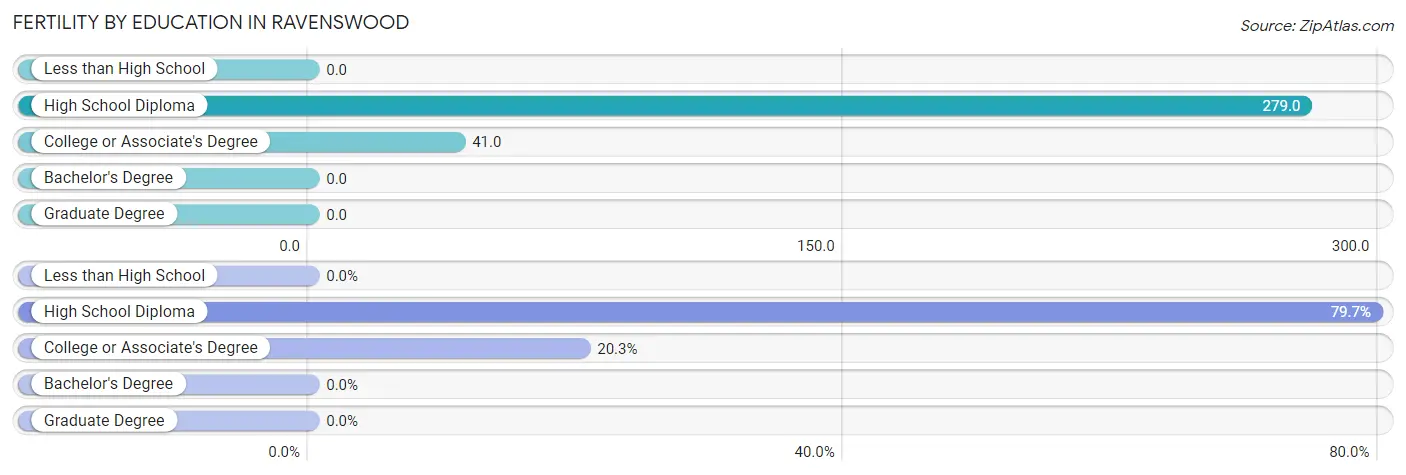
| Educational Attainment | Women with Births | Births / 1,000 Women |
| Less than High School | 0 (0.0%) | 0.0 |
| High School Diploma | 51 (79.7%) | 279.0 |
| College or Associate's Degree | 13 (20.3%) | 41.0 |
| Bachelor's Degree | 0 (0.0%) | 0.0 |
| Graduate Degree | 0 (0.0%) | 0.0 |
| Total | 64 (100.0%) | 87.0 |
Fertility by Education by Marriage Status in Ravenswood
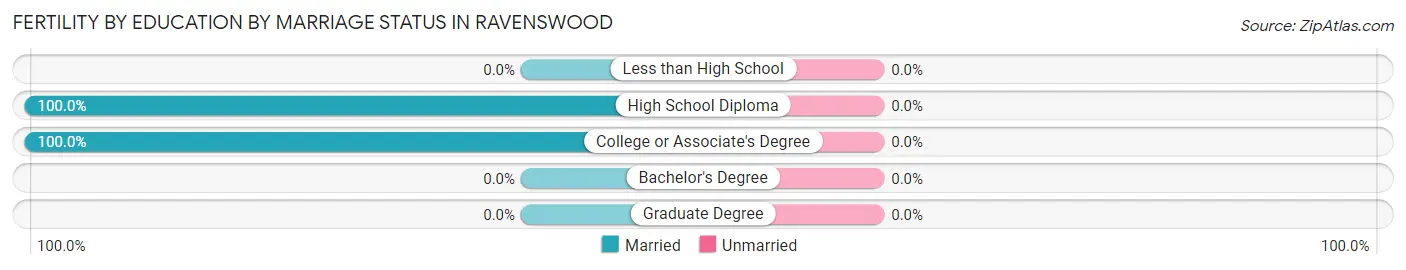
| Educational Attainment | Married | Unmarried |
| Less than High School | 0 (0.0%) | 0 (0.0%) |
| High School Diploma | 51 (100.0%) | 0 (0.0%) |
| College or Associate's Degree | 13 (100.0%) | 0 (0.0%) |
| Bachelor's Degree | 0 (0.0%) | 0 (0.0%) |
| Graduate Degree | 0 (0.0%) | 0 (0.0%) |
| Total | 64 (100.0%) | 0 (0.0%) |
Employment Characteristics in Ravenswood
Employment by Class of Employer in Ravenswood
Among the 1,470 employed individuals in Ravenswood, private company employees (1,138 | 77.4%), self-employed (not incorporated) (115 | 7.8%), and state government employees (99 | 6.7%) make up the most common classes of employment.
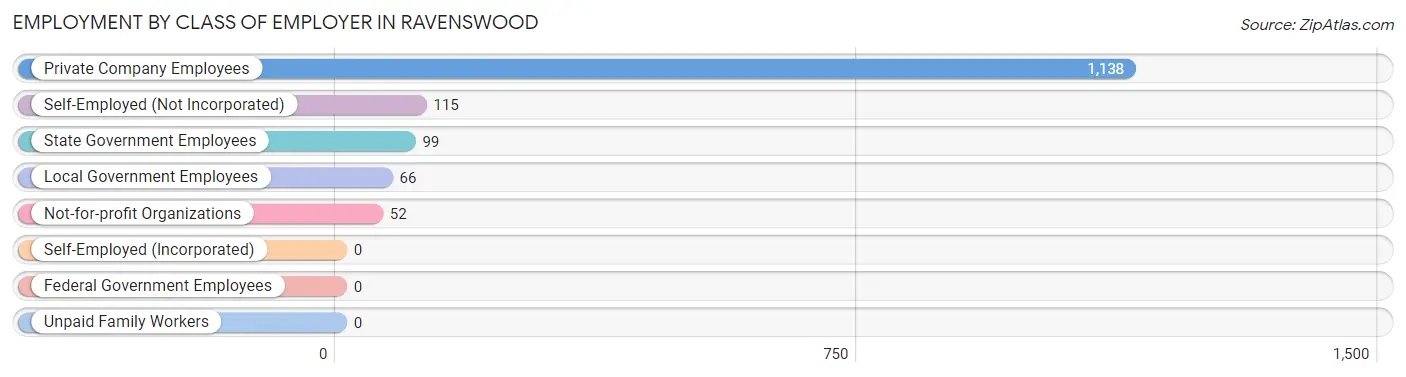
| Employer Class | # Employees | % Employees |
| Private Company Employees | 1,138 | 77.4% |
| Self-Employed (Incorporated) | 0 | 0.0% |
| Self-Employed (Not Incorporated) | 115 | 7.8% |
| Not-for-profit Organizations | 52 | 3.5% |
| Local Government Employees | 66 | 4.5% |
| State Government Employees | 99 | 6.7% |
| Federal Government Employees | 0 | 0.0% |
| Unpaid Family Workers | 0 | 0.0% |
| Total | 1,470 | 100.0% |
Employment Status by Age in Ravenswood
According to the labor force statistics for Ravenswood, out of the total population over 16 years of age (3,081), 51.0% or 1,571 individuals are in the labor force, with 6.4% or 101 of them unemployed. The age group with the highest labor force participation rate is 30 to 34 years, with 87.1% or 81 individuals in the labor force. Within the labor force, the 45 to 54 years age range has the highest percentage of unemployed individuals, with 26.8% or 56 of them being unemployed.
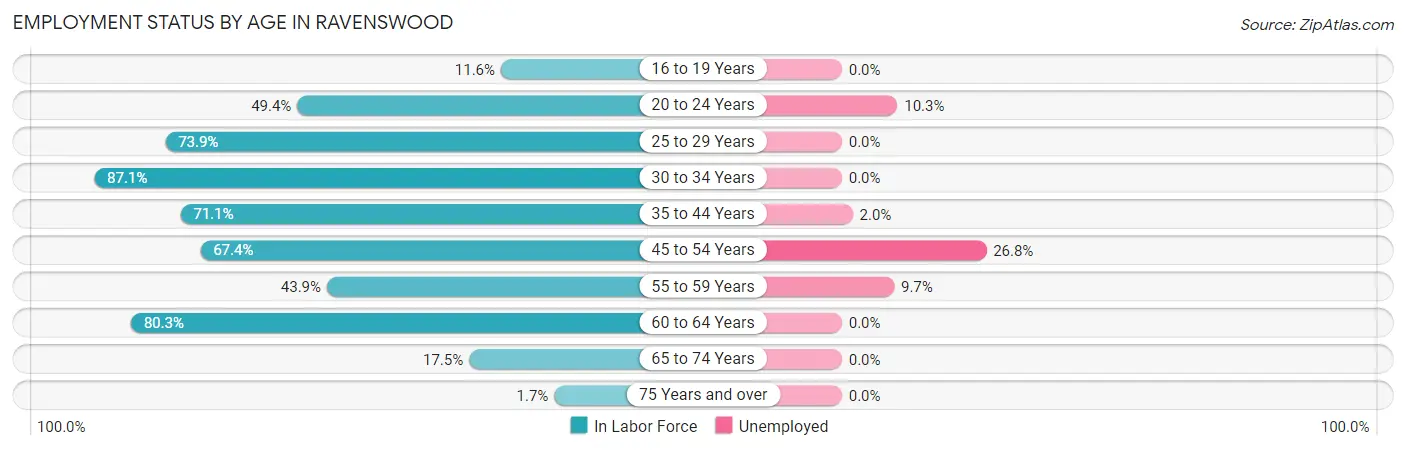
| Age Bracket | In Labor Force | Unemployed |
| 16 to 19 Years | 13 (11.6%) | 0 (0.0%) |
| 20 to 24 Years | 156 (49.4%) | 16 (10.3%) |
| 25 to 29 Years | 232 (73.9%) | 0 (0.0%) |
| 30 to 34 Years | 81 (87.1%) | 0 (0.0%) |
| 35 to 44 Years | 443 (71.1%) | 9 (2.0%) |
| 45 to 54 Years | 209 (67.4%) | 56 (26.8%) |
| 55 to 59 Years | 196 (43.9%) | 19 (9.7%) |
| 60 to 64 Years | 184 (80.3%) | 0 (0.0%) |
| 65 to 74 Years | 50 (17.5%) | 0 (0.0%) |
| 75 Years and over | 6 (1.7%) | 0 (0.0%) |
| Total | 1,571 (51.0%) | 101 (6.4%) |
Employment Status by Educational Attainment in Ravenswood
According to labor force statistics for Ravenswood, 66.7% of individuals (1,344) out of the total population between 25 and 64 years of age (2,015) are in the labor force, with 6.2% or 83 of them being unemployed. The group with the highest labor force participation rate are those with the educational attainment of bachelor's degree or higher, with 87.2% or 299 individuals in the labor force. Within the labor force, individuals with college / associate degree education have the highest percentage of unemployment, with 10.3% or 78 of them being unemployed.
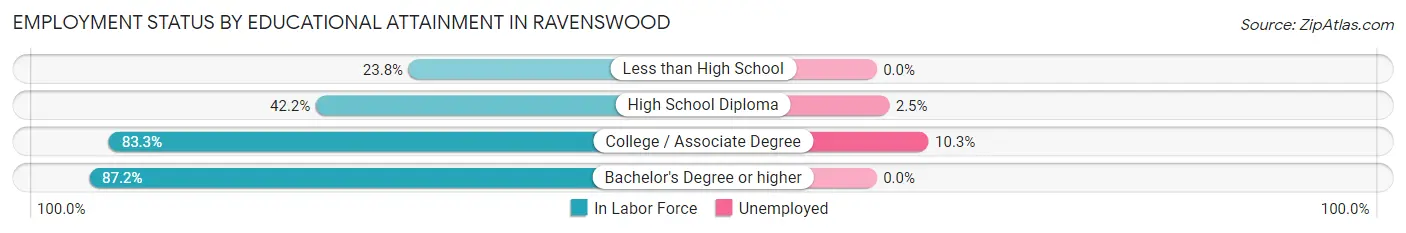
| Educational Attainment | In Labor Force | Unemployed |
| Less than High School | 45 (23.8%) | 0 (0.0%) |
| High School Diploma | 241 (42.2%) | 14 (2.5%) |
| College / Associate Degree | 760 (83.3%) | 94 (10.3%) |
| Bachelor's Degree or higher | 299 (87.2%) | 0 (0.0%) |
| Total | 1,344 (66.7%) | 125 (6.2%) |
Employment Occupations by Sex in Ravenswood
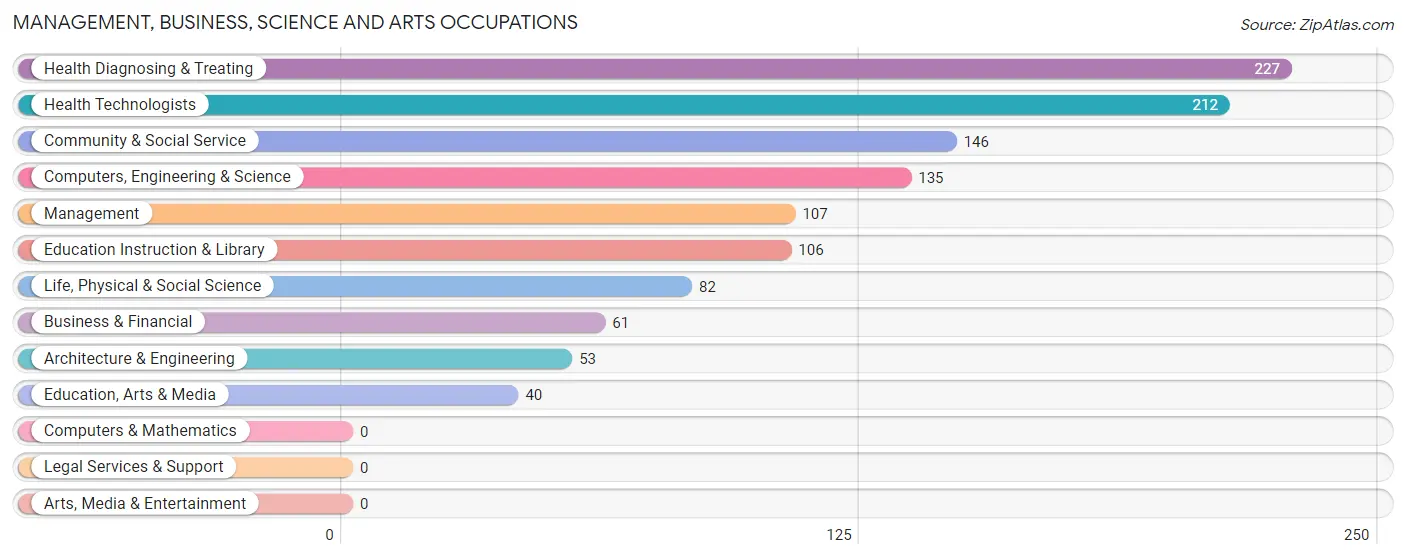
Management, Business, Science and Arts Occupations
The most common Management, Business, Science and Arts occupations in Ravenswood are Health Diagnosing & Treating (227 | 15.4%), Health Technologists (212 | 14.4%), Community & Social Service (146 | 9.9%), Computers, Engineering & Science (135 | 9.2%), and Management (107 | 7.3%).
Management, Business, Science and Arts Occupations by Sex
Within the Management, Business, Science and Arts occupations in Ravenswood, the most male-oriented occupations are Architecture & Engineering (100.0%), Business & Financial (57.4%), and Education, Arts & Media (52.5%), while the most female-oriented occupations are Life, Physical & Social Science (100.0%), Health Diagnosing & Treating (92.1%), and Health Technologists (91.5%).
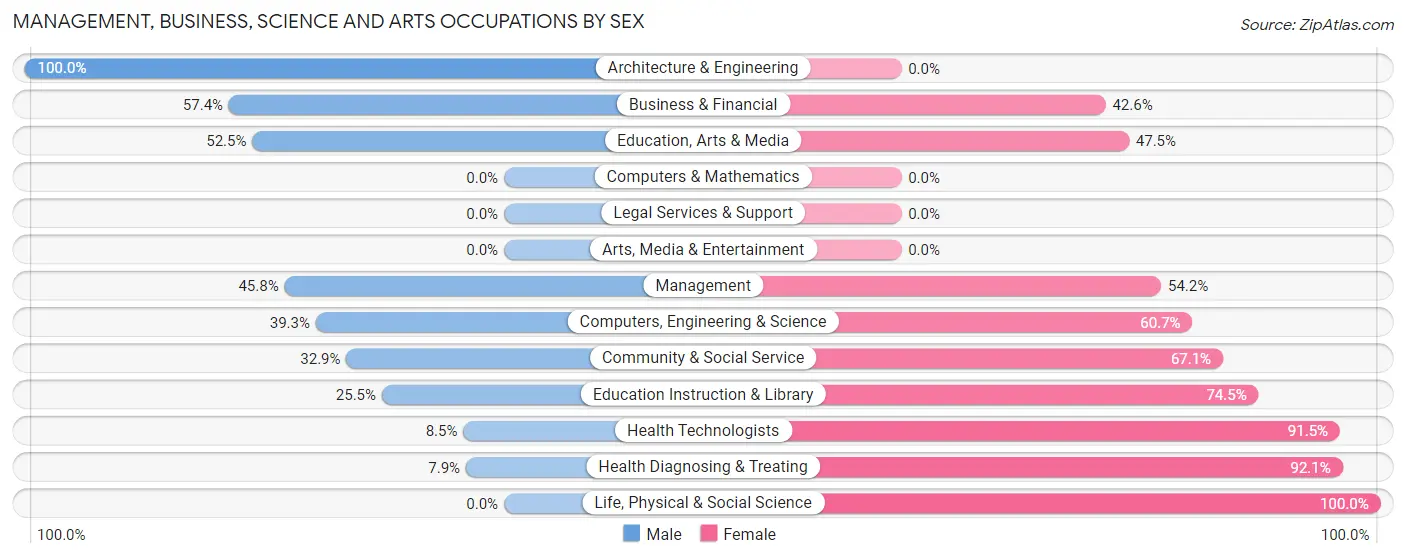
| Occupation | Male | Female |
| Management | 49 (45.8%) | 58 (54.2%) |
| Business & Financial | 35 (57.4%) | 26 (42.6%) |
| Computers, Engineering & Science | 53 (39.3%) | 82 (60.7%) |
| Computers & Mathematics | 0 (0.0%) | 0 (0.0%) |
| Architecture & Engineering | 53 (100.0%) | 0 (0.0%) |
| Life, Physical & Social Science | 0 (0.0%) | 82 (100.0%) |
| Community & Social Service | 48 (32.9%) | 98 (67.1%) |
| Education, Arts & Media | 21 (52.5%) | 19 (47.5%) |
| Legal Services & Support | 0 (0.0%) | 0 (0.0%) |
| Education Instruction & Library | 27 (25.5%) | 79 (74.5%) |
| Arts, Media & Entertainment | 0 (0.0%) | 0 (0.0%) |
| Health Diagnosing & Treating | 18 (7.9%) | 209 (92.1%) |
| Health Technologists | 18 (8.5%) | 194 (91.5%) |
| Total (Category) | 203 (30.0%) | 473 (70.0%) |
| Total (Overall) | 724 (49.2%) | 746 (50.7%) |
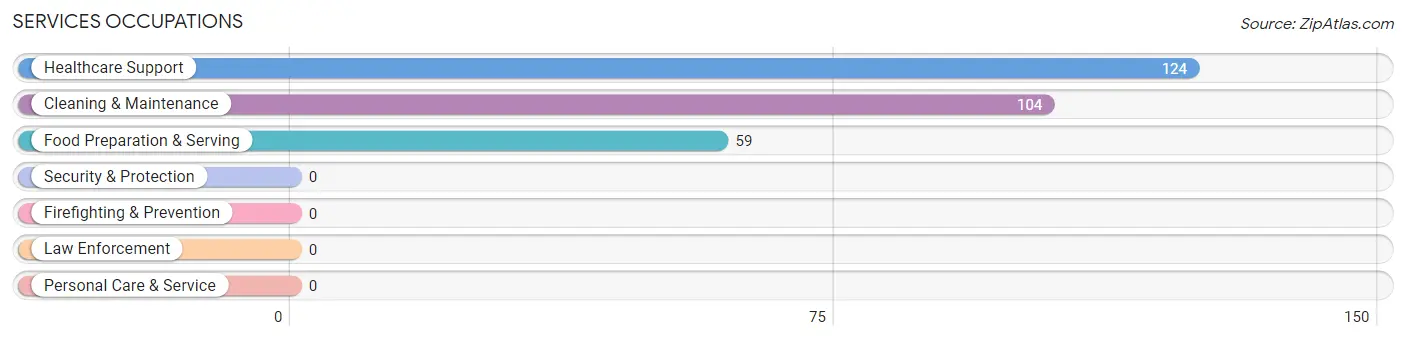
Services Occupations
The most common Services occupations in Ravenswood are Healthcare Support (124 | 8.4%), Cleaning & Maintenance (104 | 7.1%), and Food Preparation & Serving (59 | 4.0%).
Services Occupations by Sex
Within the Services occupations in Ravenswood, the most male-oriented occupations are Food Preparation & Serving (84.8%), and Cleaning & Maintenance (29.8%), while the most female-oriented occupations are Healthcare Support (100.0%), Cleaning & Maintenance (70.2%), and Food Preparation & Serving (15.2%).
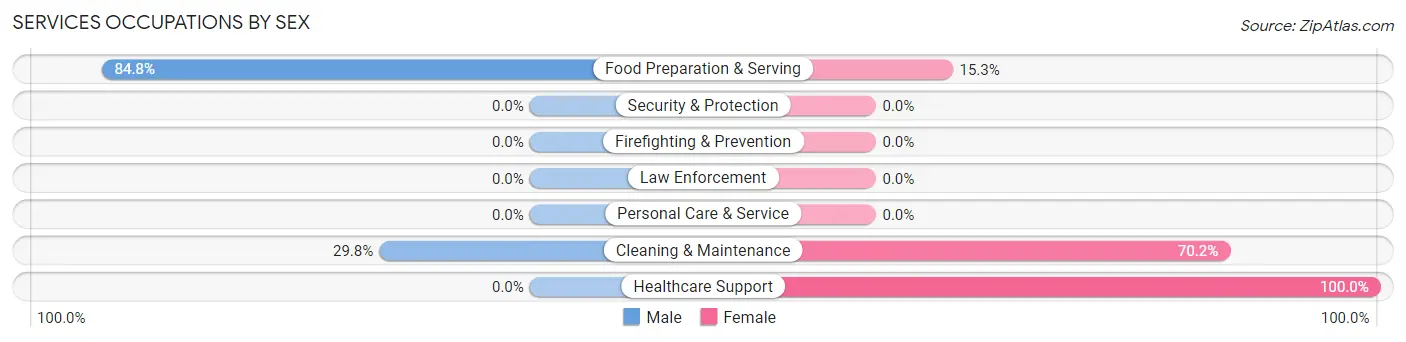
| Occupation | Male | Female |
| Healthcare Support | 0 (0.0%) | 124 (100.0%) |
| Security & Protection | 0 (0.0%) | 0 (0.0%) |
| Firefighting & Prevention | 0 (0.0%) | 0 (0.0%) |
| Law Enforcement | 0 (0.0%) | 0 (0.0%) |
| Food Preparation & Serving | 50 (84.8%) | 9 (15.2%) |
| Cleaning & Maintenance | 31 (29.8%) | 73 (70.2%) |
| Personal Care & Service | 0 (0.0%) | 0 (0.0%) |
| Total (Category) | 81 (28.2%) | 206 (71.8%) |
| Total (Overall) | 724 (49.2%) | 746 (50.7%) |
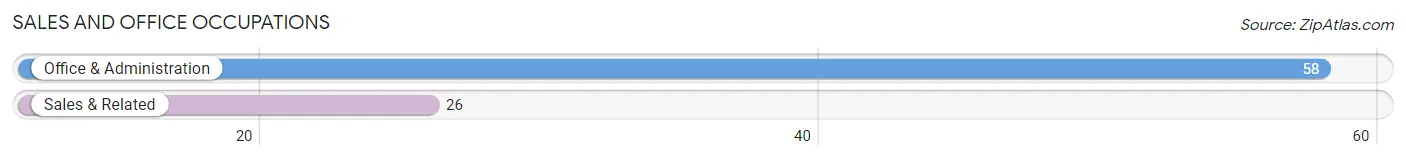
Sales and Office Occupations
The most common Sales and Office occupations in Ravenswood are Office & Administration (58 | 4.0%), and Sales & Related (26 | 1.8%).
Sales and Office Occupations by Sex
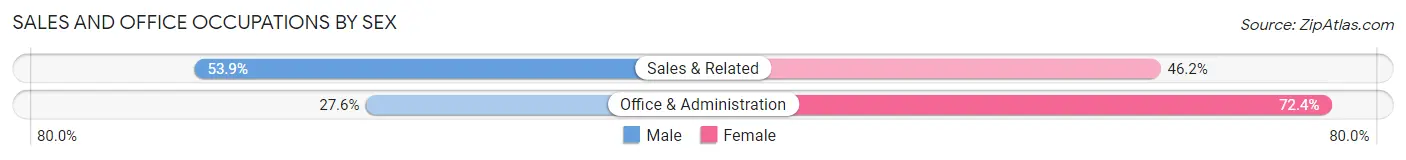
| Occupation | Male | Female |
| Sales & Related | 14 (53.8%) | 12 (46.2%) |
| Office & Administration | 16 (27.6%) | 42 (72.4%) |
| Total (Category) | 30 (35.7%) | 54 (64.3%) |
| Total (Overall) | 724 (49.2%) | 746 (50.7%) |
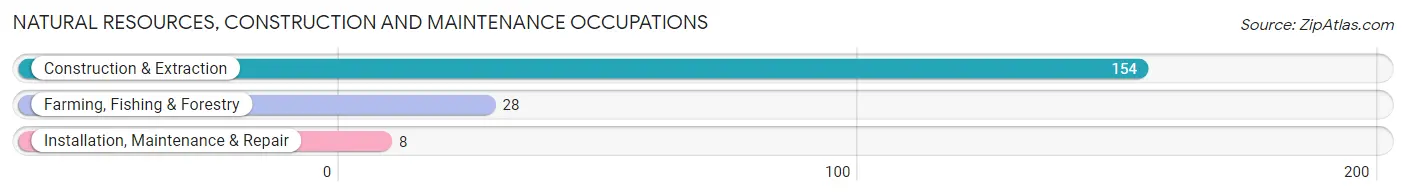
Natural Resources, Construction and Maintenance Occupations
The most common Natural Resources, Construction and Maintenance occupations in Ravenswood are Construction & Extraction (154 | 10.5%), Farming, Fishing & Forestry (28 | 1.9%), and Installation, Maintenance & Repair (8 | 0.5%).
Natural Resources, Construction and Maintenance Occupations by Sex
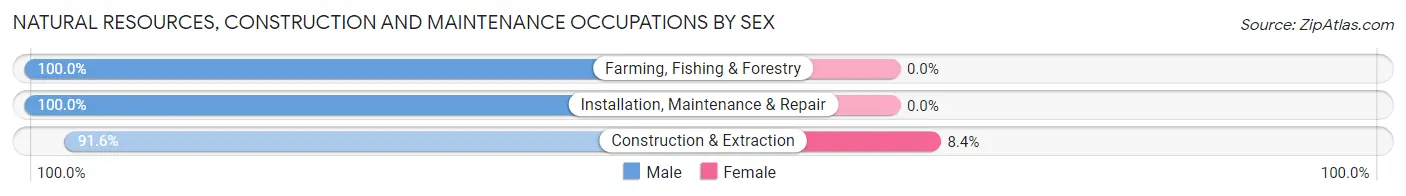
| Occupation | Male | Female |
| Farming, Fishing & Forestry | 28 (100.0%) | 0 (0.0%) |
| Construction & Extraction | 141 (91.6%) | 13 (8.4%) |
| Installation, Maintenance & Repair | 8 (100.0%) | 0 (0.0%) |
| Total (Category) | 177 (93.2%) | 13 (6.8%) |
| Total (Overall) | 724 (49.2%) | 746 (50.7%) |
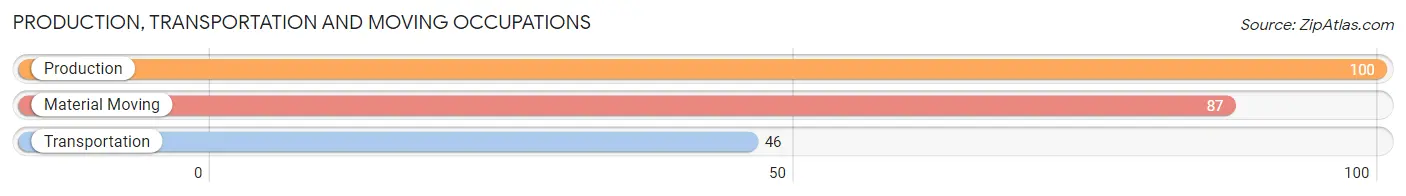
Production, Transportation and Moving Occupations
The most common Production, Transportation and Moving occupations in Ravenswood are Production (100 | 6.8%), Material Moving (87 | 5.9%), and Transportation (46 | 3.1%).
Production, Transportation and Moving Occupations by Sex
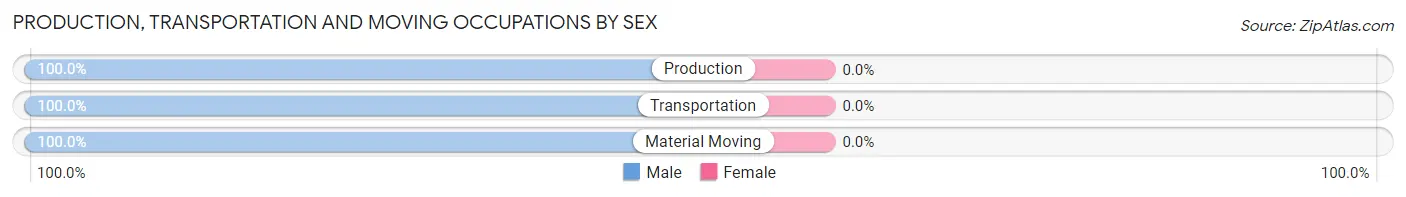
| Occupation | Male | Female |
| Production | 100 (100.0%) | 0 (0.0%) |
| Transportation | 46 (100.0%) | 0 (0.0%) |
| Material Moving | 87 (100.0%) | 0 (0.0%) |
| Total (Category) | 233 (100.0%) | 0 (0.0%) |
| Total (Overall) | 724 (49.2%) | 746 (50.7%) |
Employment Industries by Sex in Ravenswood
Employment Industries in Ravenswood
The major employment industries in Ravenswood include Health Care & Social Assistance (471 | 32.0%), Manufacturing (308 | 20.9%), Accommodation & Food Services (122 | 8.3%), Construction (111 | 7.5%), and Mining, Quarrying, & Extraction (101 | 6.9%).
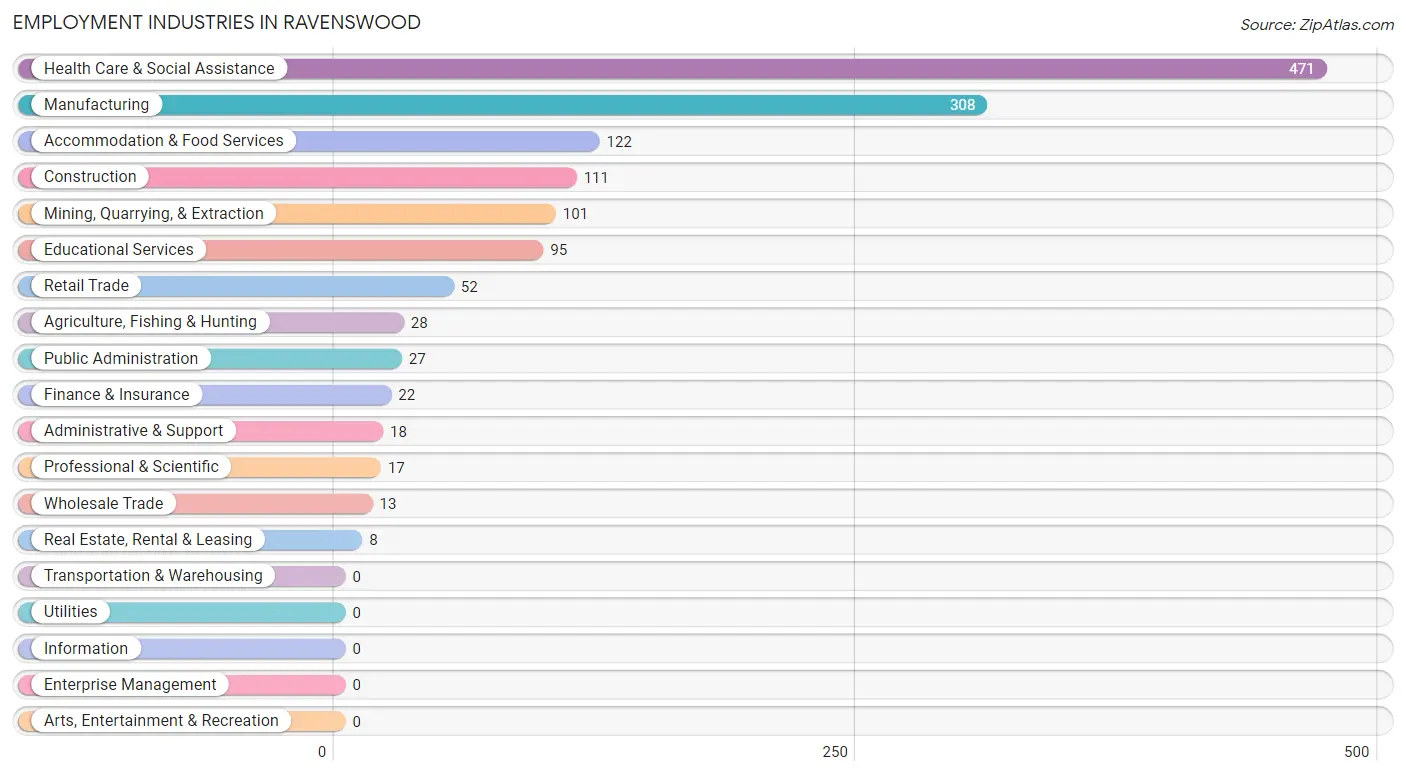
Employment Industries by Sex in Ravenswood
The Ravenswood industries that see more men than women are Agriculture, Fishing & Hunting (100.0%), Wholesale Trade (100.0%), and Real Estate, Rental & Leasing (100.0%), whereas the industries that tend to have a higher number of women are Finance & Insurance (100.0%), Public Administration (100.0%), and Health Care & Social Assistance (96.2%).
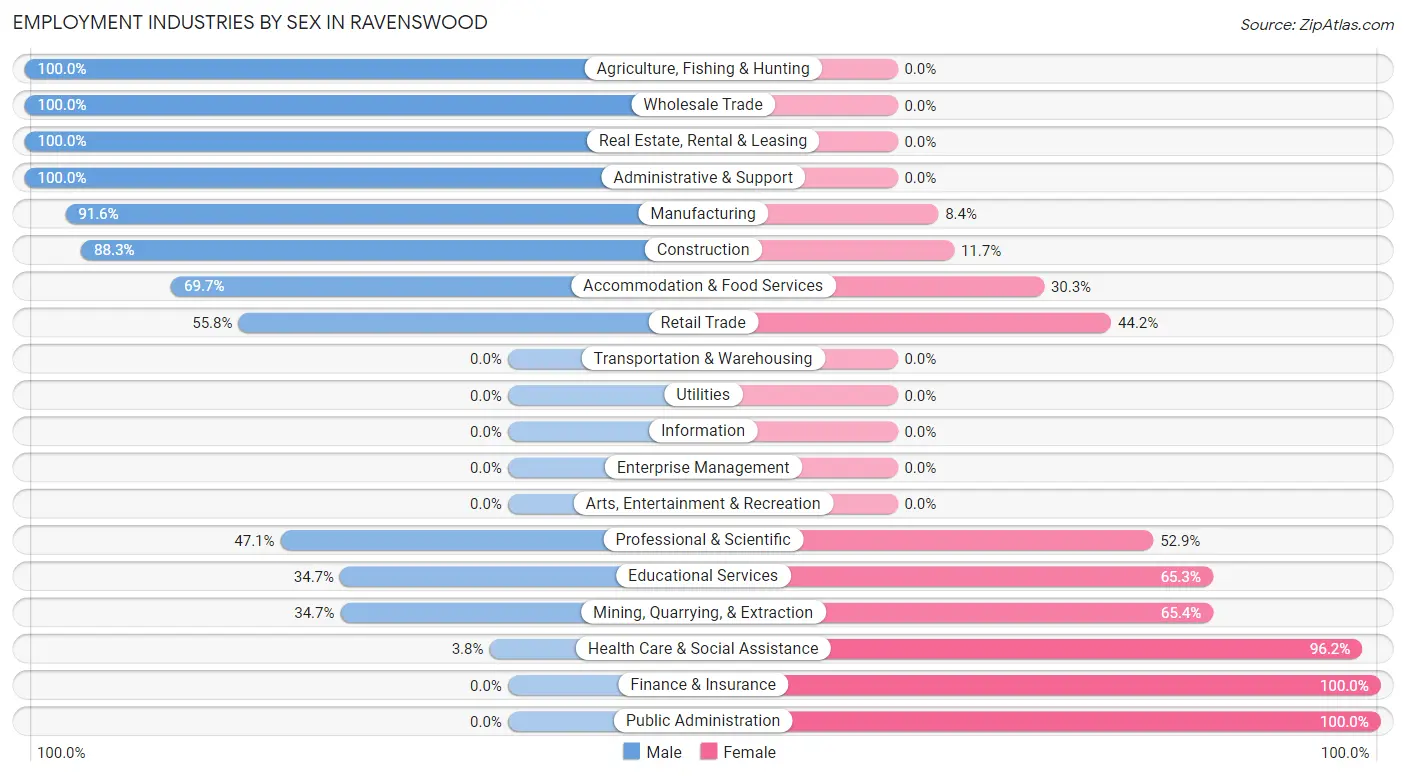
| Industry | Male | Female |
| Agriculture, Fishing & Hunting | 28 (100.0%) | 0 (0.0%) |
| Mining, Quarrying, & Extraction | 35 (34.6%) | 66 (65.3%) |
| Construction | 98 (88.3%) | 13 (11.7%) |
| Manufacturing | 282 (91.6%) | 26 (8.4%) |
| Wholesale Trade | 13 (100.0%) | 0 (0.0%) |
| Retail Trade | 29 (55.8%) | 23 (44.2%) |
| Transportation & Warehousing | 0 (0.0%) | 0 (0.0%) |
| Utilities | 0 (0.0%) | 0 (0.0%) |
| Information | 0 (0.0%) | 0 (0.0%) |
| Finance & Insurance | 0 (0.0%) | 22 (100.0%) |
| Real Estate, Rental & Leasing | 8 (100.0%) | 0 (0.0%) |
| Professional & Scientific | 8 (47.1%) | 9 (52.9%) |
| Enterprise Management | 0 (0.0%) | 0 (0.0%) |
| Administrative & Support | 18 (100.0%) | 0 (0.0%) |
| Educational Services | 33 (34.7%) | 62 (65.3%) |
| Health Care & Social Assistance | 18 (3.8%) | 453 (96.2%) |
| Arts, Entertainment & Recreation | 0 (0.0%) | 0 (0.0%) |
| Accommodation & Food Services | 85 (69.7%) | 37 (30.3%) |
| Public Administration | 0 (0.0%) | 27 (100.0%) |
| Total | 724 (49.2%) | 746 (50.7%) |
Education in Ravenswood
School Enrollment in Ravenswood
The most common levels of schooling among the 493 students in Ravenswood are middle school (161 | 32.7%), elementary school (131 | 26.6%), and high school (94 | 19.1%).
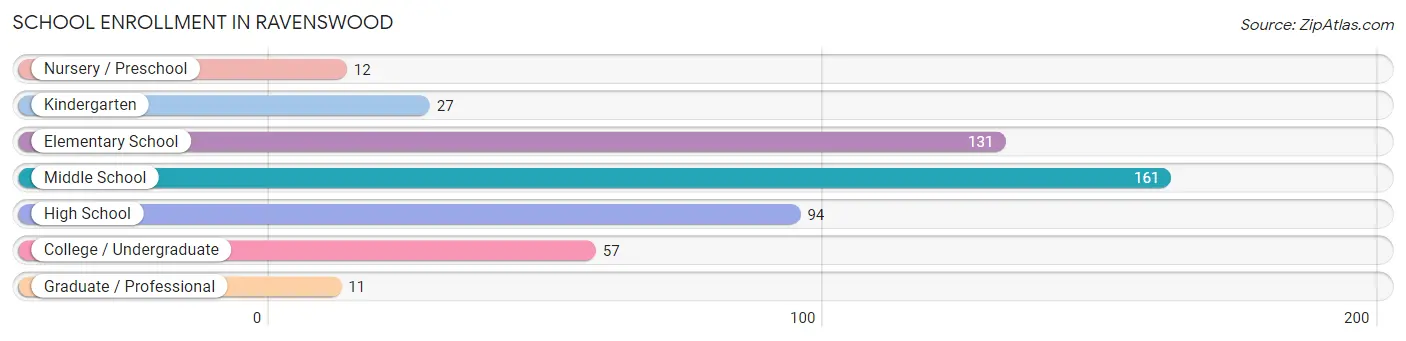
| School Level | # Students | % Students |
| Nursery / Preschool | 12 | 2.4% |
| Kindergarten | 27 | 5.5% |
| Elementary School | 131 | 26.6% |
| Middle School | 161 | 32.7% |
| High School | 94 | 19.1% |
| College / Undergraduate | 57 | 11.6% |
| Graduate / Professional | 11 | 2.2% |
| Total | 493 | 100.0% |
School Enrollment by Age by Funding Source in Ravenswood
Out of a total of 493 students who are enrolled in schools in Ravenswood, 8 (1.6%) attend a private institution, while the remaining 485 (98.4%) are enrolled in public schools. The age group of 10 to 14 year olds has the highest likelihood of being enrolled in private schools, with 8 (4.2% in the age bracket) enrolled. Conversely, the age group of 3 to 4 year olds has the lowest likelihood of being enrolled in a private school, with 12 (100.0% in the age bracket) attending a public institution.
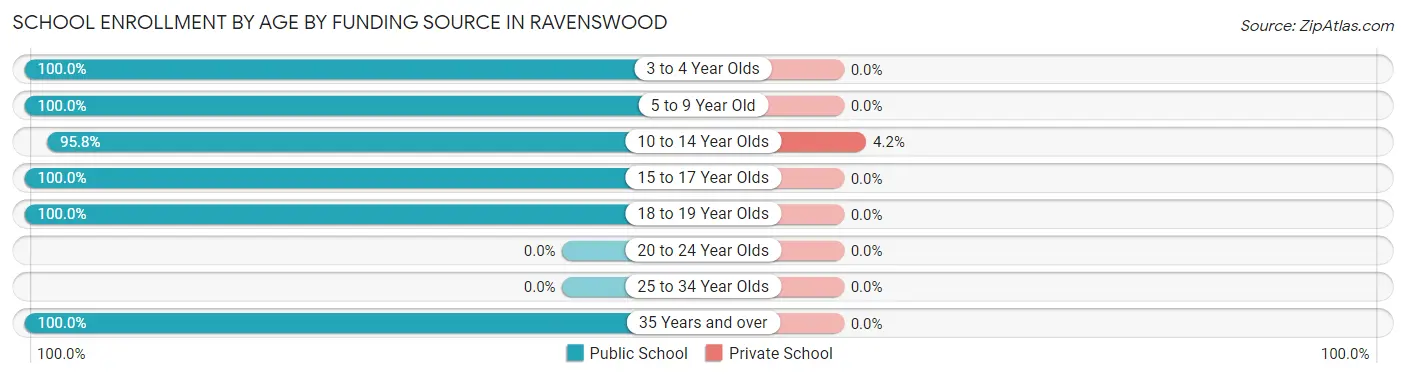
| Age Bracket | Public School | Private School |
| 3 to 4 Year Olds | 12 (100.0%) | 0 (0.0%) |
| 5 to 9 Year Old | 149 (100.0%) | 0 (0.0%) |
| 10 to 14 Year Olds | 183 (95.8%) | 8 (4.2%) |
| 15 to 17 Year Olds | 60 (100.0%) | 0 (0.0%) |
| 18 to 19 Year Olds | 52 (100.0%) | 0 (0.0%) |
| 20 to 24 Year Olds | 0 (0.0%) | 0 (0.0%) |
| 25 to 34 Year Olds | 0 (0.0%) | 0 (0.0%) |
| 35 Years and over | 29 (100.0%) | 0 (0.0%) |
| Total | 485 (98.4%) | 8 (1.6%) |
Educational Attainment by Field of Study in Ravenswood
Education (154 | 33.0%), business (87 | 18.6%), physical & health sciences (66 | 14.1%), bio, nature & agricultural (49 | 10.5%), and science & technology (47 | 10.1%) are the most common fields of study among 467 individuals in Ravenswood who have obtained a bachelor's degree or higher.
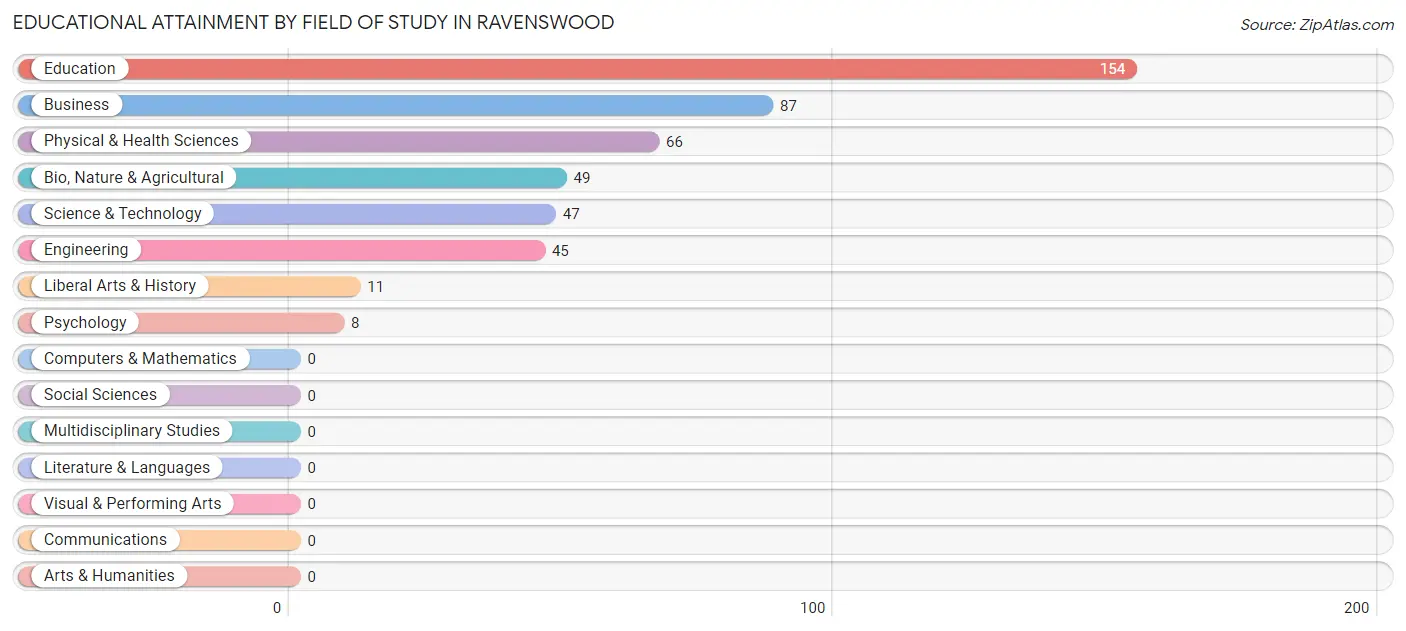
| Field of Study | # Graduates | % Graduates |
| Computers & Mathematics | 0 | 0.0% |
| Bio, Nature & Agricultural | 49 | 10.5% |
| Physical & Health Sciences | 66 | 14.1% |
| Psychology | 8 | 1.7% |
| Social Sciences | 0 | 0.0% |
| Engineering | 45 | 9.6% |
| Multidisciplinary Studies | 0 | 0.0% |
| Science & Technology | 47 | 10.1% |
| Business | 87 | 18.6% |
| Education | 154 | 33.0% |
| Literature & Languages | 0 | 0.0% |
| Liberal Arts & History | 11 | 2.4% |
| Visual & Performing Arts | 0 | 0.0% |
| Communications | 0 | 0.0% |
| Arts & Humanities | 0 | 0.0% |
| Total | 467 | 100.0% |
Transportation & Commute in Ravenswood
Vehicle Availability by Sex in Ravenswood
The most prevalent vehicle ownership categories in Ravenswood are males with 2 vehicles (348, accounting for 48.1%) and females with 2 vehicles (225, making up 46.7%).
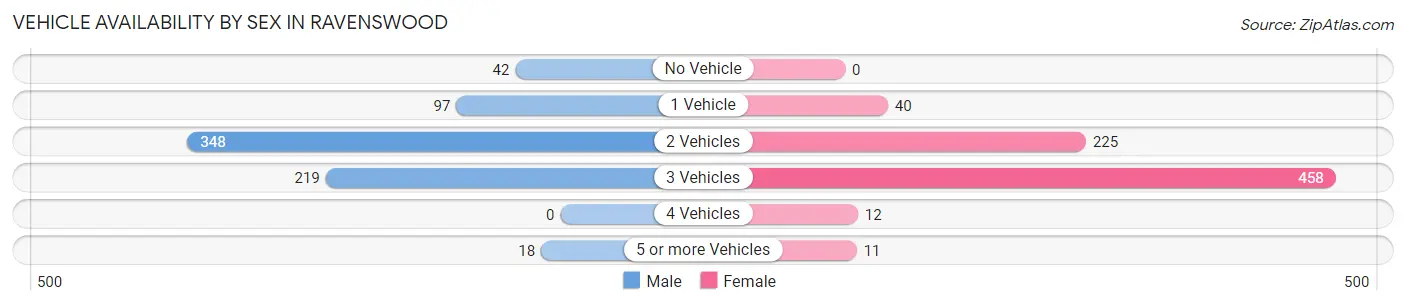
| Vehicles Available | Male | Female |
| No Vehicle | 42 (5.8%) | 0 (0.0%) |
| 1 Vehicle | 97 (13.4%) | 40 (5.4%) |
| 2 Vehicles | 348 (48.1%) | 225 (30.2%) |
| 3 Vehicles | 219 (30.2%) | 458 (61.4%) |
| 4 Vehicles | 0 (0.0%) | 12 (1.6%) |
| 5 or more Vehicles | 18 (2.5%) | 11 (1.5%) |
| Total | 724 (100.0%) | 746 (100.0%) |
Commute Time in Ravenswood
The most frequently occuring commute durations in Ravenswood are 10 to 14 minutes (216 commuters, 17.6%), 20 to 24 minutes (210 commuters, 17.1%), and 5 to 9 minutes (192 commuters, 15.7%).
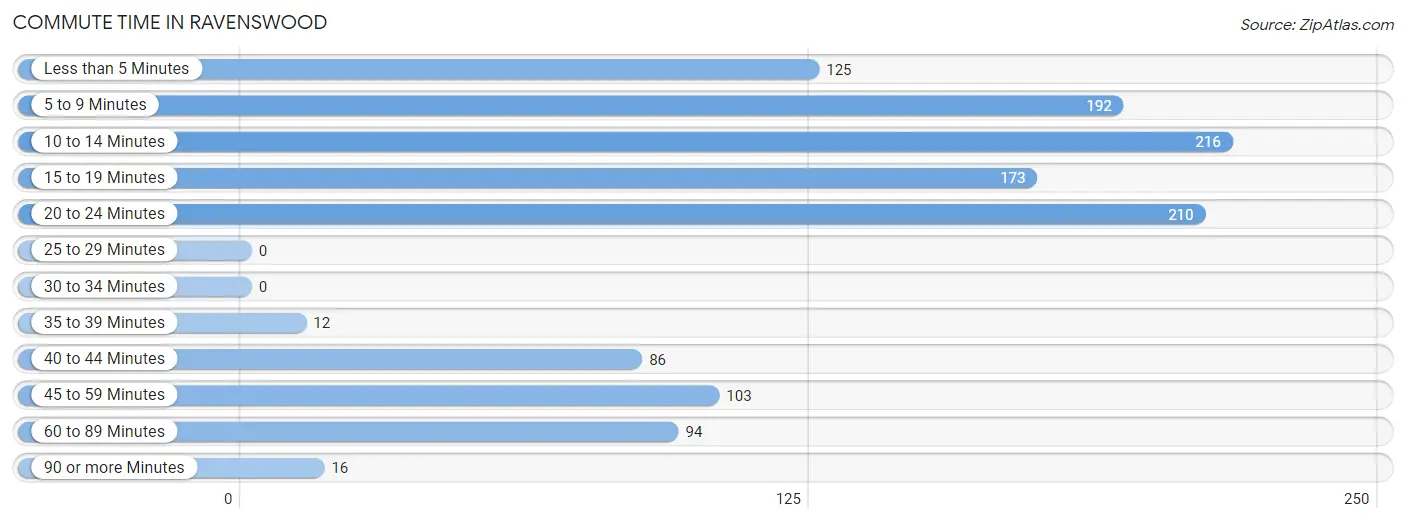
| Commute Time | # Commuters | % Commuters |
| Less than 5 Minutes | 125 | 10.2% |
| 5 to 9 Minutes | 192 | 15.7% |
| 10 to 14 Minutes | 216 | 17.6% |
| 15 to 19 Minutes | 173 | 14.1% |
| 20 to 24 Minutes | 210 | 17.1% |
| 25 to 29 Minutes | 0 | 0.0% |
| 30 to 34 Minutes | 0 | 0.0% |
| 35 to 39 Minutes | 12 | 1.0% |
| 40 to 44 Minutes | 86 | 7.0% |
| 45 to 59 Minutes | 103 | 8.4% |
| 60 to 89 Minutes | 94 | 7.7% |
| 90 or more Minutes | 16 | 1.3% |
Commute Time by Sex in Ravenswood
The most common commute times in Ravenswood are 10 to 14 minutes (182 commuters, 26.4%) for males and 20 to 24 minutes (106 commuters, 19.7%) for females.
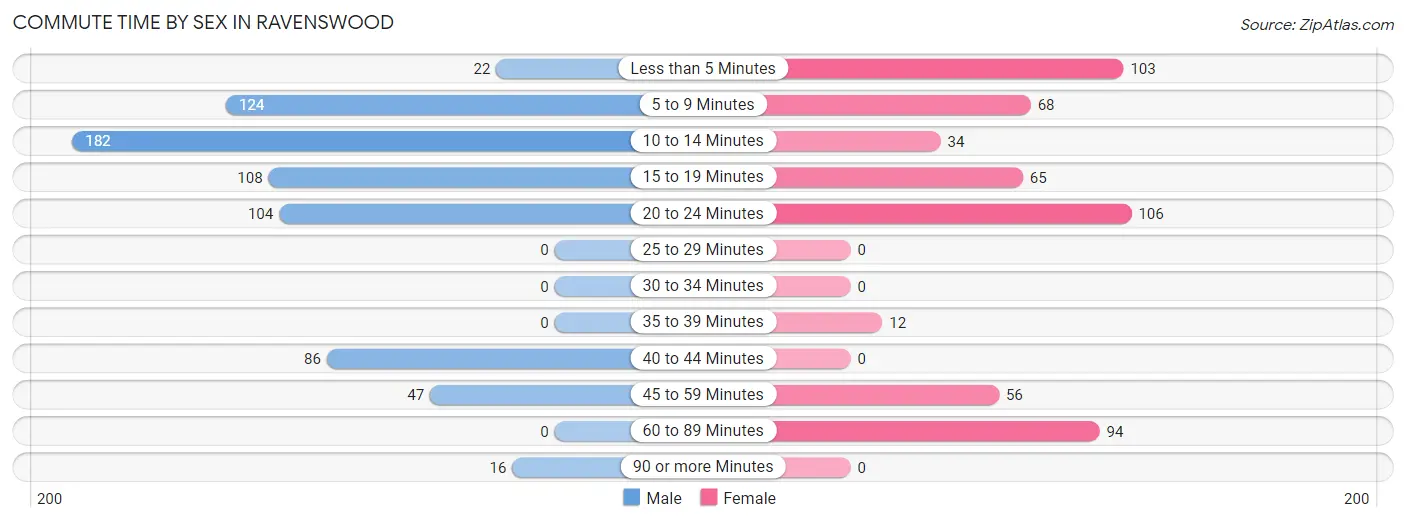
| Commute Time | Male | Female |
| Less than 5 Minutes | 22 (3.2%) | 103 (19.1%) |
| 5 to 9 Minutes | 124 (18.0%) | 68 (12.6%) |
| 10 to 14 Minutes | 182 (26.4%) | 34 (6.3%) |
| 15 to 19 Minutes | 108 (15.7%) | 65 (12.1%) |
| 20 to 24 Minutes | 104 (15.1%) | 106 (19.7%) |
| 25 to 29 Minutes | 0 (0.0%) | 0 (0.0%) |
| 30 to 34 Minutes | 0 (0.0%) | 0 (0.0%) |
| 35 to 39 Minutes | 0 (0.0%) | 12 (2.2%) |
| 40 to 44 Minutes | 86 (12.5%) | 0 (0.0%) |
| 45 to 59 Minutes | 47 (6.8%) | 56 (10.4%) |
| 60 to 89 Minutes | 0 (0.0%) | 94 (17.5%) |
| 90 or more Minutes | 16 (2.3%) | 0 (0.0%) |
Time of Departure to Work by Sex in Ravenswood
The most frequent times of departure to work in Ravenswood are 7:00 AM to 7:29 AM (129, 18.7%) for males and 4:00 PM to 11:59 PM (222, 41.3%) for females.
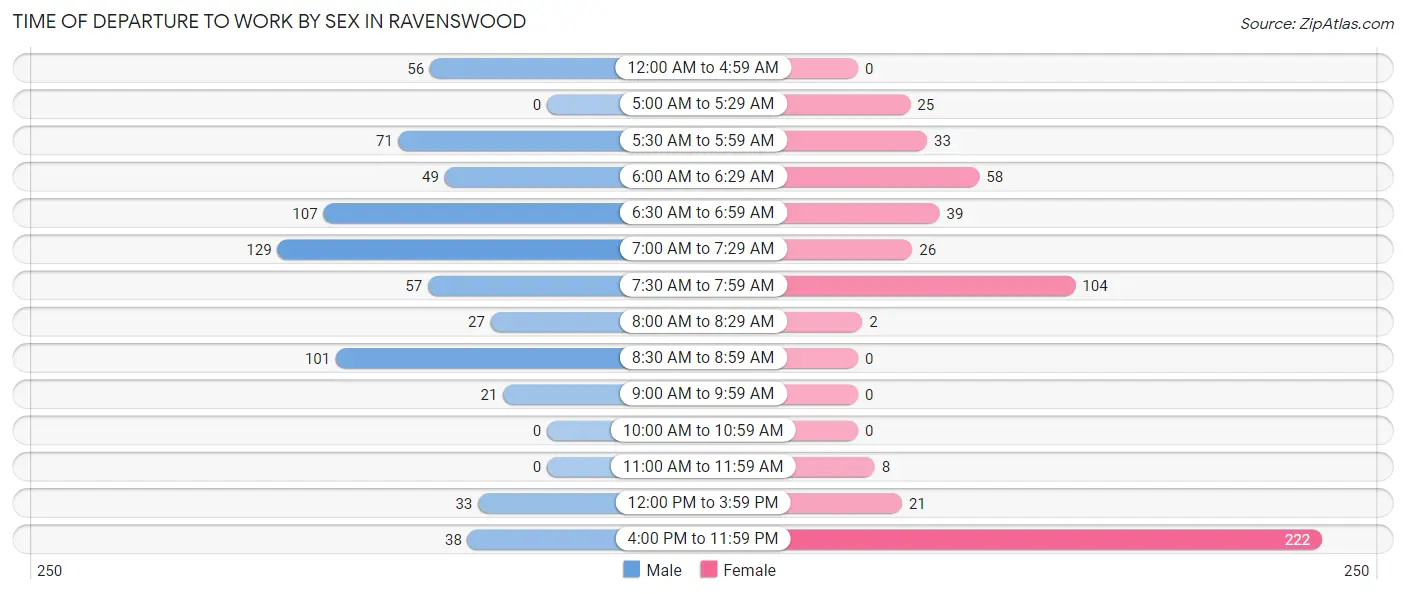
| Time of Departure | Male | Female |
| 12:00 AM to 4:59 AM | 56 (8.1%) | 0 (0.0%) |
| 5:00 AM to 5:29 AM | 0 (0.0%) | 25 (4.6%) |
| 5:30 AM to 5:59 AM | 71 (10.3%) | 33 (6.1%) |
| 6:00 AM to 6:29 AM | 49 (7.1%) | 58 (10.8%) |
| 6:30 AM to 6:59 AM | 107 (15.5%) | 39 (7.2%) |
| 7:00 AM to 7:29 AM | 129 (18.7%) | 26 (4.8%) |
| 7:30 AM to 7:59 AM | 57 (8.3%) | 104 (19.3%) |
| 8:00 AM to 8:29 AM | 27 (3.9%) | 2 (0.4%) |
| 8:30 AM to 8:59 AM | 101 (14.7%) | 0 (0.0%) |
| 9:00 AM to 9:59 AM | 21 (3.0%) | 0 (0.0%) |
| 10:00 AM to 10:59 AM | 0 (0.0%) | 0 (0.0%) |
| 11:00 AM to 11:59 AM | 0 (0.0%) | 8 (1.5%) |
| 12:00 PM to 3:59 PM | 33 (4.8%) | 21 (3.9%) |
| 4:00 PM to 11:59 PM | 38 (5.5%) | 222 (41.3%) |
| Total | 689 (100.0%) | 538 (100.0%) |
Housing Occupancy in Ravenswood
Occupancy by Ownership in Ravenswood
Of the total 1,510 dwellings in Ravenswood, owner-occupied units account for 1,065 (70.5%), while renter-occupied units make up 445 (29.5%).
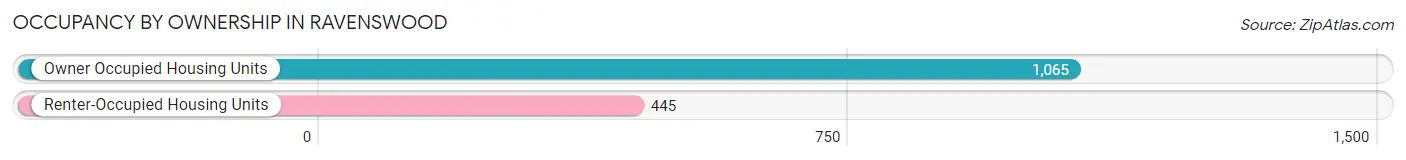
| Occupancy | # Housing Units | % Housing Units |
| Owner Occupied Housing Units | 1,065 | 70.5% |
| Renter-Occupied Housing Units | 445 | 29.5% |
| Total Occupied Housing Units | 1,510 | 100.0% |
Occupancy by Household Size in Ravenswood
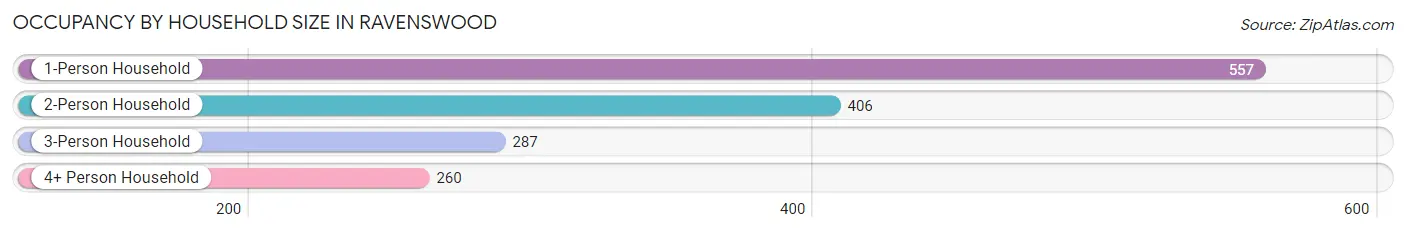
| Household Size | # Housing Units | % Housing Units |
| 1-Person Household | 557 | 36.9% |
| 2-Person Household | 406 | 26.9% |
| 3-Person Household | 287 | 19.0% |
| 4+ Person Household | 260 | 17.2% |
| Total Housing Units | 1,510 | 100.0% |
Occupancy by Ownership by Household Size in Ravenswood
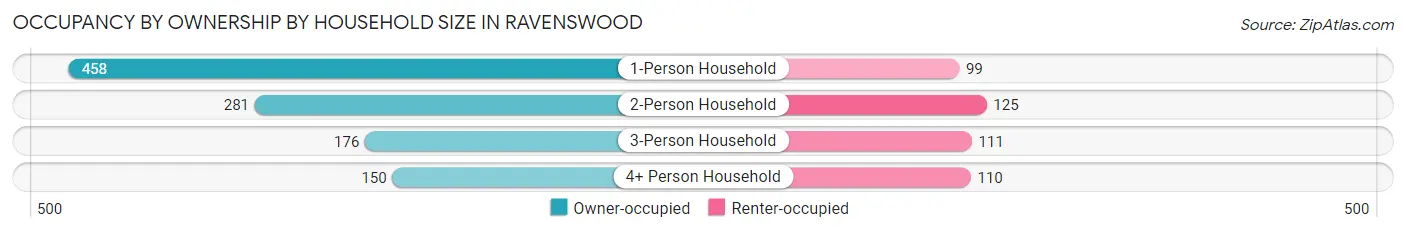
| Household Size | Owner-occupied | Renter-occupied |
| 1-Person Household | 458 (82.2%) | 99 (17.8%) |
| 2-Person Household | 281 (69.2%) | 125 (30.8%) |
| 3-Person Household | 176 (61.3%) | 111 (38.7%) |
| 4+ Person Household | 150 (57.7%) | 110 (42.3%) |
| Total Housing Units | 1,065 (70.5%) | 445 (29.5%) |
Occupancy by Educational Attainment in Ravenswood
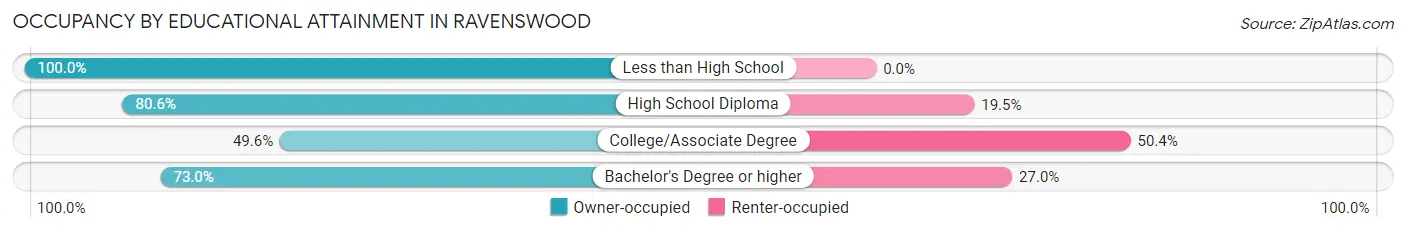
| Household Size | Owner-occupied | Renter-occupied |
| Less than High School | 78 (100.0%) | 0 (0.0%) |
| High School Diploma | 526 (80.5%) | 127 (19.5%) |
| College/Associate Degree | 228 (49.6%) | 232 (50.4%) |
| Bachelor's Degree or higher | 233 (73.0%) | 86 (27.0%) |
Occupancy by Age of Householder in Ravenswood
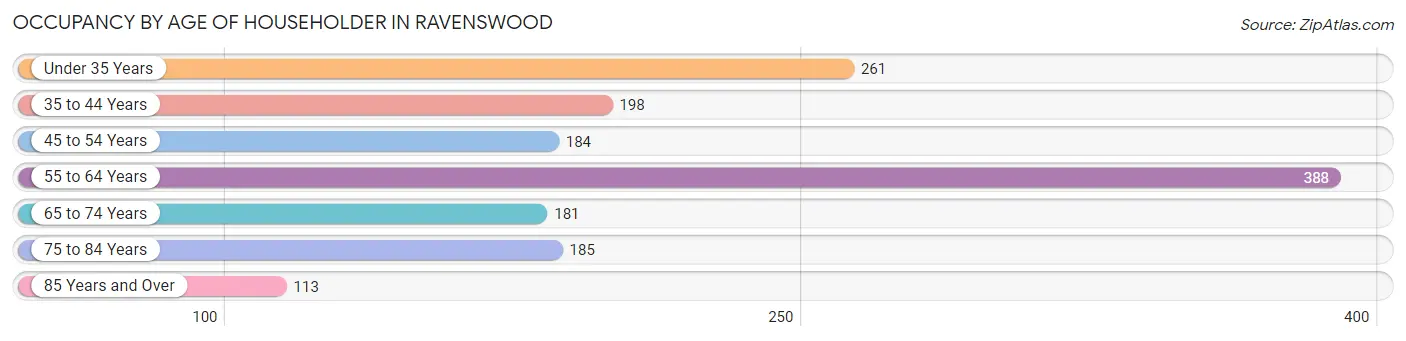
| Age Bracket | # Households | % Households |
| Under 35 Years | 261 | 17.3% |
| 35 to 44 Years | 198 | 13.1% |
| 45 to 54 Years | 184 | 12.2% |
| 55 to 64 Years | 388 | 25.7% |
| 65 to 74 Years | 181 | 12.0% |
| 75 to 84 Years | 185 | 12.2% |
| 85 Years and Over | 113 | 7.5% |
| Total | 1,510 | 100.0% |
Housing Finances in Ravenswood
Median Income by Occupancy in Ravenswood
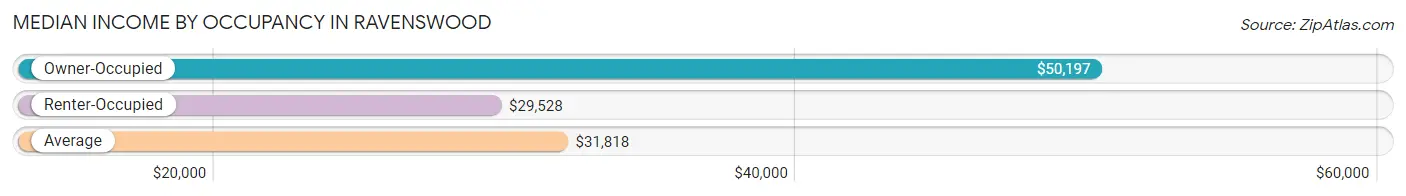
| Occupancy Type | # Households | Median Income |
| Owner-Occupied | 1,065 (70.5%) | $50,197 |
| Renter-Occupied | 445 (29.5%) | $29,528 |
| Average | 1,510 (100.0%) | $31,818 |
Occupancy by Householder Income Bracket in Ravenswood
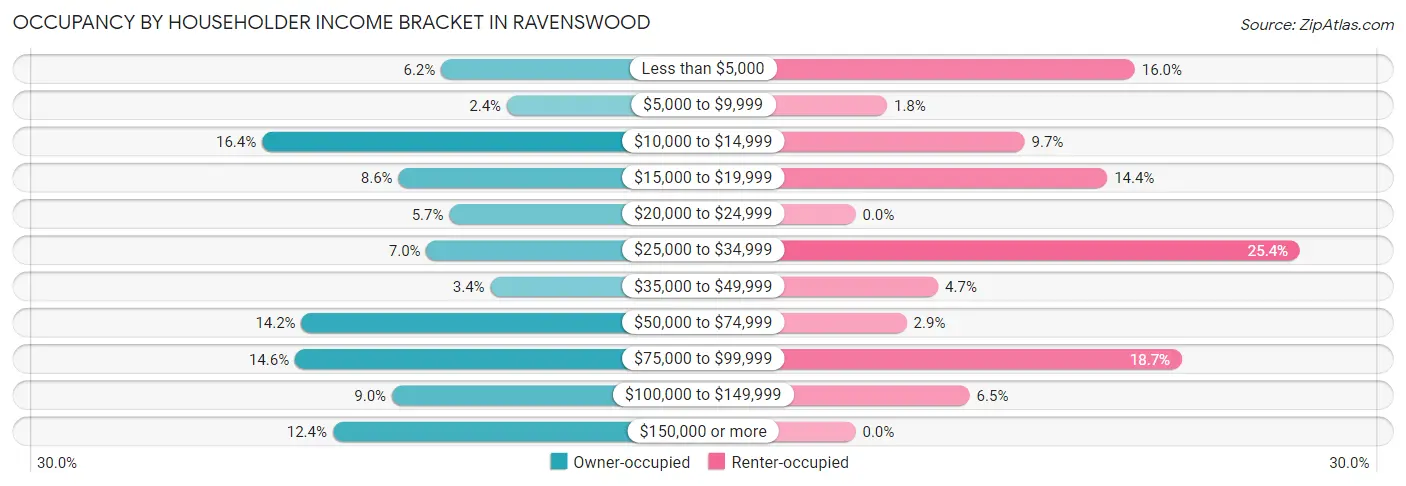
| Income Bracket | Owner-occupied | Renter-occupied |
| Less than $5,000 | 66 (6.2%) | 71 (16.0%) |
| $5,000 to $9,999 | 26 (2.4%) | 8 (1.8%) |
| $10,000 to $14,999 | 175 (16.4%) | 43 (9.7%) |
| $15,000 to $19,999 | 92 (8.6%) | 64 (14.4%) |
| $20,000 to $24,999 | 61 (5.7%) | 0 (0.0%) |
| $25,000 to $34,999 | 75 (7.0%) | 113 (25.4%) |
| $35,000 to $49,999 | 36 (3.4%) | 21 (4.7%) |
| $50,000 to $74,999 | 151 (14.2%) | 13 (2.9%) |
| $75,000 to $99,999 | 155 (14.5%) | 83 (18.6%) |
| $100,000 to $149,999 | 96 (9.0%) | 29 (6.5%) |
| $150,000 or more | 132 (12.4%) | 0 (0.0%) |
| Total | 1,065 (100.0%) | 445 (100.0%) |
Monthly Housing Cost Tiers in Ravenswood
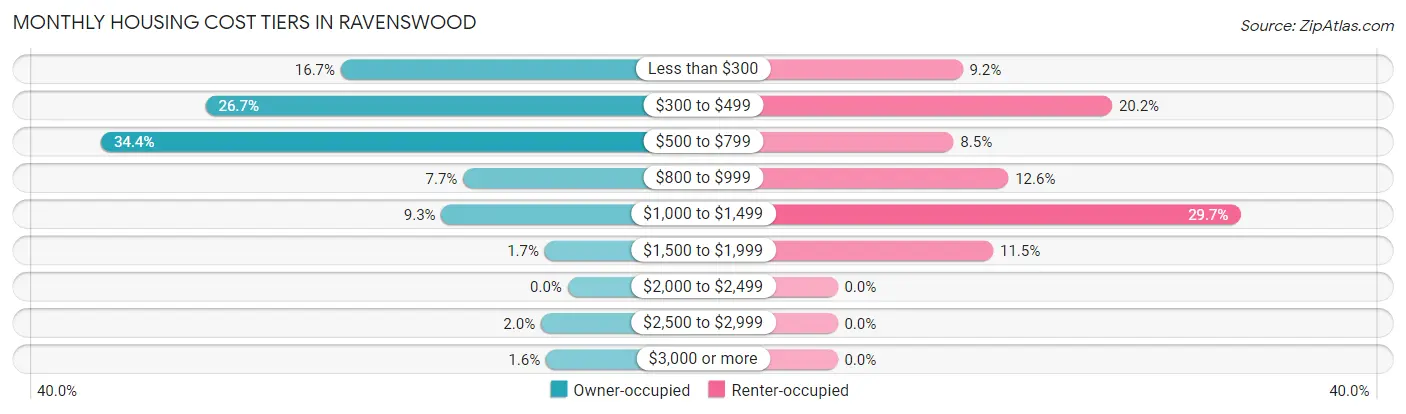
| Monthly Cost | Owner-occupied | Renter-occupied |
| Less than $300 | 178 (16.7%) | 41 (9.2%) |
| $300 to $499 | 284 (26.7%) | 90 (20.2%) |
| $500 to $799 | 366 (34.4%) | 38 (8.5%) |
| $800 to $999 | 82 (7.7%) | 56 (12.6%) |
| $1,000 to $1,499 | 99 (9.3%) | 132 (29.7%) |
| $1,500 to $1,999 | 18 (1.7%) | 51 (11.5%) |
| $2,000 to $2,499 | 0 (0.0%) | 0 (0.0%) |
| $2,500 to $2,999 | 21 (2.0%) | 0 (0.0%) |
| $3,000 or more | 17 (1.6%) | 0 (0.0%) |
| Total | 1,065 (100.0%) | 445 (100.0%) |
Physical Housing Characteristics in Ravenswood
Housing Structures in Ravenswood
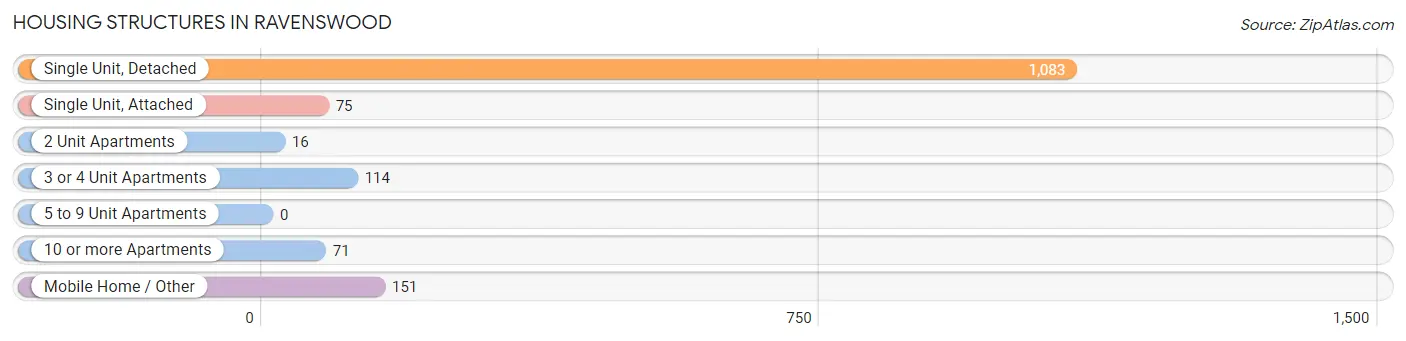
| Structure Type | # Housing Units | % Housing Units |
| Single Unit, Detached | 1,083 | 71.7% |
| Single Unit, Attached | 75 | 5.0% |
| 2 Unit Apartments | 16 | 1.1% |
| 3 or 4 Unit Apartments | 114 | 7.5% |
| 5 to 9 Unit Apartments | 0 | 0.0% |
| 10 or more Apartments | 71 | 4.7% |
| Mobile Home / Other | 151 | 10.0% |
| Total | 1,510 | 100.0% |
Housing Structures by Occupancy in Ravenswood
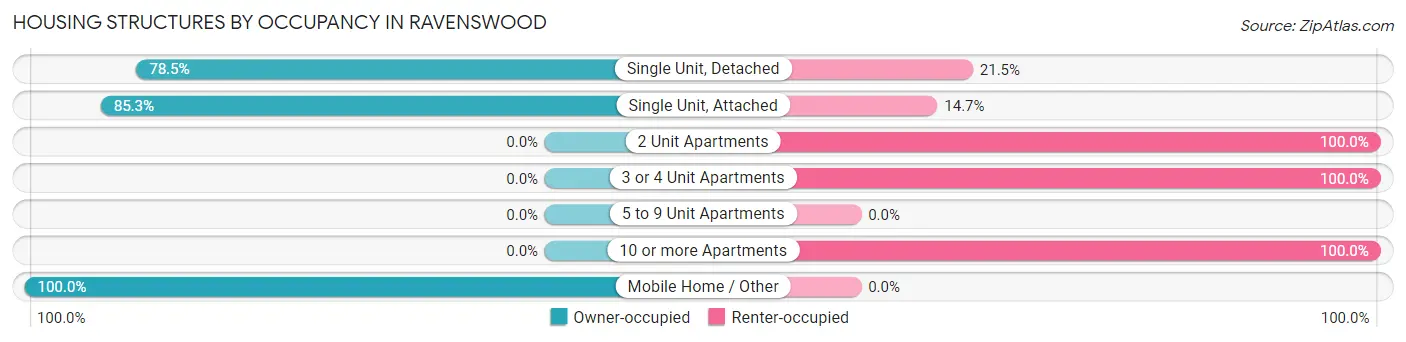
| Structure Type | Owner-occupied | Renter-occupied |
| Single Unit, Detached | 850 (78.5%) | 233 (21.5%) |
| Single Unit, Attached | 64 (85.3%) | 11 (14.7%) |
| 2 Unit Apartments | 0 (0.0%) | 16 (100.0%) |
| 3 or 4 Unit Apartments | 0 (0.0%) | 114 (100.0%) |
| 5 to 9 Unit Apartments | 0 (0.0%) | 0 (0.0%) |
| 10 or more Apartments | 0 (0.0%) | 71 (100.0%) |
| Mobile Home / Other | 151 (100.0%) | 0 (0.0%) |
| Total | 1,065 (70.5%) | 445 (29.5%) |
Housing Structures by Number of Rooms in Ravenswood
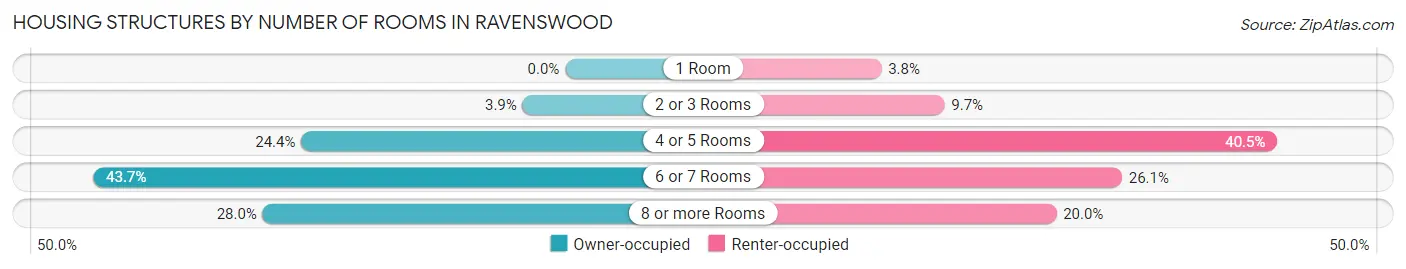
| Number of Rooms | Owner-occupied | Renter-occupied |
| 1 Room | 0 (0.0%) | 17 (3.8%) |
| 2 or 3 Rooms | 42 (3.9%) | 43 (9.7%) |
| 4 or 5 Rooms | 260 (24.4%) | 180 (40.5%) |
| 6 or 7 Rooms | 465 (43.7%) | 116 (26.1%) |
| 8 or more Rooms | 298 (28.0%) | 89 (20.0%) |
| Total | 1,065 (100.0%) | 445 (100.0%) |
Housing Structure by Heating Type in Ravenswood
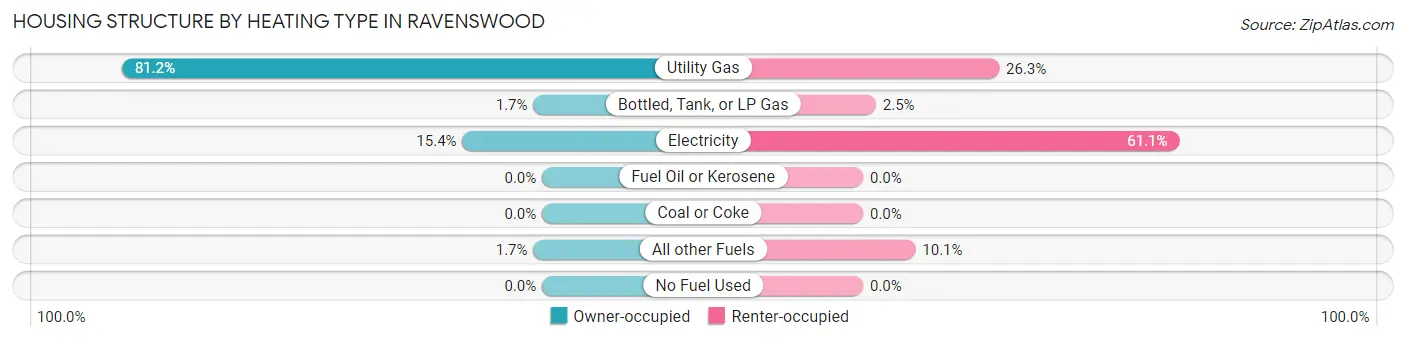
| Heating Type | Owner-occupied | Renter-occupied |
| Utility Gas | 865 (81.2%) | 117 (26.3%) |
| Bottled, Tank, or LP Gas | 18 (1.7%) | 11 (2.5%) |
| Electricity | 164 (15.4%) | 272 (61.1%) |
| Fuel Oil or Kerosene | 0 (0.0%) | 0 (0.0%) |
| Coal or Coke | 0 (0.0%) | 0 (0.0%) |
| All other Fuels | 18 (1.7%) | 45 (10.1%) |
| No Fuel Used | 0 (0.0%) | 0 (0.0%) |
| Total | 1,065 (100.0%) | 445 (100.0%) |
Household Vehicle Usage in Ravenswood
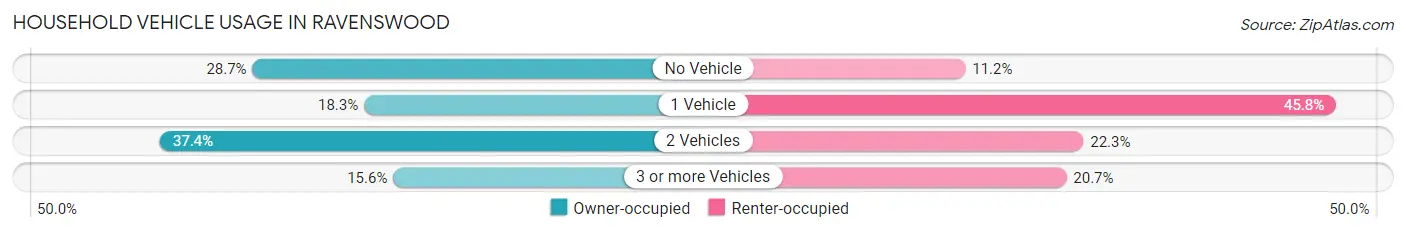
| Vehicles per Household | Owner-occupied | Renter-occupied |
| No Vehicle | 306 (28.7%) | 50 (11.2%) |
| 1 Vehicle | 195 (18.3%) | 204 (45.8%) |
| 2 Vehicles | 398 (37.4%) | 99 (22.3%) |
| 3 or more Vehicles | 166 (15.6%) | 92 (20.7%) |
| Total | 1,065 (100.0%) | 445 (100.0%) |
Real Estate & Mortgages in Ravenswood
Real Estate and Mortgage Overview in Ravenswood
| Characteristic | Without Mortgage | With Mortgage |
| Housing Units | 571 | 494 |
| Median Property Value | $86,300 | $88,500 |
| Median Household Income | $51,382 | $100 |
| Monthly Housing Costs | $360 | $17 |
| Real Estate Taxes | $870 | $0 |
Property Value by Mortgage Status in Ravenswood
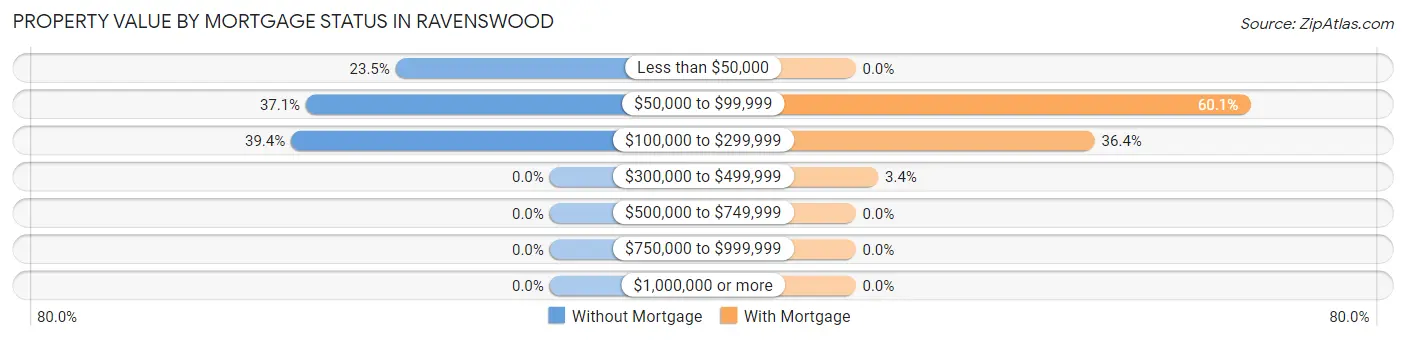
| Property Value | Without Mortgage | With Mortgage |
| Less than $50,000 | 134 (23.5%) | 0 (0.0%) |
| $50,000 to $99,999 | 212 (37.1%) | 297 (60.1%) |
| $100,000 to $299,999 | 225 (39.4%) | 180 (36.4%) |
| $300,000 to $499,999 | 0 (0.0%) | 17 (3.4%) |
| $500,000 to $749,999 | 0 (0.0%) | 0 (0.0%) |
| $750,000 to $999,999 | 0 (0.0%) | 0 (0.0%) |
| $1,000,000 or more | 0 (0.0%) | 0 (0.0%) |
| Total | 571 (100.0%) | 494 (100.0%) |
Household Income by Mortgage Status in Ravenswood
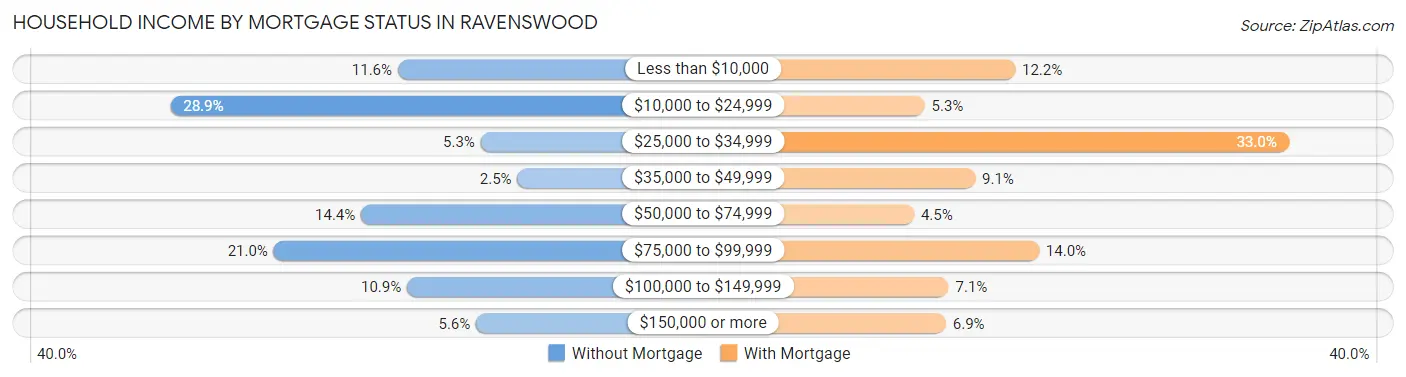
| Household Income | Without Mortgage | With Mortgage |
| Less than $10,000 | 66 (11.6%) | 60 (12.1%) |
| $10,000 to $24,999 | 165 (28.9%) | 26 (5.3%) |
| $25,000 to $34,999 | 30 (5.2%) | 163 (33.0%) |
| $35,000 to $49,999 | 14 (2.5%) | 45 (9.1%) |
| $50,000 to $74,999 | 82 (14.4%) | 22 (4.4%) |
| $75,000 to $99,999 | 120 (21.0%) | 69 (14.0%) |
| $100,000 to $149,999 | 62 (10.9%) | 35 (7.1%) |
| $150,000 or more | 32 (5.6%) | 34 (6.9%) |
| Total | 571 (100.0%) | 494 (100.0%) |
Property Value to Household Income Ratio in Ravenswood
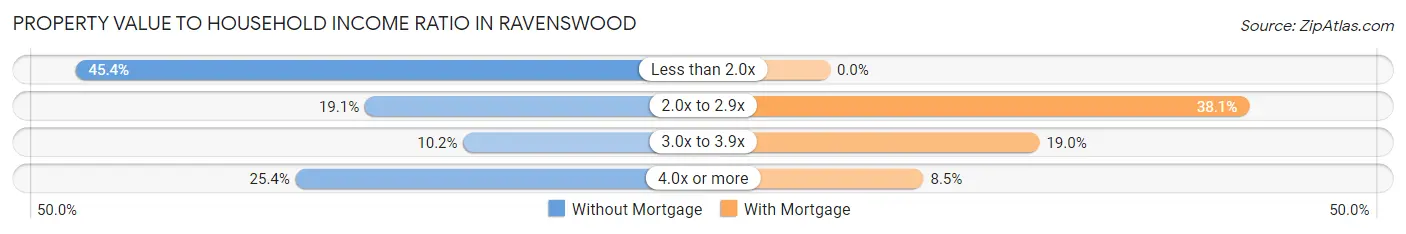
| Value-to-Income Ratio | Without Mortgage | With Mortgage |
| Less than 2.0x | 259 (45.4%) | 0 (0.0%) |
| 2.0x to 2.9x | 109 (19.1%) | 188 (38.1%) |
| 3.0x to 3.9x | 58 (10.2%) | 94 (19.0%) |
| 4.0x or more | 145 (25.4%) | 42 (8.5%) |
| Total | 571 (100.0%) | 494 (100.0%) |
Real Estate Taxes by Mortgage Status in Ravenswood
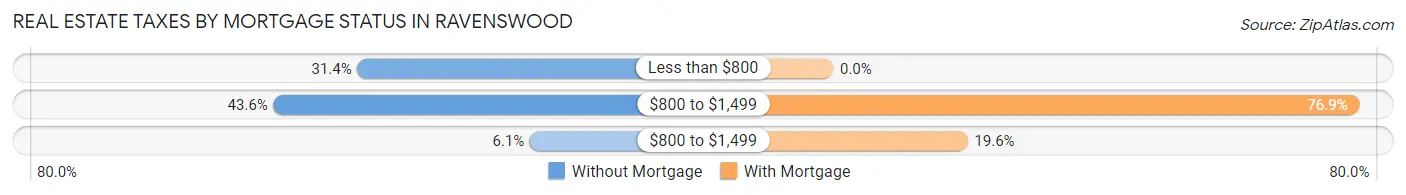
| Property Taxes | Without Mortgage | With Mortgage |
| Less than $800 | 179 (31.4%) | 0 (0.0%) |
| $800 to $1,499 | 249 (43.6%) | 380 (76.9%) |
| $800 to $1,499 | 35 (6.1%) | 97 (19.6%) |
| Total | 571 (100.0%) | 494 (100.0%) |
Health & Disability in Ravenswood
Health Insurance Coverage by Age in Ravenswood
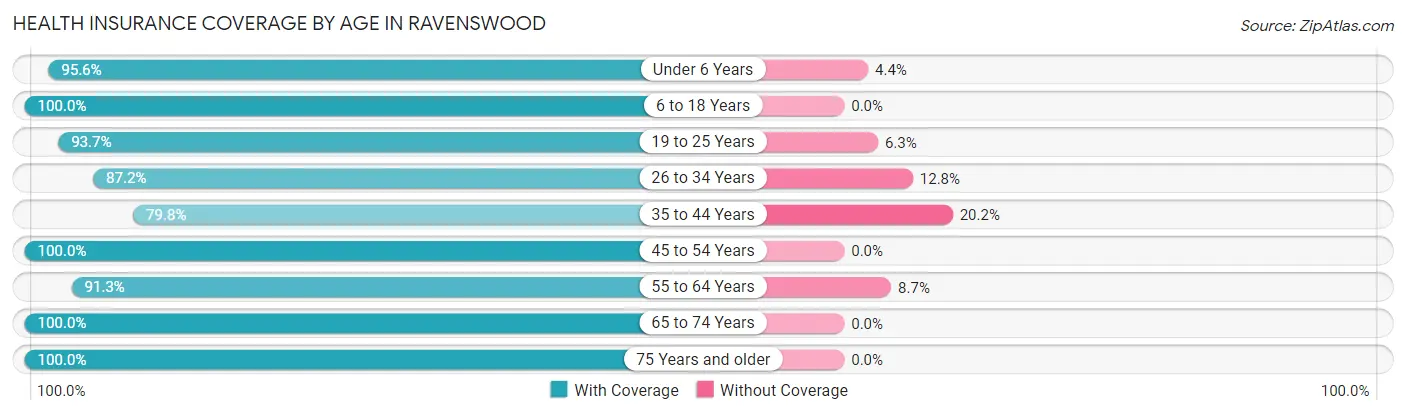
| Age Bracket | With Coverage | Without Coverage |
| Under 6 Years | 430 (95.6%) | 20 (4.4%) |
| 6 to 18 Years | 382 (100.0%) | 0 (0.0%) |
| 19 to 25 Years | 448 (93.7%) | 30 (6.3%) |
| 26 to 34 Years | 259 (87.2%) | 38 (12.8%) |
| 35 to 44 Years | 497 (79.8%) | 126 (20.2%) |
| 45 to 54 Years | 296 (100.0%) | 0 (0.0%) |
| 55 to 64 Years | 616 (91.3%) | 59 (8.7%) |
| 65 to 74 Years | 272 (100.0%) | 0 (0.0%) |
| 75 Years and older | 316 (100.0%) | 0 (0.0%) |
| Total | 3,516 (92.8%) | 273 (7.2%) |
Health Insurance Coverage by Citizenship Status in Ravenswood
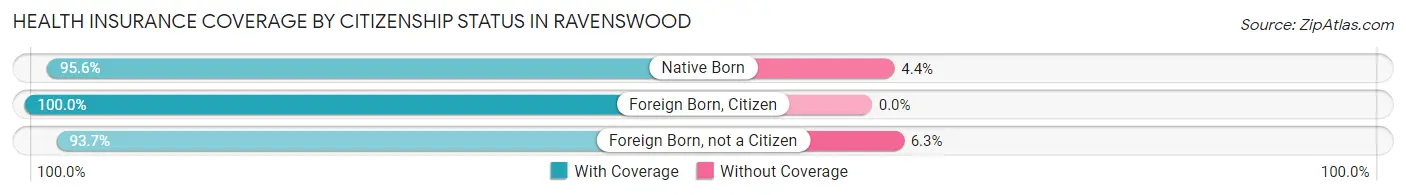
| Citizenship Status | With Coverage | Without Coverage |
| Native Born | 430 (95.6%) | 20 (4.4%) |
| Foreign Born, Citizen | 382 (100.0%) | 0 (0.0%) |
| Foreign Born, not a Citizen | 448 (93.7%) | 30 (6.3%) |
Health Insurance Coverage by Household Income in Ravenswood
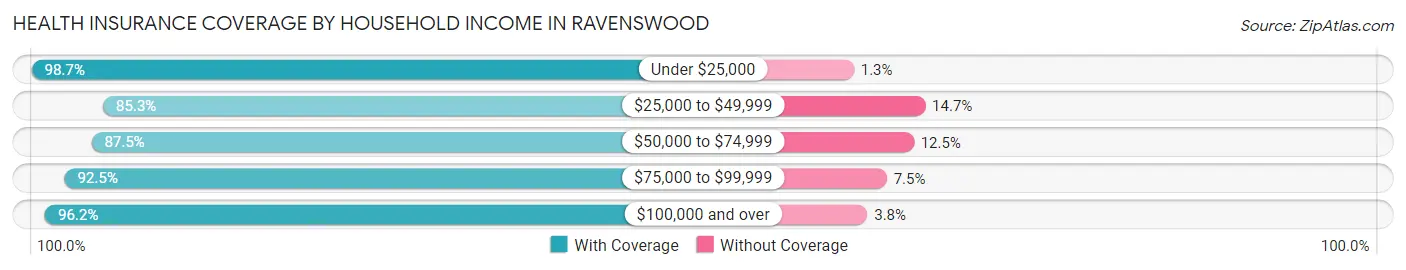
| Household Income | With Coverage | Without Coverage |
| Under $25,000 | 904 (98.7%) | 12 (1.3%) |
| $25,000 to $49,999 | 686 (85.3%) | 118 (14.7%) |
| $50,000 to $74,999 | 321 (87.5%) | 46 (12.5%) |
| $75,000 to $99,999 | 804 (92.5%) | 65 (7.5%) |
| $100,000 and over | 801 (96.2%) | 32 (3.8%) |
Public vs Private Health Insurance Coverage by Age in Ravenswood
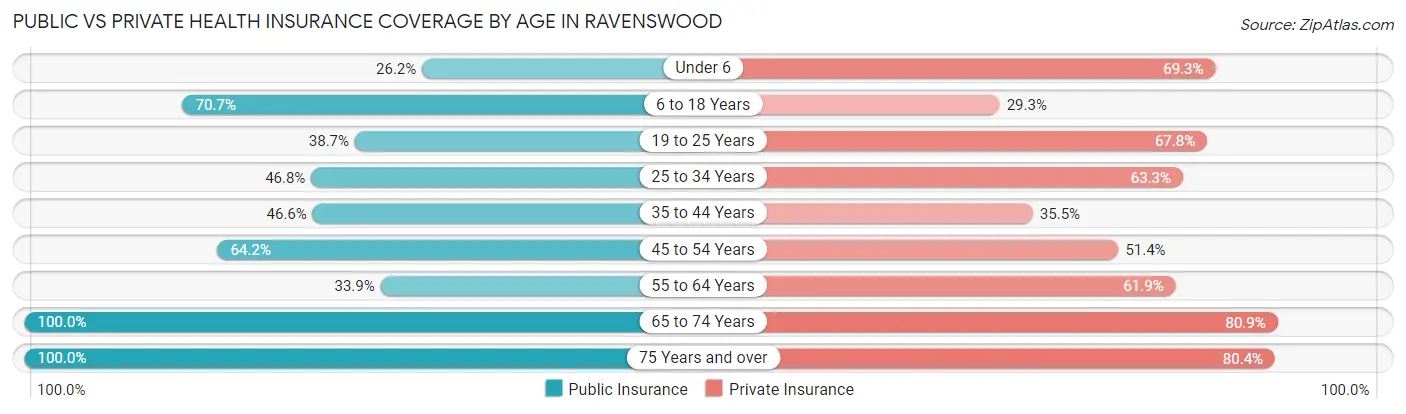
| Age Bracket | Public Insurance | Private Insurance |
| Under 6 | 118 (26.2%) | 312 (69.3%) |
| 6 to 18 Years | 270 (70.7%) | 112 (29.3%) |
| 19 to 25 Years | 185 (38.7%) | 324 (67.8%) |
| 25 to 34 Years | 139 (46.8%) | 188 (63.3%) |
| 35 to 44 Years | 290 (46.6%) | 221 (35.5%) |
| 45 to 54 Years | 190 (64.2%) | 152 (51.3%) |
| 55 to 64 Years | 229 (33.9%) | 418 (61.9%) |
| 65 to 74 Years | 272 (100.0%) | 220 (80.9%) |
| 75 Years and over | 316 (100.0%) | 254 (80.4%) |
| Total | 2,009 (53.0%) | 2,201 (58.1%) |
Disability Status by Sex by Age in Ravenswood
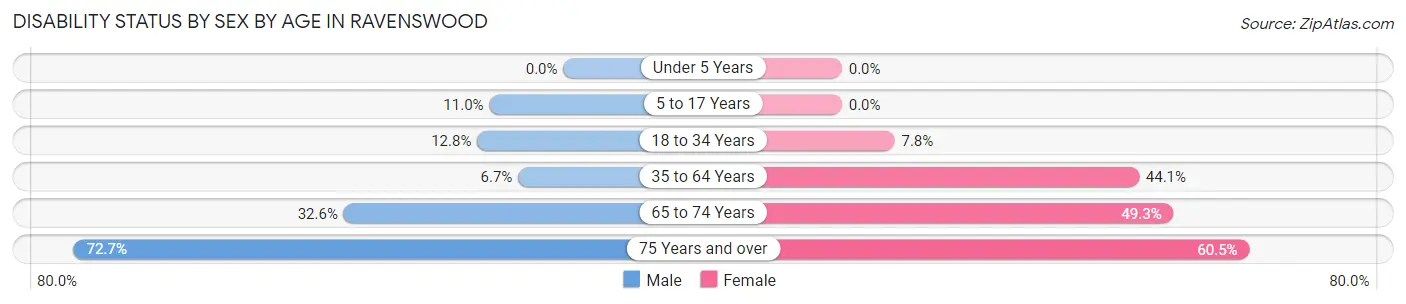
| Age Bracket | Male | Female |
| Under 5 Years | 0 (0.0%) | 0 (0.0%) |
| 5 to 17 Years | 19 (11.0%) | 0 (0.0%) |
| 18 to 34 Years | 55 (12.8%) | 27 (7.8%) |
| 35 to 64 Years | 42 (6.7%) | 427 (44.1%) |
| 65 to 74 Years | 45 (32.6%) | 66 (49.2%) |
| 75 Years and over | 64 (72.7%) | 138 (60.5%) |
Disability Class by Sex by Age in Ravenswood
Disability Class: Hearing Difficulty
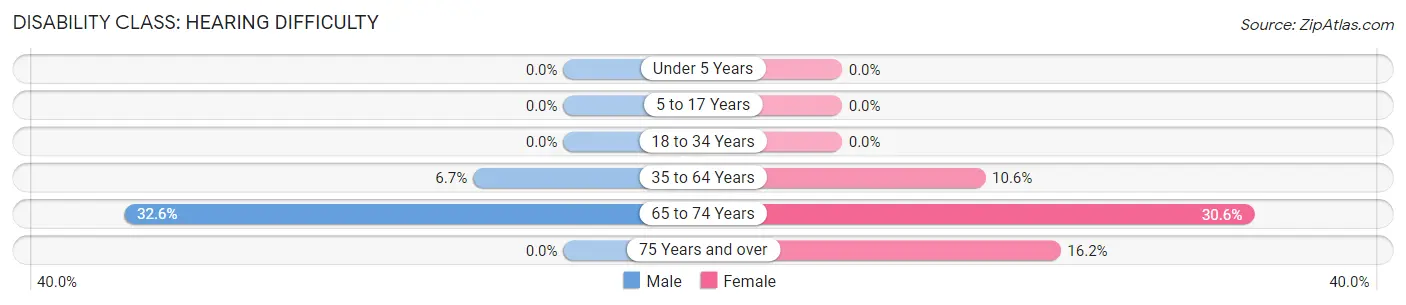
| Age Bracket | Male | Female |
| Under 5 Years | 0 (0.0%) | 0 (0.0%) |
| 5 to 17 Years | 0 (0.0%) | 0 (0.0%) |
| 18 to 34 Years | 0 (0.0%) | 0 (0.0%) |
| 35 to 64 Years | 42 (6.7%) | 103 (10.6%) |
| 65 to 74 Years | 45 (32.6%) | 41 (30.6%) |
| 75 Years and over | 0 (0.0%) | 37 (16.2%) |
Disability Class: Vision Difficulty
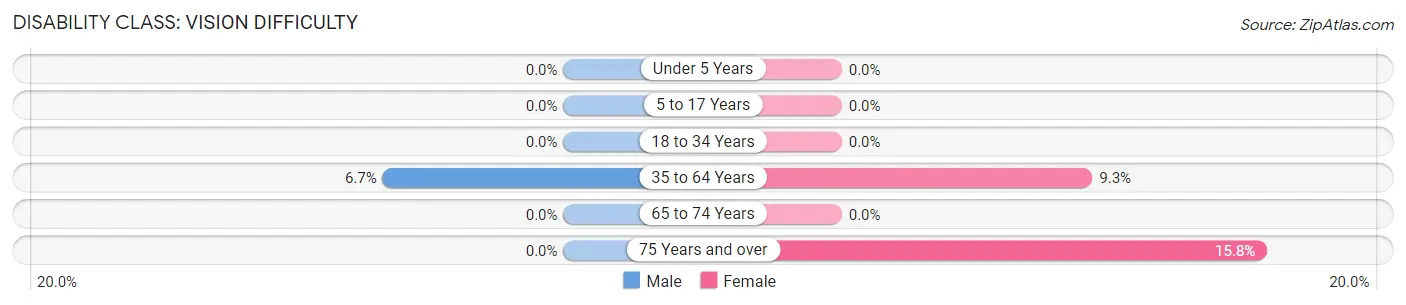
| Age Bracket | Male | Female |
| Under 5 Years | 0 (0.0%) | 0 (0.0%) |
| 5 to 17 Years | 0 (0.0%) | 0 (0.0%) |
| 18 to 34 Years | 0 (0.0%) | 0 (0.0%) |
| 35 to 64 Years | 42 (6.7%) | 90 (9.3%) |
| 65 to 74 Years | 0 (0.0%) | 0 (0.0%) |
| 75 Years and over | 0 (0.0%) | 36 (15.8%) |
Disability Class: Cognitive Difficulty
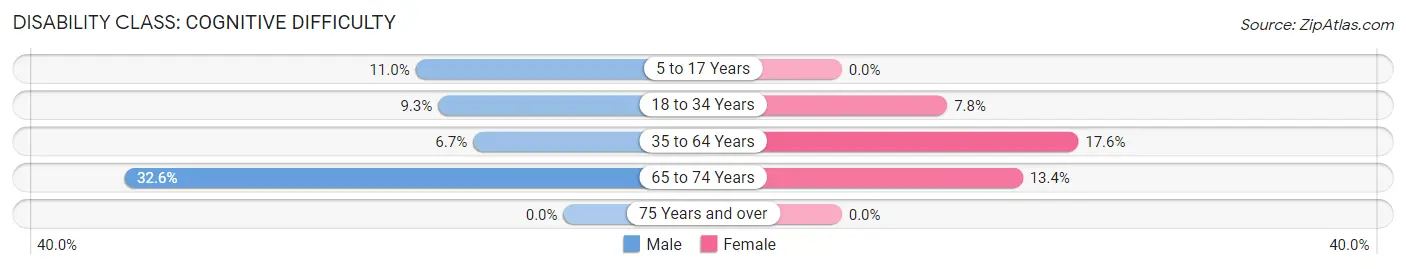
| Age Bracket | Male | Female |
| 5 to 17 Years | 19 (11.0%) | 0 (0.0%) |
| 18 to 34 Years | 40 (9.3%) | 27 (7.8%) |
| 35 to 64 Years | 42 (6.7%) | 170 (17.6%) |
| 65 to 74 Years | 45 (32.6%) | 18 (13.4%) |
| 75 Years and over | 0 (0.0%) | 0 (0.0%) |
Disability Class: Ambulatory Difficulty
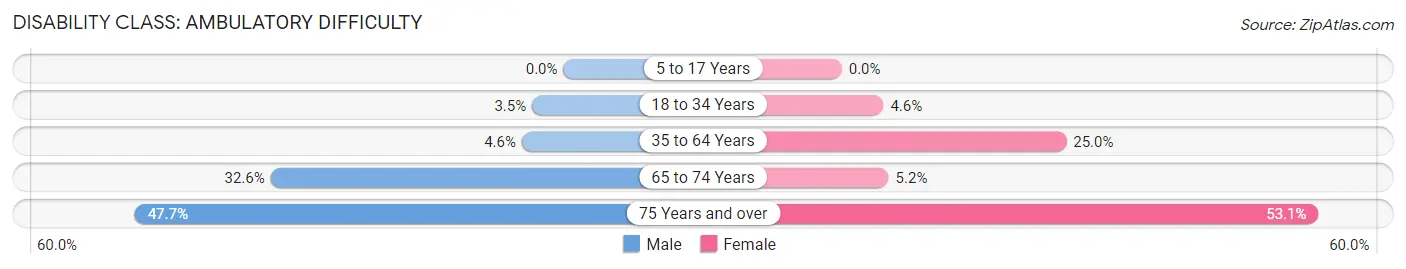
| Age Bracket | Male | Female |
| 5 to 17 Years | 0 (0.0%) | 0 (0.0%) |
| 18 to 34 Years | 15 (3.5%) | 16 (4.6%) |
| 35 to 64 Years | 29 (4.6%) | 242 (25.0%) |
| 65 to 74 Years | 45 (32.6%) | 7 (5.2%) |
| 75 Years and over | 42 (47.7%) | 121 (53.1%) |
Disability Class: Self-Care Difficulty
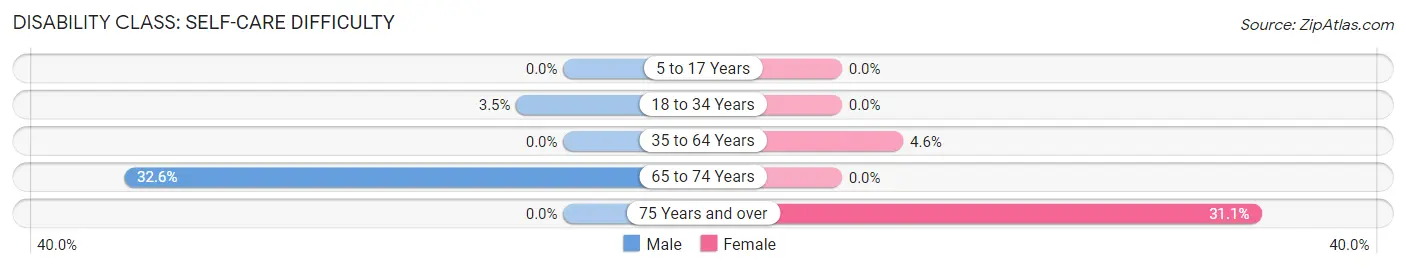
| Age Bracket | Male | Female |
| 5 to 17 Years | 0 (0.0%) | 0 (0.0%) |
| 18 to 34 Years | 15 (3.5%) | 0 (0.0%) |
| 35 to 64 Years | 0 (0.0%) | 44 (4.5%) |
| 65 to 74 Years | 45 (32.6%) | 0 (0.0%) |
| 75 Years and over | 0 (0.0%) | 71 (31.1%) |
Technology Access in Ravenswood
Computing Device Access in Ravenswood
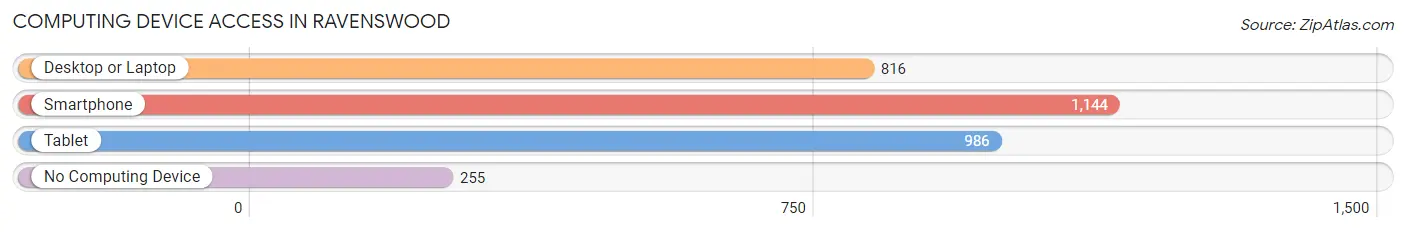
| Device Type | # Households | % Households |
| Desktop or Laptop | 816 | 54.0% |
| Smartphone | 1,144 | 75.8% |
| Tablet | 986 | 65.3% |
| No Computing Device | 255 | 16.9% |
| Total | 1,510 | 100.0% |
Internet Access in Ravenswood
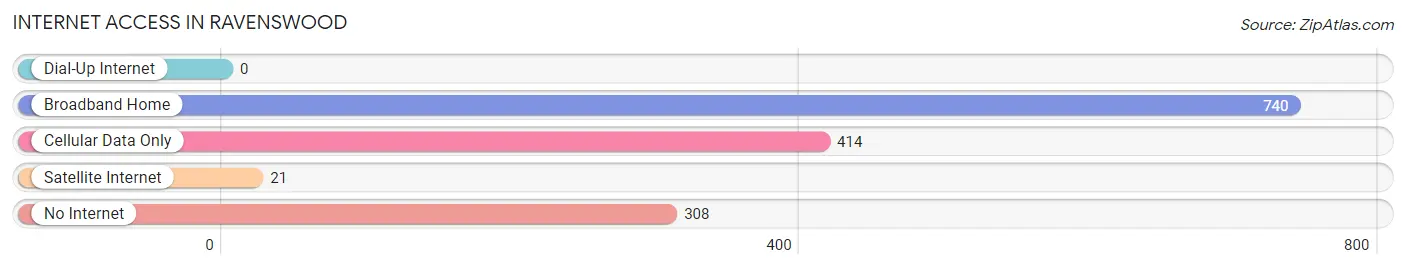
| Internet Type | # Households | % Households |
| Dial-Up Internet | 0 | 0.0% |
| Broadband Home | 740 | 49.0% |
| Cellular Data Only | 414 | 27.4% |
| Satellite Internet | 21 | 1.4% |
| No Internet | 308 | 20.4% |
| Total | 1,510 | 100.0% |
Ravenswood Summary
Ravenswood is a small city located in Jackson County, West Virginia, United States. It is situated along the Ohio River, approximately 40 miles south of Parkersburg. The city has a population of approximately 3,500 people and is the county seat of Jackson County.
History
The area that is now Ravenswood was first settled in the late 1700s by a group of German immigrants. The town was originally known as “New Germany” and was later renamed Ravenswood in 1832. The name was chosen to honor the Ravenswood family, who were prominent landowners in the area.
In 1835, the town was officially incorporated and the first post office was established. The town quickly grew and by the mid-1800s, it had become a major trading center for the surrounding area.
In the late 1800s, the town was connected to the rest of the state by the Chesapeake and Ohio Railway. This allowed for the growth of the local economy and the population of the town began to increase.
In the early 1900s, the town was home to several large industries, including a glass factory, a furniture factory, and a brickyard. These industries provided employment for many of the town’s residents and helped to fuel the local economy.
Geography
Ravenswood is located in the Appalachian Mountains of West Virginia. The city is situated along the Ohio River and is surrounded by rolling hills and forests. The climate in the area is generally mild, with hot summers and cold winters.
The city covers an area of approximately 2.5 square miles and has an elevation of 845 feet. The city is located approximately 40 miles south of Parkersburg and is accessible by Interstate 77.
Economy
The economy of Ravenswood is largely based on manufacturing and tourism. The city is home to several large industries, including a glass factory, a furniture factory, and a brickyard. These industries provide employment for many of the town’s residents and help to fuel the local economy.
The city is also home to several tourist attractions, including the Ravenswood Historical Museum, the Ravenswood City Park, and the Ravenswood Riverwalk. These attractions draw visitors from all over the state and help to boost the local economy.
Demographics
As of the 2010 census, the population of Ravenswood was 3,500. The racial makeup of the city was 95.3% White, 1.7% African American, 0.3% Native American, 0.7% Asian, 0.1% Pacific Islander, and 1.9% from two or more races.
The median household income in Ravenswood was $30,938 and the median family income was $37,813. The per capita income was $17,845. Approximately 17.3% of the population was below the poverty line.
Conclusion
Ravenswood is a small city located in Jackson County, West Virginia. It is situated along the Ohio River and has a population of approximately 3,500 people. The city’s economy is largely based on manufacturing and tourism and it is home to several large industries and tourist attractions. The racial makeup of the city is predominantly White and the median household income is $30,938.
Common Questions
What is Per Capita Income in Ravenswood?
Per Capita income in Ravenswood is $35,031.
What is the Median Family Income in Ravenswood?
Median Family Income in Ravenswood is $63,004.
What is the Median Household income in Ravenswood?
Median Household Income in Ravenswood is $31,818.
What is Income or Wage Gap in Ravenswood?
Income or Wage Gap in Ravenswood is 2.2%.
Women in Ravenswood earn 97.8 cents for every dollar earned by a man.
What is Inequality or Gini Index in Ravenswood?
Inequality or Gini Index in Ravenswood is 0.64.
What is the Total Population of Ravenswood?
Total Population of Ravenswood is 3,853.
What is the Total Male Population of Ravenswood?
Total Male Population of Ravenswood is 1,694.
What is the Total Female Population of Ravenswood?
Total Female Population of Ravenswood is 2,159.
What is the Ratio of Males per 100 Females in Ravenswood?
There are 78.46 Males per 100 Females in Ravenswood.
What is the Ratio of Females per 100 Males in Ravenswood?
There are 127.45 Females per 100 Males in Ravenswood.
What is the Median Population Age in Ravenswood?
Median Population Age in Ravenswood is 39.8 Years.
What is the Average Family Size in Ravenswood
Average Family Size in Ravenswood is 3.2 People.
What is the Average Household Size in Ravenswood
Average Household Size in Ravenswood is 2.5 People.
How Large is the Labor Force in Ravenswood?
There are 1,571 People in the Labor Forcein in Ravenswood.
What is the Percentage of People in the Labor Force in Ravenswood?
51.0% of People are in the Labor Force in Ravenswood.
What is the Unemployment Rate in Ravenswood?
Unemployment Rate in Ravenswood is 6.4%.