Brookhaven, WV Map & Demographics
Brookhaven Map
Brookhaven Overview
$34,307
PER CAPITA INCOME
$83,300
AVG FAMILY INCOME
$70,179
AVG HOUSEHOLD INCOME
16.4%
WAGE / INCOME GAP [ % ]
83.6¢/ $1
WAGE / INCOME GAP [ $ ]
$9,742
FAMILY INCOME DEFICIT
0.40
INEQUALITY / GINI INDEX
6,485
TOTAL POPULATION
3,237
MALE POPULATION
3,248
FEMALE POPULATION
99.66
MALES / 100 FEMALES
100.34
FEMALES / 100 MALES
37.2
MEDIAN AGE
3.1
AVG FAMILY SIZE
2.8
AVG HOUSEHOLD SIZE
3,239
LABOR FORCE [ PEOPLE ]
65.2%
PERCENT IN LABOR FORCE
7.8%
UNEMPLOYMENT RATE
Income in Brookhaven
Income Overview in Brookhaven
Per Capita Income in Brookhaven is $34,307, while median incomes of families and households are $83,300 and $70,179 respectively.
| Characteristic | Number | Measure |
| Per Capita Income | 6,485 | $34,307 |
| Median Family Income | 1,848 | $83,300 |
| Mean Family Income | 1,848 | $103,548 |
| Median Household Income | 2,343 | $70,179 |
| Mean Household Income | 2,343 | $96,015 |
| Income Deficit | 1,848 | $9,742 |
| Wage / Income Gap (%) | 6,485 | 16.43% |
| Wage / Income Gap ($) | 6,485 | 83.57¢ per $1 |
| Gini / Inequality Index | 6,485 | 0.40 |
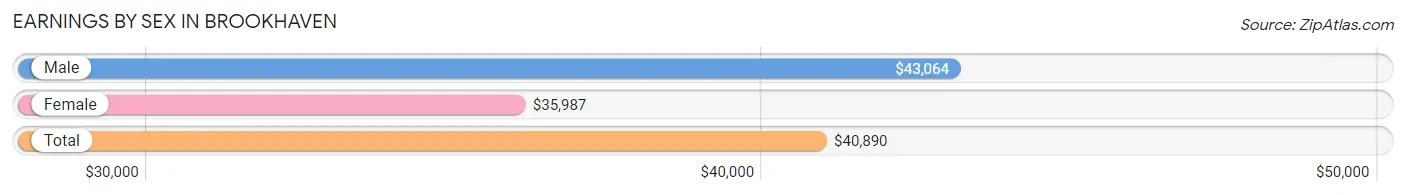
Earnings by Sex in Brookhaven
Average Earnings in Brookhaven are $40,890, $43,064 for men and $35,987 for women, a difference of 16.4%.
| Sex | Number | Average Earnings |
| Male | 1,799 (55.0%) | $43,064 |
| Female | 1,470 (45.0%) | $35,987 |
| Total | 3,269 (100.0%) | $40,890 |
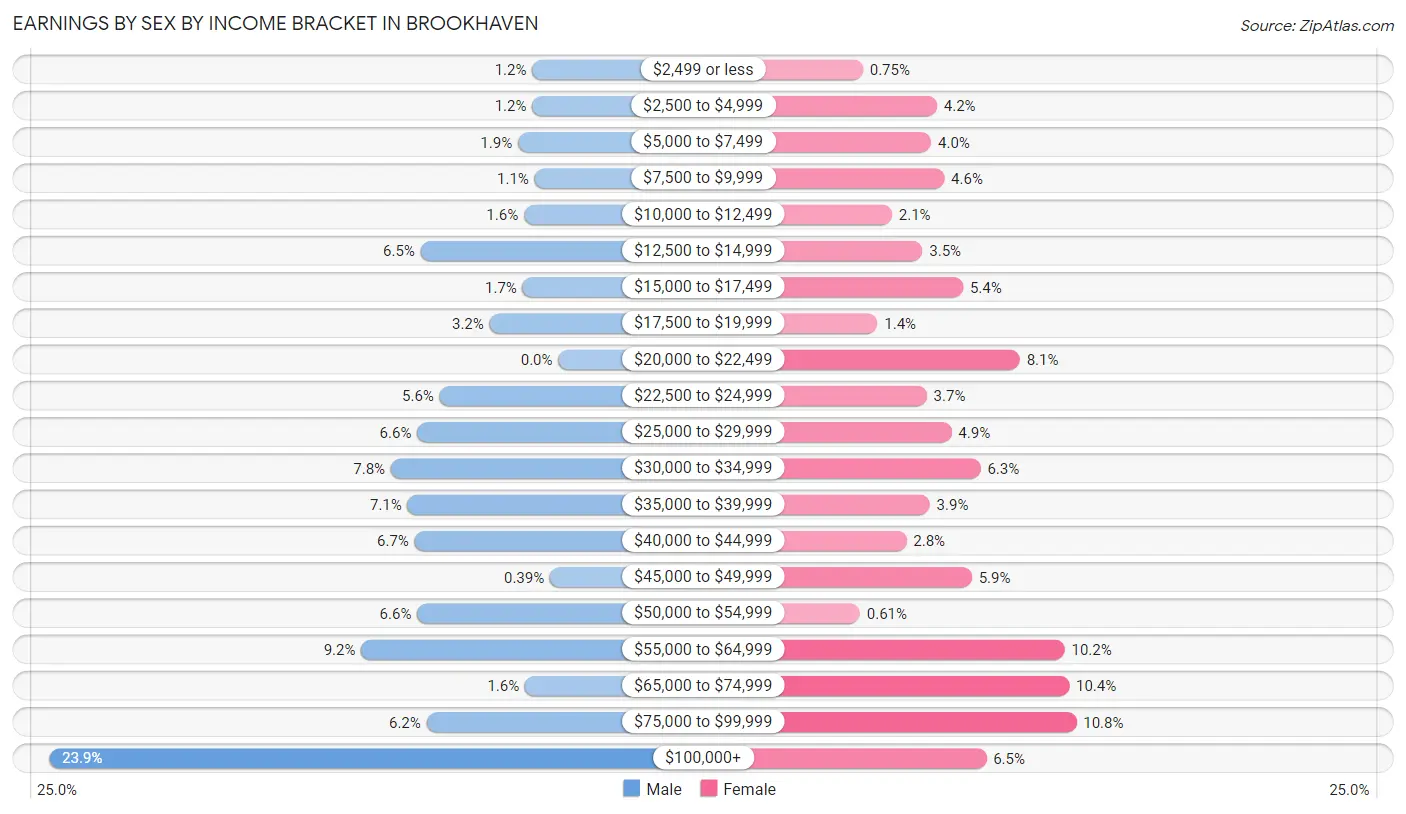
Earnings by Sex by Income Bracket in Brookhaven
The most common earnings brackets in Brookhaven are $100,000+ for men (429 | 23.8%) and $75,000 to $99,999 for women (158 | 10.7%).
| Income | Male | Female |
| $2,499 or less | 22 (1.2%) | 11 (0.7%) |
| $2,500 to $4,999 | 22 (1.2%) | 62 (4.2%) |
| $5,000 to $7,499 | 34 (1.9%) | 58 (4.0%) |
| $7,500 to $9,999 | 20 (1.1%) | 67 (4.6%) |
| $10,000 to $12,499 | 29 (1.6%) | 31 (2.1%) |
| $12,500 to $14,999 | 116 (6.5%) | 52 (3.5%) |
| $15,000 to $17,499 | 30 (1.7%) | 80 (5.4%) |
| $17,500 to $19,999 | 58 (3.2%) | 21 (1.4%) |
| $20,000 to $22,499 | 0 (0.0%) | 119 (8.1%) |
| $22,500 to $24,999 | 100 (5.6%) | 55 (3.7%) |
| $25,000 to $29,999 | 119 (6.6%) | 72 (4.9%) |
| $30,000 to $34,999 | 141 (7.8%) | 92 (6.3%) |
| $35,000 to $39,999 | 127 (7.1%) | 57 (3.9%) |
| $40,000 to $44,999 | 121 (6.7%) | 41 (2.8%) |
| $45,000 to $49,999 | 7 (0.4%) | 86 (5.9%) |
| $50,000 to $54,999 | 119 (6.6%) | 9 (0.6%) |
| $55,000 to $64,999 | 166 (9.2%) | 150 (10.2%) |
| $65,000 to $74,999 | 28 (1.6%) | 153 (10.4%) |
| $75,000 to $99,999 | 111 (6.2%) | 158 (10.7%) |
| $100,000+ | 429 (23.8%) | 96 (6.5%) |
| Total | 1,799 (100.0%) | 1,470 (100.0%) |
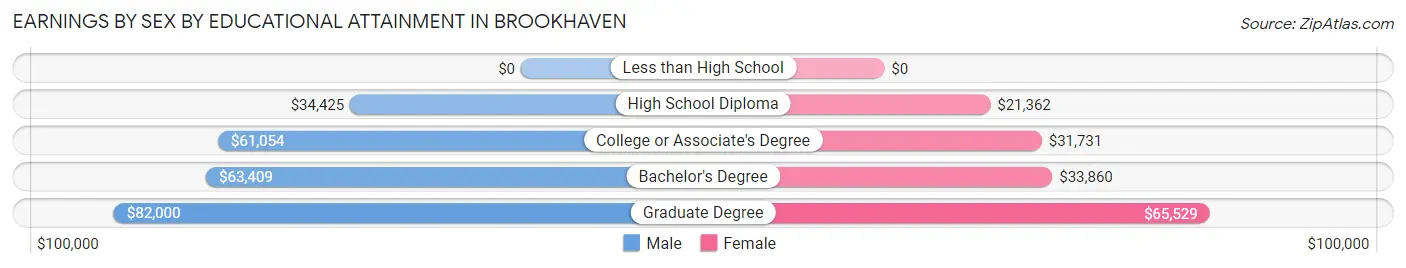
Earnings by Sex by Educational Attainment in Brookhaven
Average earnings in Brookhaven are $51,273 for men and $38,355 for women, a difference of 25.2%. Men with an educational attainment of graduate degree enjoy the highest average annual earnings of $82,000, while those with high school diploma education earn the least with $34,425. Women with an educational attainment of graduate degree earn the most with the average annual earnings of $65,529, while those with high school diploma education have the smallest earnings of $21,362.
| Educational Attainment | Male Income | Female Income |
| Less than High School | - | - |
| High School Diploma | $34,425 | $21,362 |
| College or Associate's Degree | $61,054 | $31,731 |
| Bachelor's Degree | $63,409 | $33,860 |
| Graduate Degree | $82,000 | $65,529 |
| Total | $51,273 | $38,355 |
Family Income in Brookhaven
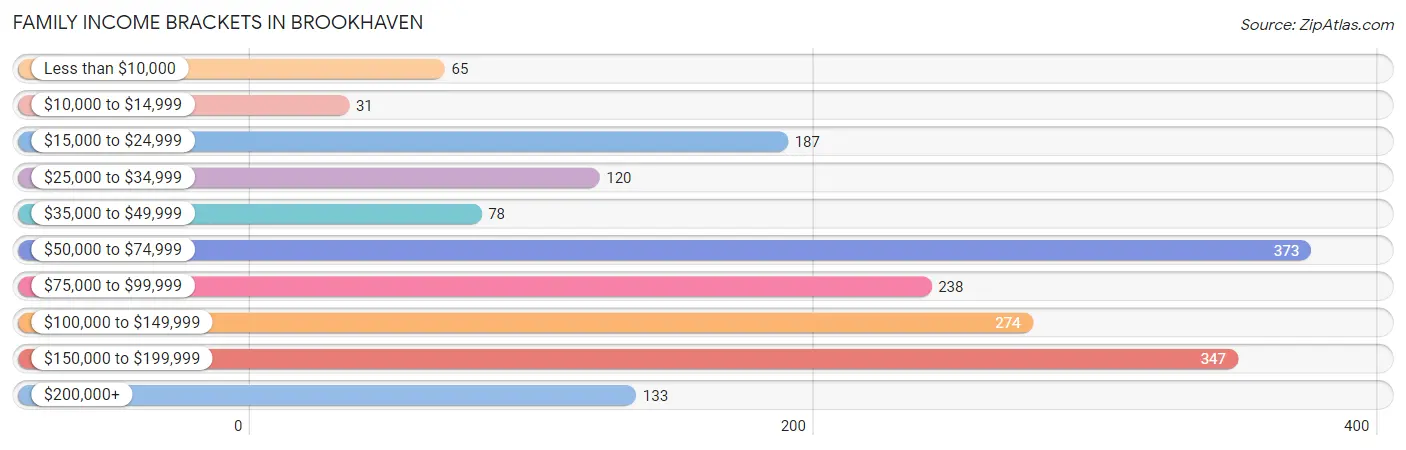
Family Income Brackets in Brookhaven
According to the Brookhaven family income data, there are 373 families falling into the $50,000 to $74,999 income range, which is the most common income bracket and makes up 20.2% of all families. Conversely, the $10,000 to $14,999 income bracket is the least frequent group with only 31 families (1.7%) belonging to this category.
| Income Bracket | # Families | % Families |
| Less than $10,000 | 65 | 3.5% |
| $10,000 to $14,999 | 31 | 1.7% |
| $15,000 to $24,999 | 187 | 10.1% |
| $25,000 to $34,999 | 120 | 6.5% |
| $35,000 to $49,999 | 78 | 4.2% |
| $50,000 to $74,999 | 373 | 20.2% |
| $75,000 to $99,999 | 238 | 12.9% |
| $100,000 to $149,999 | 274 | 14.8% |
| $150,000 to $199,999 | 347 | 18.8% |
| $200,000+ | 133 | 7.2% |
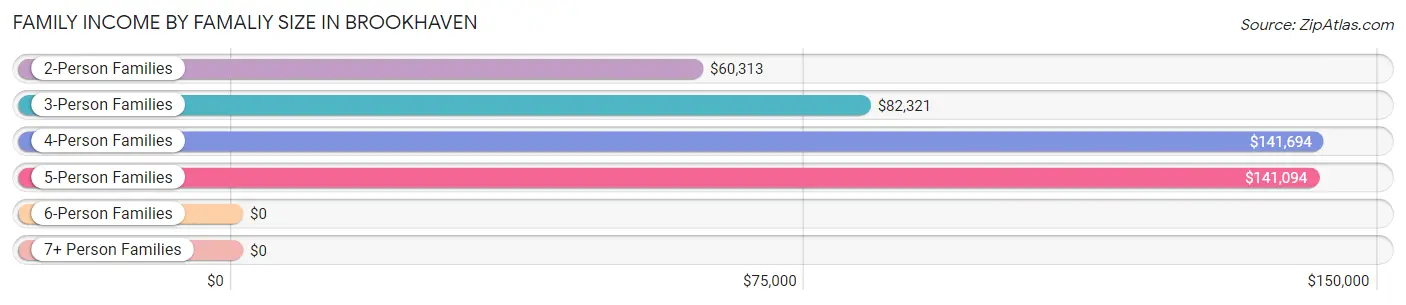
Family Income by Famaliy Size in Brookhaven
4-person families (375 | 20.3%) account for the highest median family income in Brookhaven with $141,694 per family, while 4-person families (375 | 20.3%) have the highest median income of $35,424 per family member.
| Income Bracket | # Families | Median Income |
| 2-Person Families | 799 (43.2%) | $60,313 |
| 3-Person Families | 535 (28.9%) | $82,321 |
| 4-Person Families | 375 (20.3%) | $141,694 |
| 5-Person Families | 112 (6.1%) | $141,094 |
| 6-Person Families | 16 (0.9%) | $0 |
| 7+ Person Families | 11 (0.6%) | $0 |
| Total | 1,848 (100.0%) | $83,300 |
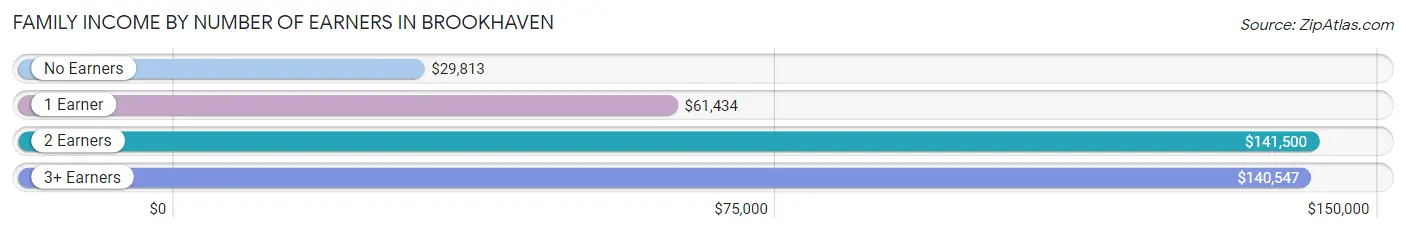
Family Income by Number of Earners in Brookhaven
The median family income in Brookhaven is $83,300, with families comprising 2 earners (710) having the highest median family income of $141,500, while families with no earners (284) have the lowest median family income of $29,813, accounting for 38.4% and 15.4% of families, respectively.
| Number of Earners | # Families | Median Income |
| No Earners | 284 (15.4%) | $29,813 |
| 1 Earner | 674 (36.5%) | $61,434 |
| 2 Earners | 710 (38.4%) | $141,500 |
| 3+ Earners | 180 (9.7%) | $140,547 |
| Total | 1,848 (100.0%) | $83,300 |
Household Income in Brookhaven
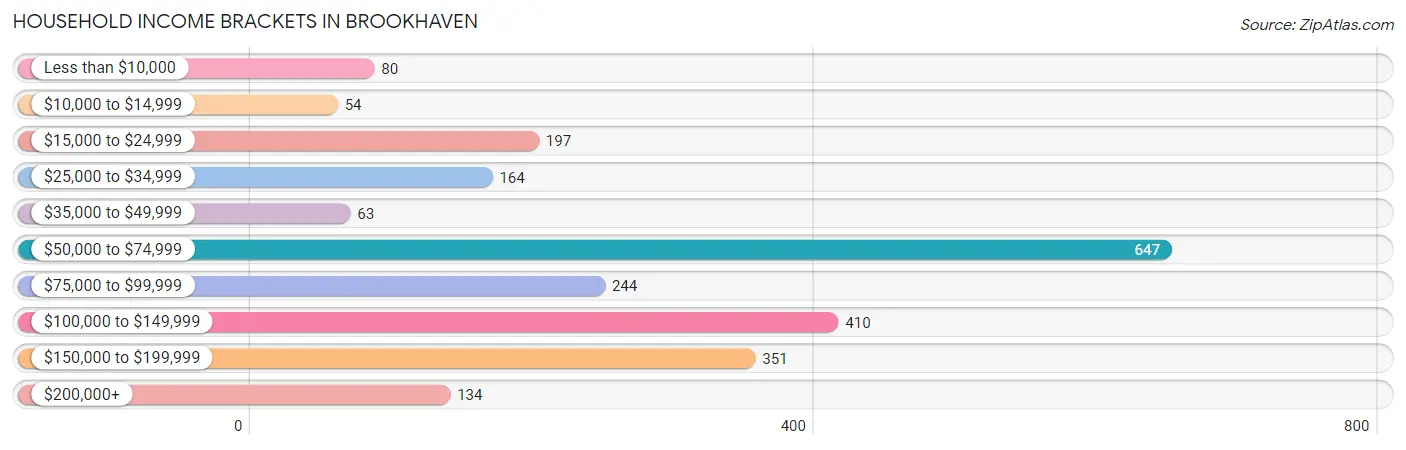
Household Income Brackets in Brookhaven
With 647 households falling in the category, the $50,000 to $74,999 income range is the most frequent in Brookhaven, accounting for 27.6% of all households. In contrast, only 54 households (2.3%) fall into the $10,000 to $14,999 income bracket, making it the least populous group.
| Income Bracket | # Households | % Households |
| Less than $10,000 | 80 | 3.4% |
| $10,000 to $14,999 | 54 | 2.3% |
| $15,000 to $24,999 | 197 | 8.4% |
| $25,000 to $34,999 | 164 | 7.0% |
| $35,000 to $49,999 | 63 | 2.7% |
| $50,000 to $74,999 | 647 | 27.6% |
| $75,000 to $99,999 | 244 | 10.4% |
| $100,000 to $149,999 | 410 | 17.5% |
| $150,000 to $199,999 | 351 | 15.0% |
| $200,000+ | 134 | 5.7% |
Household Income by Householder Age in Brookhaven
The median household income in Brookhaven is $70,179, with the highest median household income of $130,417 found in the 25 to 44 years age bracket for the primary householder. A total of 870 households (37.1%) fall into this category. Meanwhile, the 65+ years age bracket for the primary householder has the lowest median household income of $46,823, with 557 households (23.8%) in this group.
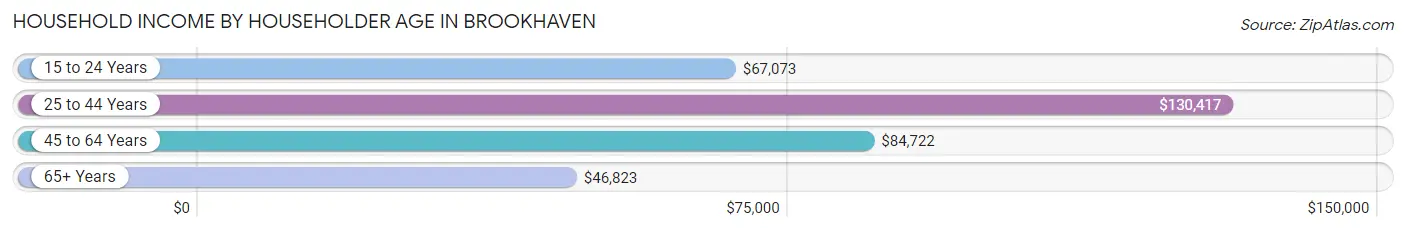
| Income Bracket | # Households | Median Income |
| 15 to 24 Years | 84 (3.6%) | $67,073 |
| 25 to 44 Years | 870 (37.1%) | $130,417 |
| 45 to 64 Years | 832 (35.5%) | $84,722 |
| 65+ Years | 557 (23.8%) | $46,823 |
| Total | 2,343 (100.0%) | $70,179 |
Poverty in Brookhaven
Income Below Poverty by Sex and Age in Brookhaven
With 5.7% poverty level for males and 15.1% for females among the residents of Brookhaven, 15 year old males and 18 to 24 year old females are the most vulnerable to poverty, with 28 males (54.9%) and 73 females (40.8%) in their respective age groups living below the poverty level.
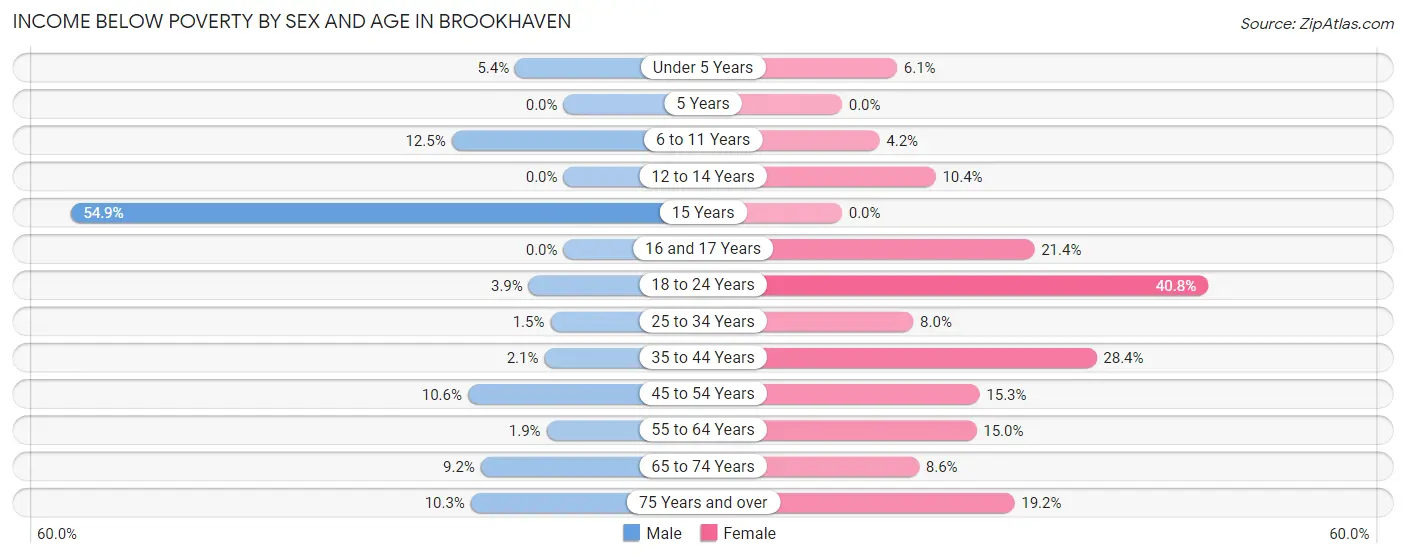
| Age Bracket | Male | Female |
| Under 5 Years | 12 (5.4%) | 26 (6.1%) |
| 5 Years | 0 (0.0%) | 0 (0.0%) |
| 6 to 11 Years | 44 (12.5%) | 10 (4.2%) |
| 12 to 14 Years | 0 (0.0%) | 12 (10.4%) |
| 15 Years | 28 (54.9%) | 0 (0.0%) |
| 16 and 17 Years | 0 (0.0%) | 21 (21.4%) |
| 18 to 24 Years | 12 (3.9%) | 73 (40.8%) |
| 25 to 34 Years | 6 (1.5%) | 35 (8.0%) |
| 35 to 44 Years | 13 (2.1%) | 146 (28.3%) |
| 45 to 54 Years | 25 (10.6%) | 38 (15.3%) |
| 55 to 64 Years | 10 (1.9%) | 71 (15.0%) |
| 65 to 74 Years | 22 (9.2%) | 26 (8.6%) |
| 75 Years and over | 13 (10.3%) | 34 (19.2%) |
| Total | 185 (5.7%) | 492 (15.1%) |
Income Above Poverty by Sex and Age in Brookhaven
According to the poverty statistics in Brookhaven, males aged 5 years and females aged 5 years are the age groups that are most secure financially, with 100.0% of males and 100.0% of females in these age groups living above the poverty line.
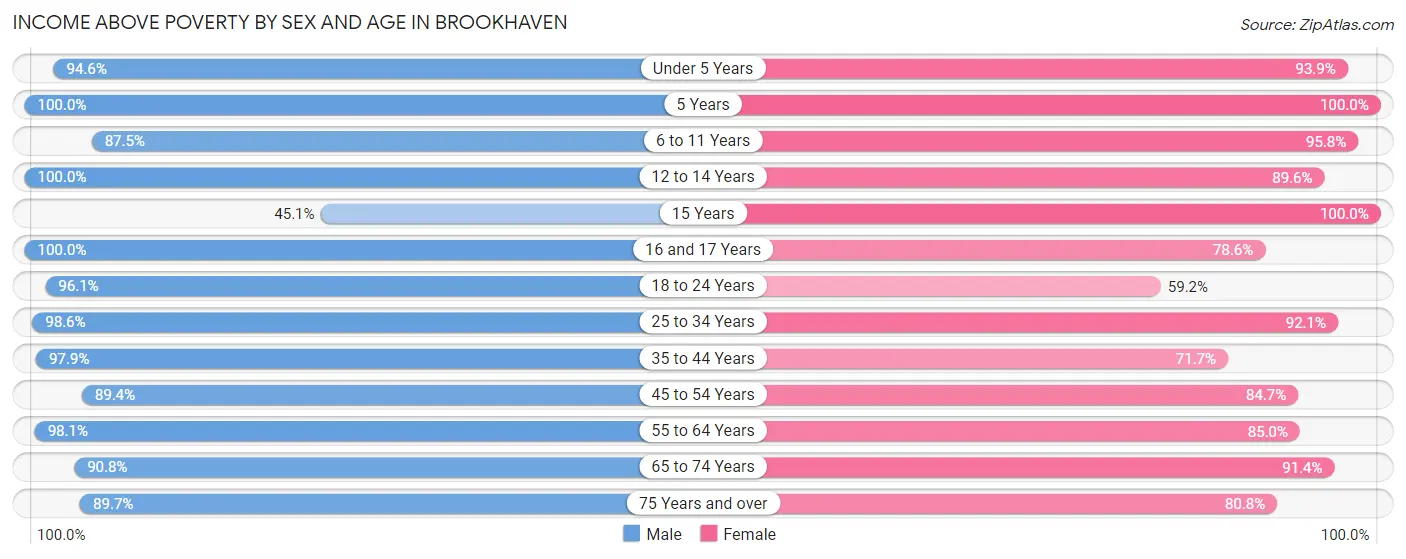
| Age Bracket | Male | Female |
| Under 5 Years | 211 (94.6%) | 398 (93.9%) |
| 5 Years | 2 (100.0%) | 26 (100.0%) |
| 6 to 11 Years | 309 (87.5%) | 229 (95.8%) |
| 12 to 14 Years | 60 (100.0%) | 103 (89.6%) |
| 15 Years | 23 (45.1%) | 10 (100.0%) |
| 16 and 17 Years | 65 (100.0%) | 77 (78.6%) |
| 18 to 24 Years | 298 (96.1%) | 106 (59.2%) |
| 25 to 34 Years | 407 (98.6%) | 405 (92.0%) |
| 35 to 44 Years | 600 (97.9%) | 369 (71.7%) |
| 45 to 54 Years | 210 (89.4%) | 210 (84.7%) |
| 55 to 64 Years | 523 (98.1%) | 403 (85.0%) |
| 65 to 74 Years | 217 (90.8%) | 277 (91.4%) |
| 75 Years and over | 113 (89.7%) | 143 (80.8%) |
| Total | 3,038 (94.3%) | 2,756 (84.9%) |
Income Below Poverty Among Married-Couple Families in Brookhaven
The poverty statistics for married-couple families in Brookhaven show that 1.4% or 18 of the total 1,313 families live below the poverty line. Families with 3 or 4 children have the highest poverty rate of 15.3%, comprising of 13 families. On the other hand, families with 1 or 2 children have the lowest poverty rate of 0.0%, which includes 0 families.
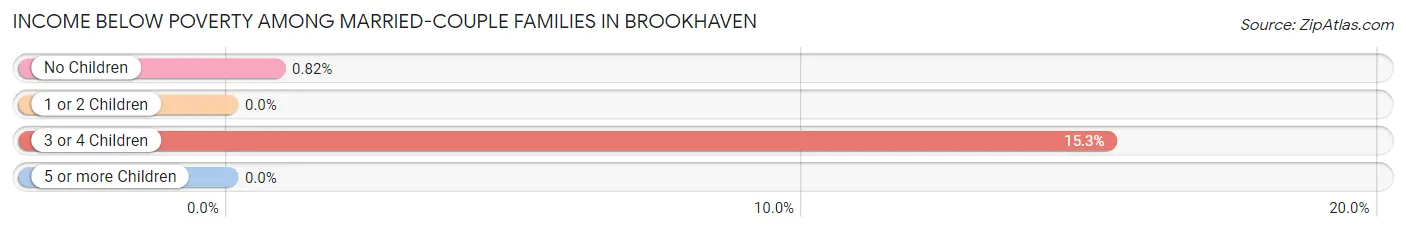
| Children | Above Poverty | Below Poverty |
| No Children | 602 (99.2%) | 5 (0.8%) |
| 1 or 2 Children | 621 (100.0%) | 0 (0.0%) |
| 3 or 4 Children | 72 (84.7%) | 13 (15.3%) |
| 5 or more Children | 0 (0.0%) | 0 (0.0%) |
| Total | 1,295 (98.6%) | 18 (1.4%) |
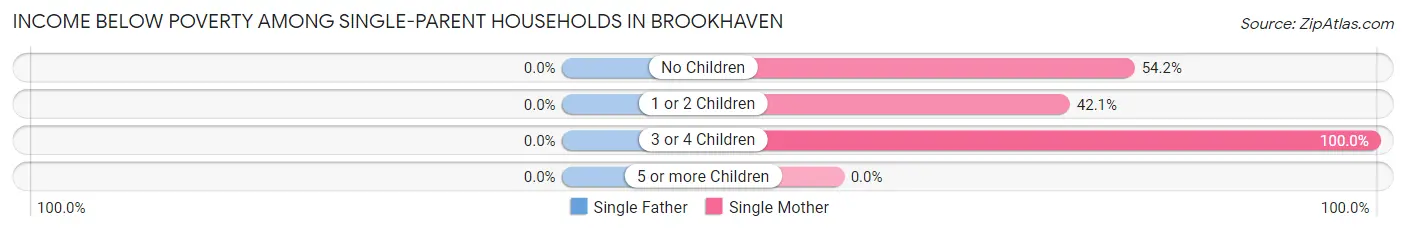
Income Below Poverty Among Single-Parent Households in Brookhaven
| Children | Single Father | Single Mother |
| No Children | 0 (0.0%) | 58 (54.2%) |
| 1 or 2 Children | 0 (0.0%) | 99 (42.1%) |
| 3 or 4 Children | 0 (0.0%) | 9 (100.0%) |
| 5 or more Children | 0 (0.0%) | 0 (0.0%) |
| Total | 0 (0.0%) | 166 (47.3%) |
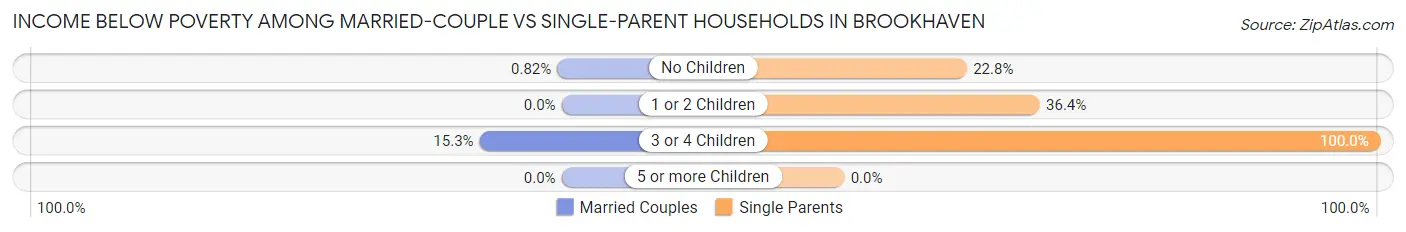
Income Below Poverty Among Married-Couple vs Single-Parent Households in Brookhaven
The poverty data for Brookhaven shows that 18 of the married-couple family households (1.4%) and 166 of the single-parent households (31.0%) are living below the poverty level. Within the married-couple family households, those with 3 or 4 children have the highest poverty rate, with 13 households (15.3%) falling below the poverty line. Among the single-parent households, those with 3 or 4 children have the highest poverty rate, with 9 household (100.0%) living below poverty.
| Children | Married-Couple Families | Single-Parent Households |
| No Children | 5 (0.8%) | 58 (22.8%) |
| 1 or 2 Children | 0 (0.0%) | 99 (36.4%) |
| 3 or 4 Children | 13 (15.3%) | 9 (100.0%) |
| 5 or more Children | 0 (0.0%) | 0 (0.0%) |
| Total | 18 (1.4%) | 166 (31.0%) |
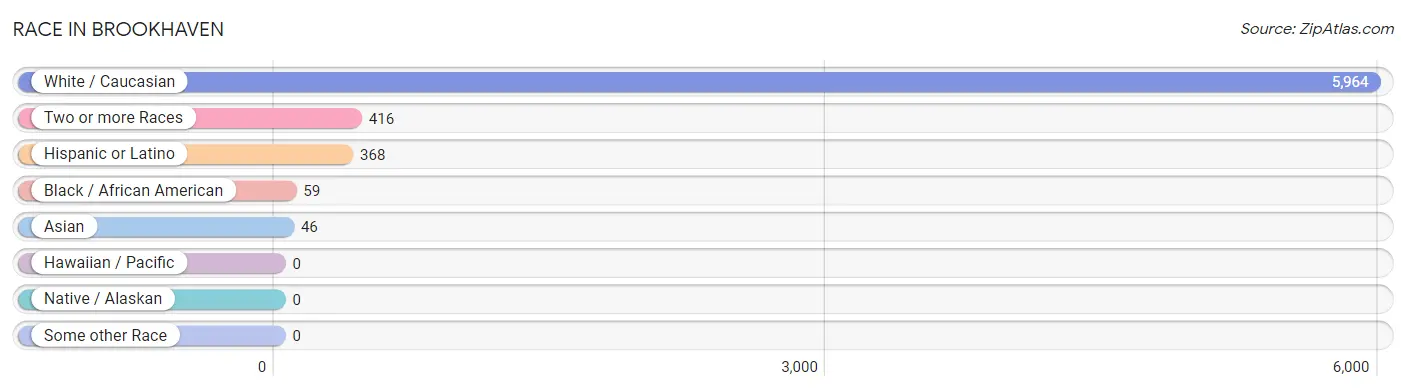
Race in Brookhaven
The most populous races in Brookhaven are White / Caucasian (5,964 | 92.0%), Two or more Races (416 | 6.4%), and Hispanic or Latino (368 | 5.7%).
| Race | # Population | % Population |
| Asian | 46 | 0.7% |
| Black / African American | 59 | 0.9% |
| Hawaiian / Pacific | 0 | 0.0% |
| Hispanic or Latino | 368 | 5.7% |
| Native / Alaskan | 0 | 0.0% |
| White / Caucasian | 5,964 | 92.0% |
| Two or more Races | 416 | 6.4% |
| Some other Race | 0 | 0.0% |
| Total | 6,485 | 100.0% |
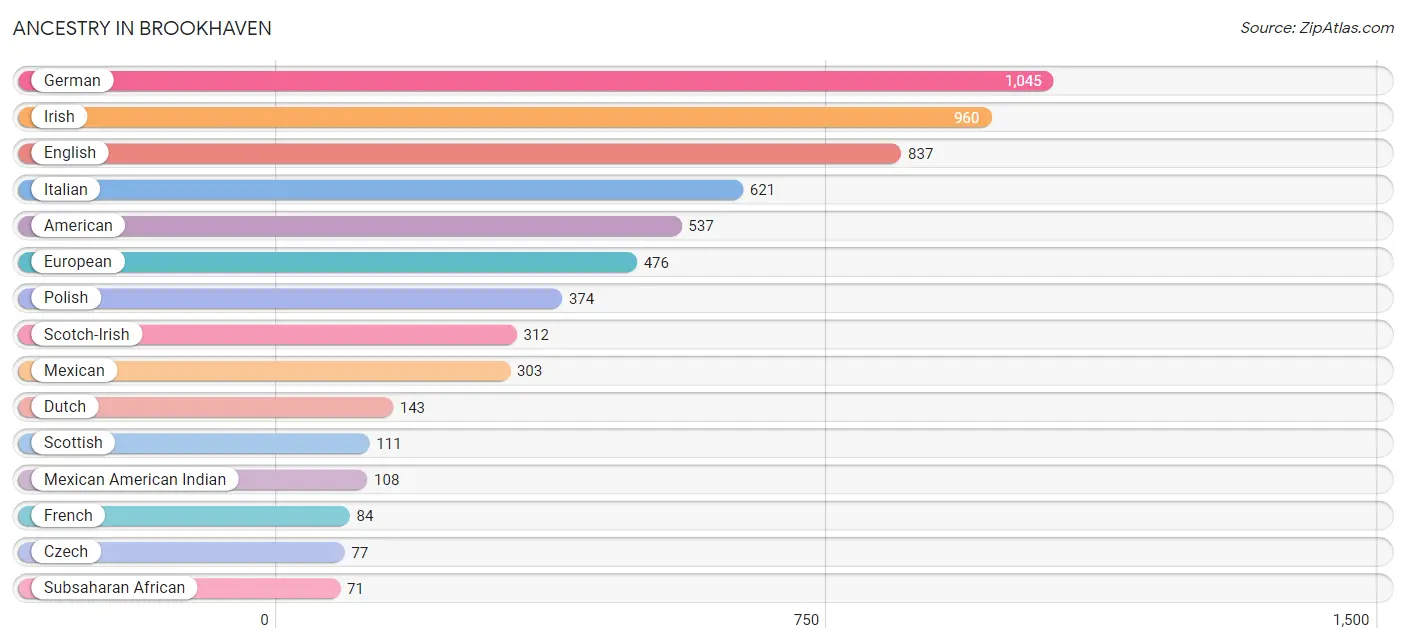
Ancestry in Brookhaven
The most populous ancestries reported in Brookhaven are German (1,045 | 16.1%), Irish (960 | 14.8%), English (837 | 12.9%), Italian (621 | 9.6%), and American (537 | 8.3%), together accounting for 61.7% of all Brookhaven residents.
| Ancestry | # Population | % Population |
| African | 41 | 0.6% |
| American | 537 | 8.3% |
| Bhutanese | 41 | 0.6% |
| British | 18 | 0.3% |
| Burmese | 16 | 0.3% |
| Central American | 41 | 0.6% |
| Choctaw | 4 | 0.1% |
| Croatian | 15 | 0.2% |
| Czech | 77 | 1.2% |
| Dutch | 143 | 2.2% |
| English | 837 | 12.9% |
| European | 476 | 7.3% |
| Finnish | 17 | 0.3% |
| French | 84 | 1.3% |
| French Canadian | 24 | 0.4% |
| German | 1,045 | 16.1% |
| Greek | 9 | 0.1% |
| Honduran | 41 | 0.6% |
| Hungarian | 32 | 0.5% |
| Indian (Asian) | 14 | 0.2% |
| Irish | 960 | 14.8% |
| Italian | 621 | 9.6% |
| Mexican | 303 | 4.7% |
| Mexican American Indian | 108 | 1.7% |
| Northern European | 31 | 0.5% |
| Pennsylvania German | 18 | 0.3% |
| Polish | 374 | 5.8% |
| Scandinavian | 5 | 0.1% |
| Scotch-Irish | 312 | 4.8% |
| Scottish | 111 | 1.7% |
| Slovak | 48 | 0.7% |
| Spanish | 24 | 0.4% |
| Subsaharan African | 71 | 1.1% |
| Welsh | 60 | 0.9% | View All 34 Rows |
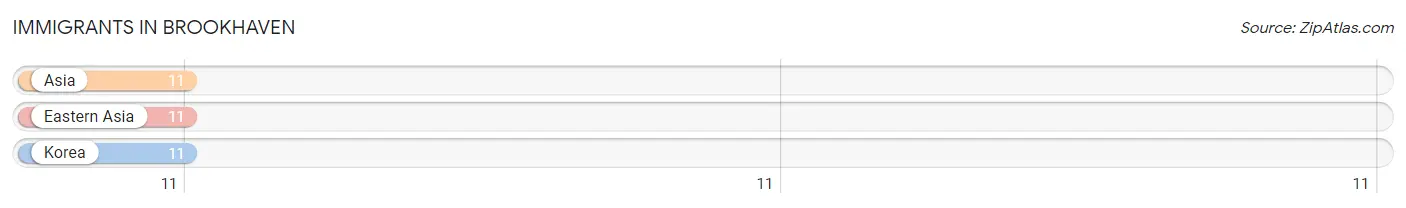
Immigrants in Brookhaven
The most numerous immigrant groups reported in Brookhaven came from Asia (11 | 0.2%), Eastern Asia (11 | 0.2%), and Korea (11 | 0.2%), together accounting for 0.5% of all Brookhaven residents.
| Immigration Origin | # Population | % Population |
| Asia | 11 | 0.2% |
| Eastern Asia | 11 | 0.2% |
| Korea | 11 | 0.2% | View All 3 Rows |
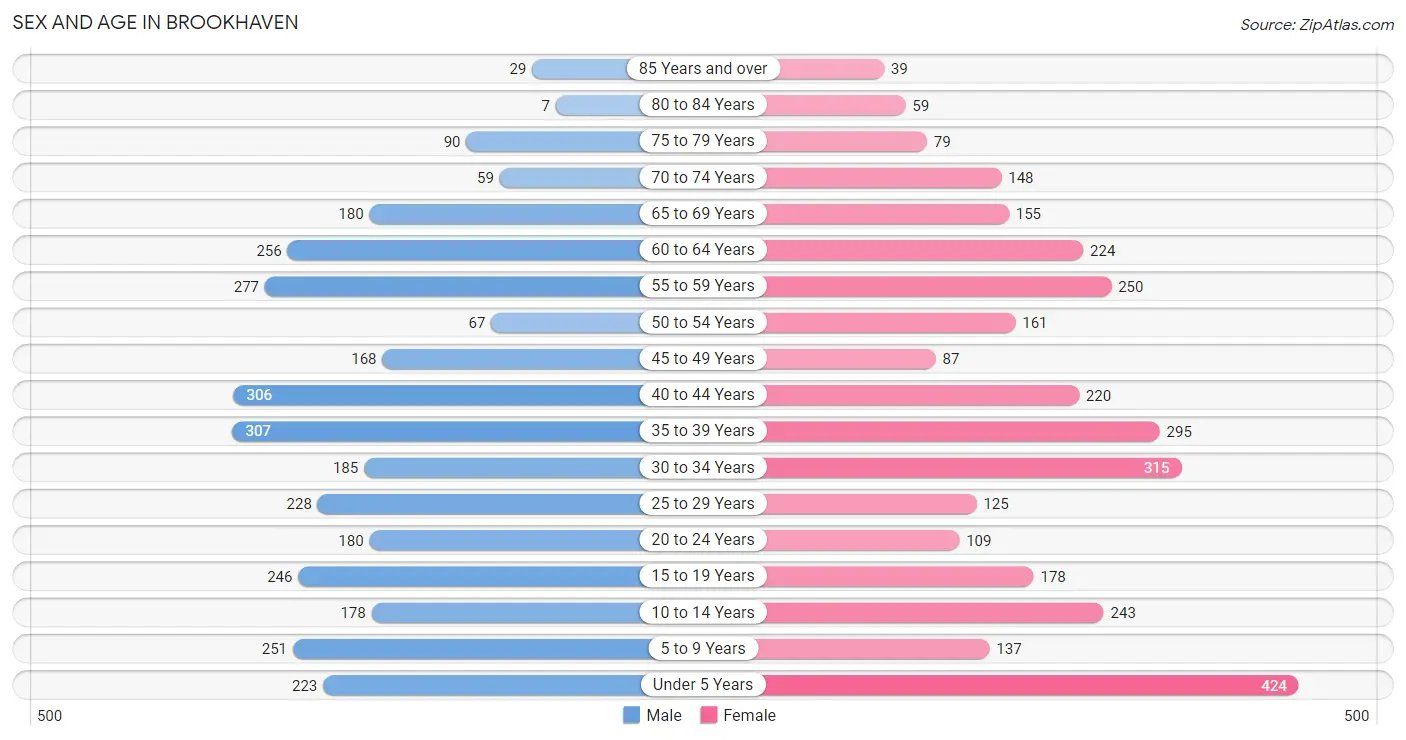
Sex and Age in Brookhaven
Sex and Age in Brookhaven
The most populous age groups in Brookhaven are 35 to 39 Years (307 | 9.5%) for men and Under 5 Years (424 | 13.1%) for women.
| Age Bracket | Male | Female |
| Under 5 Years | 223 (6.9%) | 424 (13.1%) |
| 5 to 9 Years | 251 (7.7%) | 137 (4.2%) |
| 10 to 14 Years | 178 (5.5%) | 243 (7.5%) |
| 15 to 19 Years | 246 (7.6%) | 178 (5.5%) |
| 20 to 24 Years | 180 (5.6%) | 109 (3.4%) |
| 25 to 29 Years | 228 (7.0%) | 125 (3.8%) |
| 30 to 34 Years | 185 (5.7%) | 315 (9.7%) |
| 35 to 39 Years | 307 (9.5%) | 295 (9.1%) |
| 40 to 44 Years | 306 (9.5%) | 220 (6.8%) |
| 45 to 49 Years | 168 (5.2%) | 87 (2.7%) |
| 50 to 54 Years | 67 (2.1%) | 161 (5.0%) |
| 55 to 59 Years | 277 (8.6%) | 250 (7.7%) |
| 60 to 64 Years | 256 (7.9%) | 224 (6.9%) |
| 65 to 69 Years | 180 (5.6%) | 155 (4.8%) |
| 70 to 74 Years | 59 (1.8%) | 148 (4.6%) |
| 75 to 79 Years | 90 (2.8%) | 79 (2.4%) |
| 80 to 84 Years | 7 (0.2%) | 59 (1.8%) |
| 85 Years and over | 29 (0.9%) | 39 (1.2%) |
| Total | 3,237 (100.0%) | 3,248 (100.0%) |
Families and Households in Brookhaven
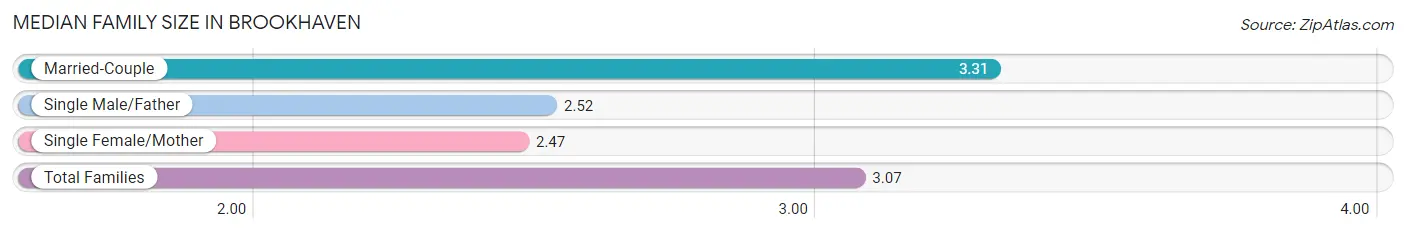
Median Family Size in Brookhaven
The median family size in Brookhaven is 3.07 persons per family, with married-couple families (1,313 | 71.1%) accounting for the largest median family size of 3.31 persons per family. On the other hand, single female/mother families (351 | 19.0%) represent the smallest median family size with 2.47 persons per family.
| Family Type | # Families | Family Size |
| Married-Couple | 1,313 (71.1%) | 3.31 |
| Single Male/Father | 184 (10.0%) | 2.52 |
| Single Female/Mother | 351 (19.0%) | 2.47 |
| Total Families | 1,848 (100.0%) | 3.07 |
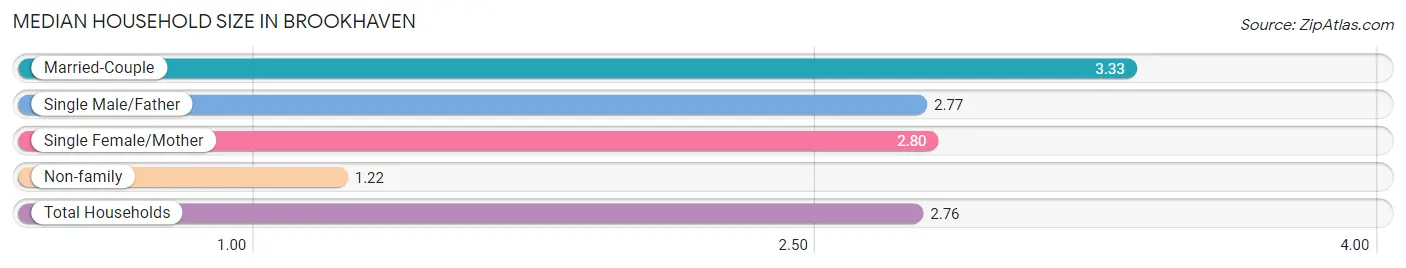
Median Household Size in Brookhaven
The median household size in Brookhaven is 2.76 persons per household, with married-couple households (1,313 | 56.0%) accounting for the largest median household size of 3.33 persons per household. non-family households (495 | 21.1%) represent the smallest median household size with 1.22 persons per household.
| Household Type | # Households | Household Size |
| Married-Couple | 1,313 (56.0%) | 3.33 |
| Single Male/Father | 184 (7.9%) | 2.77 |
| Single Female/Mother | 351 (15.0%) | 2.80 |
| Non-family | 495 (21.1%) | 1.22 |
| Total Households | 2,343 (100.0%) | 2.76 |
Household Size by Marriage Status in Brookhaven
Out of a total of 2,343 households in Brookhaven, 1,848 (78.9%) are family households, while 495 (21.1%) are nonfamily households. The most numerous type of family households are 2-person households, comprising 668, and the most common type of nonfamily households are 1-person households, comprising 394.
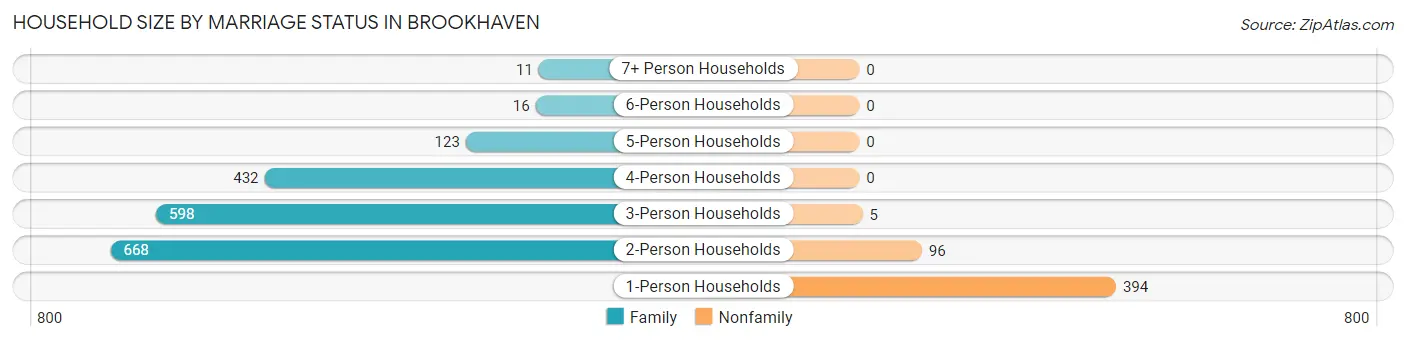
| Household Size | Family Households | Nonfamily Households |
| 1-Person Households | - | 394 (16.8%) |
| 2-Person Households | 668 (28.5%) | 96 (4.1%) |
| 3-Person Households | 598 (25.5%) | 5 (0.2%) |
| 4-Person Households | 432 (18.4%) | 0 (0.0%) |
| 5-Person Households | 123 (5.2%) | 0 (0.0%) |
| 6-Person Households | 16 (0.7%) | 0 (0.0%) |
| 7+ Person Households | 11 (0.5%) | 0 (0.0%) |
| Total | 1,848 (78.9%) | 495 (21.1%) |
Female Fertility in Brookhaven
Fertility by Age in Brookhaven
Average fertility rate in Brookhaven is 123.0 births per 1,000 women. Women in the age bracket of 20 to 34 years have the highest fertility rate with 266.0 births per 1,000 women. Women in the age bracket of 20 to 34 years acount for 85.4% of all women with births.
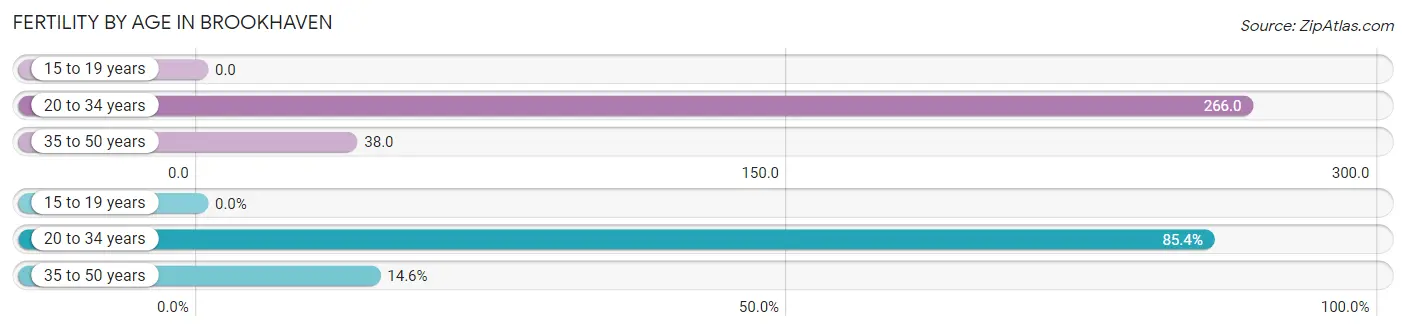
| Age Bracket | Women with Births | Births / 1,000 Women |
| 15 to 19 years | 0 (0.0%) | 0.0 |
| 20 to 34 years | 146 (85.4%) | 266.0 |
| 35 to 50 years | 25 (14.6%) | 38.0 |
| Total | 171 (100.0%) | 123.0 |
Fertility by Age by Marriage Status in Brookhaven
94.7% of women with births (171) in Brookhaven are married. The highest percentage of unmarried women with births falls into 35 to 50 years age bracket with 36.0% of them unmarried at the time of birth, while the lowest percentage of unmarried women with births belong to 20 to 34 years age bracket with 0.0% of them unmarried.
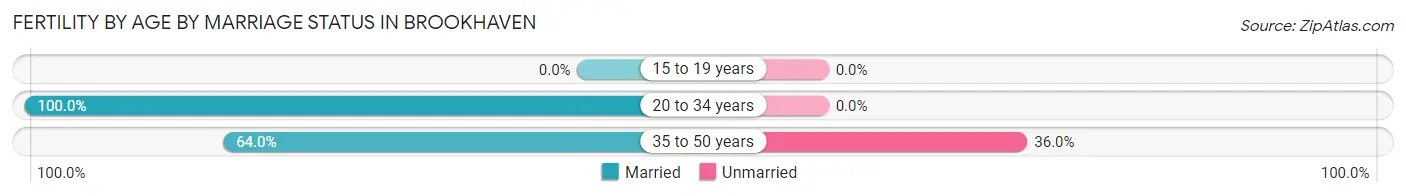
| Age Bracket | Married | Unmarried |
| 15 to 19 years | 0 (0.0%) | 0 (0.0%) |
| 20 to 34 years | 146 (100.0%) | 0 (0.0%) |
| 35 to 50 years | 16 (64.0%) | 9 (36.0%) |
| Total | 162 (94.7%) | 9 (5.3%) |
Fertility by Education in Brookhaven
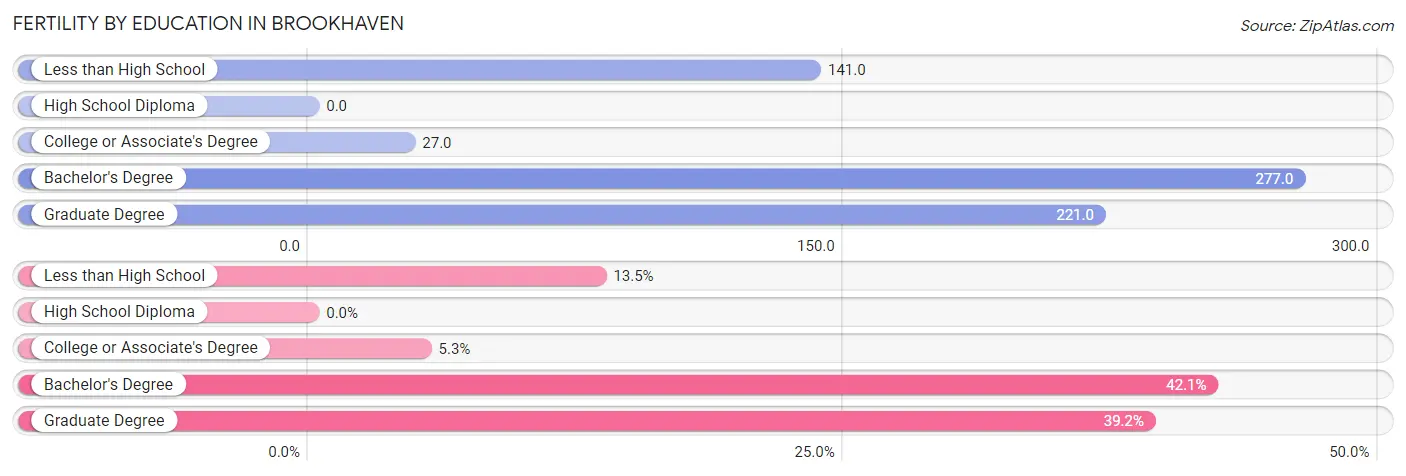
| Educational Attainment | Women with Births | Births / 1,000 Women |
| Less than High School | 23 (13.5%) | 141.0 |
| High School Diploma | 0 (0.0%) | 0.0 |
| College or Associate's Degree | 9 (5.3%) | 27.0 |
| Bachelor's Degree | 72 (42.1%) | 277.0 |
| Graduate Degree | 67 (39.2%) | 221.0 |
| Total | 171 (100.0%) | 123.0 |
Fertility by Education by Marriage Status in Brookhaven
5.3% of women with births in Brookhaven are unmarried. Women with the educational attainment of less than high school are most likely to be married with 100.0% of them married at childbirth, while women with the educational attainment of college or associate's degree are least likely to be married with 100.0% of them unmarried at childbirth.
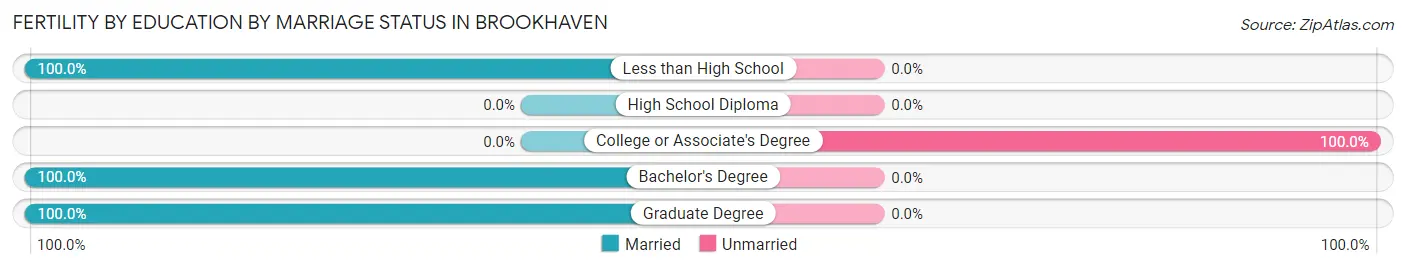
| Educational Attainment | Married | Unmarried |
| Less than High School | 23 (100.0%) | 0 (0.0%) |
| High School Diploma | 0 (0.0%) | 0 (0.0%) |
| College or Associate's Degree | 0 (0.0%) | 9 (100.0%) |
| Bachelor's Degree | 72 (100.0%) | 0 (0.0%) |
| Graduate Degree | 67 (100.0%) | 0 (0.0%) |
| Total | 162 (94.7%) | 9 (5.3%) |
Employment Characteristics in Brookhaven
Employment by Class of Employer in Brookhaven
Among the 2,924 employed individuals in Brookhaven, private company employees (1,576 | 53.9%), state government employees (447 | 15.3%), and not-for-profit organizations (332 | 11.4%) make up the most common classes of employment.
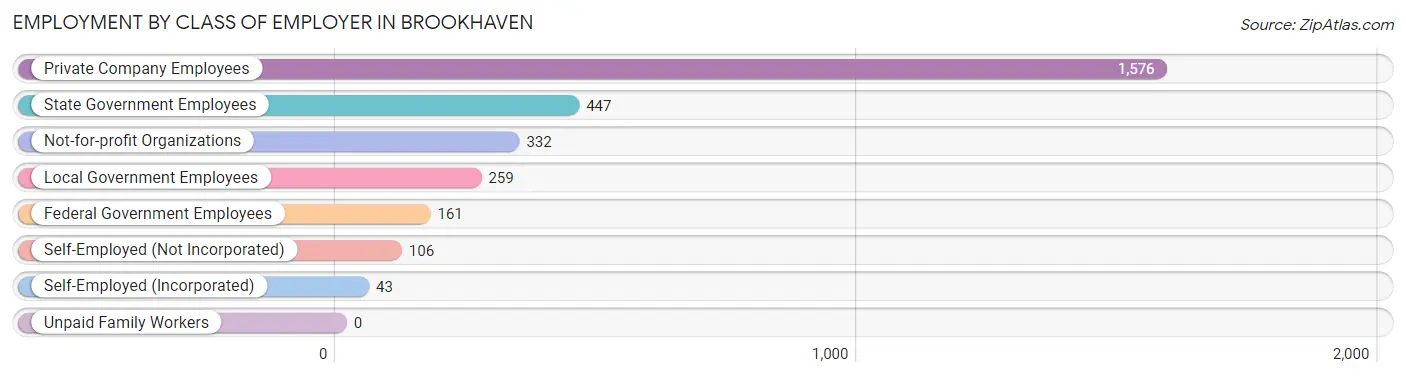
| Employer Class | # Employees | % Employees |
| Private Company Employees | 1,576 | 53.9% |
| Self-Employed (Incorporated) | 43 | 1.5% |
| Self-Employed (Not Incorporated) | 106 | 3.6% |
| Not-for-profit Organizations | 332 | 11.4% |
| Local Government Employees | 259 | 8.9% |
| State Government Employees | 447 | 15.3% |
| Federal Government Employees | 161 | 5.5% |
| Unpaid Family Workers | 0 | 0.0% |
| Total | 2,924 | 100.0% |
Employment Status by Age in Brookhaven
According to the labor force statistics for Brookhaven, out of the total population over 16 years of age (4,968), 65.2% or 3,239 individuals are in the labor force, with 7.8% or 253 of them unemployed. The age group with the highest labor force participation rate is 25 to 29 years, with 88.1% or 311 individuals in the labor force. Within the labor force, the 25 to 29 years age range has the highest percentage of unemployed individuals, with 24.1% or 75 of them being unemployed.
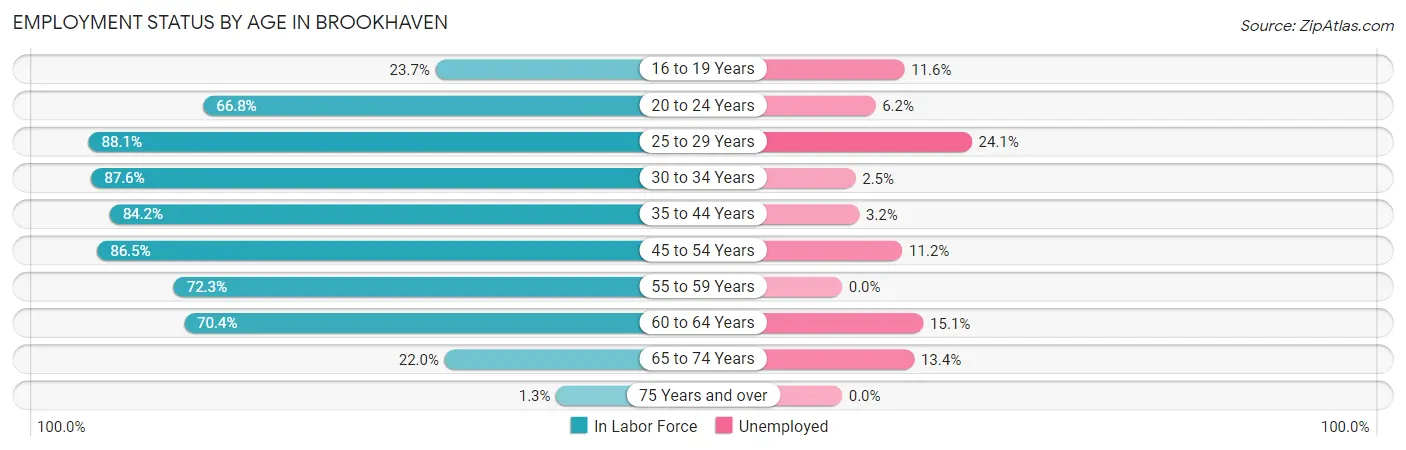
| Age Bracket | In Labor Force | Unemployed |
| 16 to 19 Years | 86 (23.7%) | 10 (11.6%) |
| 20 to 24 Years | 193 (66.8%) | 12 (6.2%) |
| 25 to 29 Years | 311 (88.1%) | 75 (24.1%) |
| 30 to 34 Years | 438 (87.6%) | 11 (2.5%) |
| 35 to 44 Years | 950 (84.2%) | 30 (3.2%) |
| 45 to 54 Years | 418 (86.5%) | 47 (11.2%) |
| 55 to 59 Years | 381 (72.3%) | 0 (0.0%) |
| 60 to 64 Years | 338 (70.4%) | 51 (15.1%) |
| 65 to 74 Years | 119 (22.0%) | 16 (13.4%) |
| 75 Years and over | 4 (1.3%) | 0 (0.0%) |
| Total | 3,239 (65.2%) | 253 (7.8%) |
Employment Status by Educational Attainment in Brookhaven
According to labor force statistics for Brookhaven, 81.7% of individuals (2,836) out of the total population between 25 and 64 years of age (3,471) are in the labor force, with 7.6% or 216 of them being unemployed. The group with the highest labor force participation rate are those with the educational attainment of bachelor's degree or higher, with 91.9% or 1,374 individuals in the labor force. Within the labor force, individuals with less than high school education have the highest percentage of unemployment, with 41.0% or 75 of them being unemployed.
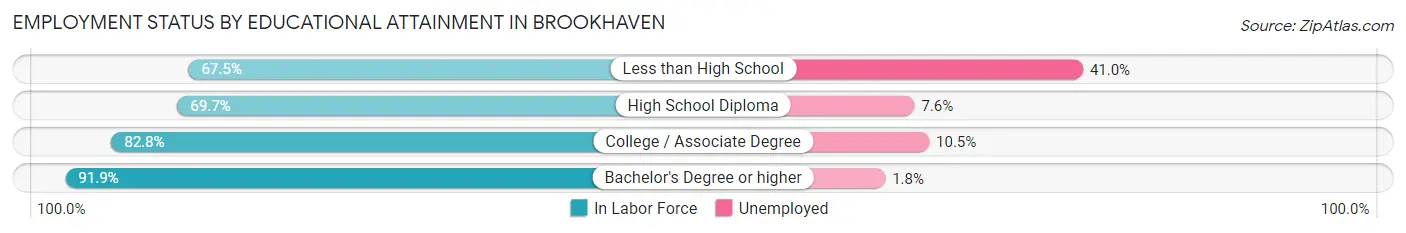
| Educational Attainment | In Labor Force | Unemployed |
| Less than High School | 183 (67.5%) | 111 (41.0%) |
| High School Diploma | 710 (69.7%) | 77 (7.6%) |
| College / Associate Degree | 569 (82.8%) | 72 (10.5%) |
| Bachelor's Degree or higher | 1,374 (91.9%) | 27 (1.8%) |
| Total | 2,836 (81.7%) | 264 (7.6%) |
Employment Occupations by Sex in Brookhaven
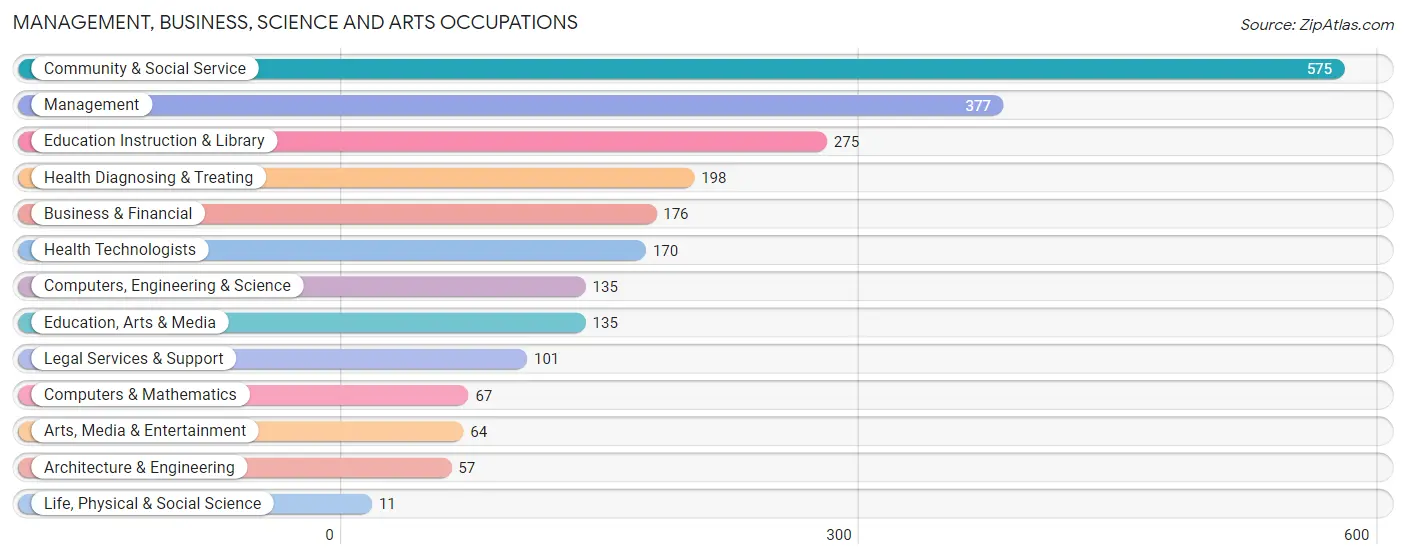
Management, Business, Science and Arts Occupations
The most common Management, Business, Science and Arts occupations in Brookhaven are Community & Social Service (575 | 19.3%), Management (377 | 12.7%), Education Instruction & Library (275 | 9.2%), Health Diagnosing & Treating (198 | 6.7%), and Business & Financial (176 | 5.9%).
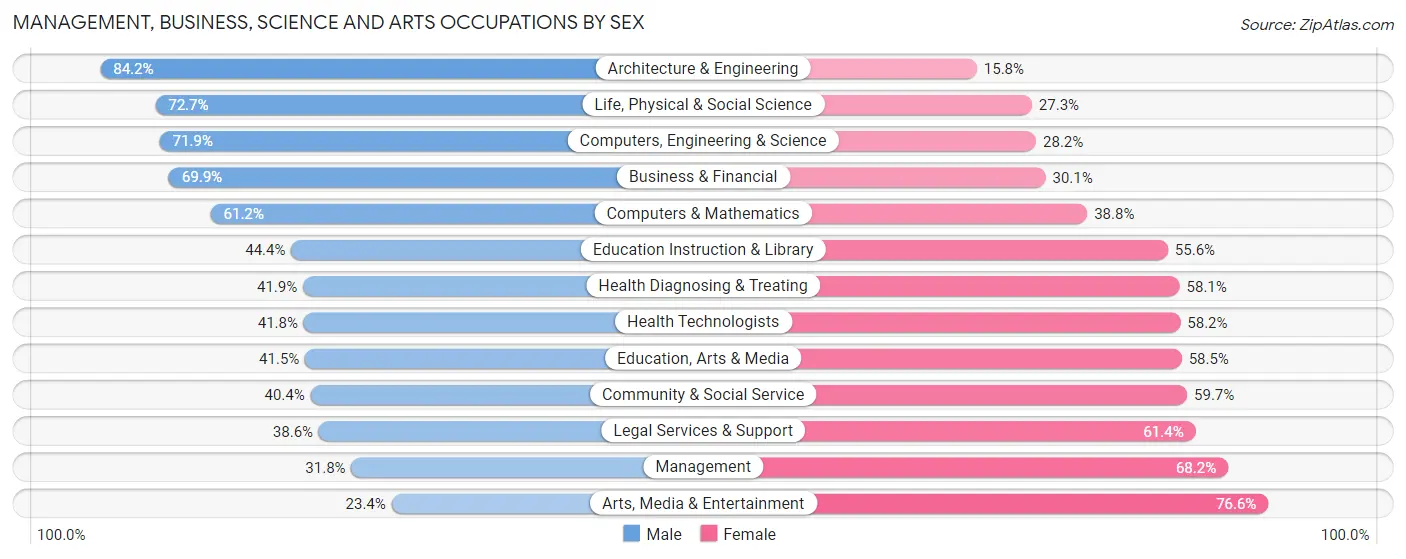
Management, Business, Science and Arts Occupations by Sex
Within the Management, Business, Science and Arts occupations in Brookhaven, the most male-oriented occupations are Architecture & Engineering (84.2%), Life, Physical & Social Science (72.7%), and Computers, Engineering & Science (71.9%), while the most female-oriented occupations are Arts, Media & Entertainment (76.6%), Management (68.2%), and Legal Services & Support (61.4%).
| Occupation | Male | Female |
| Management | 120 (31.8%) | 257 (68.2%) |
| Business & Financial | 123 (69.9%) | 53 (30.1%) |
| Computers, Engineering & Science | 97 (71.9%) | 38 (28.1%) |
| Computers & Mathematics | 41 (61.2%) | 26 (38.8%) |
| Architecture & Engineering | 48 (84.2%) | 9 (15.8%) |
| Life, Physical & Social Science | 8 (72.7%) | 3 (27.3%) |
| Community & Social Service | 232 (40.4%) | 343 (59.7%) |
| Education, Arts & Media | 56 (41.5%) | 79 (58.5%) |
| Legal Services & Support | 39 (38.6%) | 62 (61.4%) |
| Education Instruction & Library | 122 (44.4%) | 153 (55.6%) |
| Arts, Media & Entertainment | 15 (23.4%) | 49 (76.6%) |
| Health Diagnosing & Treating | 83 (41.9%) | 115 (58.1%) |
| Health Technologists | 71 (41.8%) | 99 (58.2%) |
| Total (Category) | 655 (44.8%) | 806 (55.2%) |
| Total (Overall) | 1,624 (54.6%) | 1,352 (45.4%) |
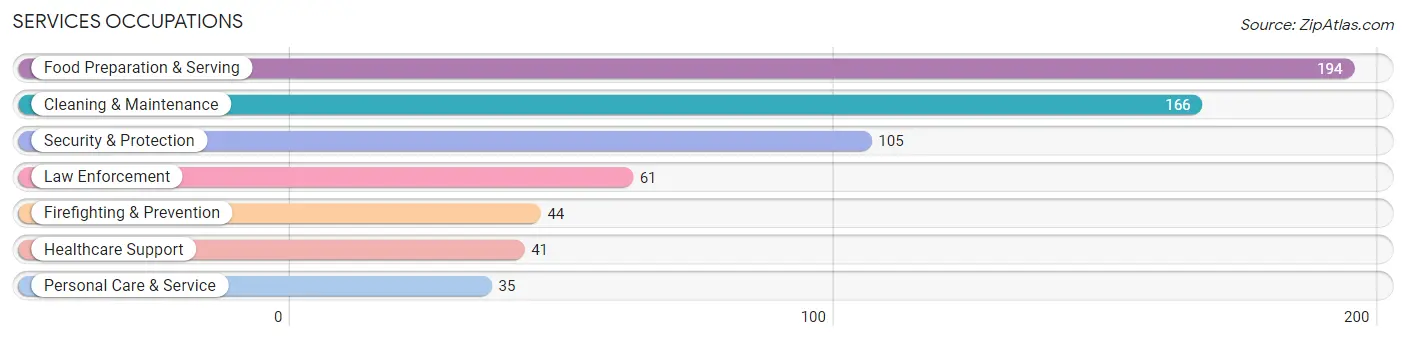
Services Occupations
The most common Services occupations in Brookhaven are Food Preparation & Serving (194 | 6.5%), Cleaning & Maintenance (166 | 5.6%), Security & Protection (105 | 3.5%), Law Enforcement (61 | 2.1%), and Firefighting & Prevention (44 | 1.5%).
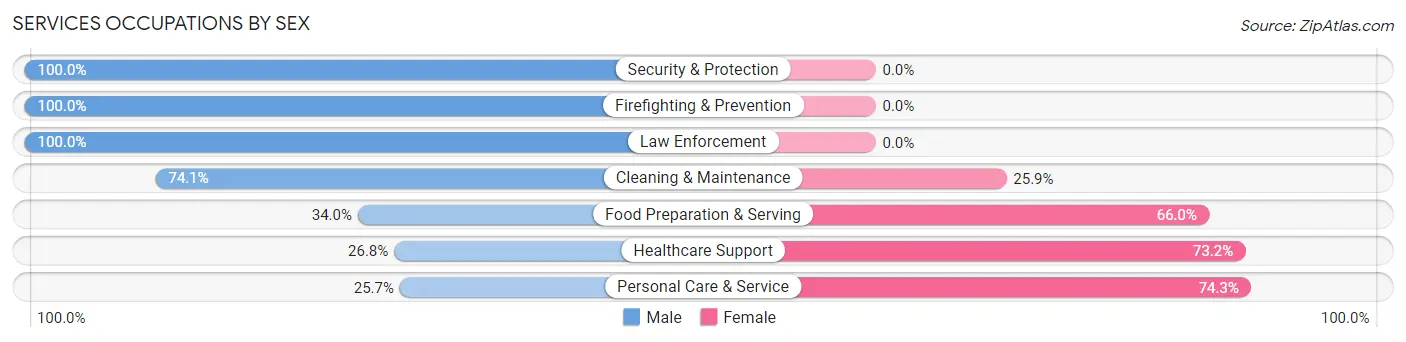
Services Occupations by Sex
Within the Services occupations in Brookhaven, the most male-oriented occupations are Security & Protection (100.0%), Firefighting & Prevention (100.0%), and Law Enforcement (100.0%), while the most female-oriented occupations are Personal Care & Service (74.3%), Healthcare Support (73.2%), and Food Preparation & Serving (66.0%).
| Occupation | Male | Female |
| Healthcare Support | 11 (26.8%) | 30 (73.2%) |
| Security & Protection | 105 (100.0%) | 0 (0.0%) |
| Firefighting & Prevention | 44 (100.0%) | 0 (0.0%) |
| Law Enforcement | 61 (100.0%) | 0 (0.0%) |
| Food Preparation & Serving | 66 (34.0%) | 128 (66.0%) |
| Cleaning & Maintenance | 123 (74.1%) | 43 (25.9%) |
| Personal Care & Service | 9 (25.7%) | 26 (74.3%) |
| Total (Category) | 314 (58.0%) | 227 (42.0%) |
| Total (Overall) | 1,624 (54.6%) | 1,352 (45.4%) |
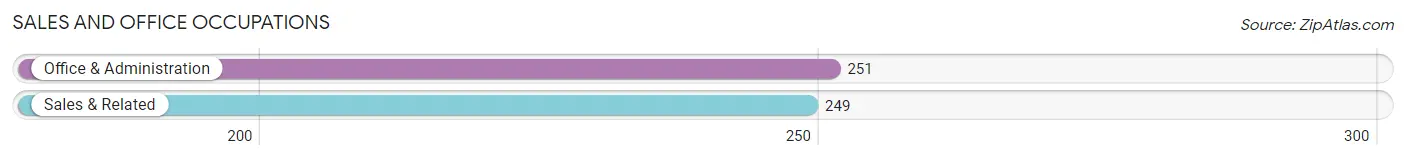
Sales and Office Occupations
The most common Sales and Office occupations in Brookhaven are Office & Administration (251 | 8.4%), and Sales & Related (249 | 8.4%).
Sales and Office Occupations by Sex
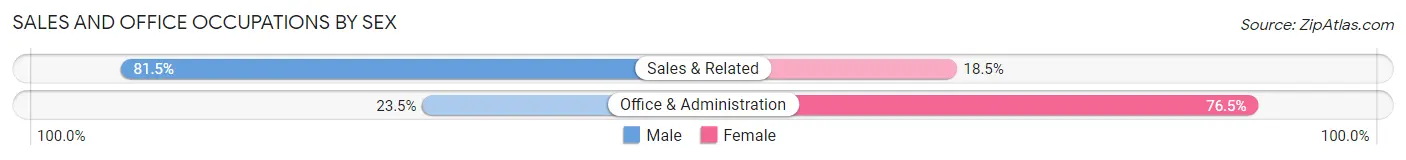
| Occupation | Male | Female |
| Sales & Related | 203 (81.5%) | 46 (18.5%) |
| Office & Administration | 59 (23.5%) | 192 (76.5%) |
| Total (Category) | 262 (52.4%) | 238 (47.6%) |
| Total (Overall) | 1,624 (54.6%) | 1,352 (45.4%) |
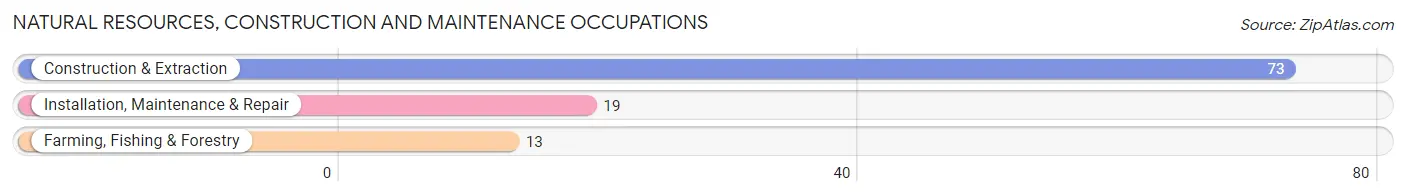
Natural Resources, Construction and Maintenance Occupations
The most common Natural Resources, Construction and Maintenance occupations in Brookhaven are Construction & Extraction (73 | 2.5%), Installation, Maintenance & Repair (19 | 0.6%), and Farming, Fishing & Forestry (13 | 0.4%).
Natural Resources, Construction and Maintenance Occupations by Sex
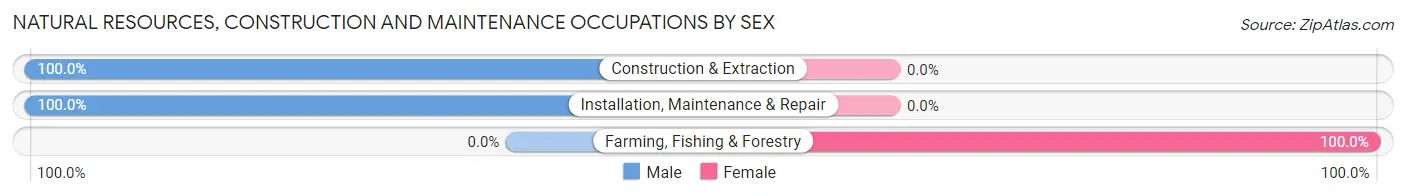
| Occupation | Male | Female |
| Farming, Fishing & Forestry | 0 (0.0%) | 13 (100.0%) |
| Construction & Extraction | 73 (100.0%) | 0 (0.0%) |
| Installation, Maintenance & Repair | 19 (100.0%) | 0 (0.0%) |
| Total (Category) | 92 (87.6%) | 13 (12.4%) |
| Total (Overall) | 1,624 (54.6%) | 1,352 (45.4%) |
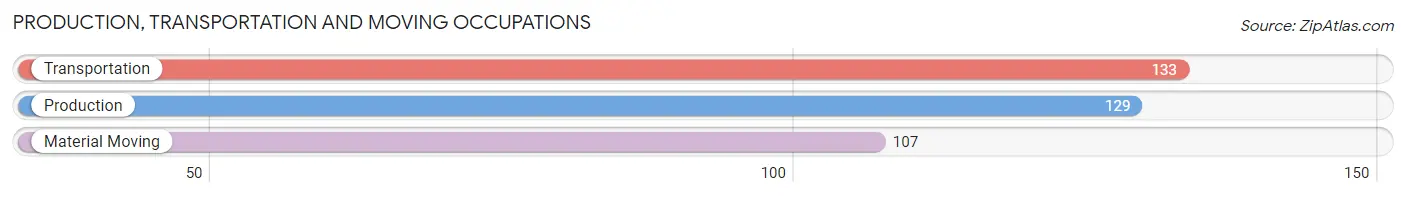
Production, Transportation and Moving Occupations
The most common Production, Transportation and Moving occupations in Brookhaven are Transportation (133 | 4.5%), Production (129 | 4.3%), and Material Moving (107 | 3.6%).
Production, Transportation and Moving Occupations by Sex
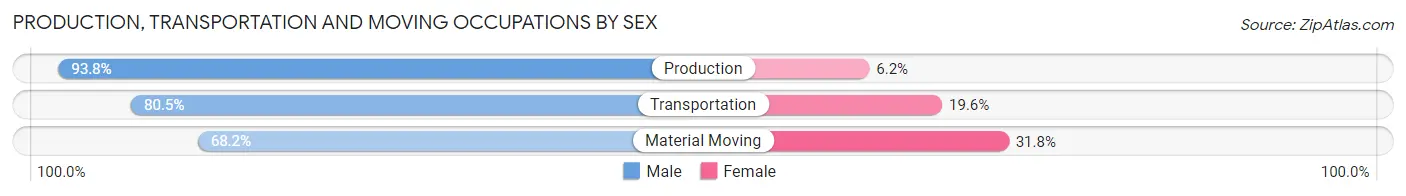
| Occupation | Male | Female |
| Production | 121 (93.8%) | 8 (6.2%) |
| Transportation | 107 (80.4%) | 26 (19.6%) |
| Material Moving | 73 (68.2%) | 34 (31.8%) |
| Total (Category) | 301 (81.6%) | 68 (18.4%) |
| Total (Overall) | 1,624 (54.6%) | 1,352 (45.4%) |
Employment Industries by Sex in Brookhaven
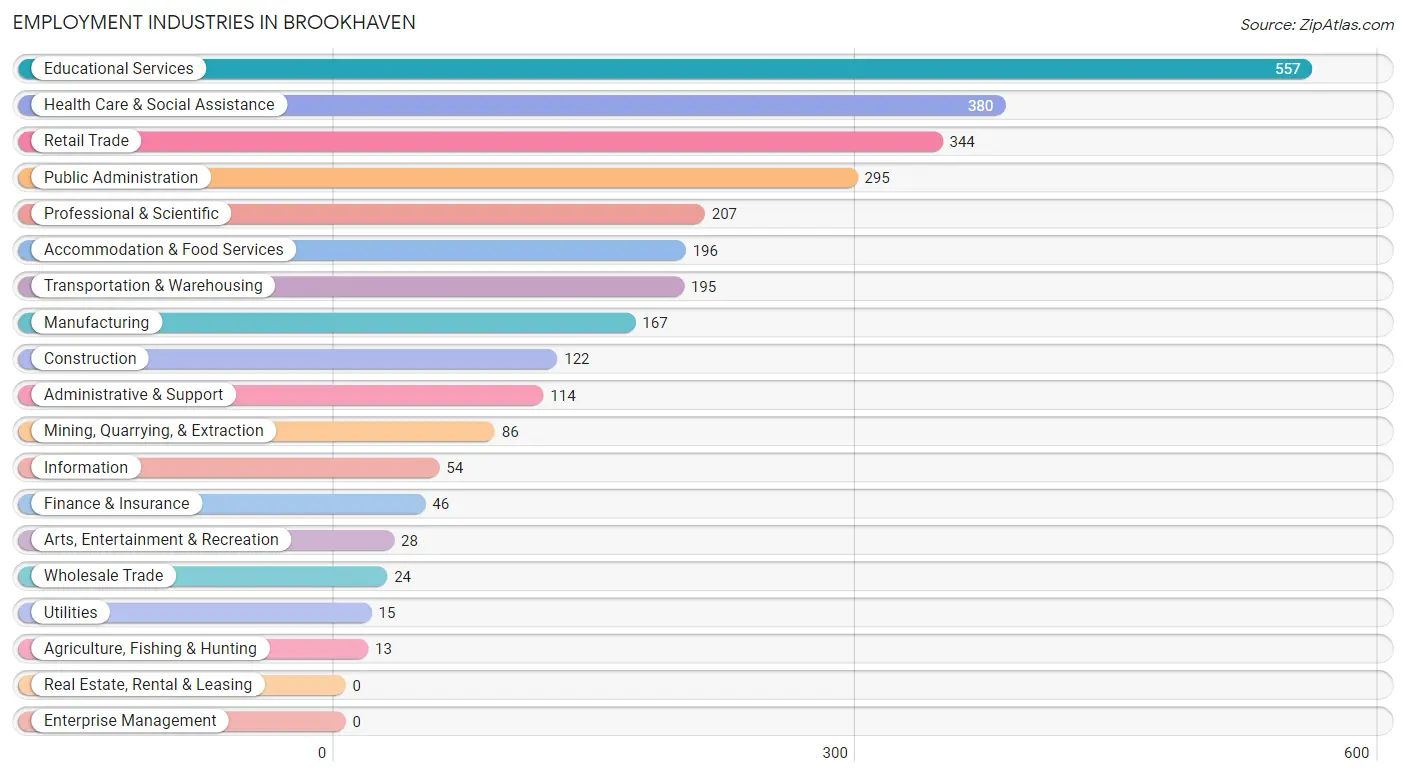
Employment Industries in Brookhaven
The major employment industries in Brookhaven include Educational Services (557 | 18.7%), Health Care & Social Assistance (380 | 12.8%), Retail Trade (344 | 11.6%), Public Administration (295 | 9.9%), and Professional & Scientific (207 | 7.0%).
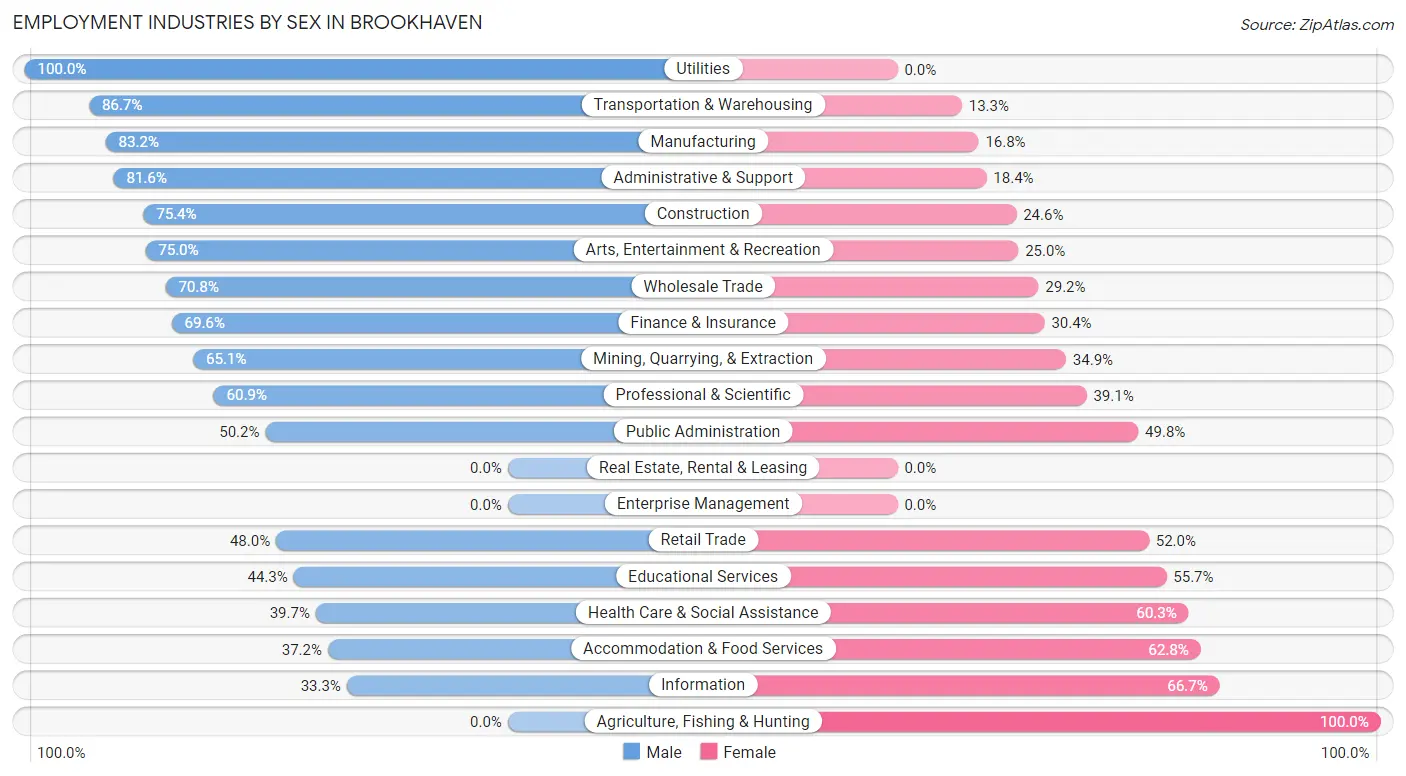
Employment Industries by Sex in Brookhaven
The Brookhaven industries that see more men than women are Utilities (100.0%), Transportation & Warehousing (86.7%), and Manufacturing (83.2%), whereas the industries that tend to have a higher number of women are Agriculture, Fishing & Hunting (100.0%), Information (66.7%), and Accommodation & Food Services (62.8%).
| Industry | Male | Female |
| Agriculture, Fishing & Hunting | 0 (0.0%) | 13 (100.0%) |
| Mining, Quarrying, & Extraction | 56 (65.1%) | 30 (34.9%) |
| Construction | 92 (75.4%) | 30 (24.6%) |
| Manufacturing | 139 (83.2%) | 28 (16.8%) |
| Wholesale Trade | 17 (70.8%) | 7 (29.2%) |
| Retail Trade | 165 (48.0%) | 179 (52.0%) |
| Transportation & Warehousing | 169 (86.7%) | 26 (13.3%) |
| Utilities | 15 (100.0%) | 0 (0.0%) |
| Information | 18 (33.3%) | 36 (66.7%) |
| Finance & Insurance | 32 (69.6%) | 14 (30.4%) |
| Real Estate, Rental & Leasing | 0 (0.0%) | 0 (0.0%) |
| Professional & Scientific | 126 (60.9%) | 81 (39.1%) |
| Enterprise Management | 0 (0.0%) | 0 (0.0%) |
| Administrative & Support | 93 (81.6%) | 21 (18.4%) |
| Educational Services | 247 (44.3%) | 310 (55.7%) |
| Health Care & Social Assistance | 151 (39.7%) | 229 (60.3%) |
| Arts, Entertainment & Recreation | 21 (75.0%) | 7 (25.0%) |
| Accommodation & Food Services | 73 (37.2%) | 123 (62.8%) |
| Public Administration | 148 (50.2%) | 147 (49.8%) |
| Total | 1,624 (54.6%) | 1,352 (45.4%) |
Education in Brookhaven
School Enrollment in Brookhaven
The most common levels of schooling among the 1,281 students in Brookhaven are elementary school (383 | 29.9%), high school (296 | 23.1%), and middle school (246 | 19.2%).
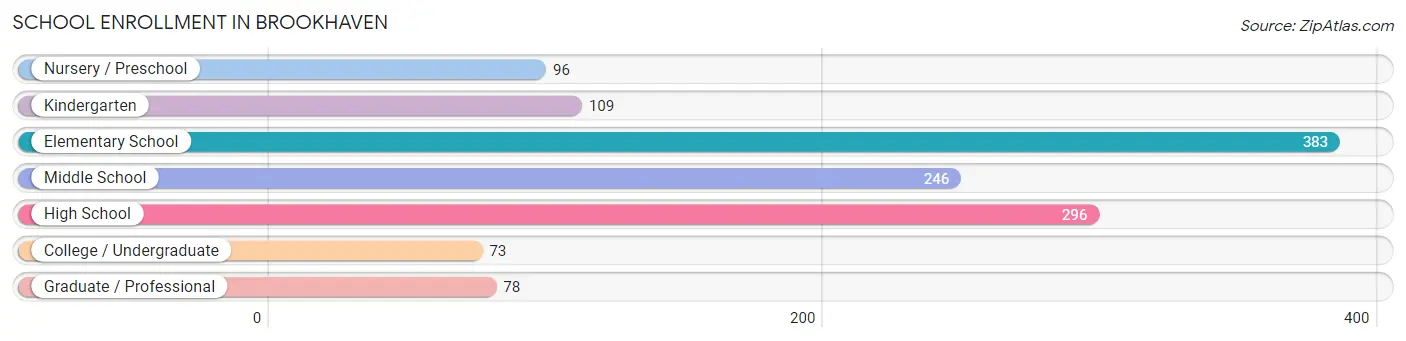
| School Level | # Students | % Students |
| Nursery / Preschool | 96 | 7.5% |
| Kindergarten | 109 | 8.5% |
| Elementary School | 383 | 29.9% |
| Middle School | 246 | 19.2% |
| High School | 296 | 23.1% |
| College / Undergraduate | 73 | 5.7% |
| Graduate / Professional | 78 | 6.1% |
| Total | 1,281 | 100.0% |
School Enrollment by Age by Funding Source in Brookhaven
Out of a total of 1,281 students who are enrolled in schools in Brookhaven, 283 (22.1%) attend a private institution, while the remaining 998 (77.9%) are enrolled in public schools. The age group of 3 to 4 year olds has the highest likelihood of being enrolled in private schools, with 53 (70.7% in the age bracket) enrolled. Conversely, the age group of 18 to 19 year olds has the lowest likelihood of being enrolled in a private school, with 38 (100.0% in the age bracket) attending a public institution.
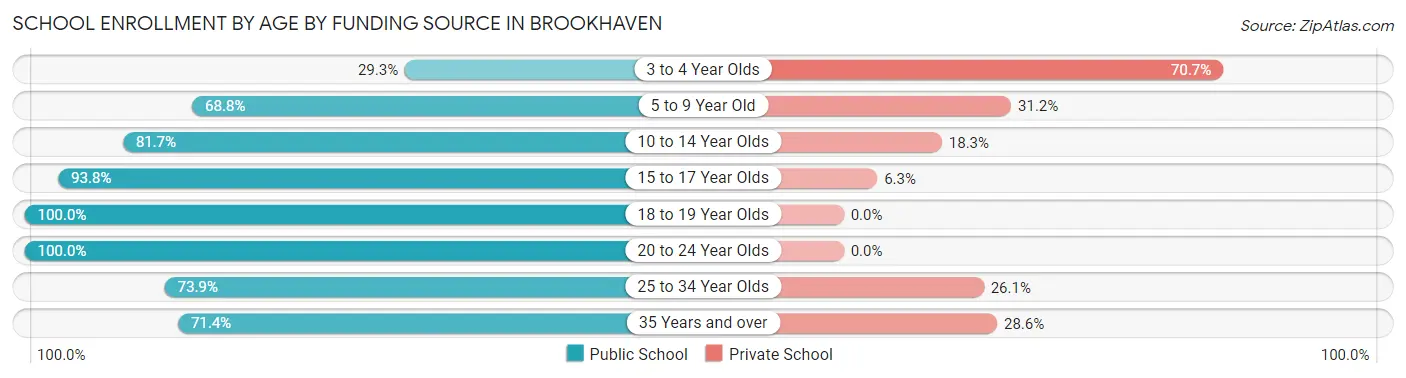
| Age Bracket | Public School | Private School |
| 3 to 4 Year Olds | 22 (29.3%) | 53 (70.7%) |
| 5 to 9 Year Old | 267 (68.8%) | 121 (31.2%) |
| 10 to 14 Year Olds | 344 (81.7%) | 77 (18.3%) |
| 15 to 17 Year Olds | 210 (93.8%) | 14 (6.2%) |
| 18 to 19 Year Olds | 38 (100.0%) | 0 (0.0%) |
| 20 to 24 Year Olds | 70 (100.0%) | 0 (0.0%) |
| 25 to 34 Year Olds | 17 (73.9%) | 6 (26.1%) |
| 35 Years and over | 30 (71.4%) | 12 (28.6%) |
| Total | 998 (77.9%) | 283 (22.1%) |
Educational Attainment by Field of Study in Brookhaven
Business (273 | 15.5%), education (269 | 15.3%), science & technology (173 | 9.8%), bio, nature & agricultural (170 | 9.7%), and arts & humanities (162 | 9.2%) are the most common fields of study among 1,761 individuals in Brookhaven who have obtained a bachelor's degree or higher.
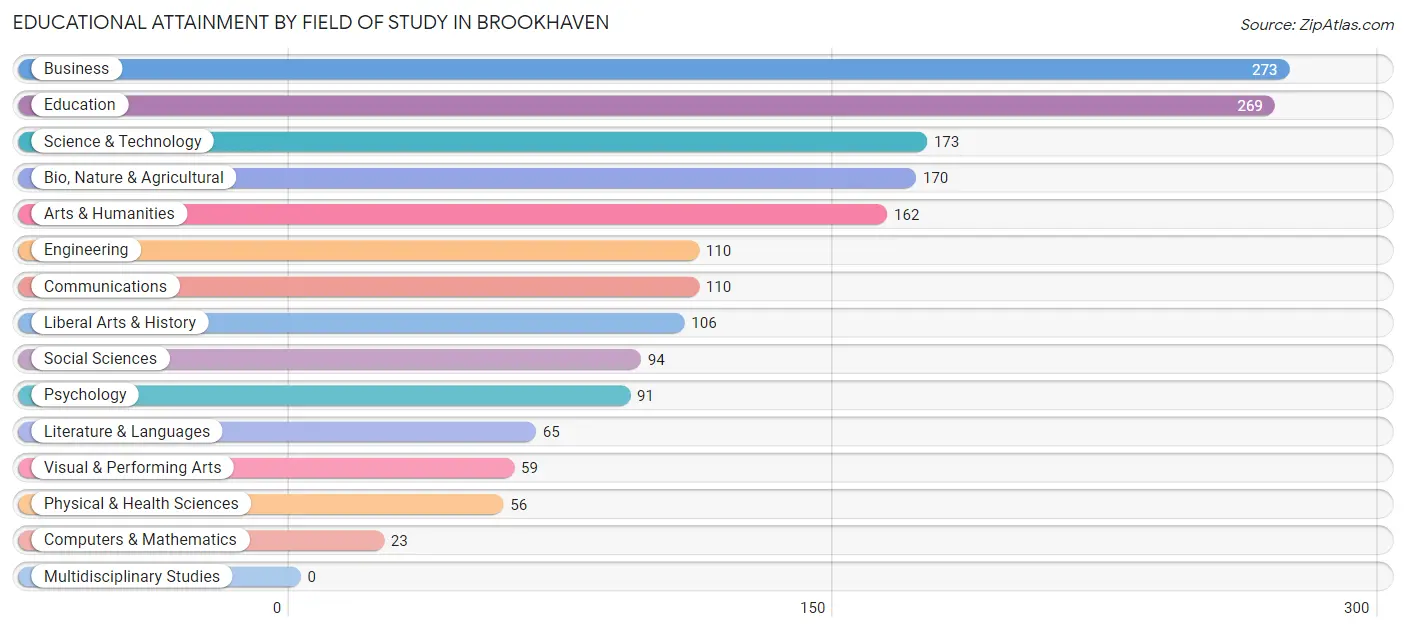
| Field of Study | # Graduates | % Graduates |
| Computers & Mathematics | 23 | 1.3% |
| Bio, Nature & Agricultural | 170 | 9.7% |
| Physical & Health Sciences | 56 | 3.2% |
| Psychology | 91 | 5.2% |
| Social Sciences | 94 | 5.3% |
| Engineering | 110 | 6.2% |
| Multidisciplinary Studies | 0 | 0.0% |
| Science & Technology | 173 | 9.8% |
| Business | 273 | 15.5% |
| Education | 269 | 15.3% |
| Literature & Languages | 65 | 3.7% |
| Liberal Arts & History | 106 | 6.0% |
| Visual & Performing Arts | 59 | 3.4% |
| Communications | 110 | 6.2% |
| Arts & Humanities | 162 | 9.2% |
| Total | 1,761 | 100.0% |
Transportation & Commute in Brookhaven
Vehicle Availability by Sex in Brookhaven
The most prevalent vehicle ownership categories in Brookhaven are males with 2 vehicles (943, accounting for 57.7%) and females with 2 vehicles (658, making up 73.1%).
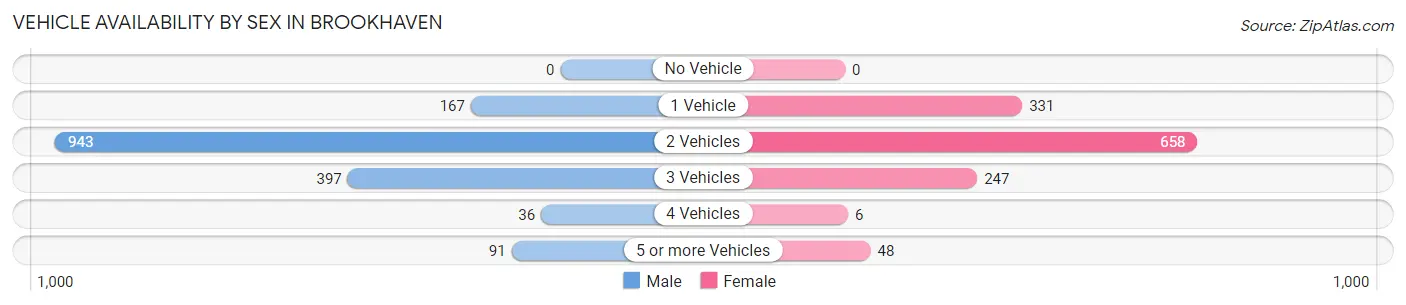
| Vehicles Available | Male | Female |
| No Vehicle | 0 (0.0%) | 0 (0.0%) |
| 1 Vehicle | 167 (10.2%) | 331 (25.7%) |
| 2 Vehicles | 943 (57.7%) | 658 (51.0%) |
| 3 Vehicles | 397 (24.3%) | 247 (19.2%) |
| 4 Vehicles | 36 (2.2%) | 6 (0.5%) |
| 5 or more Vehicles | 91 (5.6%) | 48 (3.7%) |
| Total | 1,634 (100.0%) | 1,290 (100.0%) |
Commute Time in Brookhaven
The most frequently occuring commute durations in Brookhaven are 20 to 24 minutes (647 commuters, 25.4%), 15 to 19 minutes (645 commuters, 25.3%), and 30 to 34 minutes (309 commuters, 12.1%).
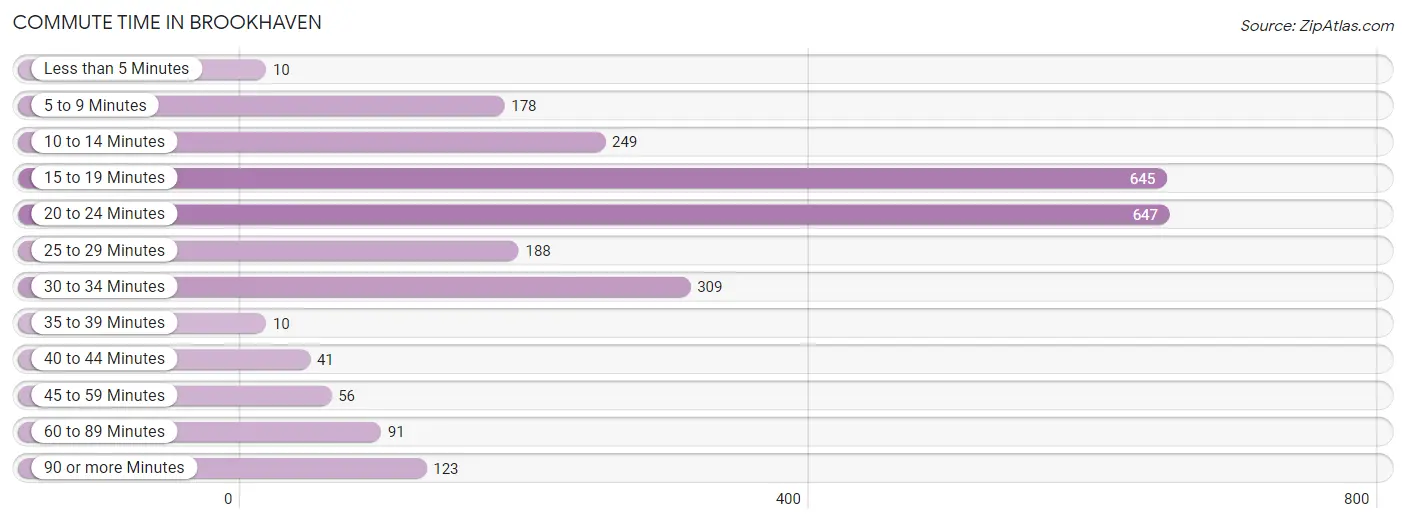
| Commute Time | # Commuters | % Commuters |
| Less than 5 Minutes | 10 | 0.4% |
| 5 to 9 Minutes | 178 | 7.0% |
| 10 to 14 Minutes | 249 | 9.8% |
| 15 to 19 Minutes | 645 | 25.3% |
| 20 to 24 Minutes | 647 | 25.4% |
| 25 to 29 Minutes | 188 | 7.4% |
| 30 to 34 Minutes | 309 | 12.1% |
| 35 to 39 Minutes | 10 | 0.4% |
| 40 to 44 Minutes | 41 | 1.6% |
| 45 to 59 Minutes | 56 | 2.2% |
| 60 to 89 Minutes | 91 | 3.6% |
| 90 or more Minutes | 123 | 4.8% |
Commute Time by Sex in Brookhaven
The most common commute times in Brookhaven are 15 to 19 minutes (353 commuters, 23.9%) for males and 20 to 24 minutes (316 commuters, 29.6%) for females.
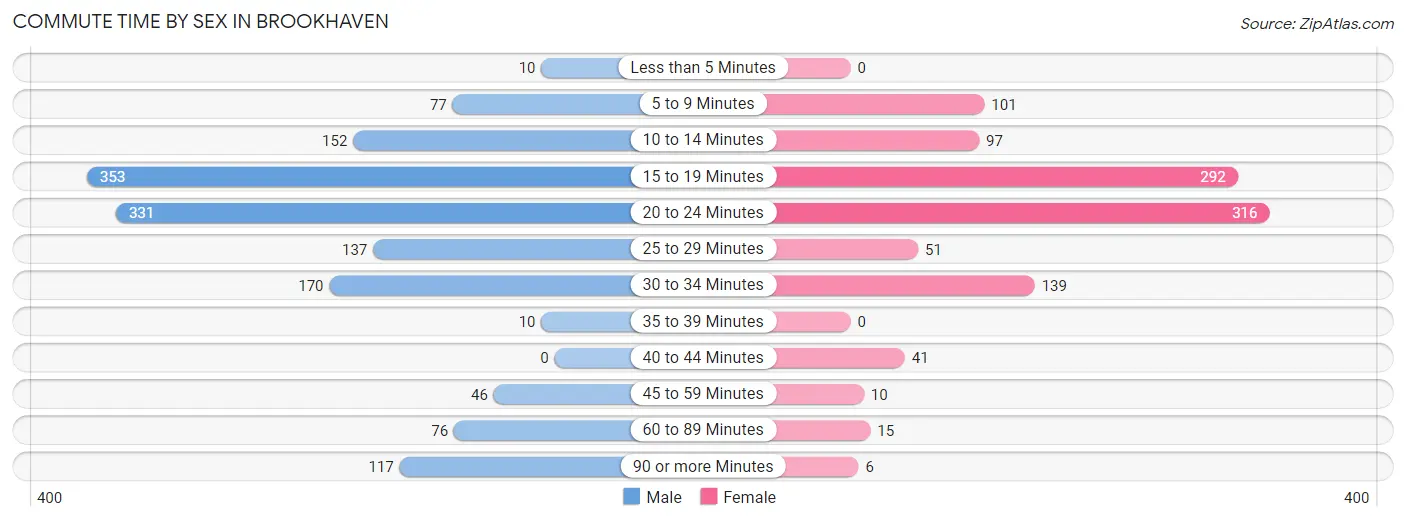
| Commute Time | Male | Female |
| Less than 5 Minutes | 10 (0.7%) | 0 (0.0%) |
| 5 to 9 Minutes | 77 (5.2%) | 101 (9.5%) |
| 10 to 14 Minutes | 152 (10.3%) | 97 (9.1%) |
| 15 to 19 Minutes | 353 (23.9%) | 292 (27.3%) |
| 20 to 24 Minutes | 331 (22.4%) | 316 (29.6%) |
| 25 to 29 Minutes | 137 (9.3%) | 51 (4.8%) |
| 30 to 34 Minutes | 170 (11.5%) | 139 (13.0%) |
| 35 to 39 Minutes | 10 (0.7%) | 0 (0.0%) |
| 40 to 44 Minutes | 0 (0.0%) | 41 (3.8%) |
| 45 to 59 Minutes | 46 (3.1%) | 10 (0.9%) |
| 60 to 89 Minutes | 76 (5.1%) | 15 (1.4%) |
| 90 or more Minutes | 117 (7.9%) | 6 (0.6%) |
Time of Departure to Work by Sex in Brookhaven
The most frequent times of departure to work in Brookhaven are 7:00 AM to 7:29 AM (401, 27.1%) for males and 8:30 AM to 8:59 AM (216, 20.2%) for females.
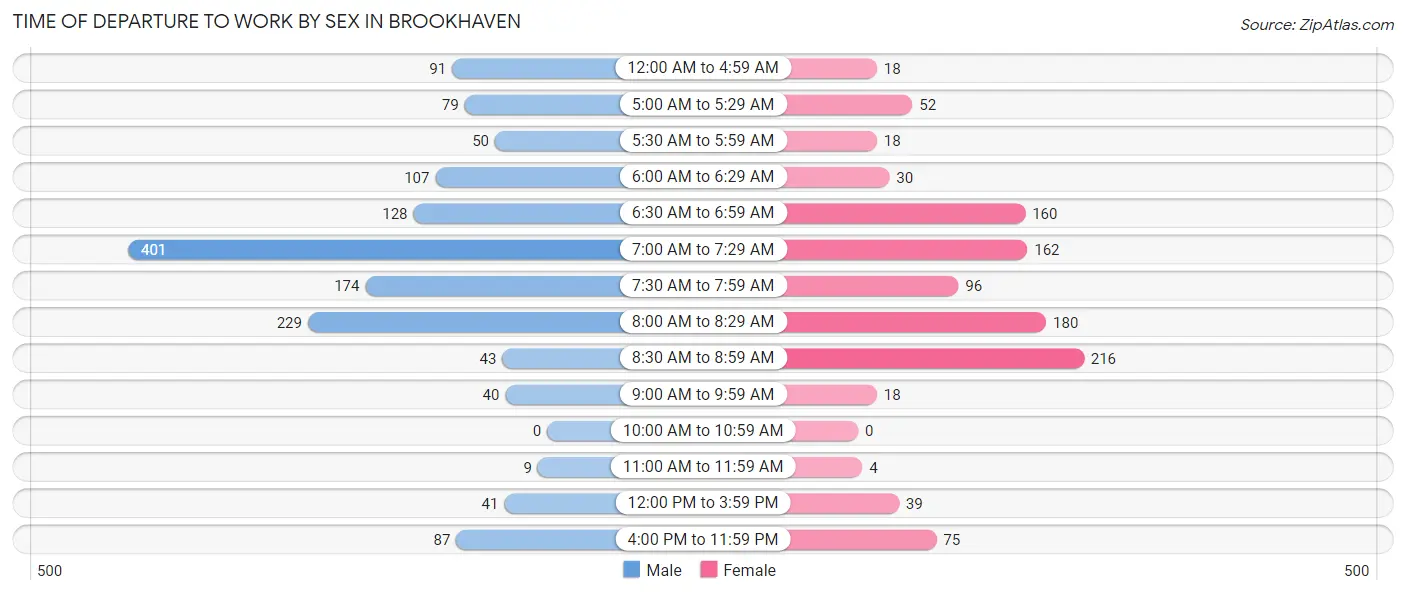
| Time of Departure | Male | Female |
| 12:00 AM to 4:59 AM | 91 (6.1%) | 18 (1.7%) |
| 5:00 AM to 5:29 AM | 79 (5.3%) | 52 (4.9%) |
| 5:30 AM to 5:59 AM | 50 (3.4%) | 18 (1.7%) |
| 6:00 AM to 6:29 AM | 107 (7.2%) | 30 (2.8%) |
| 6:30 AM to 6:59 AM | 128 (8.6%) | 160 (15.0%) |
| 7:00 AM to 7:29 AM | 401 (27.1%) | 162 (15.2%) |
| 7:30 AM to 7:59 AM | 174 (11.8%) | 96 (9.0%) |
| 8:00 AM to 8:29 AM | 229 (15.5%) | 180 (16.9%) |
| 8:30 AM to 8:59 AM | 43 (2.9%) | 216 (20.2%) |
| 9:00 AM to 9:59 AM | 40 (2.7%) | 18 (1.7%) |
| 10:00 AM to 10:59 AM | 0 (0.0%) | 0 (0.0%) |
| 11:00 AM to 11:59 AM | 9 (0.6%) | 4 (0.4%) |
| 12:00 PM to 3:59 PM | 41 (2.8%) | 39 (3.6%) |
| 4:00 PM to 11:59 PM | 87 (5.9%) | 75 (7.0%) |
| Total | 1,479 (100.0%) | 1,068 (100.0%) |
Housing Occupancy in Brookhaven
Occupancy by Ownership in Brookhaven
Of the total 2,343 dwellings in Brookhaven, owner-occupied units account for 1,822 (77.8%), while renter-occupied units make up 521 (22.2%).
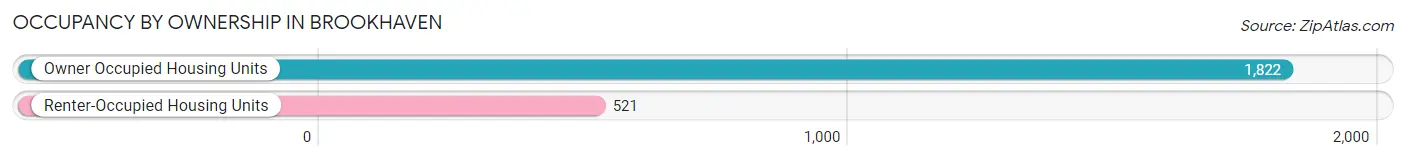
| Occupancy | # Housing Units | % Housing Units |
| Owner Occupied Housing Units | 1,822 | 77.8% |
| Renter-Occupied Housing Units | 521 | 22.2% |
| Total Occupied Housing Units | 2,343 | 100.0% |
Occupancy by Household Size in Brookhaven
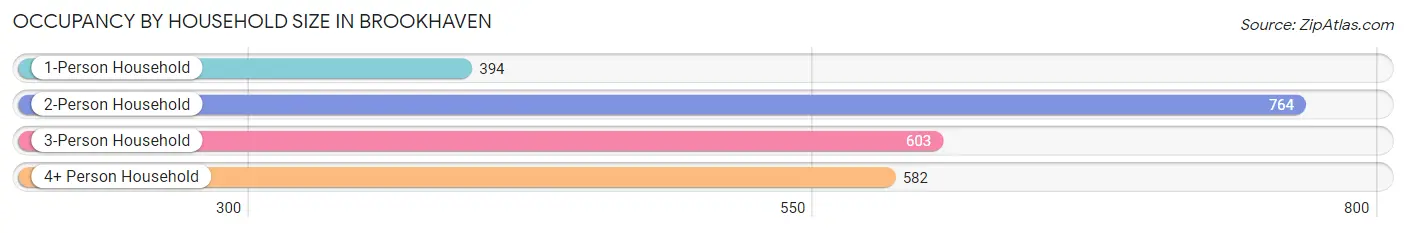
| Household Size | # Housing Units | % Housing Units |
| 1-Person Household | 394 | 16.8% |
| 2-Person Household | 764 | 32.6% |
| 3-Person Household | 603 | 25.7% |
| 4+ Person Household | 582 | 24.8% |
| Total Housing Units | 2,343 | 100.0% |
Occupancy by Ownership by Household Size in Brookhaven
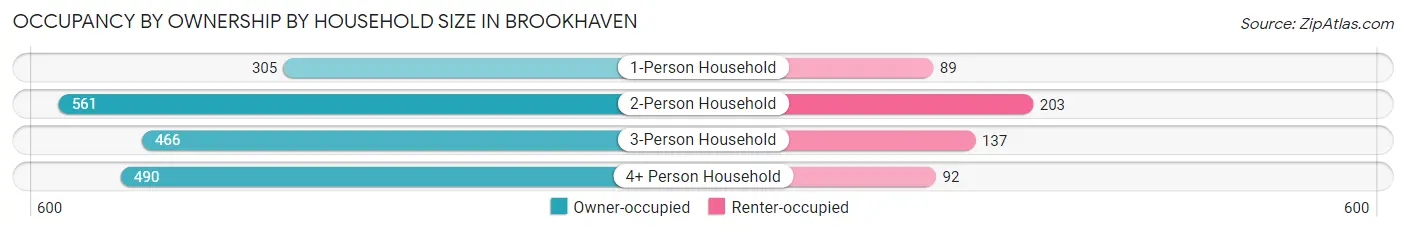
| Household Size | Owner-occupied | Renter-occupied |
| 1-Person Household | 305 (77.4%) | 89 (22.6%) |
| 2-Person Household | 561 (73.4%) | 203 (26.6%) |
| 3-Person Household | 466 (77.3%) | 137 (22.7%) |
| 4+ Person Household | 490 (84.2%) | 92 (15.8%) |
| Total Housing Units | 1,822 (77.8%) | 521 (22.2%) |
Occupancy by Educational Attainment in Brookhaven
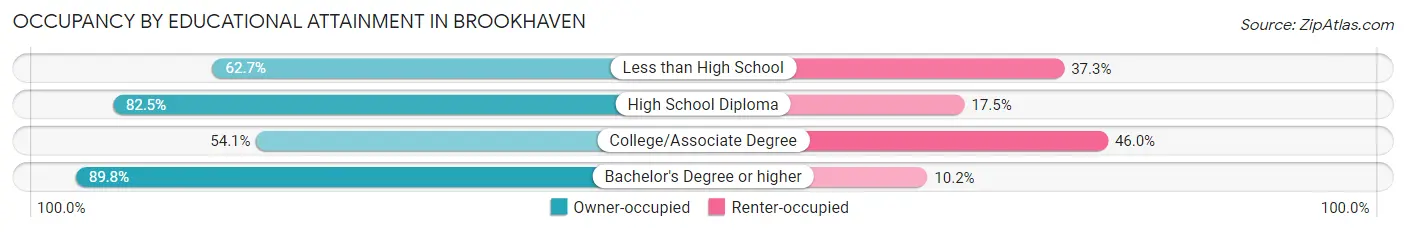
| Household Size | Owner-occupied | Renter-occupied |
| Less than High School | 111 (62.7%) | 66 (37.3%) |
| High School Diploma | 556 (82.5%) | 118 (17.5%) |
| College/Associate Degree | 280 (54.0%) | 238 (46.0%) |
| Bachelor's Degree or higher | 875 (89.8%) | 99 (10.2%) |
Occupancy by Age of Householder in Brookhaven
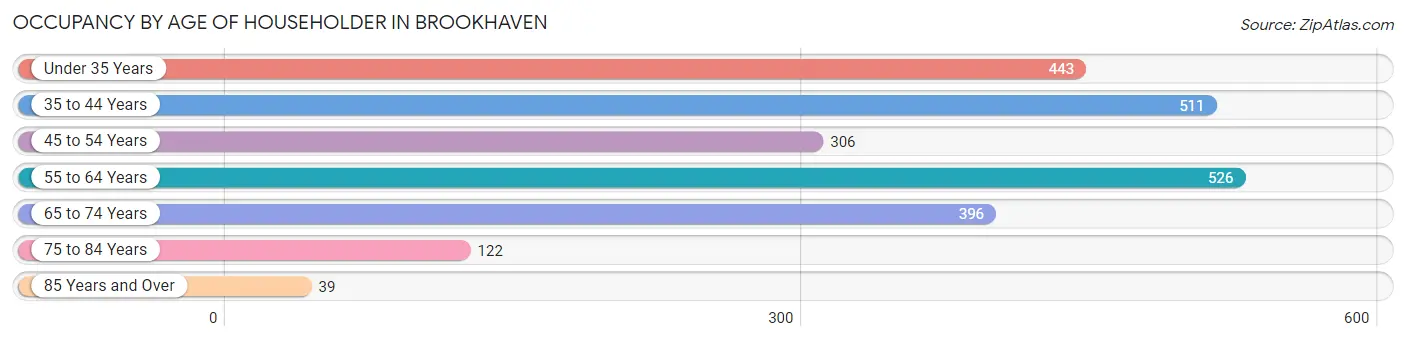
| Age Bracket | # Households | % Households |
| Under 35 Years | 443 | 18.9% |
| 35 to 44 Years | 511 | 21.8% |
| 45 to 54 Years | 306 | 13.1% |
| 55 to 64 Years | 526 | 22.5% |
| 65 to 74 Years | 396 | 16.9% |
| 75 to 84 Years | 122 | 5.2% |
| 85 Years and Over | 39 | 1.7% |
| Total | 2,343 | 100.0% |
Housing Finances in Brookhaven
Median Income by Occupancy in Brookhaven
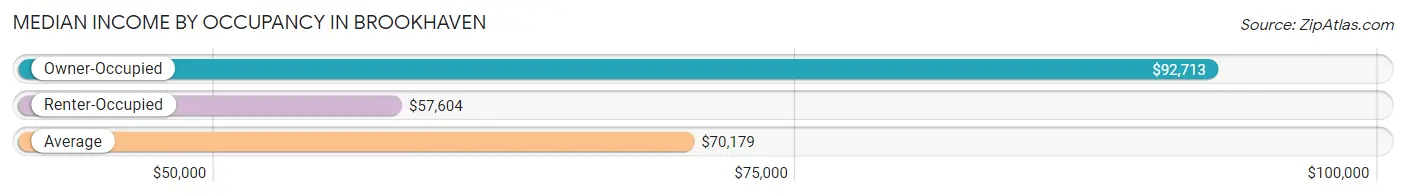
| Occupancy Type | # Households | Median Income |
| Owner-Occupied | 1,822 (77.8%) | $92,713 |
| Renter-Occupied | 521 (22.2%) | $57,604 |
| Average | 2,343 (100.0%) | $70,179 |
Occupancy by Householder Income Bracket in Brookhaven
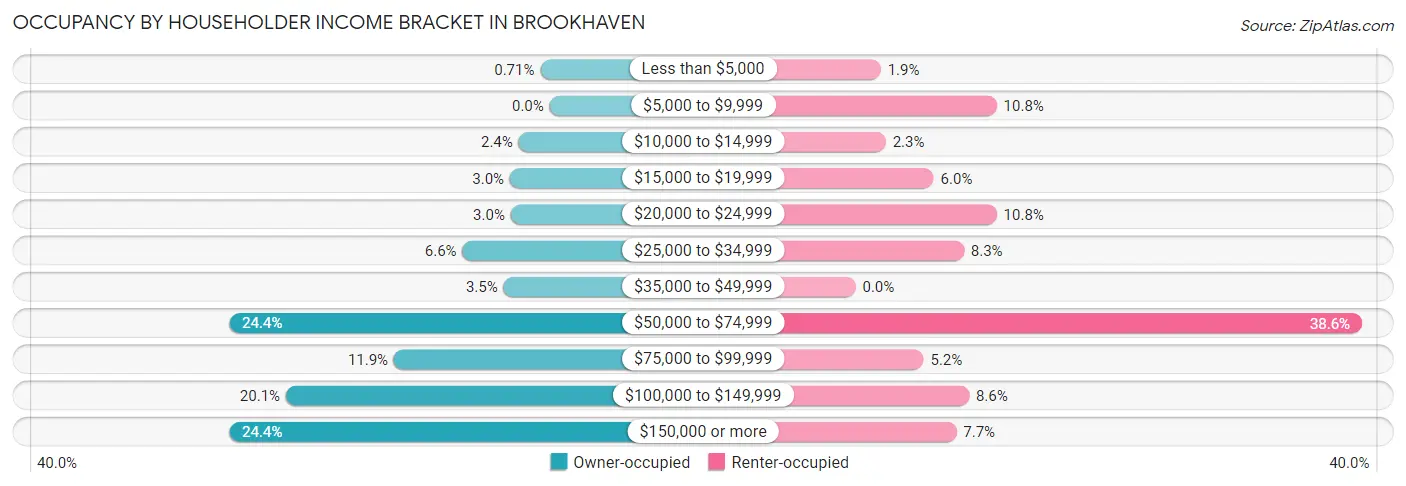
| Income Bracket | Owner-occupied | Renter-occupied |
| Less than $5,000 | 13 (0.7%) | 10 (1.9%) |
| $5,000 to $9,999 | 0 (0.0%) | 56 (10.7%) |
| $10,000 to $14,999 | 43 (2.4%) | 12 (2.3%) |
| $15,000 to $19,999 | 55 (3.0%) | 31 (5.9%) |
| $20,000 to $24,999 | 54 (3.0%) | 56 (10.7%) |
| $25,000 to $34,999 | 121 (6.6%) | 43 (8.3%) |
| $35,000 to $49,999 | 64 (3.5%) | 0 (0.0%) |
| $50,000 to $74,999 | 445 (24.4%) | 201 (38.6%) |
| $75,000 to $99,999 | 216 (11.9%) | 27 (5.2%) |
| $100,000 to $149,999 | 366 (20.1%) | 45 (8.6%) |
| $150,000 or more | 445 (24.4%) | 40 (7.7%) |
| Total | 1,822 (100.0%) | 521 (100.0%) |
Monthly Housing Cost Tiers in Brookhaven
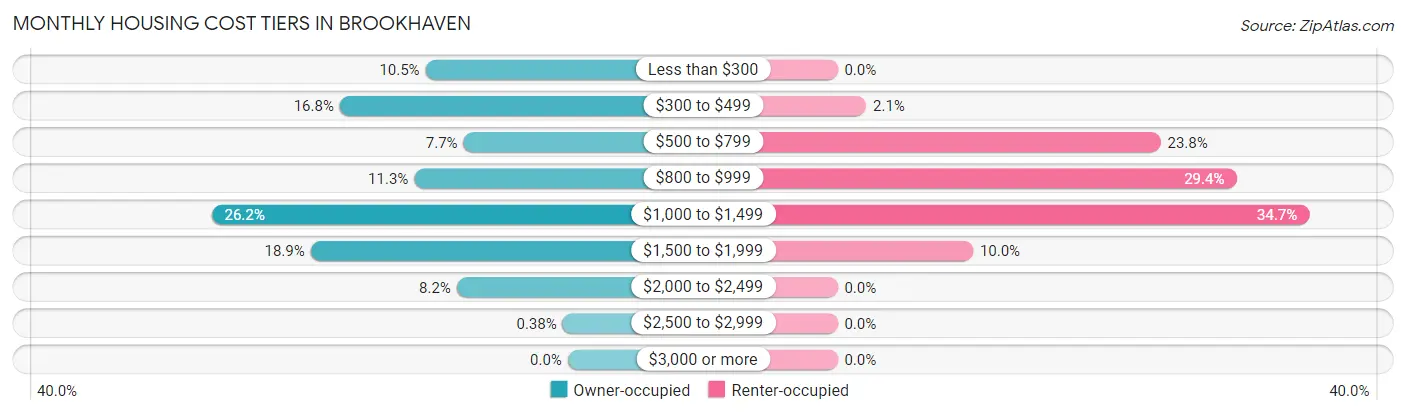
| Monthly Cost | Owner-occupied | Renter-occupied |
| Less than $300 | 191 (10.5%) | 0 (0.0%) |
| $300 to $499 | 306 (16.8%) | 11 (2.1%) |
| $500 to $799 | 140 (7.7%) | 124 (23.8%) |
| $800 to $999 | 206 (11.3%) | 153 (29.4%) |
| $1,000 to $1,499 | 478 (26.2%) | 181 (34.7%) |
| $1,500 to $1,999 | 345 (18.9%) | 52 (10.0%) |
| $2,000 to $2,499 | 149 (8.2%) | 0 (0.0%) |
| $2,500 to $2,999 | 7 (0.4%) | 0 (0.0%) |
| $3,000 or more | 0 (0.0%) | 0 (0.0%) |
| Total | 1,822 (100.0%) | 521 (100.0%) |
Physical Housing Characteristics in Brookhaven
Housing Structures in Brookhaven
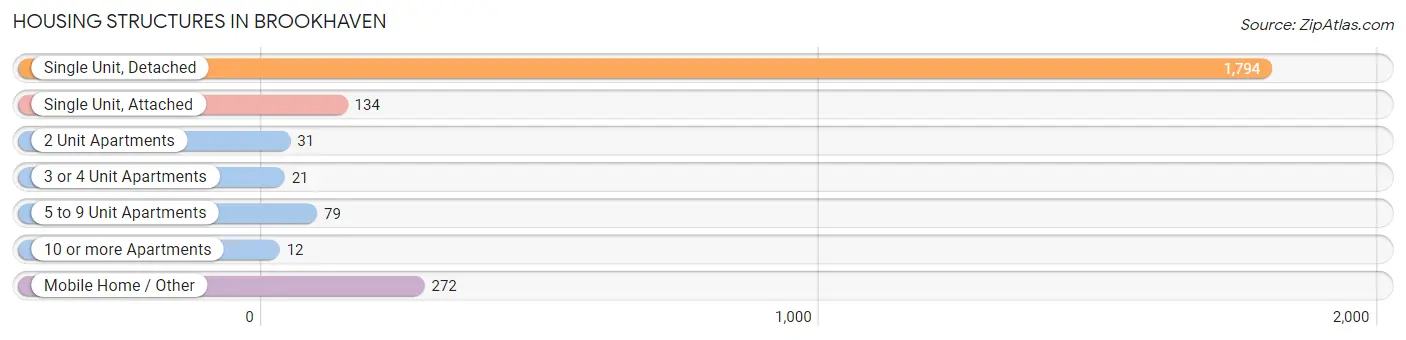
| Structure Type | # Housing Units | % Housing Units |
| Single Unit, Detached | 1,794 | 76.6% |
| Single Unit, Attached | 134 | 5.7% |
| 2 Unit Apartments | 31 | 1.3% |
| 3 or 4 Unit Apartments | 21 | 0.9% |
| 5 to 9 Unit Apartments | 79 | 3.4% |
| 10 or more Apartments | 12 | 0.5% |
| Mobile Home / Other | 272 | 11.6% |
| Total | 2,343 | 100.0% |
Housing Structures by Occupancy in Brookhaven
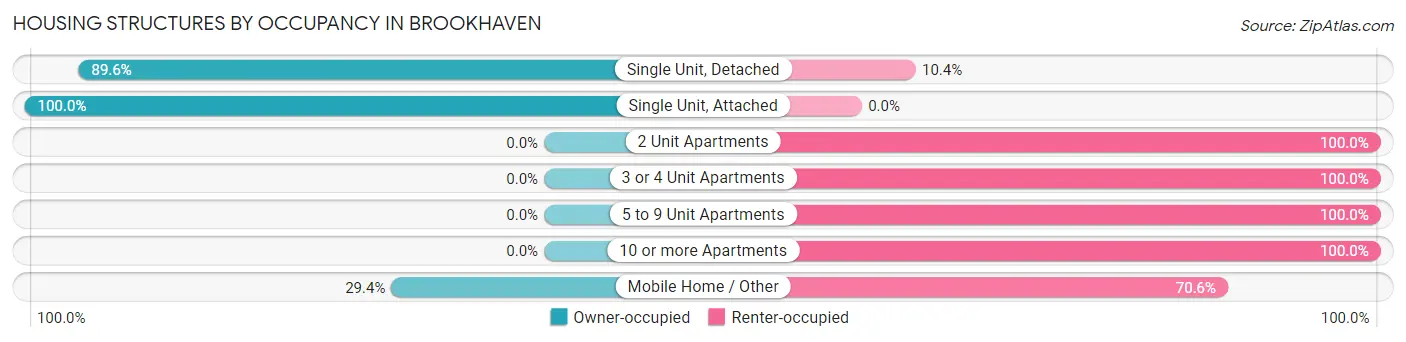
| Structure Type | Owner-occupied | Renter-occupied |
| Single Unit, Detached | 1,608 (89.6%) | 186 (10.4%) |
| Single Unit, Attached | 134 (100.0%) | 0 (0.0%) |
| 2 Unit Apartments | 0 (0.0%) | 31 (100.0%) |
| 3 or 4 Unit Apartments | 0 (0.0%) | 21 (100.0%) |
| 5 to 9 Unit Apartments | 0 (0.0%) | 79 (100.0%) |
| 10 or more Apartments | 0 (0.0%) | 12 (100.0%) |
| Mobile Home / Other | 80 (29.4%) | 192 (70.6%) |
| Total | 1,822 (77.8%) | 521 (22.2%) |
Housing Structures by Number of Rooms in Brookhaven
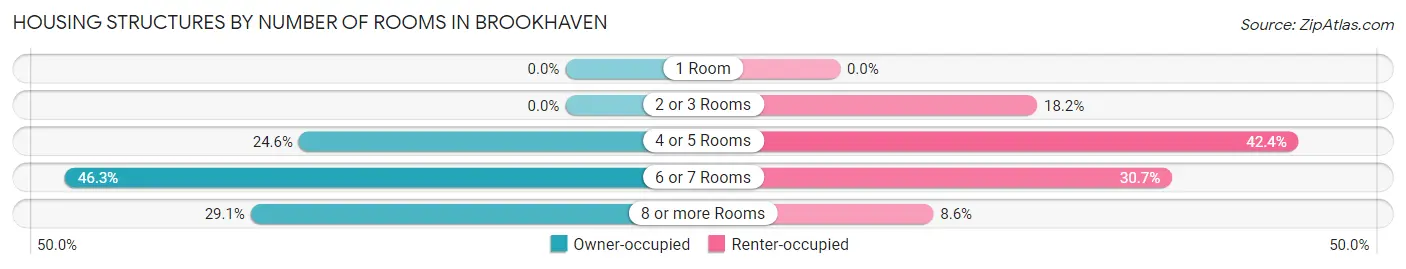
| Number of Rooms | Owner-occupied | Renter-occupied |
| 1 Room | 0 (0.0%) | 0 (0.0%) |
| 2 or 3 Rooms | 0 (0.0%) | 95 (18.2%) |
| 4 or 5 Rooms | 449 (24.6%) | 221 (42.4%) |
| 6 or 7 Rooms | 843 (46.3%) | 160 (30.7%) |
| 8 or more Rooms | 530 (29.1%) | 45 (8.6%) |
| Total | 1,822 (100.0%) | 521 (100.0%) |
Housing Structure by Heating Type in Brookhaven
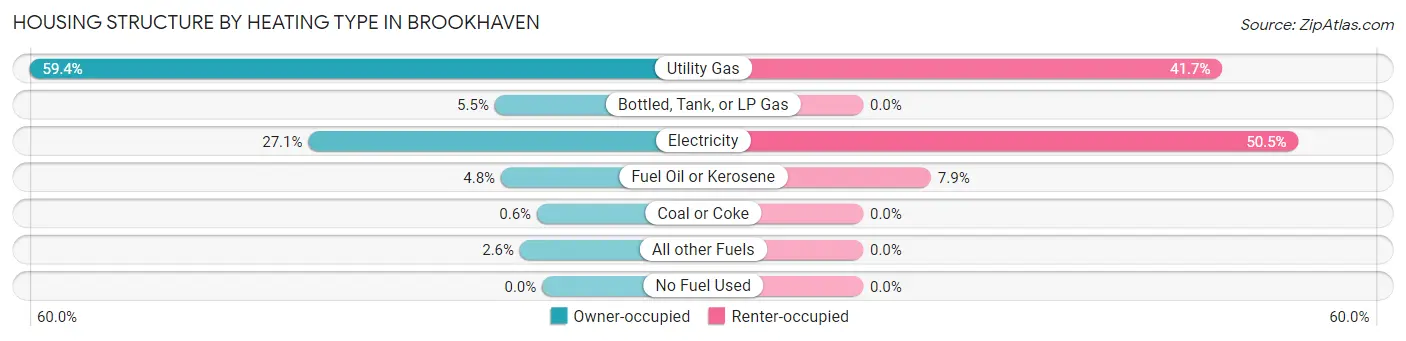
| Heating Type | Owner-occupied | Renter-occupied |
| Utility Gas | 1,083 (59.4%) | 217 (41.6%) |
| Bottled, Tank, or LP Gas | 100 (5.5%) | 0 (0.0%) |
| Electricity | 494 (27.1%) | 263 (50.5%) |
| Fuel Oil or Kerosene | 87 (4.8%) | 41 (7.9%) |
| Coal or Coke | 11 (0.6%) | 0 (0.0%) |
| All other Fuels | 47 (2.6%) | 0 (0.0%) |
| No Fuel Used | 0 (0.0%) | 0 (0.0%) |
| Total | 1,822 (100.0%) | 521 (100.0%) |
Household Vehicle Usage in Brookhaven
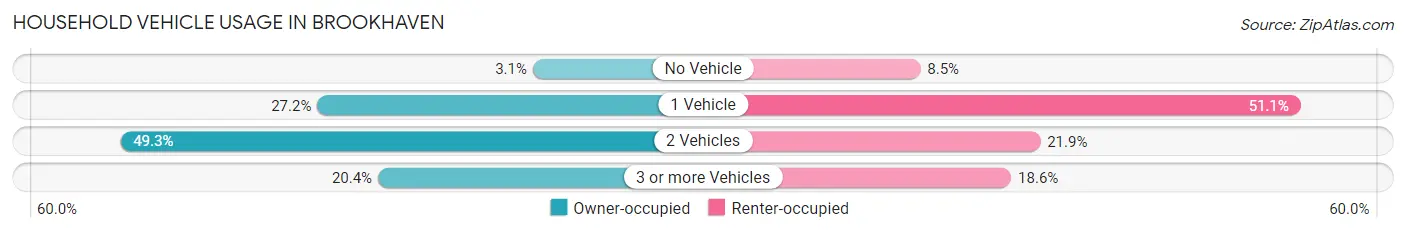
| Vehicles per Household | Owner-occupied | Renter-occupied |
| No Vehicle | 56 (3.1%) | 44 (8.5%) |
| 1 Vehicle | 496 (27.2%) | 266 (51.1%) |
| 2 Vehicles | 898 (49.3%) | 114 (21.9%) |
| 3 or more Vehicles | 372 (20.4%) | 97 (18.6%) |
| Total | 1,822 (100.0%) | 521 (100.0%) |
Real Estate & Mortgages in Brookhaven
Real Estate and Mortgage Overview in Brookhaven
| Characteristic | Without Mortgage | With Mortgage |
| Housing Units | 622 | 1,200 |
| Median Property Value | $218,900 | $241,300 |
| Median Household Income | $64,746 | $318 |
| Monthly Housing Costs | $359 | $0 |
| Real Estate Taxes | $1,027 | $8 |
Property Value by Mortgage Status in Brookhaven
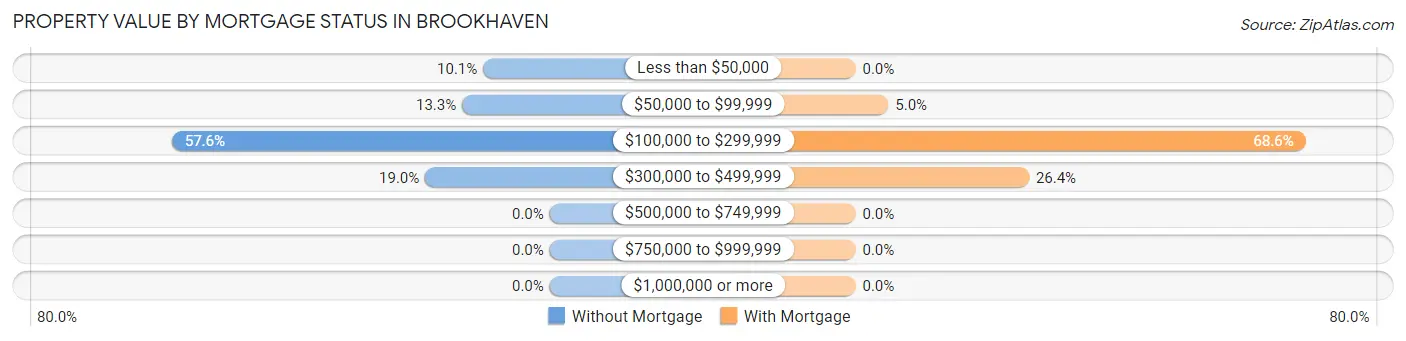
| Property Value | Without Mortgage | With Mortgage |
| Less than $50,000 | 63 (10.1%) | 0 (0.0%) |
| $50,000 to $99,999 | 83 (13.3%) | 60 (5.0%) |
| $100,000 to $299,999 | 358 (57.6%) | 823 (68.6%) |
| $300,000 to $499,999 | 118 (19.0%) | 317 (26.4%) |
| $500,000 to $749,999 | 0 (0.0%) | 0 (0.0%) |
| $750,000 to $999,999 | 0 (0.0%) | 0 (0.0%) |
| $1,000,000 or more | 0 (0.0%) | 0 (0.0%) |
| Total | 622 (100.0%) | 1,200 (100.0%) |
Household Income by Mortgage Status in Brookhaven
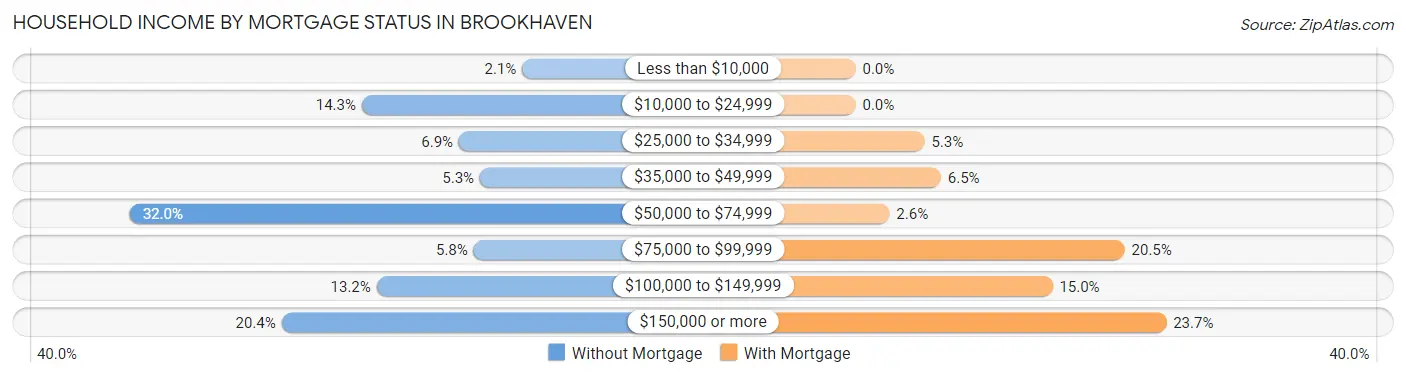
| Household Income | Without Mortgage | With Mortgage |
| Less than $10,000 | 13 (2.1%) | 0 (0.0%) |
| $10,000 to $24,999 | 89 (14.3%) | 0 (0.0%) |
| $25,000 to $34,999 | 43 (6.9%) | 63 (5.2%) |
| $35,000 to $49,999 | 33 (5.3%) | 78 (6.5%) |
| $50,000 to $74,999 | 199 (32.0%) | 31 (2.6%) |
| $75,000 to $99,999 | 36 (5.8%) | 246 (20.5%) |
| $100,000 to $149,999 | 82 (13.2%) | 180 (15.0%) |
| $150,000 or more | 127 (20.4%) | 284 (23.7%) |
| Total | 622 (100.0%) | 1,200 (100.0%) |
Property Value to Household Income Ratio in Brookhaven
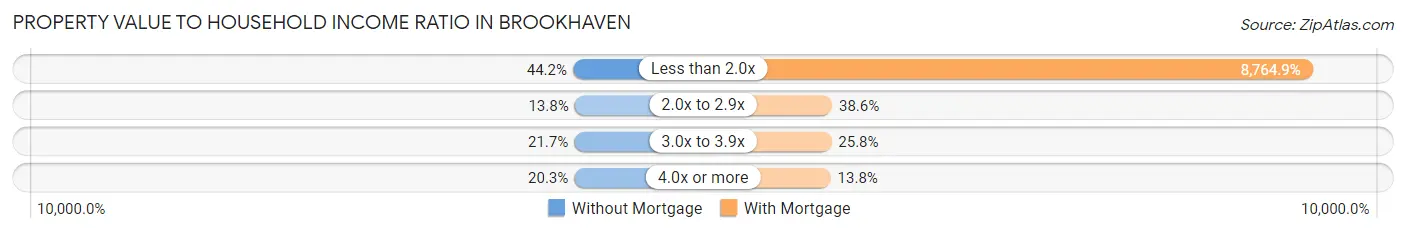
| Value-to-Income Ratio | Without Mortgage | With Mortgage |
| Less than 2.0x | 275 (44.2%) | 105,179 (8,764.9%) |
| 2.0x to 2.9x | 86 (13.8%) | 463 (38.6%) |
| 3.0x to 3.9x | 135 (21.7%) | 309 (25.8%) |
| 4.0x or more | 126 (20.3%) | 165 (13.8%) |
| Total | 622 (100.0%) | 1,200 (100.0%) |
Real Estate Taxes by Mortgage Status in Brookhaven
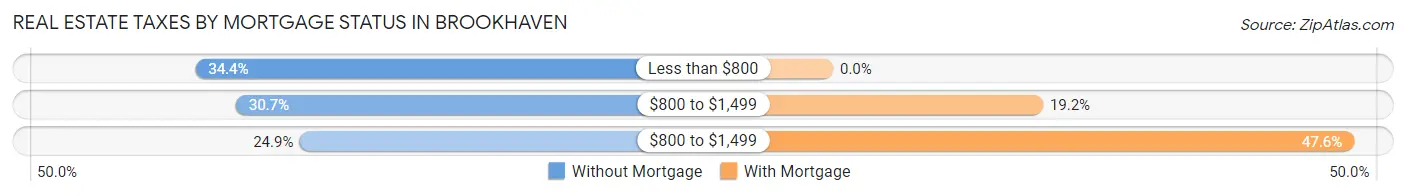
| Property Taxes | Without Mortgage | With Mortgage |
| Less than $800 | 214 (34.4%) | 0 (0.0%) |
| $800 to $1,499 | 191 (30.7%) | 230 (19.2%) |
| $800 to $1,499 | 155 (24.9%) | 571 (47.6%) |
| Total | 622 (100.0%) | 1,200 (100.0%) |
Health & Disability in Brookhaven
Health Insurance Coverage by Age in Brookhaven
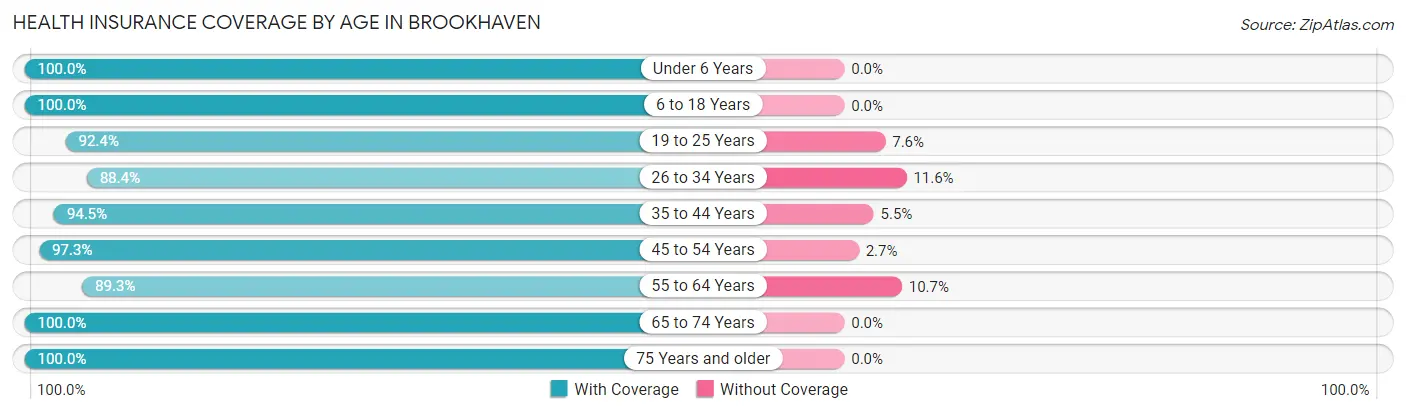
| Age Bracket | With Coverage | Without Coverage |
| Under 6 Years | 678 (100.0%) | 0 (0.0%) |
| 6 to 18 Years | 1,092 (100.0%) | 0 (0.0%) |
| 19 to 25 Years | 423 (92.4%) | 35 (7.6%) |
| 26 to 34 Years | 702 (88.4%) | 92 (11.6%) |
| 35 to 44 Years | 1,057 (94.5%) | 61 (5.5%) |
| 45 to 54 Years | 470 (97.3%) | 13 (2.7%) |
| 55 to 64 Years | 899 (89.3%) | 108 (10.7%) |
| 65 to 74 Years | 542 (100.0%) | 0 (0.0%) |
| 75 Years and older | 303 (100.0%) | 0 (0.0%) |
| Total | 6,166 (95.2%) | 309 (4.8%) |
Health Insurance Coverage by Citizenship Status in Brookhaven
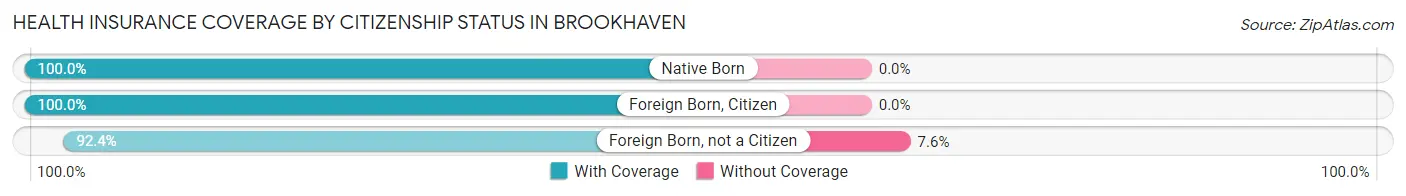
| Citizenship Status | With Coverage | Without Coverage |
| Native Born | 678 (100.0%) | 0 (0.0%) |
| Foreign Born, Citizen | 1,092 (100.0%) | 0 (0.0%) |
| Foreign Born, not a Citizen | 423 (92.4%) | 35 (7.6%) |
Health Insurance Coverage by Household Income in Brookhaven
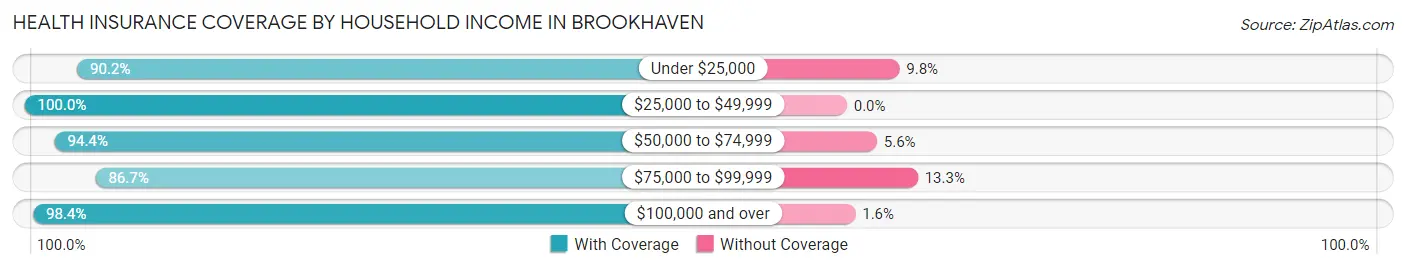
| Household Income | With Coverage | Without Coverage |
| Under $25,000 | 687 (90.2%) | 75 (9.8%) |
| $25,000 to $49,999 | 451 (100.0%) | 0 (0.0%) |
| $50,000 to $74,999 | 1,441 (94.4%) | 86 (5.6%) |
| $75,000 to $99,999 | 659 (86.7%) | 101 (13.3%) |
| $100,000 and over | 2,910 (98.4%) | 47 (1.6%) |
Public vs Private Health Insurance Coverage by Age in Brookhaven
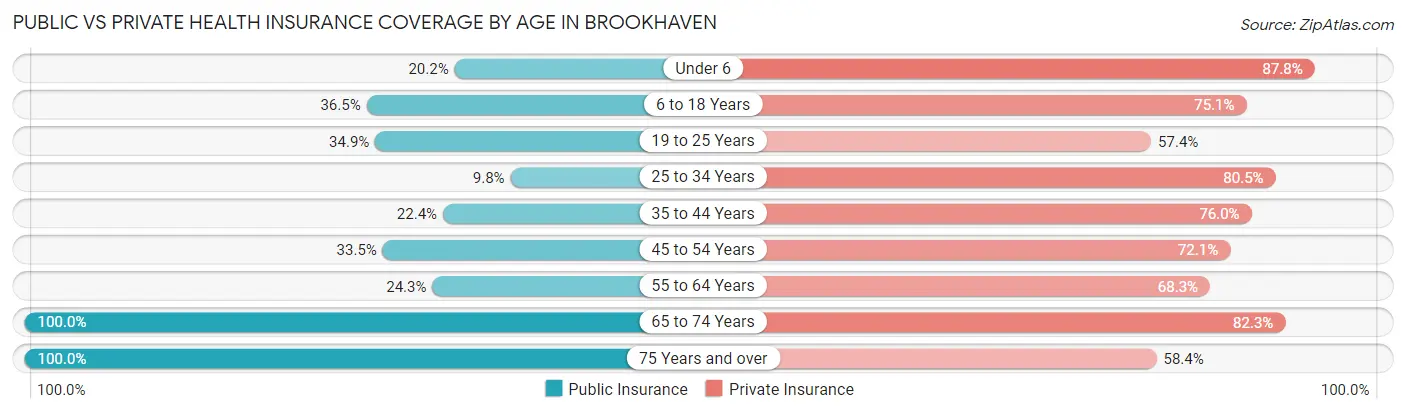
| Age Bracket | Public Insurance | Private Insurance |
| Under 6 | 137 (20.2%) | 595 (87.8%) |
| 6 to 18 Years | 399 (36.5%) | 820 (75.1%) |
| 19 to 25 Years | 160 (34.9%) | 263 (57.4%) |
| 25 to 34 Years | 78 (9.8%) | 639 (80.5%) |
| 35 to 44 Years | 250 (22.4%) | 850 (76.0%) |
| 45 to 54 Years | 162 (33.5%) | 348 (72.1%) |
| 55 to 64 Years | 245 (24.3%) | 688 (68.3%) |
| 65 to 74 Years | 542 (100.0%) | 446 (82.3%) |
| 75 Years and over | 303 (100.0%) | 177 (58.4%) |
| Total | 2,276 (35.1%) | 4,826 (74.5%) |
Disability Status by Sex by Age in Brookhaven
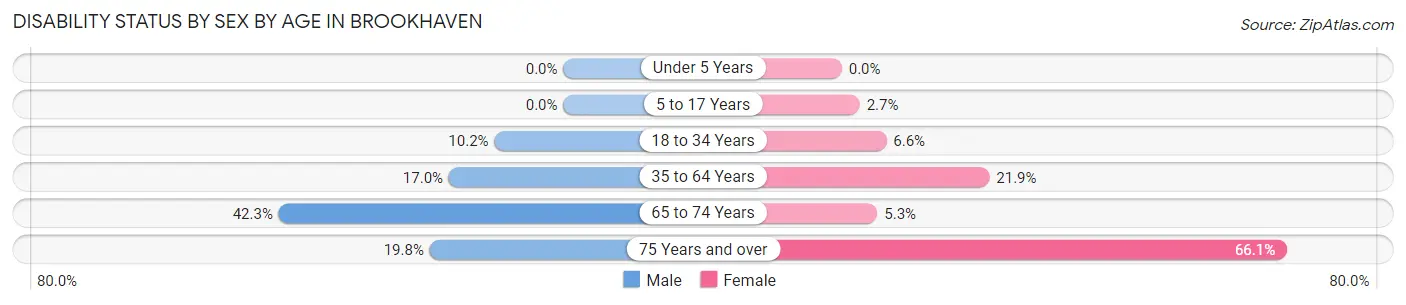
| Age Bracket | Male | Female |
| Under 5 Years | 0 (0.0%) | 0 (0.0%) |
| 5 to 17 Years | 0 (0.0%) | 13 (2.7%) |
| 18 to 34 Years | 74 (10.2%) | 41 (6.6%) |
| 35 to 64 Years | 233 (17.0%) | 271 (21.9%) |
| 65 to 74 Years | 101 (42.3%) | 16 (5.3%) |
| 75 Years and over | 25 (19.8%) | 117 (66.1%) |
Disability Class by Sex by Age in Brookhaven
Disability Class: Hearing Difficulty
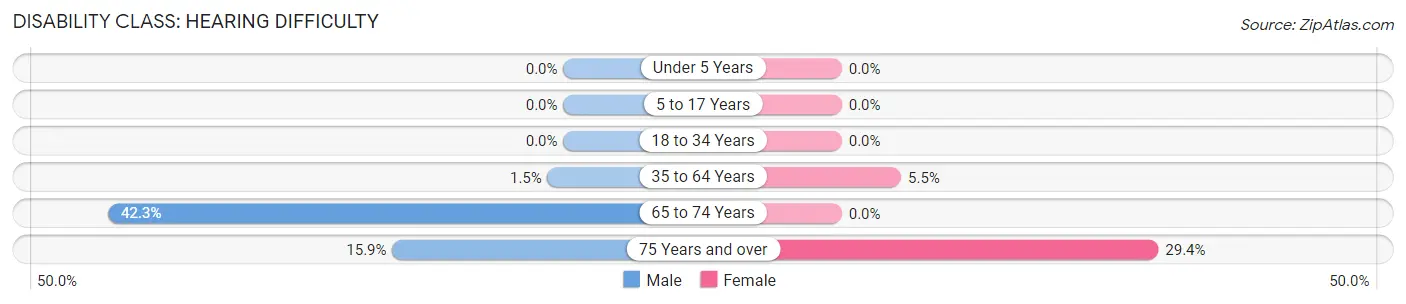
| Age Bracket | Male | Female |
| Under 5 Years | 0 (0.0%) | 0 (0.0%) |
| 5 to 17 Years | 0 (0.0%) | 0 (0.0%) |
| 18 to 34 Years | 0 (0.0%) | 0 (0.0%) |
| 35 to 64 Years | 20 (1.5%) | 68 (5.5%) |
| 65 to 74 Years | 101 (42.3%) | 0 (0.0%) |
| 75 Years and over | 20 (15.9%) | 52 (29.4%) |
Disability Class: Vision Difficulty
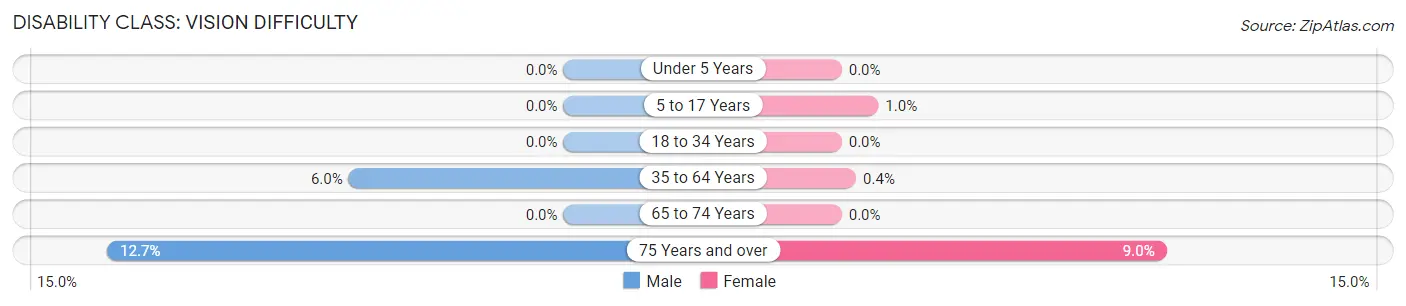
| Age Bracket | Male | Female |
| Under 5 Years | 0 (0.0%) | 0 (0.0%) |
| 5 to 17 Years | 0 (0.0%) | 5 (1.0%) |
| 18 to 34 Years | 0 (0.0%) | 0 (0.0%) |
| 35 to 64 Years | 82 (6.0%) | 5 (0.4%) |
| 65 to 74 Years | 0 (0.0%) | 0 (0.0%) |
| 75 Years and over | 16 (12.7%) | 16 (9.0%) |
Disability Class: Cognitive Difficulty
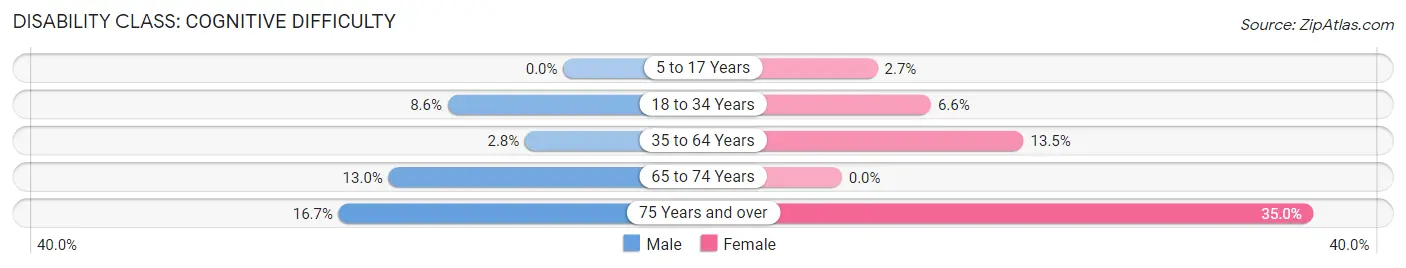
| Age Bracket | Male | Female |
| 5 to 17 Years | 0 (0.0%) | 13 (2.7%) |
| 18 to 34 Years | 62 (8.6%) | 41 (6.6%) |
| 35 to 64 Years | 39 (2.8%) | 167 (13.5%) |
| 65 to 74 Years | 31 (13.0%) | 0 (0.0%) |
| 75 Years and over | 21 (16.7%) | 62 (35.0%) |
Disability Class: Ambulatory Difficulty
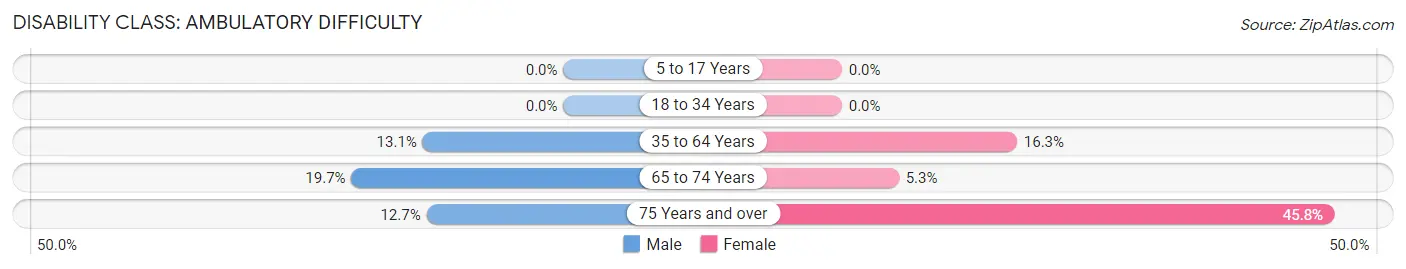
| Age Bracket | Male | Female |
| 5 to 17 Years | 0 (0.0%) | 0 (0.0%) |
| 18 to 34 Years | 0 (0.0%) | 0 (0.0%) |
| 35 to 64 Years | 179 (13.1%) | 201 (16.3%) |
| 65 to 74 Years | 47 (19.7%) | 16 (5.3%) |
| 75 Years and over | 16 (12.7%) | 81 (45.8%) |
Disability Class: Self-Care Difficulty
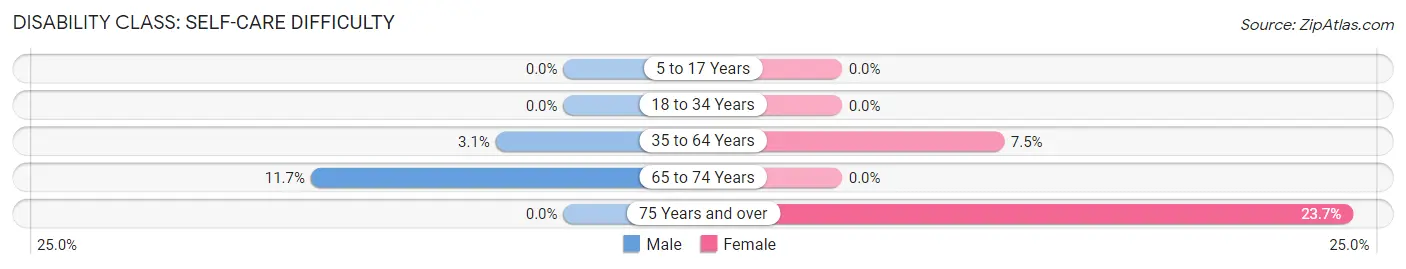
| Age Bracket | Male | Female |
| 5 to 17 Years | 0 (0.0%) | 0 (0.0%) |
| 18 to 34 Years | 0 (0.0%) | 0 (0.0%) |
| 35 to 64 Years | 43 (3.1%) | 93 (7.5%) |
| 65 to 74 Years | 28 (11.7%) | 0 (0.0%) |
| 75 Years and over | 0 (0.0%) | 42 (23.7%) |
Technology Access in Brookhaven
Computing Device Access in Brookhaven
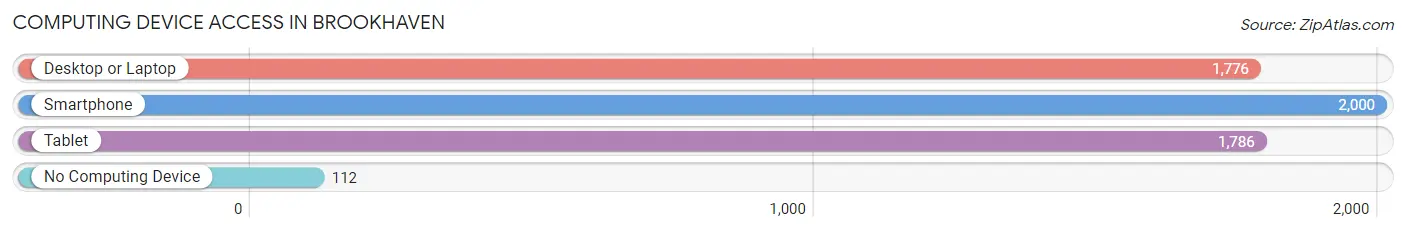
| Device Type | # Households | % Households |
| Desktop or Laptop | 1,776 | 75.8% |
| Smartphone | 2,000 | 85.4% |
| Tablet | 1,786 | 76.2% |
| No Computing Device | 112 | 4.8% |
| Total | 2,343 | 100.0% |
Internet Access in Brookhaven
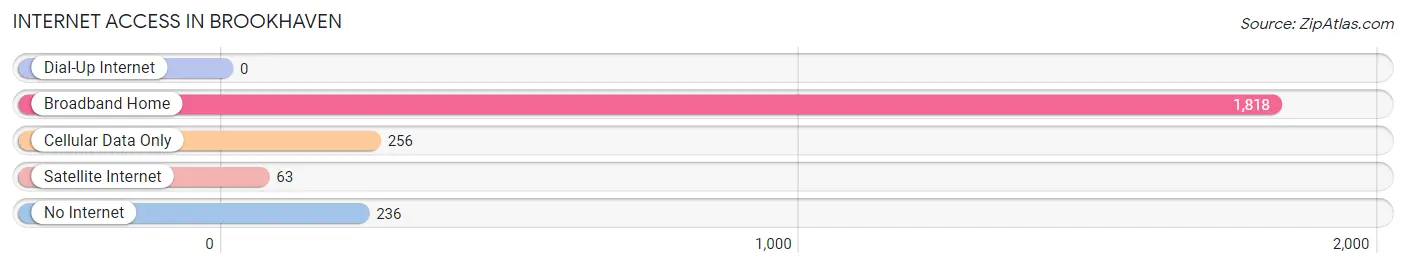
| Internet Type | # Households | % Households |
| Dial-Up Internet | 0 | 0.0% |
| Broadband Home | 1,818 | 77.6% |
| Cellular Data Only | 256 | 10.9% |
| Satellite Internet | 63 | 2.7% |
| No Internet | 236 | 10.1% |
| Total | 2,343 | 100.0% |
Brookhaven Summary
History
The town of Brookhaven, West Virginia is located in the northern part of the state in Brooke County. It was founded in 1817 and was originally known as “Hog Town” due to the large number of hogs that were raised in the area. The town was renamed Brookhaven in 1820 and was incorporated in 1836.
The town was originally a farming community and was home to many small businesses. In the late 19th century, the town began to grow and develop as a result of the coal mining industry. The coal industry brought many new jobs to the area and helped to spur economic growth.
The town was also home to a number of churches, including the First Presbyterian Church, which was founded in 1820. The church was a major part of the community and served as a place of worship for many of the town’s residents.
Geography
Brookhaven is located in the northern part of West Virginia in Brooke County. It is situated on the Ohio River and is bordered by the states of Ohio and Pennsylvania. The town is located in the Appalachian Mountains and is surrounded by rolling hills and forests.
The town has a total area of 1.2 square miles and has a population of approximately 1,500 people. The town is located at an elevation of 890 feet above sea level.
Economy
The economy of Brookhaven is largely based on the coal mining industry. The town is home to several coal mines and is a major producer of coal in the state. The coal industry has been a major source of employment for the town’s residents for many years.
In addition to the coal industry, the town is also home to several small businesses, including restaurants, retail stores, and other services. The town is also home to a number of manufacturing companies, including a steel mill and a paper mill.
Demographics
As of the 2010 census, the population of Brookhaven was 1,500 people. The town has a median household income of $35,000 and a median family income of $41,000. The town has a poverty rate of 16.7%.
The town is predominantly white, with 95.3% of the population being white. The town also has a small African American population, with 4.7% of the population being African American. The town also has a small Hispanic population, with 0.3% of the population being Hispanic.
Conclusion
Brookhaven, West Virginia is a small town located in the northern part of the state in Brooke County. The town was founded in 1817 and was originally known as “Hog Town” due to the large number of hogs that were raised in the area. The town was renamed Brookhaven in 1820 and was incorporated in 1836. The town is largely based on the coal mining industry and is home to several small businesses. The town has a population of approximately 1,500 people and has a median household income of $35,000. The town is predominantly white, with 95.3% of the population being white.
Common Questions
What is Per Capita Income in Brookhaven?
Per Capita income in Brookhaven is $34,307.
What is the Median Family Income in Brookhaven?
Median Family Income in Brookhaven is $83,300.
What is the Median Household income in Brookhaven?
Median Household Income in Brookhaven is $70,179.
What is Income or Wage Gap in Brookhaven?
Income or Wage Gap in Brookhaven is 16.4%.
Women in Brookhaven earn 83.6 cents for every dollar earned by a man.
What is Family Income Deficit in Brookhaven?
Family Income Deficit in Brookhaven is $9,742.
Families that are below poverty line in Brookhaven earn $9,742 less on average than the poverty threshold level.
What is Inequality or Gini Index in Brookhaven?
Inequality or Gini Index in Brookhaven is 0.40.
What is the Total Population of Brookhaven?
Total Population of Brookhaven is 6,485.
What is the Total Male Population of Brookhaven?
Total Male Population of Brookhaven is 3,237.
What is the Total Female Population of Brookhaven?
Total Female Population of Brookhaven is 3,248.
What is the Ratio of Males per 100 Females in Brookhaven?
There are 99.66 Males per 100 Females in Brookhaven.
What is the Ratio of Females per 100 Males in Brookhaven?
There are 100.34 Females per 100 Males in Brookhaven.
What is the Median Population Age in Brookhaven?
Median Population Age in Brookhaven is 37.2 Years.
What is the Average Family Size in Brookhaven
Average Family Size in Brookhaven is 3.1 People.
What is the Average Household Size in Brookhaven
Average Household Size in Brookhaven is 2.8 People.
How Large is the Labor Force in Brookhaven?
There are 3,239 People in the Labor Forcein in Brookhaven.
What is the Percentage of People in the Labor Force in Brookhaven?
65.2% of People are in the Labor Force in Brookhaven.
What is the Unemployment Rate in Brookhaven?
Unemployment Rate in Brookhaven is 7.8%.