Shenandoah Junction, WV Map & Demographics
Shenandoah Junction Map
Shenandoah Junction Overview
$36,797
PER CAPITA INCOME
$102,552
AVG HOUSEHOLD INCOME
45.3%
WAGE / INCOME GAP [ % ]
54.7¢/ $1
WAGE / INCOME GAP [ $ ]
0.43
INEQUALITY / GINI INDEX
1,205
TOTAL POPULATION
698
MALE POPULATION
507
FEMALE POPULATION
137.67
MALES / 100 FEMALES
72.64
FEMALES / 100 MALES
31.2
MEDIAN AGE
4.5
AVG FAMILY SIZE
4.0
AVG HOUSEHOLD SIZE
695
LABOR FORCE [ PEOPLE ]
83.8%
PERCENT IN LABOR FORCE
Shenandoah Junction Zip Codes
Shenandoah Junction Area Codes
Income in Shenandoah Junction
Income Overview in Shenandoah Junction
| Characteristic | Number | Measure |
| Per Capita Income | 1,205 | $36,797 |
| Median Family Income | 223 | $0 |
| Mean Family Income | 223 | $186,102 |
| Median Household Income | 303 | $102,552 |
| Mean Household Income | 303 | $168,972 |
| Income Deficit | 223 | $0 |
| Wage / Income Gap (%) | 1,205 | 45.29% |
| Wage / Income Gap ($) | 1,205 | 54.71¢ per $1 |
| Gini / Inequality Index | 1,205 | 0.43 |
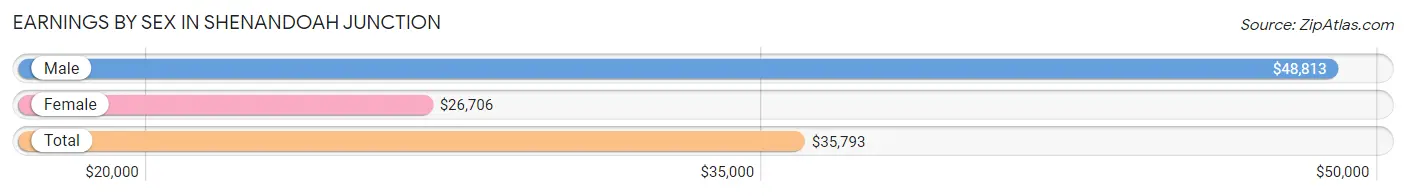
Earnings by Sex in Shenandoah Junction
Average Earnings in Shenandoah Junction are $35,793, $48,813 for men and $26,706 for women, a difference of 45.3%.
| Sex | Number | Average Earnings |
| Male | 390 (53.9%) | $48,813 |
| Female | 333 (46.1%) | $26,706 |
| Total | 723 (100.0%) | $35,793 |
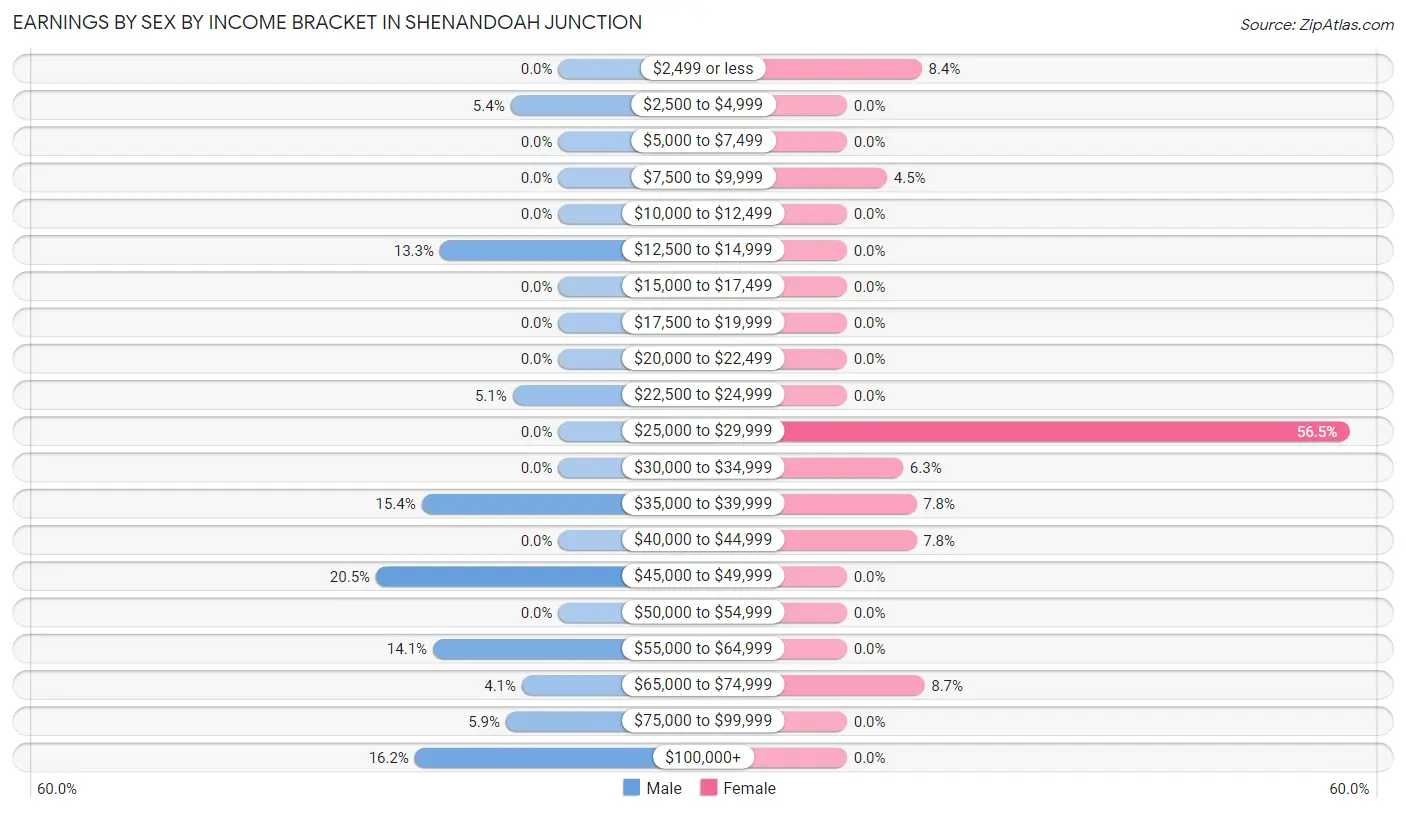
Earnings by Sex by Income Bracket in Shenandoah Junction
The most common earnings brackets in Shenandoah Junction are $45,000 to $49,999 for men (80 | 20.5%) and $25,000 to $29,999 for women (188 | 56.5%).
| Income | Male | Female |
| $2,499 or less | 0 (0.0%) | 28 (8.4%) |
| $2,500 to $4,999 | 21 (5.4%) | 0 (0.0%) |
| $5,000 to $7,499 | 0 (0.0%) | 0 (0.0%) |
| $7,500 to $9,999 | 0 (0.0%) | 15 (4.5%) |
| $10,000 to $12,499 | 0 (0.0%) | 0 (0.0%) |
| $12,500 to $14,999 | 52 (13.3%) | 0 (0.0%) |
| $15,000 to $17,499 | 0 (0.0%) | 0 (0.0%) |
| $17,500 to $19,999 | 0 (0.0%) | 0 (0.0%) |
| $20,000 to $22,499 | 0 (0.0%) | 0 (0.0%) |
| $22,500 to $24,999 | 20 (5.1%) | 0 (0.0%) |
| $25,000 to $29,999 | 0 (0.0%) | 188 (56.5%) |
| $30,000 to $34,999 | 0 (0.0%) | 21 (6.3%) |
| $35,000 to $39,999 | 60 (15.4%) | 26 (7.8%) |
| $40,000 to $44,999 | 0 (0.0%) | 26 (7.8%) |
| $45,000 to $49,999 | 80 (20.5%) | 0 (0.0%) |
| $50,000 to $54,999 | 0 (0.0%) | 0 (0.0%) |
| $55,000 to $64,999 | 55 (14.1%) | 0 (0.0%) |
| $65,000 to $74,999 | 16 (4.1%) | 29 (8.7%) |
| $75,000 to $99,999 | 23 (5.9%) | 0 (0.0%) |
| $100,000+ | 63 (16.2%) | 0 (0.0%) |
| Total | 390 (100.0%) | 333 (100.0%) |
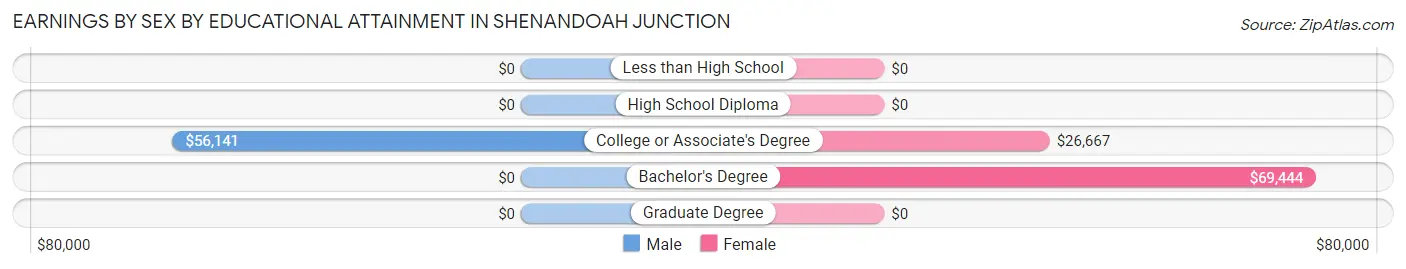
Earnings by Sex by Educational Attainment in Shenandoah Junction
Average earnings in Shenandoah Junction are $49,953 for men and $26,720 for women, a difference of 46.5%. Men with an educational attainment of college or associate's degree enjoy the highest average annual earnings of $56,141, while those with college or associate's degree education earn the least with $56,141. Women with an educational attainment of bachelor's degree earn the most with the average annual earnings of $69,444, while those with college or associate's degree education have the smallest earnings of $26,667.
| Educational Attainment | Male Income | Female Income |
| Less than High School | - | - |
| High School Diploma | - | - |
| College or Associate's Degree | $56,141 | $26,667 |
| Bachelor's Degree | - | - |
| Graduate Degree | - | - |
| Total | $49,953 | $26,720 |
Family Income in Shenandoah Junction
Family Income Brackets in Shenandoah Junction
According to the Shenandoah Junction family income data, there are 109 families falling into the $200,000+ income range, which is the most common income bracket and makes up 48.9% of all families.
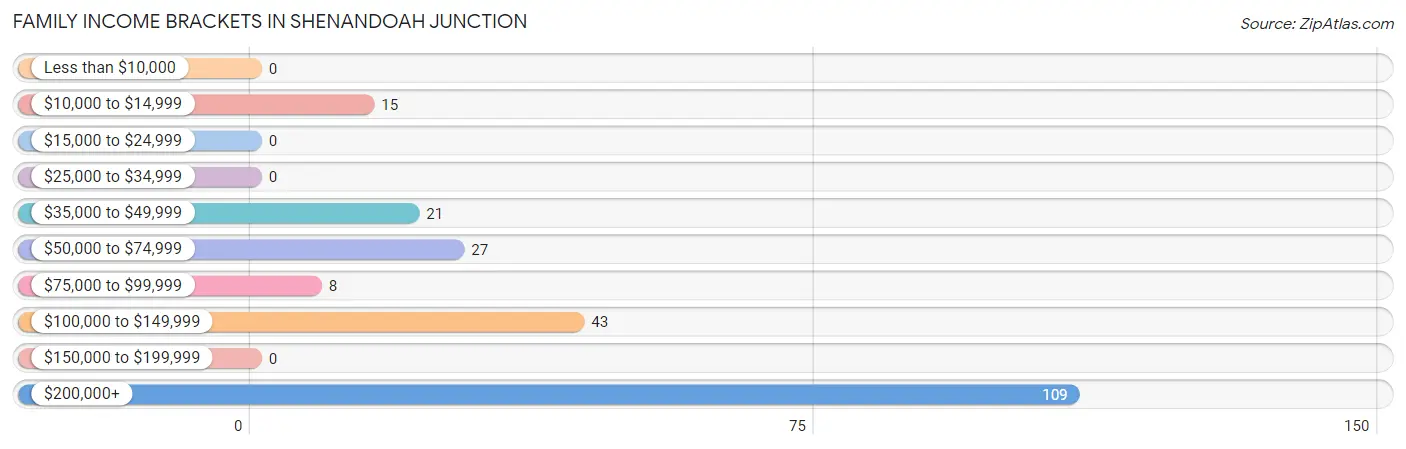
| Income Bracket | # Families | % Families |
| Less than $10,000 | 0 | 0.0% |
| $10,000 to $14,999 | 15 | 6.7% |
| $15,000 to $24,999 | 0 | 0.0% |
| $25,000 to $34,999 | 0 | 0.0% |
| $35,000 to $49,999 | 21 | 9.4% |
| $50,000 to $74,999 | 27 | 12.1% |
| $75,000 to $99,999 | 8 | 3.6% |
| $100,000 to $149,999 | 43 | 19.3% |
| $150,000 to $199,999 | 0 | 0.0% |
| $200,000+ | 109 | 48.9% |
Family Income by Famaliy Size in Shenandoah Junction
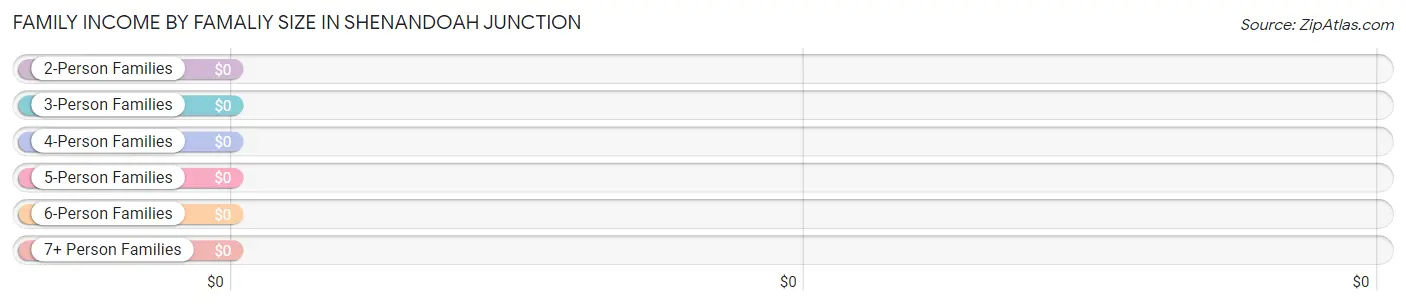
| Income Bracket | # Families | Median Income |
| 2-Person Families | 51 (22.9%) | $0 |
| 3-Person Families | 47 (21.1%) | $0 |
| 4-Person Families | 21 (9.4%) | $0 |
| 5-Person Families | 0 (0.0%) | $0 |
| 6-Person Families | 84 (37.7%) | $0 |
| 7+ Person Families | 20 (9.0%) | $0 |
| Total | 223 (100.0%) | $0 |
Family Income by Number of Earners in Shenandoah Junction
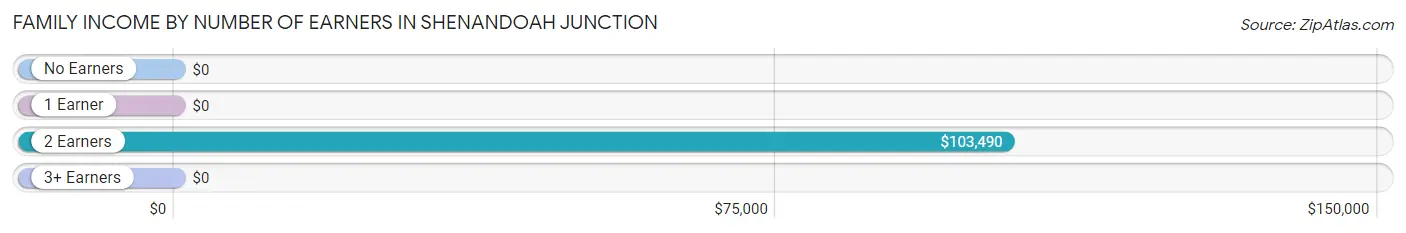
| Number of Earners | # Families | Median Income |
| No Earners | 0 (0.0%) | $0 |
| 1 Earner | 42 (18.8%) | $0 |
| 2 Earners | 77 (34.5%) | $103,490 |
| 3+ Earners | 104 (46.6%) | $0 |
| Total | 223 (100.0%) | $0 |
Household Income in Shenandoah Junction
Household Income Brackets in Shenandoah Junction
With 109 households falling in the category, the $200,000+ income range is the most frequent in Shenandoah Junction, accounting for 36.0% of all households.
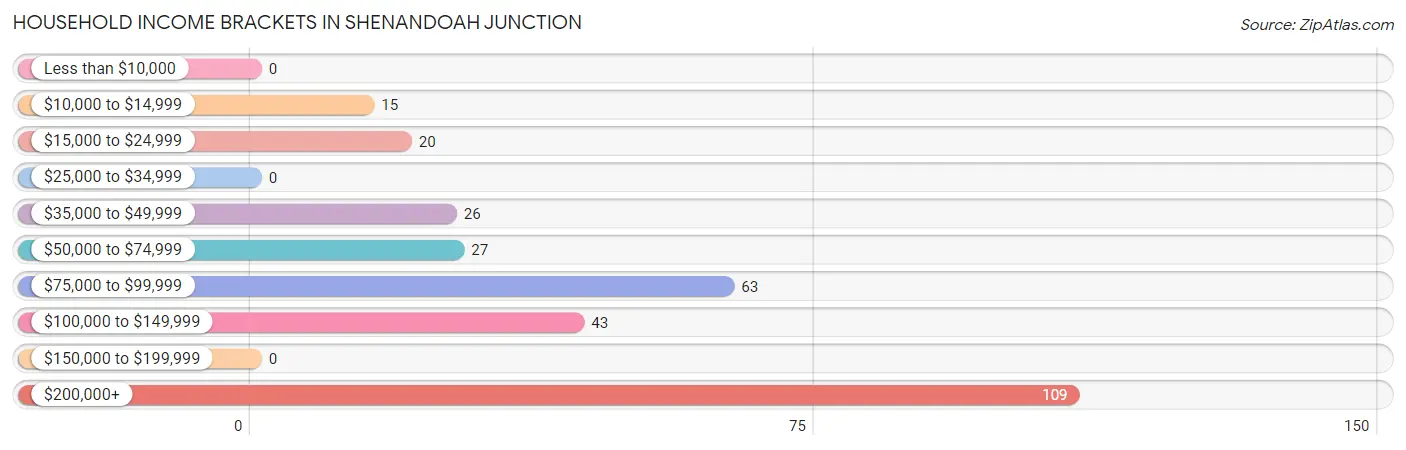
| Income Bracket | # Households | % Households |
| Less than $10,000 | 0 | 0.0% |
| $10,000 to $14,999 | 15 | 5.0% |
| $15,000 to $24,999 | 20 | 6.6% |
| $25,000 to $34,999 | 0 | 0.0% |
| $35,000 to $49,999 | 26 | 8.6% |
| $50,000 to $74,999 | 27 | 8.9% |
| $75,000 to $99,999 | 63 | 20.8% |
| $100,000 to $149,999 | 43 | 14.2% |
| $150,000 to $199,999 | 0 | 0.0% |
| $200,000+ | 109 | 36.0% |
Household Income by Householder Age in Shenandoah Junction
The median household income in Shenandoah Junction is $102,552, with the highest median household income of $250,001 found in the 45 to 64 years age bracket for the primary householder. A total of 159 households (52.5%) fall into this category.
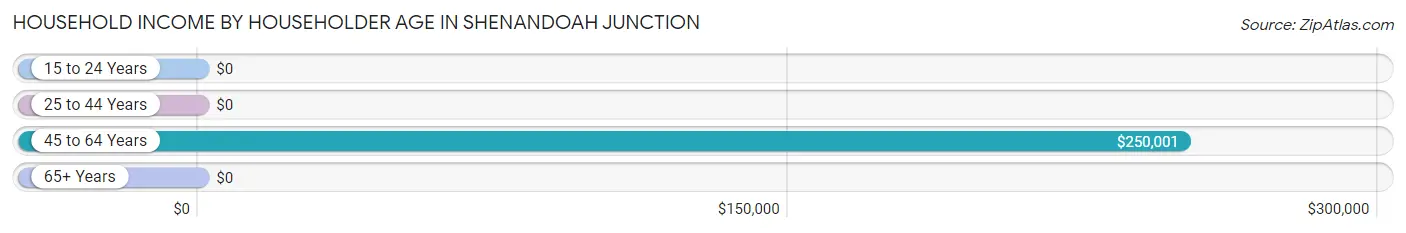
| Income Bracket | # Households | Median Income |
| 15 to 24 Years | 0 (0.0%) | $0 |
| 25 to 44 Years | 90 (29.7%) | $0 |
| 45 to 64 Years | 159 (52.5%) | $250,001 |
| 65+ Years | 54 (17.8%) | $0 |
| Total | 303 (100.0%) | $102,552 |
Poverty in Shenandoah Junction
Income Below Poverty by Sex and Age in Shenandoah Junction
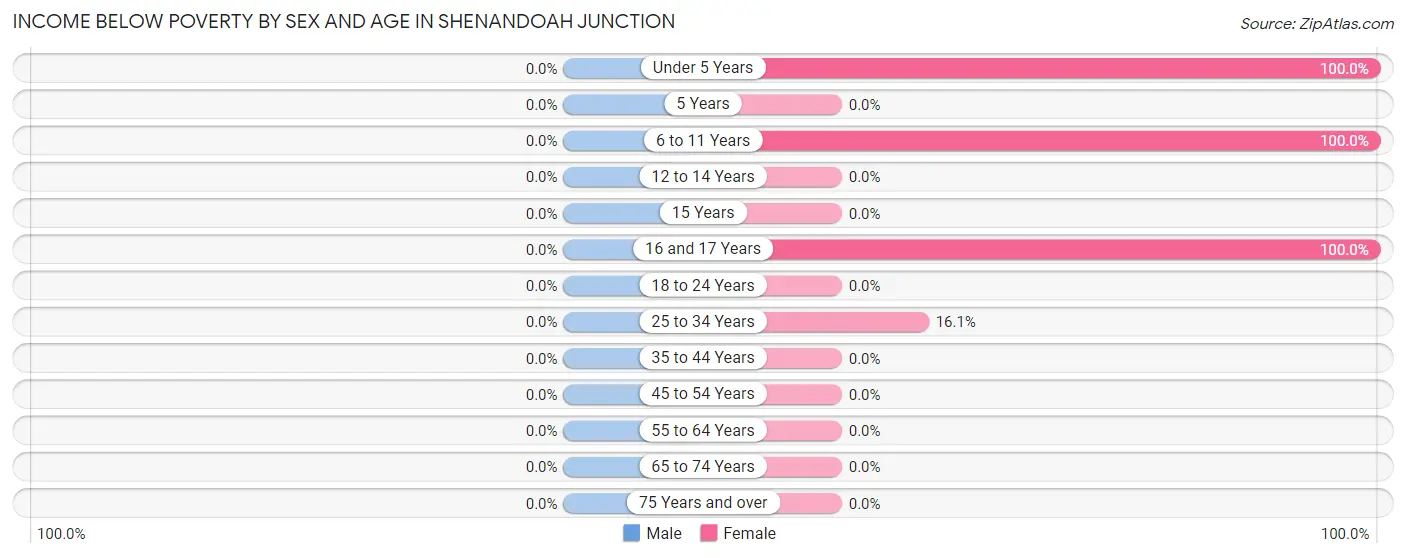
| Age Bracket | Male | Female |
| Under 5 Years | 0 (0.0%) | 15 (100.0%) |
| 5 Years | 0 (0.0%) | 0 (0.0%) |
| 6 to 11 Years | 0 (0.0%) | 12 (100.0%) |
| 12 to 14 Years | 0 (0.0%) | 0 (0.0%) |
| 15 Years | 0 (0.0%) | 0 (0.0%) |
| 16 and 17 Years | 0 (0.0%) | 19 (100.0%) |
| 18 to 24 Years | 0 (0.0%) | 0 (0.0%) |
| 25 to 34 Years | 0 (0.0%) | 15 (16.1%) |
| 35 to 44 Years | 0 (0.0%) | 0 (0.0%) |
| 45 to 54 Years | 0 (0.0%) | 0 (0.0%) |
| 55 to 64 Years | 0 (0.0%) | 0 (0.0%) |
| 65 to 74 Years | 0 (0.0%) | 0 (0.0%) |
| 75 Years and over | 0 (0.0%) | 0 (0.0%) |
| Total | 0 (0.0%) | 61 (12.0%) |
Income Above Poverty by Sex and Age in Shenandoah Junction
According to the poverty statistics in Shenandoah Junction, males aged under 5 years and females aged 5 years are the age groups that are most secure financially, with 100.0% of males and 100.0% of females in these age groups living above the poverty line.
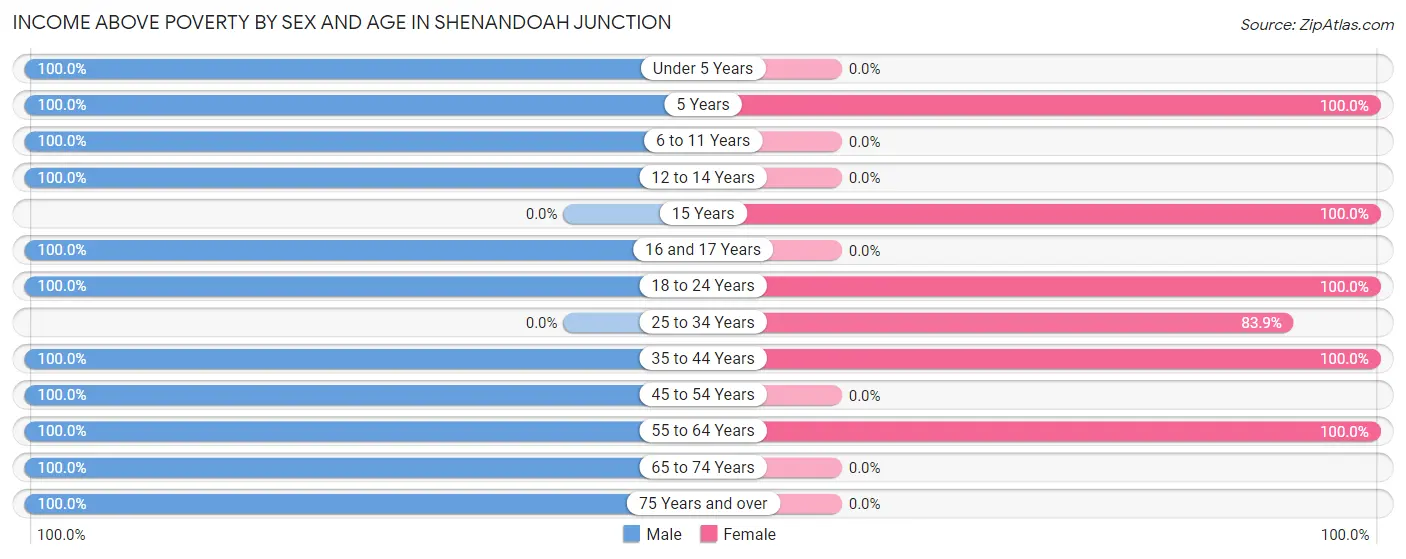
| Age Bracket | Male | Female |
| Under 5 Years | 19 (100.0%) | 0 (0.0%) |
| 5 Years | 164 (100.0%) | 91 (100.0%) |
| 6 to 11 Years | 19 (100.0%) | 0 (0.0%) |
| 12 to 14 Years | 19 (100.0%) | 0 (0.0%) |
| 15 Years | 0 (0.0%) | 37 (100.0%) |
| 16 and 17 Years | 42 (100.0%) | 0 (0.0%) |
| 18 to 24 Years | 91 (100.0%) | 54 (100.0%) |
| 25 to 34 Years | 0 (0.0%) | 78 (83.9%) |
| 35 to 44 Years | 80 (100.0%) | 74 (100.0%) |
| 45 to 54 Years | 24 (100.0%) | 0 (0.0%) |
| 55 to 64 Years | 112 (100.0%) | 112 (100.0%) |
| 65 to 74 Years | 74 (100.0%) | 0 (0.0%) |
| 75 Years and over | 54 (100.0%) | 0 (0.0%) |
| Total | 698 (100.0%) | 446 (88.0%) |
Income Below Poverty Among Married-Couple Families in Shenandoah Junction
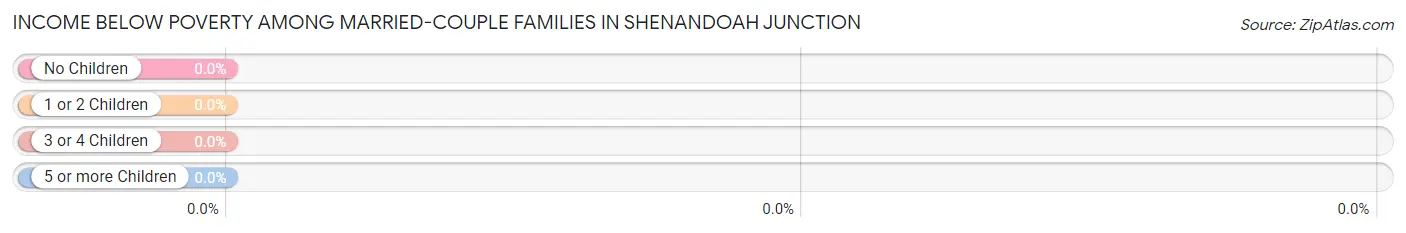
| Children | Above Poverty | Below Poverty |
| No Children | 56 (100.0%) | 0 (0.0%) |
| 1 or 2 Children | 84 (100.0%) | 0 (0.0%) |
| 3 or 4 Children | 20 (100.0%) | 0 (0.0%) |
| 5 or more Children | 0 (0.0%) | 0 (0.0%) |
| Total | 160 (100.0%) | 0 (0.0%) |
Income Below Poverty Among Single-Parent Households in Shenandoah Junction
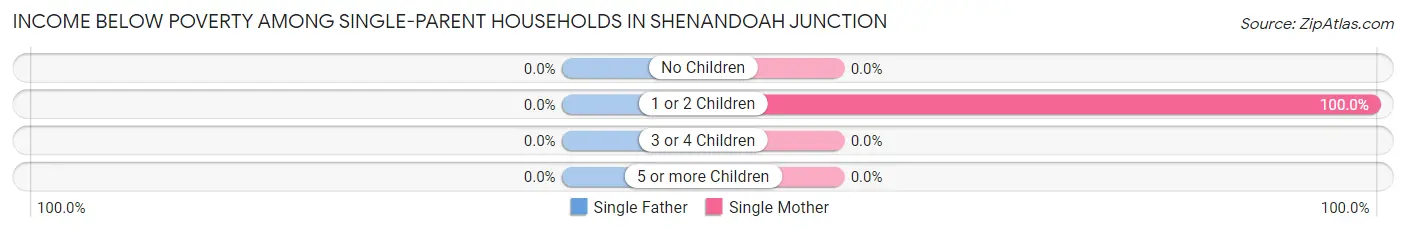
| Children | Single Father | Single Mother |
| No Children | 0 (0.0%) | 0 (0.0%) |
| 1 or 2 Children | 0 (0.0%) | 15 (100.0%) |
| 3 or 4 Children | 0 (0.0%) | 0 (0.0%) |
| 5 or more Children | 0 (0.0%) | 0 (0.0%) |
| Total | 0 (0.0%) | 15 (41.7%) |
Income Below Poverty Among Married-Couple vs Single-Parent Households in Shenandoah Junction
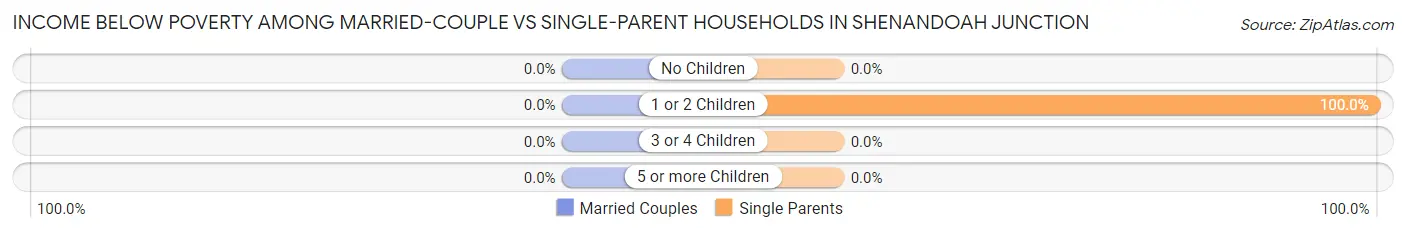
| Children | Married-Couple Families | Single-Parent Households |
| No Children | 0 (0.0%) | 0 (0.0%) |
| 1 or 2 Children | 0 (0.0%) | 15 (100.0%) |
| 3 or 4 Children | 0 (0.0%) | 0 (0.0%) |
| 5 or more Children | 0 (0.0%) | 0 (0.0%) |
| Total | 0 (0.0%) | 15 (23.8%) |
Race in Shenandoah Junction
The most populous races in Shenandoah Junction are White / Caucasian (1,116 | 92.6%), Hispanic or Latino (111 | 9.2%), and Two or more Races (53 | 4.4%).
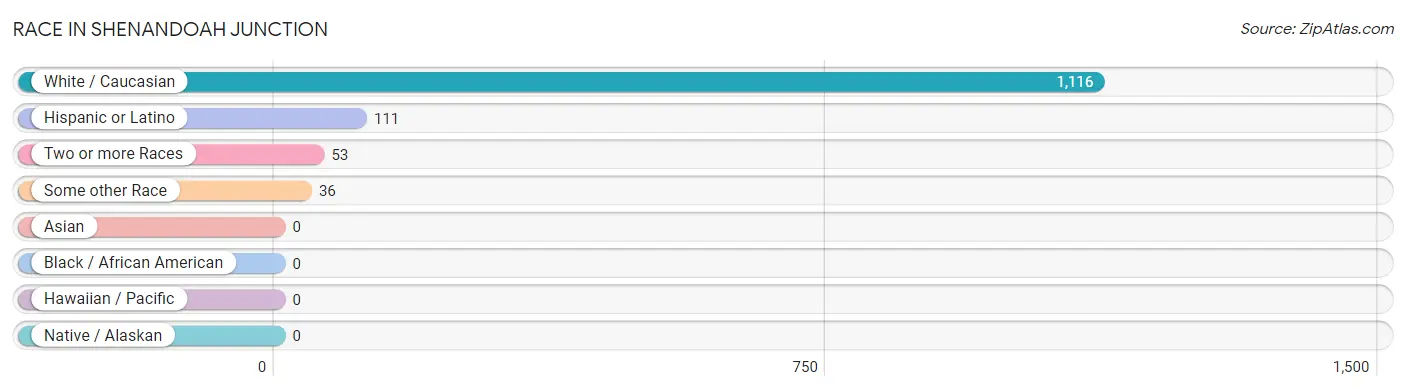
| Race | # Population | % Population |
| Asian | 0 | 0.0% |
| Black / African American | 0 | 0.0% |
| Hawaiian / Pacific | 0 | 0.0% |
| Hispanic or Latino | 111 | 9.2% |
| Native / Alaskan | 0 | 0.0% |
| White / Caucasian | 1,116 | 92.6% |
| Two or more Races | 53 | 4.4% |
| Some other Race | 36 | 3.0% |
| Total | 1,205 | 100.0% |
Ancestry in Shenandoah Junction
The most populous ancestries reported in Shenandoah Junction are Italian (469 | 38.9%), Irish (443 | 36.8%), German (116 | 9.6%), Mexican (102 | 8.5%), and English (79 | 6.6%), together accounting for 100.3% of all Shenandoah Junction residents.
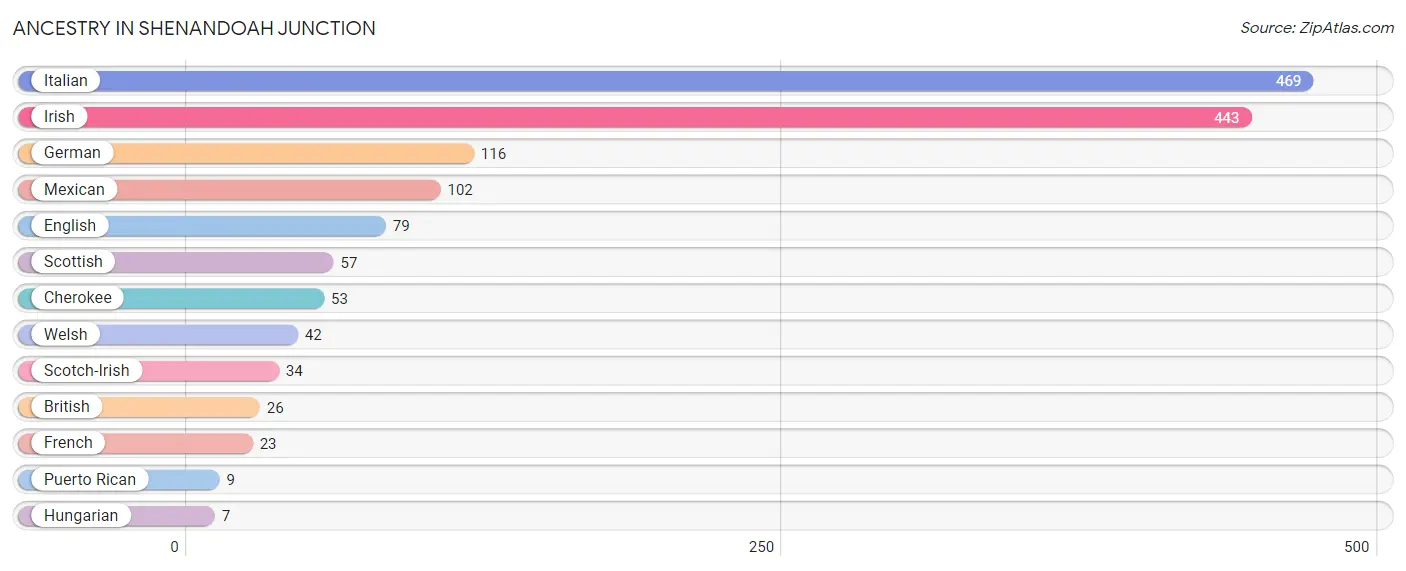
| Ancestry | # Population | % Population |
| British | 26 | 2.2% |
| Cherokee | 53 | 4.4% |
| English | 79 | 6.6% |
| French | 23 | 1.9% |
| German | 116 | 9.6% |
| Hungarian | 7 | 0.6% |
| Irish | 443 | 36.8% |
| Italian | 469 | 38.9% |
| Mexican | 102 | 8.5% |
| Puerto Rican | 9 | 0.7% |
| Scotch-Irish | 34 | 2.8% |
| Scottish | 57 | 4.7% |
| Welsh | 42 | 3.5% | View All 13 Rows |
Immigrants in Shenandoah Junction
The most numerous immigrant groups reported in Shenandoah Junction came from Europe (23 | 1.9%), Germany (23 | 1.9%), Western Europe (23 | 1.9%), Central America (20 | 1.7%), and Latin America (20 | 1.7%), together accounting for 9.0% of all Shenandoah Junction residents.
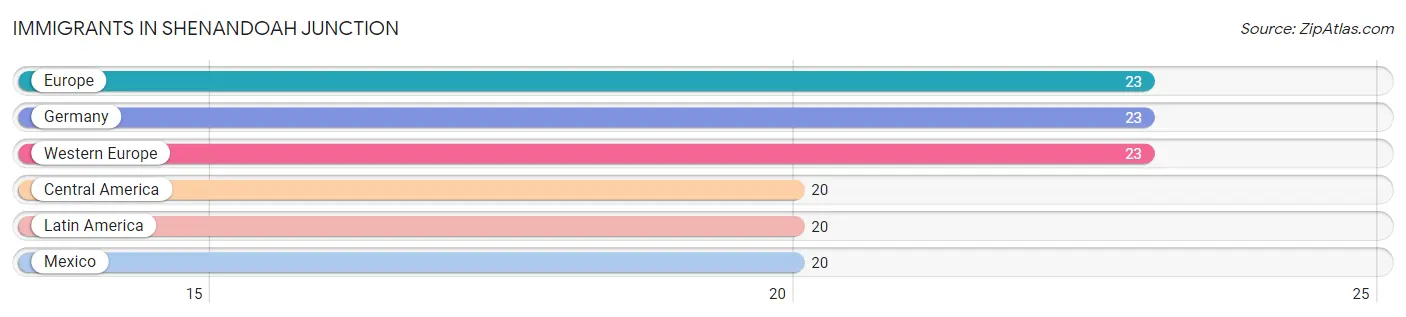
| Immigration Origin | # Population | % Population |
| Central America | 20 | 1.7% |
| Europe | 23 | 1.9% |
| Germany | 23 | 1.9% |
| Latin America | 20 | 1.7% |
| Mexico | 20 | 1.7% |
| Western Europe | 23 | 1.9% | View All 6 Rows |
Sex and Age in Shenandoah Junction
Sex and Age in Shenandoah Junction
The most populous age groups in Shenandoah Junction are 5 to 9 Years (183 | 26.2%) for men and 5 to 9 Years (103 | 20.3%) for women.
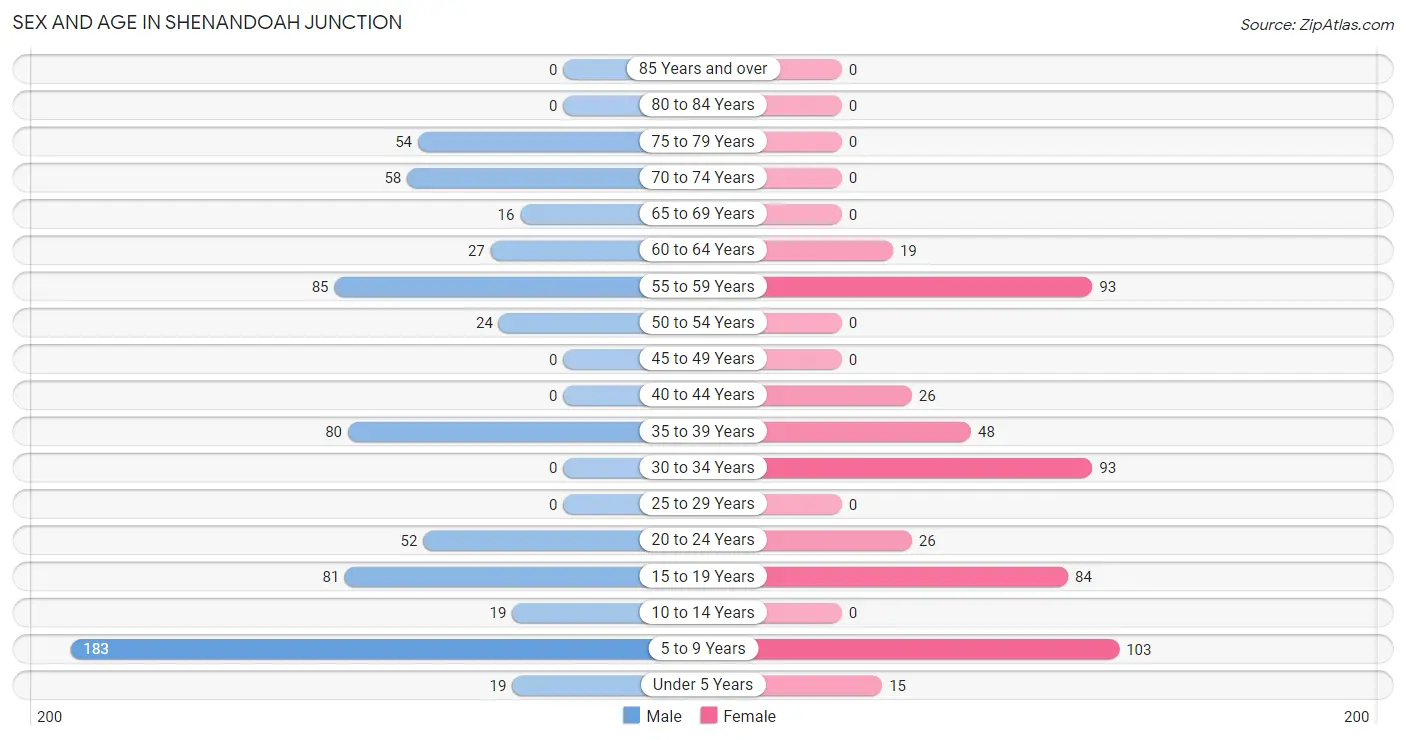
| Age Bracket | Male | Female |
| Under 5 Years | 19 (2.7%) | 15 (3.0%) |
| 5 to 9 Years | 183 (26.2%) | 103 (20.3%) |
| 10 to 14 Years | 19 (2.7%) | 0 (0.0%) |
| 15 to 19 Years | 81 (11.6%) | 84 (16.6%) |
| 20 to 24 Years | 52 (7.4%) | 26 (5.1%) |
| 25 to 29 Years | 0 (0.0%) | 0 (0.0%) |
| 30 to 34 Years | 0 (0.0%) | 93 (18.3%) |
| 35 to 39 Years | 80 (11.5%) | 48 (9.5%) |
| 40 to 44 Years | 0 (0.0%) | 26 (5.1%) |
| 45 to 49 Years | 0 (0.0%) | 0 (0.0%) |
| 50 to 54 Years | 24 (3.4%) | 0 (0.0%) |
| 55 to 59 Years | 85 (12.2%) | 93 (18.3%) |
| 60 to 64 Years | 27 (3.9%) | 19 (3.7%) |
| 65 to 69 Years | 16 (2.3%) | 0 (0.0%) |
| 70 to 74 Years | 58 (8.3%) | 0 (0.0%) |
| 75 to 79 Years | 54 (7.7%) | 0 (0.0%) |
| 80 to 84 Years | 0 (0.0%) | 0 (0.0%) |
| 85 Years and over | 0 (0.0%) | 0 (0.0%) |
| Total | 698 (100.0%) | 507 (100.0%) |
Families and Households in Shenandoah Junction
Median Family Size in Shenandoah Junction
The median family size in Shenandoah Junction is 4.50 persons per family, with married-couple families (160 | 71.8%) accounting for the largest median family size of 5.18 persons per family. On the other hand, single male/father families (27 | 12.1%) represent the smallest median family size with 1.96 persons per family.
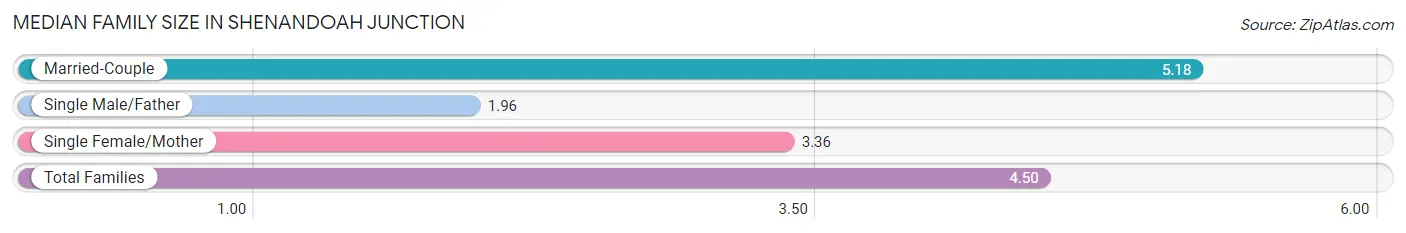
| Family Type | # Families | Family Size |
| Married-Couple | 160 (71.8%) | 5.18 |
| Single Male/Father | 27 (12.1%) | 1.96 |
| Single Female/Mother | 36 (16.1%) | 3.36 |
| Total Families | 223 (100.0%) | 4.50 |
Median Household Size in Shenandoah Junction
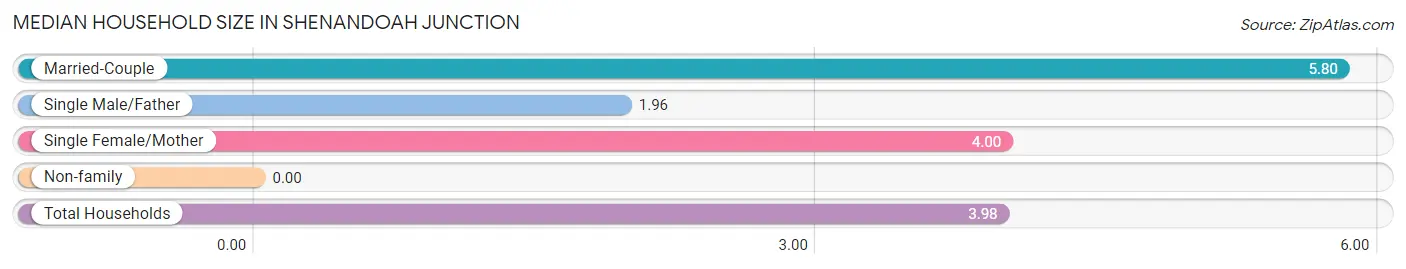
| Household Type | # Households | Household Size |
| Married-Couple | 160 (52.8%) | 5.80 |
| Single Male/Father | 27 (8.9%) | 1.96 |
| Single Female/Mother | 36 (11.9%) | 4.00 |
| Non-family | 80 (26.4%) | - |
| Total Households | 303 (100.0%) | 3.98 |
Household Size by Marriage Status in Shenandoah Junction
Out of a total of 303 households in Shenandoah Junction, 223 (73.6%) are family households, while 80 (26.4%) are nonfamily households. The most numerous type of family households are 7+ person households, comprising 104, and the most common type of nonfamily households are 1-person households, comprising 80.
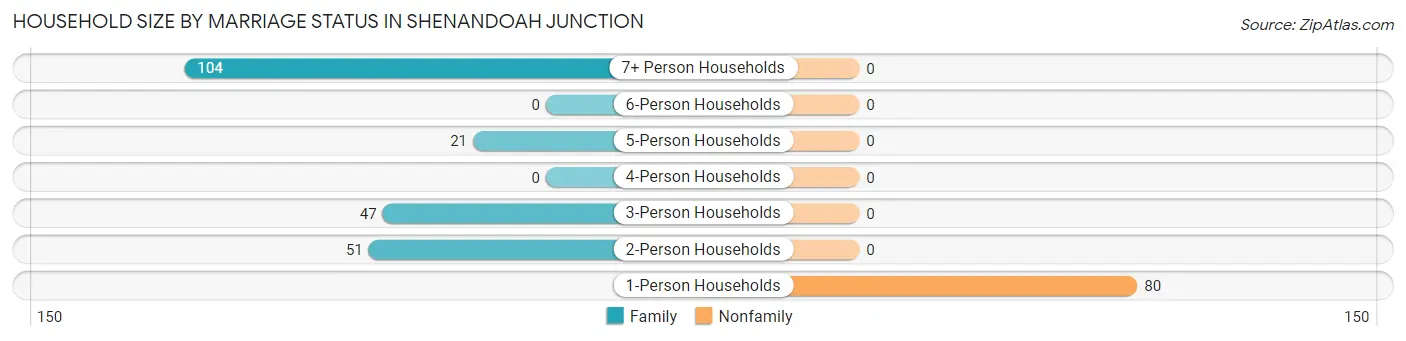
| Household Size | Family Households | Nonfamily Households |
| 1-Person Households | - | 80 (26.4%) |
| 2-Person Households | 51 (16.8%) | 0 (0.0%) |
| 3-Person Households | 47 (15.5%) | 0 (0.0%) |
| 4-Person Households | 0 (0.0%) | 0 (0.0%) |
| 5-Person Households | 21 (6.9%) | 0 (0.0%) |
| 6-Person Households | 0 (0.0%) | 0 (0.0%) |
| 7+ Person Households | 104 (34.3%) | 0 (0.0%) |
| Total | 223 (73.6%) | 80 (26.4%) |
Female Fertility in Shenandoah Junction
Fertility by Age in Shenandoah Junction
| Age Bracket | Women with Births | Births / 1,000 Women |
| 15 to 19 years | 0 (0.0%) | 0.0 |
| 20 to 34 years | 0 (0.0%) | 0.0 |
| 35 to 50 years | 0 (0.0%) | 0.0 |
| Total | 0 (0.0%) | 0.0 |
Fertility by Age by Marriage Status in Shenandoah Junction
| Age Bracket | Married | Unmarried |
| 15 to 19 years | 0 (0.0%) | 0 (0.0%) |
| 20 to 34 years | 0 (0.0%) | 0 (0.0%) |
| 35 to 50 years | 0 (0.0%) | 0 (0.0%) |
| Total | 0 (0.0%) | 0 (0.0%) |
Fertility by Education in Shenandoah Junction
| Educational Attainment | Women with Births | Births / 1,000 Women |
| Less than High School | 0 (0.0%) | 0.0 |
| High School Diploma | 0 (0.0%) | 0.0 |
| College or Associate's Degree | 0 (0.0%) | 0.0 |
| Bachelor's Degree | 0 (0.0%) | 0.0 |
| Graduate Degree | 0 (0.0%) | 0.0 |
| Total | 0 (0.0%) | 0.0 |
Fertility by Education by Marriage Status in Shenandoah Junction
| Educational Attainment | Married | Unmarried |
| Less than High School | 0 (0.0%) | 0 (0.0%) |
| High School Diploma | 0 (0.0%) | 0 (0.0%) |
| College or Associate's Degree | 0 (0.0%) | 0 (0.0%) |
| Bachelor's Degree | 0 (0.0%) | 0 (0.0%) |
| Graduate Degree | 0 (0.0%) | 0 (0.0%) |
| Total | 0 (0.0%) | 0 (0.0%) |
Employment Characteristics in Shenandoah Junction
Employment by Class of Employer in Shenandoah Junction
Among the 695 employed individuals in Shenandoah Junction, private company employees (360 | 51.8%), state government employees (214 | 30.8%), and federal government employees (75 | 10.8%) make up the most common classes of employment.
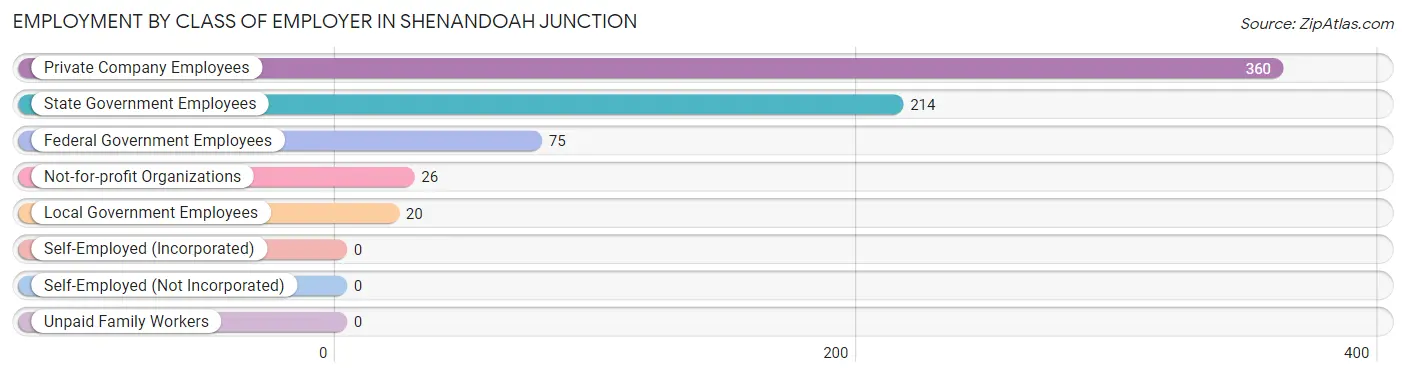
| Employer Class | # Employees | % Employees |
| Private Company Employees | 360 | 51.8% |
| Self-Employed (Incorporated) | 0 | 0.0% |
| Self-Employed (Not Incorporated) | 0 | 0.0% |
| Not-for-profit Organizations | 26 | 3.7% |
| Local Government Employees | 20 | 2.9% |
| State Government Employees | 214 | 30.8% |
| Federal Government Employees | 75 | 10.8% |
| Unpaid Family Workers | 0 | 0.0% |
| Total | 695 | 100.0% |
Employment Status by Age in Shenandoah Junction
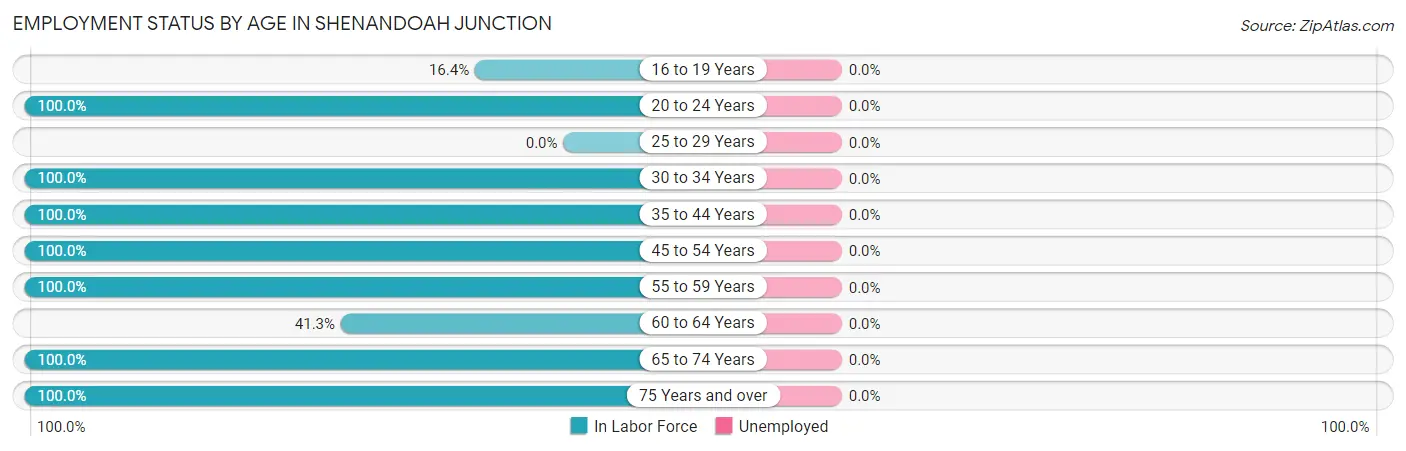
| Age Bracket | In Labor Force | Unemployed |
| 16 to 19 Years | 21 (16.4%) | 0 (0.0%) |
| 20 to 24 Years | 78 (100.0%) | 0 (0.0%) |
| 25 to 29 Years | 0 (0.0%) | 0 (0.0%) |
| 30 to 34 Years | 93 (100.0%) | 0 (0.0%) |
| 35 to 44 Years | 154 (100.0%) | 0 (0.0%) |
| 45 to 54 Years | 24 (100.0%) | 0 (0.0%) |
| 55 to 59 Years | 178 (100.0%) | 0 (0.0%) |
| 60 to 64 Years | 19 (41.3%) | 0 (0.0%) |
| 65 to 74 Years | 74 (100.0%) | 0 (0.0%) |
| 75 Years and over | 54 (100.0%) | 0 (0.0%) |
| Total | 695 (83.8%) | 0 (0.0%) |
Employment Status by Educational Attainment in Shenandoah Junction
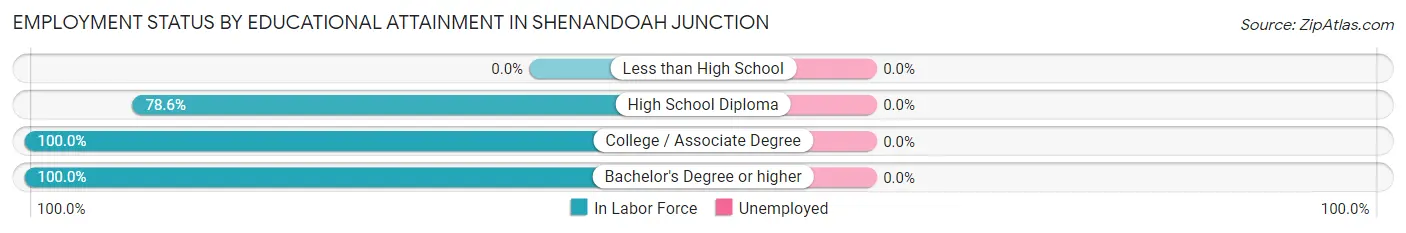
| Educational Attainment | In Labor Force | Unemployed |
| Less than High School | 0 (0.0%) | 0 (0.0%) |
| High School Diploma | 99 (78.6%) | 0 (0.0%) |
| College / Associate Degree | 271 (100.0%) | 0 (0.0%) |
| Bachelor's Degree or higher | 98 (100.0%) | 0 (0.0%) |
| Total | 468 (94.5%) | 0 (0.0%) |
Employment Occupations by Sex in Shenandoah Junction
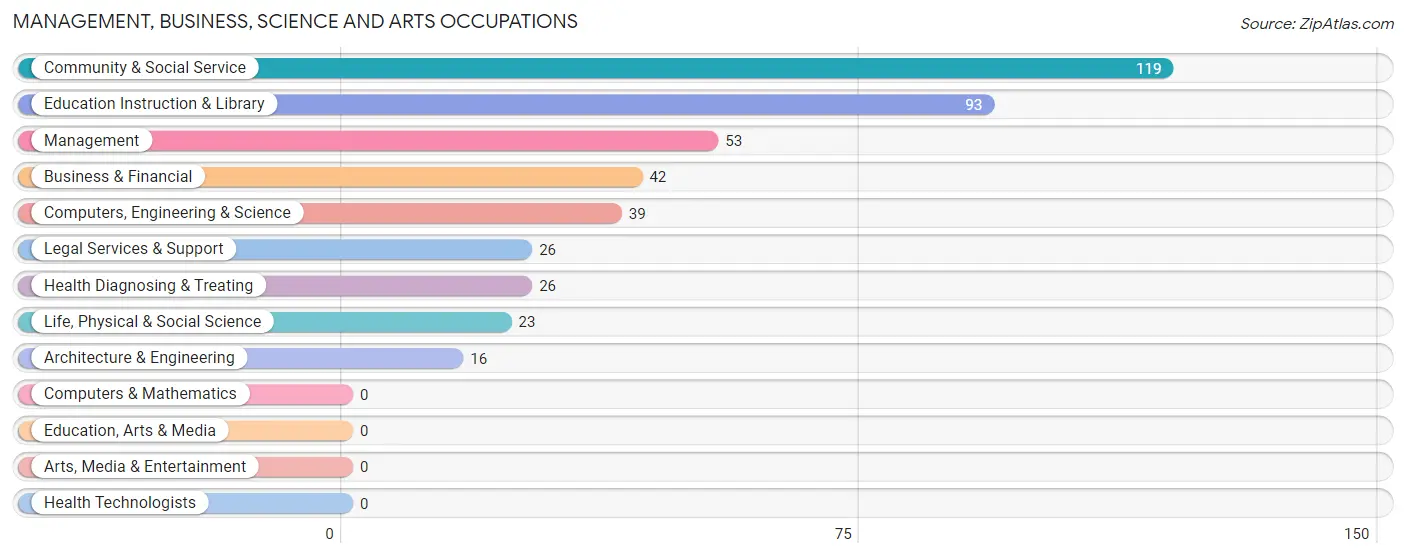
Management, Business, Science and Arts Occupations
The most common Management, Business, Science and Arts occupations in Shenandoah Junction are Community & Social Service (119 | 17.1%), Education Instruction & Library (93 | 13.4%), Management (53 | 7.6%), Business & Financial (42 | 6.0%), and Computers, Engineering & Science (39 | 5.6%).
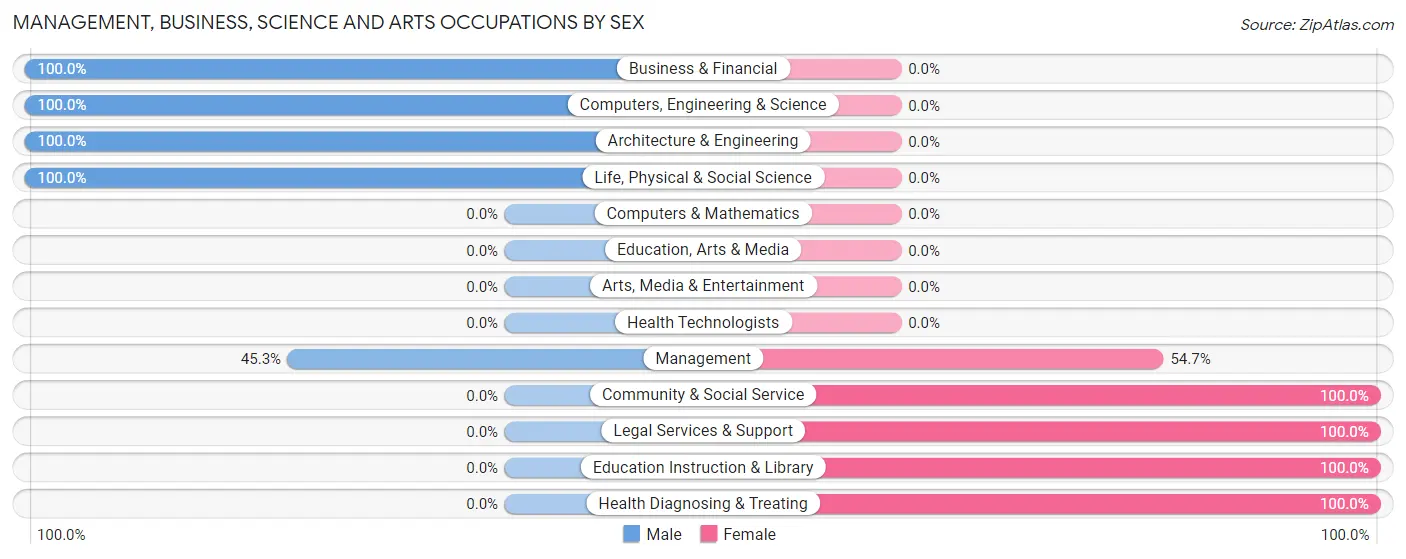
Management, Business, Science and Arts Occupations by Sex
Within the Management, Business, Science and Arts occupations in Shenandoah Junction, the most male-oriented occupations are Business & Financial (100.0%), Computers, Engineering & Science (100.0%), and Architecture & Engineering (100.0%), while the most female-oriented occupations are Community & Social Service (100.0%), Legal Services & Support (100.0%), and Education Instruction & Library (100.0%).
| Occupation | Male | Female |
| Management | 24 (45.3%) | 29 (54.7%) |
| Business & Financial | 42 (100.0%) | 0 (0.0%) |
| Computers, Engineering & Science | 39 (100.0%) | 0 (0.0%) |
| Computers & Mathematics | 0 (0.0%) | 0 (0.0%) |
| Architecture & Engineering | 16 (100.0%) | 0 (0.0%) |
| Life, Physical & Social Science | 23 (100.0%) | 0 (0.0%) |
| Community & Social Service | 0 (0.0%) | 119 (100.0%) |
| Education, Arts & Media | 0 (0.0%) | 0 (0.0%) |
| Legal Services & Support | 0 (0.0%) | 26 (100.0%) |
| Education Instruction & Library | 0 (0.0%) | 93 (100.0%) |
| Arts, Media & Entertainment | 0 (0.0%) | 0 (0.0%) |
| Health Diagnosing & Treating | 0 (0.0%) | 26 (100.0%) |
| Health Technologists | 0 (0.0%) | 0 (0.0%) |
| Total (Category) | 105 (37.6%) | 174 (62.4%) |
| Total (Overall) | 390 (56.1%) | 305 (43.9%) |
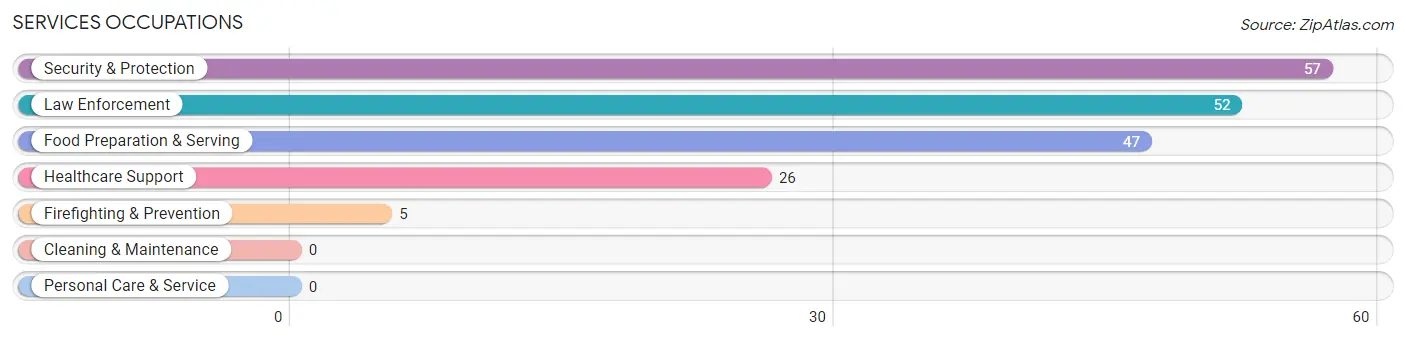
Services Occupations
The most common Services occupations in Shenandoah Junction are Security & Protection (57 | 8.2%), Law Enforcement (52 | 7.5%), Food Preparation & Serving (47 | 6.8%), Healthcare Support (26 | 3.7%), and Firefighting & Prevention (5 | 0.7%).
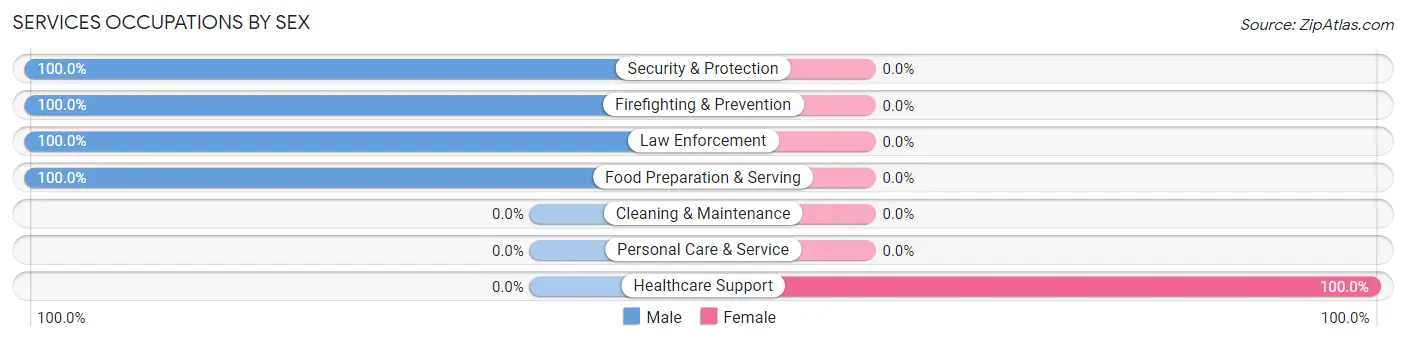
Services Occupations by Sex
| Occupation | Male | Female |
| Healthcare Support | 0 (0.0%) | 26 (100.0%) |
| Security & Protection | 57 (100.0%) | 0 (0.0%) |
| Firefighting & Prevention | 5 (100.0%) | 0 (0.0%) |
| Law Enforcement | 52 (100.0%) | 0 (0.0%) |
| Food Preparation & Serving | 47 (100.0%) | 0 (0.0%) |
| Cleaning & Maintenance | 0 (0.0%) | 0 (0.0%) |
| Personal Care & Service | 0 (0.0%) | 0 (0.0%) |
| Total (Category) | 104 (80.0%) | 26 (20.0%) |
| Total (Overall) | 390 (56.1%) | 305 (43.9%) |
Sales and Office Occupations
The most common Sales and Office occupations in Shenandoah Junction are , and Sales & Related (21 | 3.0%).

Sales and Office Occupations by Sex

| Occupation | Male | Female |
| Sales & Related | 0 (0.0%) | 21 (100.0%) |
| Office & Administration | 0 (0.0%) | 0 (0.0%) |
| Total (Category) | 0 (0.0%) | 21 (100.0%) |
| Total (Overall) | 390 (56.1%) | 305 (43.9%) |
Natural Resources, Construction and Maintenance Occupations
The most common Natural Resources, Construction and Maintenance occupations in Shenandoah Junction are , and Installation, Maintenance & Repair (58 | 8.4%).
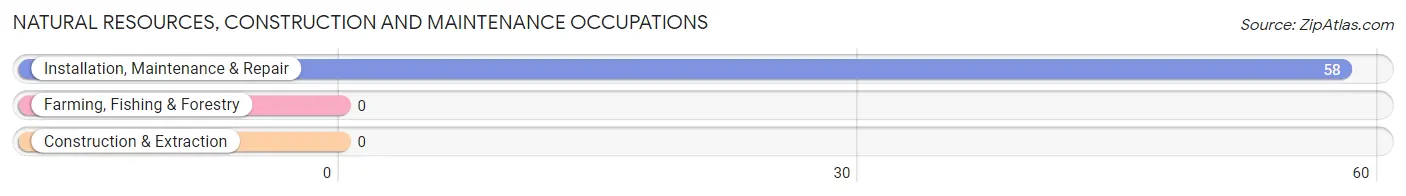
Natural Resources, Construction and Maintenance Occupations by Sex
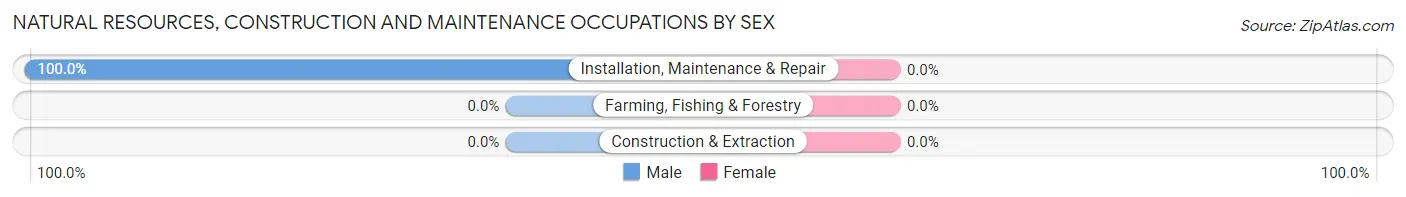
| Occupation | Male | Female |
| Farming, Fishing & Forestry | 0 (0.0%) | 0 (0.0%) |
| Construction & Extraction | 0 (0.0%) | 0 (0.0%) |
| Installation, Maintenance & Repair | 58 (100.0%) | 0 (0.0%) |
| Total (Category) | 58 (100.0%) | 0 (0.0%) |
| Total (Overall) | 390 (56.1%) | 305 (43.9%) |
Production, Transportation and Moving Occupations
The most common Production, Transportation and Moving occupations in Shenandoah Junction are Transportation (127 | 18.3%), and Production (80 | 11.5%).
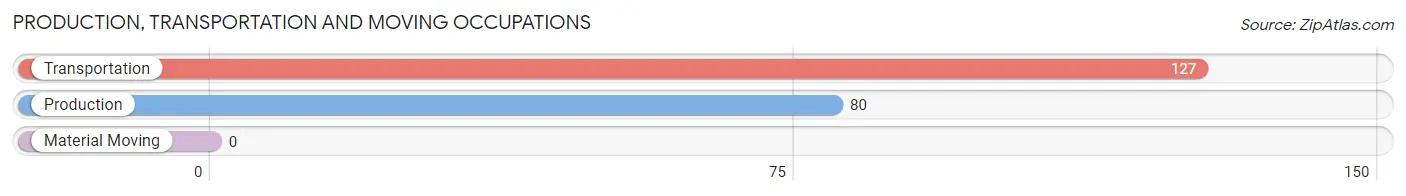
Production, Transportation and Moving Occupations by Sex
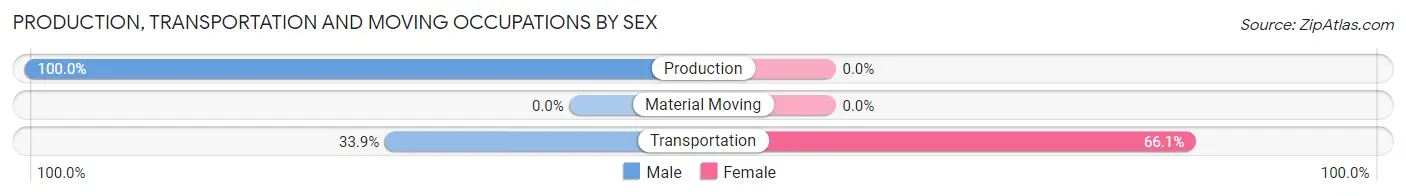
| Occupation | Male | Female |
| Production | 80 (100.0%) | 0 (0.0%) |
| Transportation | 43 (33.9%) | 84 (66.1%) |
| Material Moving | 0 (0.0%) | 0 (0.0%) |
| Total (Category) | 123 (59.4%) | 84 (40.6%) |
| Total (Overall) | 390 (56.1%) | 305 (43.9%) |
Employment Industries by Sex in Shenandoah Junction
Employment Industries in Shenandoah Junction
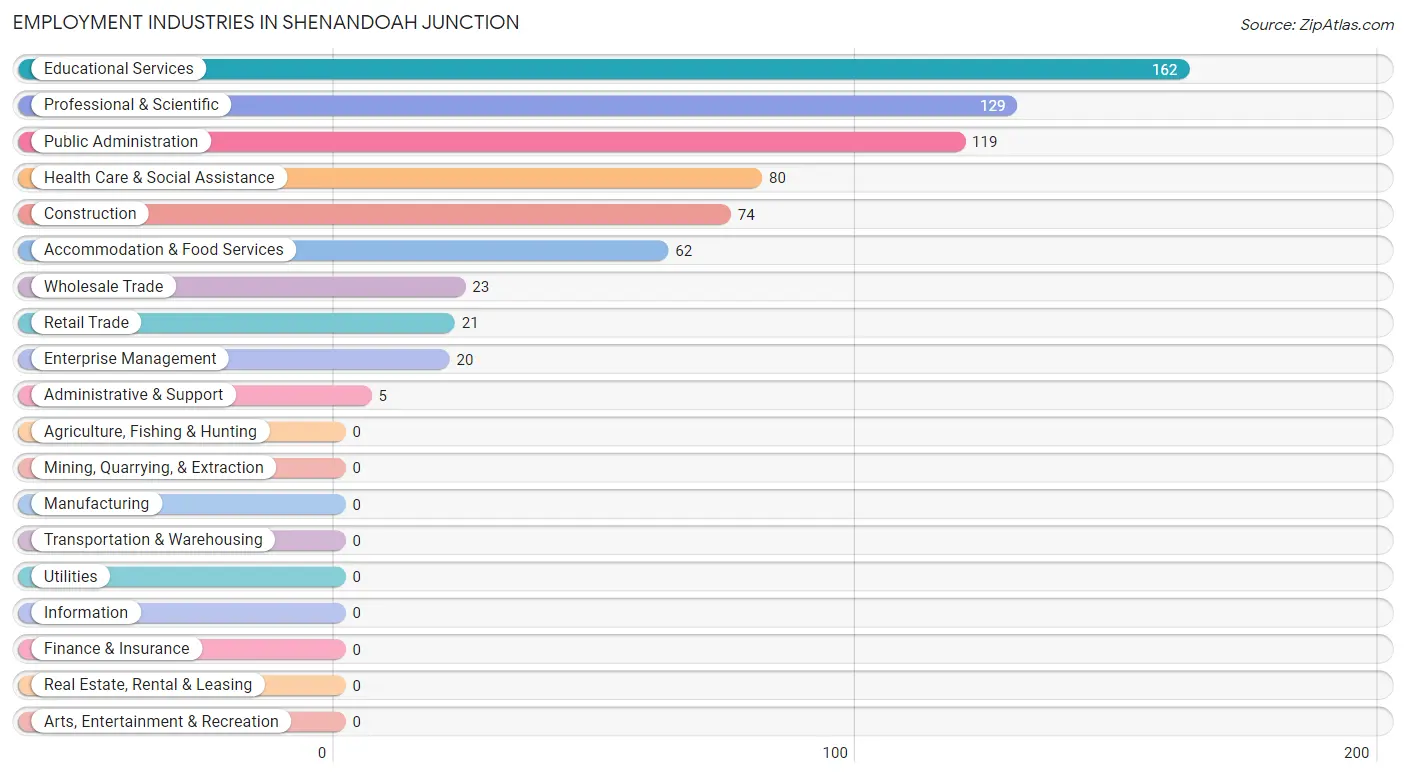
The major employment industries in Shenandoah Junction include Educational Services (162 | 23.3%), Professional & Scientific (129 | 18.6%), Public Administration (119 | 17.1%), Health Care & Social Assistance (80 | 11.5%), and Construction (74 | 10.6%).
Employment Industries by Sex in Shenandoah Junction
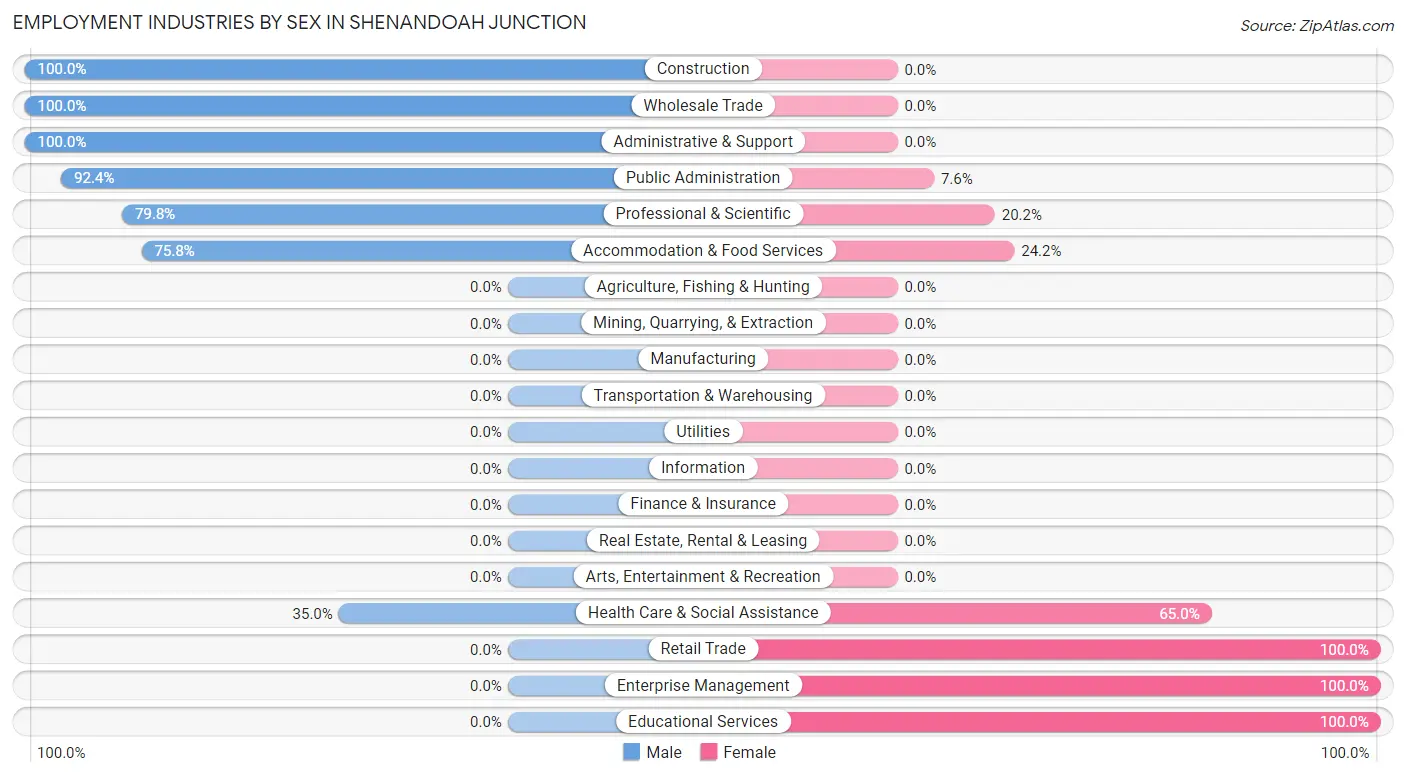
The Shenandoah Junction industries that see more men than women are Construction (100.0%), Wholesale Trade (100.0%), and Administrative & Support (100.0%), whereas the industries that tend to have a higher number of women are Retail Trade (100.0%), Enterprise Management (100.0%), and Educational Services (100.0%).
| Industry | Male | Female |
| Agriculture, Fishing & Hunting | 0 (0.0%) | 0 (0.0%) |
| Mining, Quarrying, & Extraction | 0 (0.0%) | 0 (0.0%) |
| Construction | 74 (100.0%) | 0 (0.0%) |
| Manufacturing | 0 (0.0%) | 0 (0.0%) |
| Wholesale Trade | 23 (100.0%) | 0 (0.0%) |
| Retail Trade | 0 (0.0%) | 21 (100.0%) |
| Transportation & Warehousing | 0 (0.0%) | 0 (0.0%) |
| Utilities | 0 (0.0%) | 0 (0.0%) |
| Information | 0 (0.0%) | 0 (0.0%) |
| Finance & Insurance | 0 (0.0%) | 0 (0.0%) |
| Real Estate, Rental & Leasing | 0 (0.0%) | 0 (0.0%) |
| Professional & Scientific | 103 (79.8%) | 26 (20.2%) |
| Enterprise Management | 0 (0.0%) | 20 (100.0%) |
| Administrative & Support | 5 (100.0%) | 0 (0.0%) |
| Educational Services | 0 (0.0%) | 162 (100.0%) |
| Health Care & Social Assistance | 28 (35.0%) | 52 (65.0%) |
| Arts, Entertainment & Recreation | 0 (0.0%) | 0 (0.0%) |
| Accommodation & Food Services | 47 (75.8%) | 15 (24.2%) |
| Public Administration | 110 (92.4%) | 9 (7.6%) |
| Total | 390 (56.1%) | 305 (43.9%) |
Education in Shenandoah Junction
School Enrollment in Shenandoah Junction
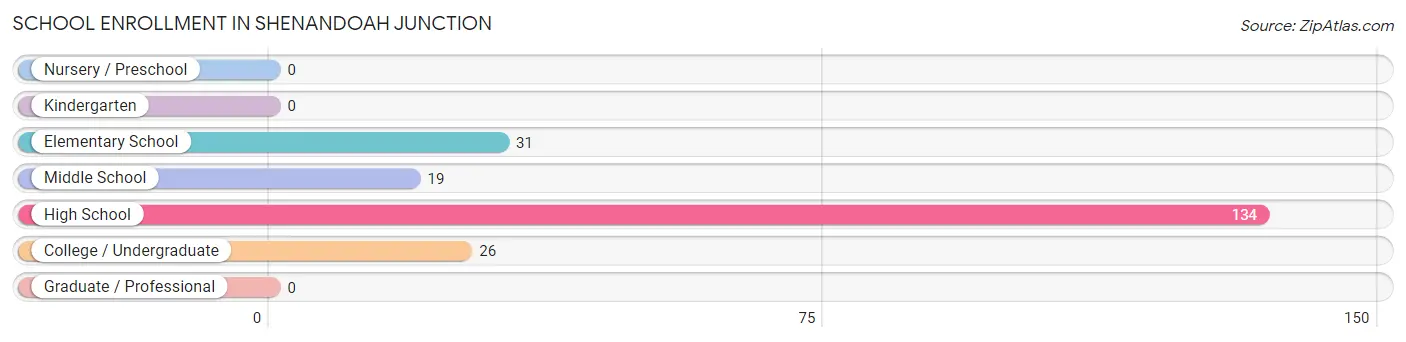
The most common levels of schooling among the 210 students in Shenandoah Junction are high school (134 | 63.8%), elementary school (31 | 14.8%), and college / undergraduate (26 | 12.4%).
| School Level | # Students | % Students |
| Nursery / Preschool | 0 | 0.0% |
| Kindergarten | 0 | 0.0% |
| Elementary School | 31 | 14.8% |
| Middle School | 19 | 9.0% |
| High School | 134 | 63.8% |
| College / Undergraduate | 26 | 12.4% |
| Graduate / Professional | 0 | 0.0% |
| Total | 210 | 100.0% |
School Enrollment by Age by Funding Source in Shenandoah Junction
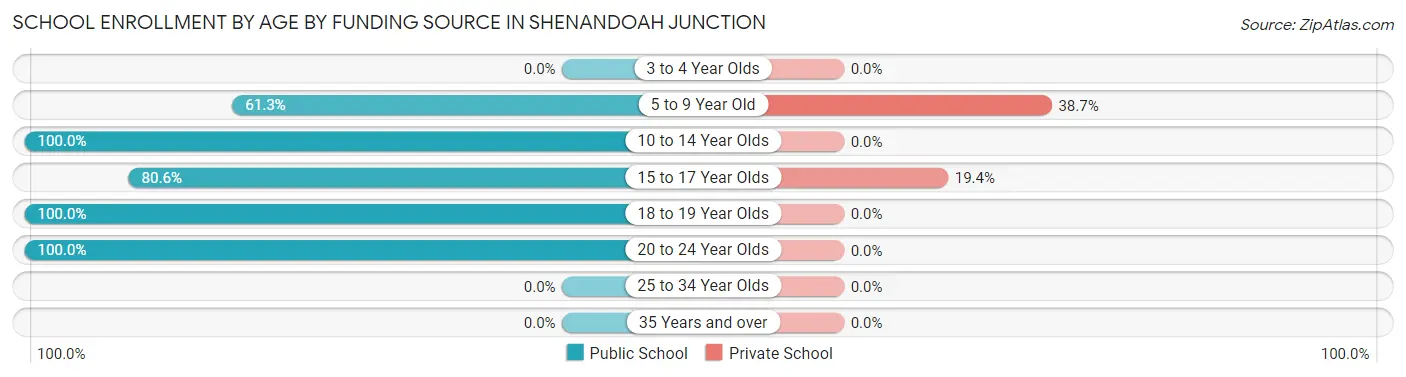
Out of a total of 210 students who are enrolled in schools in Shenandoah Junction, 31 (14.8%) attend a private institution, while the remaining 179 (85.2%) are enrolled in public schools. The age group of 5 to 9 year old has the highest likelihood of being enrolled in private schools, with 12 (38.7% in the age bracket) enrolled. Conversely, the age group of 10 to 14 year olds has the lowest likelihood of being enrolled in a private school, with 19 (100.0% in the age bracket) attending a public institution.
| Age Bracket | Public School | Private School |
| 3 to 4 Year Olds | 0 (0.0%) | 0 (0.0%) |
| 5 to 9 Year Old | 19 (61.3%) | 12 (38.7%) |
| 10 to 14 Year Olds | 19 (100.0%) | 0 (0.0%) |
| 15 to 17 Year Olds | 79 (80.6%) | 19 (19.4%) |
| 18 to 19 Year Olds | 36 (100.0%) | 0 (0.0%) |
| 20 to 24 Year Olds | 26 (100.0%) | 0 (0.0%) |
| 25 to 34 Year Olds | 0 (0.0%) | 0 (0.0%) |
| 35 Years and over | 0 (0.0%) | 0 (0.0%) |
| Total | 179 (85.2%) | 31 (14.8%) |
Educational Attainment by Field of Study in Shenandoah Junction
Business (52 | 53.1%), communications (26 | 26.5%), bio, nature & agricultural (15 | 15.3%), and arts & humanities (5 | 5.1%) are the most common fields of study among 98 individuals in Shenandoah Junction who have obtained a bachelor's degree or higher.
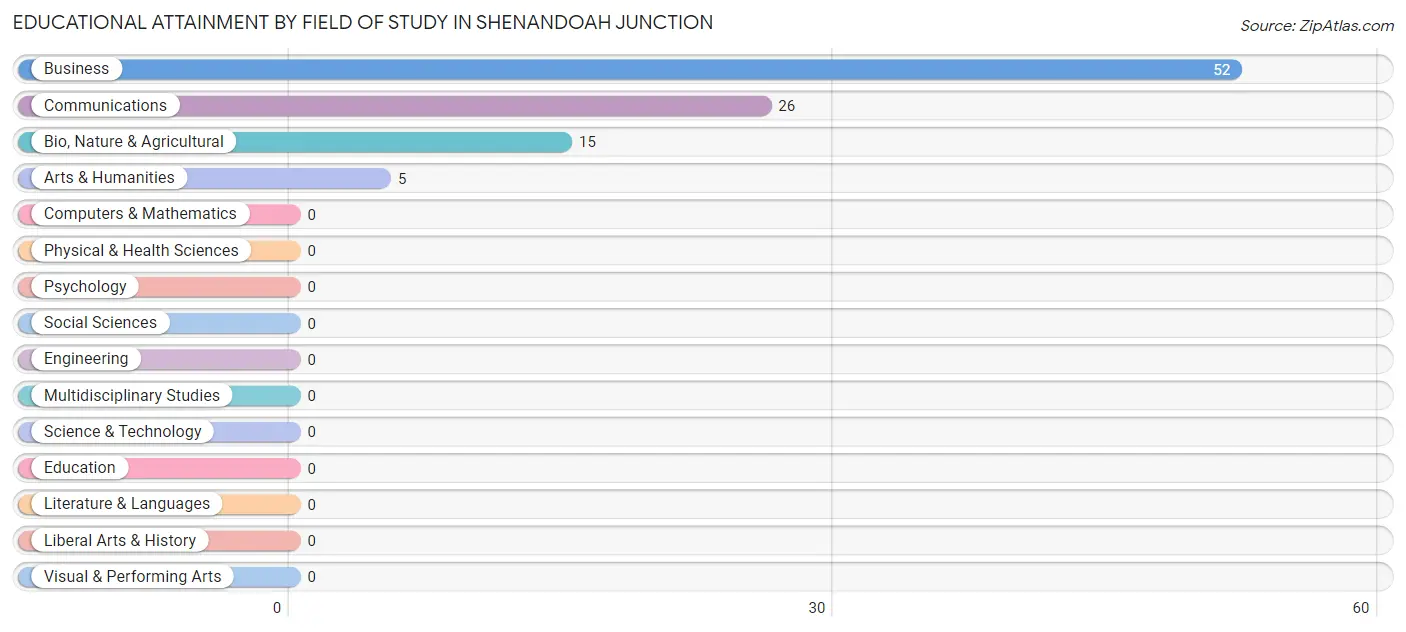
| Field of Study | # Graduates | % Graduates |
| Computers & Mathematics | 0 | 0.0% |
| Bio, Nature & Agricultural | 15 | 15.3% |
| Physical & Health Sciences | 0 | 0.0% |
| Psychology | 0 | 0.0% |
| Social Sciences | 0 | 0.0% |
| Engineering | 0 | 0.0% |
| Multidisciplinary Studies | 0 | 0.0% |
| Science & Technology | 0 | 0.0% |
| Business | 52 | 53.1% |
| Education | 0 | 0.0% |
| Literature & Languages | 0 | 0.0% |
| Liberal Arts & History | 0 | 0.0% |
| Visual & Performing Arts | 0 | 0.0% |
| Communications | 26 | 26.5% |
| Arts & Humanities | 5 | 5.1% |
| Total | 98 | 100.0% |
Transportation & Commute in Shenandoah Junction
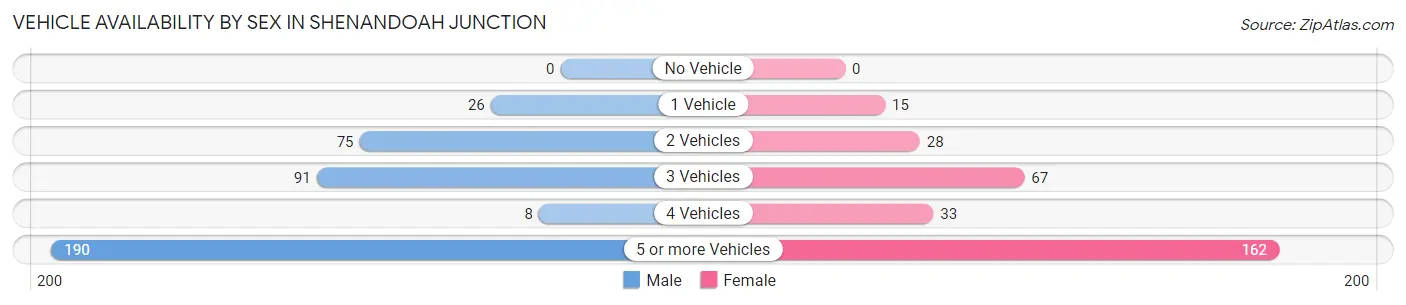
Vehicle Availability by Sex in Shenandoah Junction
The most prevalent vehicle ownership categories in Shenandoah Junction are males with 5 or more vehicles (190, accounting for 48.7%) and females with 5 or more vehicles (162, making up 62.3%).
| Vehicles Available | Male | Female |
| No Vehicle | 0 (0.0%) | 0 (0.0%) |
| 1 Vehicle | 26 (6.7%) | 15 (4.9%) |
| 2 Vehicles | 75 (19.2%) | 28 (9.2%) |
| 3 Vehicles | 91 (23.3%) | 67 (22.0%) |
| 4 Vehicles | 8 (2.1%) | 33 (10.8%) |
| 5 or more Vehicles | 190 (48.7%) | 162 (53.1%) |
| Total | 390 (100.0%) | 305 (100.0%) |
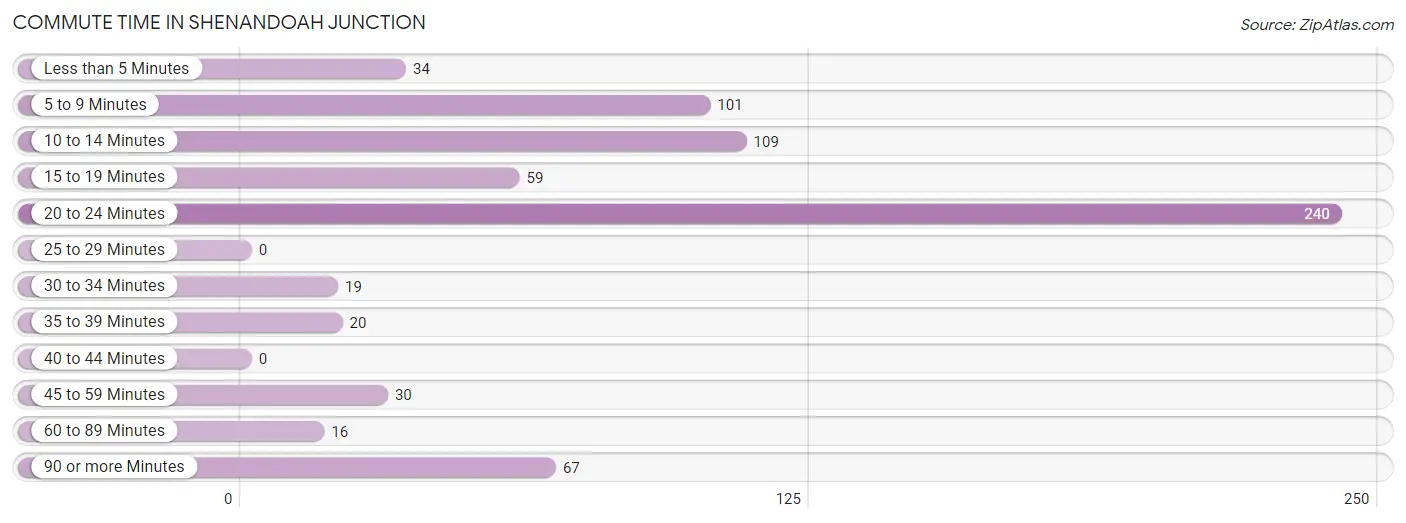
Commute Time in Shenandoah Junction
The most frequently occuring commute durations in Shenandoah Junction are 20 to 24 minutes (240 commuters, 34.5%), 10 to 14 minutes (109 commuters, 15.7%), and 5 to 9 minutes (101 commuters, 14.5%).
| Commute Time | # Commuters | % Commuters |
| Less than 5 Minutes | 34 | 4.9% |
| 5 to 9 Minutes | 101 | 14.5% |
| 10 to 14 Minutes | 109 | 15.7% |
| 15 to 19 Minutes | 59 | 8.5% |
| 20 to 24 Minutes | 240 | 34.5% |
| 25 to 29 Minutes | 0 | 0.0% |
| 30 to 34 Minutes | 19 | 2.7% |
| 35 to 39 Minutes | 20 | 2.9% |
| 40 to 44 Minutes | 0 | 0.0% |
| 45 to 59 Minutes | 30 | 4.3% |
| 60 to 89 Minutes | 16 | 2.3% |
| 90 or more Minutes | 67 | 9.6% |
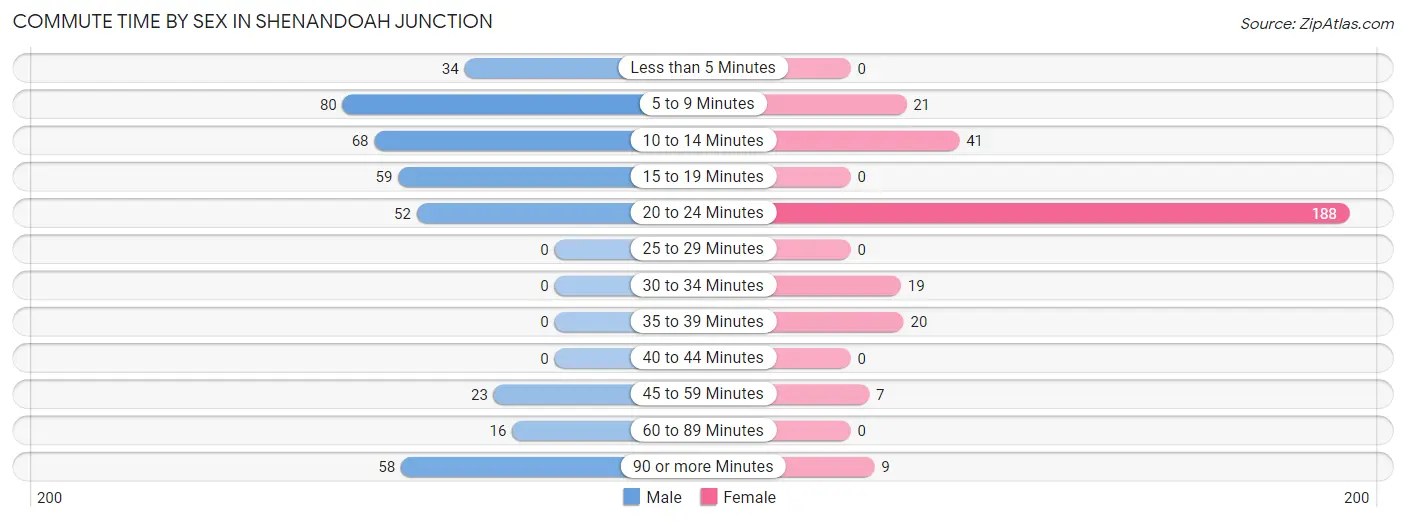
Commute Time by Sex in Shenandoah Junction
The most common commute times in Shenandoah Junction are 5 to 9 minutes (80 commuters, 20.5%) for males and 20 to 24 minutes (188 commuters, 61.6%) for females.
| Commute Time | Male | Female |
| Less than 5 Minutes | 34 (8.7%) | 0 (0.0%) |
| 5 to 9 Minutes | 80 (20.5%) | 21 (6.9%) |
| 10 to 14 Minutes | 68 (17.4%) | 41 (13.4%) |
| 15 to 19 Minutes | 59 (15.1%) | 0 (0.0%) |
| 20 to 24 Minutes | 52 (13.3%) | 188 (61.6%) |
| 25 to 29 Minutes | 0 (0.0%) | 0 (0.0%) |
| 30 to 34 Minutes | 0 (0.0%) | 19 (6.2%) |
| 35 to 39 Minutes | 0 (0.0%) | 20 (6.6%) |
| 40 to 44 Minutes | 0 (0.0%) | 0 (0.0%) |
| 45 to 59 Minutes | 23 (5.9%) | 7 (2.3%) |
| 60 to 89 Minutes | 16 (4.1%) | 0 (0.0%) |
| 90 or more Minutes | 58 (14.9%) | 9 (2.9%) |
Time of Departure to Work by Sex in Shenandoah Junction
The most frequent times of departure to work in Shenandoah Junction are 7:00 AM to 7:29 AM (132, 33.9%) for males and 6:00 AM to 6:29 AM (84, 27.5%) for females.
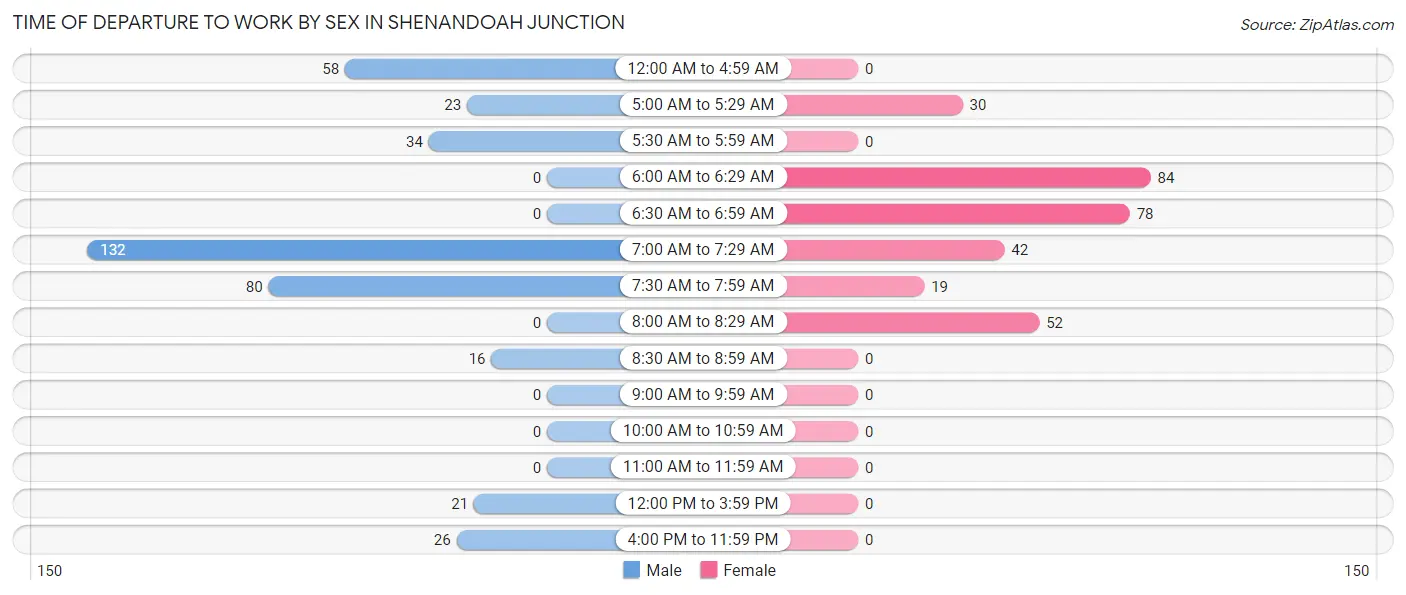
| Time of Departure | Male | Female |
| 12:00 AM to 4:59 AM | 58 (14.9%) | 0 (0.0%) |
| 5:00 AM to 5:29 AM | 23 (5.9%) | 30 (9.8%) |
| 5:30 AM to 5:59 AM | 34 (8.7%) | 0 (0.0%) |
| 6:00 AM to 6:29 AM | 0 (0.0%) | 84 (27.5%) |
| 6:30 AM to 6:59 AM | 0 (0.0%) | 78 (25.6%) |
| 7:00 AM to 7:29 AM | 132 (33.9%) | 42 (13.8%) |
| 7:30 AM to 7:59 AM | 80 (20.5%) | 19 (6.2%) |
| 8:00 AM to 8:29 AM | 0 (0.0%) | 52 (17.1%) |
| 8:30 AM to 8:59 AM | 16 (4.1%) | 0 (0.0%) |
| 9:00 AM to 9:59 AM | 0 (0.0%) | 0 (0.0%) |
| 10:00 AM to 10:59 AM | 0 (0.0%) | 0 (0.0%) |
| 11:00 AM to 11:59 AM | 0 (0.0%) | 0 (0.0%) |
| 12:00 PM to 3:59 PM | 21 (5.4%) | 0 (0.0%) |
| 4:00 PM to 11:59 PM | 26 (6.7%) | 0 (0.0%) |
| Total | 390 (100.0%) | 305 (100.0%) |
Housing Occupancy in Shenandoah Junction
Occupancy by Ownership in Shenandoah Junction
Of the total 303 dwellings in Shenandoah Junction, owner-occupied units account for 262 (86.5%), while renter-occupied units make up 41 (13.5%).
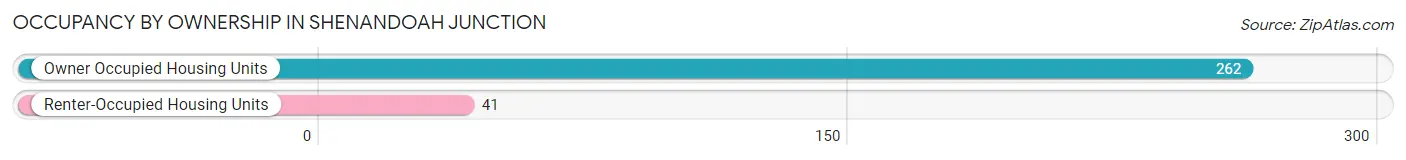
| Occupancy | # Housing Units | % Housing Units |
| Owner Occupied Housing Units | 262 | 86.5% |
| Renter-Occupied Housing Units | 41 | 13.5% |
| Total Occupied Housing Units | 303 | 100.0% |
Occupancy by Household Size in Shenandoah Junction
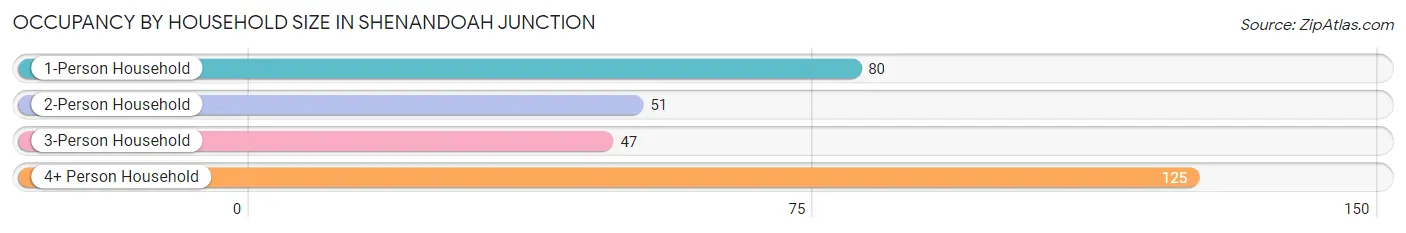
| Household Size | # Housing Units | % Housing Units |
| 1-Person Household | 80 | 26.4% |
| 2-Person Household | 51 | 16.8% |
| 3-Person Household | 47 | 15.5% |
| 4+ Person Household | 125 | 41.2% |
| Total Housing Units | 303 | 100.0% |
Occupancy by Ownership by Household Size in Shenandoah Junction
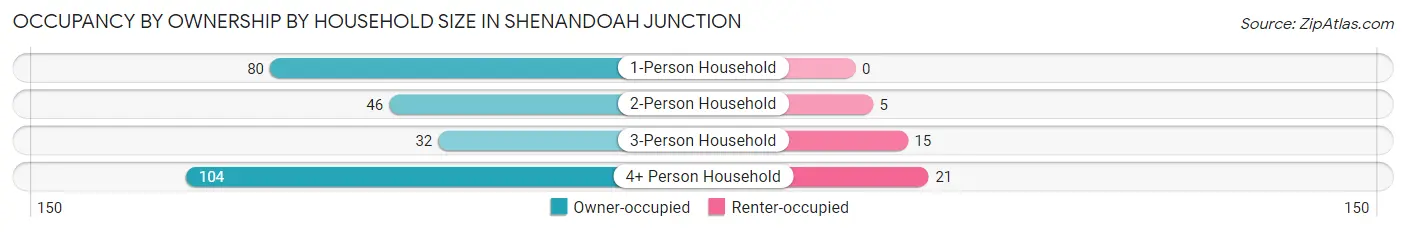
| Household Size | Owner-occupied | Renter-occupied |
| 1-Person Household | 80 (100.0%) | 0 (0.0%) |
| 2-Person Household | 46 (90.2%) | 5 (9.8%) |
| 3-Person Household | 32 (68.1%) | 15 (31.9%) |
| 4+ Person Household | 104 (83.2%) | 21 (16.8%) |
| Total Housing Units | 262 (86.5%) | 41 (13.5%) |
Occupancy by Educational Attainment in Shenandoah Junction
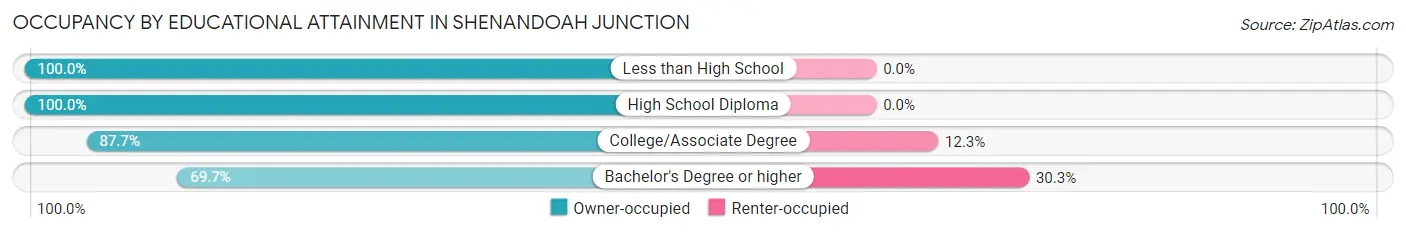
| Household Size | Owner-occupied | Renter-occupied |
| Less than High School | 20 (100.0%) | 0 (0.0%) |
| High School Diploma | 46 (100.0%) | 0 (0.0%) |
| College/Associate Degree | 150 (87.7%) | 21 (12.3%) |
| Bachelor's Degree or higher | 46 (69.7%) | 20 (30.3%) |
Occupancy by Age of Householder in Shenandoah Junction
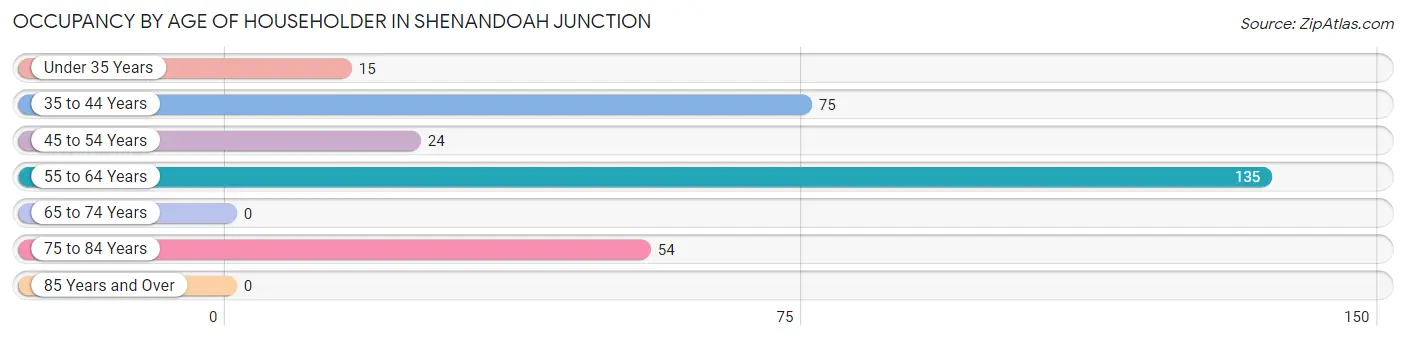
| Age Bracket | # Households | % Households |
| Under 35 Years | 15 | 5.0% |
| 35 to 44 Years | 75 | 24.7% |
| 45 to 54 Years | 24 | 7.9% |
| 55 to 64 Years | 135 | 44.6% |
| 65 to 74 Years | 0 | 0.0% |
| 75 to 84 Years | 54 | 17.8% |
| 85 Years and Over | 0 | 0.0% |
| Total | 303 | 100.0% |
Housing Finances in Shenandoah Junction
Median Income by Occupancy in Shenandoah Junction
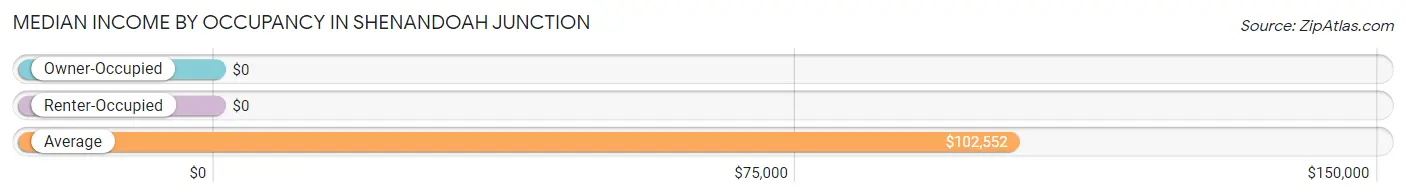
| Occupancy Type | # Households | Median Income |
| Owner-Occupied | 262 (86.5%) | $0 |
| Renter-Occupied | 41 (13.5%) | $0 |
| Average | 303 (100.0%) | $102,552 |
Occupancy by Householder Income Bracket in Shenandoah Junction
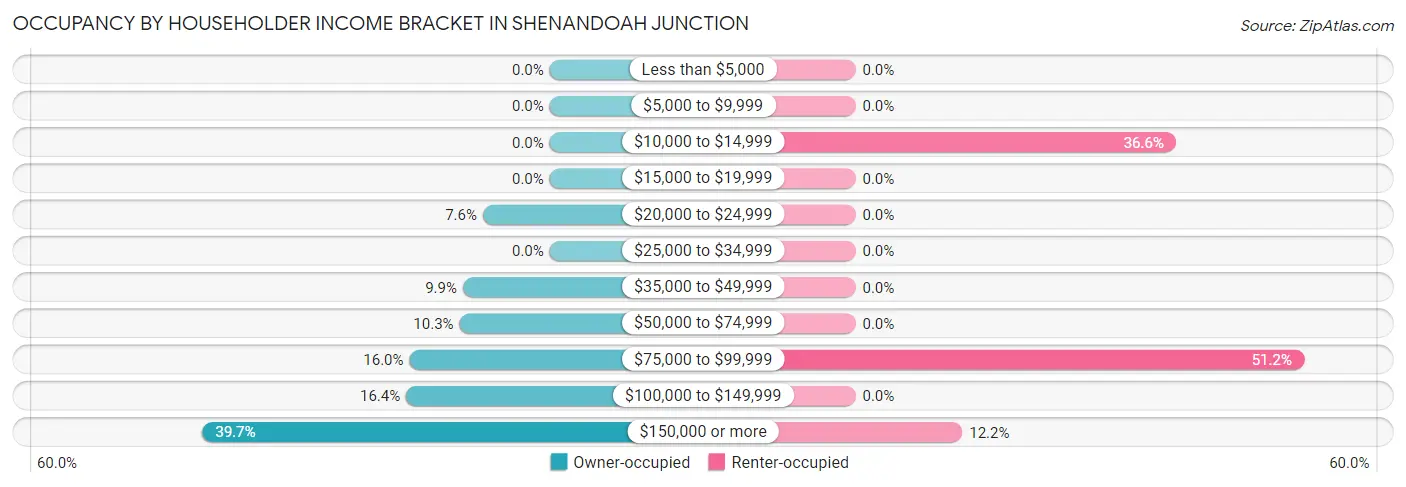
| Income Bracket | Owner-occupied | Renter-occupied |
| Less than $5,000 | 0 (0.0%) | 0 (0.0%) |
| $5,000 to $9,999 | 0 (0.0%) | 0 (0.0%) |
| $10,000 to $14,999 | 0 (0.0%) | 15 (36.6%) |
| $15,000 to $19,999 | 0 (0.0%) | 0 (0.0%) |
| $20,000 to $24,999 | 20 (7.6%) | 0 (0.0%) |
| $25,000 to $34,999 | 0 (0.0%) | 0 (0.0%) |
| $35,000 to $49,999 | 26 (9.9%) | 0 (0.0%) |
| $50,000 to $74,999 | 27 (10.3%) | 0 (0.0%) |
| $75,000 to $99,999 | 42 (16.0%) | 21 (51.2%) |
| $100,000 to $149,999 | 43 (16.4%) | 0 (0.0%) |
| $150,000 or more | 104 (39.7%) | 5 (12.2%) |
| Total | 262 (100.0%) | 41 (100.0%) |
Monthly Housing Cost Tiers in Shenandoah Junction
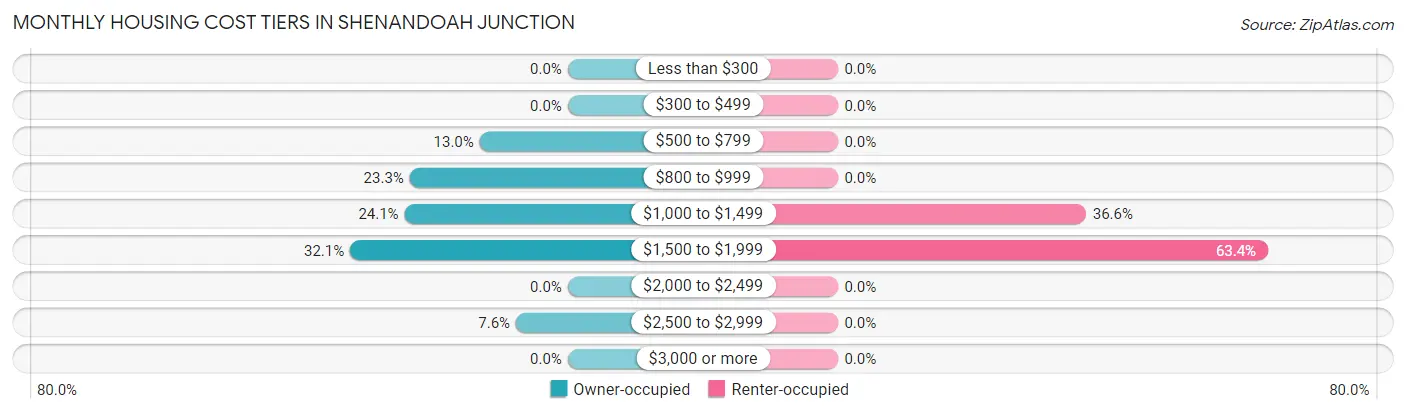
| Monthly Cost | Owner-occupied | Renter-occupied |
| Less than $300 | 0 (0.0%) | 0 (0.0%) |
| $300 to $499 | 0 (0.0%) | 0 (0.0%) |
| $500 to $799 | 34 (13.0%) | 0 (0.0%) |
| $800 to $999 | 61 (23.3%) | 0 (0.0%) |
| $1,000 to $1,499 | 63 (24.0%) | 15 (36.6%) |
| $1,500 to $1,999 | 84 (32.1%) | 26 (63.4%) |
| $2,000 to $2,499 | 0 (0.0%) | 0 (0.0%) |
| $2,500 to $2,999 | 20 (7.6%) | 0 (0.0%) |
| $3,000 or more | 0 (0.0%) | 0 (0.0%) |
| Total | 262 (100.0%) | 41 (100.0%) |
Physical Housing Characteristics in Shenandoah Junction
Housing Structures in Shenandoah Junction
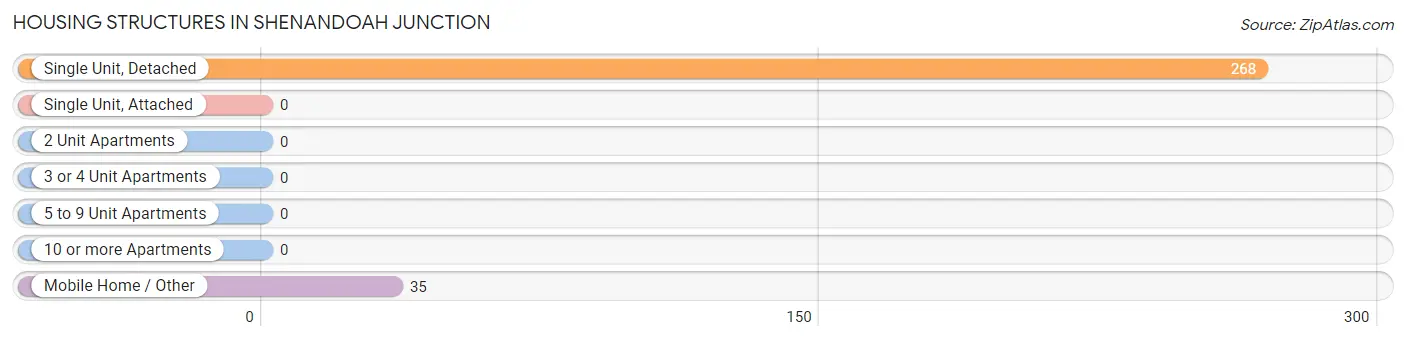
| Structure Type | # Housing Units | % Housing Units |
| Single Unit, Detached | 268 | 88.4% |
| Single Unit, Attached | 0 | 0.0% |
| 2 Unit Apartments | 0 | 0.0% |
| 3 or 4 Unit Apartments | 0 | 0.0% |
| 5 to 9 Unit Apartments | 0 | 0.0% |
| 10 or more Apartments | 0 | 0.0% |
| Mobile Home / Other | 35 | 11.6% |
| Total | 303 | 100.0% |
Housing Structures by Occupancy in Shenandoah Junction
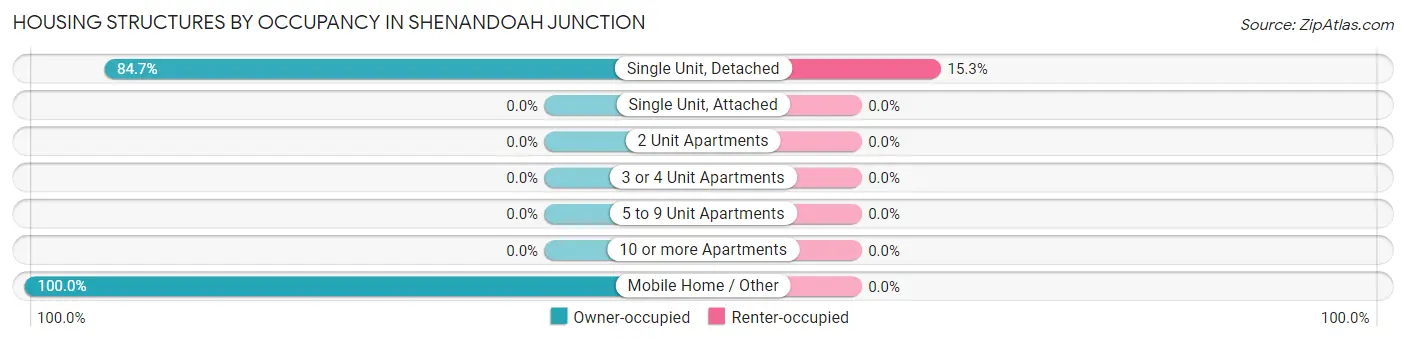
| Structure Type | Owner-occupied | Renter-occupied |
| Single Unit, Detached | 227 (84.7%) | 41 (15.3%) |
| Single Unit, Attached | 0 (0.0%) | 0 (0.0%) |
| 2 Unit Apartments | 0 (0.0%) | 0 (0.0%) |
| 3 or 4 Unit Apartments | 0 (0.0%) | 0 (0.0%) |
| 5 to 9 Unit Apartments | 0 (0.0%) | 0 (0.0%) |
| 10 or more Apartments | 0 (0.0%) | 0 (0.0%) |
| Mobile Home / Other | 35 (100.0%) | 0 (0.0%) |
| Total | 262 (86.5%) | 41 (13.5%) |
Housing Structures by Number of Rooms in Shenandoah Junction
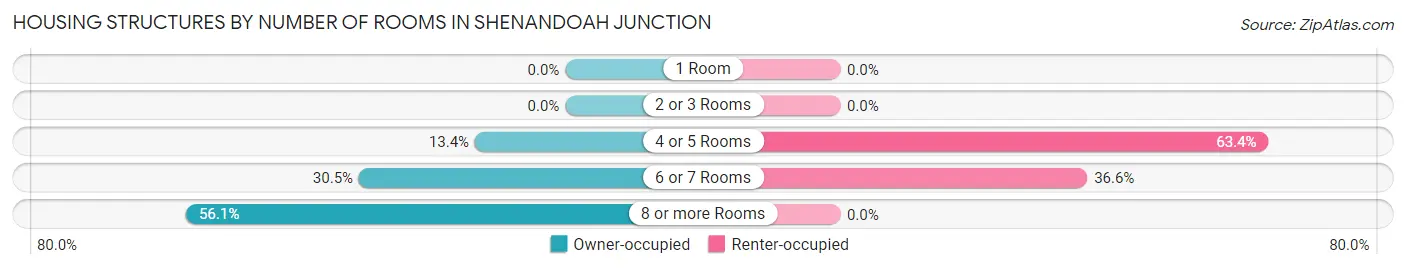
| Number of Rooms | Owner-occupied | Renter-occupied |
| 1 Room | 0 (0.0%) | 0 (0.0%) |
| 2 or 3 Rooms | 0 (0.0%) | 0 (0.0%) |
| 4 or 5 Rooms | 35 (13.4%) | 26 (63.4%) |
| 6 or 7 Rooms | 80 (30.5%) | 15 (36.6%) |
| 8 or more Rooms | 147 (56.1%) | 0 (0.0%) |
| Total | 262 (100.0%) | 41 (100.0%) |
Housing Structure by Heating Type in Shenandoah Junction
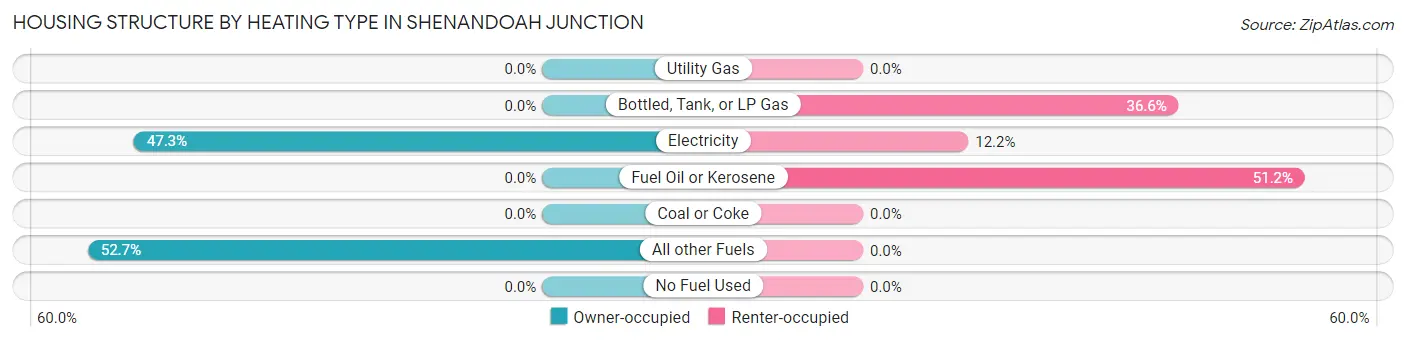
| Heating Type | Owner-occupied | Renter-occupied |
| Utility Gas | 0 (0.0%) | 0 (0.0%) |
| Bottled, Tank, or LP Gas | 0 (0.0%) | 15 (36.6%) |
| Electricity | 124 (47.3%) | 5 (12.2%) |
| Fuel Oil or Kerosene | 0 (0.0%) | 21 (51.2%) |
| Coal or Coke | 0 (0.0%) | 0 (0.0%) |
| All other Fuels | 138 (52.7%) | 0 (0.0%) |
| No Fuel Used | 0 (0.0%) | 0 (0.0%) |
| Total | 262 (100.0%) | 41 (100.0%) |
Household Vehicle Usage in Shenandoah Junction
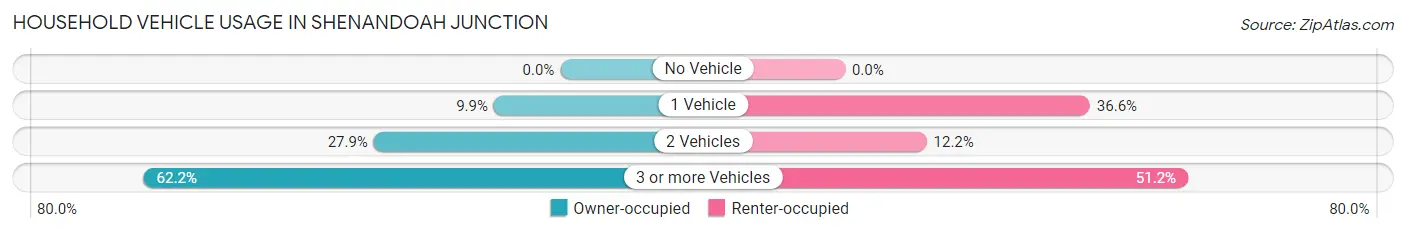
| Vehicles per Household | Owner-occupied | Renter-occupied |
| No Vehicle | 0 (0.0%) | 0 (0.0%) |
| 1 Vehicle | 26 (9.9%) | 15 (36.6%) |
| 2 Vehicles | 73 (27.9%) | 5 (12.2%) |
| 3 or more Vehicles | 163 (62.2%) | 21 (51.2%) |
| Total | 262 (100.0%) | 41 (100.0%) |
Real Estate & Mortgages in Shenandoah Junction
Real Estate and Mortgage Overview in Shenandoah Junction
| Characteristic | Without Mortgage | With Mortgage |
| Housing Units | 8 | 254 |
| Median Property Value | - | - |
| Median Household Income | - | - |
| Monthly Housing Costs | - | - |
| Real Estate Taxes | - | - |
Property Value by Mortgage Status in Shenandoah Junction
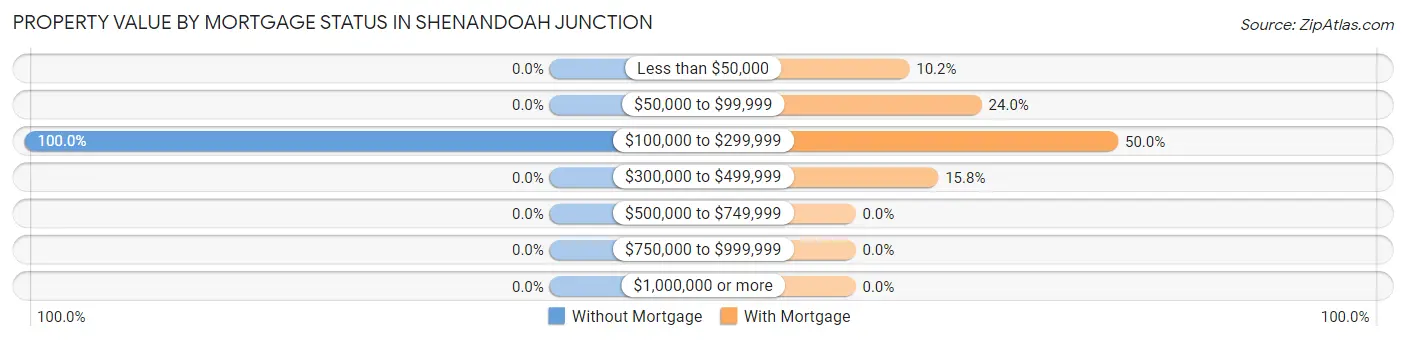
| Property Value | Without Mortgage | With Mortgage |
| Less than $50,000 | 0 (0.0%) | 26 (10.2%) |
| $50,000 to $99,999 | 0 (0.0%) | 61 (24.0%) |
| $100,000 to $299,999 | 8 (100.0%) | 127 (50.0%) |
| $300,000 to $499,999 | 0 (0.0%) | 40 (15.8%) |
| $500,000 to $749,999 | 0 (0.0%) | 0 (0.0%) |
| $750,000 to $999,999 | 0 (0.0%) | 0 (0.0%) |
| $1,000,000 or more | 0 (0.0%) | 0 (0.0%) |
| Total | 8 (100.0%) | 254 (100.0%) |
Household Income by Mortgage Status in Shenandoah Junction
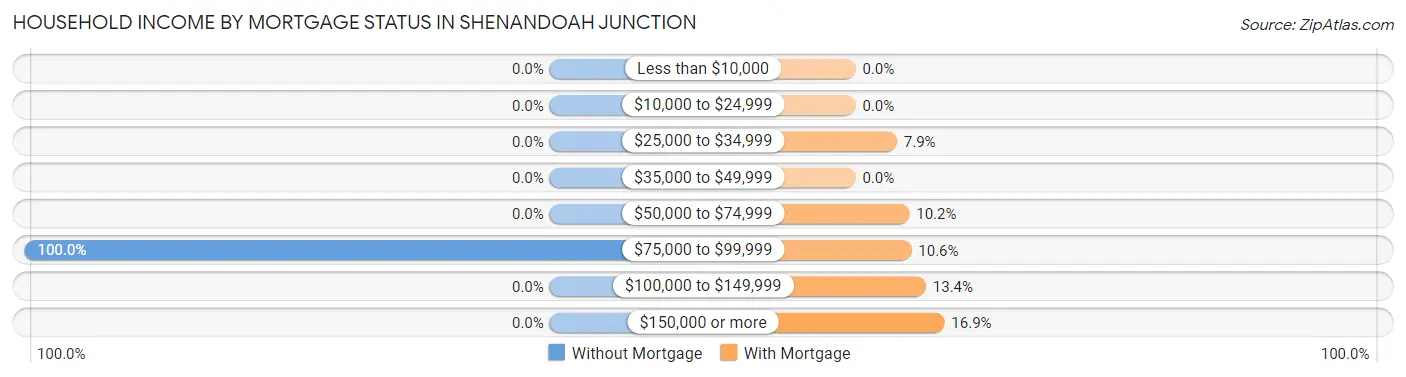
| Household Income | Without Mortgage | With Mortgage |
| Less than $10,000 | 0 (0.0%) | 0 (0.0%) |
| $10,000 to $24,999 | 0 (0.0%) | 0 (0.0%) |
| $25,000 to $34,999 | 0 (0.0%) | 20 (7.9%) |
| $35,000 to $49,999 | 0 (0.0%) | 0 (0.0%) |
| $50,000 to $74,999 | 0 (0.0%) | 26 (10.2%) |
| $75,000 to $99,999 | 8 (100.0%) | 27 (10.6%) |
| $100,000 to $149,999 | 0 (0.0%) | 34 (13.4%) |
| $150,000 or more | 0 (0.0%) | 43 (16.9%) |
| Total | 8 (100.0%) | 254 (100.0%) |
Property Value to Household Income Ratio in Shenandoah Junction
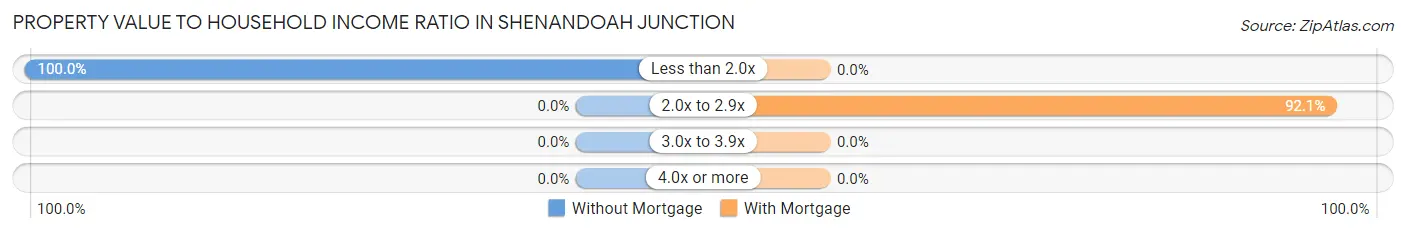
| Value-to-Income Ratio | Without Mortgage | With Mortgage |
| Less than 2.0x | 8 (100.0%) | 0 (0.0%) |
| 2.0x to 2.9x | 0 (0.0%) | 234 (92.1%) |
| 3.0x to 3.9x | 0 (0.0%) | 0 (0.0%) |
| 4.0x or more | 0 (0.0%) | 0 (0.0%) |
| Total | 8 (100.0%) | 254 (100.0%) |
Real Estate Taxes by Mortgage Status in Shenandoah Junction
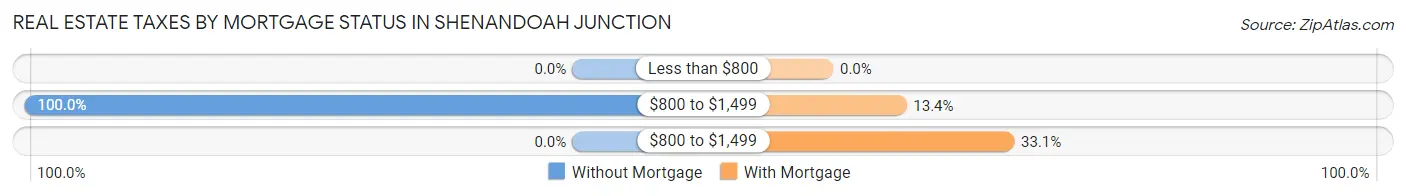
| Property Taxes | Without Mortgage | With Mortgage |
| Less than $800 | 0 (0.0%) | 0 (0.0%) |
| $800 to $1,499 | 8 (100.0%) | 34 (13.4%) |
| $800 to $1,499 | 0 (0.0%) | 84 (33.1%) |
| Total | 8 (100.0%) | 254 (100.0%) |
Health & Disability in Shenandoah Junction
Health Insurance Coverage by Age in Shenandoah Junction
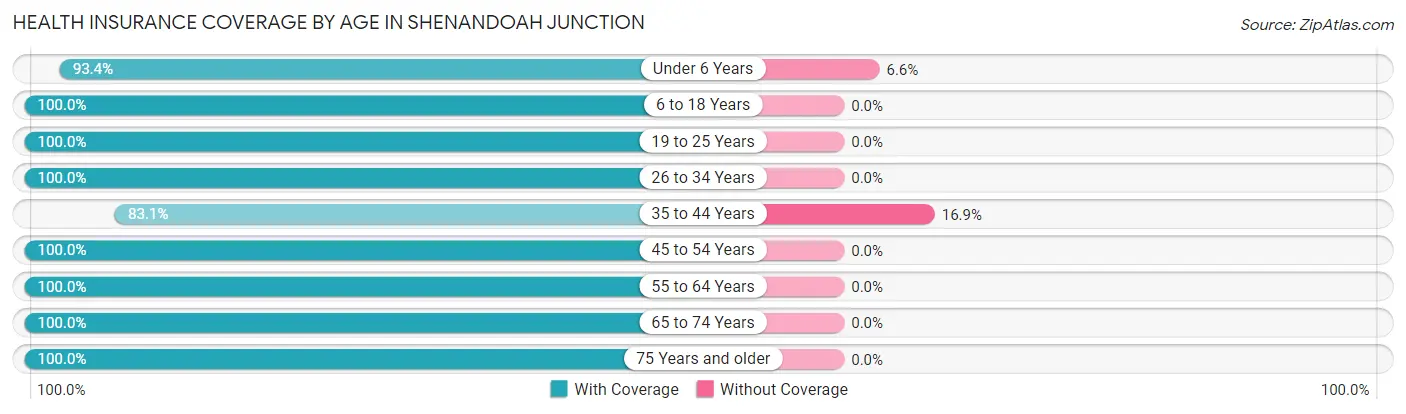
| Age Bracket | With Coverage | Without Coverage |
| Under 6 Years | 270 (93.4%) | 19 (6.6%) |
| 6 to 18 Years | 215 (100.0%) | 0 (0.0%) |
| 19 to 25 Years | 78 (100.0%) | 0 (0.0%) |
| 26 to 34 Years | 93 (100.0%) | 0 (0.0%) |
| 35 to 44 Years | 128 (83.1%) | 26 (16.9%) |
| 45 to 54 Years | 24 (100.0%) | 0 (0.0%) |
| 55 to 64 Years | 224 (100.0%) | 0 (0.0%) |
| 65 to 74 Years | 74 (100.0%) | 0 (0.0%) |
| 75 Years and older | 54 (100.0%) | 0 (0.0%) |
| Total | 1,160 (96.3%) | 45 (3.7%) |
Health Insurance Coverage by Citizenship Status in Shenandoah Junction
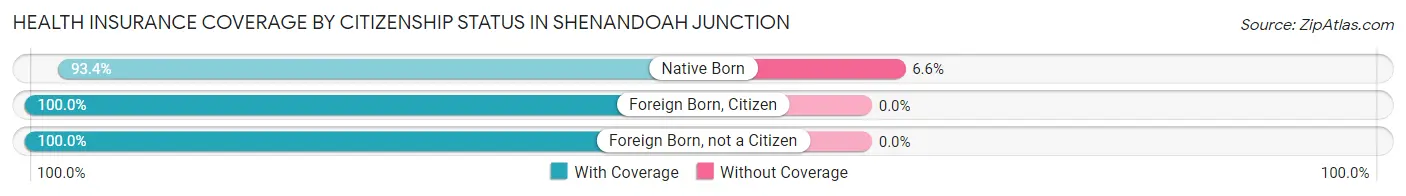
| Citizenship Status | With Coverage | Without Coverage |
| Native Born | 270 (93.4%) | 19 (6.6%) |
| Foreign Born, Citizen | 215 (100.0%) | 0 (0.0%) |
| Foreign Born, not a Citizen | 78 (100.0%) | 0 (0.0%) |
Health Insurance Coverage by Household Income in Shenandoah Junction
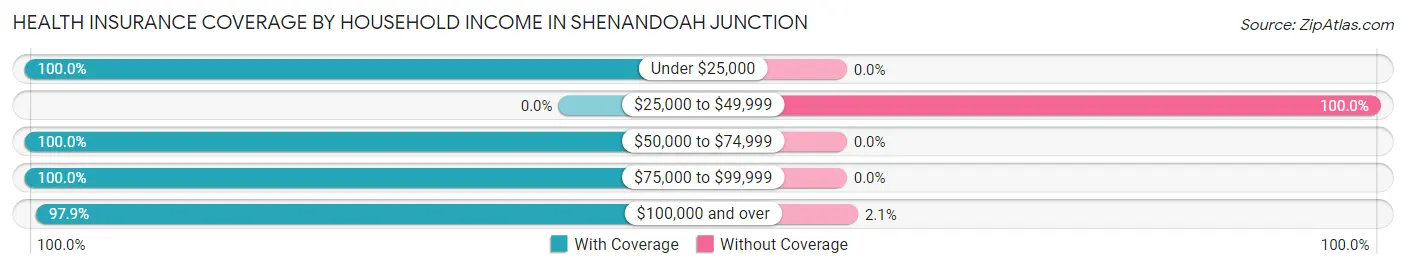
| Household Income | With Coverage | Without Coverage |
| Under $25,000 | 62 (100.0%) | 0 (0.0%) |
| $25,000 to $49,999 | 0 (0.0%) | 26 (100.0%) |
| $50,000 to $74,999 | 53 (100.0%) | 0 (0.0%) |
| $75,000 to $99,999 | 159 (100.0%) | 0 (0.0%) |
| $100,000 and over | 886 (97.9%) | 19 (2.1%) |
Public vs Private Health Insurance Coverage by Age in Shenandoah Junction
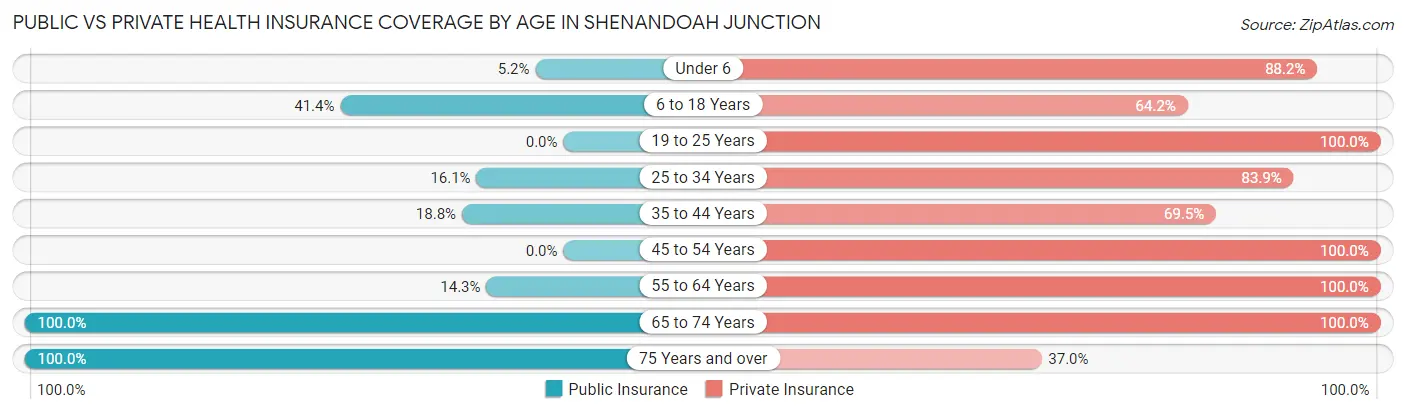
| Age Bracket | Public Insurance | Private Insurance |
| Under 6 | 15 (5.2%) | 255 (88.2%) |
| 6 to 18 Years | 89 (41.4%) | 138 (64.2%) |
| 19 to 25 Years | 0 (0.0%) | 78 (100.0%) |
| 25 to 34 Years | 15 (16.1%) | 78 (83.9%) |
| 35 to 44 Years | 29 (18.8%) | 107 (69.5%) |
| 45 to 54 Years | 0 (0.0%) | 24 (100.0%) |
| 55 to 64 Years | 32 (14.3%) | 224 (100.0%) |
| 65 to 74 Years | 74 (100.0%) | 74 (100.0%) |
| 75 Years and over | 54 (100.0%) | 20 (37.0%) |
| Total | 308 (25.6%) | 998 (82.8%) |
Disability Status by Sex by Age in Shenandoah Junction
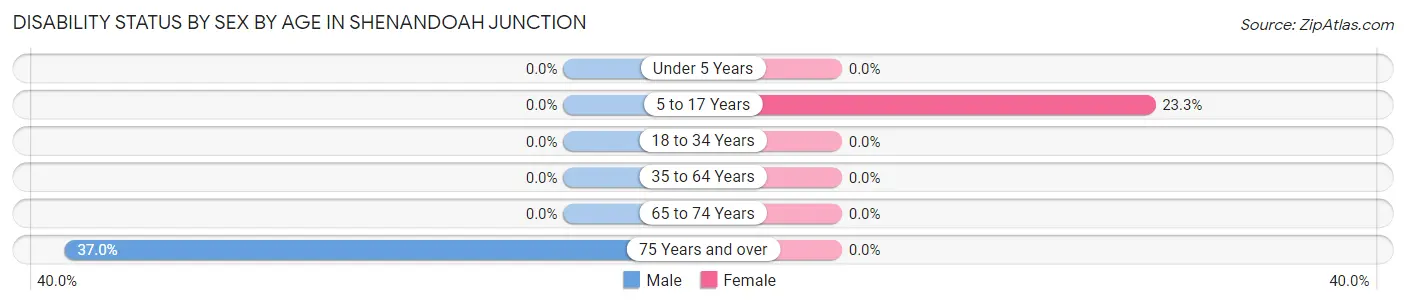
| Age Bracket | Male | Female |
| Under 5 Years | 0 (0.0%) | 0 (0.0%) |
| 5 to 17 Years | 0 (0.0%) | 37 (23.3%) |
| 18 to 34 Years | 0 (0.0%) | 0 (0.0%) |
| 35 to 64 Years | 0 (0.0%) | 0 (0.0%) |
| 65 to 74 Years | 0 (0.0%) | 0 (0.0%) |
| 75 Years and over | 20 (37.0%) | 0 (0.0%) |
Disability Class by Sex by Age in Shenandoah Junction
Disability Class: Hearing Difficulty
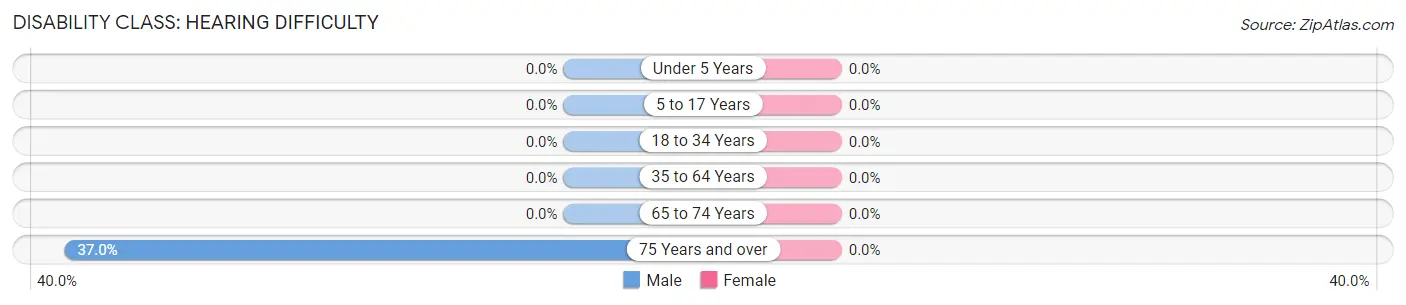
| Age Bracket | Male | Female |
| Under 5 Years | 0 (0.0%) | 0 (0.0%) |
| 5 to 17 Years | 0 (0.0%) | 0 (0.0%) |
| 18 to 34 Years | 0 (0.0%) | 0 (0.0%) |
| 35 to 64 Years | 0 (0.0%) | 0 (0.0%) |
| 65 to 74 Years | 0 (0.0%) | 0 (0.0%) |
| 75 Years and over | 20 (37.0%) | 0 (0.0%) |
Disability Class: Vision Difficulty
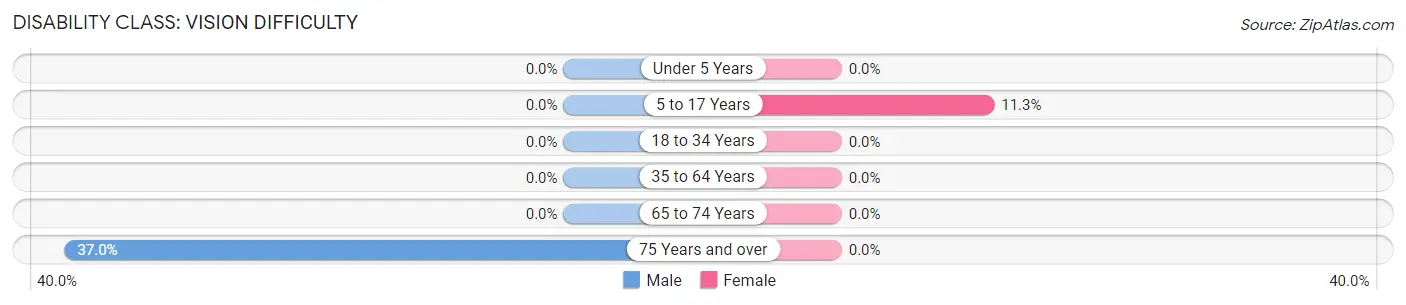
| Age Bracket | Male | Female |
| Under 5 Years | 0 (0.0%) | 0 (0.0%) |
| 5 to 17 Years | 0 (0.0%) | 18 (11.3%) |
| 18 to 34 Years | 0 (0.0%) | 0 (0.0%) |
| 35 to 64 Years | 0 (0.0%) | 0 (0.0%) |
| 65 to 74 Years | 0 (0.0%) | 0 (0.0%) |
| 75 Years and over | 20 (37.0%) | 0 (0.0%) |
Disability Class: Cognitive Difficulty
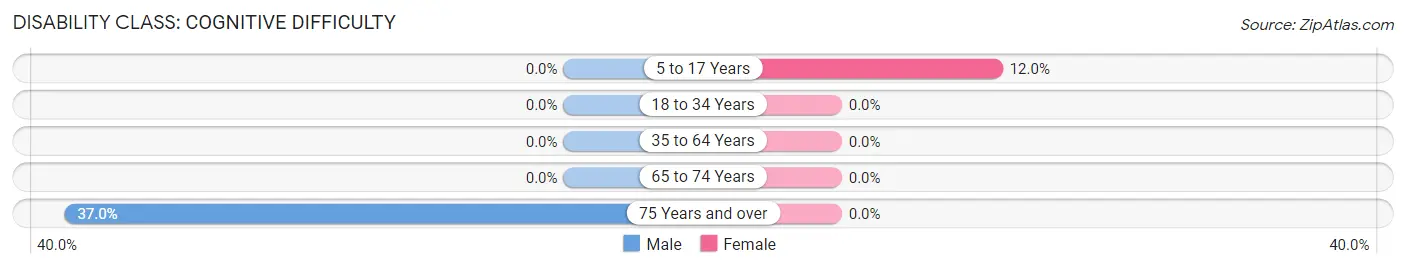
| Age Bracket | Male | Female |
| 5 to 17 Years | 0 (0.0%) | 19 (11.9%) |
| 18 to 34 Years | 0 (0.0%) | 0 (0.0%) |
| 35 to 64 Years | 0 (0.0%) | 0 (0.0%) |
| 65 to 74 Years | 0 (0.0%) | 0 (0.0%) |
| 75 Years and over | 20 (37.0%) | 0 (0.0%) |
Disability Class: Ambulatory Difficulty
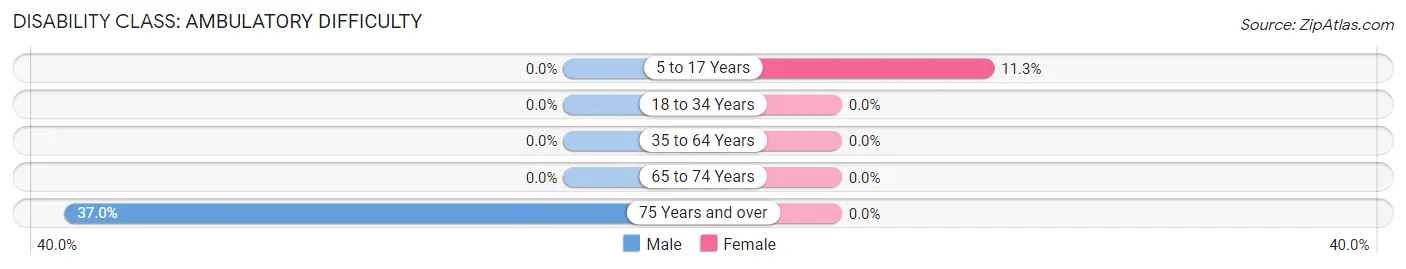
| Age Bracket | Male | Female |
| 5 to 17 Years | 0 (0.0%) | 18 (11.3%) |
| 18 to 34 Years | 0 (0.0%) | 0 (0.0%) |
| 35 to 64 Years | 0 (0.0%) | 0 (0.0%) |
| 65 to 74 Years | 0 (0.0%) | 0 (0.0%) |
| 75 Years and over | 20 (37.0%) | 0 (0.0%) |
Disability Class: Self-Care Difficulty
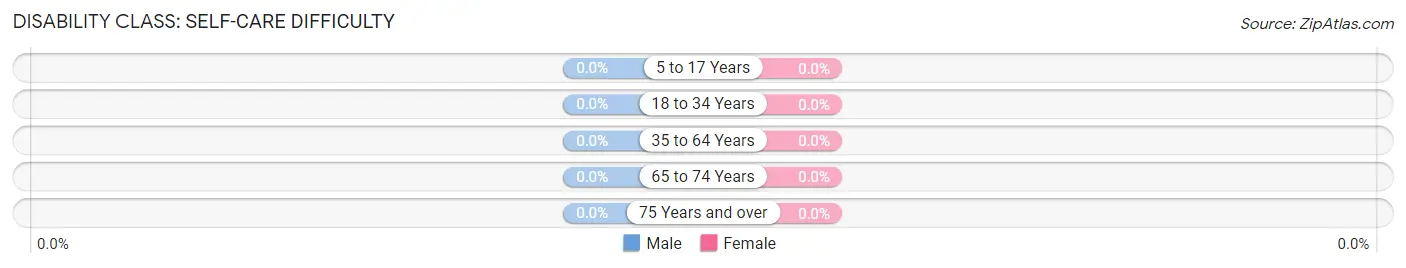
| Age Bracket | Male | Female |
| 5 to 17 Years | 0 (0.0%) | 0 (0.0%) |
| 18 to 34 Years | 0 (0.0%) | 0 (0.0%) |
| 35 to 64 Years | 0 (0.0%) | 0 (0.0%) |
| 65 to 74 Years | 0 (0.0%) | 0 (0.0%) |
| 75 Years and over | 0 (0.0%) | 0 (0.0%) |
Technology Access in Shenandoah Junction
Computing Device Access in Shenandoah Junction
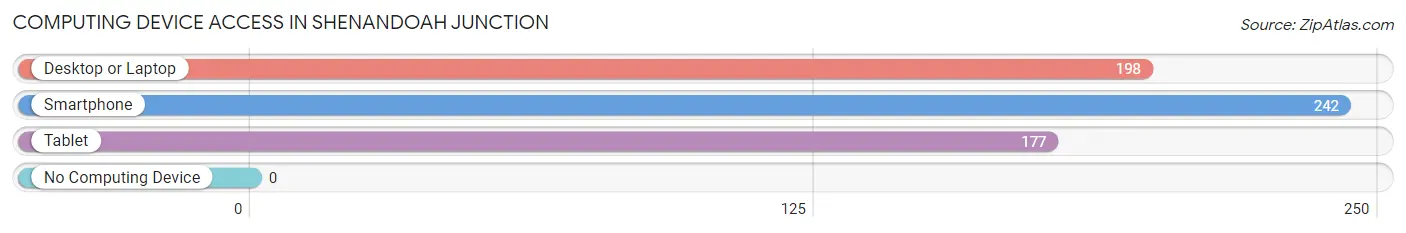
| Device Type | # Households | % Households |
| Desktop or Laptop | 198 | 65.3% |
| Smartphone | 242 | 79.9% |
| Tablet | 177 | 58.4% |
| No Computing Device | 0 | 0.0% |
| Total | 303 | 100.0% |
Internet Access in Shenandoah Junction
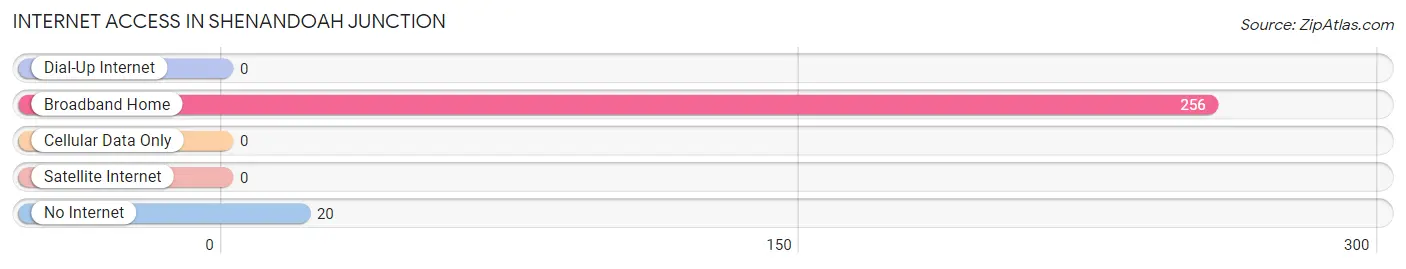
| Internet Type | # Households | % Households |
| Dial-Up Internet | 0 | 0.0% |
| Broadband Home | 256 | 84.5% |
| Cellular Data Only | 0 | 0.0% |
| Satellite Internet | 0 | 0.0% |
| No Internet | 20 | 6.6% |
| Total | 303 | 100.0% |
Shenandoah Junction Summary
Shenandoah Junction is an unincorporated community located in Jefferson County, West Virginia. It is situated along the Potomac River, just south of the city of Charles Town. The community is part of the Washington Metropolitan Area and is located approximately 25 miles northwest of Washington, D.C.
History
Shenandoah Junction was first settled in the late 1700s by German immigrants. The community was originally known as “Shenandoah” and was named after the nearby Shenandoah River. The name was changed to “Shenandoah Junction” in the early 1800s when the Baltimore and Ohio Railroad was built through the area. The railroad connected the community to the larger cities of Washington, D.C. and Baltimore.
The community was home to a number of businesses, including a grist mill, a saw mill, a blacksmith shop, and a general store. The community also had a post office, which was established in 1851.
Geography
Shenandoah Junction is located in the eastern panhandle of West Virginia, in Jefferson County. It is situated along the Potomac River, just south of the city of Charles Town. The community is part of the Washington Metropolitan Area and is located approximately 25 miles northwest of Washington, D.C.
The community is located in a rural area, with rolling hills and farmland. The climate is temperate, with hot summers and cold winters. The average annual temperature is around 50 degrees Fahrenheit.
Economy
Shenandoah Junction is a small, rural community with a limited economy. The primary industries in the area are agriculture and tourism. The community is home to several farms, which produce a variety of crops, including corn, soybeans, wheat, and hay.
The community is also home to several tourist attractions, including the Harpers Ferry National Historical Park, the Appalachian Trail, and the C&O Canal. These attractions draw visitors from all over the world, providing a boost to the local economy.
Demographics
As of the 2010 census, the population of Shenandoah Junction was 1,845. The racial makeup of the community was 94.3% White, 2.3% African American, 0.3% Native American, 0.7% Asian, 0.1% Pacific Islander, and 2.3% from other races. The median household income was $50,938, and the median family income was $60,938.
Conclusion
Shenandoah Junction is a small, rural community located in Jefferson County, West Virginia. It is situated along the Potomac River, just south of the city of Charles Town. The community is part of the Washington Metropolitan Area and is located approximately 25 miles northwest of Washington, D.C. The primary industries in the area are agriculture and tourism. The population of Shenandoah Junction was 1,845 as of the 2010 census, with a median household income of $50,938.
Common Questions
What is Per Capita Income in Shenandoah Junction?
Per Capita income in Shenandoah Junction is $36,797.
What is the Median Household income in Shenandoah Junction?
Median Household Income in Shenandoah Junction is $102,552.
What is Income or Wage Gap in Shenandoah Junction?
Income or Wage Gap in Shenandoah Junction is 45.3%.
Women in Shenandoah Junction earn 54.7 cents for every dollar earned by a man.
What is Inequality or Gini Index in Shenandoah Junction?
Inequality or Gini Index in Shenandoah Junction is 0.43.
What is the Total Population of Shenandoah Junction?
Total Population of Shenandoah Junction is 1,205.
What is the Total Male Population of Shenandoah Junction?
Total Male Population of Shenandoah Junction is 698.
What is the Total Female Population of Shenandoah Junction?
Total Female Population of Shenandoah Junction is 507.
What is the Ratio of Males per 100 Females in Shenandoah Junction?
There are 137.67 Males per 100 Females in Shenandoah Junction.
What is the Ratio of Females per 100 Males in Shenandoah Junction?
There are 72.64 Females per 100 Males in Shenandoah Junction.
What is the Median Population Age in Shenandoah Junction?
Median Population Age in Shenandoah Junction is 31.2 Years.
What is the Average Family Size in Shenandoah Junction
Average Family Size in Shenandoah Junction is 4.5 People.
What is the Average Household Size in Shenandoah Junction
Average Household Size in Shenandoah Junction is 4.0 People.
How Large is the Labor Force in Shenandoah Junction?
There are 695 People in the Labor Forcein in Shenandoah Junction.
What is the Percentage of People in the Labor Force in Shenandoah Junction?
83.8% of People are in the Labor Force in Shenandoah Junction.