Sistersville, WV Map & Demographics
Sistersville Map
Sistersville Overview
$24,280
PER CAPITA INCOME
$78,555
AVG FAMILY INCOME
$38,950
AVG HOUSEHOLD INCOME
58.2%
WAGE / INCOME GAP [ % ]
41.8¢/ $1
WAGE / INCOME GAP [ $ ]
0.51
INEQUALITY / GINI INDEX
1,261
TOTAL POPULATION
495
MALE POPULATION
766
FEMALE POPULATION
64.62
MALES / 100 FEMALES
154.75
FEMALES / 100 MALES
50.9
MEDIAN AGE
3.4
AVG FAMILY SIZE
2.2
AVG HOUSEHOLD SIZE
430
LABOR FORCE [ PEOPLE ]
41.1%
PERCENT IN LABOR FORCE
9.1%
UNEMPLOYMENT RATE
Sistersville Zip Codes
Sistersville Area Codes
Income in Sistersville
Income Overview in Sistersville
Per Capita Income in Sistersville is $24,280, while median incomes of families and households are $78,555 and $38,950 respectively.
| Characteristic | Number | Measure |
| Per Capita Income | 1,261 | $24,280 |
| Median Family Income | 277 | $78,555 |
| Mean Family Income | 277 | $80,947 |
| Median Household Income | 573 | $38,950 |
| Mean Household Income | 573 | $49,433 |
| Income Deficit | 277 | $0 |
| Wage / Income Gap (%) | 1,261 | 58.19% |
| Wage / Income Gap ($) | 1,261 | 41.81¢ per $1 |
| Gini / Inequality Index | 1,261 | 0.51 |
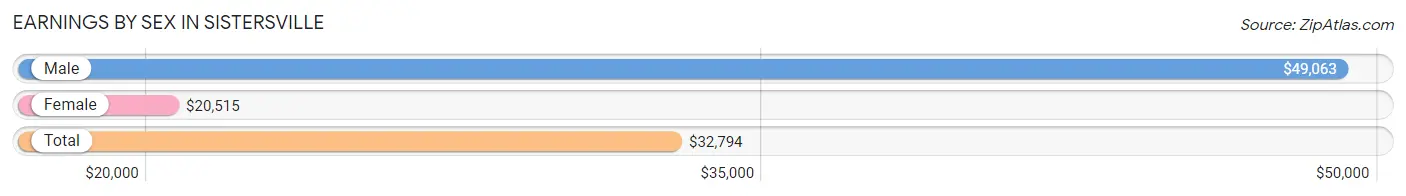
Earnings by Sex in Sistersville
Average Earnings in Sistersville are $32,794, $49,063 for men and $20,515 for women, a difference of 58.2%.
| Sex | Number | Average Earnings |
| Male | 177 (39.3%) | $49,063 |
| Female | 273 (60.7%) | $20,515 |
| Total | 450 (100.0%) | $32,794 |
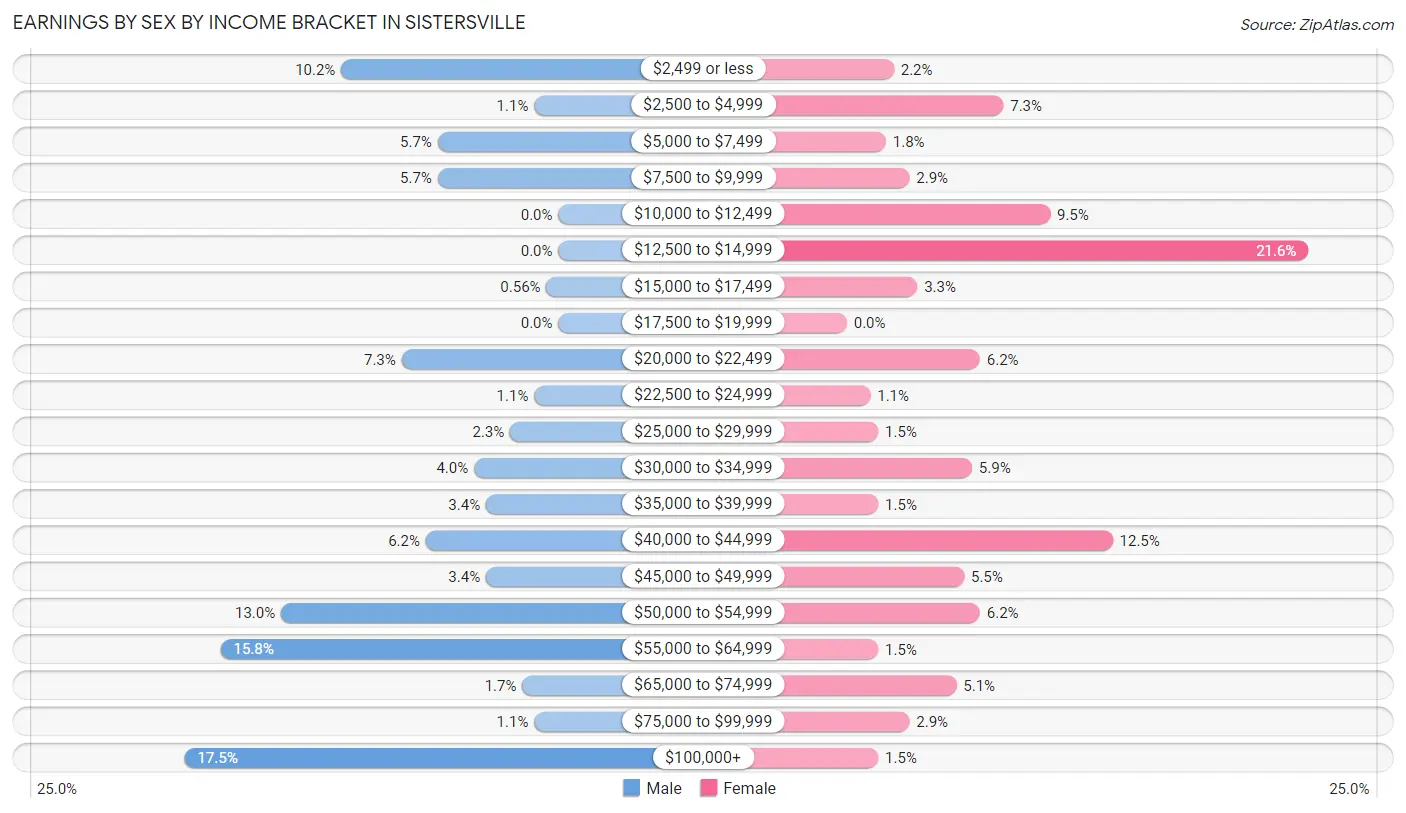
Earnings by Sex by Income Bracket in Sistersville
The most common earnings brackets in Sistersville are $100,000+ for men (31 | 17.5%) and $12,500 to $14,999 for women (59 | 21.6%).
| Income | Male | Female |
| $2,499 or less | 18 (10.2%) | 6 (2.2%) |
| $2,500 to $4,999 | 2 (1.1%) | 20 (7.3%) |
| $5,000 to $7,499 | 10 (5.7%) | 5 (1.8%) |
| $7,500 to $9,999 | 10 (5.7%) | 8 (2.9%) |
| $10,000 to $12,499 | 0 (0.0%) | 26 (9.5%) |
| $12,500 to $14,999 | 0 (0.0%) | 59 (21.6%) |
| $15,000 to $17,499 | 1 (0.6%) | 9 (3.3%) |
| $17,500 to $19,999 | 0 (0.0%) | 0 (0.0%) |
| $20,000 to $22,499 | 13 (7.3%) | 17 (6.2%) |
| $22,500 to $24,999 | 2 (1.1%) | 3 (1.1%) |
| $25,000 to $29,999 | 4 (2.3%) | 4 (1.5%) |
| $30,000 to $34,999 | 7 (4.0%) | 16 (5.9%) |
| $35,000 to $39,999 | 6 (3.4%) | 4 (1.5%) |
| $40,000 to $44,999 | 11 (6.2%) | 34 (12.4%) |
| $45,000 to $49,999 | 6 (3.4%) | 15 (5.5%) |
| $50,000 to $54,999 | 23 (13.0%) | 17 (6.2%) |
| $55,000 to $64,999 | 28 (15.8%) | 4 (1.5%) |
| $65,000 to $74,999 | 3 (1.7%) | 14 (5.1%) |
| $75,000 to $99,999 | 2 (1.1%) | 8 (2.9%) |
| $100,000+ | 31 (17.5%) | 4 (1.5%) |
| Total | 177 (100.0%) | 273 (100.0%) |
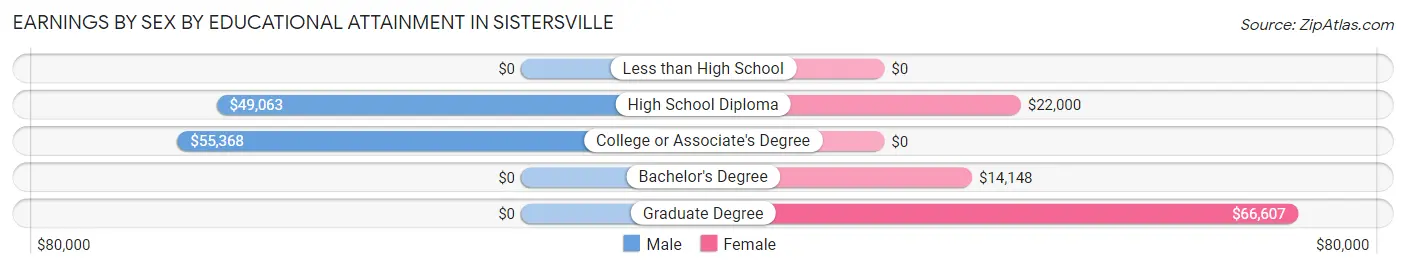
Earnings by Sex by Educational Attainment in Sistersville
Average earnings in Sistersville are $51,319 for men and $20,735 for women, a difference of 59.6%. Men with an educational attainment of college or associate's degree enjoy the highest average annual earnings of $55,368, while those with high school diploma education earn the least with $49,063. Women with an educational attainment of graduate degree earn the most with the average annual earnings of $66,607, while those with bachelor's degree education have the smallest earnings of $14,148.
| Educational Attainment | Male Income | Female Income |
| Less than High School | - | - |
| High School Diploma | $49,063 | $22,000 |
| College or Associate's Degree | $55,368 | $0 |
| Bachelor's Degree | - | - |
| Graduate Degree | - | - |
| Total | $51,319 | $20,735 |
Family Income in Sistersville
Family Income Brackets in Sistersville
According to the Sistersville family income data, there are 123 families falling into the $75,000 to $99,999 income range, which is the most common income bracket and makes up 44.4% of all families. Conversely, the $25,000 to $34,999 income bracket is the least frequent group with only 1 families (0.4%) belonging to this category.
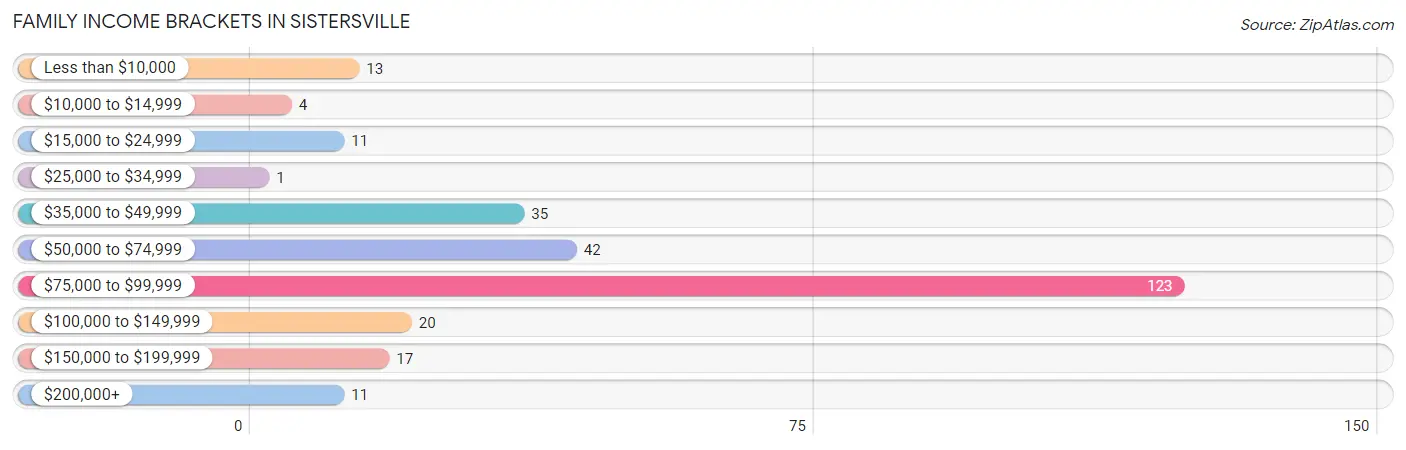
| Income Bracket | # Families | % Families |
| Less than $10,000 | 13 | 4.7% |
| $10,000 to $14,999 | 4 | 1.4% |
| $15,000 to $24,999 | 11 | 4.0% |
| $25,000 to $34,999 | 1 | 0.4% |
| $35,000 to $49,999 | 35 | 12.6% |
| $50,000 to $74,999 | 42 | 15.2% |
| $75,000 to $99,999 | 123 | 44.4% |
| $100,000 to $149,999 | 20 | 7.2% |
| $150,000 to $199,999 | 17 | 6.1% |
| $200,000+ | 11 | 4.0% |
Family Income by Famaliy Size in Sistersville
4-person families (99 | 35.7%) account for the highest median family income in Sistersville with $79,203 per family, while 2-person families (140 | 50.5%) have the highest median income of $33,750 per family member.
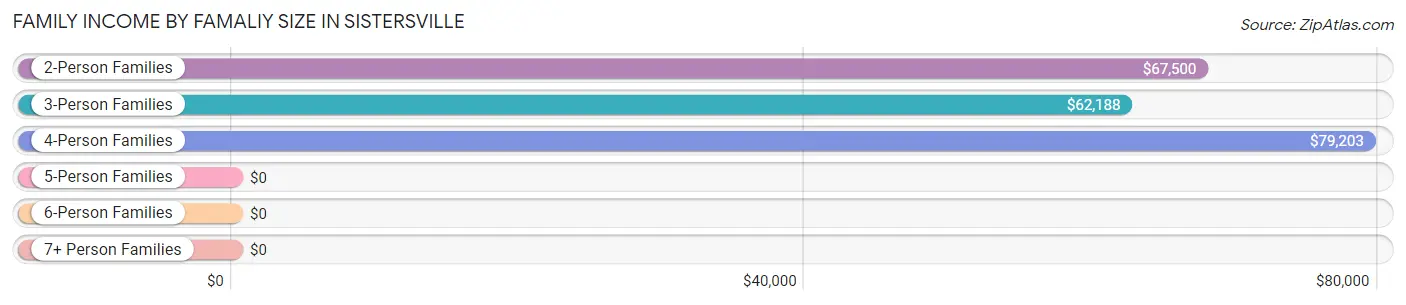
| Income Bracket | # Families | Median Income |
| 2-Person Families | 140 (50.5%) | $67,500 |
| 3-Person Families | 37 (13.4%) | $62,188 |
| 4-Person Families | 99 (35.7%) | $79,203 |
| 5-Person Families | 0 (0.0%) | $0 |
| 6-Person Families | 1 (0.4%) | $0 |
| 7+ Person Families | 0 (0.0%) | $0 |
| Total | 277 (100.0%) | $78,555 |
Family Income by Number of Earners in Sistersville
The median family income in Sistersville is $78,555, with families comprising 3+ earners (20) having the highest median family income of $153,125, while families with no earners (83) have the lowest median family income of $57,708, accounting for 7.2% and 30.0% of families, respectively.
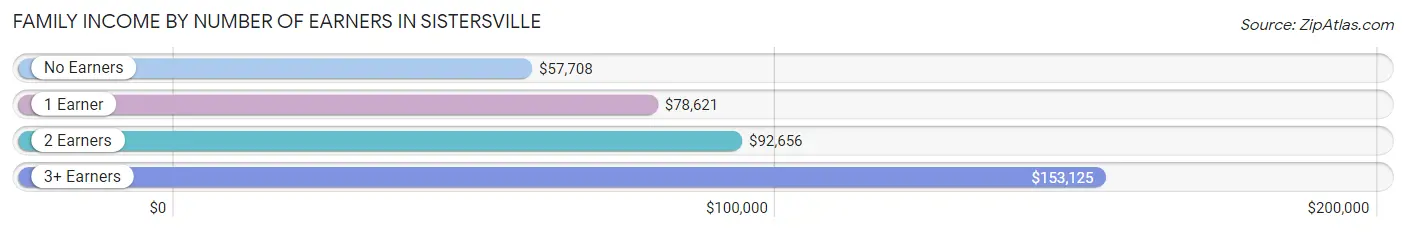
| Number of Earners | # Families | Median Income |
| No Earners | 83 (30.0%) | $57,708 |
| 1 Earner | 114 (41.2%) | $78,621 |
| 2 Earners | 60 (21.7%) | $92,656 |
| 3+ Earners | 20 (7.2%) | $153,125 |
| Total | 277 (100.0%) | $78,555 |
Household Income in Sistersville
Household Income Brackets in Sistersville
With 131 households falling in the category, the $75,000 to $99,999 income range is the most frequent in Sistersville, accounting for 22.9% of all households. In contrast, only 11 households (1.9%) fall into the $200,000+ income bracket, making it the least populous group.
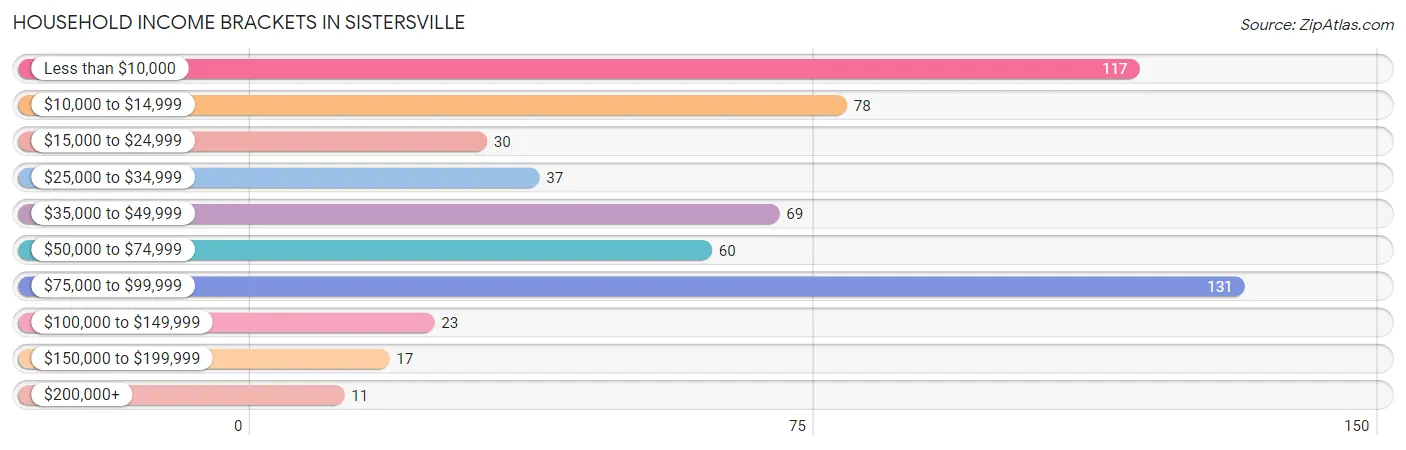
| Income Bracket | # Households | % Households |
| Less than $10,000 | 117 | 20.4% |
| $10,000 to $14,999 | 78 | 13.6% |
| $15,000 to $24,999 | 30 | 5.2% |
| $25,000 to $34,999 | 37 | 6.5% |
| $35,000 to $49,999 | 69 | 12.0% |
| $50,000 to $74,999 | 60 | 10.5% |
| $75,000 to $99,999 | 131 | 22.9% |
| $100,000 to $149,999 | 23 | 4.0% |
| $150,000 to $199,999 | 17 | 3.0% |
| $200,000+ | 11 | 1.9% |
Household Income by Householder Age in Sistersville
The median household income in Sistersville is $38,950, with the highest median household income of $55,972 found in the 25 to 44 years age bracket for the primary householder. A total of 79 households (13.8%) fall into this category. Meanwhile, the 45 to 64 years age bracket for the primary householder has the lowest median household income of $0, with 299 households (52.2%) in this group.
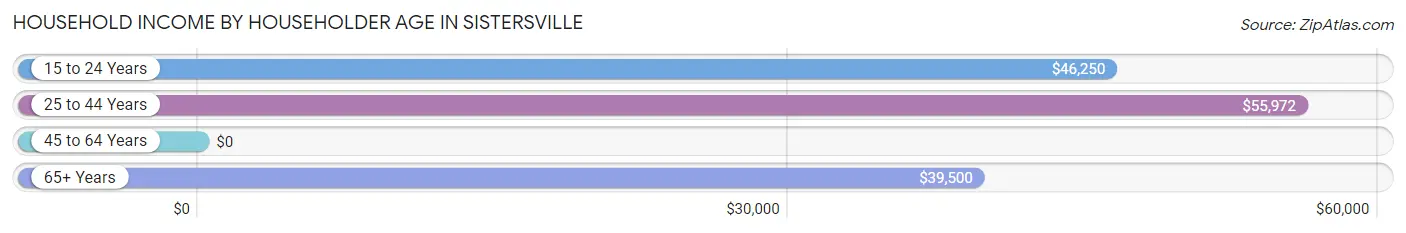
| Income Bracket | # Households | Median Income |
| 15 to 24 Years | 3 (0.5%) | $46,250 |
| 25 to 44 Years | 79 (13.8%) | $55,972 |
| 45 to 64 Years | 299 (52.2%) | $0 |
| 65+ Years | 192 (33.5%) | $39,500 |
| Total | 573 (100.0%) | $38,950 |
Poverty in Sistersville
Income Below Poverty by Sex and Age in Sistersville
With 15.8% poverty level for males and 33.7% for females among the residents of Sistersville, under 5 year old males and 5 year old females are the most vulnerable to poverty, with 7 males (63.6%) and 3 females (100.0%) in their respective age groups living below the poverty level.
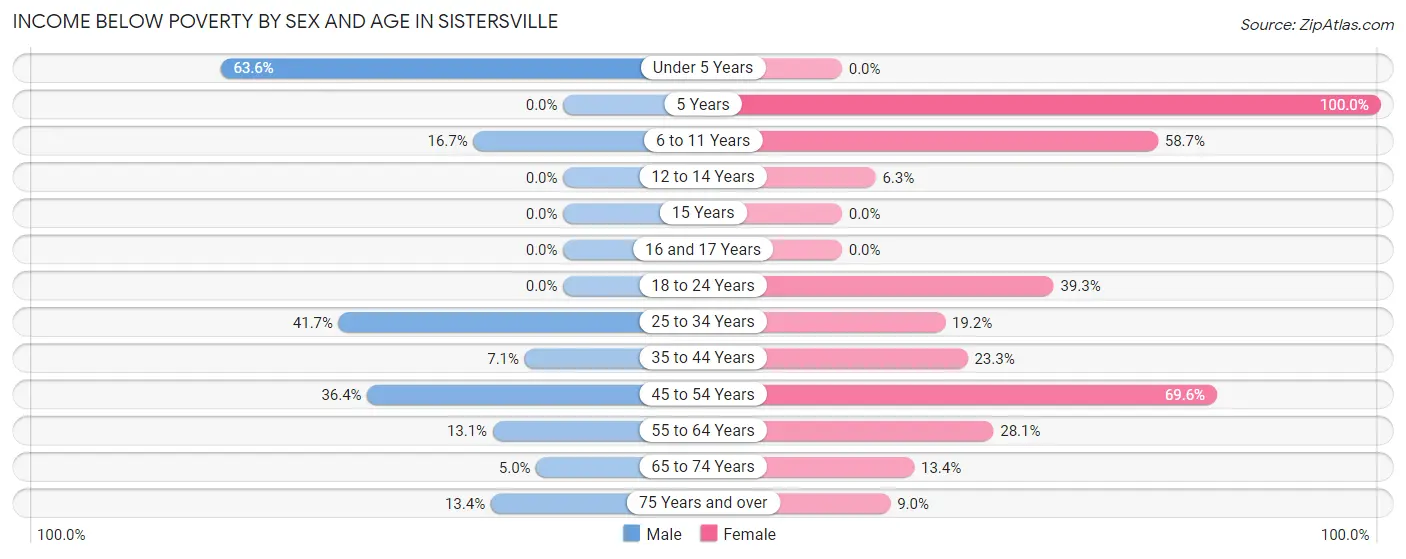
| Age Bracket | Male | Female |
| Under 5 Years | 7 (63.6%) | 0 (0.0%) |
| 5 Years | 0 (0.0%) | 3 (100.0%) |
| 6 to 11 Years | 4 (16.7%) | 61 (58.7%) |
| 12 to 14 Years | 0 (0.0%) | 2 (6.2%) |
| 15 Years | 0 (0.0%) | 0 (0.0%) |
| 16 and 17 Years | 0 (0.0%) | 0 (0.0%) |
| 18 to 24 Years | 0 (0.0%) | 11 (39.3%) |
| 25 to 34 Years | 20 (41.7%) | 9 (19.2%) |
| 35 to 44 Years | 4 (7.1%) | 14 (23.3%) |
| 45 to 54 Years | 12 (36.4%) | 94 (69.6%) |
| 55 to 64 Years | 20 (13.1%) | 45 (28.1%) |
| 65 to 74 Years | 2 (5.0%) | 11 (13.4%) |
| 75 Years and over | 9 (13.4%) | 8 (9.0%) |
| Total | 78 (15.8%) | 258 (33.7%) |
Income Above Poverty by Sex and Age in Sistersville
According to the poverty statistics in Sistersville, males aged 5 years and females aged under 5 years are the age groups that are most secure financially, with 100.0% of males and 100.0% of females in these age groups living above the poverty line.
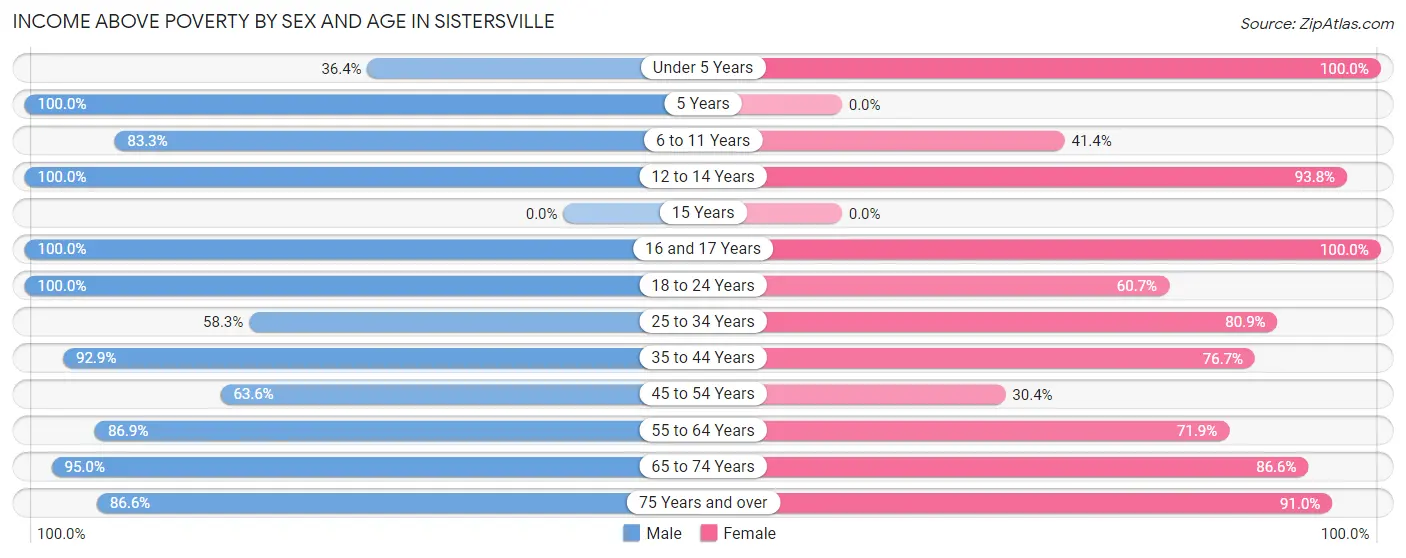
| Age Bracket | Male | Female |
| Under 5 Years | 4 (36.4%) | 24 (100.0%) |
| 5 Years | 4 (100.0%) | 0 (0.0%) |
| 6 to 11 Years | 20 (83.3%) | 43 (41.3%) |
| 12 to 14 Years | 12 (100.0%) | 30 (93.8%) |
| 15 Years | 0 (0.0%) | 0 (0.0%) |
| 16 and 17 Years | 13 (100.0%) | 2 (100.0%) |
| 18 to 24 Years | 34 (100.0%) | 17 (60.7%) |
| 25 to 34 Years | 28 (58.3%) | 38 (80.8%) |
| 35 to 44 Years | 52 (92.9%) | 46 (76.7%) |
| 45 to 54 Years | 21 (63.6%) | 41 (30.4%) |
| 55 to 64 Years | 133 (86.9%) | 115 (71.9%) |
| 65 to 74 Years | 38 (95.0%) | 71 (86.6%) |
| 75 Years and over | 58 (86.6%) | 81 (91.0%) |
| Total | 417 (84.2%) | 508 (66.3%) |
Income Below Poverty Among Married-Couple Families in Sistersville
The poverty statistics for married-couple families in Sistersville show that 1.3% or 3 of the total 237 families live below the poverty line. Families with 1 or 2 children have the highest poverty rate of 2.5%, comprising of 1 families. On the other hand, families with 3 or 4 children have the lowest poverty rate of 0.0%, which includes 0 families.
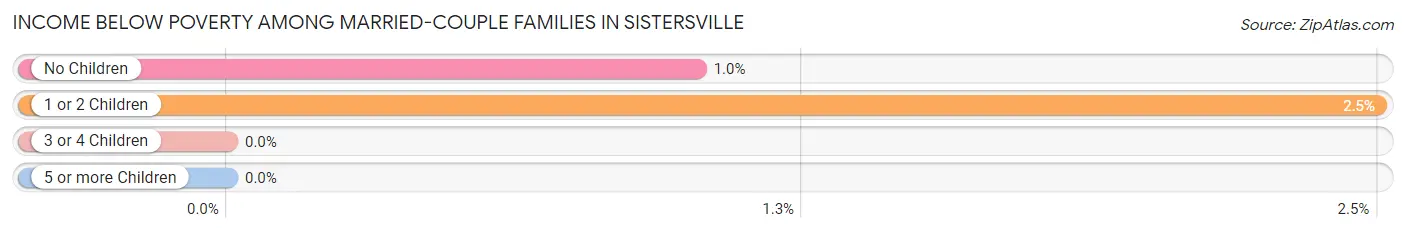
| Children | Above Poverty | Below Poverty |
| No Children | 194 (99.0%) | 2 (1.0%) |
| 1 or 2 Children | 39 (97.5%) | 1 (2.5%) |
| 3 or 4 Children | 1 (100.0%) | 0 (0.0%) |
| 5 or more Children | 0 (0.0%) | 0 (0.0%) |
| Total | 234 (98.7%) | 3 (1.3%) |
Income Below Poverty Among Single-Parent Households in Sistersville
According to the poverty data in Sistersville, 41.7% or 5 single-father households and 39.3% or 11 single-mother households are living below the poverty line. Among single-father households, those with no children have the highest poverty rate, with 5 households (71.4%) experiencing poverty. Likewise, among single-mother households, those with 1 or 2 children have the highest poverty rate, with 9 households (100.0%) falling below the poverty line.
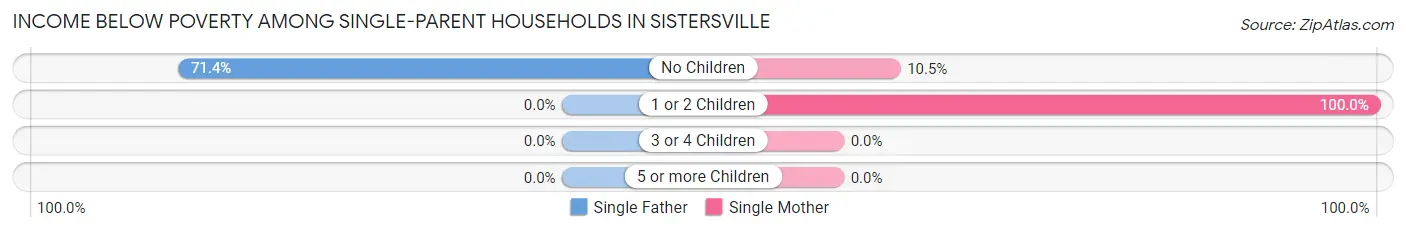
| Children | Single Father | Single Mother |
| No Children | 5 (71.4%) | 2 (10.5%) |
| 1 or 2 Children | 0 (0.0%) | 9 (100.0%) |
| 3 or 4 Children | 0 (0.0%) | 0 (0.0%) |
| 5 or more Children | 0 (0.0%) | 0 (0.0%) |
| Total | 5 (41.7%) | 11 (39.3%) |
Income Below Poverty Among Married-Couple vs Single-Parent Households in Sistersville
The poverty data for Sistersville shows that 3 of the married-couple family households (1.3%) and 16 of the single-parent households (40.0%) are living below the poverty level. Within the married-couple family households, those with 1 or 2 children have the highest poverty rate, with 1 households (2.5%) falling below the poverty line. Among the single-parent households, those with 1 or 2 children have the highest poverty rate, with 9 household (64.3%) living below poverty.
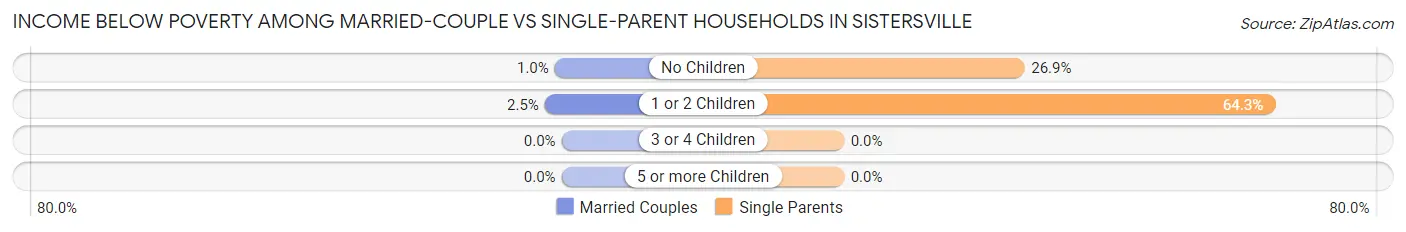
| Children | Married-Couple Families | Single-Parent Households |
| No Children | 2 (1.0%) | 7 (26.9%) |
| 1 or 2 Children | 1 (2.5%) | 9 (64.3%) |
| 3 or 4 Children | 0 (0.0%) | 0 (0.0%) |
| 5 or more Children | 0 (0.0%) | 0 (0.0%) |
| Total | 3 (1.3%) | 16 (40.0%) |
Race in Sistersville
The most populous races in Sistersville are White / Caucasian (1,069 | 84.8%), Two or more Races (134 | 10.6%), and Hispanic or Latino (117 | 9.3%).
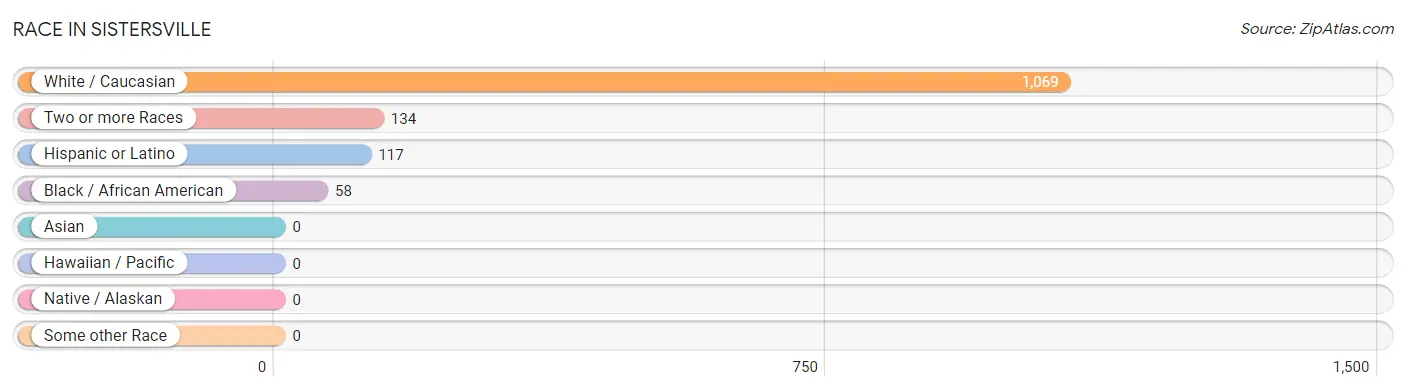
| Race | # Population | % Population |
| Asian | 0 | 0.0% |
| Black / African American | 58 | 4.6% |
| Hawaiian / Pacific | 0 | 0.0% |
| Hispanic or Latino | 117 | 9.3% |
| Native / Alaskan | 0 | 0.0% |
| White / Caucasian | 1,069 | 84.8% |
| Two or more Races | 134 | 10.6% |
| Some other Race | 0 | 0.0% |
| Total | 1,261 | 100.0% |
Ancestry in Sistersville
The most populous ancestries reported in Sistersville are German (248 | 19.7%), Irish (161 | 12.8%), English (146 | 11.6%), American (130 | 10.3%), and Spanish (94 | 7.4%), together accounting for 61.8% of all Sistersville residents.
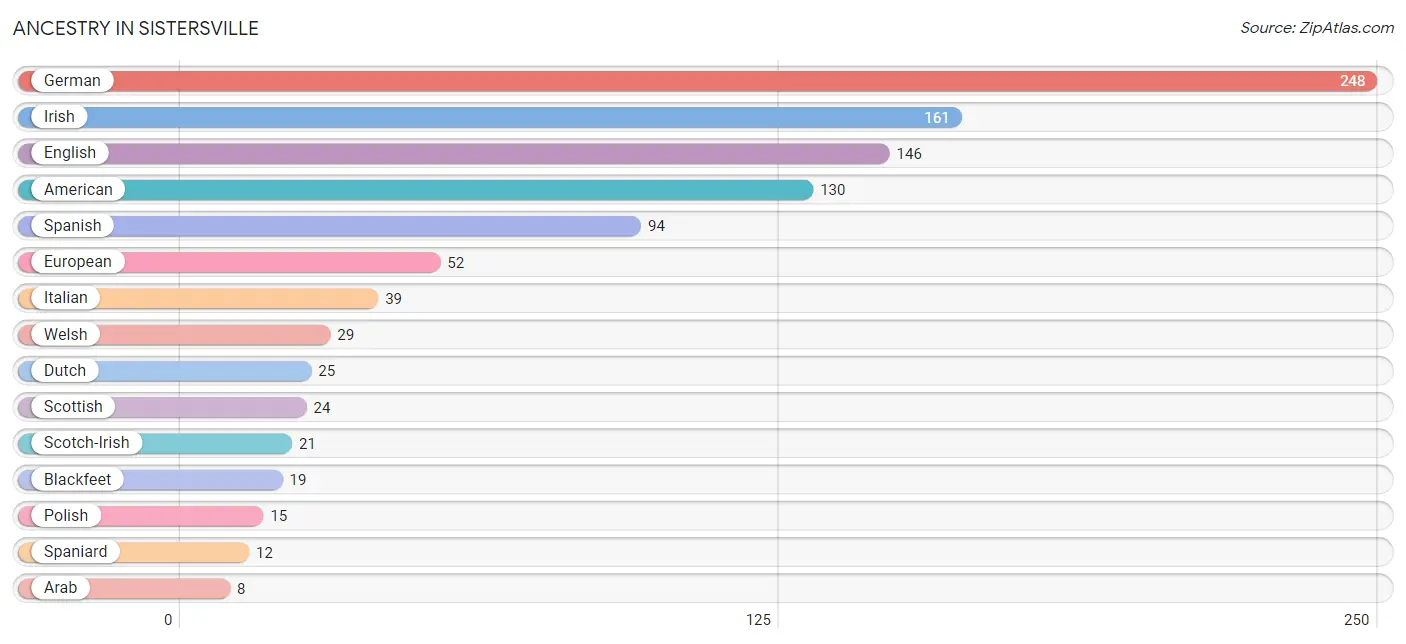
| Ancestry | # Population | % Population |
| American | 130 | 10.3% |
| Arab | 8 | 0.6% |
| Blackfeet | 19 | 1.5% |
| Canadian | 7 | 0.6% |
| Cherokee | 1 | 0.1% |
| Dutch | 25 | 2.0% |
| English | 146 | 11.6% |
| European | 52 | 4.1% |
| French | 5 | 0.4% |
| German | 248 | 19.7% |
| Irish | 161 | 12.8% |
| Iroquois | 1 | 0.1% |
| Italian | 39 | 3.1% |
| Lebanese | 4 | 0.3% |
| Mexican | 5 | 0.4% |
| Norwegian | 4 | 0.3% |
| Polish | 15 | 1.2% |
| Russian | 2 | 0.2% |
| Scotch-Irish | 21 | 1.7% |
| Scottish | 24 | 1.9% |
| Sioux | 1 | 0.1% |
| Spaniard | 12 | 0.9% |
| Spanish | 94 | 7.4% |
| Swiss | 1 | 0.1% |
| Welsh | 29 | 2.3% | View All 25 Rows |
Immigrants in Sistersville
The most numerous immigrant groups reported in Sistersville came from , and Canada (7 | 0.6%), together accounting for 0.6% of all Sistersville residents.

| Immigration Origin | # Population | % Population |
| Canada | 7 | 0.6% | View All 1 Rows |
Sex and Age in Sistersville
Sex and Age in Sistersville
The most populous age groups in Sistersville are 60 to 64 Years (112 | 22.6%) for men and 50 to 54 Years (124 | 16.2%) for women.
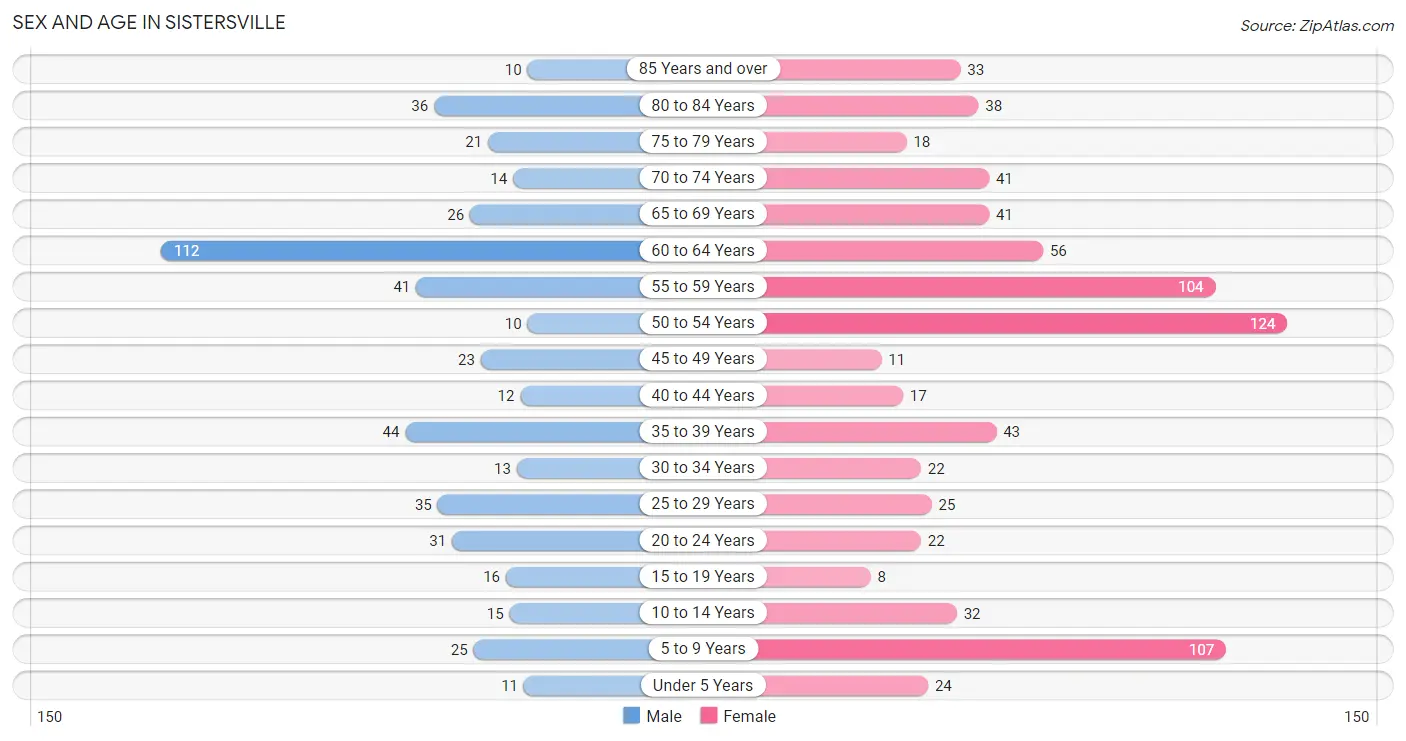
| Age Bracket | Male | Female |
| Under 5 Years | 11 (2.2%) | 24 (3.1%) |
| 5 to 9 Years | 25 (5.1%) | 107 (14.0%) |
| 10 to 14 Years | 15 (3.0%) | 32 (4.2%) |
| 15 to 19 Years | 16 (3.2%) | 8 (1.0%) |
| 20 to 24 Years | 31 (6.3%) | 22 (2.9%) |
| 25 to 29 Years | 35 (7.1%) | 25 (3.3%) |
| 30 to 34 Years | 13 (2.6%) | 22 (2.9%) |
| 35 to 39 Years | 44 (8.9%) | 43 (5.6%) |
| 40 to 44 Years | 12 (2.4%) | 17 (2.2%) |
| 45 to 49 Years | 23 (4.6%) | 11 (1.4%) |
| 50 to 54 Years | 10 (2.0%) | 124 (16.2%) |
| 55 to 59 Years | 41 (8.3%) | 104 (13.6%) |
| 60 to 64 Years | 112 (22.6%) | 56 (7.3%) |
| 65 to 69 Years | 26 (5.2%) | 41 (5.3%) |
| 70 to 74 Years | 14 (2.8%) | 41 (5.3%) |
| 75 to 79 Years | 21 (4.2%) | 18 (2.4%) |
| 80 to 84 Years | 36 (7.3%) | 38 (5.0%) |
| 85 Years and over | 10 (2.0%) | 33 (4.3%) |
| Total | 495 (100.0%) | 766 (100.0%) |
Families and Households in Sistersville
Median Family Size in Sistersville
The median family size in Sistersville is 3.37 persons per family, with single female/mother families (28 | 10.1%) accounting for the largest median family size of 6.79 persons per family. On the other hand, married-couple families (237 | 85.6%) represent the smallest median family size with 2.82 persons per family.
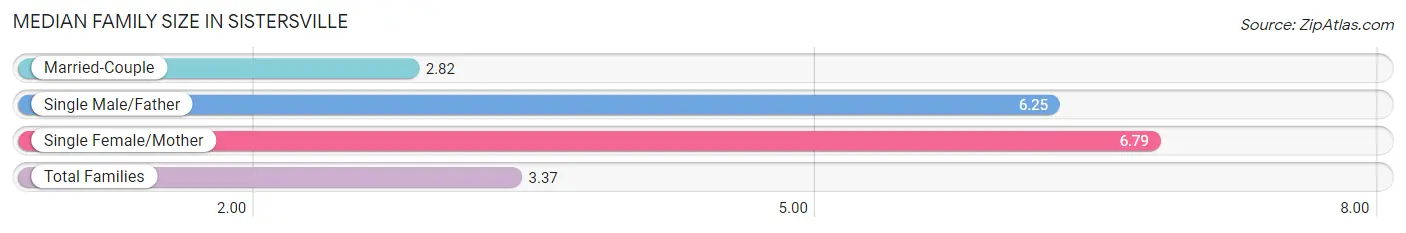
| Family Type | # Families | Family Size |
| Married-Couple | 237 (85.6%) | 2.82 |
| Single Male/Father | 12 (4.3%) | 6.25 |
| Single Female/Mother | 28 (10.1%) | 6.79 |
| Total Families | 277 (100.0%) | 3.37 |
Median Household Size in Sistersville
The median household size in Sistersville is 2.19 persons per household, with single female/mother households (28 | 4.9%) accounting for the largest median household size of 7.32 persons per household. non-family households (296 | 51.7%) represent the smallest median household size with 1.04 persons per household.
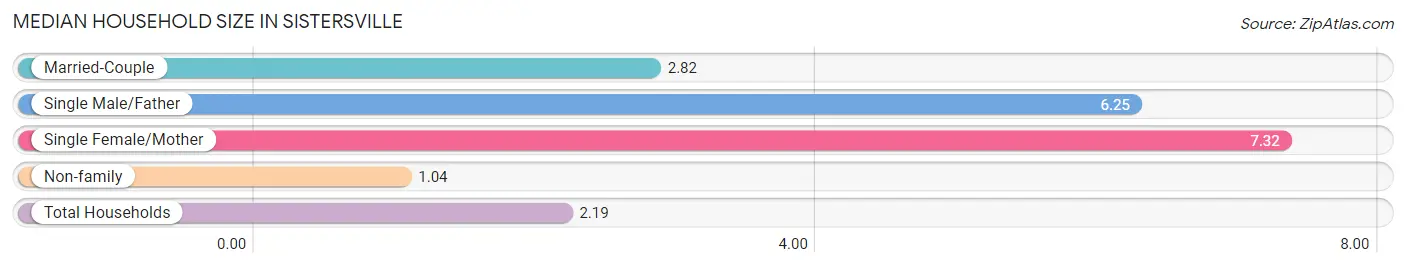
| Household Type | # Households | Household Size |
| Married-Couple | 237 (41.4%) | 2.82 |
| Single Male/Father | 12 (2.1%) | 6.25 |
| Single Female/Mother | 28 (4.9%) | 7.32 |
| Non-family | 296 (51.7%) | 1.04 |
| Total Households | 573 (100.0%) | 2.19 |
Household Size by Marriage Status in Sistersville
Out of a total of 573 households in Sistersville, 277 (48.3%) are family households, while 296 (51.7%) are nonfamily households. The most numerous type of family households are 2-person households, comprising 138, and the most common type of nonfamily households are 1-person households, comprising 287.
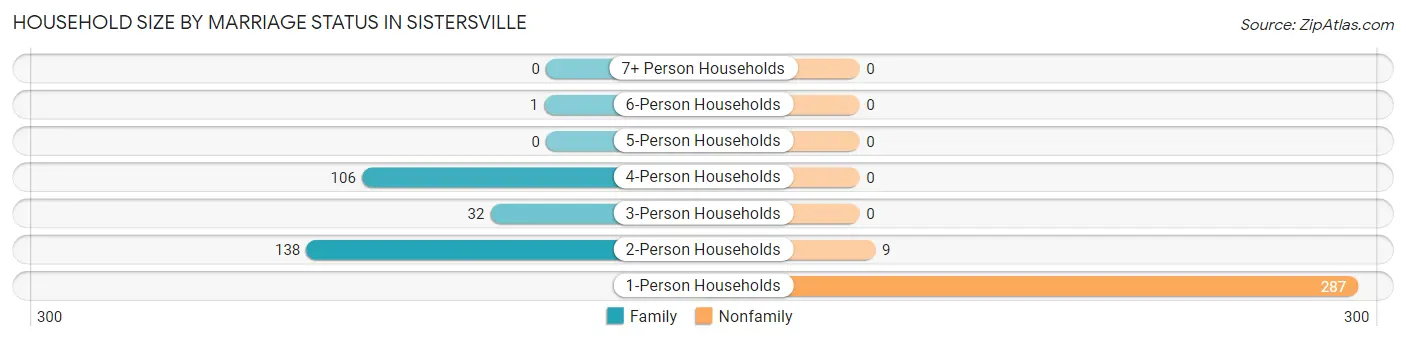
| Household Size | Family Households | Nonfamily Households |
| 1-Person Households | - | 287 (50.1%) |
| 2-Person Households | 138 (24.1%) | 9 (1.6%) |
| 3-Person Households | 32 (5.6%) | 0 (0.0%) |
| 4-Person Households | 106 (18.5%) | 0 (0.0%) |
| 5-Person Households | 0 (0.0%) | 0 (0.0%) |
| 6-Person Households | 1 (0.2%) | 0 (0.0%) |
| 7+ Person Households | 0 (0.0%) | 0 (0.0%) |
| Total | 277 (48.3%) | 296 (51.7%) |
Female Fertility in Sistersville
Fertility by Age in Sistersville
Average fertility rate in Sistersville is 8.0 births per 1,000 women. Women in the age bracket of 20 to 34 years have the highest fertility rate with 29.0 births per 1,000 women. Women in the age bracket of 20 to 34 years acount for 100.0% of all women with births.
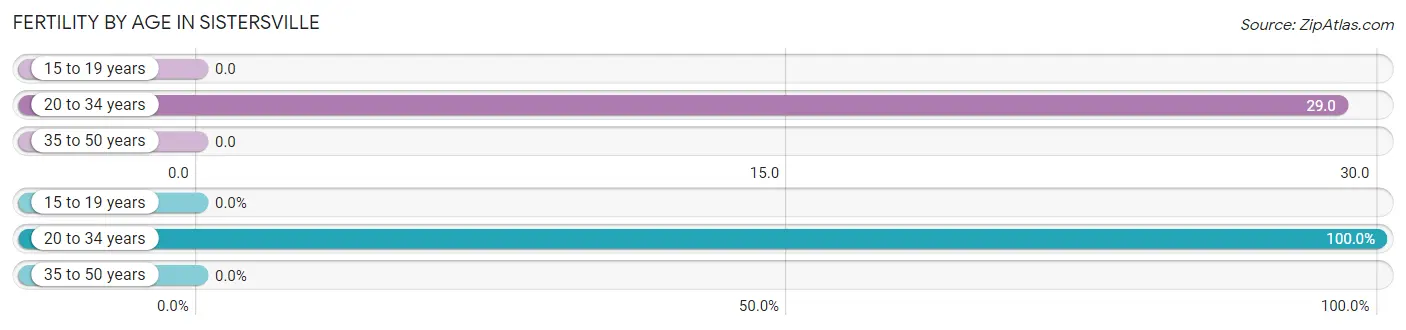
| Age Bracket | Women with Births | Births / 1,000 Women |
| 15 to 19 years | 0 (0.0%) | 0.0 |
| 20 to 34 years | 2 (100.0%) | 29.0 |
| 35 to 50 years | 0 (0.0%) | 0.0 |
| Total | 2 (100.0%) | 8.0 |
Fertility by Age by Marriage Status in Sistersville
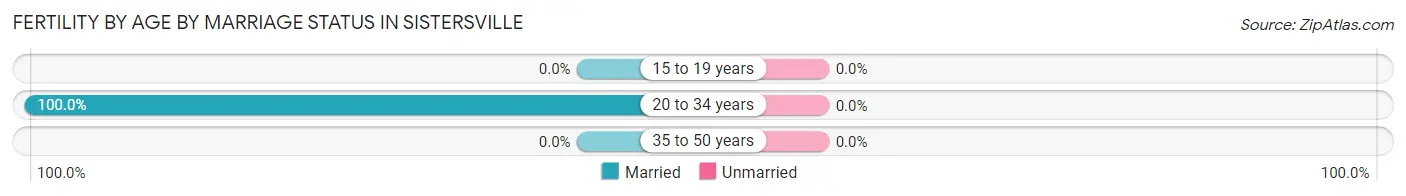
| Age Bracket | Married | Unmarried |
| 15 to 19 years | 0 (0.0%) | 0 (0.0%) |
| 20 to 34 years | 2 (100.0%) | 0 (0.0%) |
| 35 to 50 years | 0 (0.0%) | 0 (0.0%) |
| Total | 2 (100.0%) | 0 (0.0%) |
Fertility by Education in Sistersville
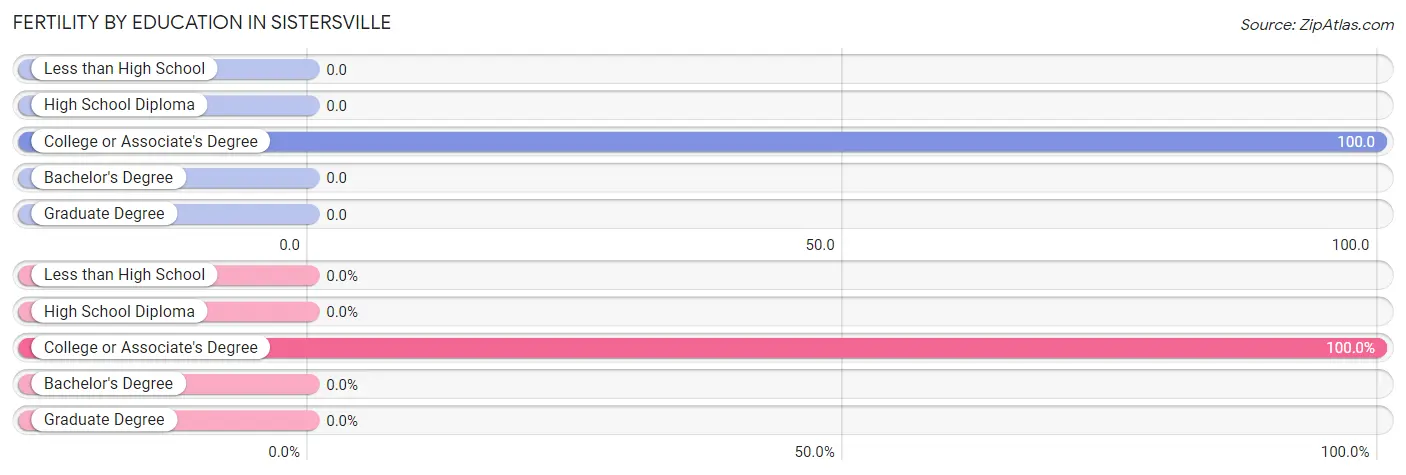
| Educational Attainment | Women with Births | Births / 1,000 Women |
| Less than High School | 0 (0.0%) | 0.0 |
| High School Diploma | 0 (0.0%) | 0.0 |
| College or Associate's Degree | 2 (100.0%) | 100.0 |
| Bachelor's Degree | 0 (0.0%) | 0.0 |
| Graduate Degree | 0 (0.0%) | 0.0 |
| Total | 2 (100.0%) | 8.0 |
Fertility by Education by Marriage Status in Sistersville
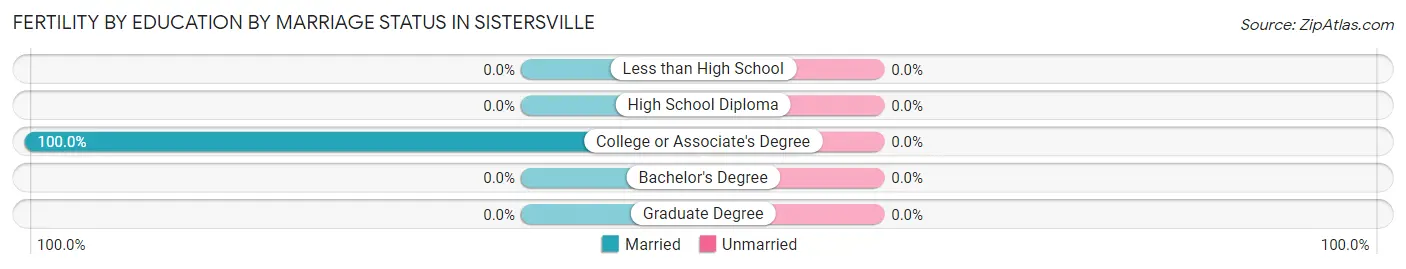
| Educational Attainment | Married | Unmarried |
| Less than High School | 0 (0.0%) | 0 (0.0%) |
| High School Diploma | 0 (0.0%) | 0 (0.0%) |
| College or Associate's Degree | 2 (100.0%) | 0 (0.0%) |
| Bachelor's Degree | 0 (0.0%) | 0 (0.0%) |
| Graduate Degree | 0 (0.0%) | 0 (0.0%) |
| Total | 2 (100.0%) | 0 (0.0%) |
Employment Characteristics in Sistersville
Employment by Class of Employer in Sistersville
Among the 374 employed individuals in Sistersville, private company employees (196 | 52.4%), not-for-profit organizations (66 | 17.6%), and state government employees (53 | 14.2%) make up the most common classes of employment.
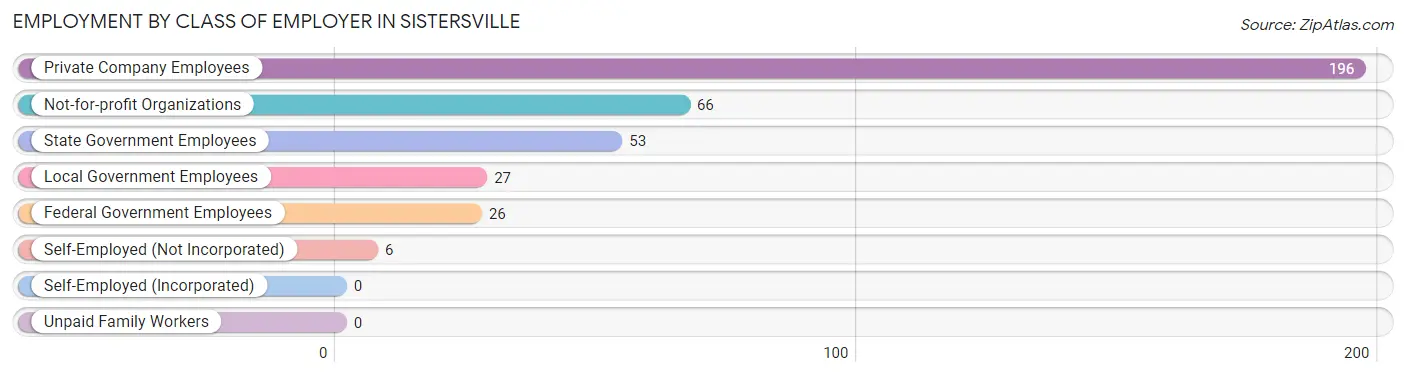
| Employer Class | # Employees | % Employees |
| Private Company Employees | 196 | 52.4% |
| Self-Employed (Incorporated) | 0 | 0.0% |
| Self-Employed (Not Incorporated) | 6 | 1.6% |
| Not-for-profit Organizations | 66 | 17.6% |
| Local Government Employees | 27 | 7.2% |
| State Government Employees | 53 | 14.2% |
| Federal Government Employees | 26 | 7.0% |
| Unpaid Family Workers | 0 | 0.0% |
| Total | 374 | 100.0% |
Employment Status by Age in Sistersville
According to the labor force statistics for Sistersville, out of the total population over 16 years of age (1,047), 41.1% or 430 individuals are in the labor force, with 9.1% or 39 of them unemployed. The age group with the highest labor force participation rate is 30 to 34 years, with 100.0% or 35 individuals in the labor force. Within the labor force, the 16 to 19 years age range has the highest percentage of unemployed individuals, with 100.0% or 3 of them being unemployed.
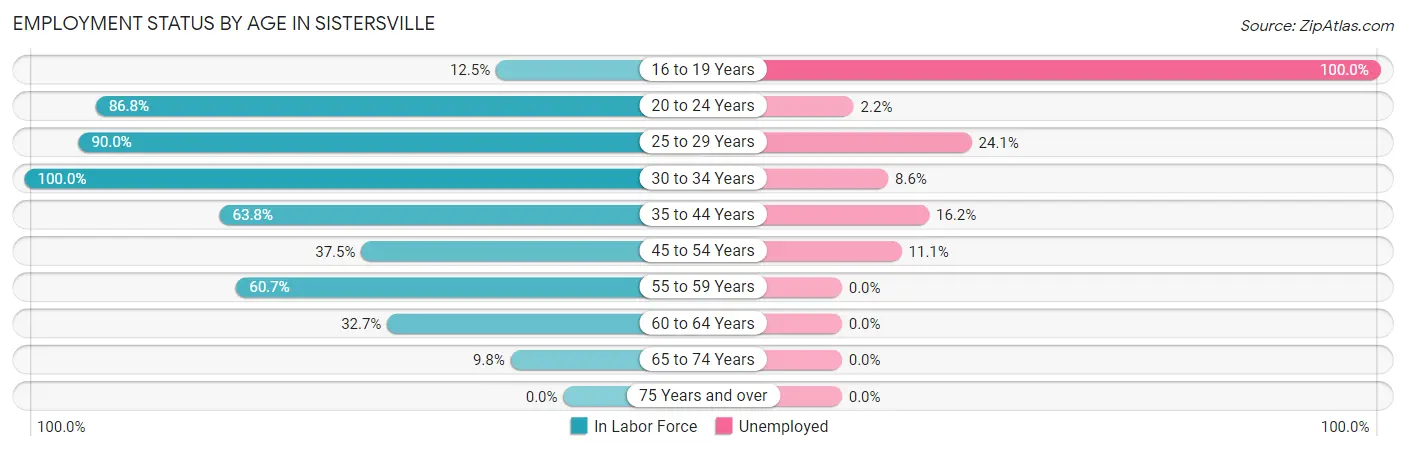
| Age Bracket | In Labor Force | Unemployed |
| 16 to 19 Years | 3 (12.5%) | 3 (100.0%) |
| 20 to 24 Years | 46 (86.8%) | 1 (2.2%) |
| 25 to 29 Years | 54 (90.0%) | 13 (24.1%) |
| 30 to 34 Years | 35 (100.0%) | 3 (8.6%) |
| 35 to 44 Years | 74 (63.8%) | 12 (16.2%) |
| 45 to 54 Years | 63 (37.5%) | 7 (11.1%) |
| 55 to 59 Years | 88 (60.7%) | 0 (0.0%) |
| 60 to 64 Years | 55 (32.7%) | 0 (0.0%) |
| 65 to 74 Years | 12 (9.8%) | 0 (0.0%) |
| 75 Years and over | 0 (0.0%) | 0 (0.0%) |
| Total | 430 (41.1%) | 39 (9.1%) |
Employment Status by Educational Attainment in Sistersville
According to labor force statistics for Sistersville, 53.3% of individuals (369) out of the total population between 25 and 64 years of age (692) are in the labor force, with 9.5% or 35 of them being unemployed. The group with the highest labor force participation rate are those with the educational attainment of bachelor's degree or higher, with 68.4% or 91 individuals in the labor force. Within the labor force, individuals with high school diploma education have the highest percentage of unemployment, with 18.9% or 30 of them being unemployed.
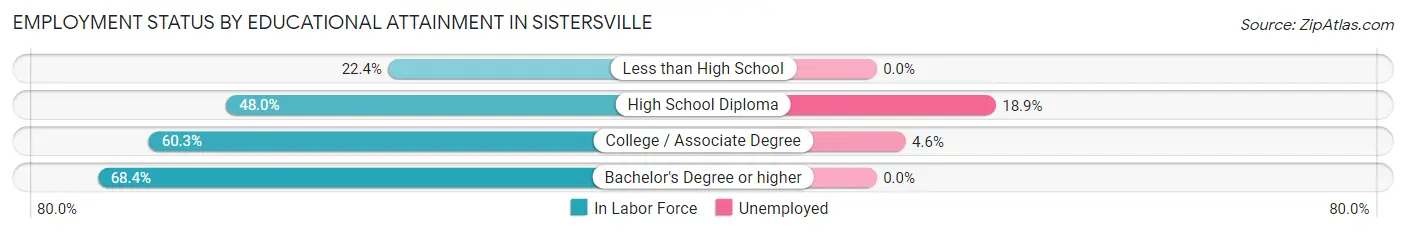
| Educational Attainment | In Labor Force | Unemployed |
| Less than High School | 11 (22.4%) | 0 (0.0%) |
| High School Diploma | 159 (48.0%) | 63 (18.9%) |
| College / Associate Degree | 108 (60.3%) | 8 (4.6%) |
| Bachelor's Degree or higher | 91 (68.4%) | 0 (0.0%) |
| Total | 369 (53.3%) | 66 (9.5%) |
Employment Occupations by Sex in Sistersville
Management, Business, Science and Arts Occupations
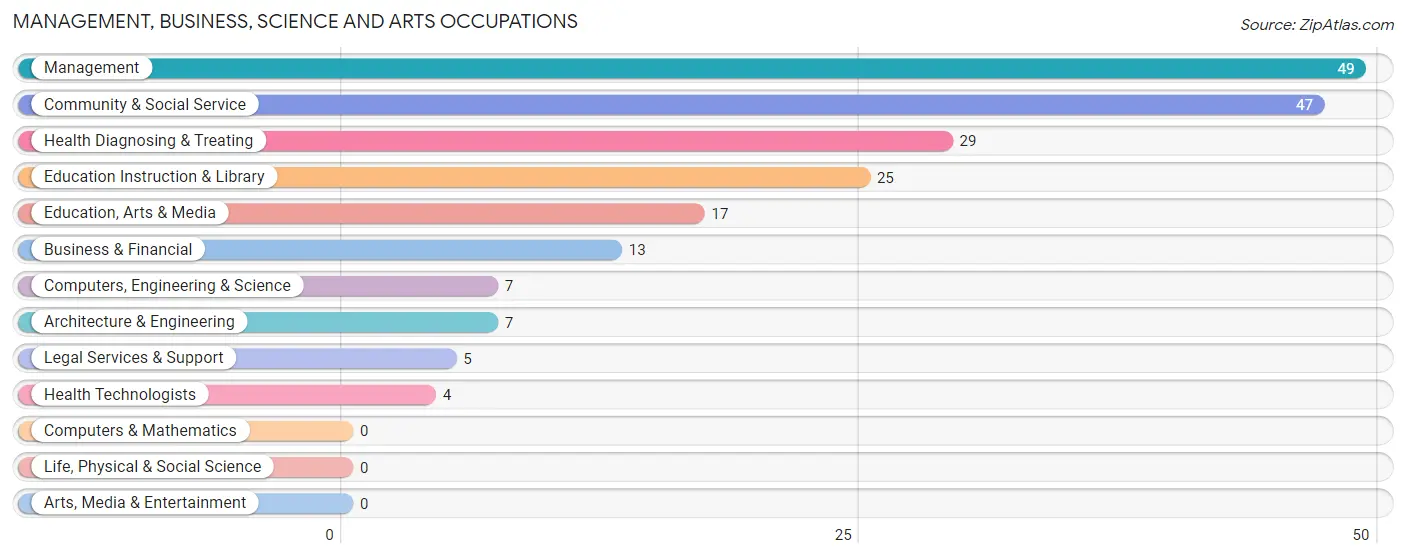
The most common Management, Business, Science and Arts occupations in Sistersville are Management (49 | 12.5%), Community & Social Service (47 | 12.0%), Health Diagnosing & Treating (29 | 7.4%), Education Instruction & Library (25 | 6.4%), and Education, Arts & Media (17 | 4.3%).
Management, Business, Science and Arts Occupations by Sex
Within the Management, Business, Science and Arts occupations in Sistersville, the most male-oriented occupations are Computers, Engineering & Science (100.0%), Architecture & Engineering (100.0%), and Legal Services & Support (100.0%), while the most female-oriented occupations are Business & Financial (100.0%), Health Diagnosing & Treating (100.0%), and Health Technologists (100.0%).
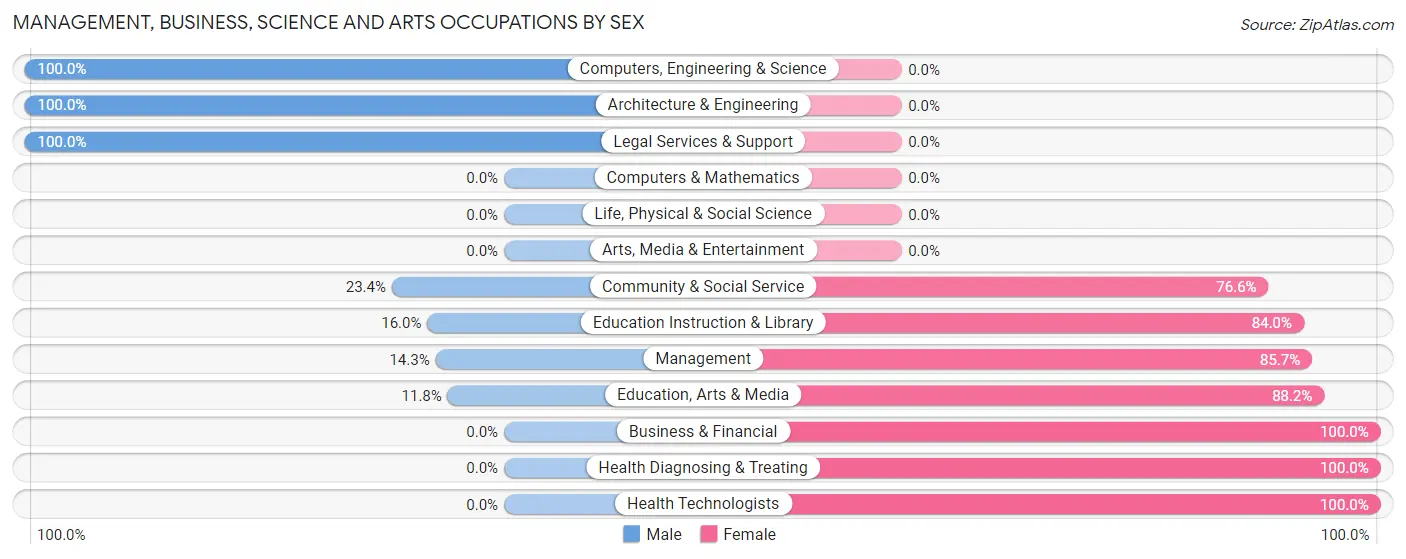
| Occupation | Male | Female |
| Management | 7 (14.3%) | 42 (85.7%) |
| Business & Financial | 0 (0.0%) | 13 (100.0%) |
| Computers, Engineering & Science | 7 (100.0%) | 0 (0.0%) |
| Computers & Mathematics | 0 (0.0%) | 0 (0.0%) |
| Architecture & Engineering | 7 (100.0%) | 0 (0.0%) |
| Life, Physical & Social Science | 0 (0.0%) | 0 (0.0%) |
| Community & Social Service | 11 (23.4%) | 36 (76.6%) |
| Education, Arts & Media | 2 (11.8%) | 15 (88.2%) |
| Legal Services & Support | 5 (100.0%) | 0 (0.0%) |
| Education Instruction & Library | 4 (16.0%) | 21 (84.0%) |
| Arts, Media & Entertainment | 0 (0.0%) | 0 (0.0%) |
| Health Diagnosing & Treating | 0 (0.0%) | 29 (100.0%) |
| Health Technologists | 0 (0.0%) | 4 (100.0%) |
| Total (Category) | 25 (17.2%) | 120 (82.8%) |
| Total (Overall) | 152 (38.9%) | 239 (61.1%) |
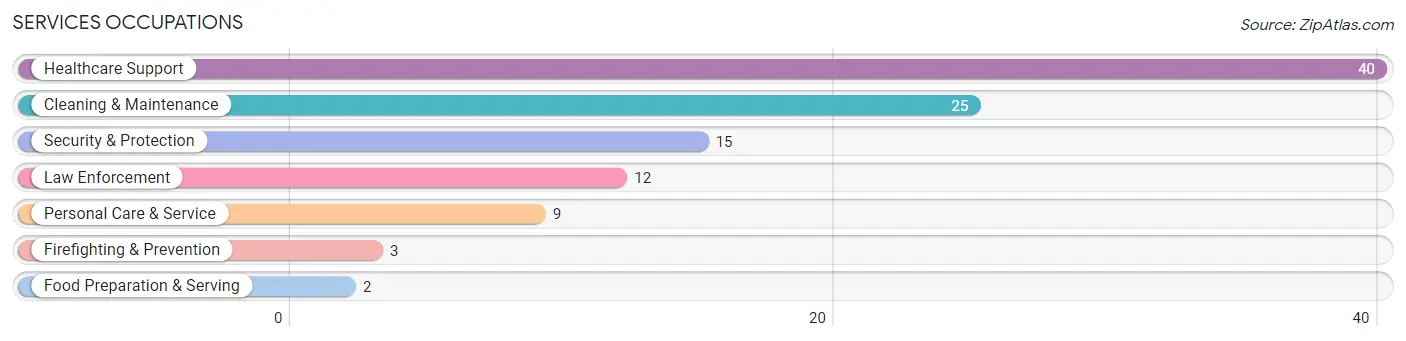
Services Occupations
The most common Services occupations in Sistersville are Healthcare Support (40 | 10.2%), Cleaning & Maintenance (25 | 6.4%), Security & Protection (15 | 3.8%), Law Enforcement (12 | 3.1%), and Personal Care & Service (9 | 2.3%).
Services Occupations by Sex
Within the Services occupations in Sistersville, the most male-oriented occupations are Security & Protection (100.0%), Firefighting & Prevention (100.0%), and Law Enforcement (100.0%), while the most female-oriented occupations are Food Preparation & Serving (100.0%), Personal Care & Service (100.0%), and Healthcare Support (75.0%).
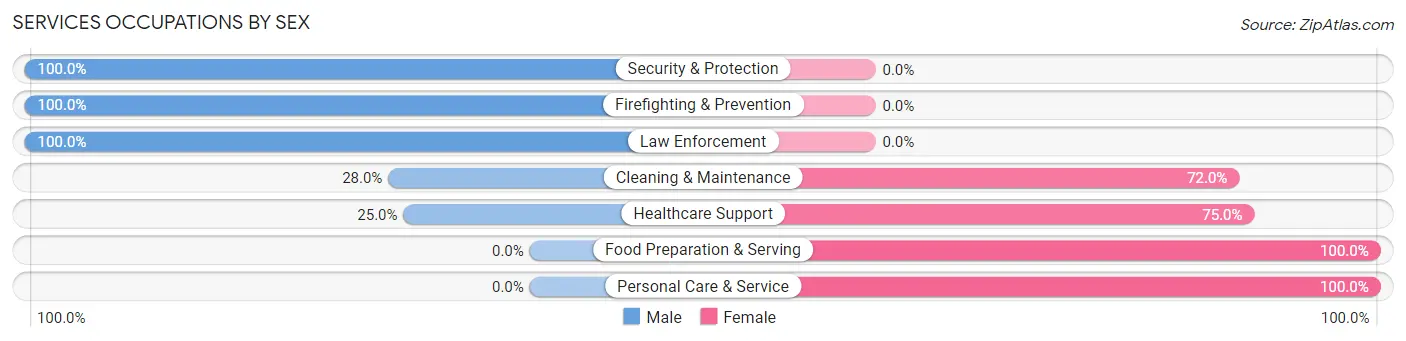
| Occupation | Male | Female |
| Healthcare Support | 10 (25.0%) | 30 (75.0%) |
| Security & Protection | 15 (100.0%) | 0 (0.0%) |
| Firefighting & Prevention | 3 (100.0%) | 0 (0.0%) |
| Law Enforcement | 12 (100.0%) | 0 (0.0%) |
| Food Preparation & Serving | 0 (0.0%) | 2 (100.0%) |
| Cleaning & Maintenance | 7 (28.0%) | 18 (72.0%) |
| Personal Care & Service | 0 (0.0%) | 9 (100.0%) |
| Total (Category) | 32 (35.2%) | 59 (64.8%) |
| Total (Overall) | 152 (38.9%) | 239 (61.1%) |
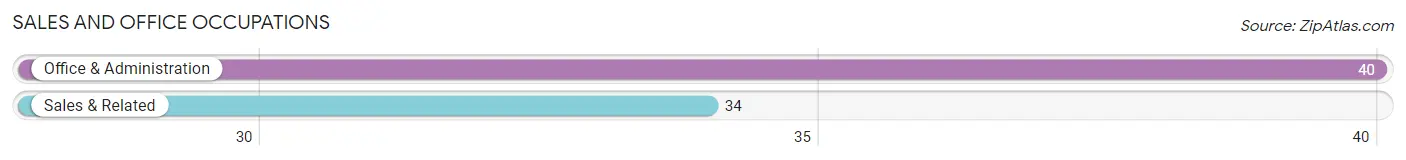
Sales and Office Occupations
The most common Sales and Office occupations in Sistersville are Office & Administration (40 | 10.2%), and Sales & Related (34 | 8.7%).
Sales and Office Occupations by Sex
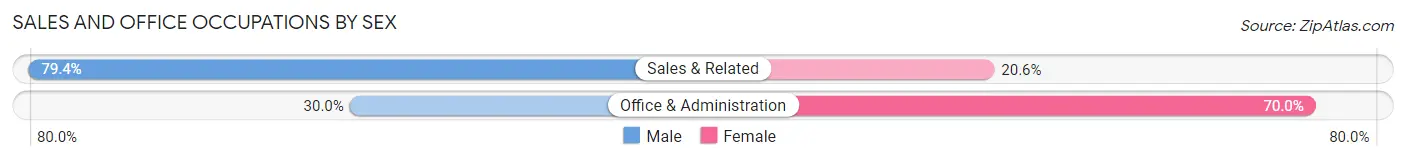
| Occupation | Male | Female |
| Sales & Related | 27 (79.4%) | 7 (20.6%) |
| Office & Administration | 12 (30.0%) | 28 (70.0%) |
| Total (Category) | 39 (52.7%) | 35 (47.3%) |
| Total (Overall) | 152 (38.9%) | 239 (61.1%) |
Natural Resources, Construction and Maintenance Occupations
The most common Natural Resources, Construction and Maintenance occupations in Sistersville are Installation, Maintenance & Repair (22 | 5.6%), and Construction & Extraction (14 | 3.6%).
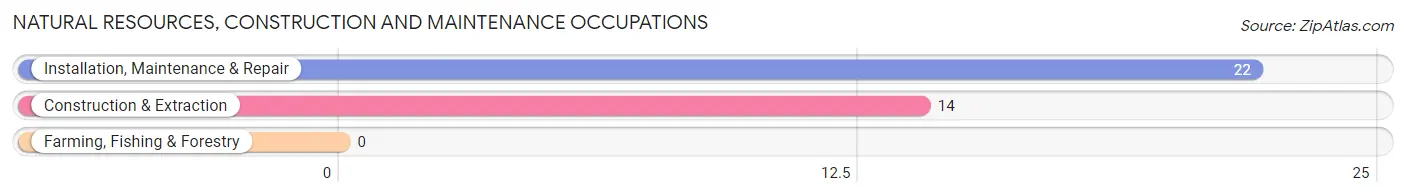
Natural Resources, Construction and Maintenance Occupations by Sex

| Occupation | Male | Female |
| Farming, Fishing & Forestry | 0 (0.0%) | 0 (0.0%) |
| Construction & Extraction | 14 (100.0%) | 0 (0.0%) |
| Installation, Maintenance & Repair | 22 (100.0%) | 0 (0.0%) |
| Total (Category) | 36 (100.0%) | 0 (0.0%) |
| Total (Overall) | 152 (38.9%) | 239 (61.1%) |
Production, Transportation and Moving Occupations
The most common Production, Transportation and Moving occupations in Sistersville are Production (26 | 6.7%), Material Moving (10 | 2.6%), and Transportation (9 | 2.3%).
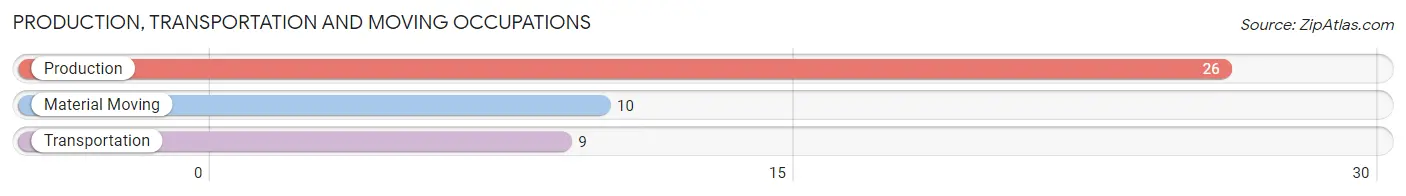
Production, Transportation and Moving Occupations by Sex
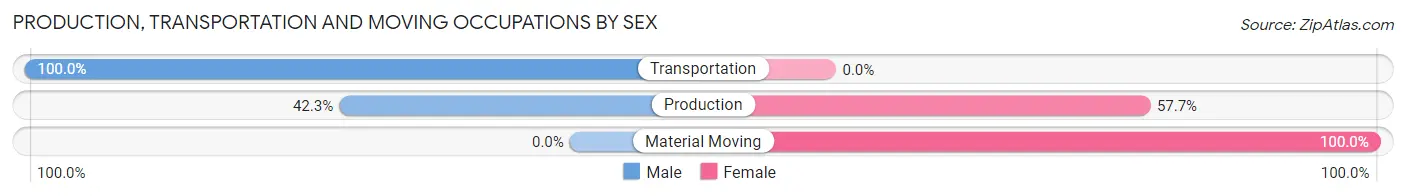
| Occupation | Male | Female |
| Production | 11 (42.3%) | 15 (57.7%) |
| Transportation | 9 (100.0%) | 0 (0.0%) |
| Material Moving | 0 (0.0%) | 10 (100.0%) |
| Total (Category) | 20 (44.4%) | 25 (55.6%) |
| Total (Overall) | 152 (38.9%) | 239 (61.1%) |
Employment Industries by Sex in Sistersville
Employment Industries in Sistersville
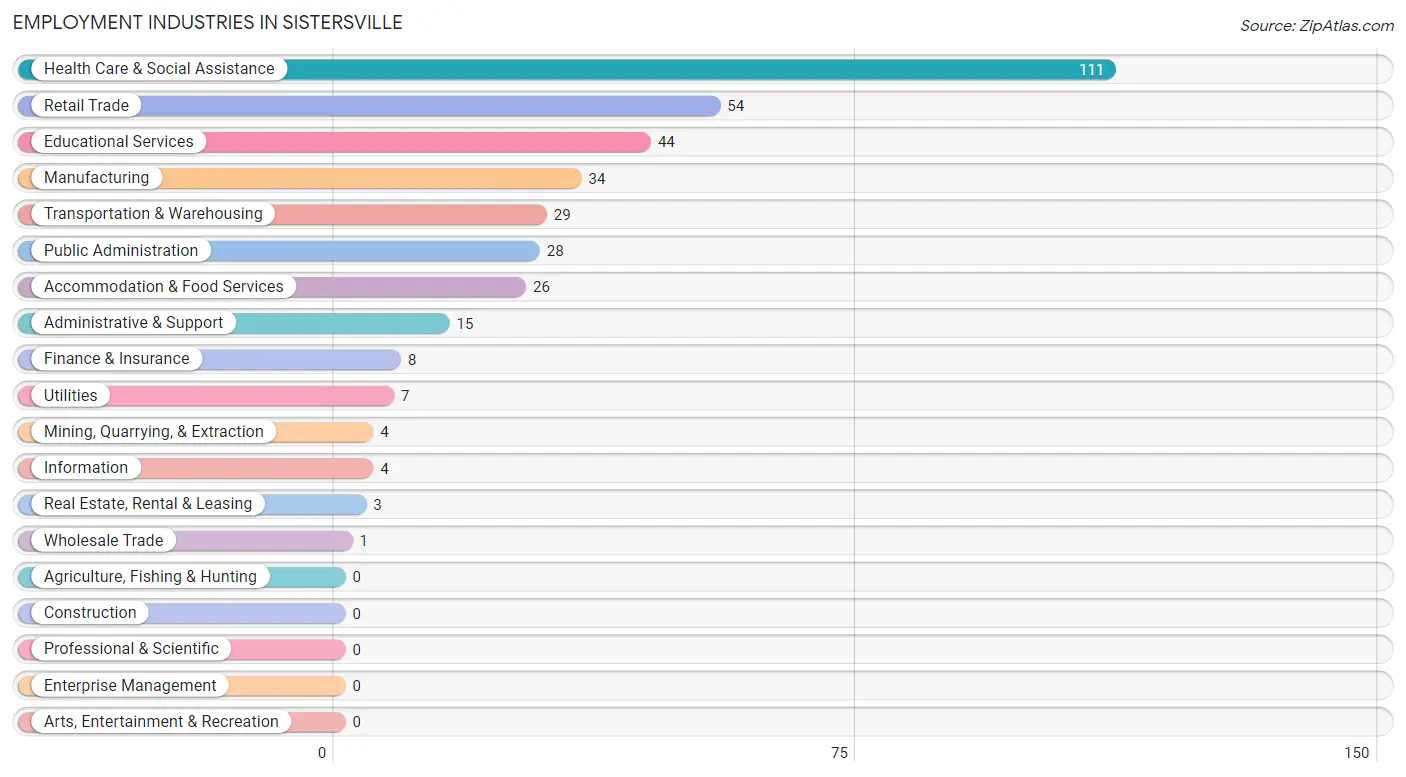
The major employment industries in Sistersville include Health Care & Social Assistance (111 | 28.4%), Retail Trade (54 | 13.8%), Educational Services (44 | 11.3%), Manufacturing (34 | 8.7%), and Transportation & Warehousing (29 | 7.4%).
Employment Industries by Sex in Sistersville
The Sistersville industries that see more men than women are Mining, Quarrying, & Extraction (100.0%), Wholesale Trade (100.0%), and Utilities (100.0%), whereas the industries that tend to have a higher number of women are Accommodation & Food Services (100.0%), Health Care & Social Assistance (91.0%), and Educational Services (79.5%).
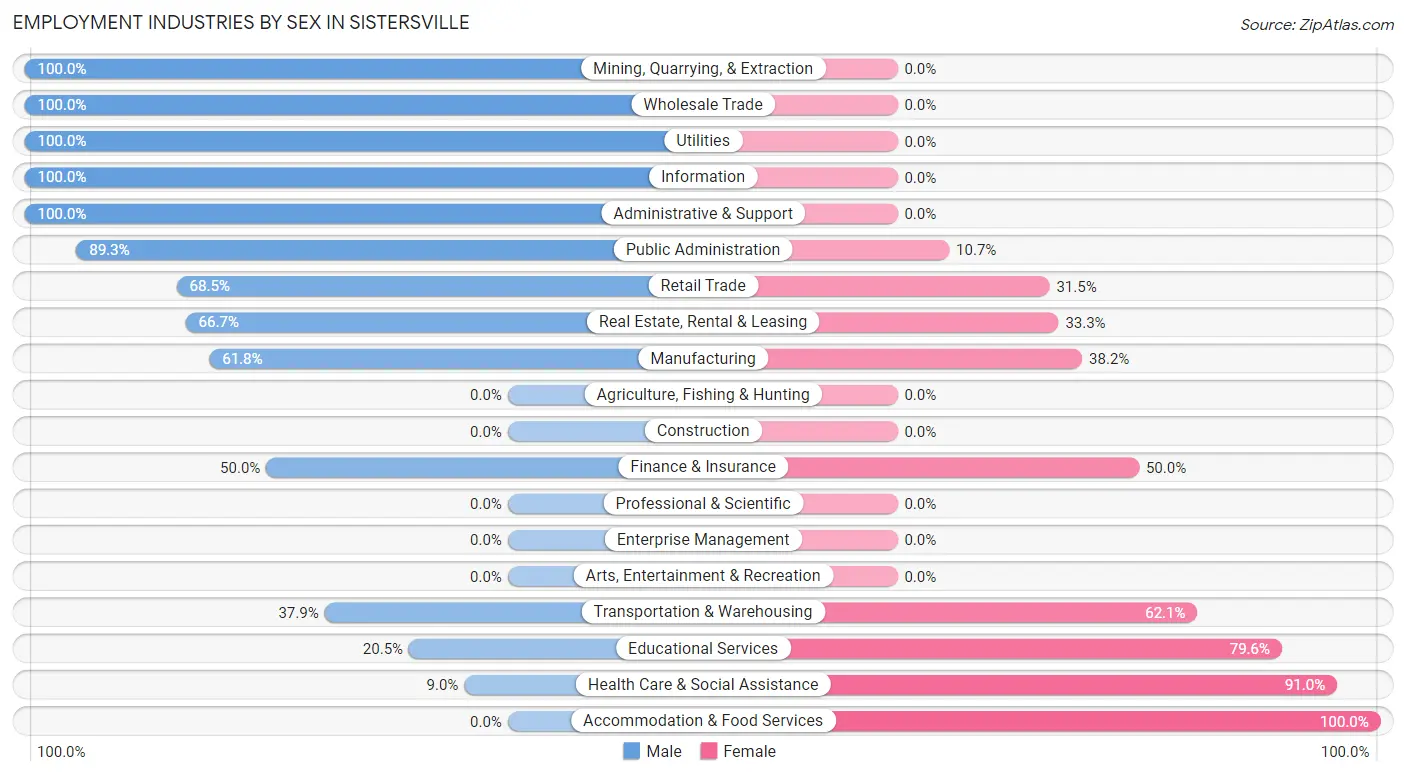
| Industry | Male | Female |
| Agriculture, Fishing & Hunting | 0 (0.0%) | 0 (0.0%) |
| Mining, Quarrying, & Extraction | 4 (100.0%) | 0 (0.0%) |
| Construction | 0 (0.0%) | 0 (0.0%) |
| Manufacturing | 21 (61.8%) | 13 (38.2%) |
| Wholesale Trade | 1 (100.0%) | 0 (0.0%) |
| Retail Trade | 37 (68.5%) | 17 (31.5%) |
| Transportation & Warehousing | 11 (37.9%) | 18 (62.1%) |
| Utilities | 7 (100.0%) | 0 (0.0%) |
| Information | 4 (100.0%) | 0 (0.0%) |
| Finance & Insurance | 4 (50.0%) | 4 (50.0%) |
| Real Estate, Rental & Leasing | 2 (66.7%) | 1 (33.3%) |
| Professional & Scientific | 0 (0.0%) | 0 (0.0%) |
| Enterprise Management | 0 (0.0%) | 0 (0.0%) |
| Administrative & Support | 15 (100.0%) | 0 (0.0%) |
| Educational Services | 9 (20.4%) | 35 (79.5%) |
| Health Care & Social Assistance | 10 (9.0%) | 101 (91.0%) |
| Arts, Entertainment & Recreation | 0 (0.0%) | 0 (0.0%) |
| Accommodation & Food Services | 0 (0.0%) | 26 (100.0%) |
| Public Administration | 25 (89.3%) | 3 (10.7%) |
| Total | 152 (38.9%) | 239 (61.1%) |
Education in Sistersville
School Enrollment in Sistersville
The most common levels of schooling among the 166 students in Sistersville are kindergarten (46 | 27.7%), elementary school (44 | 26.5%), and middle school (40 | 24.1%).
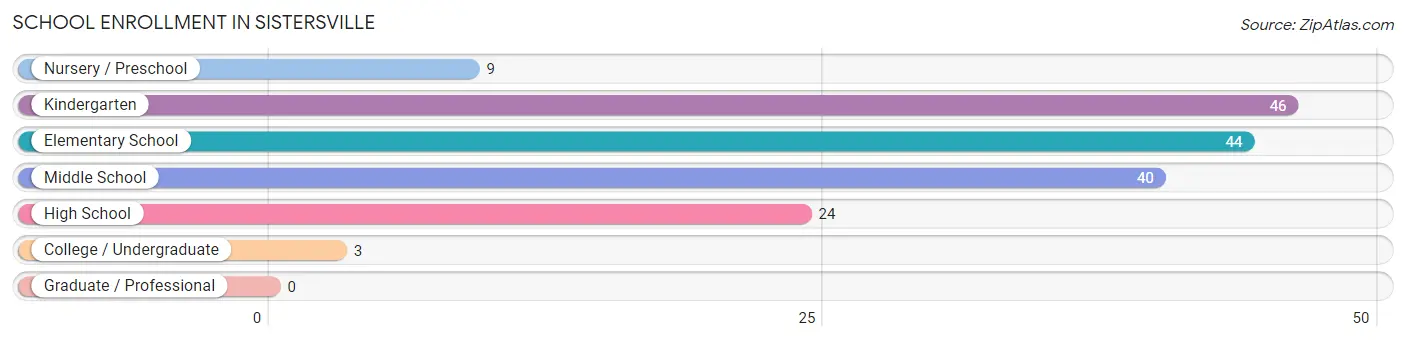
| School Level | # Students | % Students |
| Nursery / Preschool | 9 | 5.4% |
| Kindergarten | 46 | 27.7% |
| Elementary School | 44 | 26.5% |
| Middle School | 40 | 24.1% |
| High School | 24 | 14.5% |
| College / Undergraduate | 3 | 1.8% |
| Graduate / Professional | 0 | 0.0% |
| Total | 166 | 100.0% |
School Enrollment by Age by Funding Source in Sistersville
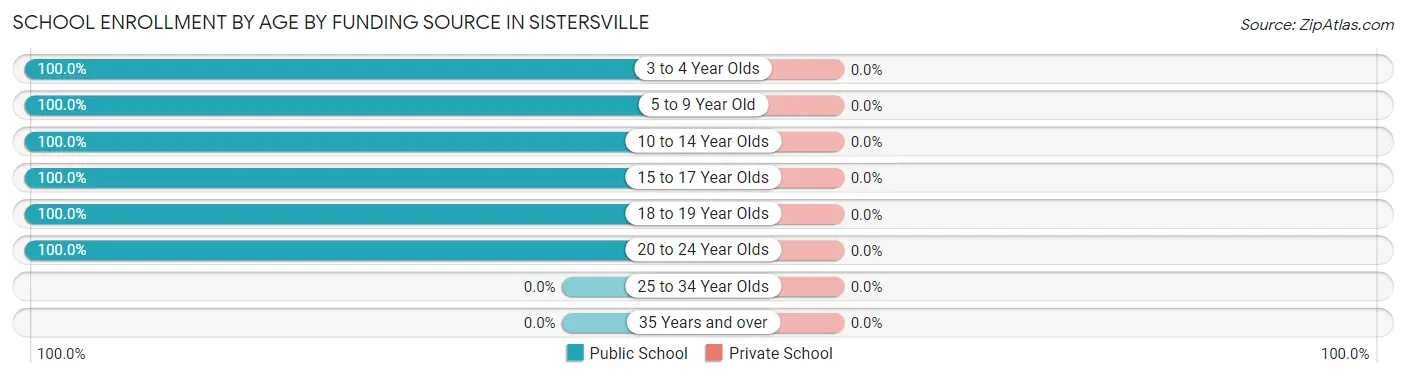
| Age Bracket | Public School | Private School |
| 3 to 4 Year Olds | 9 (100.0%) | 0 (0.0%) |
| 5 to 9 Year Old | 87 (100.0%) | 0 (0.0%) |
| 10 to 14 Year Olds | 47 (100.0%) | 0 (0.0%) |
| 15 to 17 Year Olds | 15 (100.0%) | 0 (0.0%) |
| 18 to 19 Year Olds | 5 (100.0%) | 0 (0.0%) |
| 20 to 24 Year Olds | 3 (100.0%) | 0 (0.0%) |
| 25 to 34 Year Olds | 0 (0.0%) | 0 (0.0%) |
| 35 Years and over | 0 (0.0%) | 0 (0.0%) |
| Total | 166 (100.0%) | 0 (0.0%) |
Educational Attainment by Field of Study in Sistersville
Education (44 | 22.8%), science & technology (42 | 21.8%), literature & languages (29 | 15.0%), arts & humanities (20 | 10.4%), and business (14 | 7.2%) are the most common fields of study among 193 individuals in Sistersville who have obtained a bachelor's degree or higher.
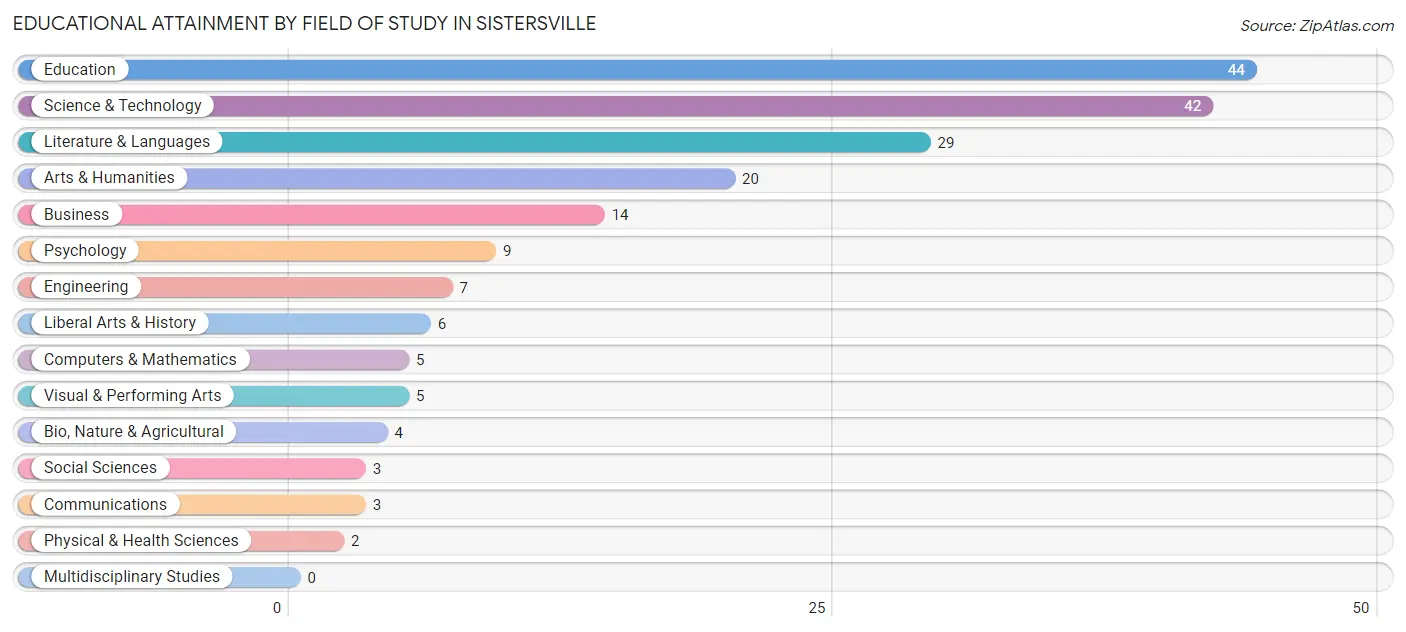
| Field of Study | # Graduates | % Graduates |
| Computers & Mathematics | 5 | 2.6% |
| Bio, Nature & Agricultural | 4 | 2.1% |
| Physical & Health Sciences | 2 | 1.0% |
| Psychology | 9 | 4.7% |
| Social Sciences | 3 | 1.5% |
| Engineering | 7 | 3.6% |
| Multidisciplinary Studies | 0 | 0.0% |
| Science & Technology | 42 | 21.8% |
| Business | 14 | 7.2% |
| Education | 44 | 22.8% |
| Literature & Languages | 29 | 15.0% |
| Liberal Arts & History | 6 | 3.1% |
| Visual & Performing Arts | 5 | 2.6% |
| Communications | 3 | 1.5% |
| Arts & Humanities | 20 | 10.4% |
| Total | 193 | 100.0% |
Transportation & Commute in Sistersville
Vehicle Availability by Sex in Sistersville
The most prevalent vehicle ownership categories in Sistersville are males with 2 vehicles (61, accounting for 40.1%) and females with 2 vehicles (38, making up 27.5%).
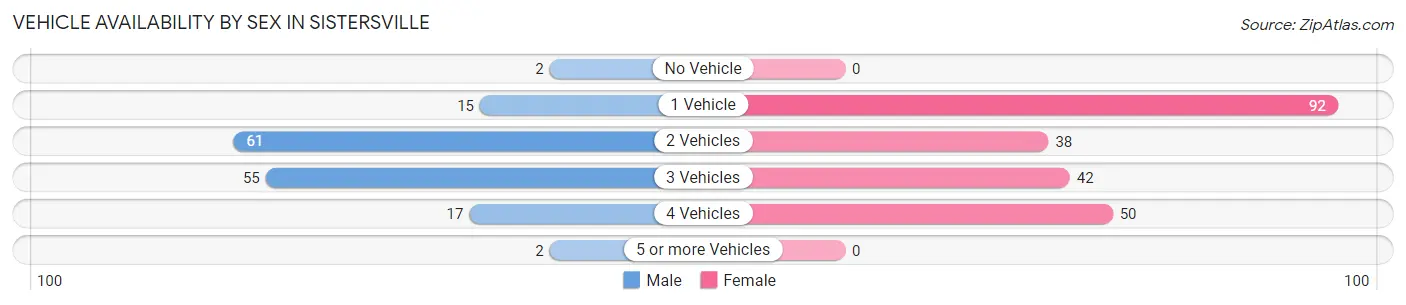
| Vehicles Available | Male | Female |
| No Vehicle | 2 (1.3%) | 0 (0.0%) |
| 1 Vehicle | 15 (9.9%) | 92 (41.4%) |
| 2 Vehicles | 61 (40.1%) | 38 (17.1%) |
| 3 Vehicles | 55 (36.2%) | 42 (18.9%) |
| 4 Vehicles | 17 (11.2%) | 50 (22.5%) |
| 5 or more Vehicles | 2 (1.3%) | 0 (0.0%) |
| Total | 152 (100.0%) | 222 (100.0%) |
Commute Time in Sistersville
The most frequently occuring commute durations in Sistersville are 20 to 24 minutes (77 commuters, 22.2%), 5 to 9 minutes (67 commuters, 19.3%), and 15 to 19 minutes (43 commuters, 12.4%).
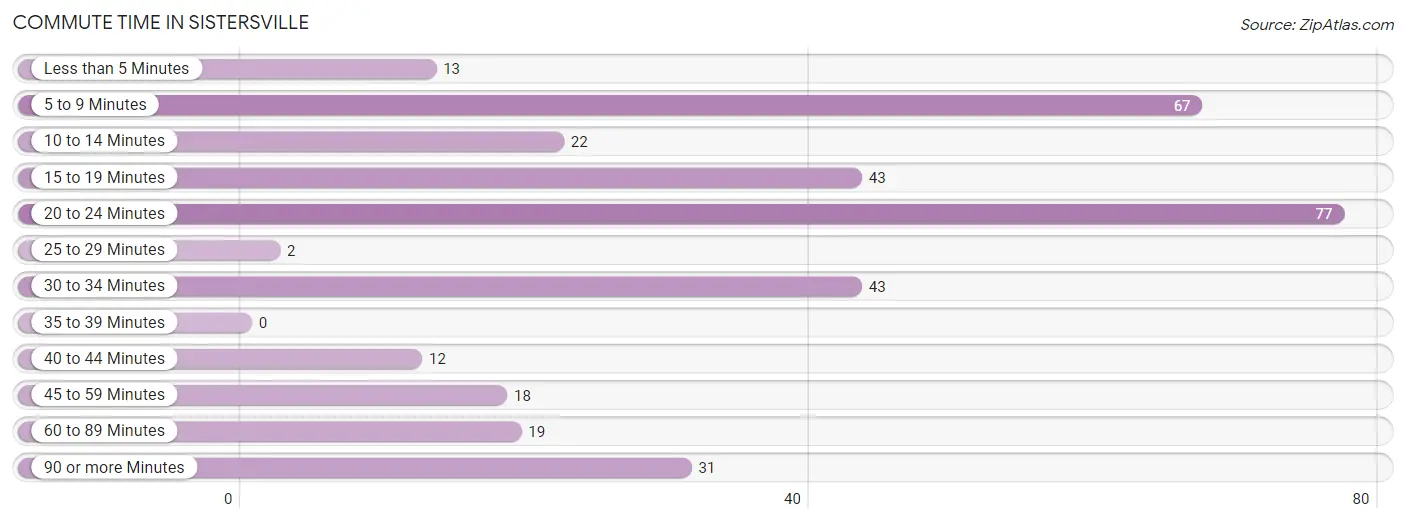
| Commute Time | # Commuters | % Commuters |
| Less than 5 Minutes | 13 | 3.7% |
| 5 to 9 Minutes | 67 | 19.3% |
| 10 to 14 Minutes | 22 | 6.3% |
| 15 to 19 Minutes | 43 | 12.4% |
| 20 to 24 Minutes | 77 | 22.2% |
| 25 to 29 Minutes | 2 | 0.6% |
| 30 to 34 Minutes | 43 | 12.4% |
| 35 to 39 Minutes | 0 | 0.0% |
| 40 to 44 Minutes | 12 | 3.5% |
| 45 to 59 Minutes | 18 | 5.2% |
| 60 to 89 Minutes | 19 | 5.5% |
| 90 or more Minutes | 31 | 8.9% |
Commute Time by Sex in Sistersville
The most common commute times in Sistersville are 5 to 9 minutes (25 commuters, 16.9%) for males and 20 to 24 minutes (66 commuters, 33.2%) for females.
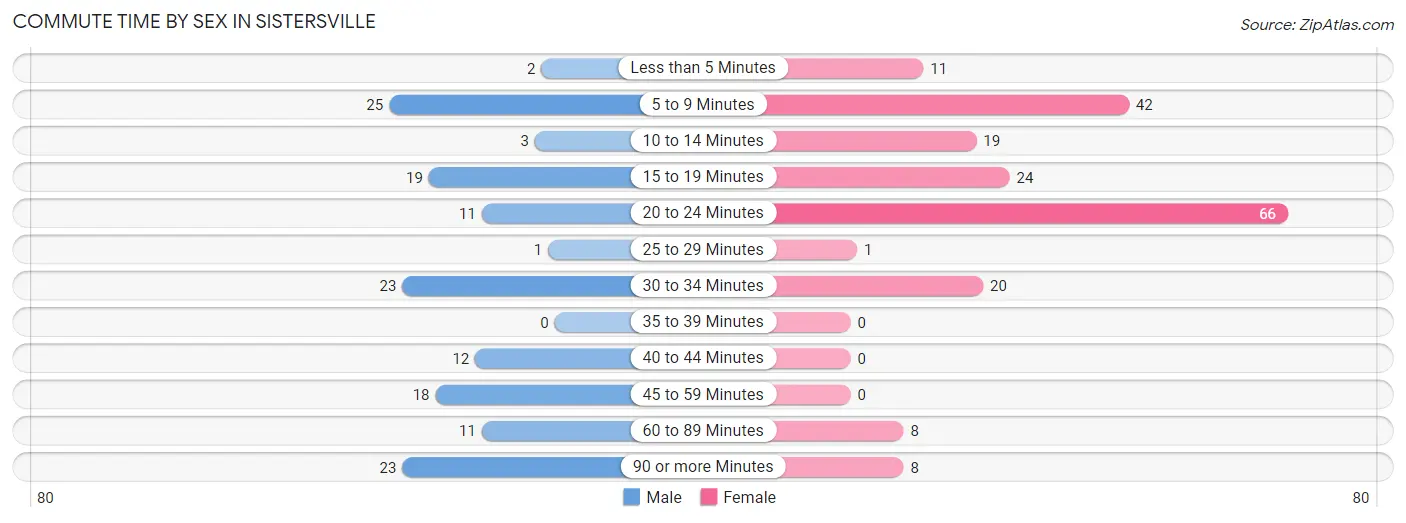
| Commute Time | Male | Female |
| Less than 5 Minutes | 2 (1.3%) | 11 (5.5%) |
| 5 to 9 Minutes | 25 (16.9%) | 42 (21.1%) |
| 10 to 14 Minutes | 3 (2.0%) | 19 (9.6%) |
| 15 to 19 Minutes | 19 (12.8%) | 24 (12.1%) |
| 20 to 24 Minutes | 11 (7.4%) | 66 (33.2%) |
| 25 to 29 Minutes | 1 (0.7%) | 1 (0.5%) |
| 30 to 34 Minutes | 23 (15.5%) | 20 (10.1%) |
| 35 to 39 Minutes | 0 (0.0%) | 0 (0.0%) |
| 40 to 44 Minutes | 12 (8.1%) | 0 (0.0%) |
| 45 to 59 Minutes | 18 (12.2%) | 0 (0.0%) |
| 60 to 89 Minutes | 11 (7.4%) | 8 (4.0%) |
| 90 or more Minutes | 23 (15.5%) | 8 (4.0%) |
Time of Departure to Work by Sex in Sistersville
The most frequent times of departure to work in Sistersville are 7:00 AM to 7:29 AM (37, 25.0%) for males and 7:00 AM to 7:29 AM (73, 36.7%) for females.
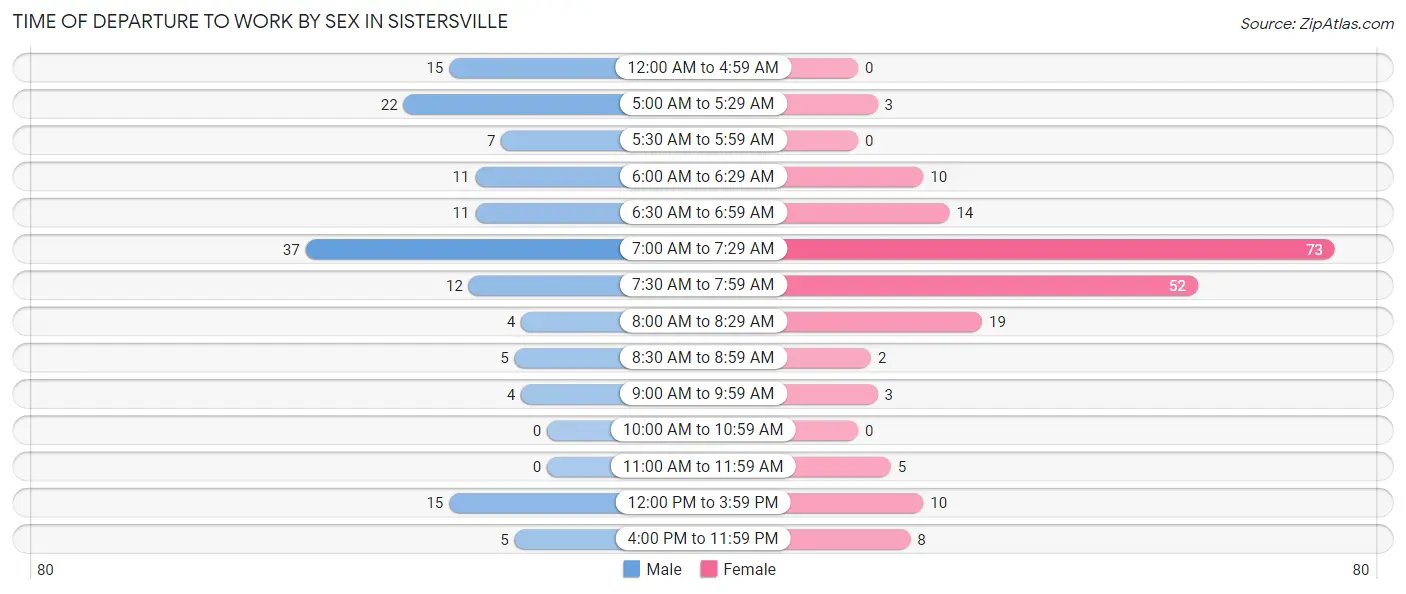
| Time of Departure | Male | Female |
| 12:00 AM to 4:59 AM | 15 (10.1%) | 0 (0.0%) |
| 5:00 AM to 5:29 AM | 22 (14.9%) | 3 (1.5%) |
| 5:30 AM to 5:59 AM | 7 (4.7%) | 0 (0.0%) |
| 6:00 AM to 6:29 AM | 11 (7.4%) | 10 (5.0%) |
| 6:30 AM to 6:59 AM | 11 (7.4%) | 14 (7.0%) |
| 7:00 AM to 7:29 AM | 37 (25.0%) | 73 (36.7%) |
| 7:30 AM to 7:59 AM | 12 (8.1%) | 52 (26.1%) |
| 8:00 AM to 8:29 AM | 4 (2.7%) | 19 (9.6%) |
| 8:30 AM to 8:59 AM | 5 (3.4%) | 2 (1.0%) |
| 9:00 AM to 9:59 AM | 4 (2.7%) | 3 (1.5%) |
| 10:00 AM to 10:59 AM | 0 (0.0%) | 0 (0.0%) |
| 11:00 AM to 11:59 AM | 0 (0.0%) | 5 (2.5%) |
| 12:00 PM to 3:59 PM | 15 (10.1%) | 10 (5.0%) |
| 4:00 PM to 11:59 PM | 5 (3.4%) | 8 (4.0%) |
| Total | 148 (100.0%) | 199 (100.0%) |
Housing Occupancy in Sistersville
Occupancy by Ownership in Sistersville
Of the total 573 dwellings in Sistersville, owner-occupied units account for 460 (80.3%), while renter-occupied units make up 113 (19.7%).
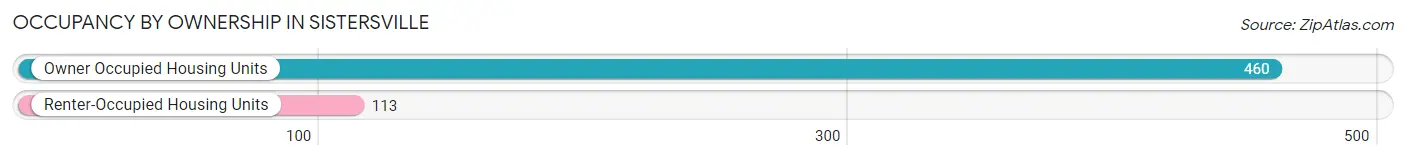
| Occupancy | # Housing Units | % Housing Units |
| Owner Occupied Housing Units | 460 | 80.3% |
| Renter-Occupied Housing Units | 113 | 19.7% |
| Total Occupied Housing Units | 573 | 100.0% |
Occupancy by Household Size in Sistersville
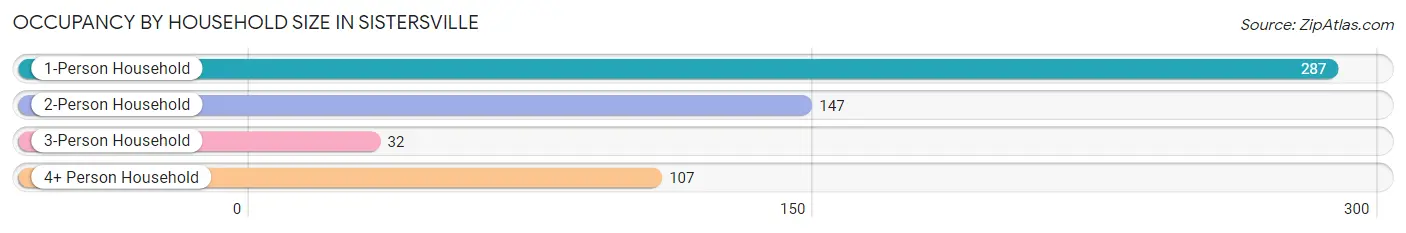
| Household Size | # Housing Units | % Housing Units |
| 1-Person Household | 287 | 50.1% |
| 2-Person Household | 147 | 25.7% |
| 3-Person Household | 32 | 5.6% |
| 4+ Person Household | 107 | 18.7% |
| Total Housing Units | 573 | 100.0% |
Occupancy by Ownership by Household Size in Sistersville
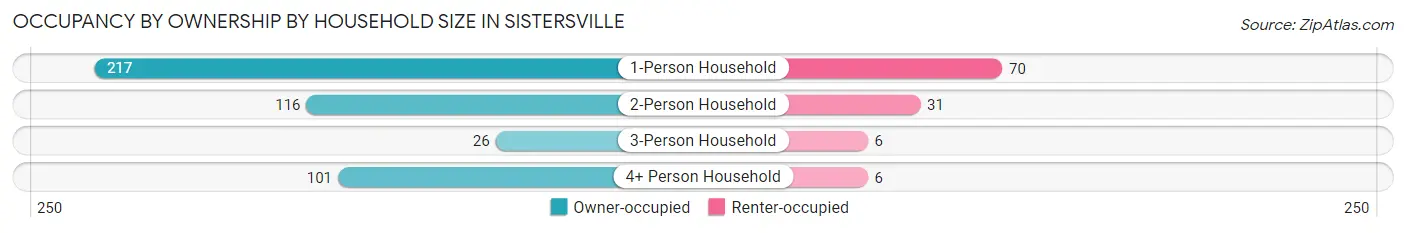
| Household Size | Owner-occupied | Renter-occupied |
| 1-Person Household | 217 (75.6%) | 70 (24.4%) |
| 2-Person Household | 116 (78.9%) | 31 (21.1%) |
| 3-Person Household | 26 (81.2%) | 6 (18.8%) |
| 4+ Person Household | 101 (94.4%) | 6 (5.6%) |
| Total Housing Units | 460 (80.3%) | 113 (19.7%) |
Occupancy by Educational Attainment in Sistersville
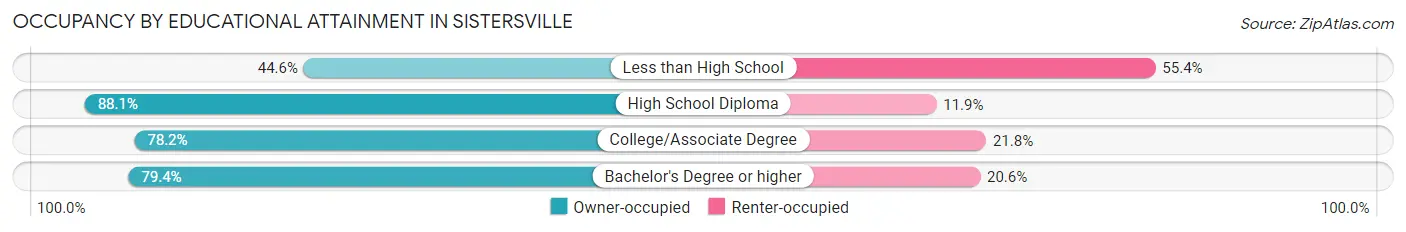
| Household Size | Owner-occupied | Renter-occupied |
| Less than High School | 25 (44.6%) | 31 (55.4%) |
| High School Diploma | 266 (88.1%) | 36 (11.9%) |
| College/Associate Degree | 115 (78.2%) | 32 (21.8%) |
| Bachelor's Degree or higher | 54 (79.4%) | 14 (20.6%) |
Occupancy by Age of Householder in Sistersville
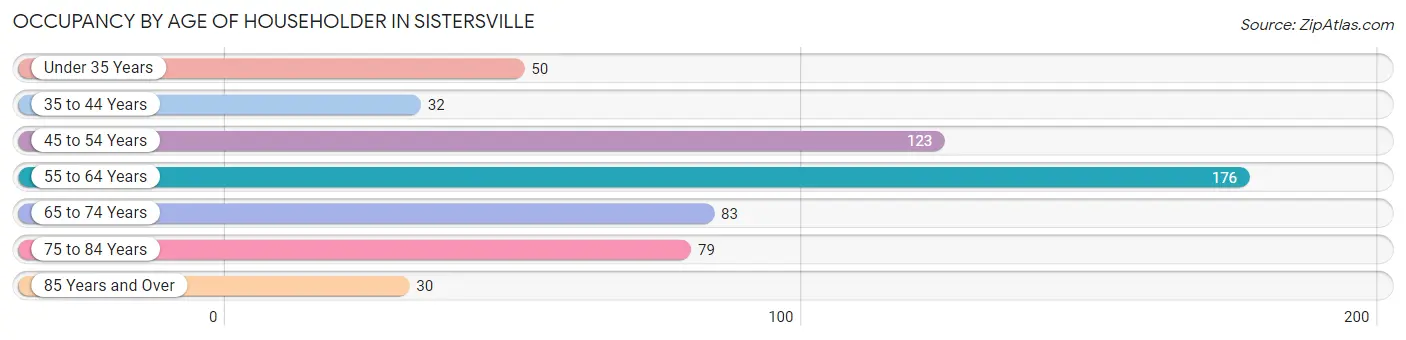
| Age Bracket | # Households | % Households |
| Under 35 Years | 50 | 8.7% |
| 35 to 44 Years | 32 | 5.6% |
| 45 to 54 Years | 123 | 21.5% |
| 55 to 64 Years | 176 | 30.7% |
| 65 to 74 Years | 83 | 14.5% |
| 75 to 84 Years | 79 | 13.8% |
| 85 Years and Over | 30 | 5.2% |
| Total | 573 | 100.0% |
Housing Finances in Sistersville
Median Income by Occupancy in Sistersville
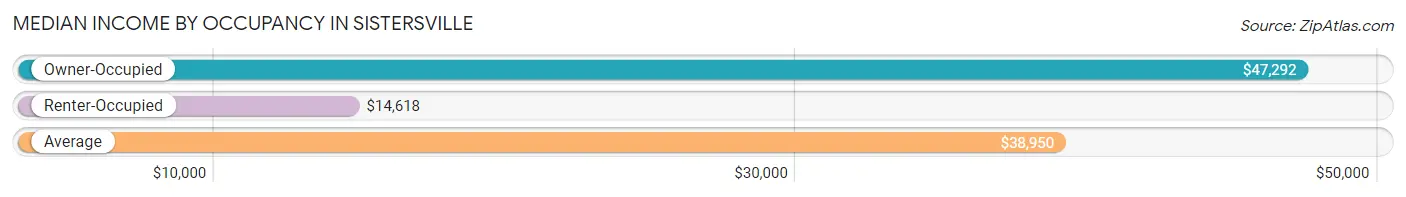
| Occupancy Type | # Households | Median Income |
| Owner-Occupied | 460 (80.3%) | $47,292 |
| Renter-Occupied | 113 (19.7%) | $14,618 |
| Average | 573 (100.0%) | $38,950 |
Occupancy by Householder Income Bracket in Sistersville
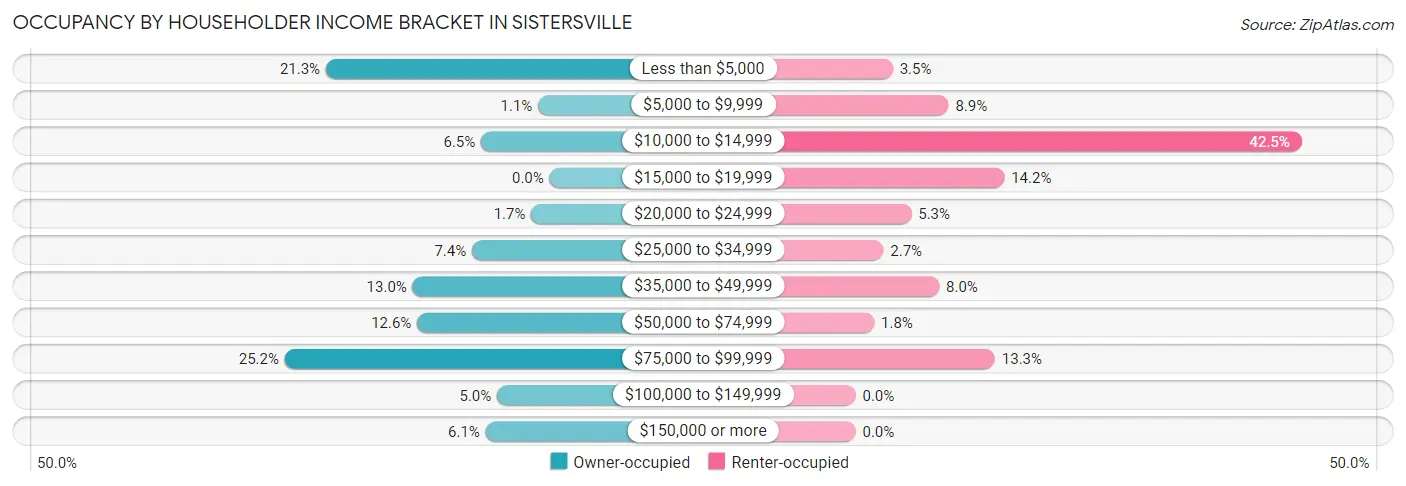
| Income Bracket | Owner-occupied | Renter-occupied |
| Less than $5,000 | 98 (21.3%) | 4 (3.5%) |
| $5,000 to $9,999 | 5 (1.1%) | 10 (8.8%) |
| $10,000 to $14,999 | 30 (6.5%) | 48 (42.5%) |
| $15,000 to $19,999 | 0 (0.0%) | 16 (14.2%) |
| $20,000 to $24,999 | 8 (1.7%) | 6 (5.3%) |
| $25,000 to $34,999 | 34 (7.4%) | 3 (2.6%) |
| $35,000 to $49,999 | 60 (13.0%) | 9 (8.0%) |
| $50,000 to $74,999 | 58 (12.6%) | 2 (1.8%) |
| $75,000 to $99,999 | 116 (25.2%) | 15 (13.3%) |
| $100,000 to $149,999 | 23 (5.0%) | 0 (0.0%) |
| $150,000 or more | 28 (6.1%) | 0 (0.0%) |
| Total | 460 (100.0%) | 113 (100.0%) |
Monthly Housing Cost Tiers in Sistersville
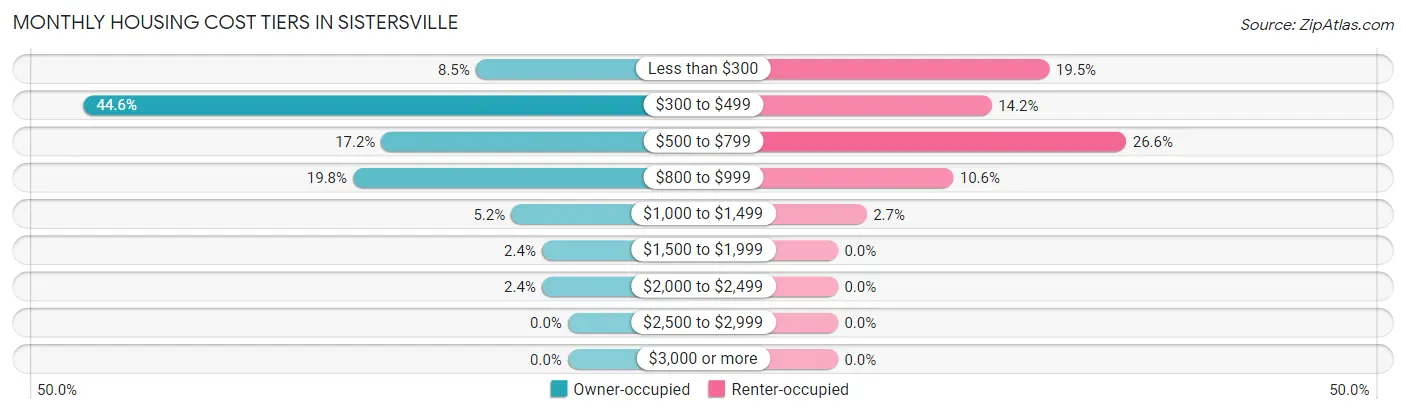
| Monthly Cost | Owner-occupied | Renter-occupied |
| Less than $300 | 39 (8.5%) | 22 (19.5%) |
| $300 to $499 | 205 (44.6%) | 16 (14.2%) |
| $500 to $799 | 79 (17.2%) | 30 (26.6%) |
| $800 to $999 | 91 (19.8%) | 12 (10.6%) |
| $1,000 to $1,499 | 24 (5.2%) | 3 (2.6%) |
| $1,500 to $1,999 | 11 (2.4%) | 0 (0.0%) |
| $2,000 to $2,499 | 11 (2.4%) | 0 (0.0%) |
| $2,500 to $2,999 | 0 (0.0%) | 0 (0.0%) |
| $3,000 or more | 0 (0.0%) | 0 (0.0%) |
| Total | 460 (100.0%) | 113 (100.0%) |
Physical Housing Characteristics in Sistersville
Housing Structures in Sistersville
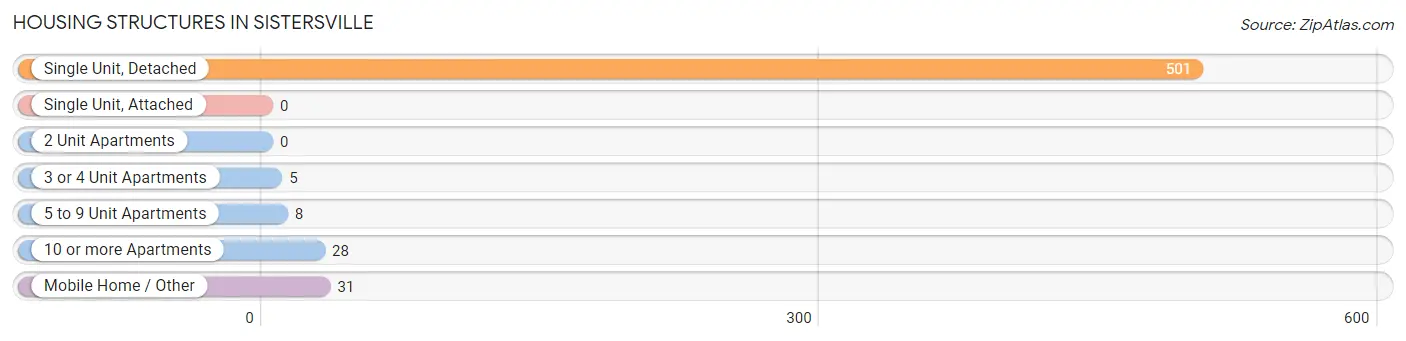
| Structure Type | # Housing Units | % Housing Units |
| Single Unit, Detached | 501 | 87.4% |
| Single Unit, Attached | 0 | 0.0% |
| 2 Unit Apartments | 0 | 0.0% |
| 3 or 4 Unit Apartments | 5 | 0.9% |
| 5 to 9 Unit Apartments | 8 | 1.4% |
| 10 or more Apartments | 28 | 4.9% |
| Mobile Home / Other | 31 | 5.4% |
| Total | 573 | 100.0% |
Housing Structures by Occupancy in Sistersville
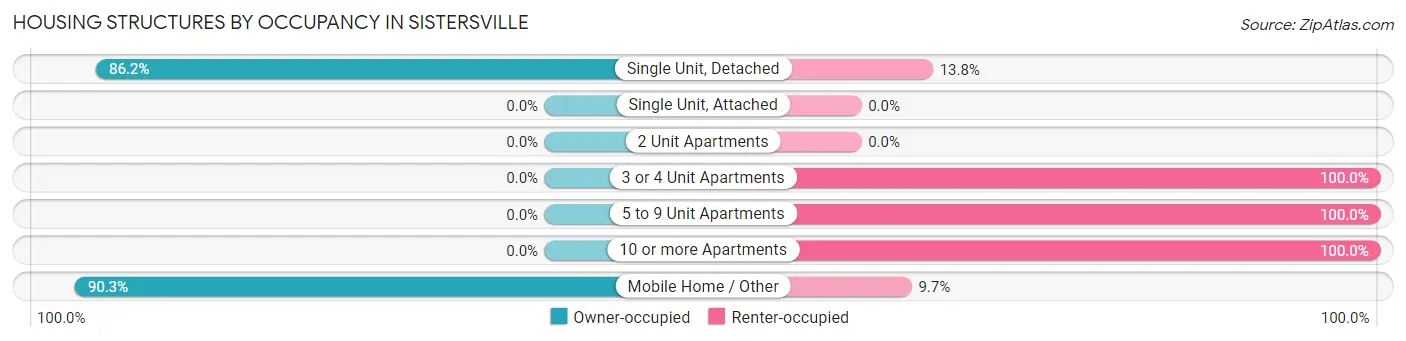
| Structure Type | Owner-occupied | Renter-occupied |
| Single Unit, Detached | 432 (86.2%) | 69 (13.8%) |
| Single Unit, Attached | 0 (0.0%) | 0 (0.0%) |
| 2 Unit Apartments | 0 (0.0%) | 0 (0.0%) |
| 3 or 4 Unit Apartments | 0 (0.0%) | 5 (100.0%) |
| 5 to 9 Unit Apartments | 0 (0.0%) | 8 (100.0%) |
| 10 or more Apartments | 0 (0.0%) | 28 (100.0%) |
| Mobile Home / Other | 28 (90.3%) | 3 (9.7%) |
| Total | 460 (80.3%) | 113 (19.7%) |
Housing Structures by Number of Rooms in Sistersville
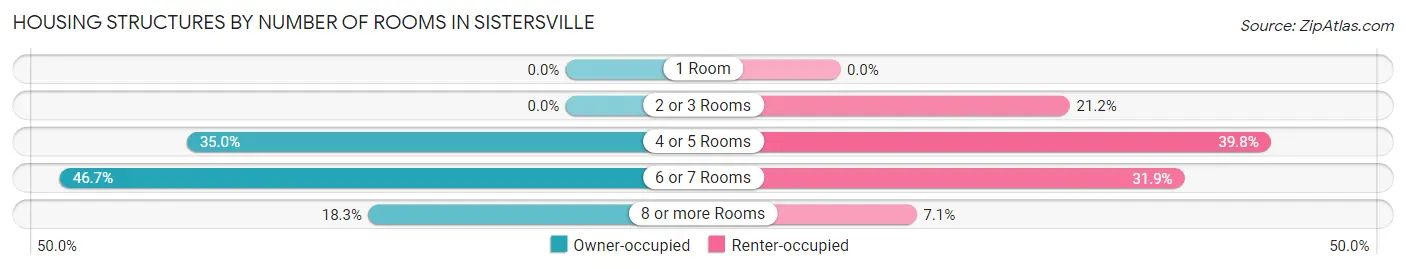
| Number of Rooms | Owner-occupied | Renter-occupied |
| 1 Room | 0 (0.0%) | 0 (0.0%) |
| 2 or 3 Rooms | 0 (0.0%) | 24 (21.2%) |
| 4 or 5 Rooms | 161 (35.0%) | 45 (39.8%) |
| 6 or 7 Rooms | 215 (46.7%) | 36 (31.9%) |
| 8 or more Rooms | 84 (18.3%) | 8 (7.1%) |
| Total | 460 (100.0%) | 113 (100.0%) |
Housing Structure by Heating Type in Sistersville
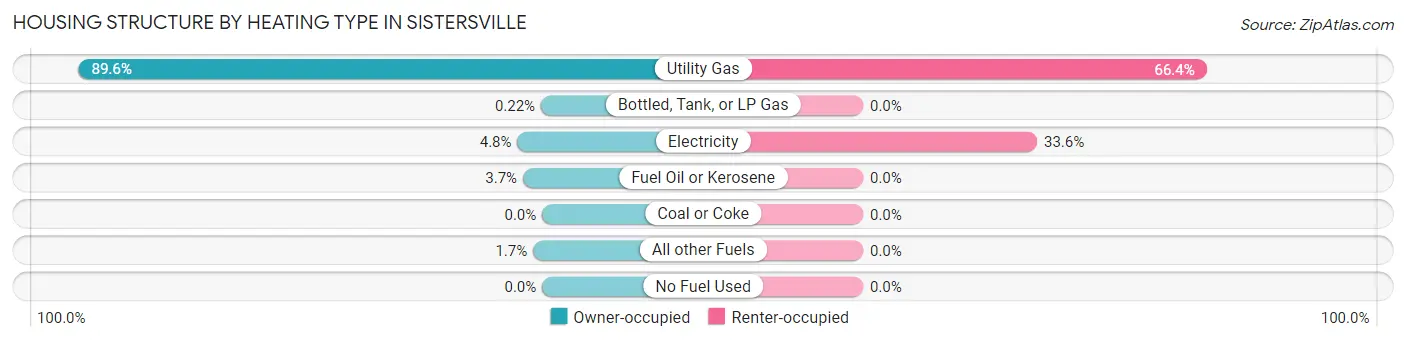
| Heating Type | Owner-occupied | Renter-occupied |
| Utility Gas | 412 (89.6%) | 75 (66.4%) |
| Bottled, Tank, or LP Gas | 1 (0.2%) | 0 (0.0%) |
| Electricity | 22 (4.8%) | 38 (33.6%) |
| Fuel Oil or Kerosene | 17 (3.7%) | 0 (0.0%) |
| Coal or Coke | 0 (0.0%) | 0 (0.0%) |
| All other Fuels | 8 (1.7%) | 0 (0.0%) |
| No Fuel Used | 0 (0.0%) | 0 (0.0%) |
| Total | 460 (100.0%) | 113 (100.0%) |
Household Vehicle Usage in Sistersville
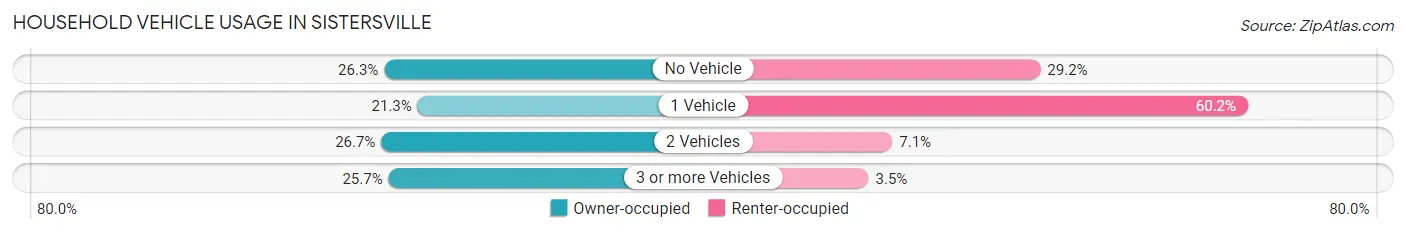
| Vehicles per Household | Owner-occupied | Renter-occupied |
| No Vehicle | 121 (26.3%) | 33 (29.2%) |
| 1 Vehicle | 98 (21.3%) | 68 (60.2%) |
| 2 Vehicles | 123 (26.7%) | 8 (7.1%) |
| 3 or more Vehicles | 118 (25.7%) | 4 (3.5%) |
| Total | 460 (100.0%) | 113 (100.0%) |
Real Estate & Mortgages in Sistersville
Real Estate and Mortgage Overview in Sistersville
| Characteristic | Without Mortgage | With Mortgage |
| Housing Units | 290 | 170 |
| Median Property Value | $76,700 | $80,000 |
| Median Household Income | - | - |
| Monthly Housing Costs | $379 | $0 |
| Real Estate Taxes | $531 | $4 |
Property Value by Mortgage Status in Sistersville
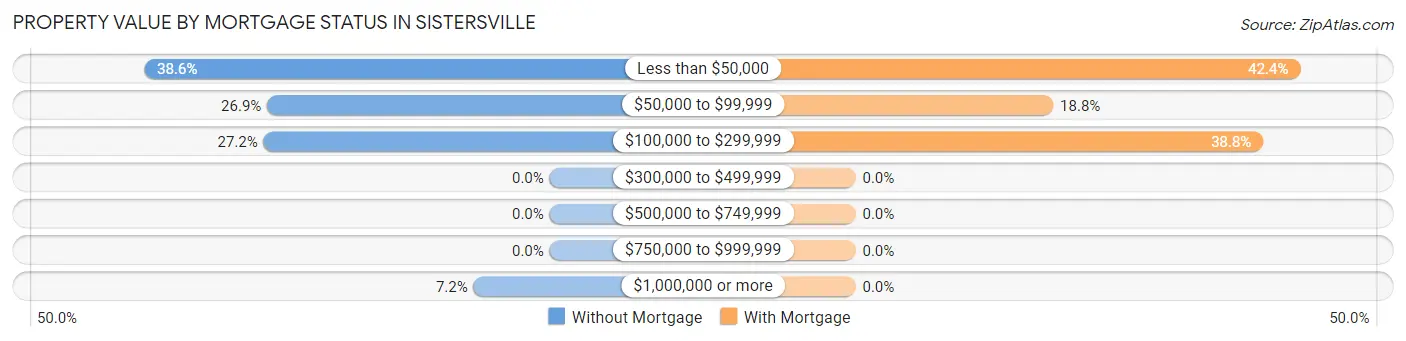
| Property Value | Without Mortgage | With Mortgage |
| Less than $50,000 | 112 (38.6%) | 72 (42.3%) |
| $50,000 to $99,999 | 78 (26.9%) | 32 (18.8%) |
| $100,000 to $299,999 | 79 (27.2%) | 66 (38.8%) |
| $300,000 to $499,999 | 0 (0.0%) | 0 (0.0%) |
| $500,000 to $749,999 | 0 (0.0%) | 0 (0.0%) |
| $750,000 to $999,999 | 0 (0.0%) | 0 (0.0%) |
| $1,000,000 or more | 21 (7.2%) | 0 (0.0%) |
| Total | 290 (100.0%) | 170 (100.0%) |
Household Income by Mortgage Status in Sistersville
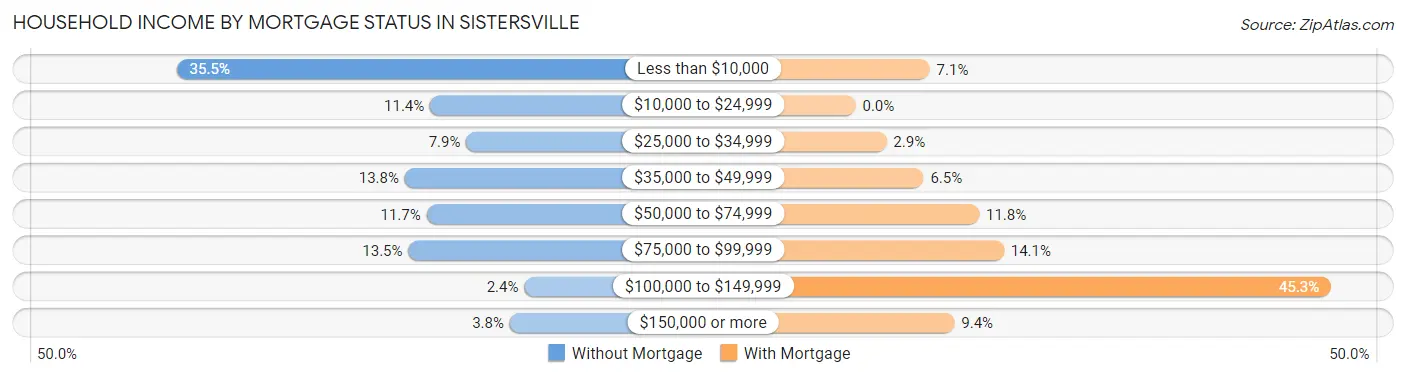
| Household Income | Without Mortgage | With Mortgage |
| Less than $10,000 | 103 (35.5%) | 12 (7.1%) |
| $10,000 to $24,999 | 33 (11.4%) | 0 (0.0%) |
| $25,000 to $34,999 | 23 (7.9%) | 5 (2.9%) |
| $35,000 to $49,999 | 40 (13.8%) | 11 (6.5%) |
| $50,000 to $74,999 | 34 (11.7%) | 20 (11.8%) |
| $75,000 to $99,999 | 39 (13.5%) | 24 (14.1%) |
| $100,000 to $149,999 | 7 (2.4%) | 77 (45.3%) |
| $150,000 or more | 11 (3.8%) | 16 (9.4%) |
| Total | 290 (100.0%) | 170 (100.0%) |
Property Value to Household Income Ratio in Sistersville
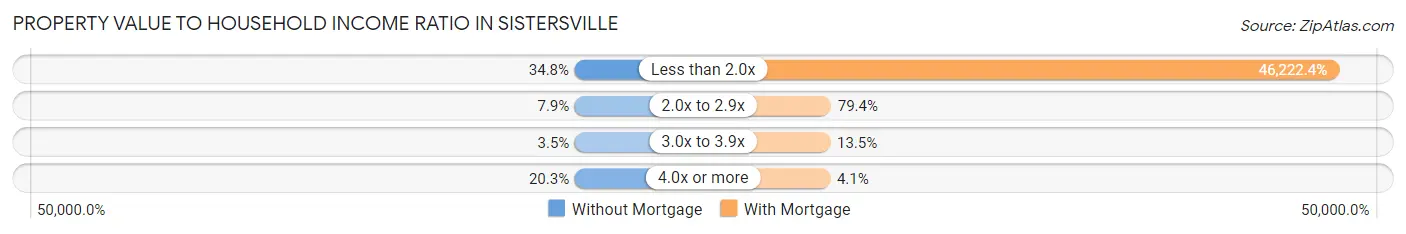
| Value-to-Income Ratio | Without Mortgage | With Mortgage |
| Less than 2.0x | 101 (34.8%) | 78,578 (46,222.4%) |
| 2.0x to 2.9x | 23 (7.9%) | 135 (79.4%) |
| 3.0x to 3.9x | 10 (3.5%) | 23 (13.5%) |
| 4.0x or more | 59 (20.3%) | 7 (4.1%) |
| Total | 290 (100.0%) | 170 (100.0%) |
Real Estate Taxes by Mortgage Status in Sistersville
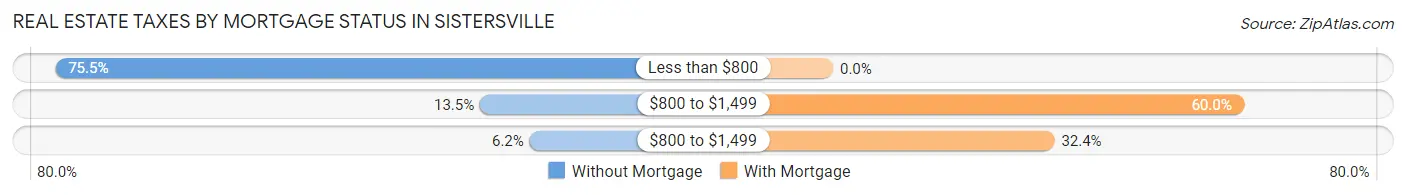
| Property Taxes | Without Mortgage | With Mortgage |
| Less than $800 | 219 (75.5%) | 0 (0.0%) |
| $800 to $1,499 | 39 (13.5%) | 102 (60.0%) |
| $800 to $1,499 | 18 (6.2%) | 55 (32.4%) |
| Total | 290 (100.0%) | 170 (100.0%) |
Health & Disability in Sistersville
Health Insurance Coverage by Age in Sistersville
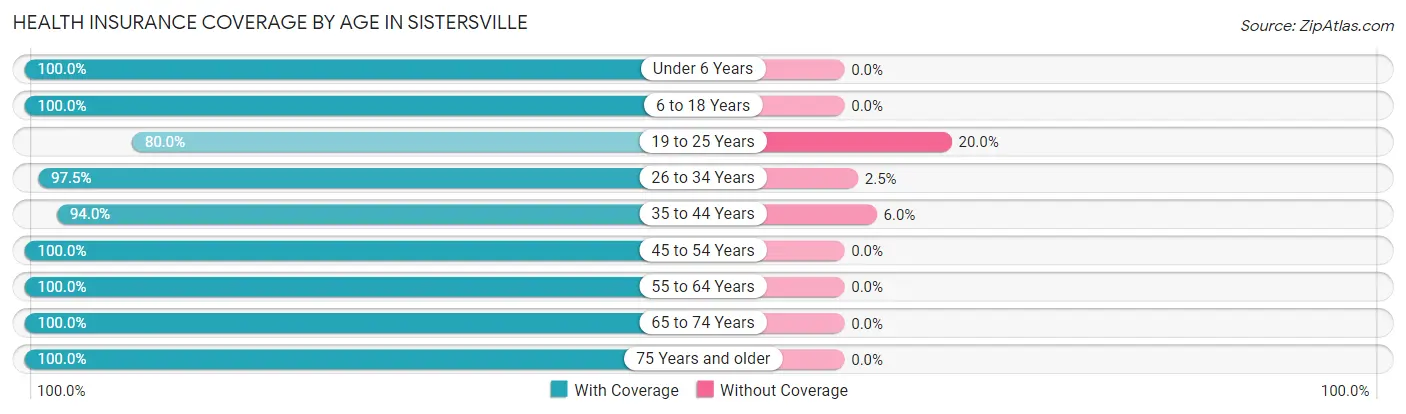
| Age Bracket | With Coverage | Without Coverage |
| Under 6 Years | 42 (100.0%) | 0 (0.0%) |
| 6 to 18 Years | 195 (100.0%) | 0 (0.0%) |
| 19 to 25 Years | 56 (80.0%) | 14 (20.0%) |
| 26 to 34 Years | 77 (97.5%) | 2 (2.5%) |
| 35 to 44 Years | 109 (94.0%) | 7 (6.0%) |
| 45 to 54 Years | 168 (100.0%) | 0 (0.0%) |
| 55 to 64 Years | 313 (100.0%) | 0 (0.0%) |
| 65 to 74 Years | 122 (100.0%) | 0 (0.0%) |
| 75 Years and older | 156 (100.0%) | 0 (0.0%) |
| Total | 1,238 (98.2%) | 23 (1.8%) |
Health Insurance Coverage by Citizenship Status in Sistersville
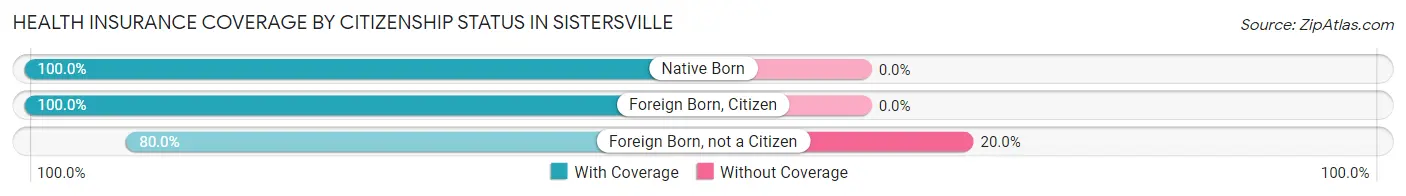
| Citizenship Status | With Coverage | Without Coverage |
| Native Born | 42 (100.0%) | 0 (0.0%) |
| Foreign Born, Citizen | 195 (100.0%) | 0 (0.0%) |
| Foreign Born, not a Citizen | 56 (80.0%) | 14 (20.0%) |
Health Insurance Coverage by Household Income in Sistersville
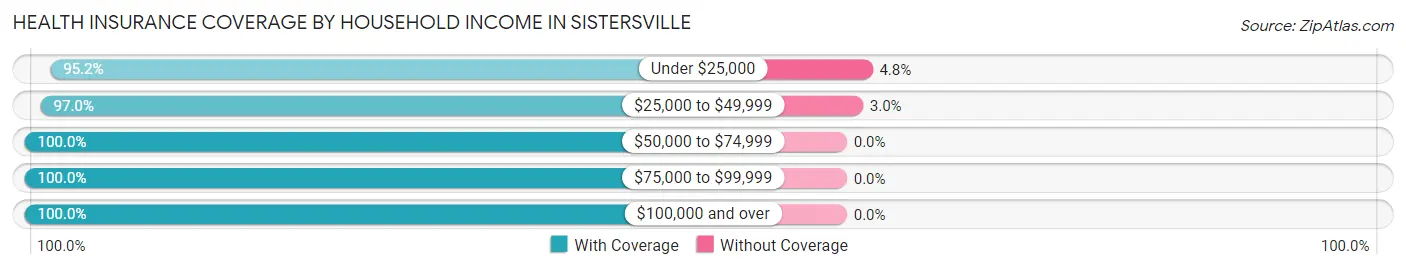
| Household Income | With Coverage | Without Coverage |
| Under $25,000 | 356 (95.2%) | 18 (4.8%) |
| $25,000 to $49,999 | 161 (97.0%) | 5 (3.0%) |
| $50,000 to $74,999 | 185 (100.0%) | 0 (0.0%) |
| $75,000 to $99,999 | 296 (100.0%) | 0 (0.0%) |
| $100,000 and over | 236 (100.0%) | 0 (0.0%) |
Public vs Private Health Insurance Coverage by Age in Sistersville
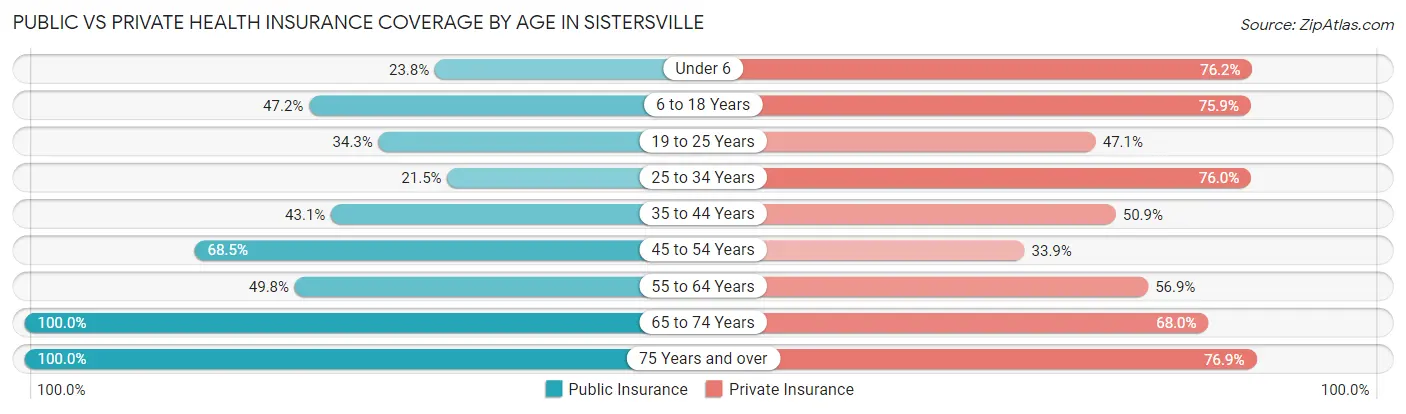
| Age Bracket | Public Insurance | Private Insurance |
| Under 6 | 10 (23.8%) | 32 (76.2%) |
| 6 to 18 Years | 92 (47.2%) | 148 (75.9%) |
| 19 to 25 Years | 24 (34.3%) | 33 (47.1%) |
| 25 to 34 Years | 17 (21.5%) | 60 (75.9%) |
| 35 to 44 Years | 50 (43.1%) | 59 (50.9%) |
| 45 to 54 Years | 115 (68.4%) | 57 (33.9%) |
| 55 to 64 Years | 156 (49.8%) | 178 (56.9%) |
| 65 to 74 Years | 122 (100.0%) | 83 (68.0%) |
| 75 Years and over | 156 (100.0%) | 120 (76.9%) |
| Total | 742 (58.8%) | 770 (61.1%) |
Disability Status by Sex by Age in Sistersville
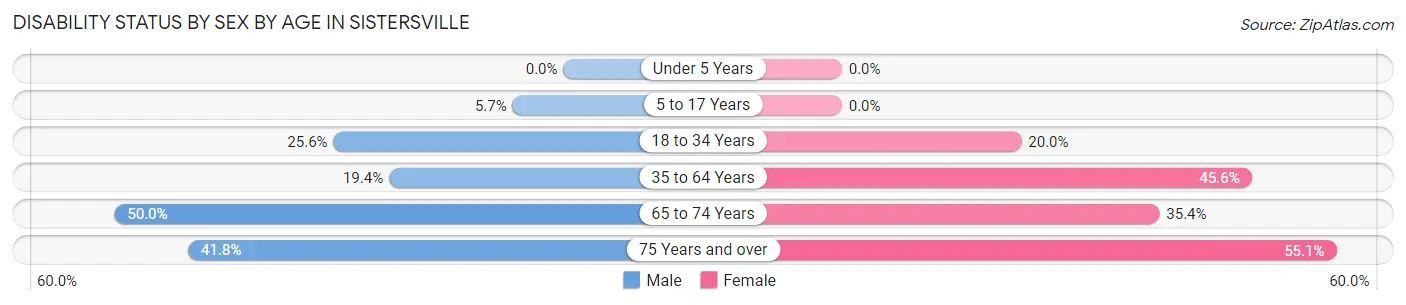
| Age Bracket | Male | Female |
| Under 5 Years | 0 (0.0%) | 0 (0.0%) |
| 5 to 17 Years | 3 (5.7%) | 0 (0.0%) |
| 18 to 34 Years | 21 (25.6%) | 15 (20.0%) |
| 35 to 64 Years | 47 (19.4%) | 162 (45.6%) |
| 65 to 74 Years | 20 (50.0%) | 29 (35.4%) |
| 75 Years and over | 28 (41.8%) | 49 (55.1%) |
Disability Class by Sex by Age in Sistersville
Disability Class: Hearing Difficulty
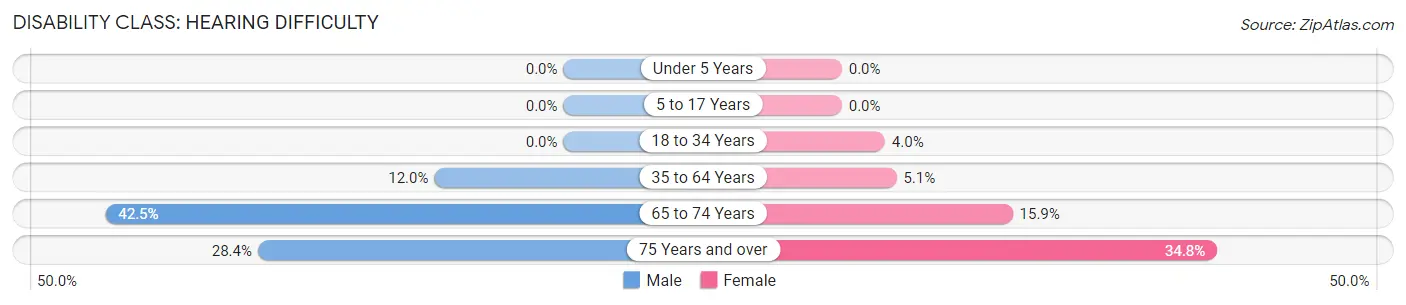
| Age Bracket | Male | Female |
| Under 5 Years | 0 (0.0%) | 0 (0.0%) |
| 5 to 17 Years | 0 (0.0%) | 0 (0.0%) |
| 18 to 34 Years | 0 (0.0%) | 3 (4.0%) |
| 35 to 64 Years | 29 (12.0%) | 18 (5.1%) |
| 65 to 74 Years | 17 (42.5%) | 13 (15.9%) |
| 75 Years and over | 19 (28.4%) | 31 (34.8%) |
Disability Class: Vision Difficulty
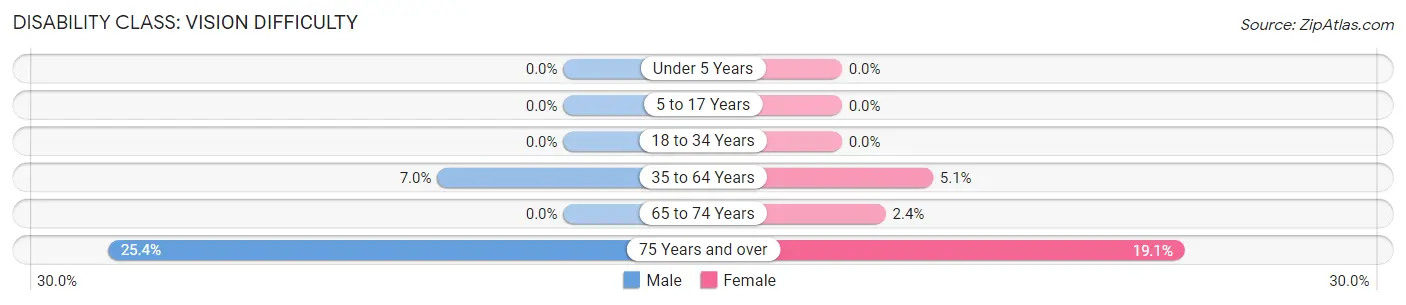
| Age Bracket | Male | Female |
| Under 5 Years | 0 (0.0%) | 0 (0.0%) |
| 5 to 17 Years | 0 (0.0%) | 0 (0.0%) |
| 18 to 34 Years | 0 (0.0%) | 0 (0.0%) |
| 35 to 64 Years | 17 (7.0%) | 18 (5.1%) |
| 65 to 74 Years | 0 (0.0%) | 2 (2.4%) |
| 75 Years and over | 17 (25.4%) | 17 (19.1%) |
Disability Class: Cognitive Difficulty
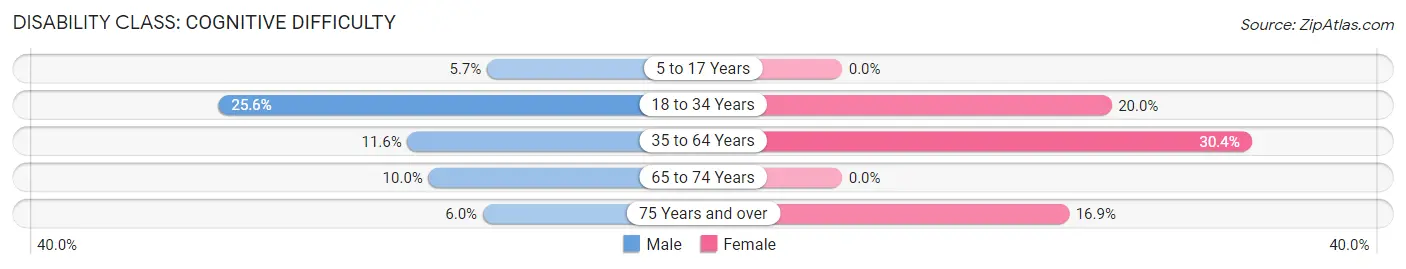
| Age Bracket | Male | Female |
| 5 to 17 Years | 3 (5.7%) | 0 (0.0%) |
| 18 to 34 Years | 21 (25.6%) | 15 (20.0%) |
| 35 to 64 Years | 28 (11.6%) | 108 (30.4%) |
| 65 to 74 Years | 4 (10.0%) | 0 (0.0%) |
| 75 Years and over | 4 (6.0%) | 15 (16.9%) |
Disability Class: Ambulatory Difficulty
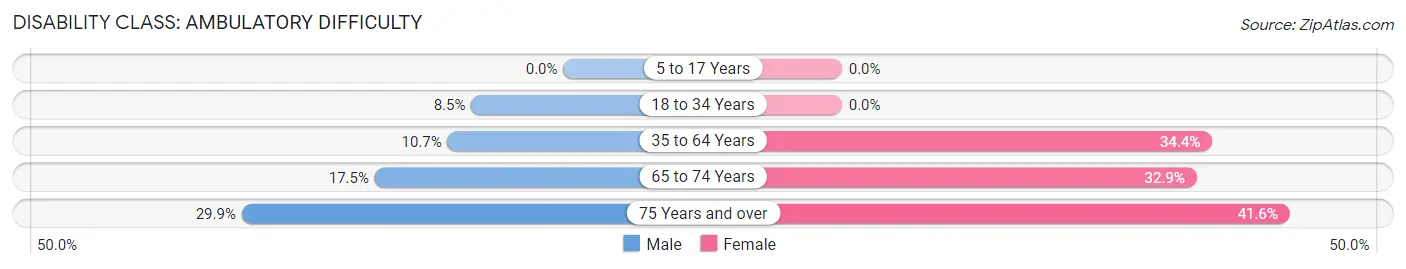
| Age Bracket | Male | Female |
| 5 to 17 Years | 0 (0.0%) | 0 (0.0%) |
| 18 to 34 Years | 7 (8.5%) | 0 (0.0%) |
| 35 to 64 Years | 26 (10.7%) | 122 (34.4%) |
| 65 to 74 Years | 7 (17.5%) | 27 (32.9%) |
| 75 Years and over | 20 (29.8%) | 37 (41.6%) |
Disability Class: Self-Care Difficulty
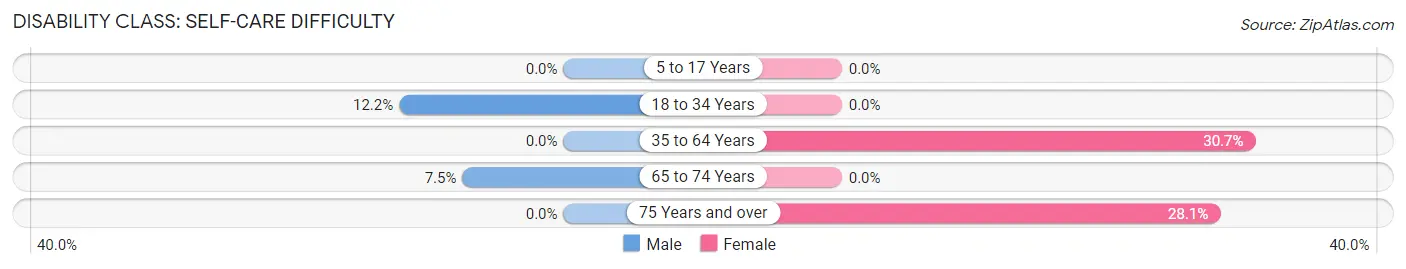
| Age Bracket | Male | Female |
| 5 to 17 Years | 0 (0.0%) | 0 (0.0%) |
| 18 to 34 Years | 10 (12.2%) | 0 (0.0%) |
| 35 to 64 Years | 0 (0.0%) | 109 (30.7%) |
| 65 to 74 Years | 3 (7.5%) | 0 (0.0%) |
| 75 Years and over | 0 (0.0%) | 25 (28.1%) |
Technology Access in Sistersville
Computing Device Access in Sistersville
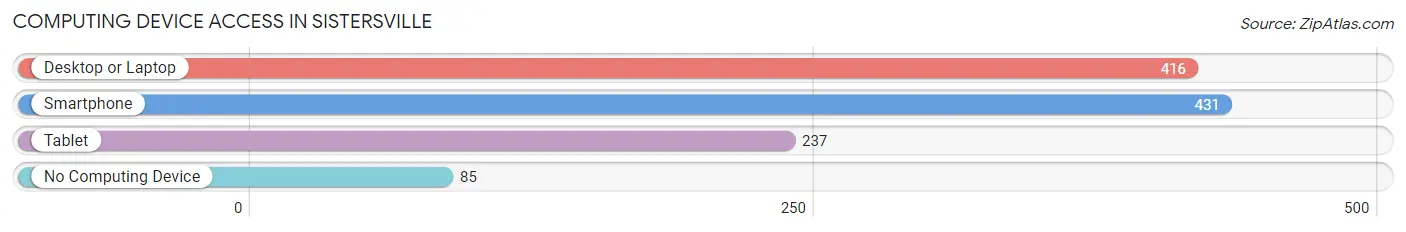
| Device Type | # Households | % Households |
| Desktop or Laptop | 416 | 72.6% |
| Smartphone | 431 | 75.2% |
| Tablet | 237 | 41.4% |
| No Computing Device | 85 | 14.8% |
| Total | 573 | 100.0% |
Internet Access in Sistersville
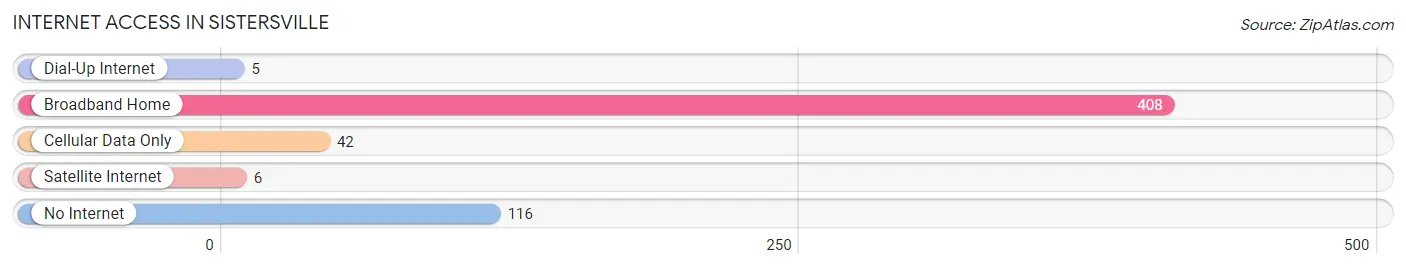
| Internet Type | # Households | % Households |
| Dial-Up Internet | 5 | 0.9% |
| Broadband Home | 408 | 71.2% |
| Cellular Data Only | 42 | 7.3% |
| Satellite Internet | 6 | 1.1% |
| No Internet | 116 | 20.2% |
| Total | 573 | 100.0% |
Sistersville Summary
Sistersville is a city located in Tyler County, West Virginia, United States. It is situated along the Ohio River, and is the county seat of Tyler County. The population was 1,396 at the 2010 census.
History
Sistersville was founded in 1817 by two brothers, William and Joseph Tanner, who named the town after their two sisters. The town was incorporated in 1839.
During the Civil War, Sistersville was a major supply depot for the Confederate Army. In 1863, the town was the site of a major battle between Union and Confederate forces.
Geography
Sistersville is located at 39 27 17 North 80 51 45 West 39 454722 80 862472
According to the United States Census Bureau, the city has a total area of 1.2 square miles (3.1 km2), all of it land.
Economy
Sistersville is the home of the Sistersville Oil and Gas Field, which is the largest oil and gas field in West Virginia. The city is also home to several manufacturing companies, including Sistersville Tank Works, which produces oil tanks and other oil and gas related equipment.
Demographics
As of the census of 2010, there were 1,396 people, 590 households, and 369 families residing in the city. The population density was 1,164.2 people per square mile (449.7/km2). There were 645 housing units at an average density of 537.5 per square mile (207.3/km2). The racial makeup of the city was 97.3% White, 0.6% African American, 0.1% Native American, 0.1% Asian, 0.1% Pacific Islander, 0.3% from other races, and 1.6% from two or more races. Hispanic or Latino of any race were 0.9% of the population.
There were 590 households, out of which 28.6% had children under the age of 18 living with them, 43.4% were married couples living together, 14.6% had a female householder with no husband present, and 37.3% were non-families. 33.1% of all households were made up of individuals, and 15.3% had someone living alone who was 65 years of age or older. The average household size was 2.35 and the average family size was 2.97.
In the city, the population was spread out, with 24.2% under the age of 18, 8.2% from 18 to 24, 25.2% from 25 to 44, 24.2% from 45 to 64, and 18.2% who were 65 years of age or older. The median age was 39 years. For every 100 females, there were 87.2 males. For every 100 females age 18 and over, there were 83.2 males.
The median income for a household in the city was $27,500, and the median income for a family was $35,000. Males had a median income of $30,000 versus $20,000 for females. The per capita income for the city was $15,845. About 14.2% of families and 17.2% of the population were below the poverty line, including 24.2% of those under age 18 and 11.2% of those age 65 or over.
Common Questions
What is Per Capita Income in Sistersville?
Per Capita income in Sistersville is $24,280.
What is the Median Family Income in Sistersville?
Median Family Income in Sistersville is $78,555.
What is the Median Household income in Sistersville?
Median Household Income in Sistersville is $38,950.
What is Income or Wage Gap in Sistersville?
Income or Wage Gap in Sistersville is 58.2%.
Women in Sistersville earn 41.8 cents for every dollar earned by a man.
What is Inequality or Gini Index in Sistersville?
Inequality or Gini Index in Sistersville is 0.51.
What is the Total Population of Sistersville?
Total Population of Sistersville is 1,261.
What is the Total Male Population of Sistersville?
Total Male Population of Sistersville is 495.
What is the Total Female Population of Sistersville?
Total Female Population of Sistersville is 766.
What is the Ratio of Males per 100 Females in Sistersville?
There are 64.62 Males per 100 Females in Sistersville.
What is the Ratio of Females per 100 Males in Sistersville?
There are 154.75 Females per 100 Males in Sistersville.
What is the Median Population Age in Sistersville?
Median Population Age in Sistersville is 50.9 Years.
What is the Average Family Size in Sistersville
Average Family Size in Sistersville is 3.4 People.
What is the Average Household Size in Sistersville
Average Household Size in Sistersville is 2.2 People.
How Large is the Labor Force in Sistersville?
There are 430 People in the Labor Forcein in Sistersville.
What is the Percentage of People in the Labor Force in Sistersville?
41.1% of People are in the Labor Force in Sistersville.
What is the Unemployment Rate in Sistersville?
Unemployment Rate in Sistersville is 9.1%.