South Charleston, WV Map & Demographics
South Charleston Map
South Charleston Overview
$35,801
PER CAPITA INCOME
$69,426
AVG FAMILY INCOME
$58,756
AVG HOUSEHOLD INCOME
25.8%
WAGE / INCOME GAP [ % ]
74.2¢/ $1
WAGE / INCOME GAP [ $ ]
$10,586
FAMILY INCOME DEFICIT
0.44
INEQUALITY / GINI INDEX
13,527
TOTAL POPULATION
6,400
MALE POPULATION
7,127
FEMALE POPULATION
89.80
MALES / 100 FEMALES
111.36
FEMALES / 100 MALES
40.7
MEDIAN AGE
2.8
AVG FAMILY SIZE
2.2
AVG HOUSEHOLD SIZE
6,857
LABOR FORCE [ PEOPLE ]
62.2%
PERCENT IN LABOR FORCE
6.9%
UNEMPLOYMENT RATE
South Charleston Area Codes
Income in South Charleston
Income Overview in South Charleston
Per Capita Income in South Charleston is $35,801, while median incomes of families and households are $69,426 and $58,756 respectively.
| Characteristic | Number | Measure |
| Per Capita Income | 13,527 | $35,801 |
| Median Family Income | 3,417 | $69,426 |
| Mean Family Income | 3,417 | $86,726 |
| Median Household Income | 6,018 | $58,756 |
| Mean Household Income | 6,018 | $77,680 |
| Income Deficit | 3,417 | $10,586 |
| Wage / Income Gap (%) | 13,527 | 25.82% |
| Wage / Income Gap ($) | 13,527 | 74.18¢ per $1 |
| Gini / Inequality Index | 13,527 | 0.44 |
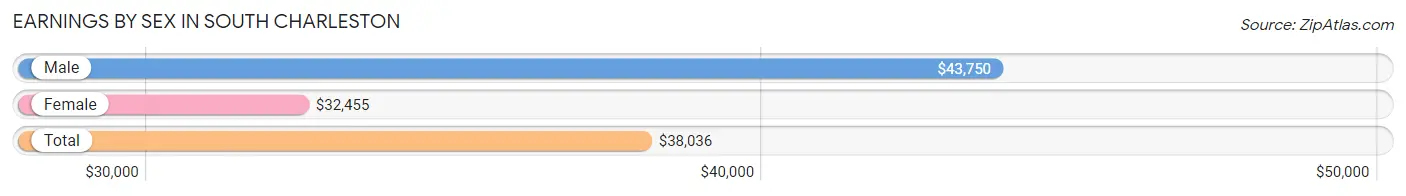
Earnings by Sex in South Charleston
Average Earnings in South Charleston are $38,036, $43,750 for men and $32,455 for women, a difference of 25.8%.
| Sex | Number | Average Earnings |
| Male | 3,630 (52.6%) | $43,750 |
| Female | 3,274 (47.4%) | $32,455 |
| Total | 6,904 (100.0%) | $38,036 |
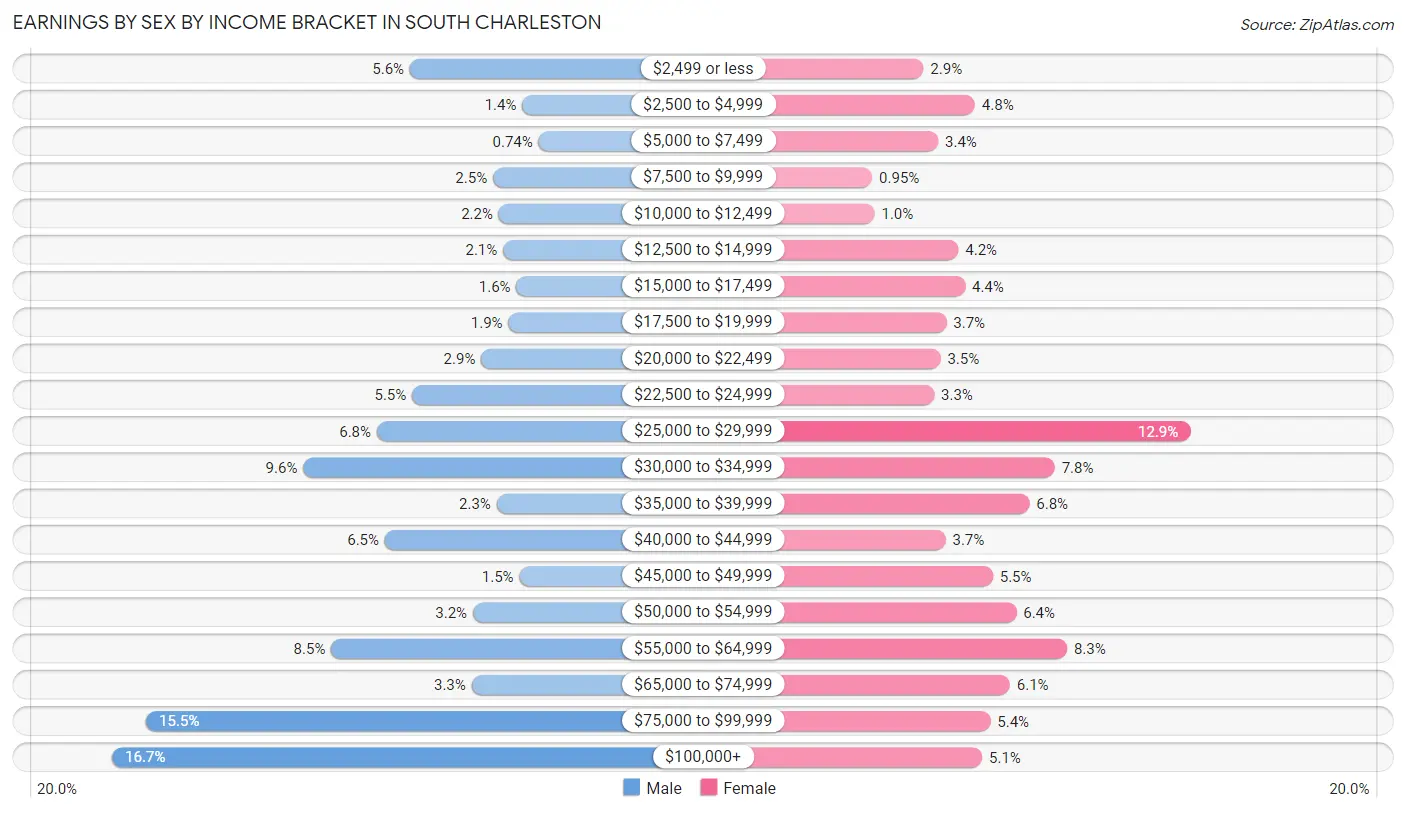
Earnings by Sex by Income Bracket in South Charleston
The most common earnings brackets in South Charleston are $100,000+ for men (607 | 16.7%) and $25,000 to $29,999 for women (421 | 12.9%).
| Income | Male | Female |
| $2,499 or less | 202 (5.6%) | 94 (2.9%) |
| $2,500 to $4,999 | 49 (1.3%) | 157 (4.8%) |
| $5,000 to $7,499 | 27 (0.7%) | 112 (3.4%) |
| $7,500 to $9,999 | 89 (2.5%) | 31 (0.9%) |
| $10,000 to $12,499 | 81 (2.2%) | 34 (1.0%) |
| $12,500 to $14,999 | 75 (2.1%) | 137 (4.2%) |
| $15,000 to $17,499 | 57 (1.6%) | 145 (4.4%) |
| $17,500 to $19,999 | 68 (1.9%) | 122 (3.7%) |
| $20,000 to $22,499 | 105 (2.9%) | 115 (3.5%) |
| $22,500 to $24,999 | 199 (5.5%) | 107 (3.3%) |
| $25,000 to $29,999 | 247 (6.8%) | 421 (12.9%) |
| $30,000 to $34,999 | 347 (9.6%) | 255 (7.8%) |
| $35,000 to $39,999 | 84 (2.3%) | 224 (6.8%) |
| $40,000 to $44,999 | 236 (6.5%) | 121 (3.7%) |
| $45,000 to $49,999 | 53 (1.5%) | 179 (5.5%) |
| $50,000 to $54,999 | 116 (3.2%) | 208 (6.4%) |
| $55,000 to $64,999 | 309 (8.5%) | 270 (8.3%) |
| $65,000 to $74,999 | 118 (3.3%) | 200 (6.1%) |
| $75,000 to $99,999 | 561 (15.4%) | 176 (5.4%) |
| $100,000+ | 607 (16.7%) | 166 (5.1%) |
| Total | 3,630 (100.0%) | 3,274 (100.0%) |
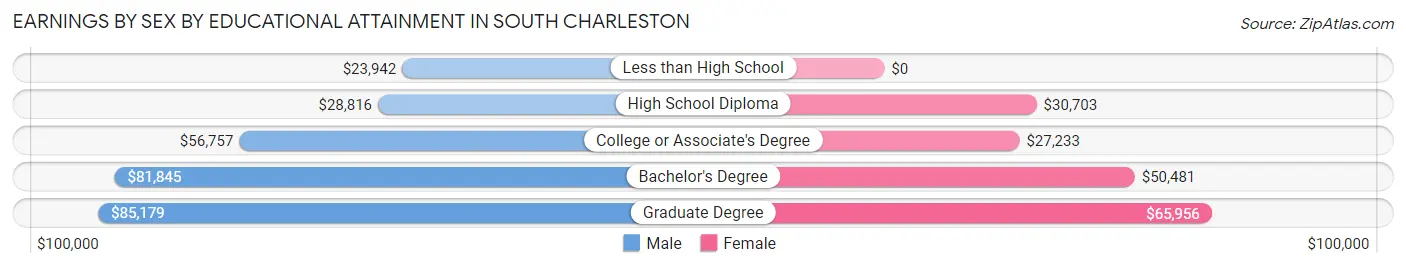
Earnings by Sex by Educational Attainment in South Charleston
Average earnings in South Charleston are $55,777 for men and $35,750 for women, a difference of 35.9%. Men with an educational attainment of graduate degree enjoy the highest average annual earnings of $85,179, while those with less than high school education earn the least with $23,942. Women with an educational attainment of graduate degree earn the most with the average annual earnings of $65,956, while those with college or associate's degree education have the smallest earnings of $27,233.
| Educational Attainment | Male Income | Female Income |
| Less than High School | $23,942 | $0 |
| High School Diploma | $28,816 | $30,703 |
| College or Associate's Degree | $56,757 | $27,233 |
| Bachelor's Degree | $81,845 | $50,481 |
| Graduate Degree | $85,179 | $65,956 |
| Total | $55,777 | $35,750 |
Family Income in South Charleston
Family Income Brackets in South Charleston
According to the South Charleston family income data, there are 550 families falling into the $75,000 to $99,999 income range, which is the most common income bracket and makes up 16.1% of all families. Conversely, the less than $10,000 income bracket is the least frequent group with only 202 families (5.9%) belonging to this category.
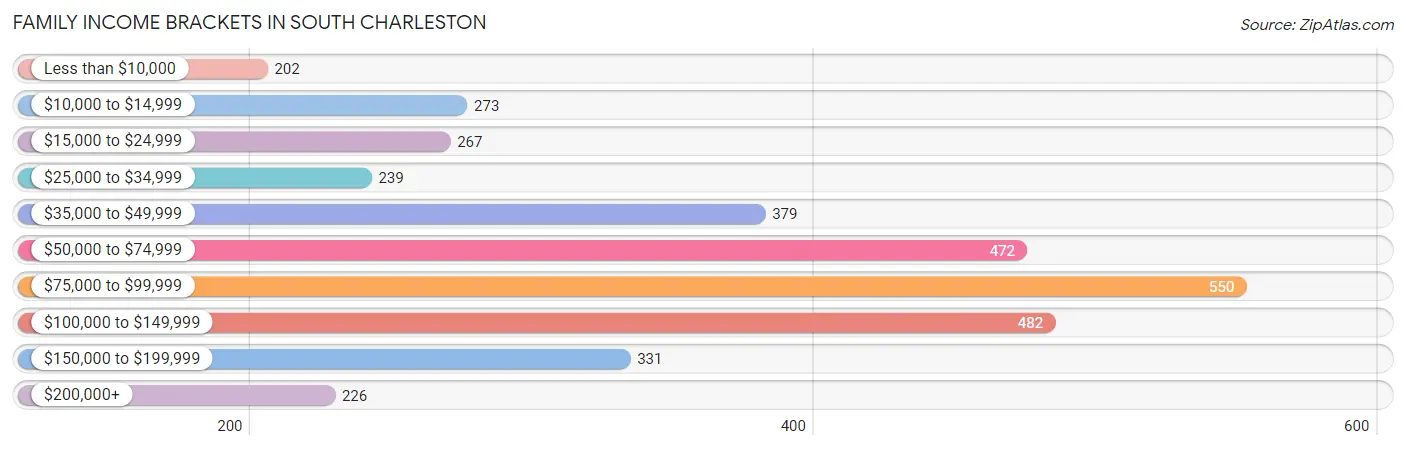
| Income Bracket | # Families | % Families |
| Less than $10,000 | 202 | 5.9% |
| $10,000 to $14,999 | 273 | 8.0% |
| $15,000 to $24,999 | 267 | 7.8% |
| $25,000 to $34,999 | 239 | 7.0% |
| $35,000 to $49,999 | 379 | 11.1% |
| $50,000 to $74,999 | 472 | 13.8% |
| $75,000 to $99,999 | 550 | 16.1% |
| $100,000 to $149,999 | 482 | 14.1% |
| $150,000 to $199,999 | 331 | 9.7% |
| $200,000+ | 226 | 6.6% |
Family Income by Famaliy Size in South Charleston
4-person families (382 | 11.2%) account for the highest median family income in South Charleston with $90,351 per family, while 2-person families (1,975 | 57.8%) have the highest median income of $32,264 per family member.
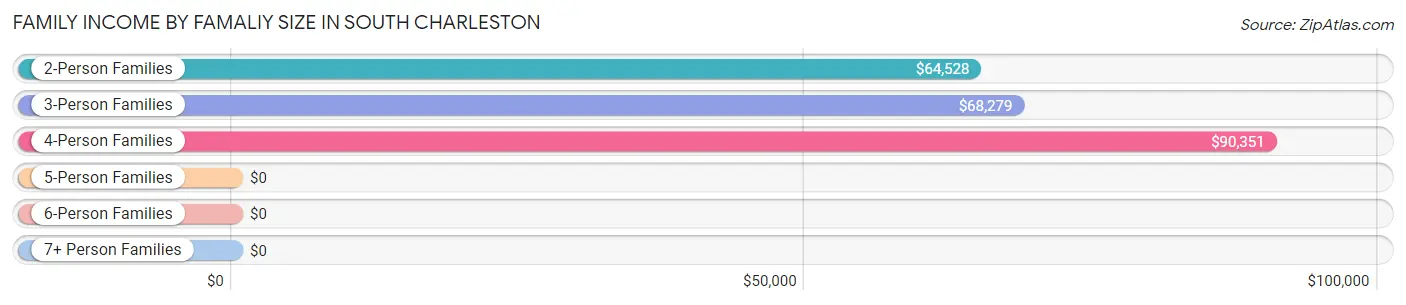
| Income Bracket | # Families | Median Income |
| 2-Person Families | 1,975 (57.8%) | $64,528 |
| 3-Person Families | 874 (25.6%) | $68,279 |
| 4-Person Families | 382 (11.2%) | $90,351 |
| 5-Person Families | 150 (4.4%) | $0 |
| 6-Person Families | 23 (0.7%) | $0 |
| 7+ Person Families | 13 (0.4%) | $0 |
| Total | 3,417 (100.0%) | $69,426 |
Family Income by Number of Earners in South Charleston
The median family income in South Charleston is $69,426, with families comprising 2 earners (1,040) having the highest median family income of $135,449, while families with no earners (784) have the lowest median family income of $36,944, accounting for 30.4% and 22.9% of families, respectively.
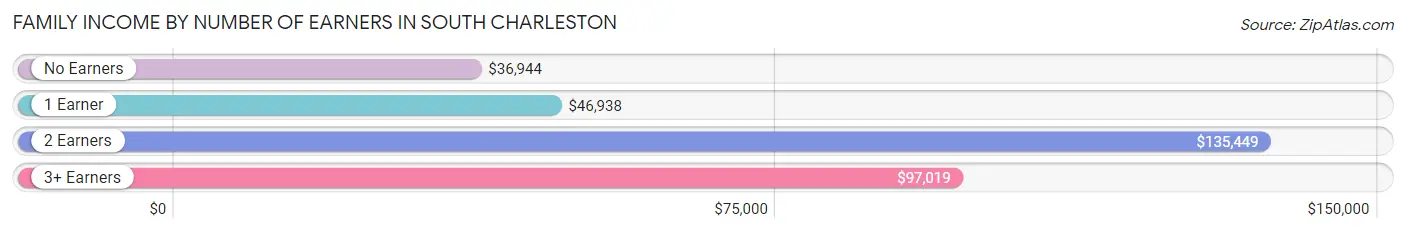
| Number of Earners | # Families | Median Income |
| No Earners | 784 (22.9%) | $36,944 |
| 1 Earner | 1,426 (41.7%) | $46,938 |
| 2 Earners | 1,040 (30.4%) | $135,449 |
| 3+ Earners | 167 (4.9%) | $97,019 |
| Total | 3,417 (100.0%) | $69,426 |
Household Income in South Charleston
Household Income Brackets in South Charleston
With 1,113 households falling in the category, the $50,000 to $74,999 income range is the most frequent in South Charleston, accounting for 18.5% of all households. In contrast, only 271 households (4.5%) fall into the $10,000 to $14,999 income bracket, making it the least populous group.
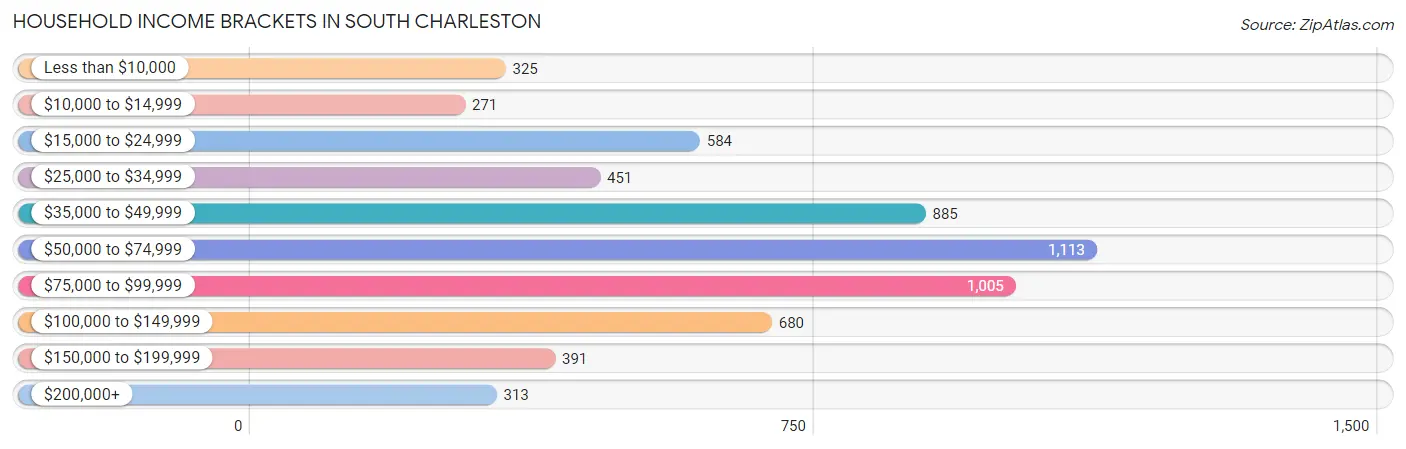
| Income Bracket | # Households | % Households |
| Less than $10,000 | 325 | 5.4% |
| $10,000 to $14,999 | 271 | 4.5% |
| $15,000 to $24,999 | 584 | 9.7% |
| $25,000 to $34,999 | 451 | 7.5% |
| $35,000 to $49,999 | 885 | 14.7% |
| $50,000 to $74,999 | 1,113 | 18.5% |
| $75,000 to $99,999 | 1,005 | 16.7% |
| $100,000 to $149,999 | 680 | 11.3% |
| $150,000 to $199,999 | 391 | 6.5% |
| $200,000+ | 313 | 5.2% |
Household Income by Householder Age in South Charleston
The median household income in South Charleston is $58,756, with the highest median household income of $73,364 found in the 45 to 64 years age bracket for the primary householder. A total of 1,812 households (30.1%) fall into this category. Meanwhile, the 15 to 24 years age bracket for the primary householder has the lowest median household income of $21,333, with 188 households (3.1%) in this group.
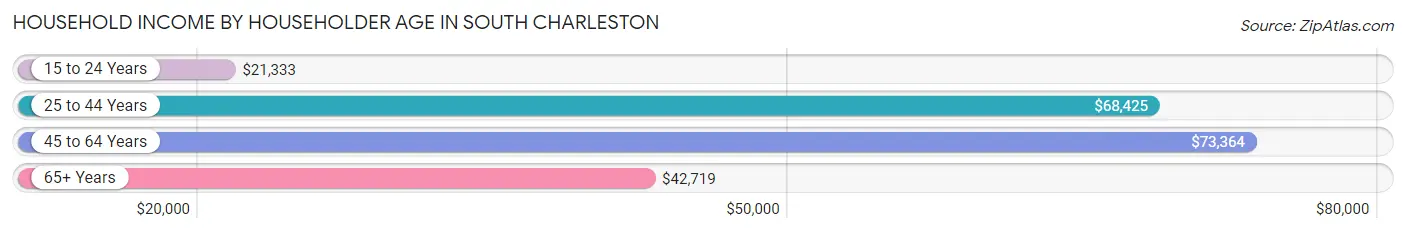
| Income Bracket | # Households | Median Income |
| 15 to 24 Years | 188 (3.1%) | $21,333 |
| 25 to 44 Years | 2,117 (35.2%) | $68,425 |
| 45 to 64 Years | 1,812 (30.1%) | $73,364 |
| 65+ Years | 1,901 (31.6%) | $42,719 |
| Total | 6,018 (100.0%) | $58,756 |
Poverty in South Charleston
Income Below Poverty by Sex and Age in South Charleston
With 16.1% poverty level for males and 25.3% for females among the residents of South Charleston, under 5 year old males and 5 year old females are the most vulnerable to poverty, with 151 males (42.4%) and 70 females (88.6%) in their respective age groups living below the poverty level.
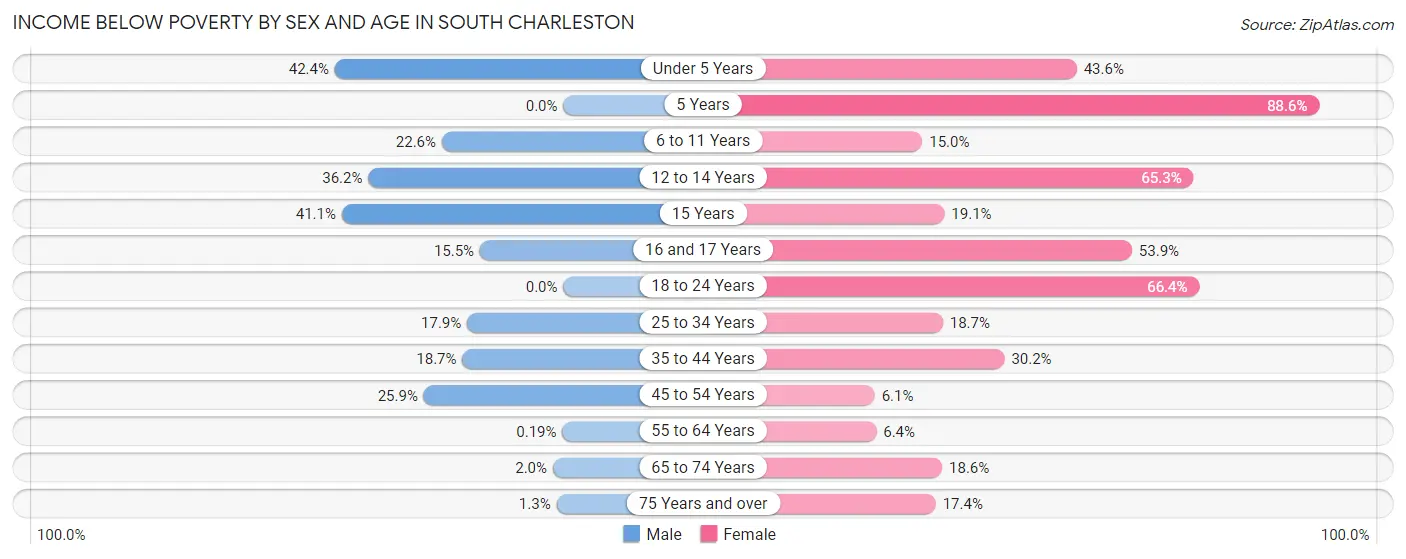
| Age Bracket | Male | Female |
| Under 5 Years | 151 (42.4%) | 99 (43.6%) |
| 5 Years | 0 (0.0%) | 70 (88.6%) |
| 6 to 11 Years | 76 (22.6%) | 74 (14.9%) |
| 12 to 14 Years | 80 (36.2%) | 295 (65.3%) |
| 15 Years | 58 (41.1%) | 12 (19.1%) |
| 16 and 17 Years | 37 (15.5%) | 77 (53.8%) |
| 18 to 24 Years | 0 (0.0%) | 278 (66.3%) |
| 25 to 34 Years | 169 (17.9%) | 179 (18.7%) |
| 35 to 44 Years | 188 (18.7%) | 310 (30.2%) |
| 45 to 54 Years | 249 (25.9%) | 39 (6.1%) |
| 55 to 64 Years | 1 (0.2%) | 62 (6.4%) |
| 65 to 74 Years | 11 (1.9%) | 175 (18.6%) |
| 75 Years and over | 6 (1.3%) | 117 (17.4%) |
| Total | 1,026 (16.1%) | 1,787 (25.3%) |
Income Above Poverty by Sex and Age in South Charleston
According to the poverty statistics in South Charleston, males aged 5 years and females aged 45 to 54 years are the age groups that are most secure financially, with 100.0% of males and 93.9% of females in these age groups living above the poverty line.
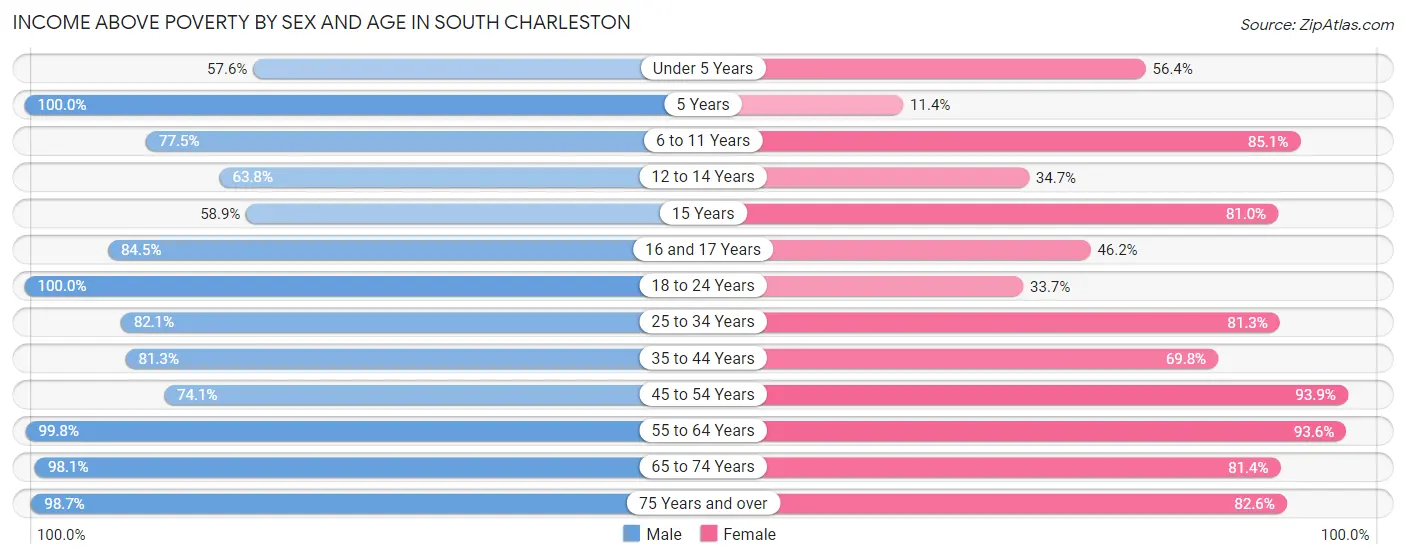
| Age Bracket | Male | Female |
| Under 5 Years | 205 (57.6%) | 128 (56.4%) |
| 5 Years | 74 (100.0%) | 9 (11.4%) |
| 6 to 11 Years | 261 (77.4%) | 421 (85.1%) |
| 12 to 14 Years | 141 (63.8%) | 157 (34.7%) |
| 15 Years | 83 (58.9%) | 51 (80.9%) |
| 16 and 17 Years | 202 (84.5%) | 66 (46.2%) |
| 18 to 24 Years | 530 (100.0%) | 141 (33.7%) |
| 25 to 34 Years | 777 (82.1%) | 776 (81.3%) |
| 35 to 44 Years | 815 (81.3%) | 717 (69.8%) |
| 45 to 54 Years | 712 (74.1%) | 599 (93.9%) |
| 55 to 64 Years | 538 (99.8%) | 906 (93.6%) |
| 65 to 74 Years | 554 (98.1%) | 765 (81.4%) |
| 75 Years and over | 468 (98.7%) | 554 (82.6%) |
| Total | 5,360 (83.9%) | 5,290 (74.8%) |
Income Below Poverty Among Married-Couple Families in South Charleston
The poverty statistics for married-couple families in South Charleston show that 7.1% or 140 of the total 1,970 families live below the poverty line. Families with 1 or 2 children have the highest poverty rate of 17.0%, comprising of 129 families. On the other hand, families with no children have the lowest poverty rate of 0.5%, which includes 6 families.
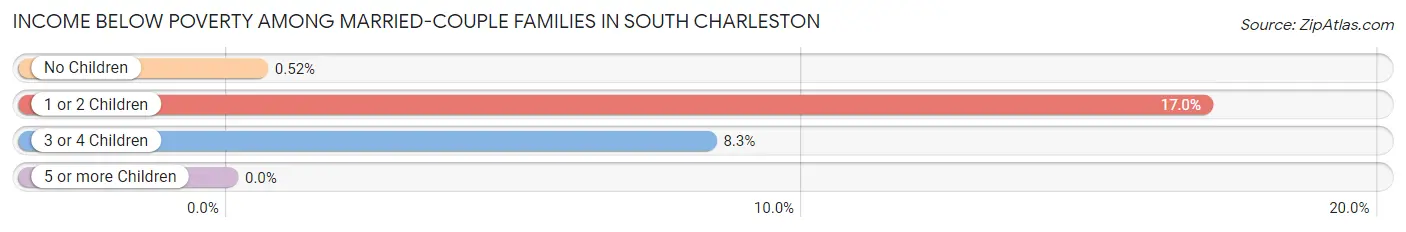
| Children | Above Poverty | Below Poverty |
| No Children | 1,144 (99.5%) | 6 (0.5%) |
| 1 or 2 Children | 631 (83.0%) | 129 (17.0%) |
| 3 or 4 Children | 55 (91.7%) | 5 (8.3%) |
| 5 or more Children | 0 (0.0%) | 0 (0.0%) |
| Total | 1,830 (92.9%) | 140 (7.1%) |
Income Below Poverty Among Single-Parent Households in South Charleston
According to the poverty data in South Charleston, 24.9% or 94 single-father households and 46.1% or 493 single-mother households are living below the poverty line. Among single-father households, those with 3 or 4 children have the highest poverty rate, with 43 households (100.0%) experiencing poverty. Likewise, among single-mother households, those with 3 or 4 children have the highest poverty rate, with 78 households (85.7%) falling below the poverty line.
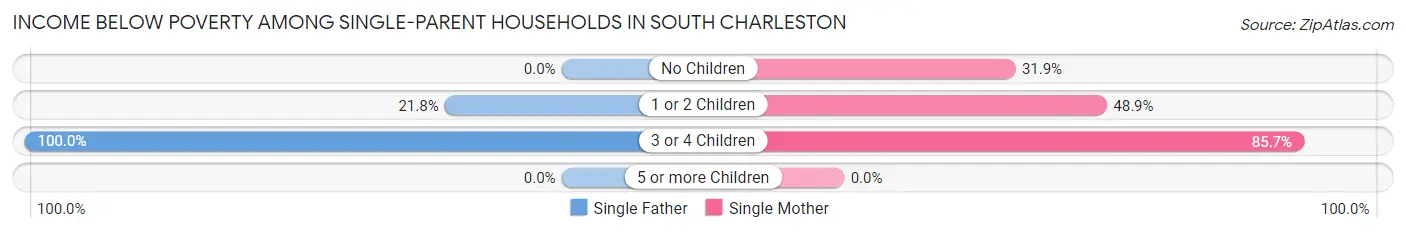
| Children | Single Father | Single Mother |
| No Children | 0 (0.0%) | 119 (31.9%) |
| 1 or 2 Children | 51 (21.8%) | 296 (48.9%) |
| 3 or 4 Children | 43 (100.0%) | 78 (85.7%) |
| 5 or more Children | 0 (0.0%) | 0 (0.0%) |
| Total | 94 (24.9%) | 493 (46.1%) |
Income Below Poverty Among Married-Couple vs Single-Parent Households in South Charleston
The poverty data for South Charleston shows that 140 of the married-couple family households (7.1%) and 587 of the single-parent households (40.6%) are living below the poverty level. Within the married-couple family households, those with 1 or 2 children have the highest poverty rate, with 129 households (17.0%) falling below the poverty line. Among the single-parent households, those with 3 or 4 children have the highest poverty rate, with 121 household (90.3%) living below poverty.
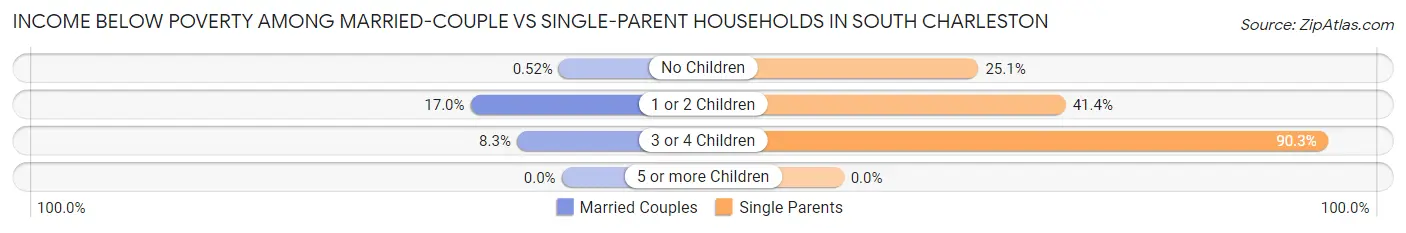
| Children | Married-Couple Families | Single-Parent Households |
| No Children | 6 (0.5%) | 119 (25.1%) |
| 1 or 2 Children | 129 (17.0%) | 347 (41.4%) |
| 3 or 4 Children | 5 (8.3%) | 121 (90.3%) |
| 5 or more Children | 0 (0.0%) | 0 (0.0%) |
| Total | 140 (7.1%) | 587 (40.6%) |
Race in South Charleston
The most populous races in South Charleston are White / Caucasian (11,216 | 82.9%), Black / African American (1,187 | 8.8%), and Two or more Races (765 | 5.7%).
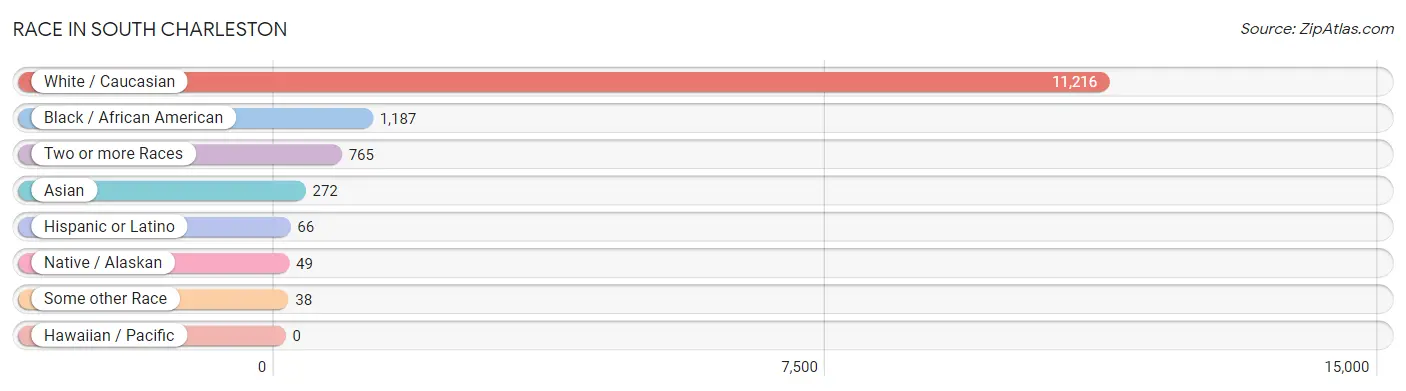
| Race | # Population | % Population |
| Asian | 272 | 2.0% |
| Black / African American | 1,187 | 8.8% |
| Hawaiian / Pacific | 0 | 0.0% |
| Hispanic or Latino | 66 | 0.5% |
| Native / Alaskan | 49 | 0.4% |
| White / Caucasian | 11,216 | 82.9% |
| Two or more Races | 765 | 5.7% |
| Some other Race | 38 | 0.3% |
| Total | 13,527 | 100.0% |
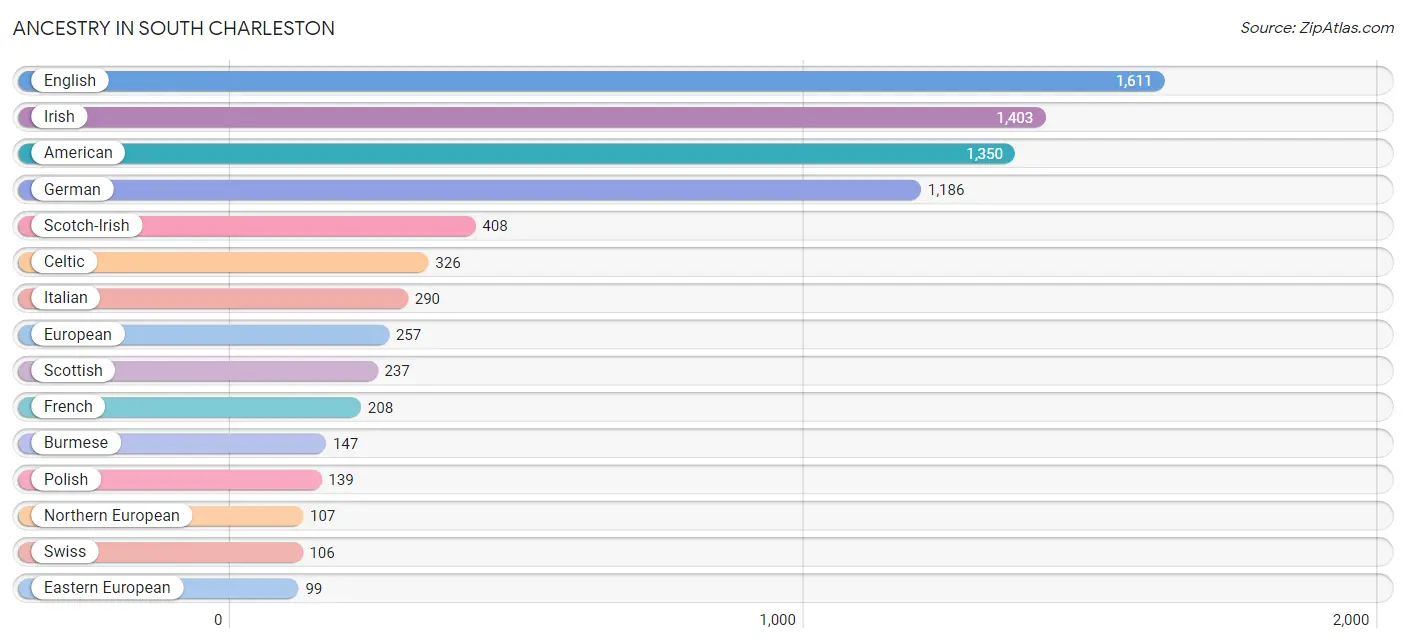
Ancestry in South Charleston
The most populous ancestries reported in South Charleston are English (1,611 | 11.9%), Irish (1,403 | 10.4%), American (1,350 | 10.0%), German (1,186 | 8.8%), and Scotch-Irish (408 | 3.0%), together accounting for 44.1% of all South Charleston residents.
| Ancestry | # Population | % Population |
| African | 2 | 0.0% |
| American | 1,350 | 10.0% |
| Arab | 49 | 0.4% |
| Austrian | 22 | 0.2% |
| Belgian | 11 | 0.1% |
| Bhutanese | 4 | 0.0% |
| British | 26 | 0.2% |
| Burmese | 147 | 1.1% |
| Celtic | 326 | 2.4% |
| Cherokee | 54 | 0.4% |
| Czechoslovakian | 17 | 0.1% |
| Dutch | 88 | 0.6% |
| Dutch West Indian | 12 | 0.1% |
| Eastern European | 99 | 0.7% |
| English | 1,611 | 11.9% |
| European | 257 | 1.9% |
| Finnish | 11 | 0.1% |
| French | 208 | 1.5% |
| German | 1,186 | 8.8% |
| Ghanaian | 16 | 0.1% |
| Greek | 58 | 0.4% |
| Hungarian | 39 | 0.3% |
| Indian (Asian) | 9 | 0.1% |
| Indonesian | 22 | 0.2% |
| Irish | 1,403 | 10.4% |
| Italian | 290 | 2.1% |
| Lebanese | 10 | 0.1% |
| Mexican | 60 | 0.4% |
| Northern European | 107 | 0.8% |
| Norwegian | 30 | 0.2% |
| Pennsylvania German | 9 | 0.1% |
| Polish | 139 | 1.0% |
| Romanian | 9 | 0.1% |
| Scandinavian | 28 | 0.2% |
| Scotch-Irish | 408 | 3.0% |
| Scottish | 237 | 1.8% |
| Slovak | 81 | 0.6% |
| Sri Lankan | 12 | 0.1% |
| Subsaharan African | 18 | 0.1% |
| Swiss | 106 | 0.8% |
| Thai | 84 | 0.6% |
| Turkish | 32 | 0.2% |
| Welsh | 75 | 0.5% | View All 43 Rows |
Immigrants in South Charleston
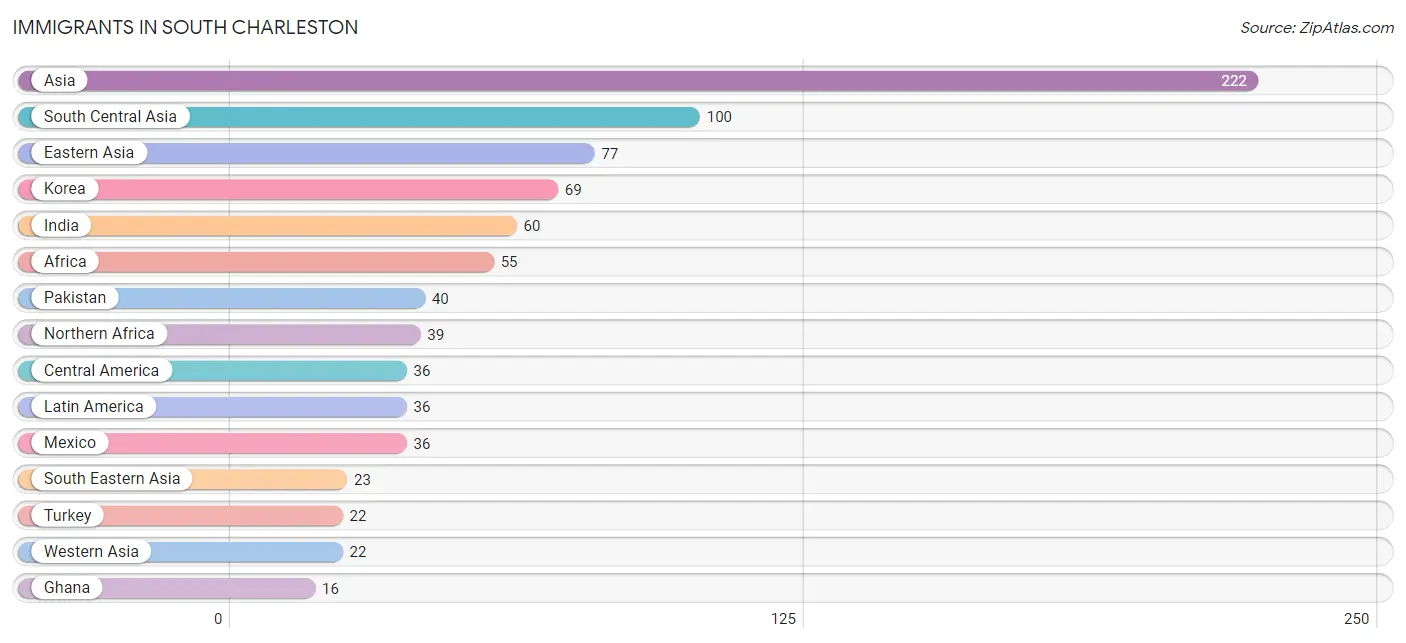
The most numerous immigrant groups reported in South Charleston came from Asia (222 | 1.6%), South Central Asia (100 | 0.7%), Eastern Asia (77 | 0.6%), Korea (69 | 0.5%), and India (60 | 0.4%), together accounting for 3.9% of all South Charleston residents.
| Immigration Origin | # Population | % Population |
| Africa | 55 | 0.4% |
| Asia | 222 | 1.6% |
| Central America | 36 | 0.3% |
| China | 4 | 0.0% |
| Eastern Asia | 77 | 0.6% |
| Ghana | 16 | 0.1% |
| India | 60 | 0.4% |
| Japan | 4 | 0.0% |
| Korea | 69 | 0.5% |
| Latin America | 36 | 0.3% |
| Mexico | 36 | 0.3% |
| Northern Africa | 39 | 0.3% |
| Pakistan | 40 | 0.3% |
| South Central Asia | 100 | 0.7% |
| South Eastern Asia | 23 | 0.2% |
| Turkey | 22 | 0.2% |
| Vietnam | 12 | 0.1% |
| Western Africa | 16 | 0.1% |
| Western Asia | 22 | 0.2% | View All 19 Rows |
Sex and Age in South Charleston
Sex and Age in South Charleston
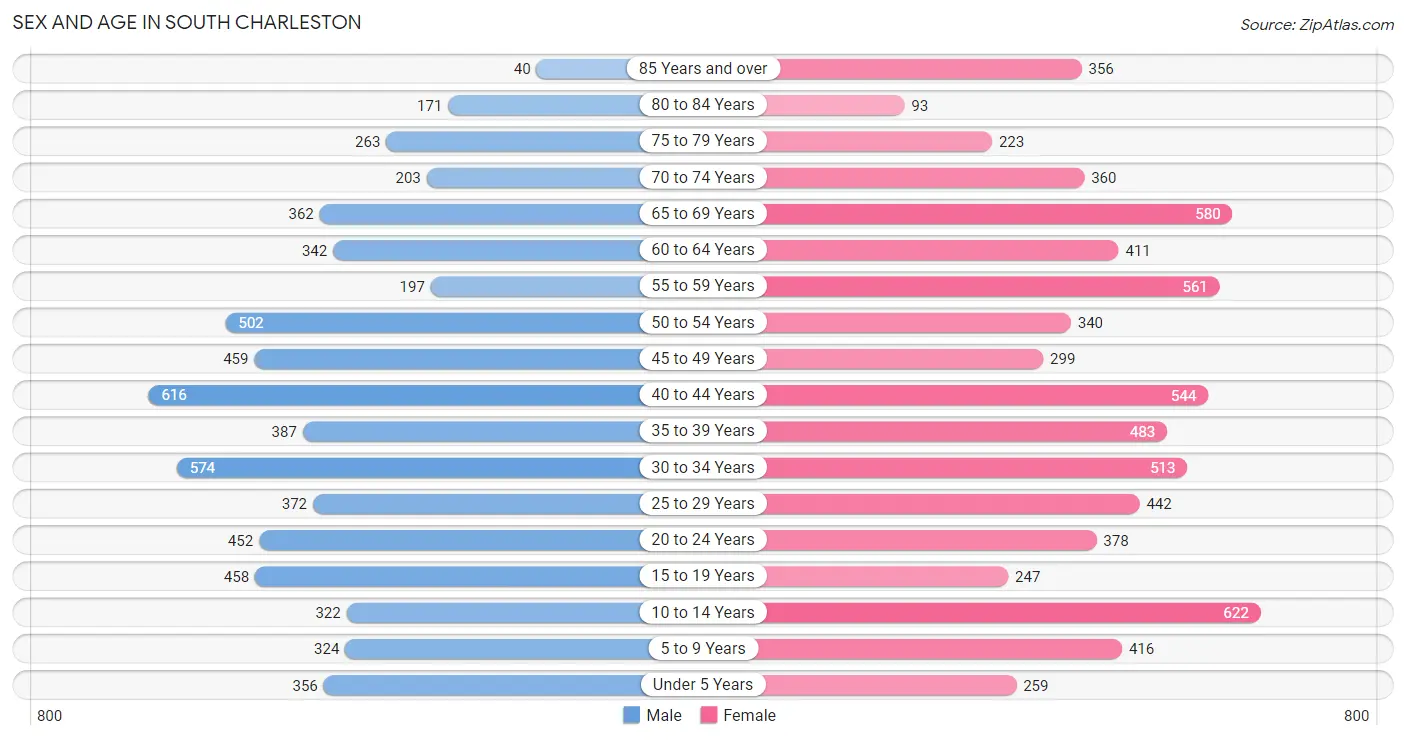
The most populous age groups in South Charleston are 40 to 44 Years (616 | 9.6%) for men and 10 to 14 Years (622 | 8.7%) for women.
| Age Bracket | Male | Female |
| Under 5 Years | 356 (5.6%) | 259 (3.6%) |
| 5 to 9 Years | 324 (5.1%) | 416 (5.8%) |
| 10 to 14 Years | 322 (5.0%) | 622 (8.7%) |
| 15 to 19 Years | 458 (7.2%) | 247 (3.5%) |
| 20 to 24 Years | 452 (7.1%) | 378 (5.3%) |
| 25 to 29 Years | 372 (5.8%) | 442 (6.2%) |
| 30 to 34 Years | 574 (9.0%) | 513 (7.2%) |
| 35 to 39 Years | 387 (6.0%) | 483 (6.8%) |
| 40 to 44 Years | 616 (9.6%) | 544 (7.6%) |
| 45 to 49 Years | 459 (7.2%) | 299 (4.2%) |
| 50 to 54 Years | 502 (7.8%) | 340 (4.8%) |
| 55 to 59 Years | 197 (3.1%) | 561 (7.9%) |
| 60 to 64 Years | 342 (5.3%) | 411 (5.8%) |
| 65 to 69 Years | 362 (5.7%) | 580 (8.1%) |
| 70 to 74 Years | 203 (3.2%) | 360 (5.1%) |
| 75 to 79 Years | 263 (4.1%) | 223 (3.1%) |
| 80 to 84 Years | 171 (2.7%) | 93 (1.3%) |
| 85 Years and over | 40 (0.6%) | 356 (5.0%) |
| Total | 6,400 (100.0%) | 7,127 (100.0%) |
Families and Households in South Charleston
Median Family Size in South Charleston
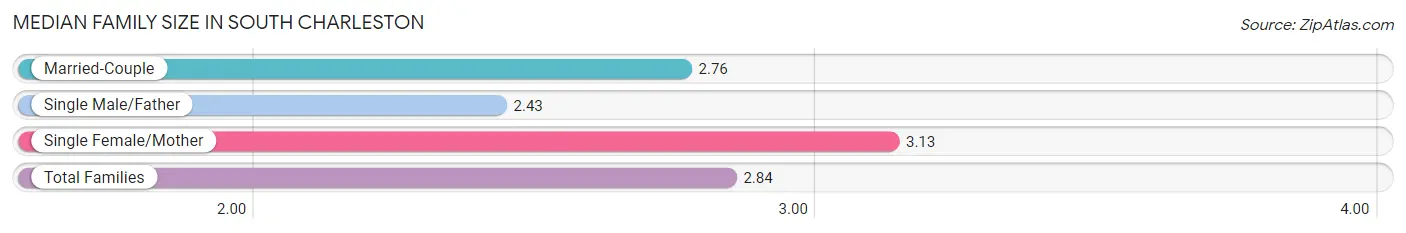
The median family size in South Charleston is 2.84 persons per family, with single female/mother families (1,069 | 31.3%) accounting for the largest median family size of 3.13 persons per family. On the other hand, single male/father families (378 | 11.1%) represent the smallest median family size with 2.43 persons per family.
| Family Type | # Families | Family Size |
| Married-Couple | 1,970 (57.7%) | 2.76 |
| Single Male/Father | 378 (11.1%) | 2.43 |
| Single Female/Mother | 1,069 (31.3%) | 3.13 |
| Total Families | 3,417 (100.0%) | 2.84 |
Median Household Size in South Charleston
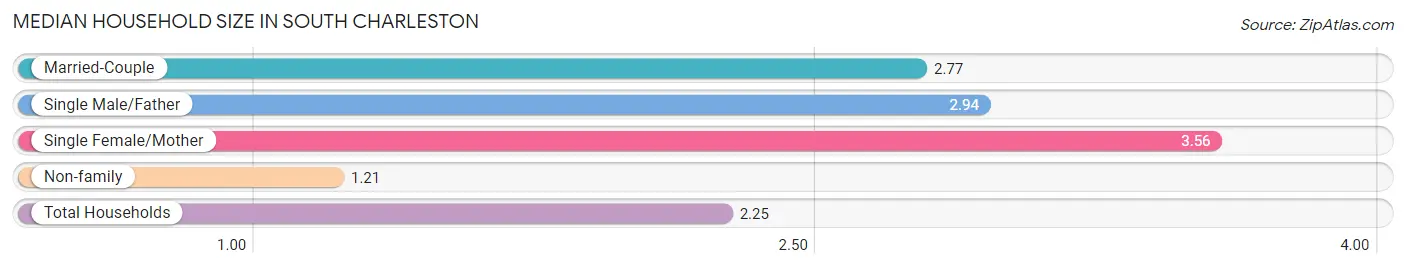
The median household size in South Charleston is 2.25 persons per household, with single female/mother households (1,069 | 17.8%) accounting for the largest median household size of 3.56 persons per household. non-family households (2,601 | 43.2%) represent the smallest median household size with 1.21 persons per household.
| Household Type | # Households | Household Size |
| Married-Couple | 1,970 (32.7%) | 2.77 |
| Single Male/Father | 378 (6.3%) | 2.94 |
| Single Female/Mother | 1,069 (17.8%) | 3.56 |
| Non-family | 2,601 (43.2%) | 1.21 |
| Total Households | 6,018 (100.0%) | 2.25 |
Household Size by Marriage Status in South Charleston
Out of a total of 6,018 households in South Charleston, 3,417 (56.8%) are family households, while 2,601 (43.2%) are nonfamily households. The most numerous type of family households are 2-person households, comprising 1,563, and the most common type of nonfamily households are 1-person households, comprising 2,194.
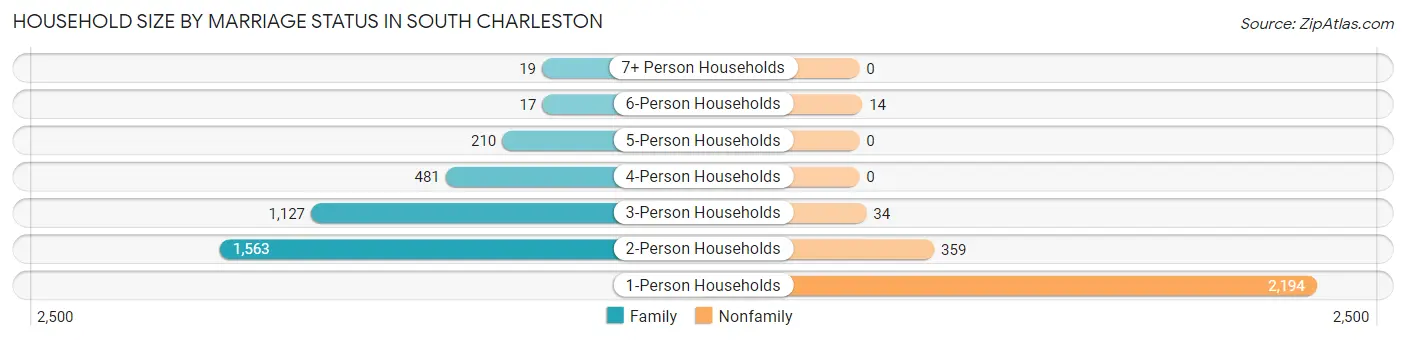
| Household Size | Family Households | Nonfamily Households |
| 1-Person Households | - | 2,194 (36.5%) |
| 2-Person Households | 1,563 (26.0%) | 359 (6.0%) |
| 3-Person Households | 1,127 (18.7%) | 34 (0.6%) |
| 4-Person Households | 481 (8.0%) | 0 (0.0%) |
| 5-Person Households | 210 (3.5%) | 0 (0.0%) |
| 6-Person Households | 17 (0.3%) | 14 (0.2%) |
| 7+ Person Households | 19 (0.3%) | 0 (0.0%) |
| Total | 3,417 (56.8%) | 2,601 (43.2%) |
Female Fertility in South Charleston
Fertility by Age in South Charleston
Average fertility rate in South Charleston is 69.0 births per 1,000 women. Women in the age bracket of 20 to 34 years have the highest fertility rate with 136.0 births per 1,000 women. Women in the age bracket of 20 to 34 years acount for 87.4% of all women with births.
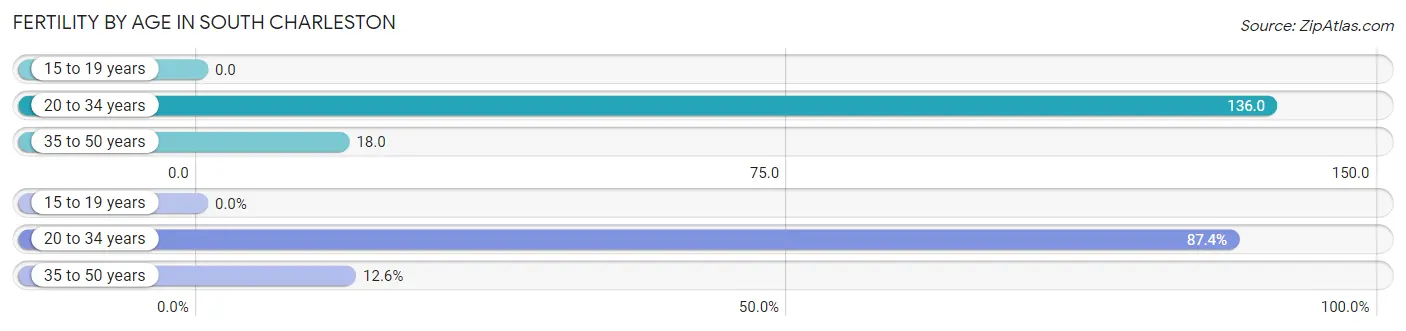
| Age Bracket | Women with Births | Births / 1,000 Women |
| 15 to 19 years | 0 (0.0%) | 0.0 |
| 20 to 34 years | 181 (87.4%) | 136.0 |
| 35 to 50 years | 26 (12.6%) | 18.0 |
| Total | 207 (100.0%) | 69.0 |
Fertility by Age by Marriage Status in South Charleston
39.6% of women with births (207) in South Charleston are married. The highest percentage of unmarried women with births falls into 35 to 50 years age bracket with 100.0% of them unmarried at the time of birth, while the lowest percentage of unmarried women with births belong to 20 to 34 years age bracket with 54.7% of them unmarried.
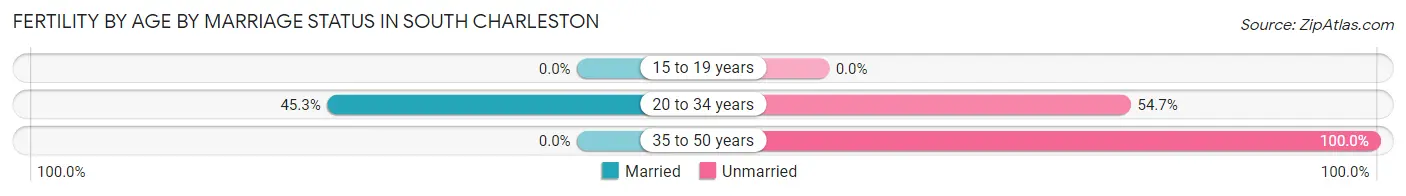
| Age Bracket | Married | Unmarried |
| 15 to 19 years | 0 (0.0%) | 0 (0.0%) |
| 20 to 34 years | 82 (45.3%) | 99 (54.7%) |
| 35 to 50 years | 0 (0.0%) | 26 (100.0%) |
| Total | 82 (39.6%) | 125 (60.4%) |
Fertility by Education in South Charleston
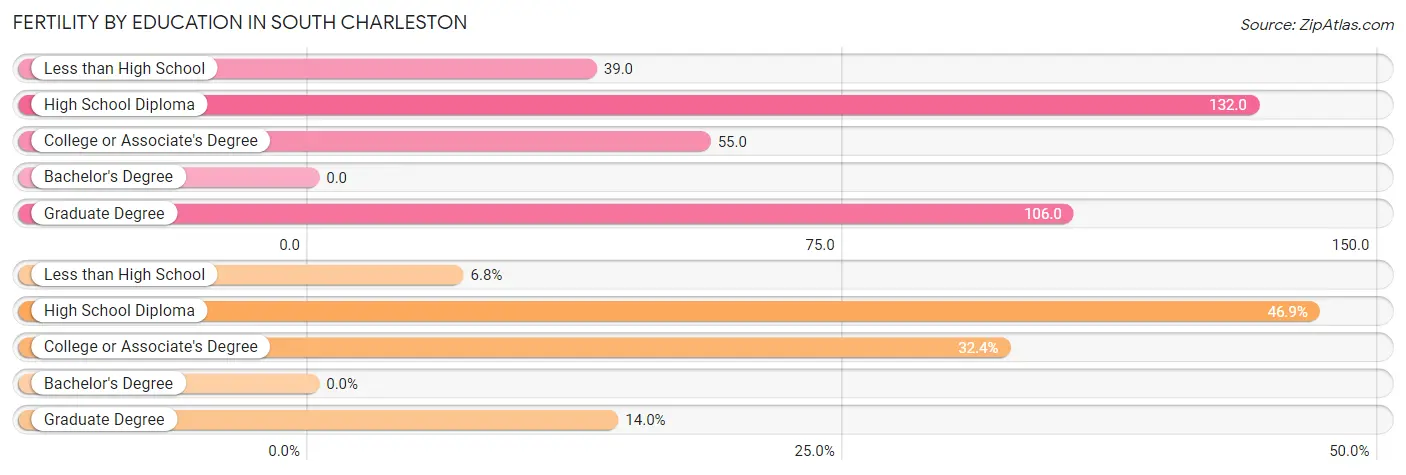
| Educational Attainment | Women with Births | Births / 1,000 Women |
| Less than High School | 14 (6.8%) | 39.0 |
| High School Diploma | 97 (46.9%) | 132.0 |
| College or Associate's Degree | 67 (32.4%) | 55.0 |
| Bachelor's Degree | 0 (0.0%) | 0.0 |
| Graduate Degree | 29 (14.0%) | 106.0 |
| Total | 207 (100.0%) | 69.0 |
Fertility by Education by Marriage Status in South Charleston
60.4% of women with births in South Charleston are unmarried. Women with the educational attainment of high school diploma are most likely to be married with 73.2% of them married at childbirth, while women with the educational attainment of less than high school are least likely to be married with 100.0% of them unmarried at childbirth.
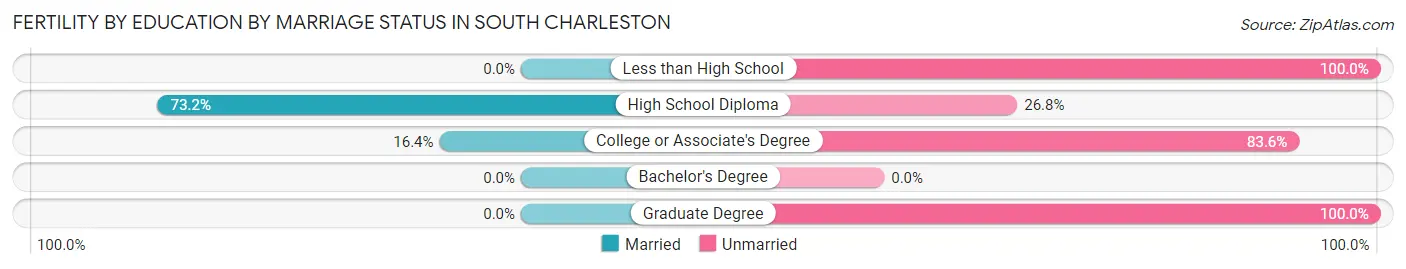
| Educational Attainment | Married | Unmarried |
| Less than High School | 0 (0.0%) | 14 (100.0%) |
| High School Diploma | 71 (73.2%) | 26 (26.8%) |
| College or Associate's Degree | 11 (16.4%) | 56 (83.6%) |
| Bachelor's Degree | 0 (0.0%) | 0 (0.0%) |
| Graduate Degree | 0 (0.0%) | 29 (100.0%) |
| Total | 82 (39.6%) | 125 (60.4%) |
Employment Characteristics in South Charleston
Employment by Class of Employer in South Charleston
Among the 6,256 employed individuals in South Charleston, private company employees (4,036 | 64.5%), state government employees (757 | 12.1%), and not-for-profit organizations (535 | 8.6%) make up the most common classes of employment.
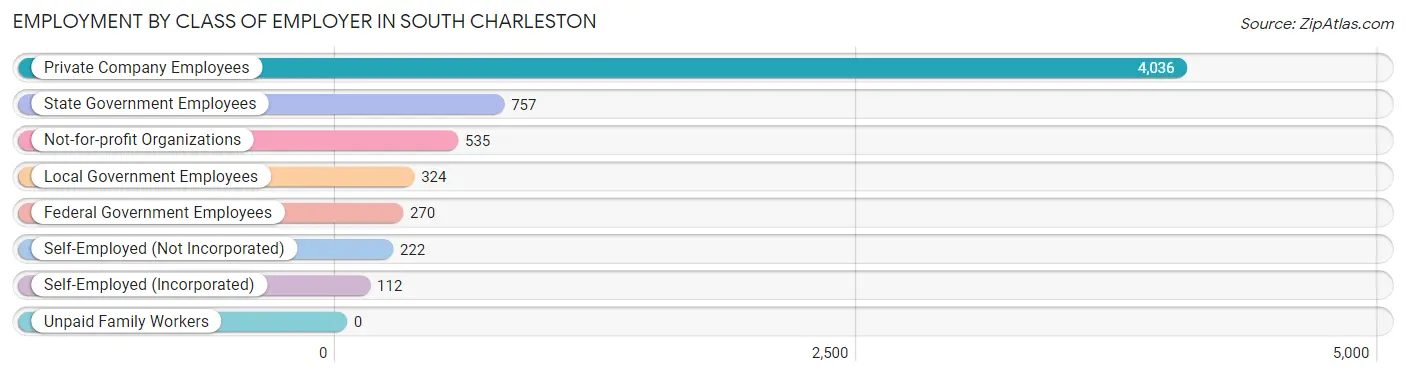
| Employer Class | # Employees | % Employees |
| Private Company Employees | 4,036 | 64.5% |
| Self-Employed (Incorporated) | 112 | 1.8% |
| Self-Employed (Not Incorporated) | 222 | 3.5% |
| Not-for-profit Organizations | 535 | 8.6% |
| Local Government Employees | 324 | 5.2% |
| State Government Employees | 757 | 12.1% |
| Federal Government Employees | 270 | 4.3% |
| Unpaid Family Workers | 0 | 0.0% |
| Total | 6,256 | 100.0% |
Employment Status by Age in South Charleston
According to the labor force statistics for South Charleston, out of the total population over 16 years of age (11,024), 62.2% or 6,857 individuals are in the labor force, with 6.9% or 473 of them unemployed. The age group with the highest labor force participation rate is 30 to 34 years, with 92.2% or 1,002 individuals in the labor force. Within the labor force, the 20 to 24 years age range has the highest percentage of unemployed individuals, with 24.6% or 169 of them being unemployed.
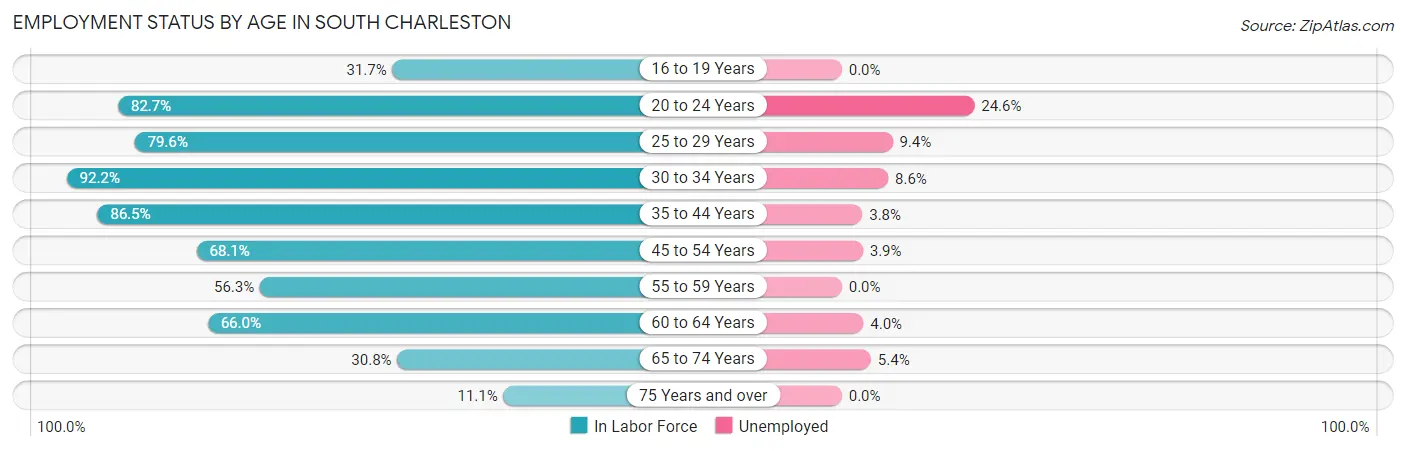
| Age Bracket | In Labor Force | Unemployed |
| 16 to 19 Years | 159 (31.7%) | 0 (0.0%) |
| 20 to 24 Years | 686 (82.7%) | 169 (24.6%) |
| 25 to 29 Years | 648 (79.6%) | 61 (9.4%) |
| 30 to 34 Years | 1,002 (92.2%) | 86 (8.6%) |
| 35 to 44 Years | 1,756 (86.5%) | 67 (3.8%) |
| 45 to 54 Years | 1,090 (68.1%) | 43 (3.9%) |
| 55 to 59 Years | 427 (56.3%) | 0 (0.0%) |
| 60 to 64 Years | 497 (66.0%) | 20 (4.0%) |
| 65 to 74 Years | 464 (30.8%) | 25 (5.4%) |
| 75 Years and over | 127 (11.1%) | 0 (0.0%) |
| Total | 6,857 (62.2%) | 473 (6.9%) |
Employment Status by Educational Attainment in South Charleston
According to labor force statistics for South Charleston, 76.9% of individuals (5,415) out of the total population between 25 and 64 years of age (7,042) are in the labor force, with 5.1% or 276 of them being unemployed. The group with the highest labor force participation rate are those with the educational attainment of bachelor's degree or higher, with 89.7% or 1,914 individuals in the labor force. Within the labor force, individuals with less than high school education have the highest percentage of unemployment, with 50.2% or 114 of them being unemployed.
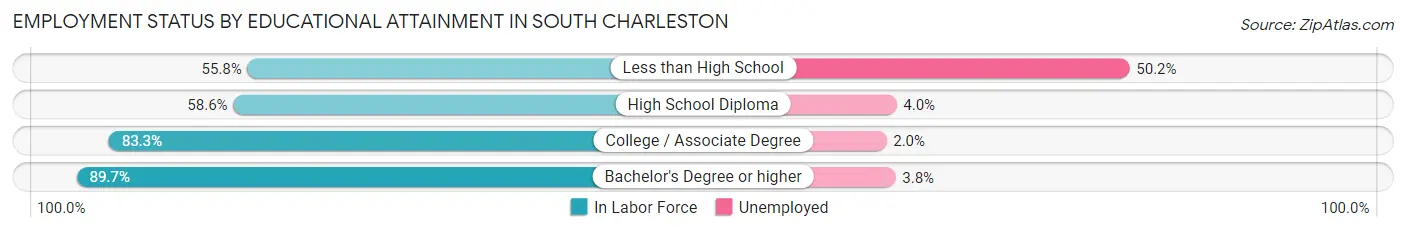
| Educational Attainment | In Labor Force | Unemployed |
| Less than High School | 227 (55.8%) | 204 (50.2%) |
| High School Diploma | 1,122 (58.6%) | 77 (4.0%) |
| College / Associate Degree | 2,154 (83.3%) | 52 (2.0%) |
| Bachelor's Degree or higher | 1,914 (89.7%) | 81 (3.8%) |
| Total | 5,415 (76.9%) | 359 (5.1%) |
Employment Occupations by Sex in South Charleston
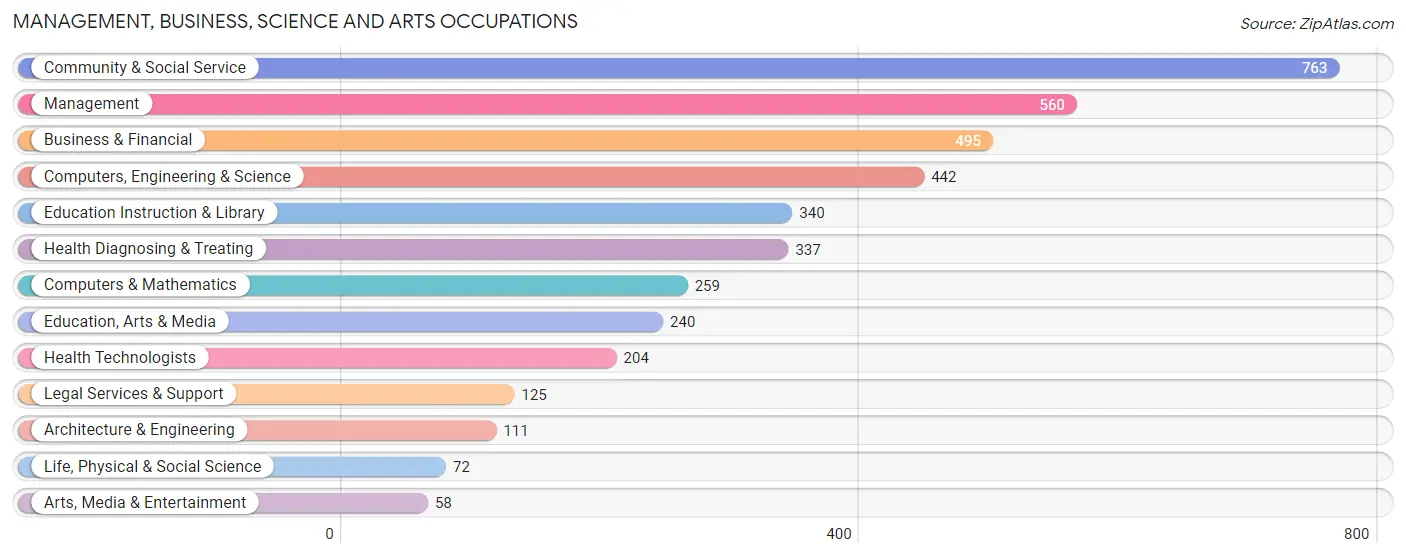
Management, Business, Science and Arts Occupations
The most common Management, Business, Science and Arts occupations in South Charleston are Community & Social Service (763 | 12.0%), Management (560 | 8.8%), Business & Financial (495 | 7.8%), Computers, Engineering & Science (442 | 7.0%), and Education Instruction & Library (340 | 5.3%).
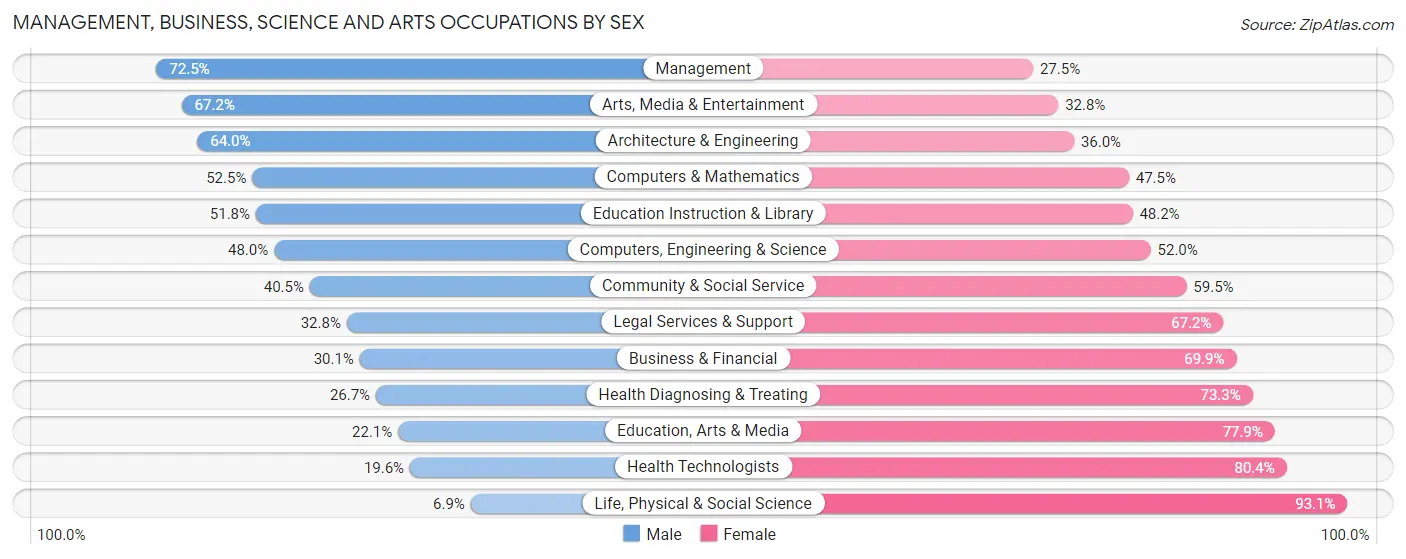
Management, Business, Science and Arts Occupations by Sex
Within the Management, Business, Science and Arts occupations in South Charleston, the most male-oriented occupations are Management (72.5%), Arts, Media & Entertainment (67.2%), and Architecture & Engineering (64.0%), while the most female-oriented occupations are Life, Physical & Social Science (93.1%), Health Technologists (80.4%), and Education, Arts & Media (77.9%).
| Occupation | Male | Female |
| Management | 406 (72.5%) | 154 (27.5%) |
| Business & Financial | 149 (30.1%) | 346 (69.9%) |
| Computers, Engineering & Science | 212 (48.0%) | 230 (52.0%) |
| Computers & Mathematics | 136 (52.5%) | 123 (47.5%) |
| Architecture & Engineering | 71 (64.0%) | 40 (36.0%) |
| Life, Physical & Social Science | 5 (6.9%) | 67 (93.1%) |
| Community & Social Service | 309 (40.5%) | 454 (59.5%) |
| Education, Arts & Media | 53 (22.1%) | 187 (77.9%) |
| Legal Services & Support | 41 (32.8%) | 84 (67.2%) |
| Education Instruction & Library | 176 (51.8%) | 164 (48.2%) |
| Arts, Media & Entertainment | 39 (67.2%) | 19 (32.8%) |
| Health Diagnosing & Treating | 90 (26.7%) | 247 (73.3%) |
| Health Technologists | 40 (19.6%) | 164 (80.4%) |
| Total (Category) | 1,166 (44.9%) | 1,431 (55.1%) |
| Total (Overall) | 3,353 (52.8%) | 3,002 (47.2%) |
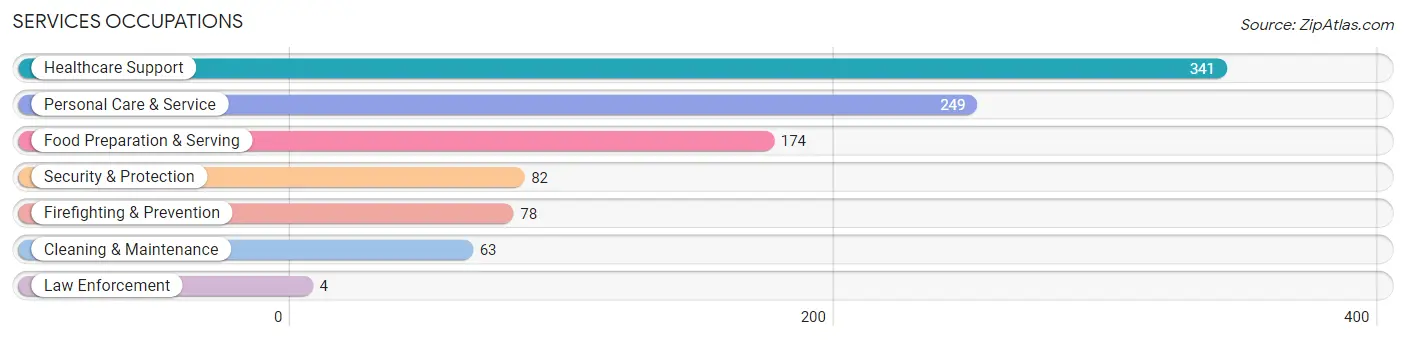
Services Occupations
The most common Services occupations in South Charleston are Healthcare Support (341 | 5.4%), Personal Care & Service (249 | 3.9%), Food Preparation & Serving (174 | 2.7%), Security & Protection (82 | 1.3%), and Firefighting & Prevention (78 | 1.2%).
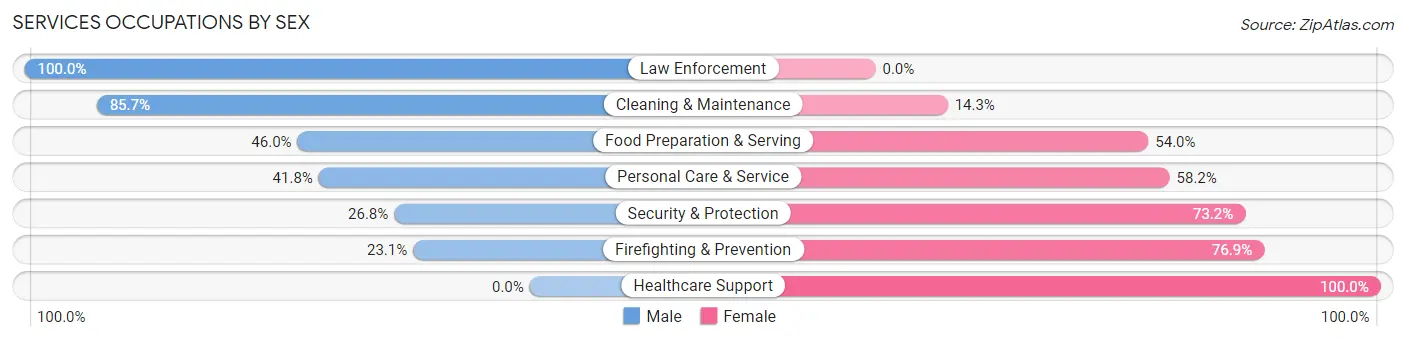
Services Occupations by Sex
Within the Services occupations in South Charleston, the most male-oriented occupations are Law Enforcement (100.0%), Cleaning & Maintenance (85.7%), and Food Preparation & Serving (46.0%), while the most female-oriented occupations are Healthcare Support (100.0%), Firefighting & Prevention (76.9%), and Security & Protection (73.2%).
| Occupation | Male | Female |
| Healthcare Support | 0 (0.0%) | 341 (100.0%) |
| Security & Protection | 22 (26.8%) | 60 (73.2%) |
| Firefighting & Prevention | 18 (23.1%) | 60 (76.9%) |
| Law Enforcement | 4 (100.0%) | 0 (0.0%) |
| Food Preparation & Serving | 80 (46.0%) | 94 (54.0%) |
| Cleaning & Maintenance | 54 (85.7%) | 9 (14.3%) |
| Personal Care & Service | 104 (41.8%) | 145 (58.2%) |
| Total (Category) | 260 (28.6%) | 649 (71.4%) |
| Total (Overall) | 3,353 (52.8%) | 3,002 (47.2%) |
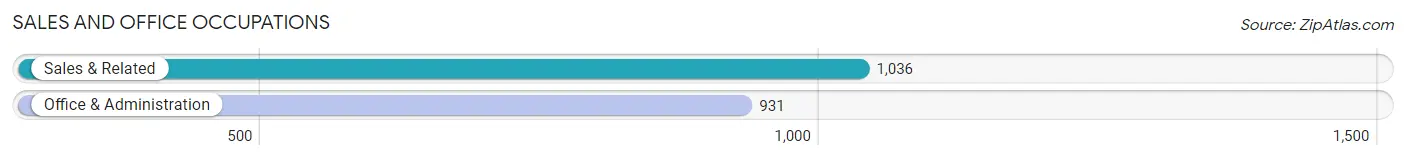
Sales and Office Occupations
The most common Sales and Office occupations in South Charleston are Sales & Related (1,036 | 16.3%), and Office & Administration (931 | 14.6%).
Sales and Office Occupations by Sex
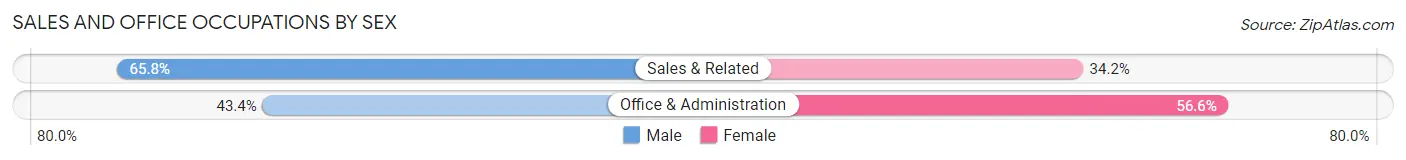
| Occupation | Male | Female |
| Sales & Related | 682 (65.8%) | 354 (34.2%) |
| Office & Administration | 404 (43.4%) | 527 (56.6%) |
| Total (Category) | 1,086 (55.2%) | 881 (44.8%) |
| Total (Overall) | 3,353 (52.8%) | 3,002 (47.2%) |
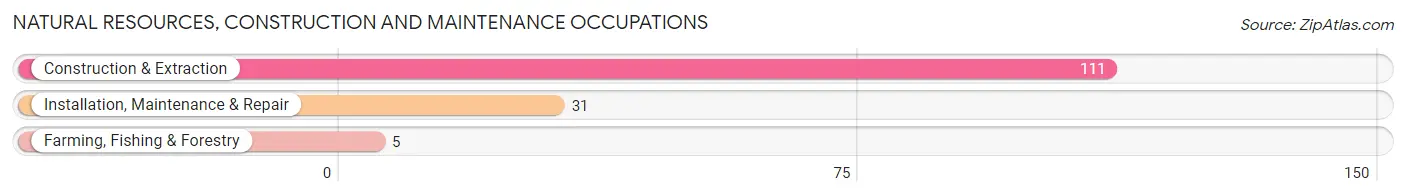
Natural Resources, Construction and Maintenance Occupations
The most common Natural Resources, Construction and Maintenance occupations in South Charleston are Construction & Extraction (111 | 1.8%), Installation, Maintenance & Repair (31 | 0.5%), and Farming, Fishing & Forestry (5 | 0.1%).
Natural Resources, Construction and Maintenance Occupations by Sex
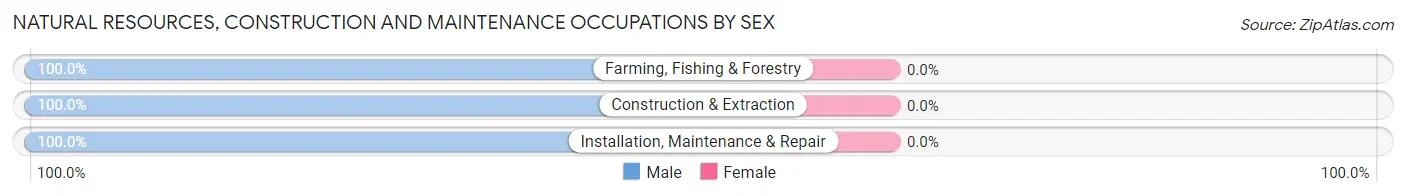
| Occupation | Male | Female |
| Farming, Fishing & Forestry | 5 (100.0%) | 0 (0.0%) |
| Construction & Extraction | 111 (100.0%) | 0 (0.0%) |
| Installation, Maintenance & Repair | 31 (100.0%) | 0 (0.0%) |
| Total (Category) | 147 (100.0%) | 0 (0.0%) |
| Total (Overall) | 3,353 (52.8%) | 3,002 (47.2%) |
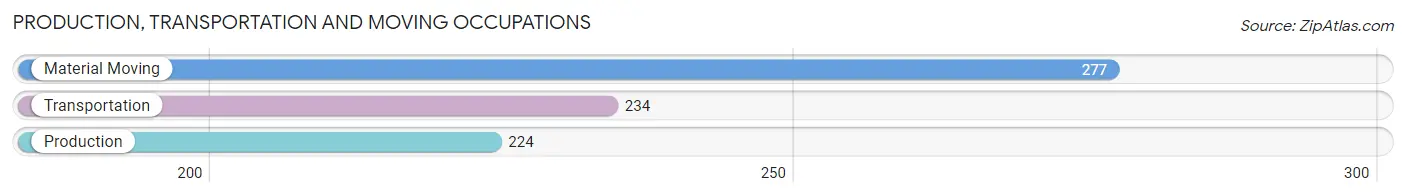
Production, Transportation and Moving Occupations
The most common Production, Transportation and Moving occupations in South Charleston are Material Moving (277 | 4.4%), Transportation (234 | 3.7%), and Production (224 | 3.5%).
Production, Transportation and Moving Occupations by Sex
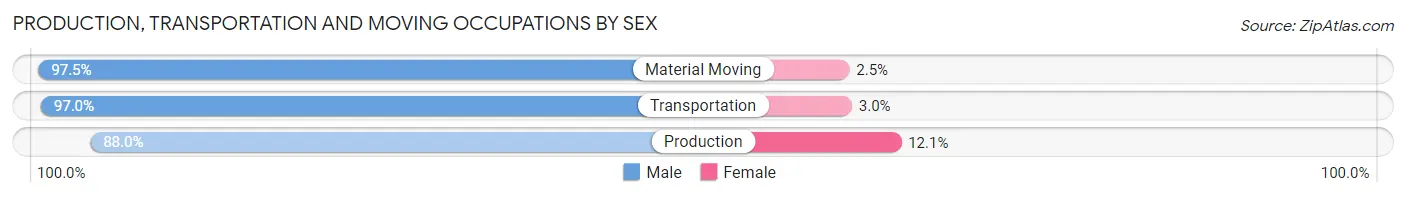
| Occupation | Male | Female |
| Production | 197 (87.9%) | 27 (12.0%) |
| Transportation | 227 (97.0%) | 7 (3.0%) |
| Material Moving | 270 (97.5%) | 7 (2.5%) |
| Total (Category) | 694 (94.4%) | 41 (5.6%) |
| Total (Overall) | 3,353 (52.8%) | 3,002 (47.2%) |
Employment Industries by Sex in South Charleston
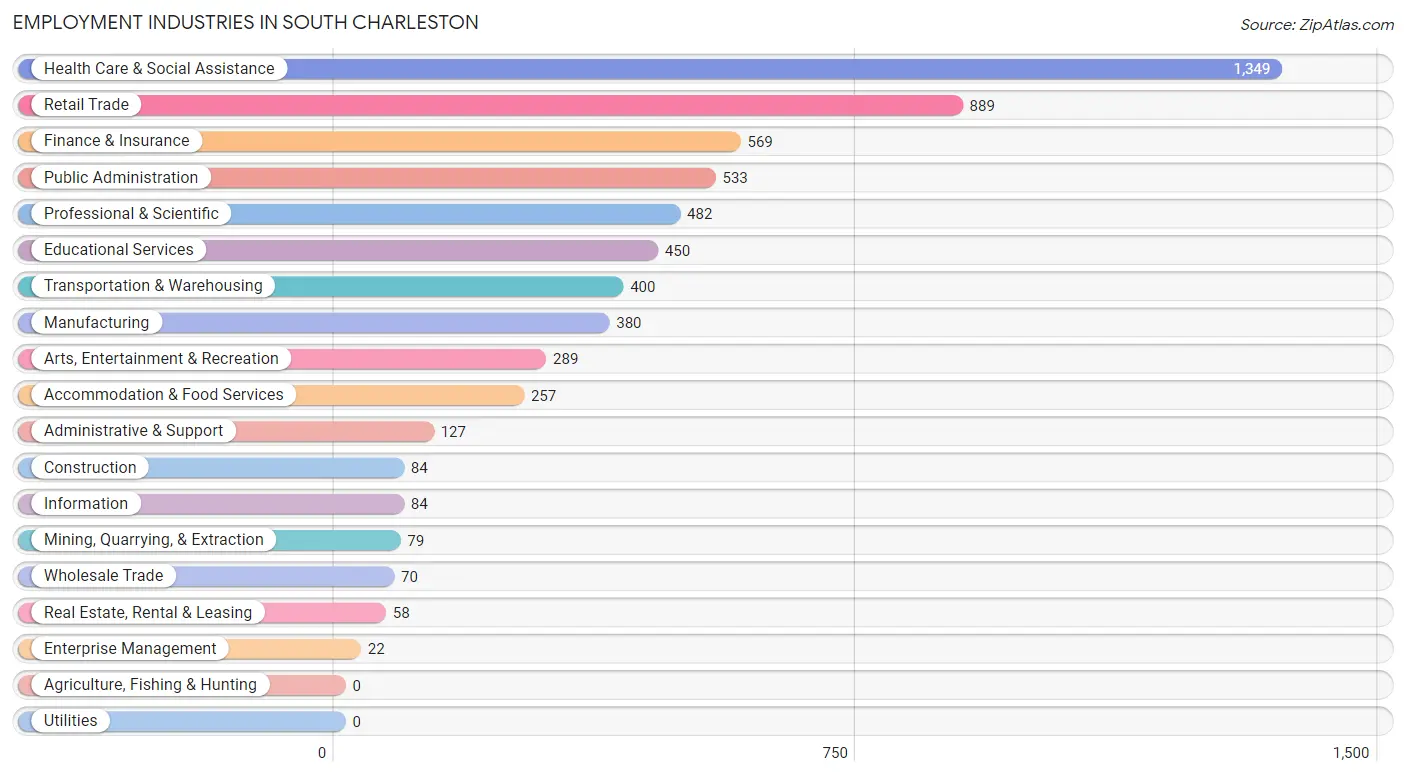
Employment Industries in South Charleston
The major employment industries in South Charleston include Health Care & Social Assistance (1,349 | 21.2%), Retail Trade (889 | 14.0%), Finance & Insurance (569 | 8.9%), Public Administration (533 | 8.4%), and Professional & Scientific (482 | 7.6%).
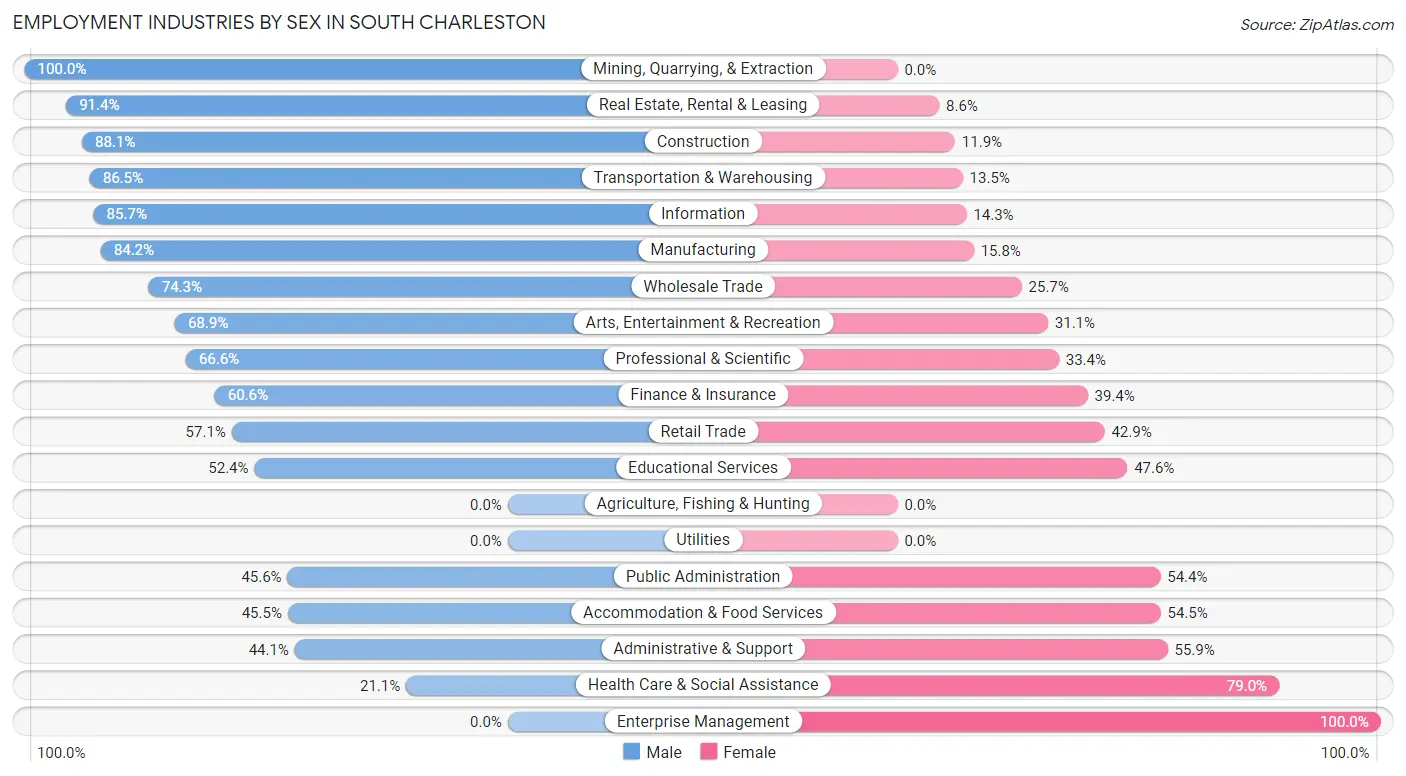
Employment Industries by Sex in South Charleston
The South Charleston industries that see more men than women are Mining, Quarrying, & Extraction (100.0%), Real Estate, Rental & Leasing (91.4%), and Construction (88.1%), whereas the industries that tend to have a higher number of women are Enterprise Management (100.0%), Health Care & Social Assistance (78.9%), and Administrative & Support (55.9%).
| Industry | Male | Female |
| Agriculture, Fishing & Hunting | 0 (0.0%) | 0 (0.0%) |
| Mining, Quarrying, & Extraction | 79 (100.0%) | 0 (0.0%) |
| Construction | 74 (88.1%) | 10 (11.9%) |
| Manufacturing | 320 (84.2%) | 60 (15.8%) |
| Wholesale Trade | 52 (74.3%) | 18 (25.7%) |
| Retail Trade | 508 (57.1%) | 381 (42.9%) |
| Transportation & Warehousing | 346 (86.5%) | 54 (13.5%) |
| Utilities | 0 (0.0%) | 0 (0.0%) |
| Information | 72 (85.7%) | 12 (14.3%) |
| Finance & Insurance | 345 (60.6%) | 224 (39.4%) |
| Real Estate, Rental & Leasing | 53 (91.4%) | 5 (8.6%) |
| Professional & Scientific | 321 (66.6%) | 161 (33.4%) |
| Enterprise Management | 0 (0.0%) | 22 (100.0%) |
| Administrative & Support | 56 (44.1%) | 71 (55.9%) |
| Educational Services | 236 (52.4%) | 214 (47.6%) |
| Health Care & Social Assistance | 284 (21.0%) | 1,065 (78.9%) |
| Arts, Entertainment & Recreation | 199 (68.9%) | 90 (31.1%) |
| Accommodation & Food Services | 117 (45.5%) | 140 (54.5%) |
| Public Administration | 243 (45.6%) | 290 (54.4%) |
| Total | 3,353 (52.8%) | 3,002 (47.2%) |
Education in South Charleston
School Enrollment in South Charleston
The most common levels of schooling among the 2,742 students in South Charleston are middle school (865 | 31.6%), high school (689 | 25.1%), and elementary school (603 | 22.0%).
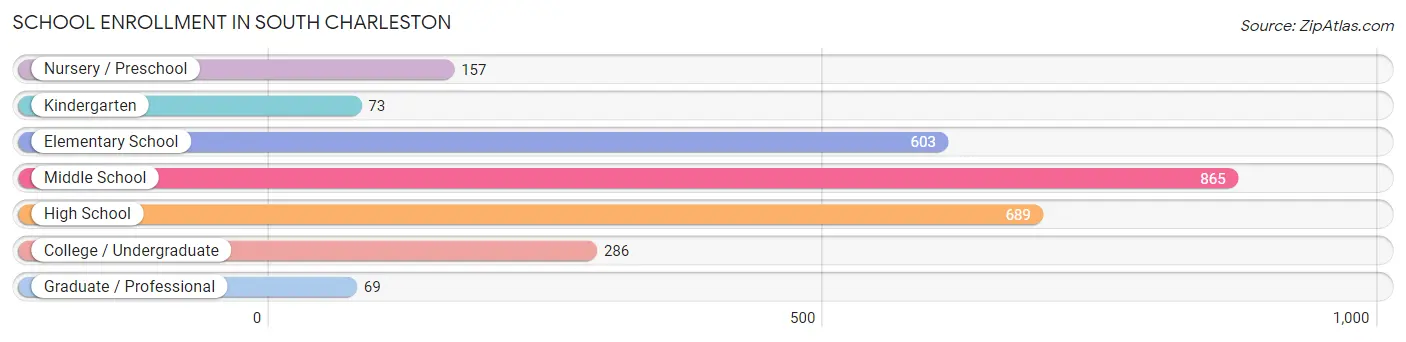
| School Level | # Students | % Students |
| Nursery / Preschool | 157 | 5.7% |
| Kindergarten | 73 | 2.7% |
| Elementary School | 603 | 22.0% |
| Middle School | 865 | 31.6% |
| High School | 689 | 25.1% |
| College / Undergraduate | 286 | 10.4% |
| Graduate / Professional | 69 | 2.5% |
| Total | 2,742 | 100.0% |
School Enrollment by Age by Funding Source in South Charleston
Out of a total of 2,742 students who are enrolled in schools in South Charleston, 277 (10.1%) attend a private institution, while the remaining 2,465 (89.9%) are enrolled in public schools. The age group of 3 to 4 year olds has the highest likelihood of being enrolled in private schools, with 30 (44.1% in the age bracket) enrolled. Conversely, the age group of 18 to 19 year olds has the lowest likelihood of being enrolled in a private school, with 96 (100.0% in the age bracket) attending a public institution.
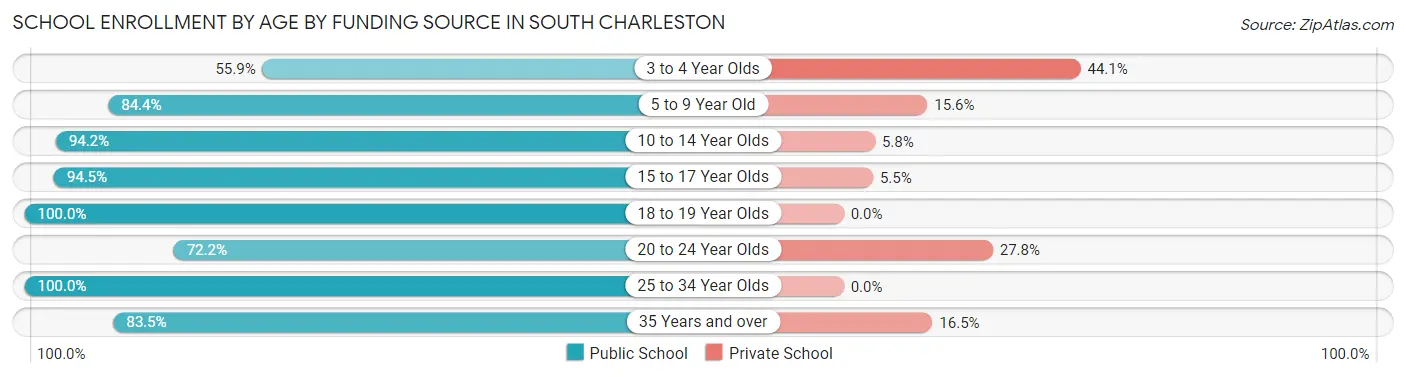
| Age Bracket | Public School | Private School |
| 3 to 4 Year Olds | 38 (55.9%) | 30 (44.1%) |
| 5 to 9 Year Old | 601 (84.4%) | 111 (15.6%) |
| 10 to 14 Year Olds | 889 (94.2%) | 55 (5.8%) |
| 15 to 17 Year Olds | 554 (94.5%) | 32 (5.5%) |
| 18 to 19 Year Olds | 96 (100.0%) | 0 (0.0%) |
| 20 to 24 Year Olds | 78 (72.2%) | 30 (27.8%) |
| 25 to 34 Year Olds | 107 (100.0%) | 0 (0.0%) |
| 35 Years and over | 101 (83.5%) | 20 (16.5%) |
| Total | 2,465 (89.9%) | 277 (10.1%) |
Educational Attainment by Field of Study in South Charleston
Business (788 | 25.0%), education (593 | 18.8%), science & technology (301 | 9.6%), social sciences (219 | 7.0%), and psychology (212 | 6.7%) are the most common fields of study among 3,153 individuals in South Charleston who have obtained a bachelor's degree or higher.
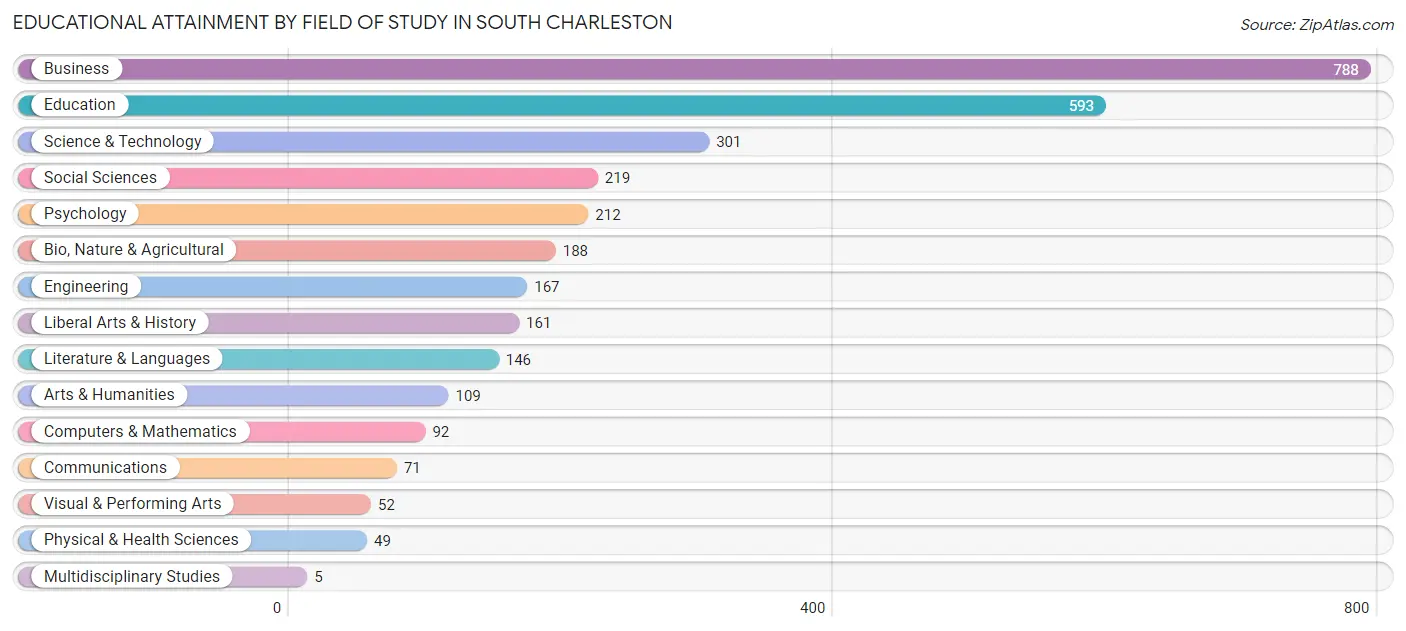
| Field of Study | # Graduates | % Graduates |
| Computers & Mathematics | 92 | 2.9% |
| Bio, Nature & Agricultural | 188 | 6.0% |
| Physical & Health Sciences | 49 | 1.5% |
| Psychology | 212 | 6.7% |
| Social Sciences | 219 | 7.0% |
| Engineering | 167 | 5.3% |
| Multidisciplinary Studies | 5 | 0.2% |
| Science & Technology | 301 | 9.6% |
| Business | 788 | 25.0% |
| Education | 593 | 18.8% |
| Literature & Languages | 146 | 4.6% |
| Liberal Arts & History | 161 | 5.1% |
| Visual & Performing Arts | 52 | 1.7% |
| Communications | 71 | 2.2% |
| Arts & Humanities | 109 | 3.5% |
| Total | 3,153 | 100.0% |
Transportation & Commute in South Charleston
Vehicle Availability by Sex in South Charleston
The most prevalent vehicle ownership categories in South Charleston are males with 2 vehicles (2,001, accounting for 59.6%) and females with 2 vehicles (1,285, making up 69.1%).
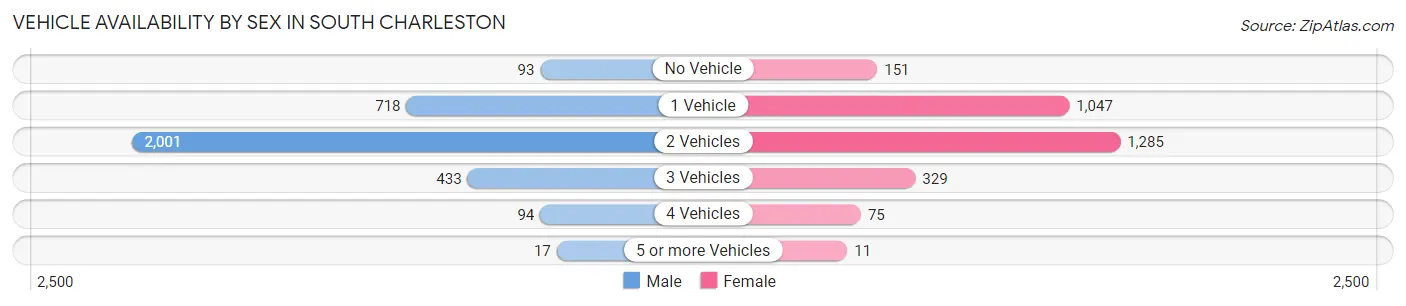
| Vehicles Available | Male | Female |
| No Vehicle | 93 (2.8%) | 151 (5.2%) |
| 1 Vehicle | 718 (21.4%) | 1,047 (36.1%) |
| 2 Vehicles | 2,001 (59.6%) | 1,285 (44.3%) |
| 3 Vehicles | 433 (12.9%) | 329 (11.4%) |
| 4 Vehicles | 94 (2.8%) | 75 (2.6%) |
| 5 or more Vehicles | 17 (0.5%) | 11 (0.4%) |
| Total | 3,356 (100.0%) | 2,898 (100.0%) |
Commute Time in South Charleston
The most frequently occuring commute durations in South Charleston are 15 to 19 minutes (1,688 commuters, 28.6%), 10 to 14 minutes (1,195 commuters, 20.2%), and 20 to 24 minutes (973 commuters, 16.5%).
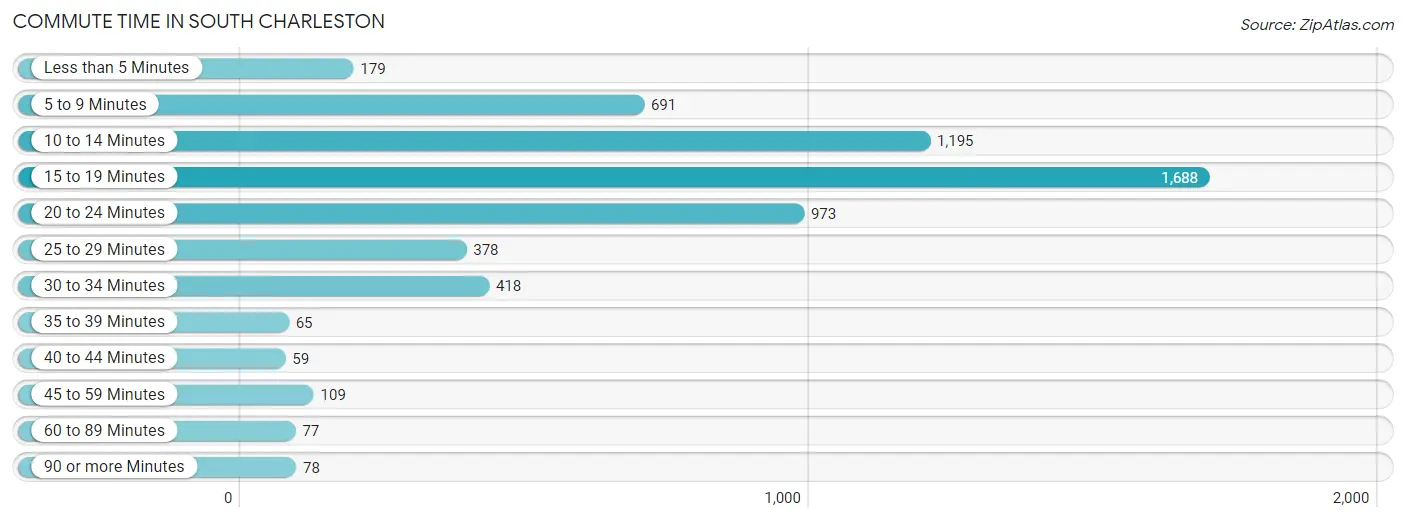
| Commute Time | # Commuters | % Commuters |
| Less than 5 Minutes | 179 | 3.0% |
| 5 to 9 Minutes | 691 | 11.7% |
| 10 to 14 Minutes | 1,195 | 20.2% |
| 15 to 19 Minutes | 1,688 | 28.6% |
| 20 to 24 Minutes | 973 | 16.5% |
| 25 to 29 Minutes | 378 | 6.4% |
| 30 to 34 Minutes | 418 | 7.1% |
| 35 to 39 Minutes | 65 | 1.1% |
| 40 to 44 Minutes | 59 | 1.0% |
| 45 to 59 Minutes | 109 | 1.8% |
| 60 to 89 Minutes | 77 | 1.3% |
| 90 or more Minutes | 78 | 1.3% |
Commute Time by Sex in South Charleston
The most common commute times in South Charleston are 15 to 19 minutes (1,062 commuters, 33.1%) for males and 15 to 19 minutes (626 commuters, 23.2%) for females.
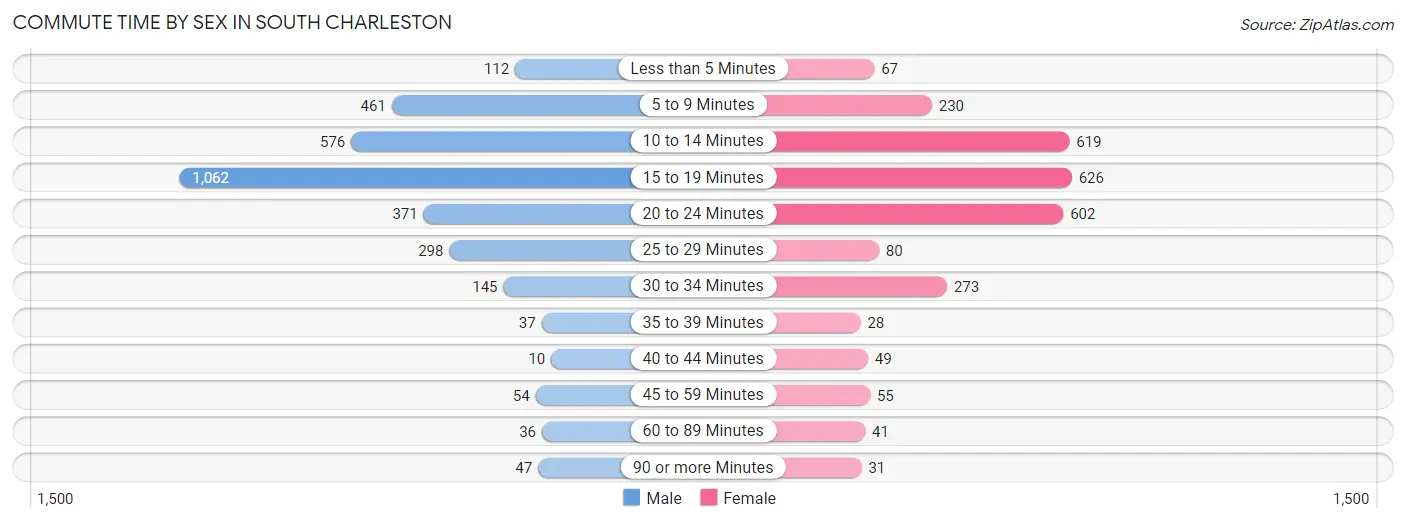
| Commute Time | Male | Female |
| Less than 5 Minutes | 112 (3.5%) | 67 (2.5%) |
| 5 to 9 Minutes | 461 (14.4%) | 230 (8.5%) |
| 10 to 14 Minutes | 576 (17.9%) | 619 (22.9%) |
| 15 to 19 Minutes | 1,062 (33.1%) | 626 (23.2%) |
| 20 to 24 Minutes | 371 (11.6%) | 602 (22.3%) |
| 25 to 29 Minutes | 298 (9.3%) | 80 (3.0%) |
| 30 to 34 Minutes | 145 (4.5%) | 273 (10.1%) |
| 35 to 39 Minutes | 37 (1.1%) | 28 (1.0%) |
| 40 to 44 Minutes | 10 (0.3%) | 49 (1.8%) |
| 45 to 59 Minutes | 54 (1.7%) | 55 (2.0%) |
| 60 to 89 Minutes | 36 (1.1%) | 41 (1.5%) |
| 90 or more Minutes | 47 (1.5%) | 31 (1.1%) |
Time of Departure to Work by Sex in South Charleston
The most frequent times of departure to work in South Charleston are 7:30 AM to 7:59 AM (715, 22.3%) for males and 7:30 AM to 7:59 AM (633, 23.4%) for females.
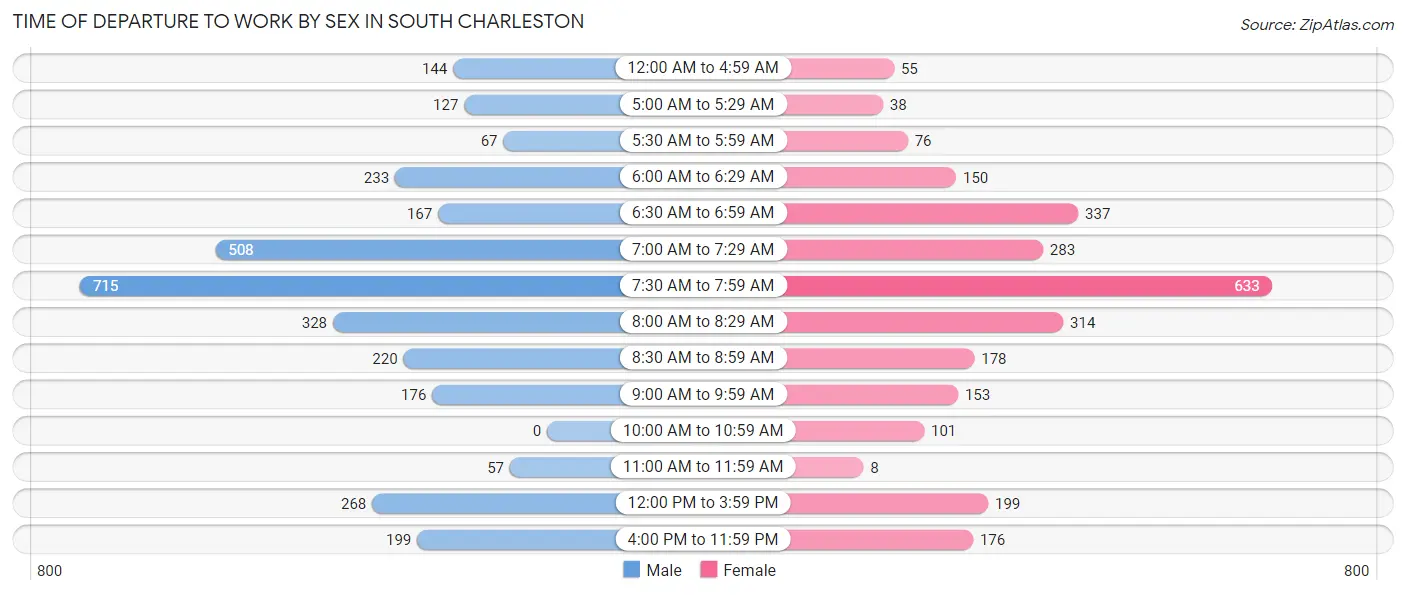
| Time of Departure | Male | Female |
| 12:00 AM to 4:59 AM | 144 (4.5%) | 55 (2.0%) |
| 5:00 AM to 5:29 AM | 127 (4.0%) | 38 (1.4%) |
| 5:30 AM to 5:59 AM | 67 (2.1%) | 76 (2.8%) |
| 6:00 AM to 6:29 AM | 233 (7.3%) | 150 (5.6%) |
| 6:30 AM to 6:59 AM | 167 (5.2%) | 337 (12.5%) |
| 7:00 AM to 7:29 AM | 508 (15.8%) | 283 (10.5%) |
| 7:30 AM to 7:59 AM | 715 (22.3%) | 633 (23.4%) |
| 8:00 AM to 8:29 AM | 328 (10.2%) | 314 (11.6%) |
| 8:30 AM to 8:59 AM | 220 (6.9%) | 178 (6.6%) |
| 9:00 AM to 9:59 AM | 176 (5.5%) | 153 (5.7%) |
| 10:00 AM to 10:59 AM | 0 (0.0%) | 101 (3.7%) |
| 11:00 AM to 11:59 AM | 57 (1.8%) | 8 (0.3%) |
| 12:00 PM to 3:59 PM | 268 (8.4%) | 199 (7.4%) |
| 4:00 PM to 11:59 PM | 199 (6.2%) | 176 (6.5%) |
| Total | 3,209 (100.0%) | 2,701 (100.0%) |
Housing Occupancy in South Charleston
Occupancy by Ownership in South Charleston
Of the total 6,018 dwellings in South Charleston, owner-occupied units account for 4,198 (69.8%), while renter-occupied units make up 1,820 (30.2%).
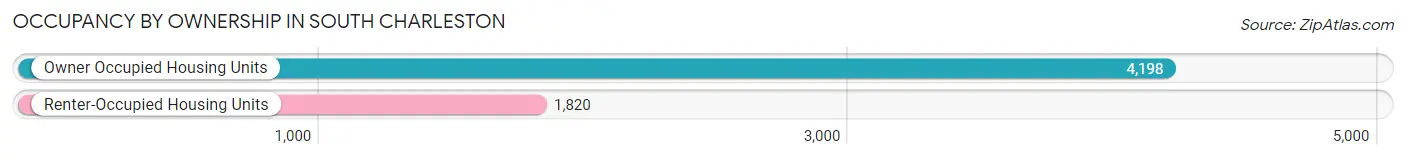
| Occupancy | # Housing Units | % Housing Units |
| Owner Occupied Housing Units | 4,198 | 69.8% |
| Renter-Occupied Housing Units | 1,820 | 30.2% |
| Total Occupied Housing Units | 6,018 | 100.0% |
Occupancy by Household Size in South Charleston
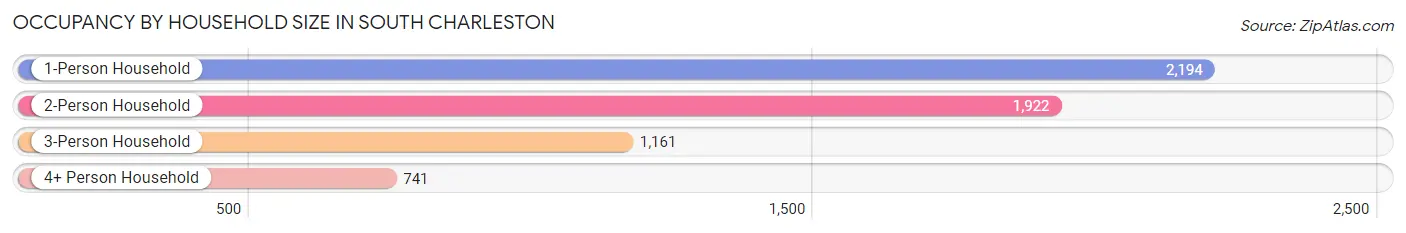
| Household Size | # Housing Units | % Housing Units |
| 1-Person Household | 2,194 | 36.5% |
| 2-Person Household | 1,922 | 31.9% |
| 3-Person Household | 1,161 | 19.3% |
| 4+ Person Household | 741 | 12.3% |
| Total Housing Units | 6,018 | 100.0% |
Occupancy by Ownership by Household Size in South Charleston
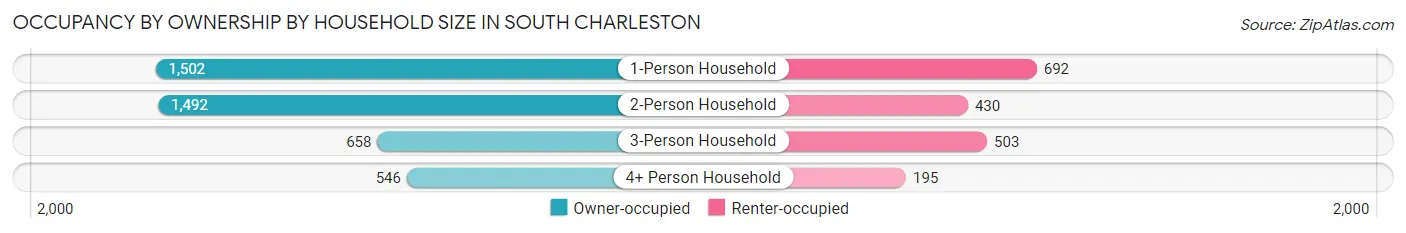
| Household Size | Owner-occupied | Renter-occupied |
| 1-Person Household | 1,502 (68.5%) | 692 (31.5%) |
| 2-Person Household | 1,492 (77.6%) | 430 (22.4%) |
| 3-Person Household | 658 (56.7%) | 503 (43.3%) |
| 4+ Person Household | 546 (73.7%) | 195 (26.3%) |
| Total Housing Units | 4,198 (69.8%) | 1,820 (30.2%) |
Occupancy by Educational Attainment in South Charleston
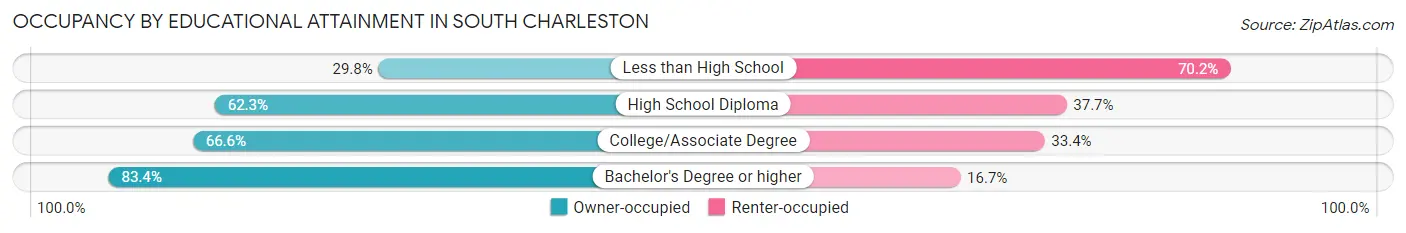
| Household Size | Owner-occupied | Renter-occupied |
| Less than High School | 68 (29.8%) | 160 (70.2%) |
| High School Diploma | 996 (62.3%) | 603 (37.7%) |
| College/Associate Degree | 1,432 (66.6%) | 717 (33.4%) |
| Bachelor's Degree or higher | 1,702 (83.4%) | 340 (16.7%) |
Occupancy by Age of Householder in South Charleston
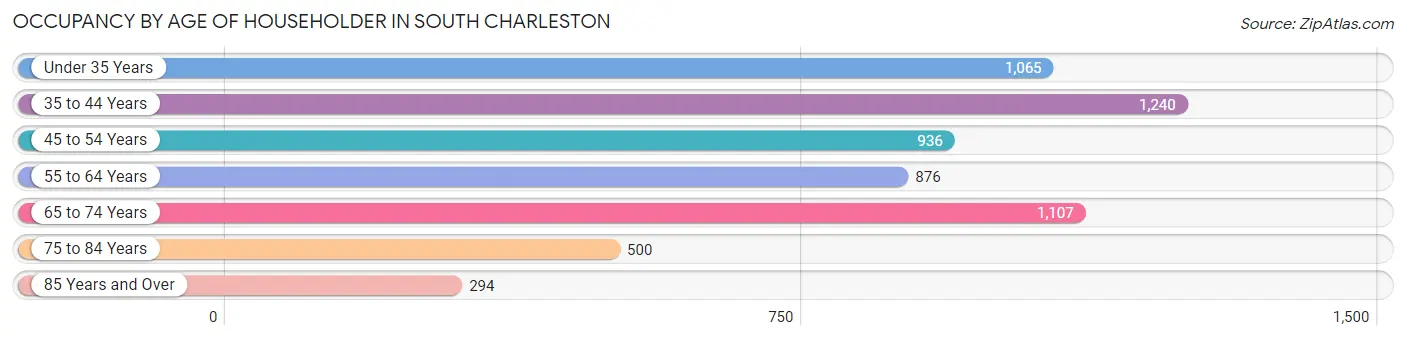
| Age Bracket | # Households | % Households |
| Under 35 Years | 1,065 | 17.7% |
| 35 to 44 Years | 1,240 | 20.6% |
| 45 to 54 Years | 936 | 15.5% |
| 55 to 64 Years | 876 | 14.6% |
| 65 to 74 Years | 1,107 | 18.4% |
| 75 to 84 Years | 500 | 8.3% |
| 85 Years and Over | 294 | 4.9% |
| Total | 6,018 | 100.0% |
Housing Finances in South Charleston
Median Income by Occupancy in South Charleston
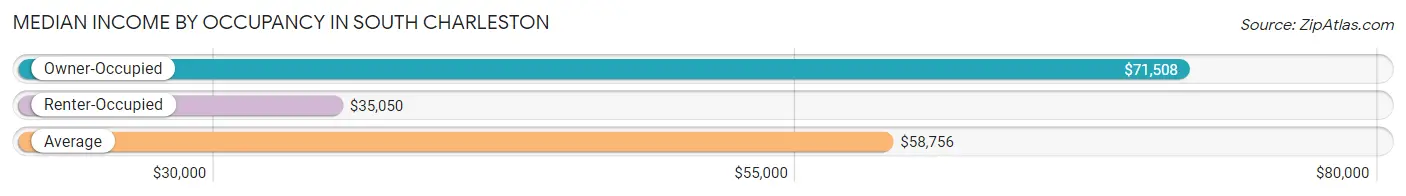
| Occupancy Type | # Households | Median Income |
| Owner-Occupied | 4,198 (69.8%) | $71,508 |
| Renter-Occupied | 1,820 (30.2%) | $35,050 |
| Average | 6,018 (100.0%) | $58,756 |
Occupancy by Householder Income Bracket in South Charleston
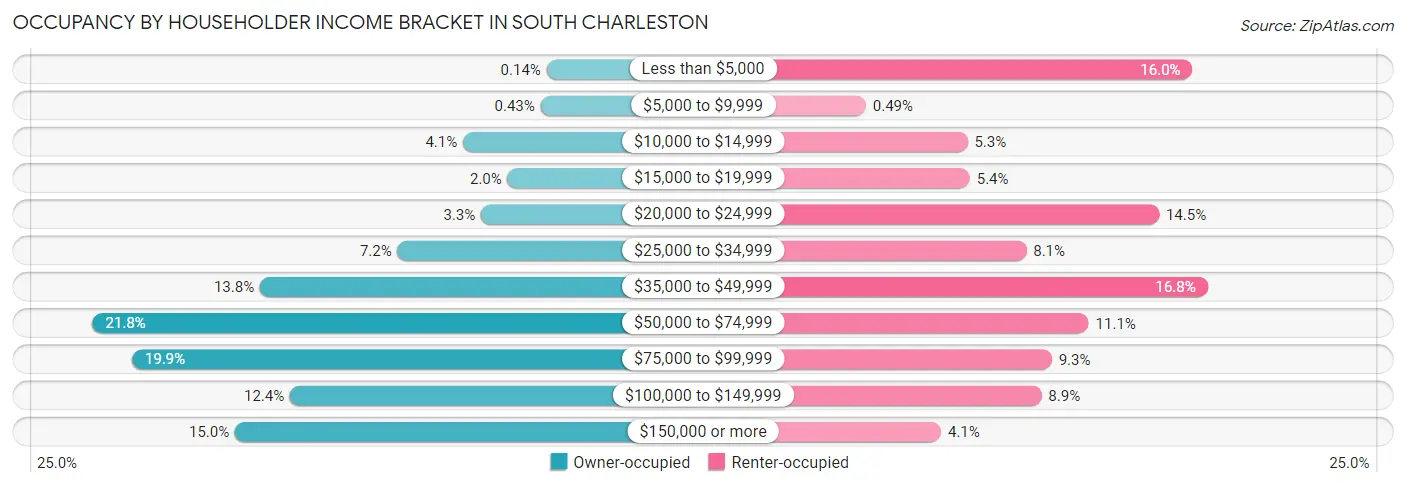
| Income Bracket | Owner-occupied | Renter-occupied |
| Less than $5,000 | 6 (0.1%) | 292 (16.0%) |
| $5,000 to $9,999 | 18 (0.4%) | 9 (0.5%) |
| $10,000 to $14,999 | 173 (4.1%) | 97 (5.3%) |
| $15,000 to $19,999 | 84 (2.0%) | 99 (5.4%) |
| $20,000 to $24,999 | 137 (3.3%) | 263 (14.4%) |
| $25,000 to $34,999 | 304 (7.2%) | 148 (8.1%) |
| $35,000 to $49,999 | 579 (13.8%) | 305 (16.8%) |
| $50,000 to $74,999 | 914 (21.8%) | 202 (11.1%) |
| $75,000 to $99,999 | 835 (19.9%) | 170 (9.3%) |
| $100,000 to $149,999 | 519 (12.4%) | 161 (8.8%) |
| $150,000 or more | 629 (15.0%) | 74 (4.1%) |
| Total | 4,198 (100.0%) | 1,820 (100.0%) |
Monthly Housing Cost Tiers in South Charleston
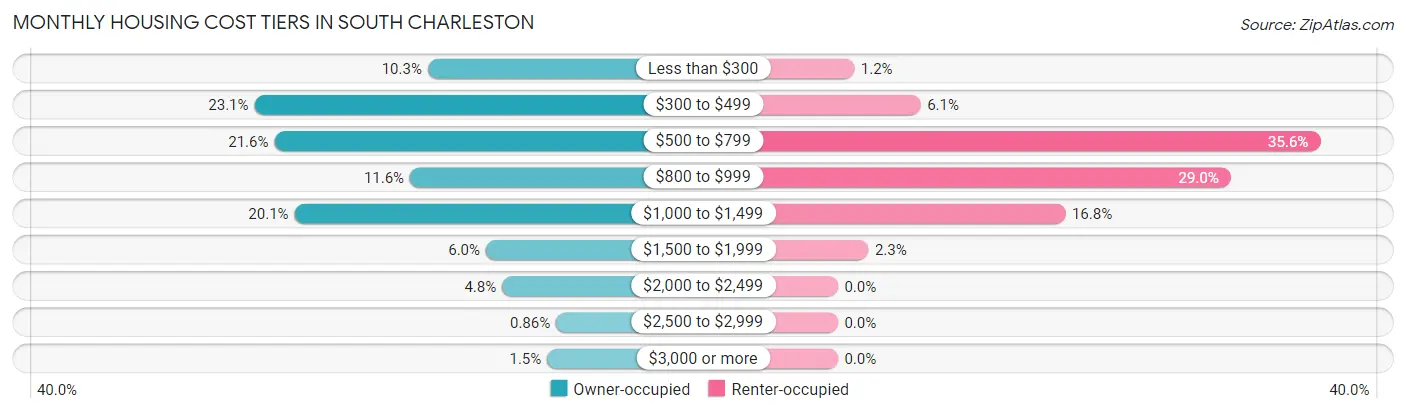
| Monthly Cost | Owner-occupied | Renter-occupied |
| Less than $300 | 433 (10.3%) | 22 (1.2%) |
| $300 to $499 | 969 (23.1%) | 111 (6.1%) |
| $500 to $799 | 907 (21.6%) | 647 (35.5%) |
| $800 to $999 | 488 (11.6%) | 527 (29.0%) |
| $1,000 to $1,499 | 845 (20.1%) | 305 (16.8%) |
| $1,500 to $1,999 | 253 (6.0%) | 41 (2.2%) |
| $2,000 to $2,499 | 203 (4.8%) | 0 (0.0%) |
| $2,500 to $2,999 | 36 (0.9%) | 0 (0.0%) |
| $3,000 or more | 64 (1.5%) | 0 (0.0%) |
| Total | 4,198 (100.0%) | 1,820 (100.0%) |
Physical Housing Characteristics in South Charleston
Housing Structures in South Charleston
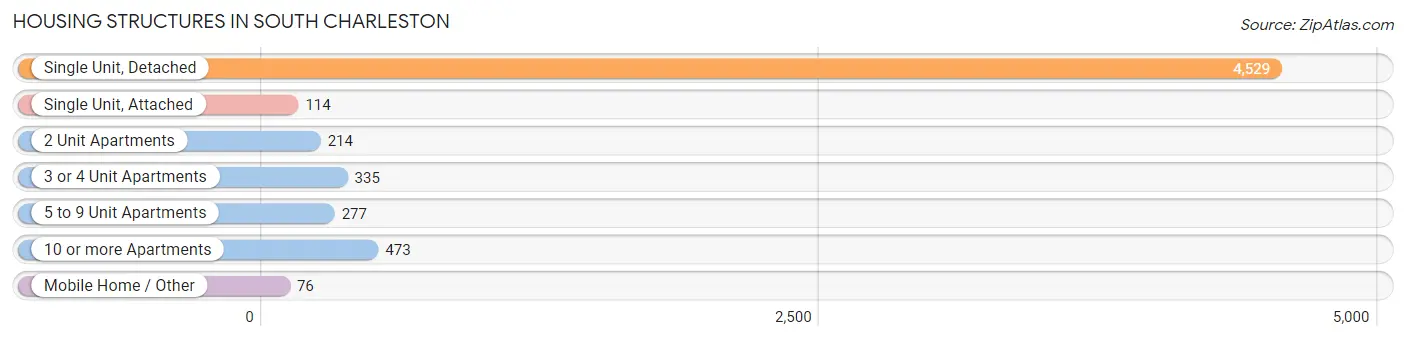
| Structure Type | # Housing Units | % Housing Units |
| Single Unit, Detached | 4,529 | 75.3% |
| Single Unit, Attached | 114 | 1.9% |
| 2 Unit Apartments | 214 | 3.6% |
| 3 or 4 Unit Apartments | 335 | 5.6% |
| 5 to 9 Unit Apartments | 277 | 4.6% |
| 10 or more Apartments | 473 | 7.9% |
| Mobile Home / Other | 76 | 1.3% |
| Total | 6,018 | 100.0% |
Housing Structures by Occupancy in South Charleston
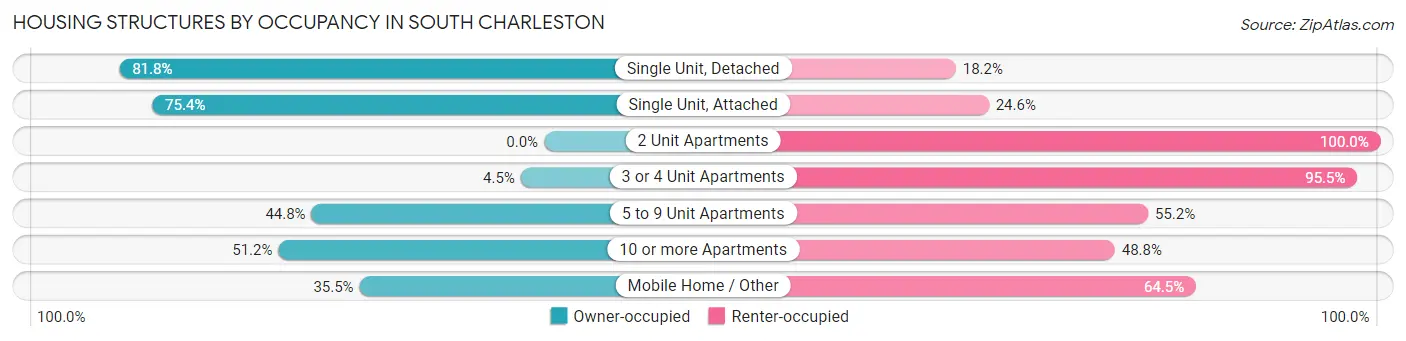
| Structure Type | Owner-occupied | Renter-occupied |
| Single Unit, Detached | 3,704 (81.8%) | 825 (18.2%) |
| Single Unit, Attached | 86 (75.4%) | 28 (24.6%) |
| 2 Unit Apartments | 0 (0.0%) | 214 (100.0%) |
| 3 or 4 Unit Apartments | 15 (4.5%) | 320 (95.5%) |
| 5 to 9 Unit Apartments | 124 (44.8%) | 153 (55.2%) |
| 10 or more Apartments | 242 (51.2%) | 231 (48.8%) |
| Mobile Home / Other | 27 (35.5%) | 49 (64.5%) |
| Total | 4,198 (69.8%) | 1,820 (30.2%) |
Housing Structures by Number of Rooms in South Charleston
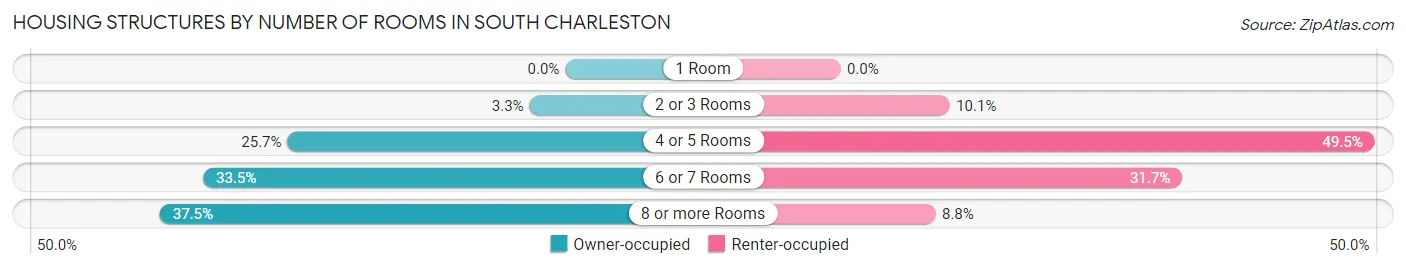
| Number of Rooms | Owner-occupied | Renter-occupied |
| 1 Room | 0 (0.0%) | 0 (0.0%) |
| 2 or 3 Rooms | 139 (3.3%) | 184 (10.1%) |
| 4 or 5 Rooms | 1,079 (25.7%) | 900 (49.4%) |
| 6 or 7 Rooms | 1,406 (33.5%) | 576 (31.7%) |
| 8 or more Rooms | 1,574 (37.5%) | 160 (8.8%) |
| Total | 4,198 (100.0%) | 1,820 (100.0%) |
Housing Structure by Heating Type in South Charleston
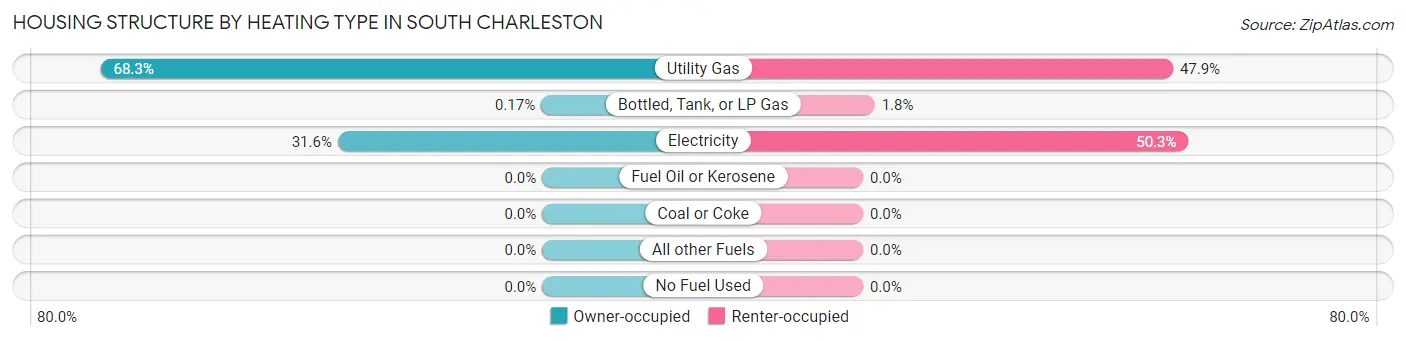
| Heating Type | Owner-occupied | Renter-occupied |
| Utility Gas | 2,865 (68.2%) | 872 (47.9%) |
| Bottled, Tank, or LP Gas | 7 (0.2%) | 33 (1.8%) |
| Electricity | 1,326 (31.6%) | 915 (50.3%) |
| Fuel Oil or Kerosene | 0 (0.0%) | 0 (0.0%) |
| Coal or Coke | 0 (0.0%) | 0 (0.0%) |
| All other Fuels | 0 (0.0%) | 0 (0.0%) |
| No Fuel Used | 0 (0.0%) | 0 (0.0%) |
| Total | 4,198 (100.0%) | 1,820 (100.0%) |
Household Vehicle Usage in South Charleston
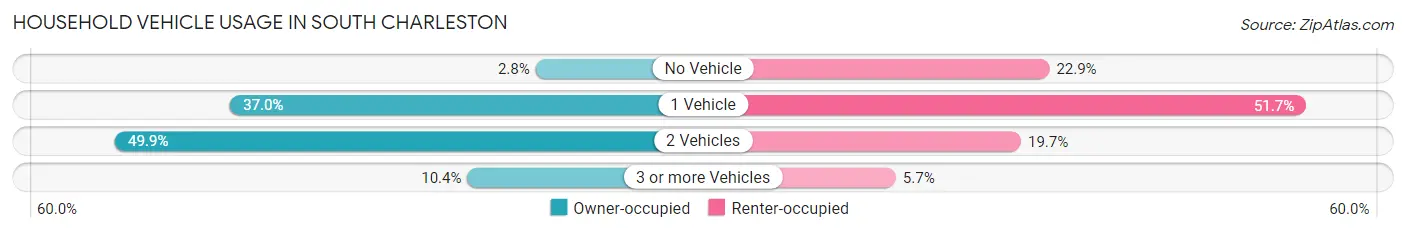
| Vehicles per Household | Owner-occupied | Renter-occupied |
| No Vehicle | 116 (2.8%) | 417 (22.9%) |
| 1 Vehicle | 1,552 (37.0%) | 940 (51.6%) |
| 2 Vehicles | 2,093 (49.9%) | 359 (19.7%) |
| 3 or more Vehicles | 437 (10.4%) | 104 (5.7%) |
| Total | 4,198 (100.0%) | 1,820 (100.0%) |
Real Estate & Mortgages in South Charleston
Real Estate and Mortgage Overview in South Charleston
| Characteristic | Without Mortgage | With Mortgage |
| Housing Units | 2,040 | 2,158 |
| Median Property Value | $125,100 | $158,200 |
| Median Household Income | $53,130 | $432 |
| Monthly Housing Costs | $423 | $64 |
| Real Estate Taxes | $1,056 | $15 |
Property Value by Mortgage Status in South Charleston
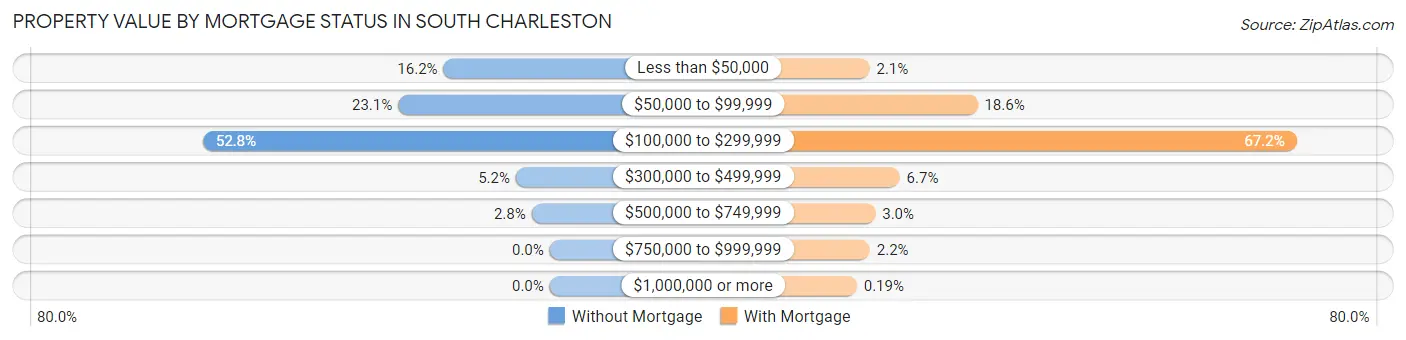
| Property Value | Without Mortgage | With Mortgage |
| Less than $50,000 | 330 (16.2%) | 46 (2.1%) |
| $50,000 to $99,999 | 471 (23.1%) | 401 (18.6%) |
| $100,000 to $299,999 | 1,078 (52.8%) | 1,450 (67.2%) |
| $300,000 to $499,999 | 105 (5.1%) | 145 (6.7%) |
| $500,000 to $749,999 | 56 (2.8%) | 65 (3.0%) |
| $750,000 to $999,999 | 0 (0.0%) | 47 (2.2%) |
| $1,000,000 or more | 0 (0.0%) | 4 (0.2%) |
| Total | 2,040 (100.0%) | 2,158 (100.0%) |
Household Income by Mortgage Status in South Charleston
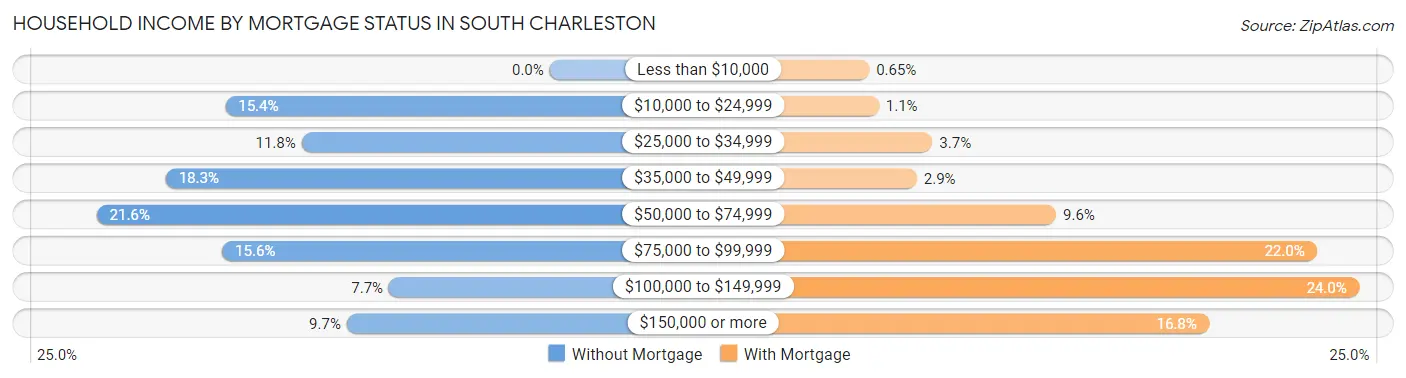
| Household Income | Without Mortgage | With Mortgage |
| Less than $10,000 | 0 (0.0%) | 14 (0.6%) |
| $10,000 to $24,999 | 315 (15.4%) | 24 (1.1%) |
| $25,000 to $34,999 | 241 (11.8%) | 79 (3.7%) |
| $35,000 to $49,999 | 373 (18.3%) | 63 (2.9%) |
| $50,000 to $74,999 | 440 (21.6%) | 206 (9.6%) |
| $75,000 to $99,999 | 318 (15.6%) | 474 (22.0%) |
| $100,000 to $149,999 | 156 (7.6%) | 517 (24.0%) |
| $150,000 or more | 197 (9.7%) | 363 (16.8%) |
| Total | 2,040 (100.0%) | 2,158 (100.0%) |
Property Value to Household Income Ratio in South Charleston
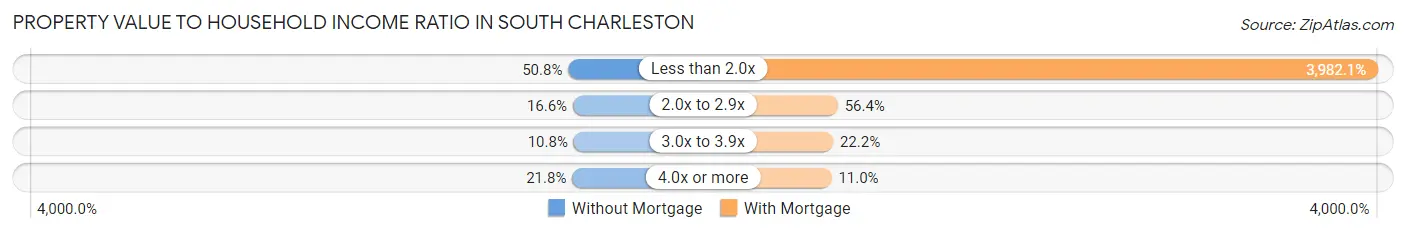
| Value-to-Income Ratio | Without Mortgage | With Mortgage |
| Less than 2.0x | 1,036 (50.8%) | 85,934 (3,982.1%) |
| 2.0x to 2.9x | 338 (16.6%) | 1,218 (56.4%) |
| 3.0x to 3.9x | 221 (10.8%) | 479 (22.2%) |
| 4.0x or more | 445 (21.8%) | 237 (11.0%) |
| Total | 2,040 (100.0%) | 2,158 (100.0%) |
Real Estate Taxes by Mortgage Status in South Charleston
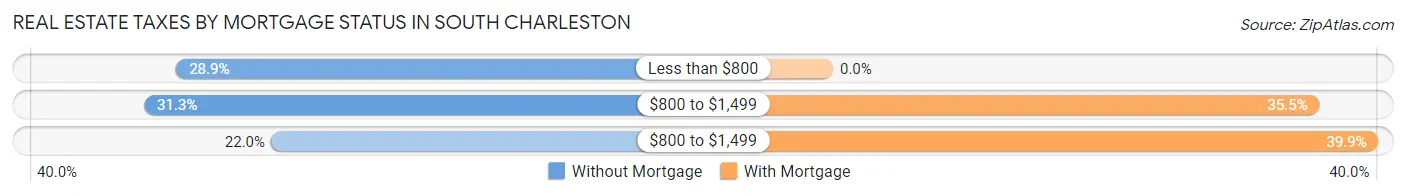
| Property Taxes | Without Mortgage | With Mortgage |
| Less than $800 | 590 (28.9%) | 0 (0.0%) |
| $800 to $1,499 | 638 (31.3%) | 767 (35.5%) |
| $800 to $1,499 | 449 (22.0%) | 860 (39.9%) |
| Total | 2,040 (100.0%) | 2,158 (100.0%) |
Health & Disability in South Charleston
Health Insurance Coverage by Age in South Charleston
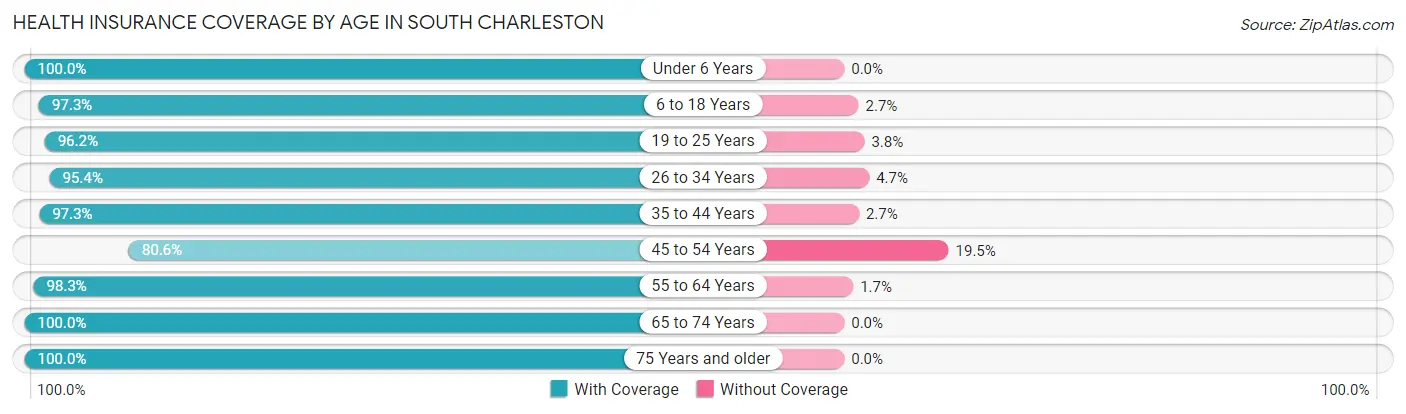
| Age Bracket | With Coverage | Without Coverage |
| Under 6 Years | 768 (100.0%) | 0 (0.0%) |
| 6 to 18 Years | 2,149 (97.3%) | 59 (2.7%) |
| 19 to 25 Years | 1,023 (96.2%) | 40 (3.8%) |
| 26 to 34 Years | 1,601 (95.4%) | 78 (4.6%) |
| 35 to 44 Years | 1,961 (97.3%) | 55 (2.7%) |
| 45 to 54 Years | 1,288 (80.5%) | 311 (19.5%) |
| 55 to 64 Years | 1,482 (98.3%) | 25 (1.7%) |
| 65 to 74 Years | 1,505 (100.0%) | 0 (0.0%) |
| 75 Years and older | 1,145 (100.0%) | 0 (0.0%) |
| Total | 12,922 (95.8%) | 568 (4.2%) |
Health Insurance Coverage by Citizenship Status in South Charleston
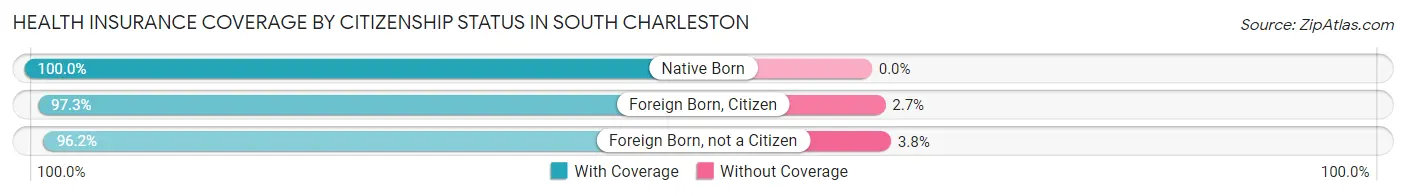
| Citizenship Status | With Coverage | Without Coverage |
| Native Born | 768 (100.0%) | 0 (0.0%) |
| Foreign Born, Citizen | 2,149 (97.3%) | 59 (2.7%) |
| Foreign Born, not a Citizen | 1,023 (96.2%) | 40 (3.8%) |
Health Insurance Coverage by Household Income in South Charleston
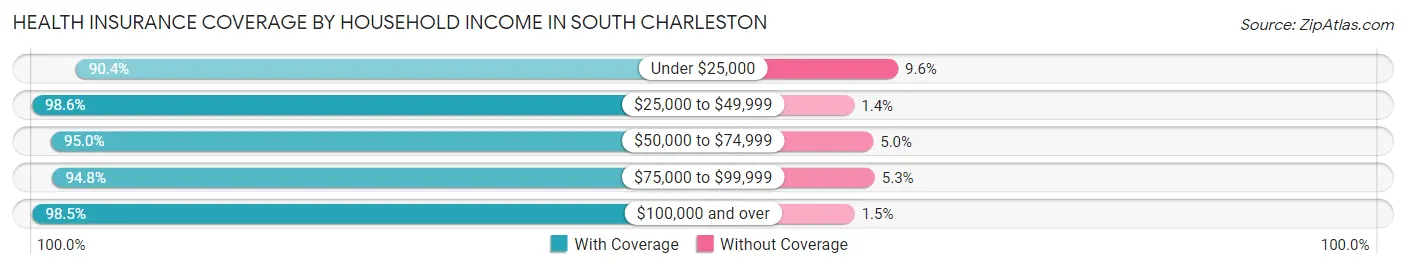
| Household Income | With Coverage | Without Coverage |
| Under $25,000 | 2,303 (90.4%) | 245 (9.6%) |
| $25,000 to $49,999 | 2,356 (98.6%) | 34 (1.4%) |
| $50,000 to $74,999 | 2,145 (95.0%) | 112 (5.0%) |
| $75,000 to $99,999 | 2,058 (94.8%) | 114 (5.2%) |
| $100,000 and over | 4,057 (98.5%) | 61 (1.5%) |
Public vs Private Health Insurance Coverage by Age in South Charleston
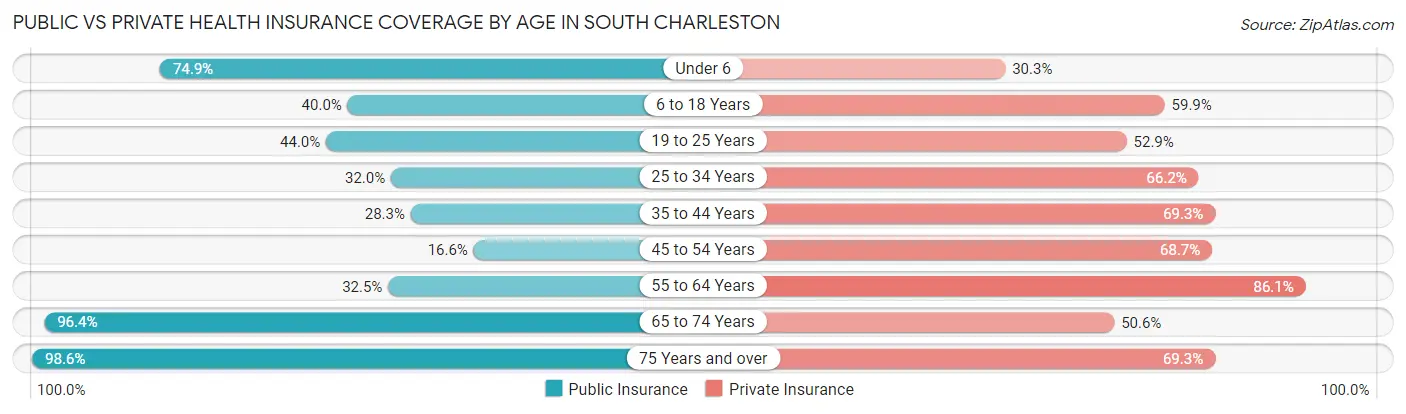
| Age Bracket | Public Insurance | Private Insurance |
| Under 6 | 575 (74.9%) | 233 (30.3%) |
| 6 to 18 Years | 884 (40.0%) | 1,323 (59.9%) |
| 19 to 25 Years | 468 (44.0%) | 562 (52.9%) |
| 25 to 34 Years | 537 (32.0%) | 1,112 (66.2%) |
| 35 to 44 Years | 571 (28.3%) | 1,397 (69.3%) |
| 45 to 54 Years | 266 (16.6%) | 1,099 (68.7%) |
| 55 to 64 Years | 490 (32.5%) | 1,297 (86.1%) |
| 65 to 74 Years | 1,450 (96.4%) | 761 (50.6%) |
| 75 Years and over | 1,129 (98.6%) | 793 (69.3%) |
| Total | 6,370 (47.2%) | 8,577 (63.6%) |
Disability Status by Sex by Age in South Charleston
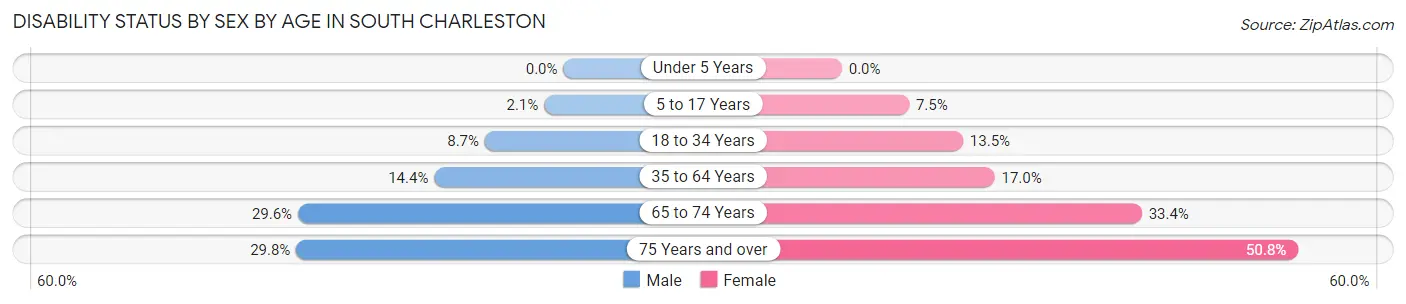
| Age Bracket | Male | Female |
| Under 5 Years | 0 (0.0%) | 0 (0.0%) |
| 5 to 17 Years | 22 (2.1%) | 93 (7.5%) |
| 18 to 34 Years | 129 (8.7%) | 183 (13.5%) |
| 35 to 64 Years | 358 (14.4%) | 448 (17.0%) |
| 65 to 74 Years | 167 (29.6%) | 314 (33.4%) |
| 75 Years and over | 141 (29.7%) | 341 (50.8%) |
Disability Class by Sex by Age in South Charleston
Disability Class: Hearing Difficulty
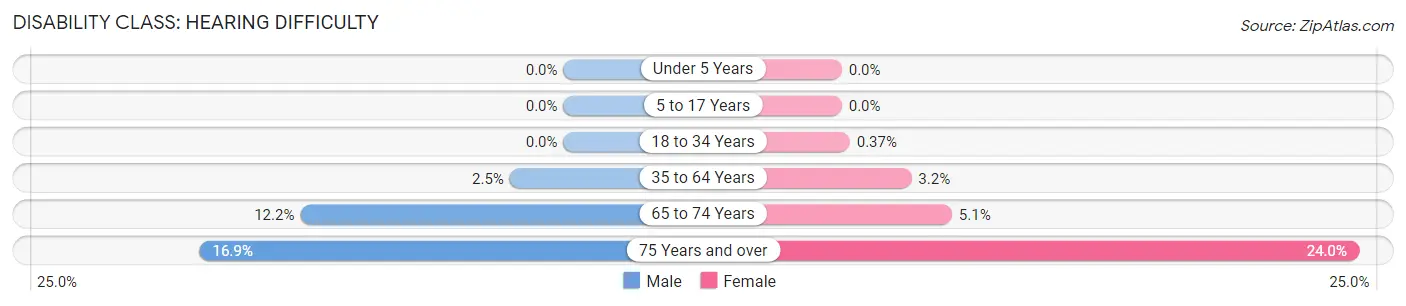
| Age Bracket | Male | Female |
| Under 5 Years | 0 (0.0%) | 0 (0.0%) |
| 5 to 17 Years | 0 (0.0%) | 0 (0.0%) |
| 18 to 34 Years | 0 (0.0%) | 5 (0.4%) |
| 35 to 64 Years | 62 (2.5%) | 85 (3.2%) |
| 65 to 74 Years | 69 (12.2%) | 48 (5.1%) |
| 75 Years and over | 80 (16.9%) | 161 (24.0%) |
Disability Class: Vision Difficulty
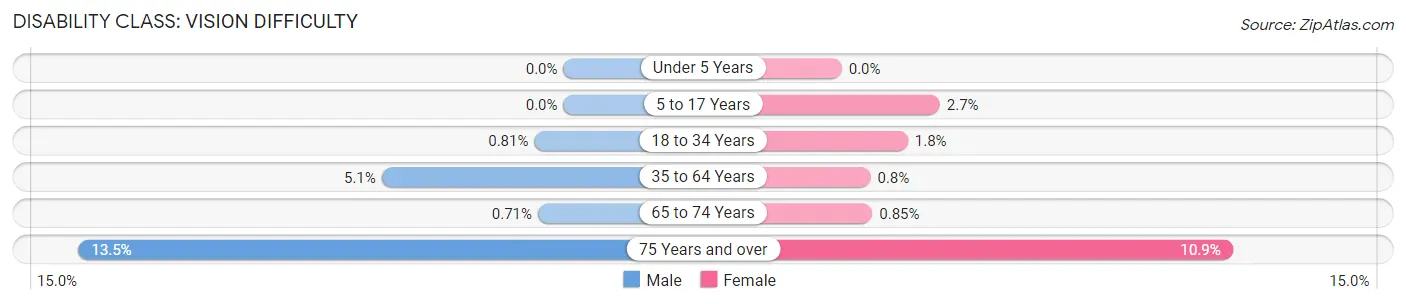
| Age Bracket | Male | Female |
| Under 5 Years | 0 (0.0%) | 0 (0.0%) |
| 5 to 17 Years | 0 (0.0%) | 34 (2.7%) |
| 18 to 34 Years | 12 (0.8%) | 25 (1.8%) |
| 35 to 64 Years | 126 (5.1%) | 21 (0.8%) |
| 65 to 74 Years | 4 (0.7%) | 8 (0.9%) |
| 75 Years and over | 64 (13.5%) | 73 (10.9%) |
Disability Class: Cognitive Difficulty
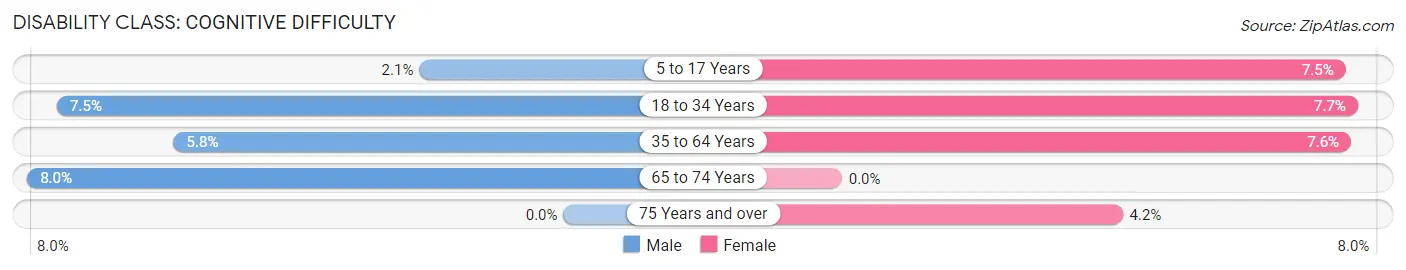
| Age Bracket | Male | Female |
| 5 to 17 Years | 22 (2.1%) | 93 (7.5%) |
| 18 to 34 Years | 111 (7.5%) | 104 (7.7%) |
| 35 to 64 Years | 144 (5.8%) | 199 (7.6%) |
| 65 to 74 Years | 45 (8.0%) | 0 (0.0%) |
| 75 Years and over | 0 (0.0%) | 28 (4.2%) |
Disability Class: Ambulatory Difficulty
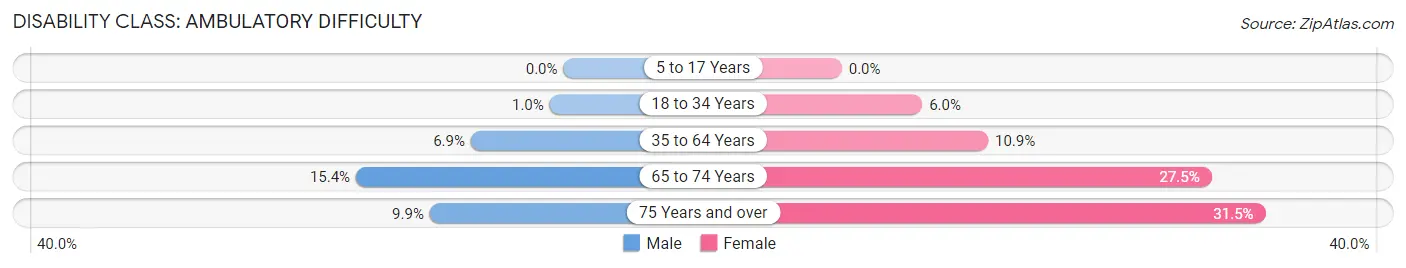
| Age Bracket | Male | Female |
| 5 to 17 Years | 0 (0.0%) | 0 (0.0%) |
| 18 to 34 Years | 15 (1.0%) | 81 (6.0%) |
| 35 to 64 Years | 171 (6.9%) | 286 (10.9%) |
| 65 to 74 Years | 87 (15.4%) | 258 (27.5%) |
| 75 Years and over | 47 (9.9%) | 211 (31.5%) |
Disability Class: Self-Care Difficulty
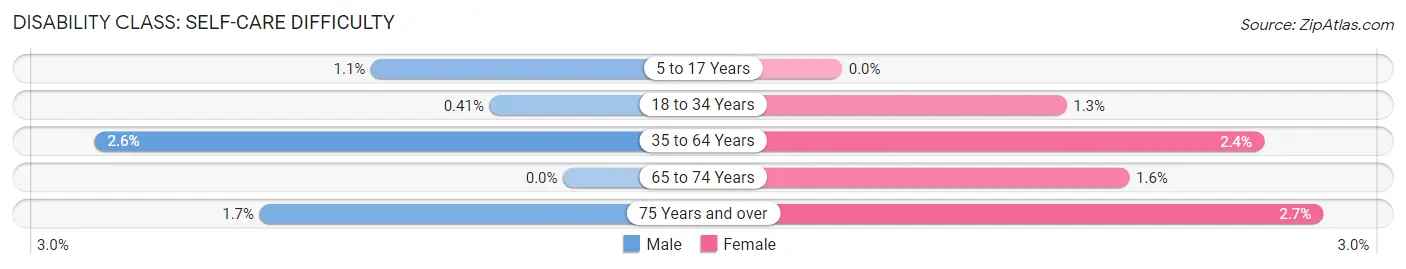
| Age Bracket | Male | Female |
| 5 to 17 Years | 11 (1.1%) | 0 (0.0%) |
| 18 to 34 Years | 6 (0.4%) | 17 (1.3%) |
| 35 to 64 Years | 65 (2.6%) | 62 (2.4%) |
| 65 to 74 Years | 0 (0.0%) | 15 (1.6%) |
| 75 Years and over | 8 (1.7%) | 18 (2.7%) |
Technology Access in South Charleston
Computing Device Access in South Charleston
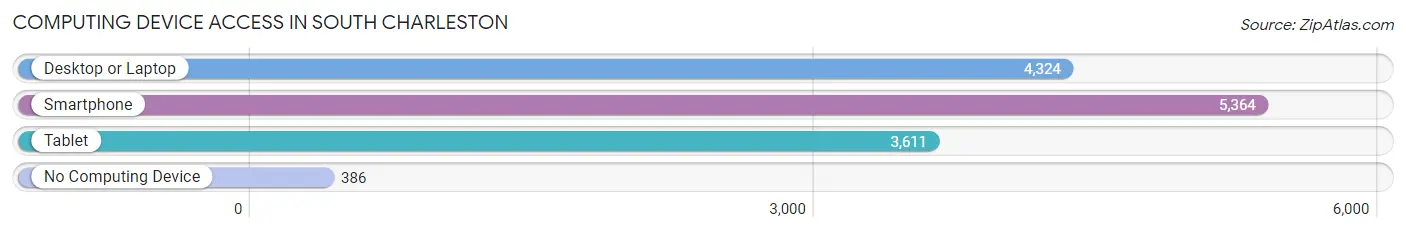
| Device Type | # Households | % Households |
| Desktop or Laptop | 4,324 | 71.9% |
| Smartphone | 5,364 | 89.1% |
| Tablet | 3,611 | 60.0% |
| No Computing Device | 386 | 6.4% |
| Total | 6,018 | 100.0% |
Internet Access in South Charleston
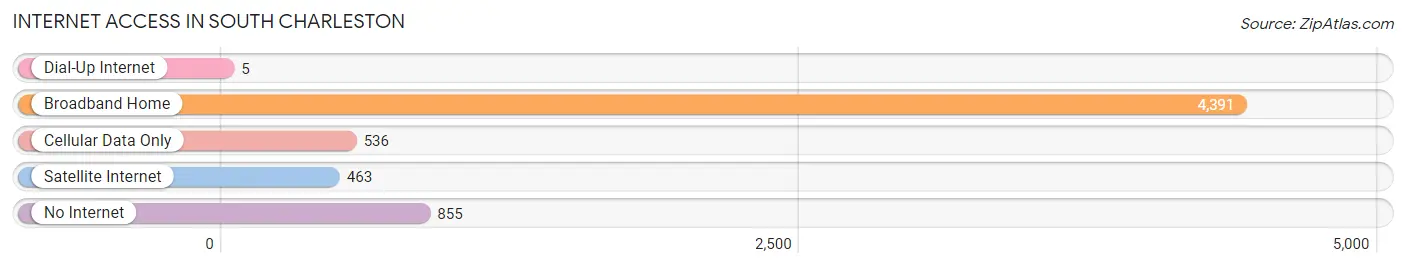
| Internet Type | # Households | % Households |
| Dial-Up Internet | 5 | 0.1% |
| Broadband Home | 4,391 | 73.0% |
| Cellular Data Only | 536 | 8.9% |
| Satellite Internet | 463 | 7.7% |
| No Internet | 855 | 14.2% |
| Total | 6,018 | 100.0% |
South Charleston Summary
South Charleston, West Virginia is a city located in Kanawha County, West Virginia. It is located just south of the state capital, Charleston, and is part of the Charleston metropolitan area. The city has a population of 13,450 as of the 2010 census.
History
South Charleston was founded in 1788 by a group of settlers from Virginia. The town was originally known as Charleston South Side, and was incorporated in 1901. The city was originally a small farming community, but began to grow in the late 19th century with the arrival of the Chesapeake and Ohio Railway. The city was also home to a large chemical plant, which was built in the early 20th century.
The city experienced a period of rapid growth in the 1950s and 1960s, as the chemical plant expanded and new industries moved into the area. The city was also home to a large shopping mall, which opened in the 1970s.
Geography
South Charleston is located in the southwestern part of West Virginia, in Kanawha County. The city is situated on the Kanawha River, and is bordered by the cities of Charleston, Dunbar, and St. Albans. The city has a total area of 8.3 square miles, of which 8.2 square miles is land and 0.1 square miles is water.
The city has a humid subtropical climate, with hot, humid summers and cold, snowy winters. The average annual temperature is 54.3°F, and the average annual precipitation is 43.3 inches.
Economy
South Charleston's economy is largely based on the chemical industry. The city is home to a large chemical plant, which produces a variety of chemicals and plastics. The city is also home to several other industries, including manufacturing, retail, and healthcare.
The city's largest employer is the chemical plant, which employs over 1,000 people. Other major employers include the South Charleston Medical Center, the South Charleston Public Library, and the South Charleston Convention Center.
Demographics
As of the 2010 census, South Charleston had a population of 13,450. The racial makeup of the city was 87.3% White, 8.2% African American, 0.4% Native American, 0.7% Asian, 0.1% Pacific Islander, 0.7% from other races, and 2.6% from two or more races. Hispanic or Latino of any race were 1.7% of the population.
The median income for a household in the city was $35,945, and the median income for a family was $45,945. The per capita income for the city was $20,945. About 11.3% of families and 14.2% of the population were below the poverty line, including 19.2% of those under age 18 and 8.2% of those age 65 or over.
Common Questions
What is Per Capita Income in South Charleston?
Per Capita income in South Charleston is $35,801.
What is the Median Family Income in South Charleston?
Median Family Income in South Charleston is $69,426.
What is the Median Household income in South Charleston?
Median Household Income in South Charleston is $58,756.
What is Income or Wage Gap in South Charleston?
Income or Wage Gap in South Charleston is 25.8%.
Women in South Charleston earn 74.2 cents for every dollar earned by a man.
What is Family Income Deficit in South Charleston?
Family Income Deficit in South Charleston is $10,586.
Families that are below poverty line in South Charleston earn $10,586 less on average than the poverty threshold level.
What is Inequality or Gini Index in South Charleston?
Inequality or Gini Index in South Charleston is 0.44.
What is the Total Population of South Charleston?
Total Population of South Charleston is 13,527.
What is the Total Male Population of South Charleston?
Total Male Population of South Charleston is 6,400.
What is the Total Female Population of South Charleston?
Total Female Population of South Charleston is 7,127.
What is the Ratio of Males per 100 Females in South Charleston?
There are 89.80 Males per 100 Females in South Charleston.
What is the Ratio of Females per 100 Males in South Charleston?
There are 111.36 Females per 100 Males in South Charleston.
What is the Median Population Age in South Charleston?
Median Population Age in South Charleston is 40.7 Years.
What is the Average Family Size in South Charleston
Average Family Size in South Charleston is 2.8 People.
What is the Average Household Size in South Charleston
Average Household Size in South Charleston is 2.2 People.
How Large is the Labor Force in South Charleston?
There are 6,857 People in the Labor Forcein in South Charleston.
What is the Percentage of People in the Labor Force in South Charleston?
62.2% of People are in the Labor Force in South Charleston.
What is the Unemployment Rate in South Charleston?
Unemployment Rate in South Charleston is 6.9%.