Sophia, WV Map & Demographics
Sophia Map
Sophia Overview
$25,065
PER CAPITA INCOME
$34,978
AVG FAMILY INCOME
$33,372
AVG HOUSEHOLD INCOME
0.60
INEQUALITY / GINI INDEX
1,730
TOTAL POPULATION
850
MALE POPULATION
880
FEMALE POPULATION
96.59
MALES / 100 FEMALES
103.53
FEMALES / 100 MALES
45.8
MEDIAN AGE
2.7
AVG FAMILY SIZE
2.2
AVG HOUSEHOLD SIZE
568
LABOR FORCE [ PEOPLE ]
39.5%
PERCENT IN LABOR FORCE
12.7%
UNEMPLOYMENT RATE
Sophia Zip Codes
Sophia Area Codes
Income in Sophia
Income Overview in Sophia
Per Capita Income in Sophia is $25,065, while median incomes of families and households are $34,978 and $33,372 respectively.
| Characteristic | Number | Measure |
| Per Capita Income | 1,730 | $25,065 |
| Median Family Income | 512 | $34,978 |
| Mean Family Income | 512 | $56,407 |
| Median Household Income | 775 | $33,372 |
| Mean Household Income | 775 | $57,882 |
| Income Deficit | 512 | $0 |
| Wage / Income Gap (%) | 1,730 | 0.00% |
| Wage / Income Gap ($) | 1,730 | 100.00¢ per $1 |
| Gini / Inequality Index | 1,730 | 0.60 |
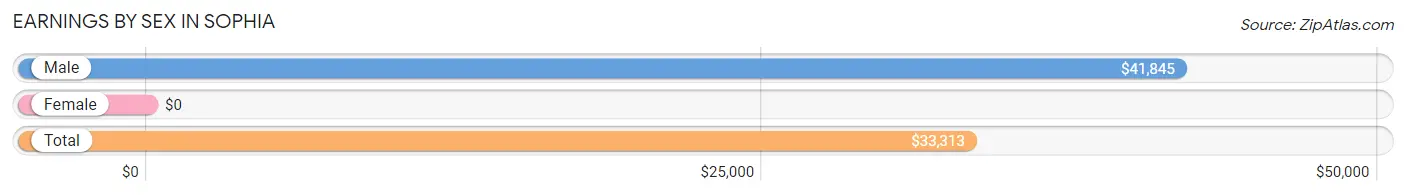
Earnings by Sex in Sophia
| Sex | Number | Average Earnings |
| Male | 375 (68.4%) | $41,845 |
| Female | 173 (31.6%) | $0 |
| Total | 548 (100.0%) | $33,313 |
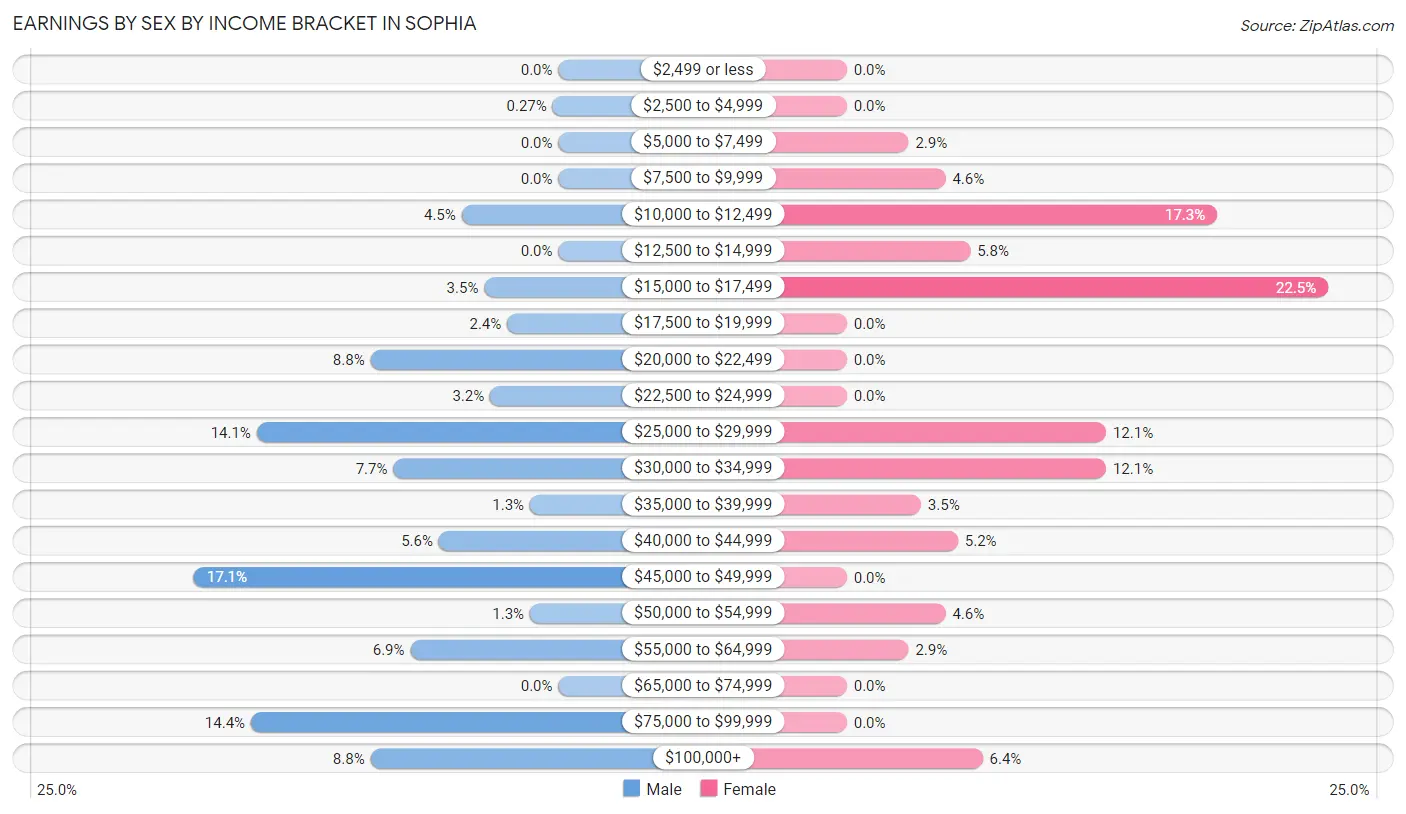
Earnings by Sex by Income Bracket in Sophia
The most common earnings brackets in Sophia are $45,000 to $49,999 for men (64 | 17.1%) and $15,000 to $17,499 for women (39 | 22.5%).
| Income | Male | Female |
| $2,499 or less | 0 (0.0%) | 0 (0.0%) |
| $2,500 to $4,999 | 1 (0.3%) | 0 (0.0%) |
| $5,000 to $7,499 | 0 (0.0%) | 5 (2.9%) |
| $7,500 to $9,999 | 0 (0.0%) | 8 (4.6%) |
| $10,000 to $12,499 | 17 (4.5%) | 30 (17.3%) |
| $12,500 to $14,999 | 0 (0.0%) | 10 (5.8%) |
| $15,000 to $17,499 | 13 (3.5%) | 39 (22.5%) |
| $17,500 to $19,999 | 9 (2.4%) | 0 (0.0%) |
| $20,000 to $22,499 | 33 (8.8%) | 0 (0.0%) |
| $22,500 to $24,999 | 12 (3.2%) | 0 (0.0%) |
| $25,000 to $29,999 | 53 (14.1%) | 21 (12.1%) |
| $30,000 to $34,999 | 29 (7.7%) | 21 (12.1%) |
| $35,000 to $39,999 | 5 (1.3%) | 6 (3.5%) |
| $40,000 to $44,999 | 21 (5.6%) | 9 (5.2%) |
| $45,000 to $49,999 | 64 (17.1%) | 0 (0.0%) |
| $50,000 to $54,999 | 5 (1.3%) | 8 (4.6%) |
| $55,000 to $64,999 | 26 (6.9%) | 5 (2.9%) |
| $65,000 to $74,999 | 0 (0.0%) | 0 (0.0%) |
| $75,000 to $99,999 | 54 (14.4%) | 0 (0.0%) |
| $100,000+ | 33 (8.8%) | 11 (6.4%) |
| Total | 375 (100.0%) | 173 (100.0%) |
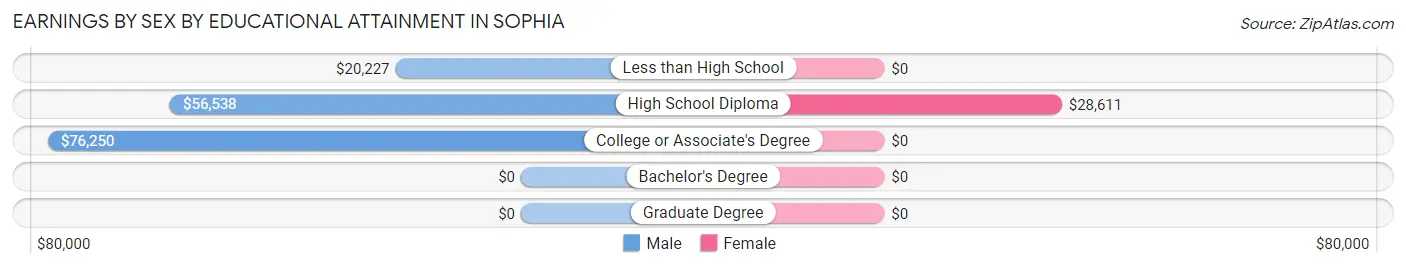
Earnings by Sex by Educational Attainment in Sophia
Average earnings in Sophia are $52,750 for men and $29,028 for women, a difference of 45.0%. Men with an educational attainment of college or associate's degree enjoy the highest average annual earnings of $76,250, while those with less than high school education earn the least with $20,227. Women with an educational attainment of high school diploma earn the most with the average annual earnings of $28,611, while those with high school diploma education have the smallest earnings of $28,611.
| Educational Attainment | Male Income | Female Income |
| Less than High School | $20,227 | $0 |
| High School Diploma | $56,538 | $28,611 |
| College or Associate's Degree | $76,250 | $0 |
| Bachelor's Degree | - | - |
| Graduate Degree | - | - |
| Total | $52,750 | $29,028 |
Family Income in Sophia
Family Income Brackets in Sophia
According to the Sophia family income data, there are 133 families falling into the $25,000 to $34,999 income range, which is the most common income bracket and makes up 26.0% of all families.
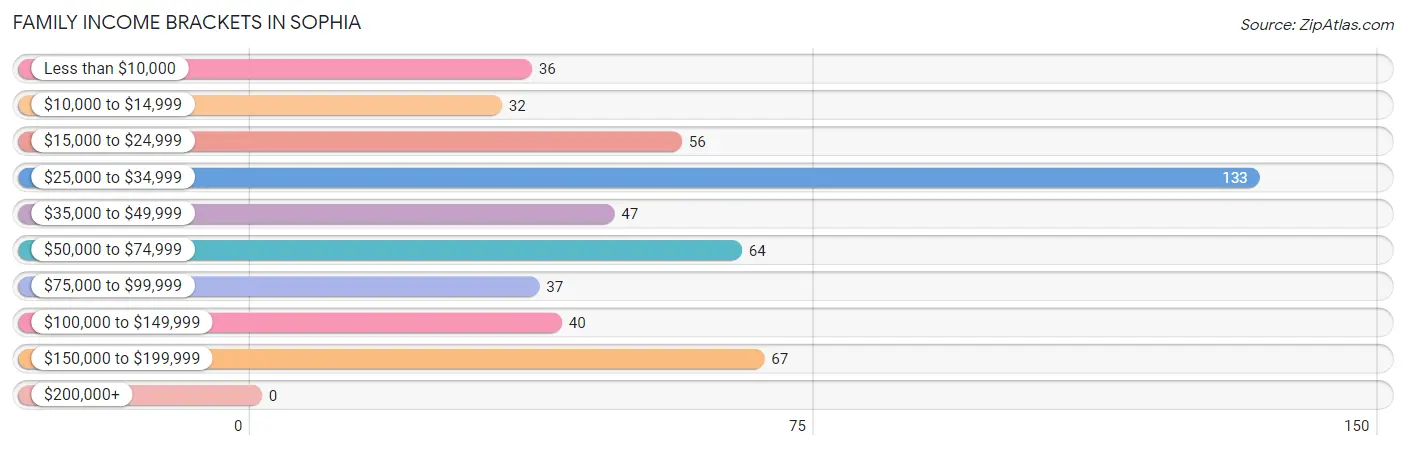
| Income Bracket | # Families | % Families |
| Less than $10,000 | 36 | 7.0% |
| $10,000 to $14,999 | 32 | 6.3% |
| $15,000 to $24,999 | 56 | 10.9% |
| $25,000 to $34,999 | 133 | 26.0% |
| $35,000 to $49,999 | 47 | 9.2% |
| $50,000 to $74,999 | 64 | 12.5% |
| $75,000 to $99,999 | 37 | 7.2% |
| $100,000 to $149,999 | 40 | 7.8% |
| $150,000 to $199,999 | 67 | 13.1% |
| $200,000+ | 0 | 0.0% |
Family Income by Famaliy Size in Sophia
3-person families (78 | 15.2%) account for the highest median family income in Sophia with $114,091 per family, while 3-person families (78 | 15.2%) have the highest median income of $38,030 per family member.
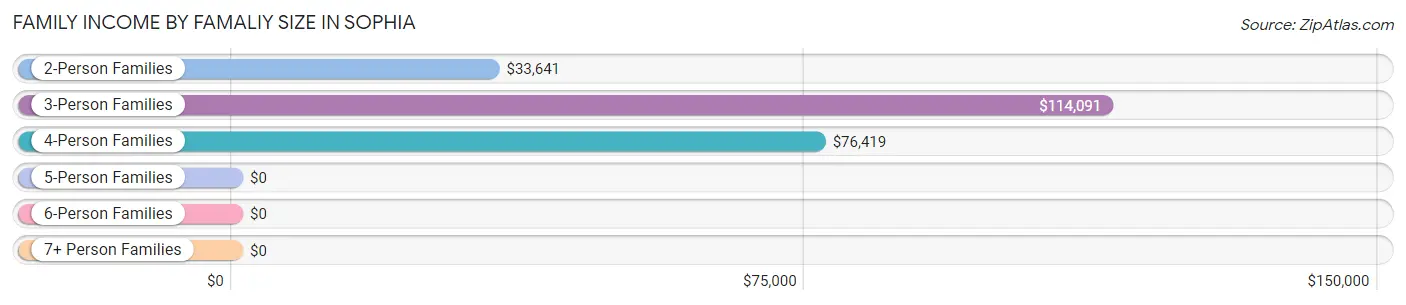
| Income Bracket | # Families | Median Income |
| 2-Person Families | 297 (58.0%) | $33,641 |
| 3-Person Families | 78 (15.2%) | $114,091 |
| 4-Person Families | 120 (23.4%) | $76,419 |
| 5-Person Families | 17 (3.3%) | $0 |
| 6-Person Families | 0 (0.0%) | $0 |
| 7+ Person Families | 0 (0.0%) | $0 |
| Total | 512 (100.0%) | $34,978 |
Family Income by Number of Earners in Sophia
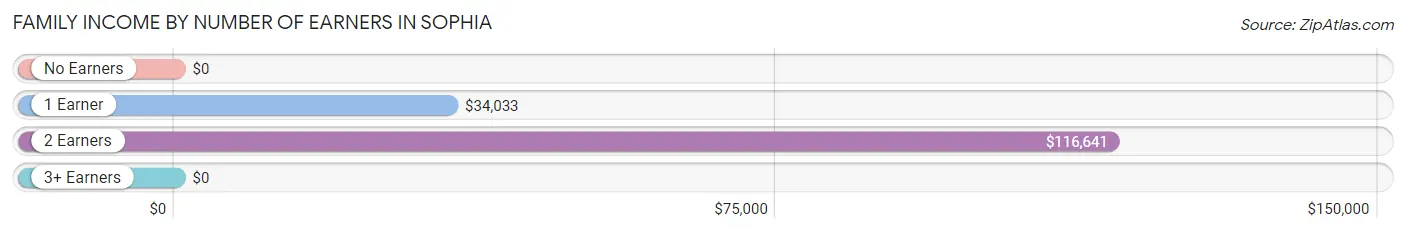
| Number of Earners | # Families | Median Income |
| No Earners | 133 (26.0%) | $0 |
| 1 Earner | 270 (52.7%) | $34,033 |
| 2 Earners | 73 (14.3%) | $116,641 |
| 3+ Earners | 36 (7.0%) | $0 |
| Total | 512 (100.0%) | $34,978 |
Household Income in Sophia
Household Income Brackets in Sophia
With 178 households falling in the category, the $25,000 to $34,999 income range is the most frequent in Sophia, accounting for 23.0% of all households. In contrast, only 11 households (1.4%) fall into the $200,000+ income bracket, making it the least populous group.
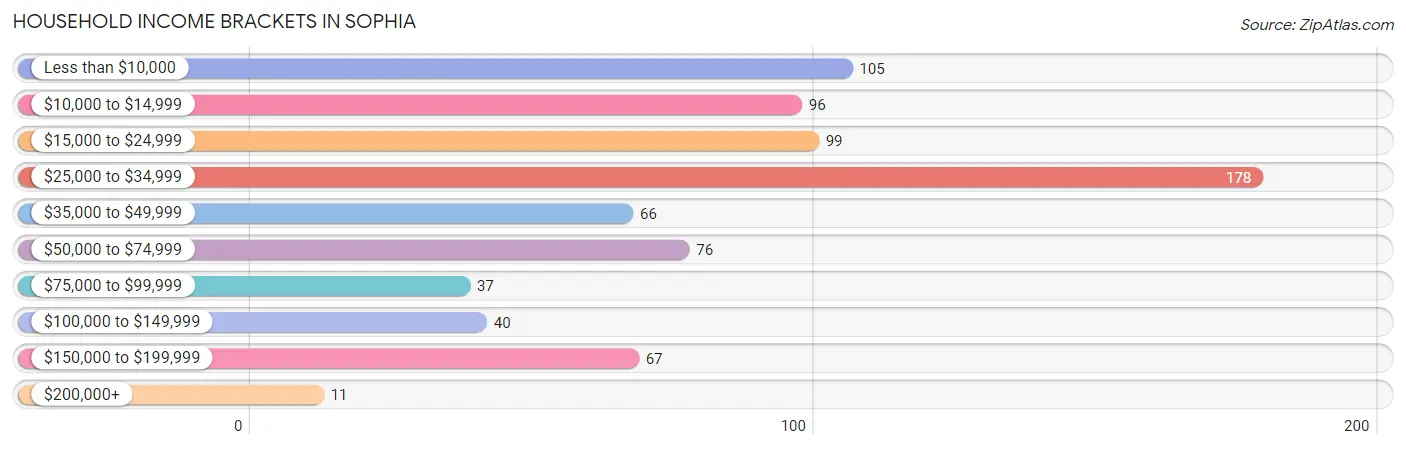
| Income Bracket | # Households | % Households |
| Less than $10,000 | 105 | 13.5% |
| $10,000 to $14,999 | 96 | 12.4% |
| $15,000 to $24,999 | 99 | 12.8% |
| $25,000 to $34,999 | 178 | 23.0% |
| $35,000 to $49,999 | 66 | 8.5% |
| $50,000 to $74,999 | 76 | 9.8% |
| $75,000 to $99,999 | 37 | 4.8% |
| $100,000 to $149,999 | 40 | 5.2% |
| $150,000 to $199,999 | 67 | 8.6% |
| $200,000+ | 11 | 1.4% |
Household Income by Householder Age in Sophia
The median household income in Sophia is $33,372, with the highest median household income of $56,779 found in the 25 to 44 years age bracket for the primary householder. A total of 125 households (16.1%) fall into this category. Meanwhile, the 15 to 24 years age bracket for the primary householder has the lowest median household income of $0, with 34 households (4.4%) in this group.
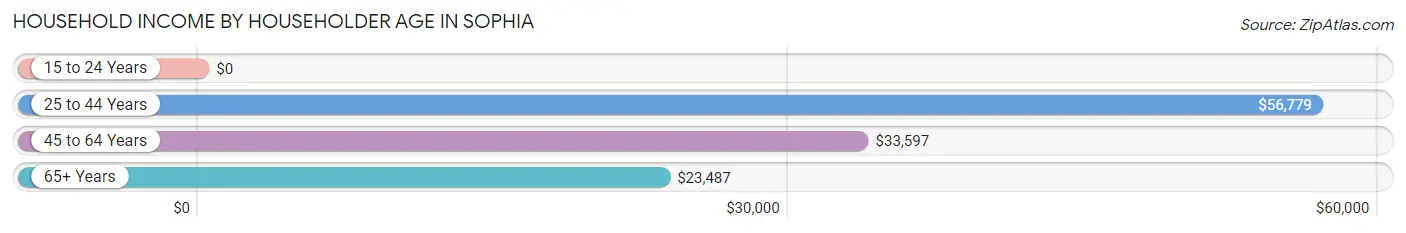
| Income Bracket | # Households | Median Income |
| 15 to 24 Years | 34 (4.4%) | $0 |
| 25 to 44 Years | 125 (16.1%) | $56,779 |
| 45 to 64 Years | 315 (40.6%) | $33,597 |
| 65+ Years | 301 (38.8%) | $23,487 |
| Total | 775 (100.0%) | $33,372 |
Poverty in Sophia
Income Below Poverty by Sex and Age in Sophia
With 28.1% poverty level for males and 32.6% for females among the residents of Sophia, under 5 year old males and 16 and 17 year old females are the most vulnerable to poverty, with 25 males (59.5%) and 17 females (80.9%) in their respective age groups living below the poverty level.
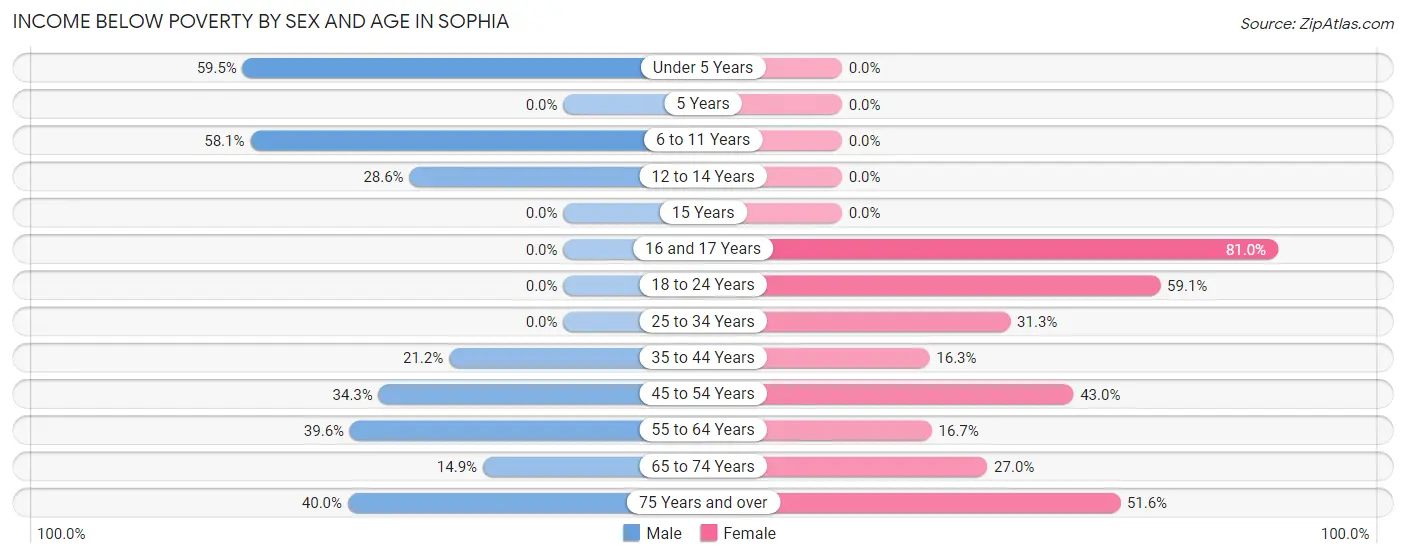
| Age Bracket | Male | Female |
| Under 5 Years | 25 (59.5%) | 0 (0.0%) |
| 5 Years | 0 (0.0%) | 0 (0.0%) |
| 6 to 11 Years | 43 (58.1%) | 0 (0.0%) |
| 12 to 14 Years | 12 (28.6%) | 0 (0.0%) |
| 15 Years | 0 (0.0%) | 0 (0.0%) |
| 16 and 17 Years | 0 (0.0%) | 17 (80.9%) |
| 18 to 24 Years | 0 (0.0%) | 52 (59.1%) |
| 25 to 34 Years | 0 (0.0%) | 25 (31.2%) |
| 35 to 44 Years | 14 (21.2%) | 13 (16.3%) |
| 45 to 54 Years | 48 (34.3%) | 58 (43.0%) |
| 55 to 64 Years | 42 (39.6%) | 26 (16.7%) |
| 65 to 74 Years | 10 (14.9%) | 17 (27.0%) |
| 75 Years and over | 36 (40.0%) | 79 (51.6%) |
| Total | 230 (28.1%) | 287 (32.6%) |
Income Above Poverty by Sex and Age in Sophia
According to the poverty statistics in Sophia, males aged 18 to 24 years and females aged under 5 years are the age groups that are most secure financially, with 100.0% of males and 100.0% of females in these age groups living above the poverty line.
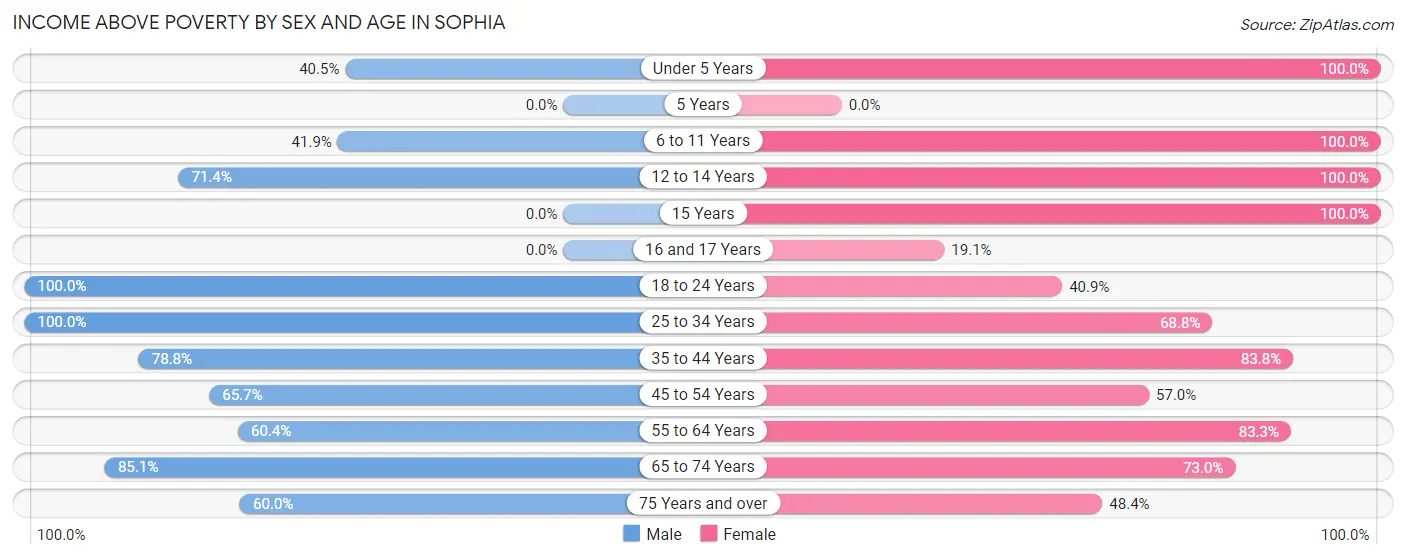
| Age Bracket | Male | Female |
| Under 5 Years | 17 (40.5%) | 15 (100.0%) |
| 5 Years | 0 (0.0%) | 0 (0.0%) |
| 6 to 11 Years | 31 (41.9%) | 48 (100.0%) |
| 12 to 14 Years | 30 (71.4%) | 25 (100.0%) |
| 15 Years | 0 (0.0%) | 16 (100.0%) |
| 16 and 17 Years | 0 (0.0%) | 4 (19.1%) |
| 18 to 24 Years | 140 (100.0%) | 36 (40.9%) |
| 25 to 34 Years | 52 (100.0%) | 55 (68.8%) |
| 35 to 44 Years | 52 (78.8%) | 67 (83.8%) |
| 45 to 54 Years | 92 (65.7%) | 77 (57.0%) |
| 55 to 64 Years | 64 (60.4%) | 130 (83.3%) |
| 65 to 74 Years | 57 (85.1%) | 46 (73.0%) |
| 75 Years and over | 54 (60.0%) | 74 (48.4%) |
| Total | 589 (71.9%) | 593 (67.4%) |
Income Below Poverty Among Married-Couple Families in Sophia
The poverty statistics for married-couple families in Sophia show that 11.5% or 45 of the total 392 families live below the poverty line. Families with 1 or 2 children have the highest poverty rate of 14.1%, comprising of 13 families. On the other hand, families with 3 or 4 children have the lowest poverty rate of 0.0%, which includes 0 families.
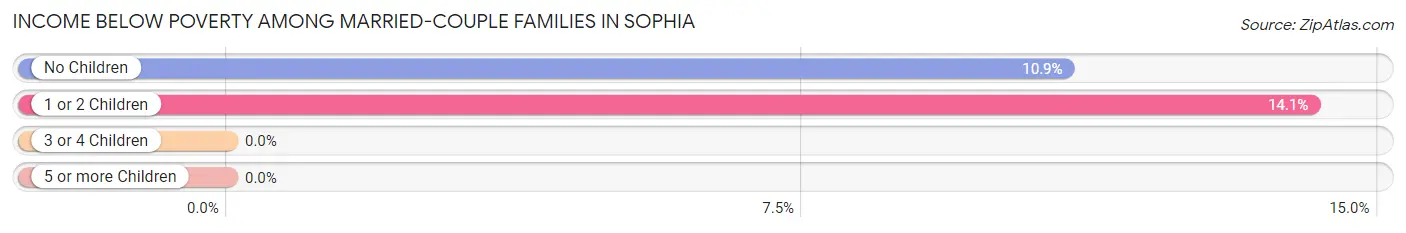
| Children | Above Poverty | Below Poverty |
| No Children | 261 (89.1%) | 32 (10.9%) |
| 1 or 2 Children | 79 (85.9%) | 13 (14.1%) |
| 3 or 4 Children | 7 (100.0%) | 0 (0.0%) |
| 5 or more Children | 0 (0.0%) | 0 (0.0%) |
| Total | 347 (88.5%) | 45 (11.5%) |
Income Below Poverty Among Single-Parent Households in Sophia
According to the poverty data in Sophia, 100.0% or 11 single-father households and 58.7% or 64 single-mother households are living below the poverty line. Among single-father households, those with no children have the highest poverty rate, with 11 households (100.0%) experiencing poverty. Likewise, among single-mother households, those with 1 or 2 children have the highest poverty rate, with 64 households (84.2%) falling below the poverty line.
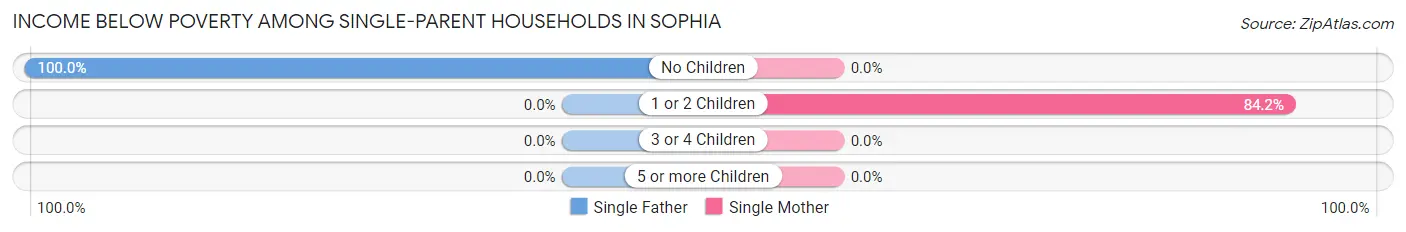
| Children | Single Father | Single Mother |
| No Children | 11 (100.0%) | 0 (0.0%) |
| 1 or 2 Children | 0 (0.0%) | 64 (84.2%) |
| 3 or 4 Children | 0 (0.0%) | 0 (0.0%) |
| 5 or more Children | 0 (0.0%) | 0 (0.0%) |
| Total | 11 (100.0%) | 64 (58.7%) |
Income Below Poverty Among Married-Couple vs Single-Parent Households in Sophia
The poverty data for Sophia shows that 45 of the married-couple family households (11.5%) and 75 of the single-parent households (62.5%) are living below the poverty level. Within the married-couple family households, those with 1 or 2 children have the highest poverty rate, with 13 households (14.1%) falling below the poverty line. Among the single-parent households, those with 1 or 2 children have the highest poverty rate, with 64 household (84.2%) living below poverty.
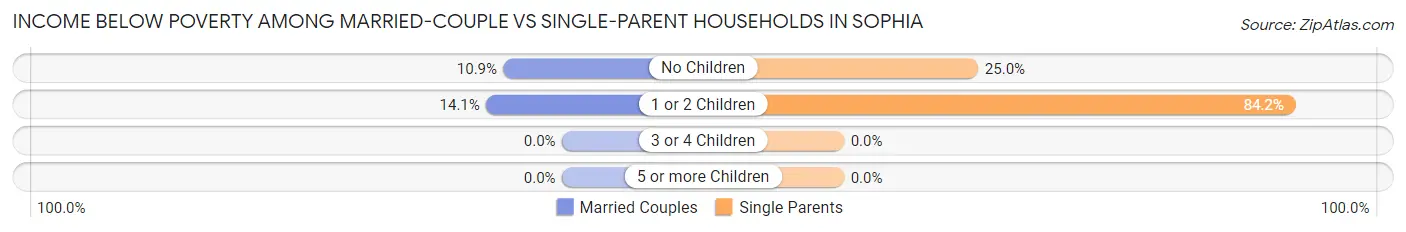
| Children | Married-Couple Families | Single-Parent Households |
| No Children | 32 (10.9%) | 11 (25.0%) |
| 1 or 2 Children | 13 (14.1%) | 64 (84.2%) |
| 3 or 4 Children | 0 (0.0%) | 0 (0.0%) |
| 5 or more Children | 0 (0.0%) | 0 (0.0%) |
| Total | 45 (11.5%) | 75 (62.5%) |
Race in Sophia
The most populous races in Sophia are White / Caucasian (1,632 | 94.3%), Black / African American (90 | 5.2%), and Asian (8 | 0.5%).
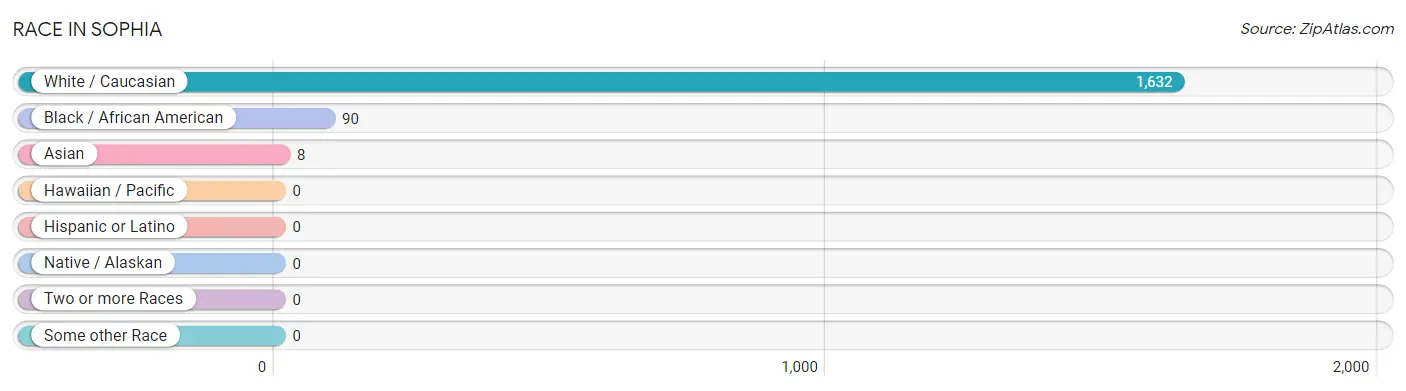
| Race | # Population | % Population |
| Asian | 8 | 0.5% |
| Black / African American | 90 | 5.2% |
| Hawaiian / Pacific | 0 | 0.0% |
| Hispanic or Latino | 0 | 0.0% |
| Native / Alaskan | 0 | 0.0% |
| White / Caucasian | 1,632 | 94.3% |
| Two or more Races | 0 | 0.0% |
| Some other Race | 0 | 0.0% |
| Total | 1,730 | 100.0% |
Ancestry in Sophia
The most populous ancestries reported in Sophia are English (821 | 47.5%), Irish (124 | 7.2%), German (107 | 6.2%), Liberian (90 | 5.2%), and Subsaharan African (90 | 5.2%), together accounting for 71.2% of all Sophia residents.

| Ancestry | # Population | % Population |
| American | 11 | 0.6% |
| Dutch | 23 | 1.3% |
| English | 821 | 47.5% |
| European | 32 | 1.8% |
| French | 55 | 3.2% |
| German | 107 | 6.2% |
| Hungarian | 31 | 1.8% |
| Irish | 124 | 7.2% |
| Italian | 76 | 4.4% |
| Korean | 8 | 0.5% |
| Liberian | 90 | 5.2% |
| Norwegian | 54 | 3.1% |
| Polish | 51 | 2.9% |
| Scandinavian | 15 | 0.9% |
| Subsaharan African | 90 | 5.2% | View All 15 Rows |
Immigrants in Sophia
The most numerous immigrant groups reported in Sophia came from Africa (51 | 2.9%), Liberia (51 | 2.9%), and Western Africa (51 | 2.9%), together accounting for 8.8% of all Sophia residents.
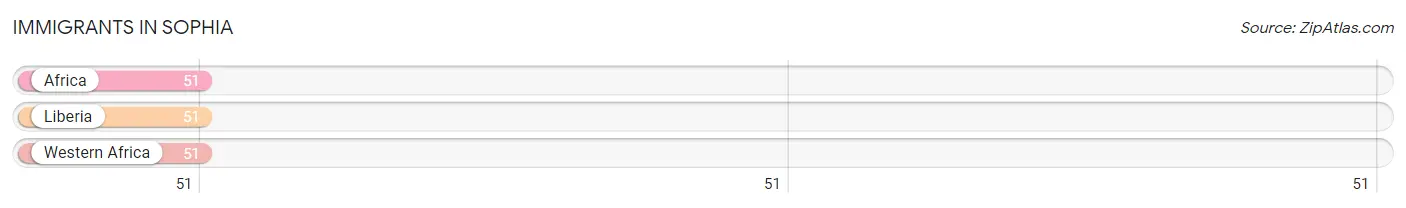
| Immigration Origin | # Population | % Population |
| Africa | 51 | 2.9% |
| Liberia | 51 | 2.9% |
| Western Africa | 51 | 2.9% | View All 3 Rows |
Sex and Age in Sophia
Sex and Age in Sophia
The most populous age groups in Sophia are 20 to 24 Years (117 | 13.8%) for men and 55 to 59 Years (132 | 15.0%) for women.
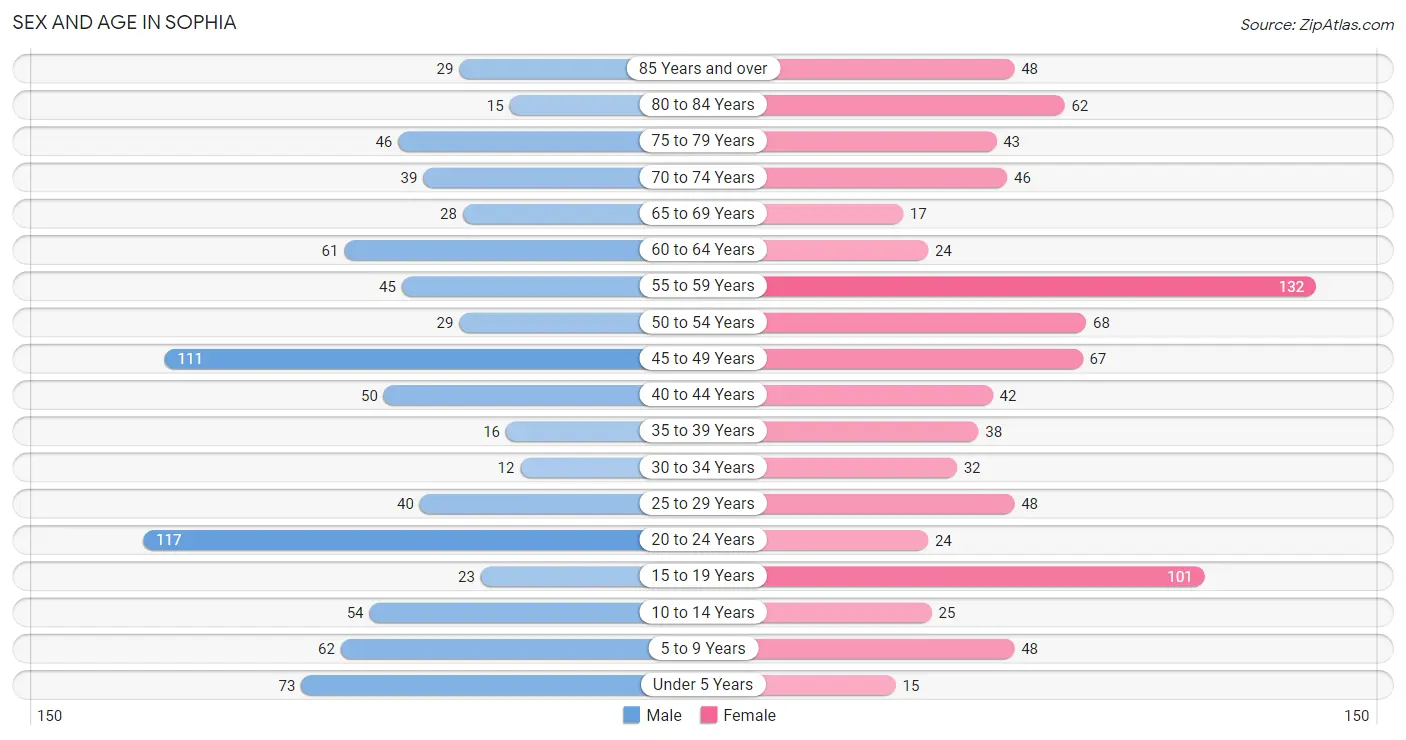
| Age Bracket | Male | Female |
| Under 5 Years | 73 (8.6%) | 15 (1.7%) |
| 5 to 9 Years | 62 (7.3%) | 48 (5.4%) |
| 10 to 14 Years | 54 (6.4%) | 25 (2.8%) |
| 15 to 19 Years | 23 (2.7%) | 101 (11.5%) |
| 20 to 24 Years | 117 (13.8%) | 24 (2.7%) |
| 25 to 29 Years | 40 (4.7%) | 48 (5.4%) |
| 30 to 34 Years | 12 (1.4%) | 32 (3.6%) |
| 35 to 39 Years | 16 (1.9%) | 38 (4.3%) |
| 40 to 44 Years | 50 (5.9%) | 42 (4.8%) |
| 45 to 49 Years | 111 (13.1%) | 67 (7.6%) |
| 50 to 54 Years | 29 (3.4%) | 68 (7.7%) |
| 55 to 59 Years | 45 (5.3%) | 132 (15.0%) |
| 60 to 64 Years | 61 (7.2%) | 24 (2.7%) |
| 65 to 69 Years | 28 (3.3%) | 17 (1.9%) |
| 70 to 74 Years | 39 (4.6%) | 46 (5.2%) |
| 75 to 79 Years | 46 (5.4%) | 43 (4.9%) |
| 80 to 84 Years | 15 (1.8%) | 62 (7.0%) |
| 85 Years and over | 29 (3.4%) | 48 (5.4%) |
| Total | 850 (100.0%) | 880 (100.0%) |
Families and Households in Sophia
Median Family Size in Sophia
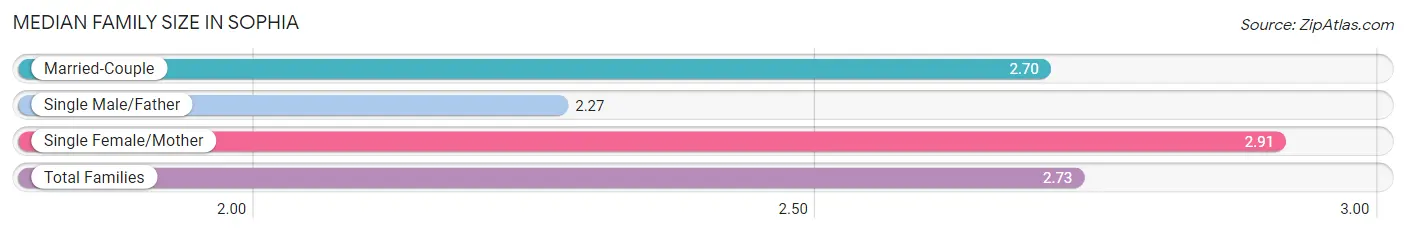
The median family size in Sophia is 2.73 persons per family, with single female/mother families (109 | 21.3%) accounting for the largest median family size of 2.91 persons per family. On the other hand, single male/father families (11 | 2.1%) represent the smallest median family size with 2.27 persons per family.
| Family Type | # Families | Family Size |
| Married-Couple | 392 (76.6%) | 2.70 |
| Single Male/Father | 11 (2.1%) | 2.27 |
| Single Female/Mother | 109 (21.3%) | 2.91 |
| Total Families | 512 (100.0%) | 2.73 |
Median Household Size in Sophia
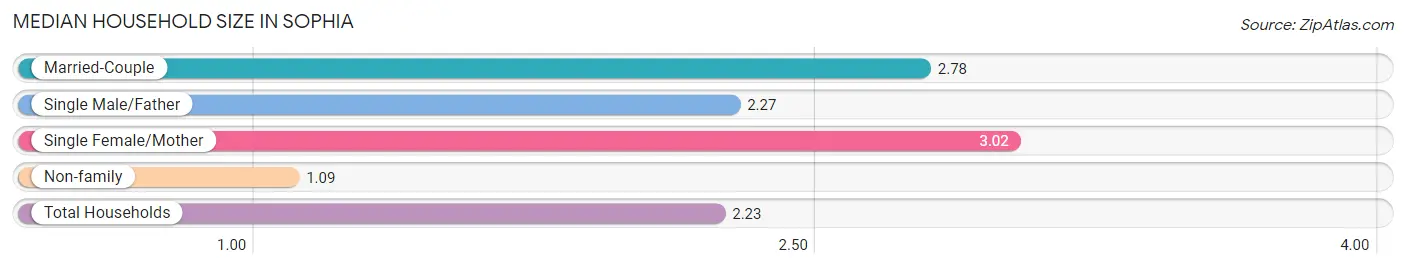
The median household size in Sophia is 2.23 persons per household, with single female/mother households (109 | 14.1%) accounting for the largest median household size of 3.02 persons per household. non-family households (263 | 33.9%) represent the smallest median household size with 1.09 persons per household.
| Household Type | # Households | Household Size |
| Married-Couple | 392 (50.6%) | 2.78 |
| Single Male/Father | 11 (1.4%) | 2.27 |
| Single Female/Mother | 109 (14.1%) | 3.02 |
| Non-family | 263 (33.9%) | 1.09 |
| Total Households | 775 (100.0%) | 2.23 |
Household Size by Marriage Status in Sophia
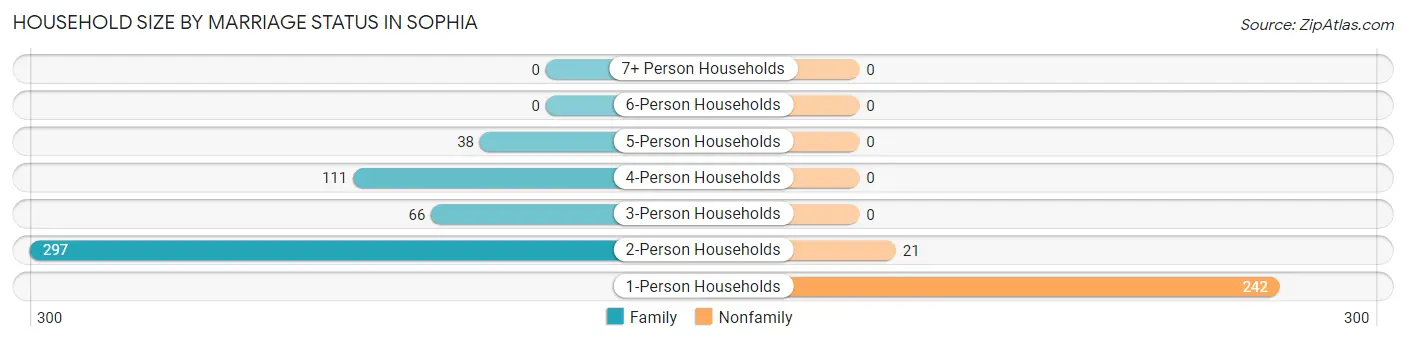
Out of a total of 775 households in Sophia, 512 (66.1%) are family households, while 263 (33.9%) are nonfamily households. The most numerous type of family households are 2-person households, comprising 297, and the most common type of nonfamily households are 1-person households, comprising 242.
| Household Size | Family Households | Nonfamily Households |
| 1-Person Households | - | 242 (31.2%) |
| 2-Person Households | 297 (38.3%) | 21 (2.7%) |
| 3-Person Households | 66 (8.5%) | 0 (0.0%) |
| 4-Person Households | 111 (14.3%) | 0 (0.0%) |
| 5-Person Households | 38 (4.9%) | 0 (0.0%) |
| 6-Person Households | 0 (0.0%) | 0 (0.0%) |
| 7+ Person Households | 0 (0.0%) | 0 (0.0%) |
| Total | 512 (66.1%) | 263 (33.9%) |
Female Fertility in Sophia
Fertility by Age in Sophia
Average fertility rate in Sophia is 20.0 births per 1,000 women. Women in the age bracket of 20 to 34 years have the highest fertility rate with 67.0 births per 1,000 women. Women in the age bracket of 20 to 34 years acount for 100.0% of all women with births.
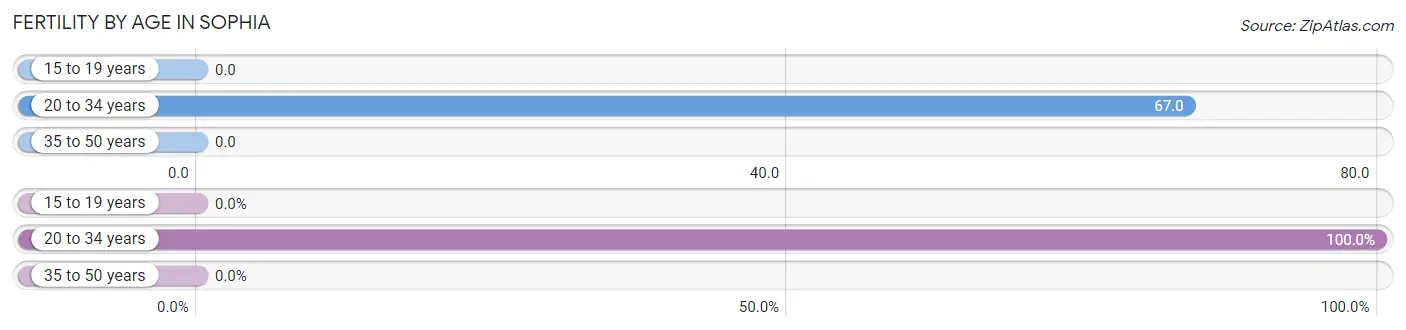
| Age Bracket | Women with Births | Births / 1,000 Women |
| 15 to 19 years | 0 (0.0%) | 0.0 |
| 20 to 34 years | 7 (100.0%) | 67.0 |
| 35 to 50 years | 0 (0.0%) | 0.0 |
| Total | 7 (100.0%) | 20.0 |
Fertility by Age by Marriage Status in Sophia
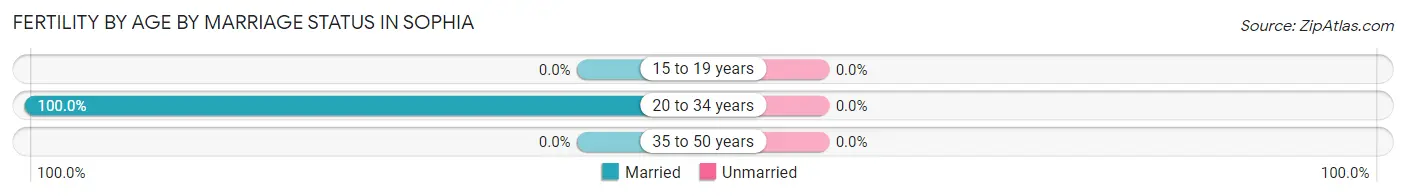
| Age Bracket | Married | Unmarried |
| 15 to 19 years | 0 (0.0%) | 0 (0.0%) |
| 20 to 34 years | 7 (100.0%) | 0 (0.0%) |
| 35 to 50 years | 0 (0.0%) | 0 (0.0%) |
| Total | 7 (100.0%) | 0 (0.0%) |
Fertility by Education in Sophia
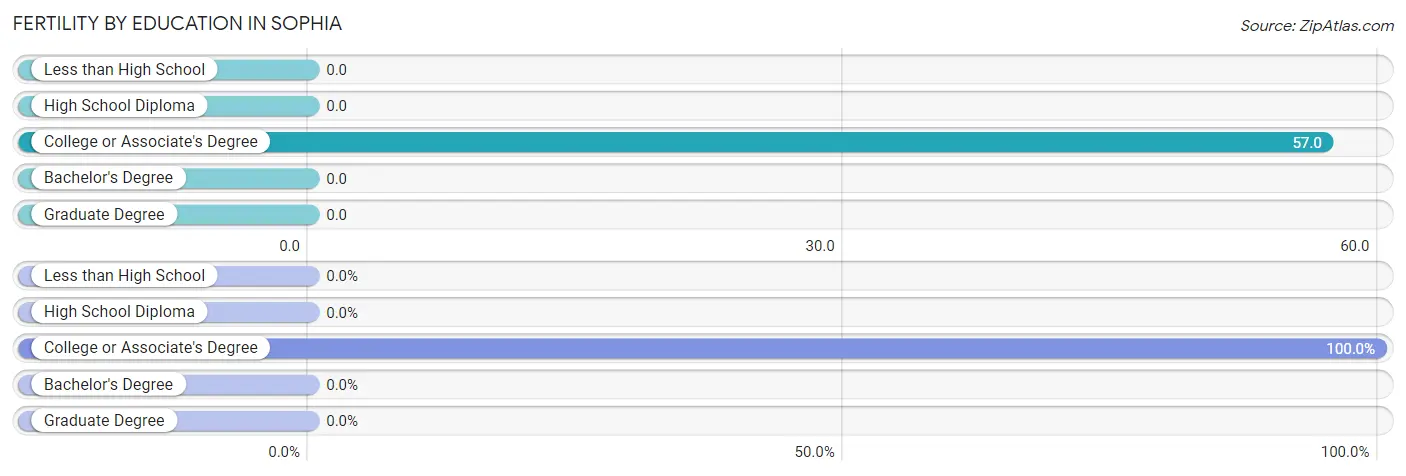
| Educational Attainment | Women with Births | Births / 1,000 Women |
| Less than High School | 0 (0.0%) | 0.0 |
| High School Diploma | 0 (0.0%) | 0.0 |
| College or Associate's Degree | 7 (100.0%) | 57.0 |
| Bachelor's Degree | 0 (0.0%) | 0.0 |
| Graduate Degree | 0 (0.0%) | 0.0 |
| Total | 7 (100.0%) | 20.0 |
Fertility by Education by Marriage Status in Sophia
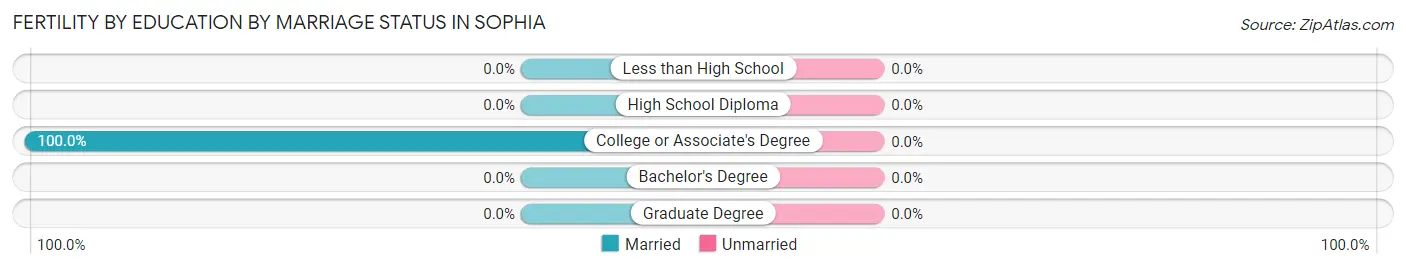
| Educational Attainment | Married | Unmarried |
| Less than High School | 0 (0.0%) | 0 (0.0%) |
| High School Diploma | 0 (0.0%) | 0 (0.0%) |
| College or Associate's Degree | 7 (100.0%) | 0 (0.0%) |
| Bachelor's Degree | 0 (0.0%) | 0 (0.0%) |
| Graduate Degree | 0 (0.0%) | 0 (0.0%) |
| Total | 7 (100.0%) | 0 (0.0%) |
Employment Characteristics in Sophia
Employment by Class of Employer in Sophia
Among the 496 employed individuals in Sophia, private company employees (412 | 83.1%), local government employees (38 | 7.7%), and state government employees (25 | 5.0%) make up the most common classes of employment.
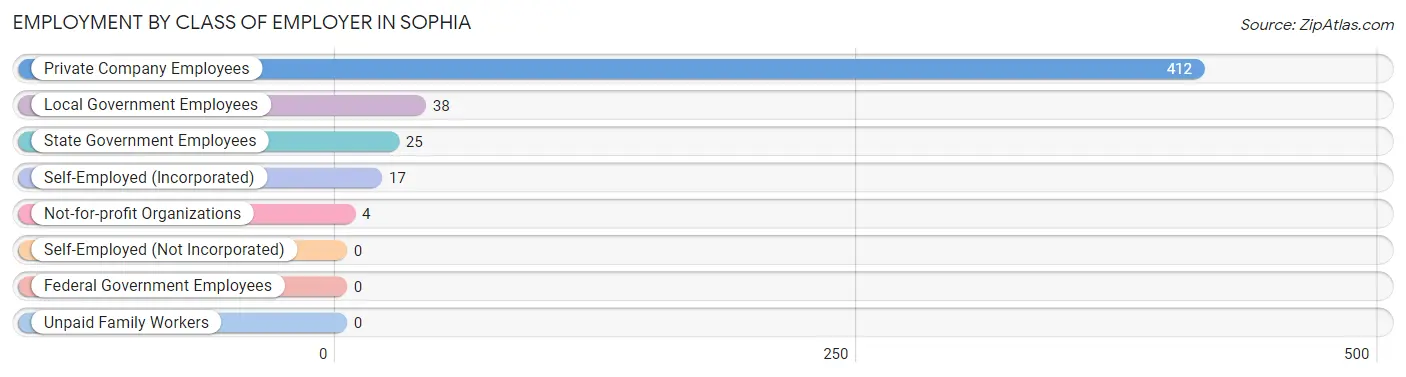
| Employer Class | # Employees | % Employees |
| Private Company Employees | 412 | 83.1% |
| Self-Employed (Incorporated) | 17 | 3.4% |
| Self-Employed (Not Incorporated) | 0 | 0.0% |
| Not-for-profit Organizations | 4 | 0.8% |
| Local Government Employees | 38 | 7.7% |
| State Government Employees | 25 | 5.0% |
| Federal Government Employees | 0 | 0.0% |
| Unpaid Family Workers | 0 | 0.0% |
| Total | 496 | 100.0% |
Employment Status by Age in Sophia
According to the labor force statistics for Sophia, out of the total population over 16 years of age (1,437), 39.5% or 568 individuals are in the labor force, with 12.7% or 72 of them unemployed. The age group with the highest labor force participation rate is 20 to 24 years, with 87.2% or 123 individuals in the labor force. Within the labor force, the 30 to 34 years age range has the highest percentage of unemployed individuals, with 67.6% or 25 of them being unemployed.
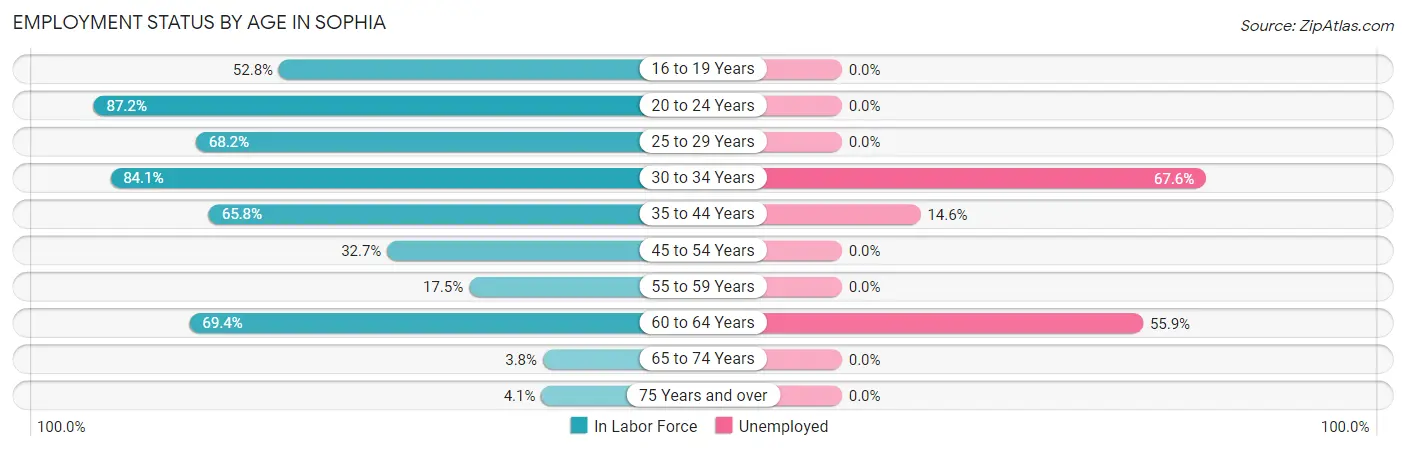
| Age Bracket | In Labor Force | Unemployed |
| 16 to 19 Years | 57 (52.8%) | 0 (0.0%) |
| 20 to 24 Years | 123 (87.2%) | 0 (0.0%) |
| 25 to 29 Years | 60 (68.2%) | 0 (0.0%) |
| 30 to 34 Years | 37 (84.1%) | 25 (67.6%) |
| 35 to 44 Years | 96 (65.8%) | 14 (14.6%) |
| 45 to 54 Years | 90 (32.7%) | 0 (0.0%) |
| 55 to 59 Years | 31 (17.5%) | 0 (0.0%) |
| 60 to 64 Years | 59 (69.4%) | 33 (55.9%) |
| 65 to 74 Years | 5 (3.8%) | 0 (0.0%) |
| 75 Years and over | 10 (4.1%) | 0 (0.0%) |
| Total | 568 (39.5%) | 72 (12.7%) |
Employment Status by Educational Attainment in Sophia
According to labor force statistics for Sophia, 45.8% of individuals (373) out of the total population between 25 and 64 years of age (815) are in the labor force, with 19.3% or 72 of them being unemployed. The group with the highest labor force participation rate are those with the educational attainment of bachelor's degree or higher, with 100.0% or 24 individuals in the labor force. Within the labor force, individuals with less than high school education have the highest percentage of unemployment, with 64.4% or 47 of them being unemployed.
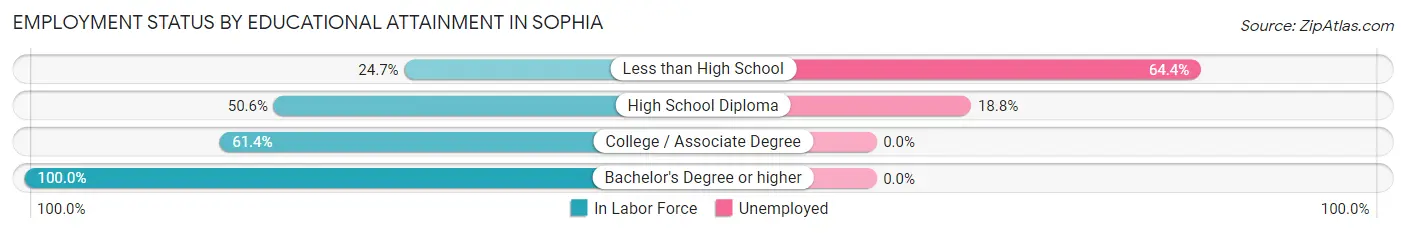
| Educational Attainment | In Labor Force | Unemployed |
| Less than High School | 73 (24.7%) | 190 (64.4%) |
| High School Diploma | 133 (50.6%) | 49 (18.8%) |
| College / Associate Degree | 143 (61.4%) | 0 (0.0%) |
| Bachelor's Degree or higher | 24 (100.0%) | 0 (0.0%) |
| Total | 373 (45.8%) | 157 (19.3%) |
Employment Occupations by Sex in Sophia
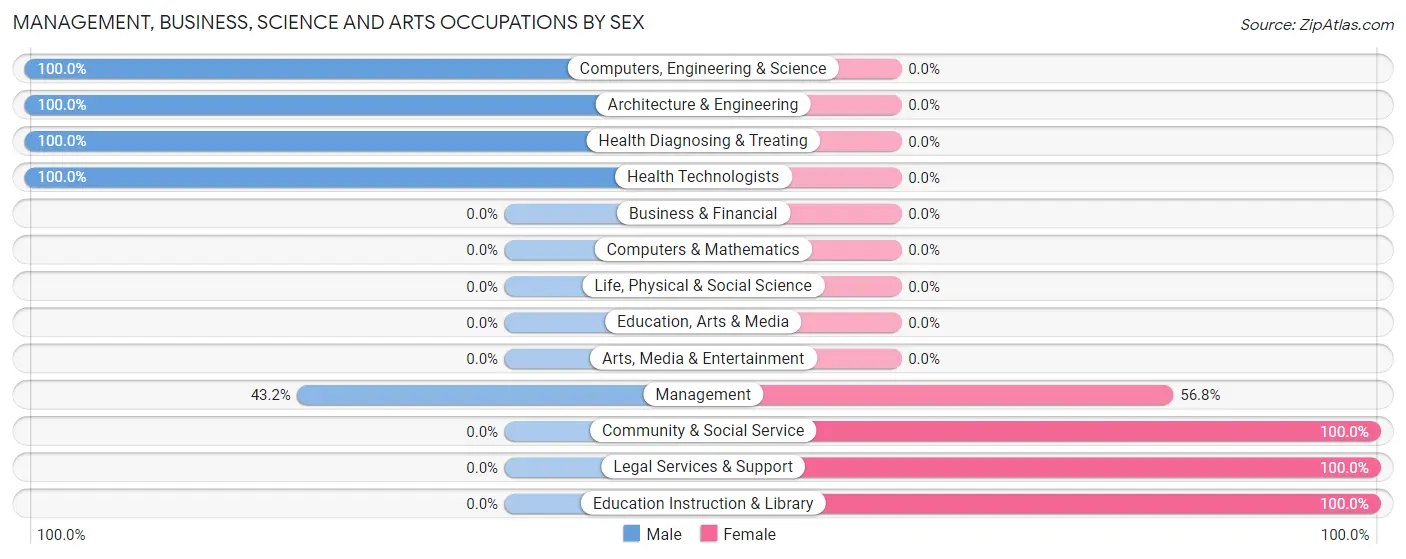
Management, Business, Science and Arts Occupations
The most common Management, Business, Science and Arts occupations in Sophia are Health Diagnosing & Treating (40 | 8.1%), Management (37 | 7.5%), Computers, Engineering & Science (31 | 6.2%), Architecture & Engineering (31 | 6.2%), and Health Technologists (30 | 6.0%).
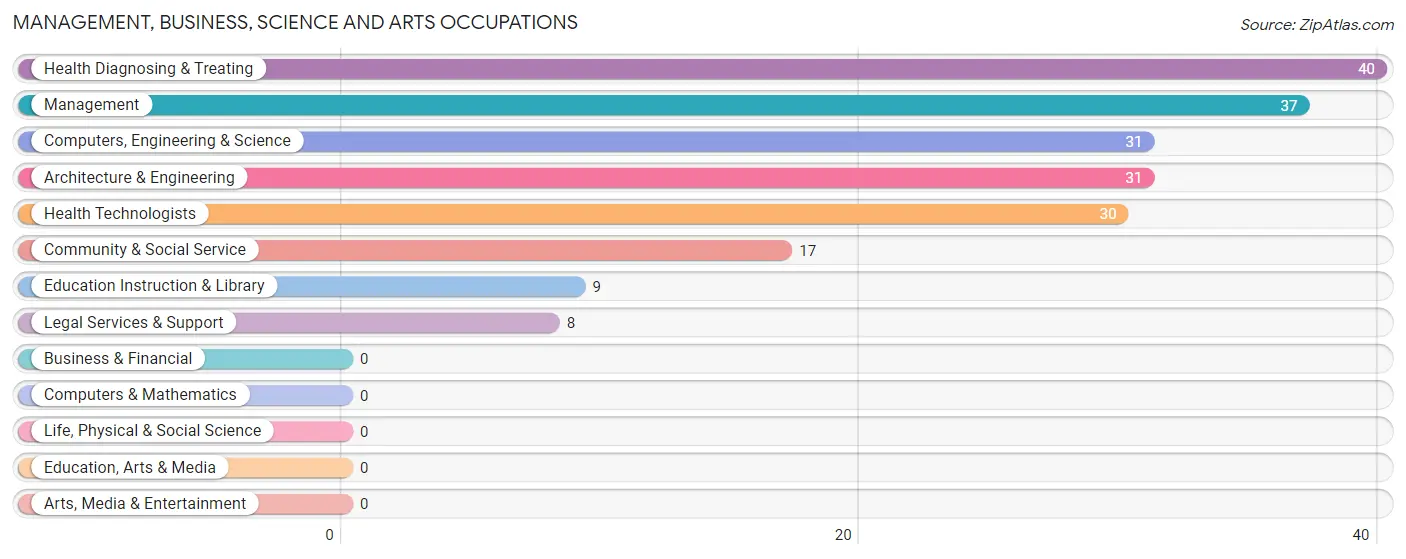
Management, Business, Science and Arts Occupations by Sex
Within the Management, Business, Science and Arts occupations in Sophia, the most male-oriented occupations are Computers, Engineering & Science (100.0%), Architecture & Engineering (100.0%), and Health Diagnosing & Treating (100.0%), while the most female-oriented occupations are Community & Social Service (100.0%), Legal Services & Support (100.0%), and Education Instruction & Library (100.0%).
| Occupation | Male | Female |
| Management | 16 (43.2%) | 21 (56.8%) |
| Business & Financial | 0 (0.0%) | 0 (0.0%) |
| Computers, Engineering & Science | 31 (100.0%) | 0 (0.0%) |
| Computers & Mathematics | 0 (0.0%) | 0 (0.0%) |
| Architecture & Engineering | 31 (100.0%) | 0 (0.0%) |
| Life, Physical & Social Science | 0 (0.0%) | 0 (0.0%) |
| Community & Social Service | 0 (0.0%) | 17 (100.0%) |
| Education, Arts & Media | 0 (0.0%) | 0 (0.0%) |
| Legal Services & Support | 0 (0.0%) | 8 (100.0%) |
| Education Instruction & Library | 0 (0.0%) | 9 (100.0%) |
| Arts, Media & Entertainment | 0 (0.0%) | 0 (0.0%) |
| Health Diagnosing & Treating | 40 (100.0%) | 0 (0.0%) |
| Health Technologists | 30 (100.0%) | 0 (0.0%) |
| Total (Category) | 87 (69.6%) | 38 (30.4%) |
| Total (Overall) | 341 (68.8%) | 155 (31.2%) |
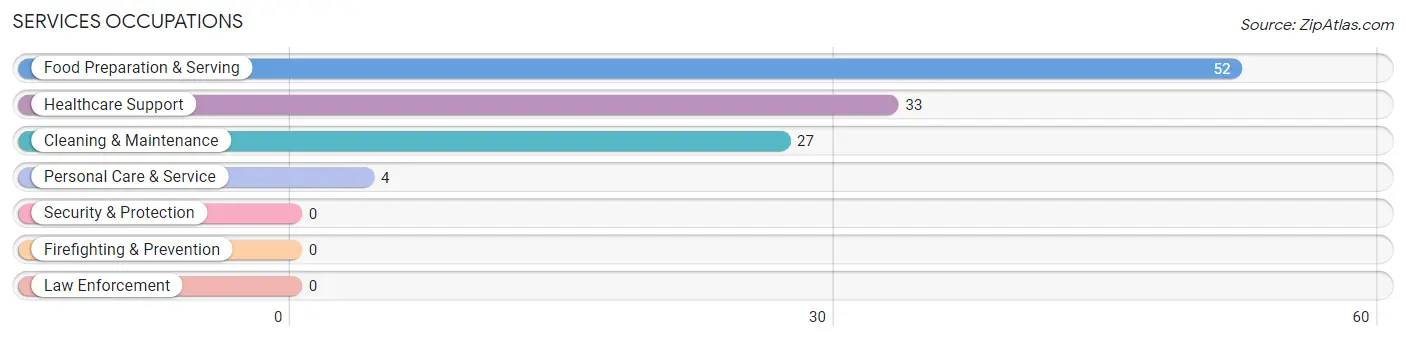
Services Occupations
The most common Services occupations in Sophia are Food Preparation & Serving (52 | 10.5%), Healthcare Support (33 | 6.7%), Cleaning & Maintenance (27 | 5.4%), and Personal Care & Service (4 | 0.8%).
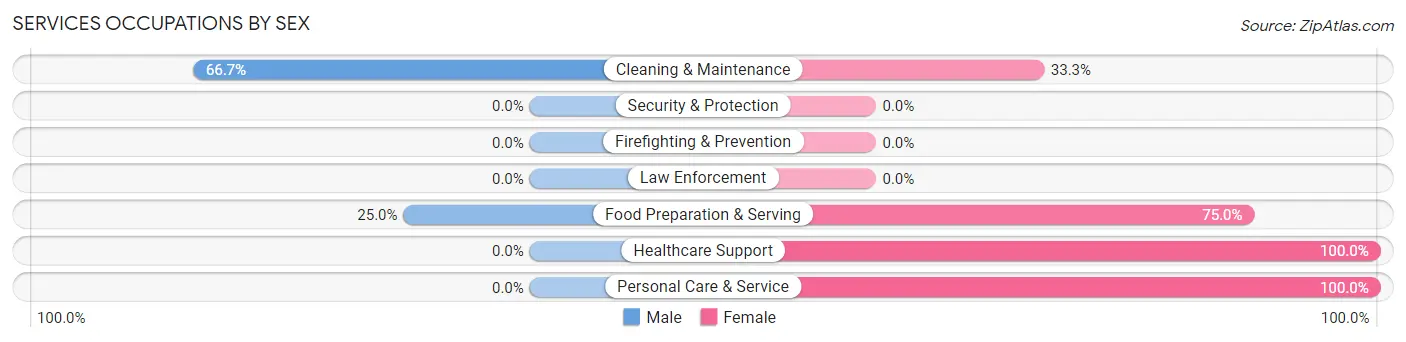
Services Occupations by Sex
Within the Services occupations in Sophia, the most male-oriented occupations are Cleaning & Maintenance (66.7%), and Food Preparation & Serving (25.0%), while the most female-oriented occupations are Healthcare Support (100.0%), Personal Care & Service (100.0%), and Food Preparation & Serving (75.0%).
| Occupation | Male | Female |
| Healthcare Support | 0 (0.0%) | 33 (100.0%) |
| Security & Protection | 0 (0.0%) | 0 (0.0%) |
| Firefighting & Prevention | 0 (0.0%) | 0 (0.0%) |
| Law Enforcement | 0 (0.0%) | 0 (0.0%) |
| Food Preparation & Serving | 13 (25.0%) | 39 (75.0%) |
| Cleaning & Maintenance | 18 (66.7%) | 9 (33.3%) |
| Personal Care & Service | 0 (0.0%) | 4 (100.0%) |
| Total (Category) | 31 (26.7%) | 85 (73.3%) |
| Total (Overall) | 341 (68.8%) | 155 (31.2%) |
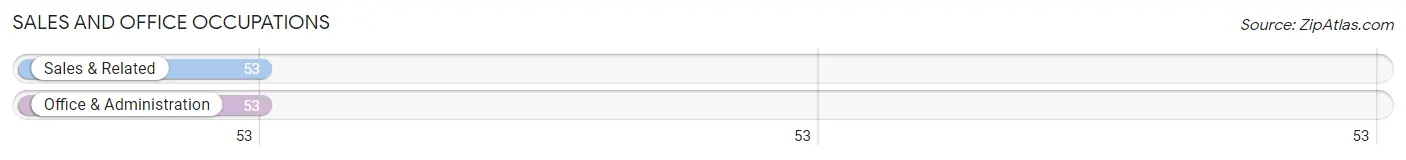
Sales and Office Occupations
The most common Sales and Office occupations in Sophia are Sales & Related (53 | 10.7%), and Office & Administration (53 | 10.7%).
Sales and Office Occupations by Sex
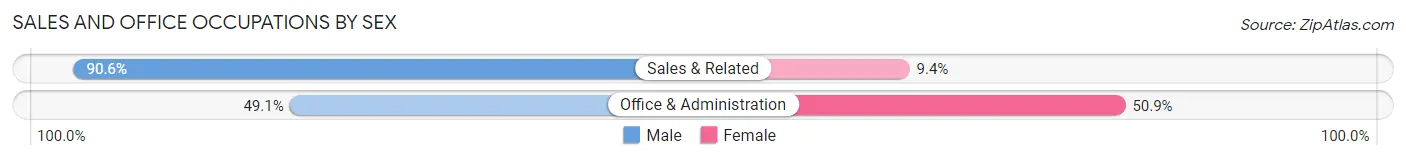
| Occupation | Male | Female |
| Sales & Related | 48 (90.6%) | 5 (9.4%) |
| Office & Administration | 26 (49.1%) | 27 (50.9%) |
| Total (Category) | 74 (69.8%) | 32 (30.2%) |
| Total (Overall) | 341 (68.8%) | 155 (31.2%) |
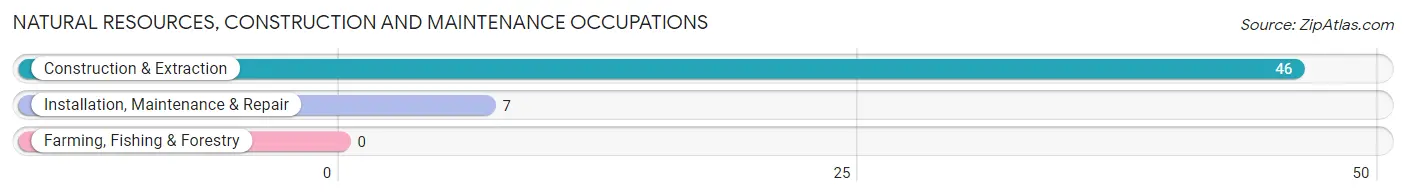
Natural Resources, Construction and Maintenance Occupations
The most common Natural Resources, Construction and Maintenance occupations in Sophia are Construction & Extraction (46 | 9.3%), and Installation, Maintenance & Repair (7 | 1.4%).
Natural Resources, Construction and Maintenance Occupations by Sex
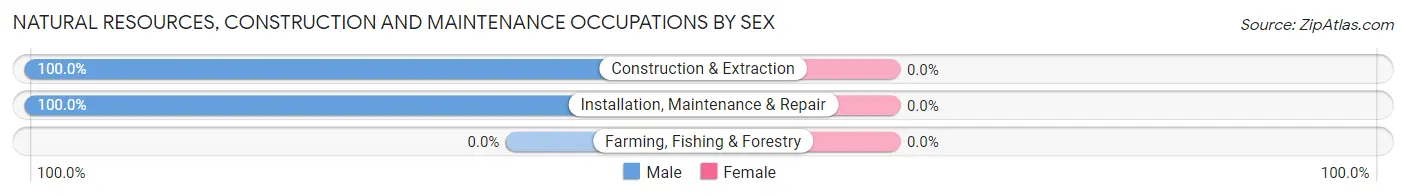
| Occupation | Male | Female |
| Farming, Fishing & Forestry | 0 (0.0%) | 0 (0.0%) |
| Construction & Extraction | 46 (100.0%) | 0 (0.0%) |
| Installation, Maintenance & Repair | 7 (100.0%) | 0 (0.0%) |
| Total (Category) | 53 (100.0%) | 0 (0.0%) |
| Total (Overall) | 341 (68.8%) | 155 (31.2%) |
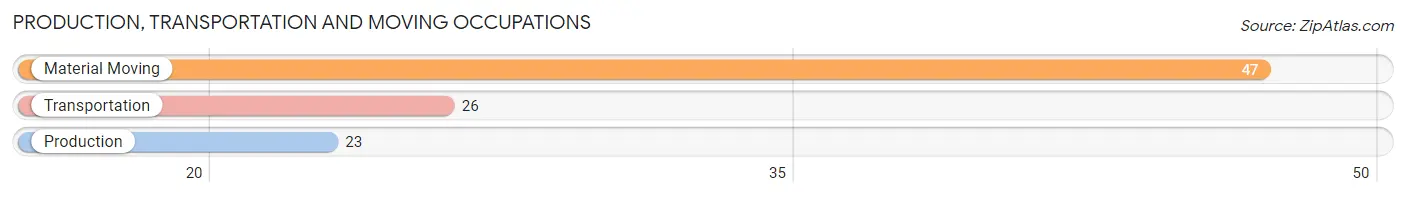
Production, Transportation and Moving Occupations
The most common Production, Transportation and Moving occupations in Sophia are Material Moving (47 | 9.5%), Transportation (26 | 5.2%), and Production (23 | 4.6%).
Production, Transportation and Moving Occupations by Sex
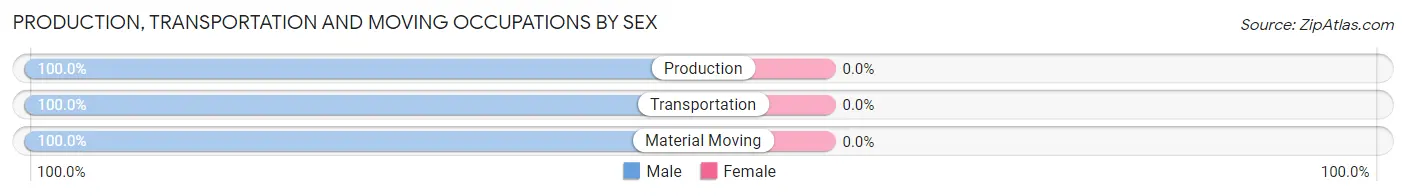
| Occupation | Male | Female |
| Production | 23 (100.0%) | 0 (0.0%) |
| Transportation | 26 (100.0%) | 0 (0.0%) |
| Material Moving | 47 (100.0%) | 0 (0.0%) |
| Total (Category) | 96 (100.0%) | 0 (0.0%) |
| Total (Overall) | 341 (68.8%) | 155 (31.2%) |
Employment Industries by Sex in Sophia
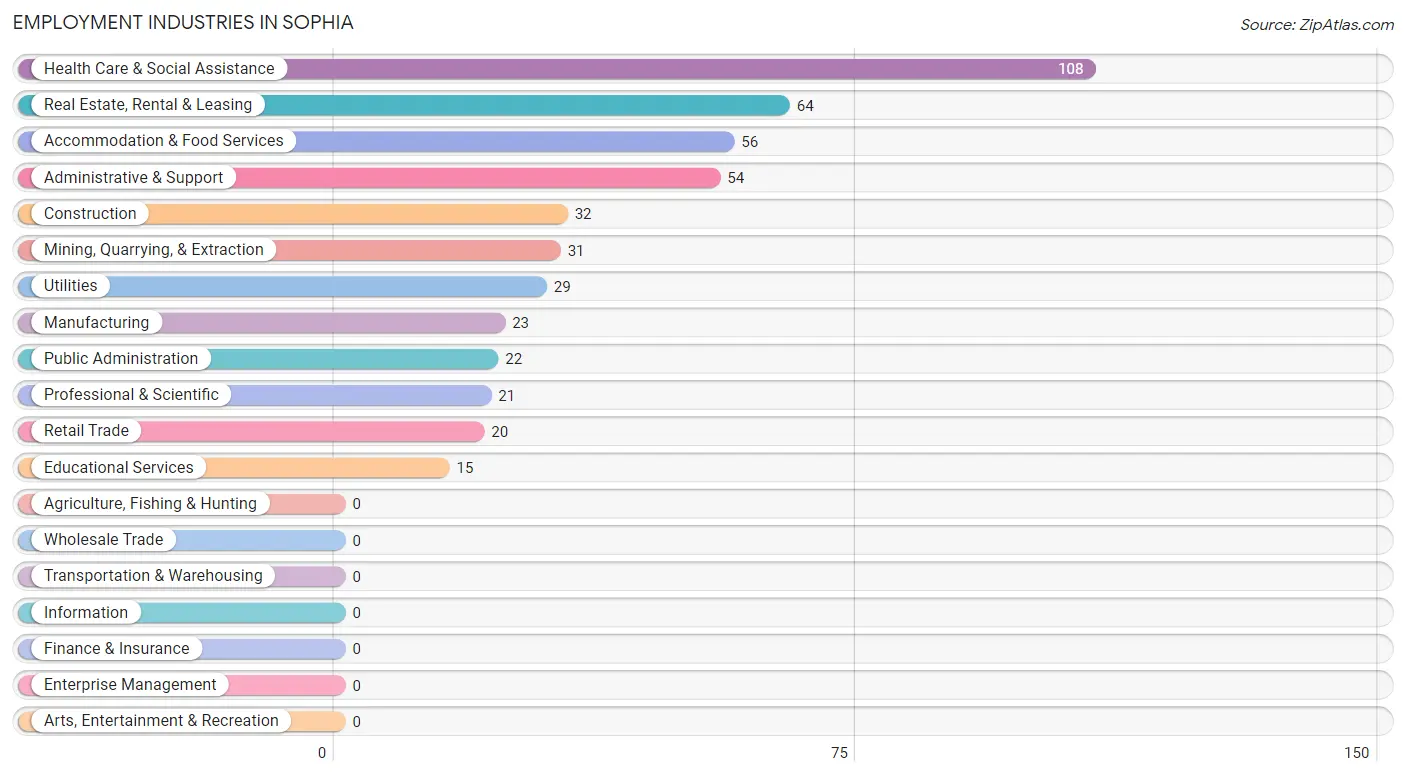
Employment Industries in Sophia
The major employment industries in Sophia include Health Care & Social Assistance (108 | 21.8%), Real Estate, Rental & Leasing (64 | 12.9%), Accommodation & Food Services (56 | 11.3%), Administrative & Support (54 | 10.9%), and Construction (32 | 6.5%).
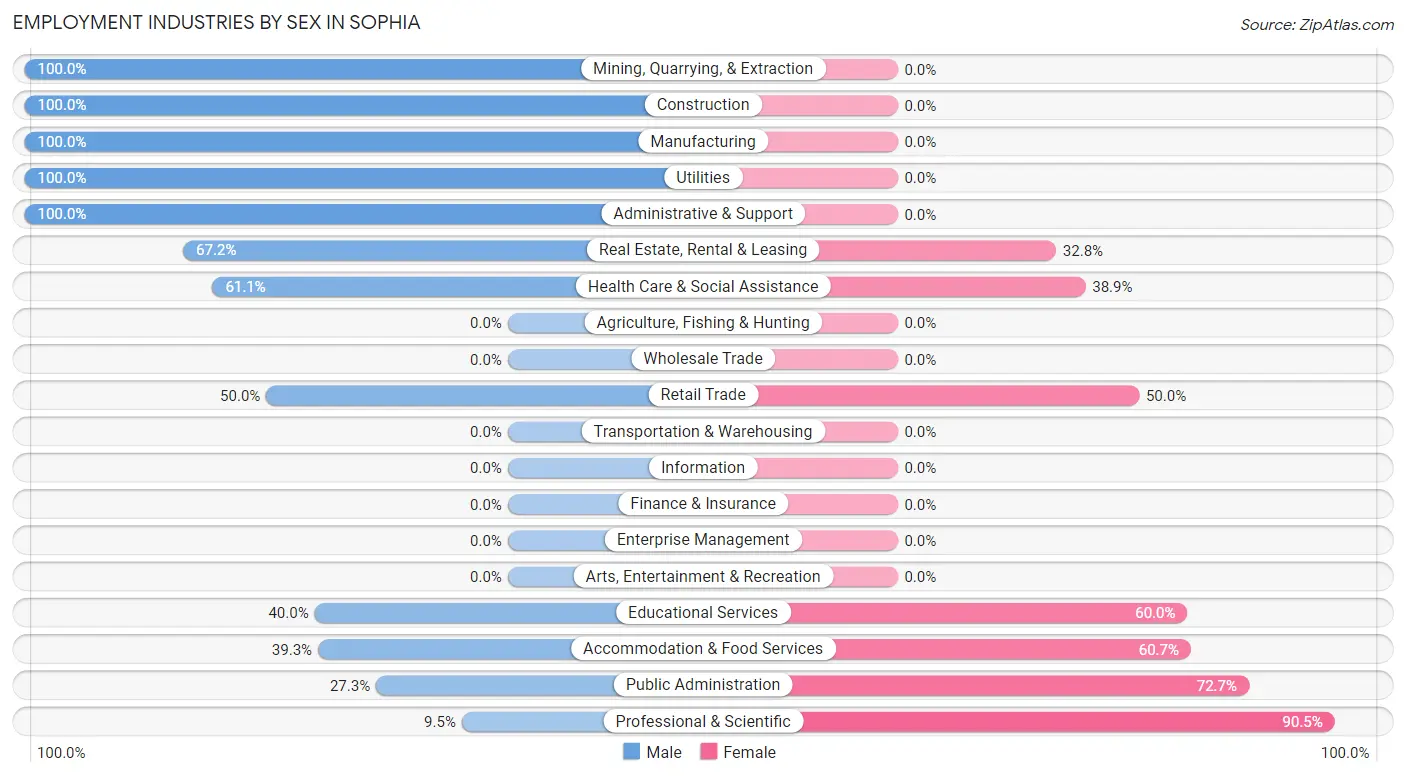
Employment Industries by Sex in Sophia
The Sophia industries that see more men than women are Mining, Quarrying, & Extraction (100.0%), Construction (100.0%), and Manufacturing (100.0%), whereas the industries that tend to have a higher number of women are Professional & Scientific (90.5%), Public Administration (72.7%), and Accommodation & Food Services (60.7%).
| Industry | Male | Female |
| Agriculture, Fishing & Hunting | 0 (0.0%) | 0 (0.0%) |
| Mining, Quarrying, & Extraction | 31 (100.0%) | 0 (0.0%) |
| Construction | 32 (100.0%) | 0 (0.0%) |
| Manufacturing | 23 (100.0%) | 0 (0.0%) |
| Wholesale Trade | 0 (0.0%) | 0 (0.0%) |
| Retail Trade | 10 (50.0%) | 10 (50.0%) |
| Transportation & Warehousing | 0 (0.0%) | 0 (0.0%) |
| Utilities | 29 (100.0%) | 0 (0.0%) |
| Information | 0 (0.0%) | 0 (0.0%) |
| Finance & Insurance | 0 (0.0%) | 0 (0.0%) |
| Real Estate, Rental & Leasing | 43 (67.2%) | 21 (32.8%) |
| Professional & Scientific | 2 (9.5%) | 19 (90.5%) |
| Enterprise Management | 0 (0.0%) | 0 (0.0%) |
| Administrative & Support | 54 (100.0%) | 0 (0.0%) |
| Educational Services | 6 (40.0%) | 9 (60.0%) |
| Health Care & Social Assistance | 66 (61.1%) | 42 (38.9%) |
| Arts, Entertainment & Recreation | 0 (0.0%) | 0 (0.0%) |
| Accommodation & Food Services | 22 (39.3%) | 34 (60.7%) |
| Public Administration | 6 (27.3%) | 16 (72.7%) |
| Total | 341 (68.8%) | 155 (31.2%) |
Education in Sophia
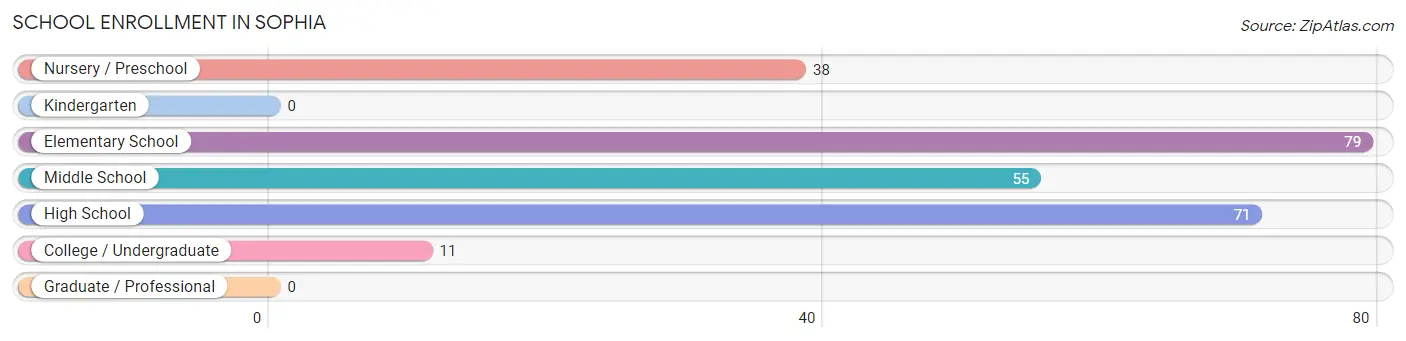
School Enrollment in Sophia
The most common levels of schooling among the 254 students in Sophia are elementary school (79 | 31.1%), high school (71 | 28.0%), and middle school (55 | 21.6%).
| School Level | # Students | % Students |
| Nursery / Preschool | 38 | 15.0% |
| Kindergarten | 0 | 0.0% |
| Elementary School | 79 | 31.1% |
| Middle School | 55 | 21.6% |
| High School | 71 | 28.0% |
| College / Undergraduate | 11 | 4.3% |
| Graduate / Professional | 0 | 0.0% |
| Total | 254 | 100.0% |
School Enrollment by Age by Funding Source in Sophia
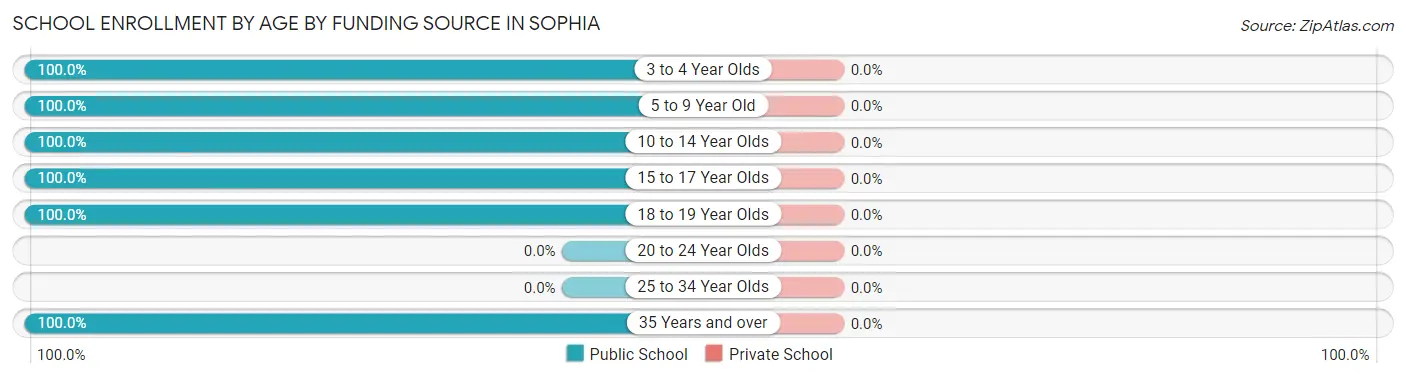
| Age Bracket | Public School | Private School |
| 3 to 4 Year Olds | 38 (100.0%) | 0 (0.0%) |
| 5 to 9 Year Old | 79 (100.0%) | 0 (0.0%) |
| 10 to 14 Year Olds | 55 (100.0%) | 0 (0.0%) |
| 15 to 17 Year Olds | 37 (100.0%) | 0 (0.0%) |
| 18 to 19 Year Olds | 34 (100.0%) | 0 (0.0%) |
| 20 to 24 Year Olds | 0 (0.0%) | 0 (0.0%) |
| 25 to 34 Year Olds | 0 (0.0%) | 0 (0.0%) |
| 35 Years and over | 11 (100.0%) | 0 (0.0%) |
| Total | 254 (100.0%) | 0 (0.0%) |
Educational Attainment by Field of Study in Sophia
Science & technology (35 | 29.2%), education (31 | 25.8%), literature & languages (22 | 18.3%), liberal arts & history (17 | 14.2%), and bio, nature & agricultural (13 | 10.8%) are the most common fields of study among 120 individuals in Sophia who have obtained a bachelor's degree or higher.
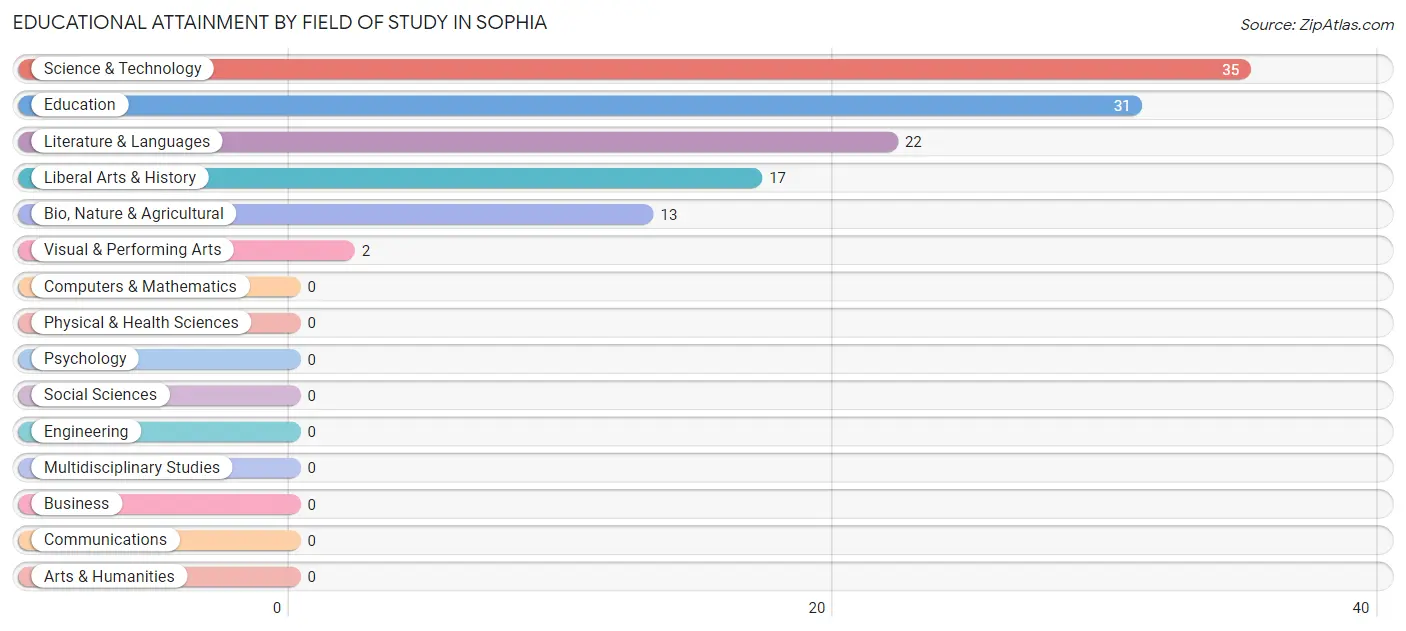
| Field of Study | # Graduates | % Graduates |
| Computers & Mathematics | 0 | 0.0% |
| Bio, Nature & Agricultural | 13 | 10.8% |
| Physical & Health Sciences | 0 | 0.0% |
| Psychology | 0 | 0.0% |
| Social Sciences | 0 | 0.0% |
| Engineering | 0 | 0.0% |
| Multidisciplinary Studies | 0 | 0.0% |
| Science & Technology | 35 | 29.2% |
| Business | 0 | 0.0% |
| Education | 31 | 25.8% |
| Literature & Languages | 22 | 18.3% |
| Liberal Arts & History | 17 | 14.2% |
| Visual & Performing Arts | 2 | 1.7% |
| Communications | 0 | 0.0% |
| Arts & Humanities | 0 | 0.0% |
| Total | 120 | 100.0% |
Transportation & Commute in Sophia
Vehicle Availability by Sex in Sophia
The most prevalent vehicle ownership categories in Sophia are males with 2 vehicles (149, accounting for 43.7%) and females with 2 vehicles (100, making up 96.1%).
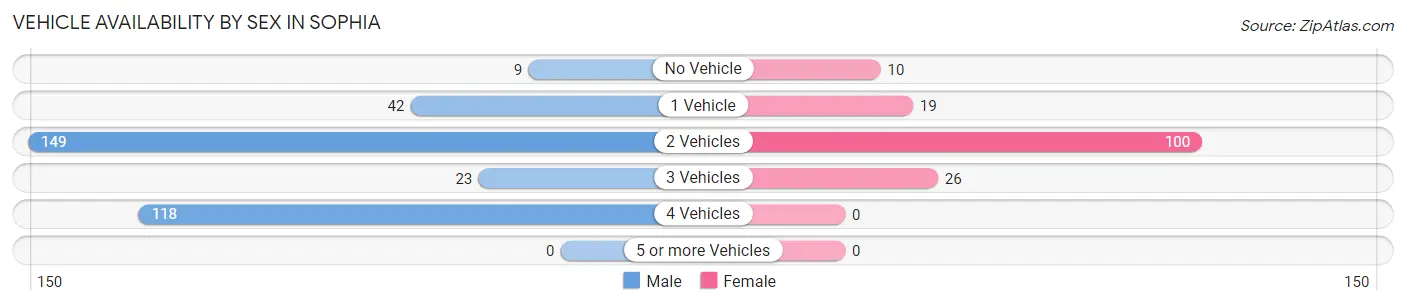
| Vehicles Available | Male | Female |
| No Vehicle | 9 (2.6%) | 10 (6.5%) |
| 1 Vehicle | 42 (12.3%) | 19 (12.3%) |
| 2 Vehicles | 149 (43.7%) | 100 (64.5%) |
| 3 Vehicles | 23 (6.7%) | 26 (16.8%) |
| 4 Vehicles | 118 (34.6%) | 0 (0.0%) |
| 5 or more Vehicles | 0 (0.0%) | 0 (0.0%) |
| Total | 341 (100.0%) | 155 (100.0%) |
Commute Time in Sophia
The most frequently occuring commute durations in Sophia are 15 to 19 minutes (107 commuters, 23.5%), 10 to 14 minutes (59 commuters, 12.9%), and 25 to 29 minutes (58 commuters, 12.7%).
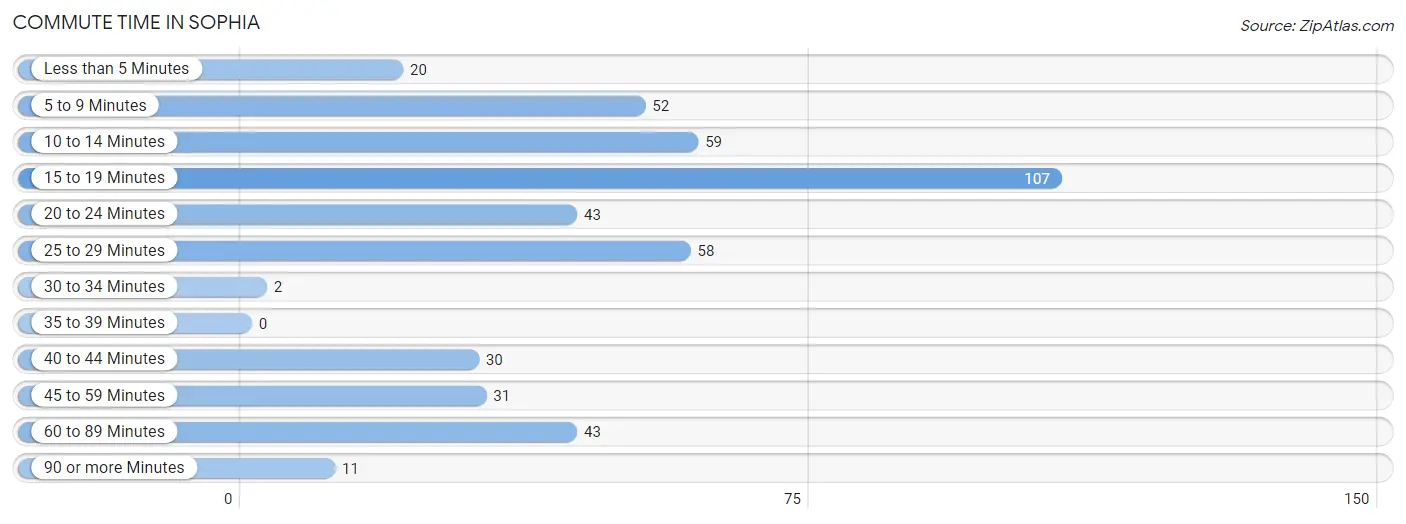
| Commute Time | # Commuters | % Commuters |
| Less than 5 Minutes | 20 | 4.4% |
| 5 to 9 Minutes | 52 | 11.4% |
| 10 to 14 Minutes | 59 | 12.9% |
| 15 to 19 Minutes | 107 | 23.5% |
| 20 to 24 Minutes | 43 | 9.4% |
| 25 to 29 Minutes | 58 | 12.7% |
| 30 to 34 Minutes | 2 | 0.4% |
| 35 to 39 Minutes | 0 | 0.0% |
| 40 to 44 Minutes | 30 | 6.6% |
| 45 to 59 Minutes | 31 | 6.8% |
| 60 to 89 Minutes | 43 | 9.4% |
| 90 or more Minutes | 11 | 2.4% |
Commute Time by Sex in Sophia
The most common commute times in Sophia are 15 to 19 minutes (98 commuters, 28.7%) for males and 25 to 29 minutes (52 commuters, 45.2%) for females.
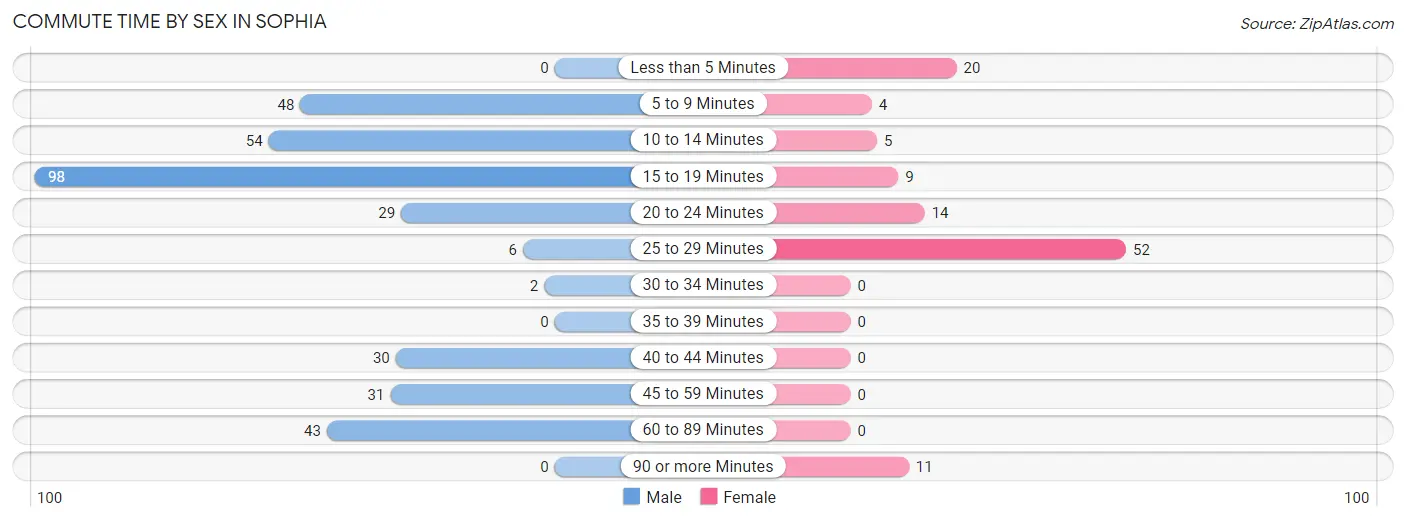
| Commute Time | Male | Female |
| Less than 5 Minutes | 0 (0.0%) | 20 (17.4%) |
| 5 to 9 Minutes | 48 (14.1%) | 4 (3.5%) |
| 10 to 14 Minutes | 54 (15.8%) | 5 (4.3%) |
| 15 to 19 Minutes | 98 (28.7%) | 9 (7.8%) |
| 20 to 24 Minutes | 29 (8.5%) | 14 (12.2%) |
| 25 to 29 Minutes | 6 (1.8%) | 52 (45.2%) |
| 30 to 34 Minutes | 2 (0.6%) | 0 (0.0%) |
| 35 to 39 Minutes | 0 (0.0%) | 0 (0.0%) |
| 40 to 44 Minutes | 30 (8.8%) | 0 (0.0%) |
| 45 to 59 Minutes | 31 (9.1%) | 0 (0.0%) |
| 60 to 89 Minutes | 43 (12.6%) | 0 (0.0%) |
| 90 or more Minutes | 0 (0.0%) | 11 (9.6%) |
Time of Departure to Work by Sex in Sophia
The most frequent times of departure to work in Sophia are 7:00 AM to 7:29 AM (90, 26.4%) for males and 12:00 PM to 3:59 PM (36, 31.3%) for females.
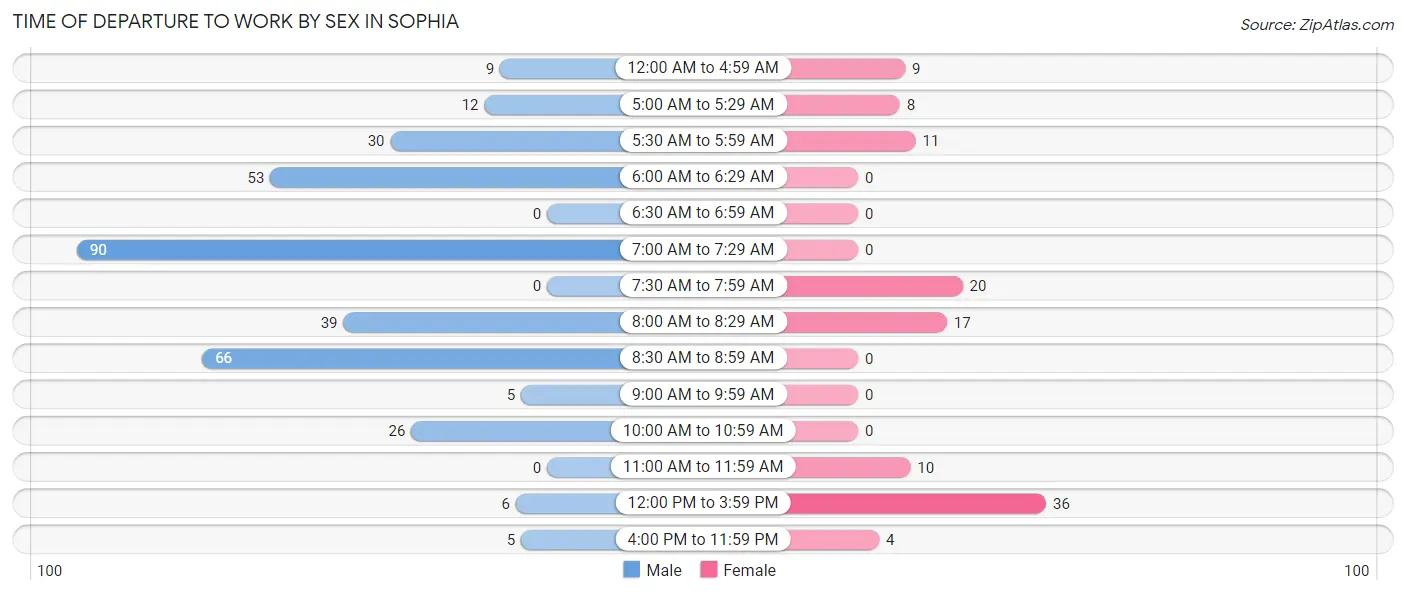
| Time of Departure | Male | Female |
| 12:00 AM to 4:59 AM | 9 (2.6%) | 9 (7.8%) |
| 5:00 AM to 5:29 AM | 12 (3.5%) | 8 (7.0%) |
| 5:30 AM to 5:59 AM | 30 (8.8%) | 11 (9.6%) |
| 6:00 AM to 6:29 AM | 53 (15.5%) | 0 (0.0%) |
| 6:30 AM to 6:59 AM | 0 (0.0%) | 0 (0.0%) |
| 7:00 AM to 7:29 AM | 90 (26.4%) | 0 (0.0%) |
| 7:30 AM to 7:59 AM | 0 (0.0%) | 20 (17.4%) |
| 8:00 AM to 8:29 AM | 39 (11.4%) | 17 (14.8%) |
| 8:30 AM to 8:59 AM | 66 (19.4%) | 0 (0.0%) |
| 9:00 AM to 9:59 AM | 5 (1.5%) | 0 (0.0%) |
| 10:00 AM to 10:59 AM | 26 (7.6%) | 0 (0.0%) |
| 11:00 AM to 11:59 AM | 0 (0.0%) | 10 (8.7%) |
| 12:00 PM to 3:59 PM | 6 (1.8%) | 36 (31.3%) |
| 4:00 PM to 11:59 PM | 5 (1.5%) | 4 (3.5%) |
| Total | 341 (100.0%) | 115 (100.0%) |
Housing Occupancy in Sophia
Occupancy by Ownership in Sophia
Of the total 775 dwellings in Sophia, owner-occupied units account for 416 (53.7%), while renter-occupied units make up 359 (46.3%).
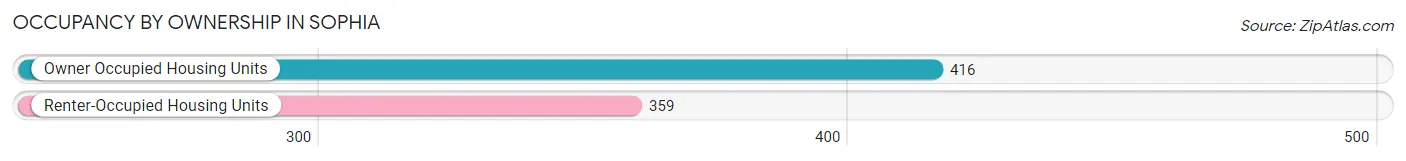
| Occupancy | # Housing Units | % Housing Units |
| Owner Occupied Housing Units | 416 | 53.7% |
| Renter-Occupied Housing Units | 359 | 46.3% |
| Total Occupied Housing Units | 775 | 100.0% |
Occupancy by Household Size in Sophia
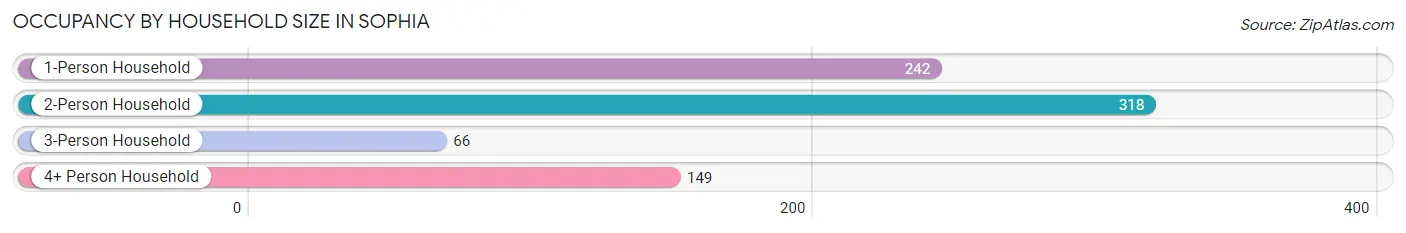
| Household Size | # Housing Units | % Housing Units |
| 1-Person Household | 242 | 31.2% |
| 2-Person Household | 318 | 41.0% |
| 3-Person Household | 66 | 8.5% |
| 4+ Person Household | 149 | 19.2% |
| Total Housing Units | 775 | 100.0% |
Occupancy by Ownership by Household Size in Sophia
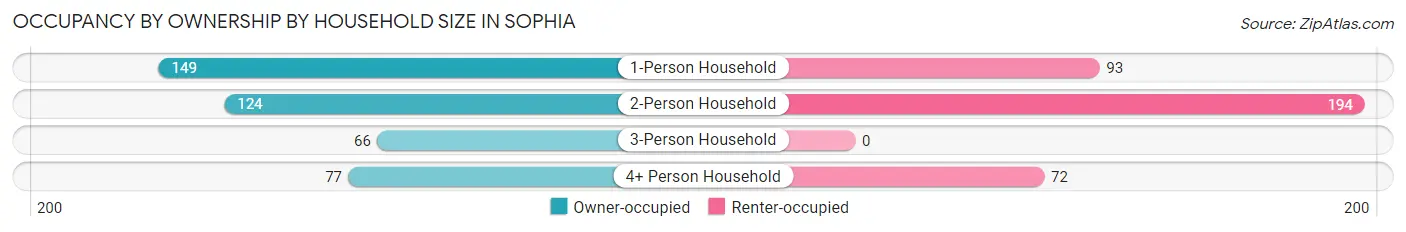
| Household Size | Owner-occupied | Renter-occupied |
| 1-Person Household | 149 (61.6%) | 93 (38.4%) |
| 2-Person Household | 124 (39.0%) | 194 (61.0%) |
| 3-Person Household | 66 (100.0%) | 0 (0.0%) |
| 4+ Person Household | 77 (51.7%) | 72 (48.3%) |
| Total Housing Units | 416 (53.7%) | 359 (46.3%) |
Occupancy by Educational Attainment in Sophia
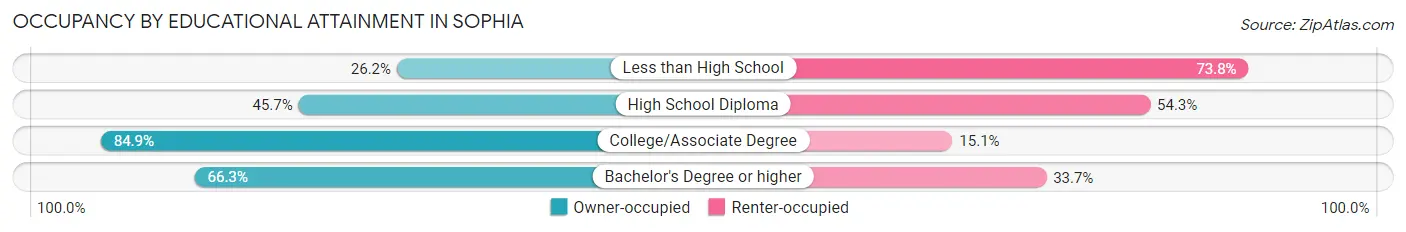
| Household Size | Owner-occupied | Renter-occupied |
| Less than High School | 60 (26.2%) | 169 (73.8%) |
| High School Diploma | 106 (45.7%) | 126 (54.3%) |
| College/Associate Degree | 191 (84.9%) | 34 (15.1%) |
| Bachelor's Degree or higher | 59 (66.3%) | 30 (33.7%) |
Occupancy by Age of Householder in Sophia
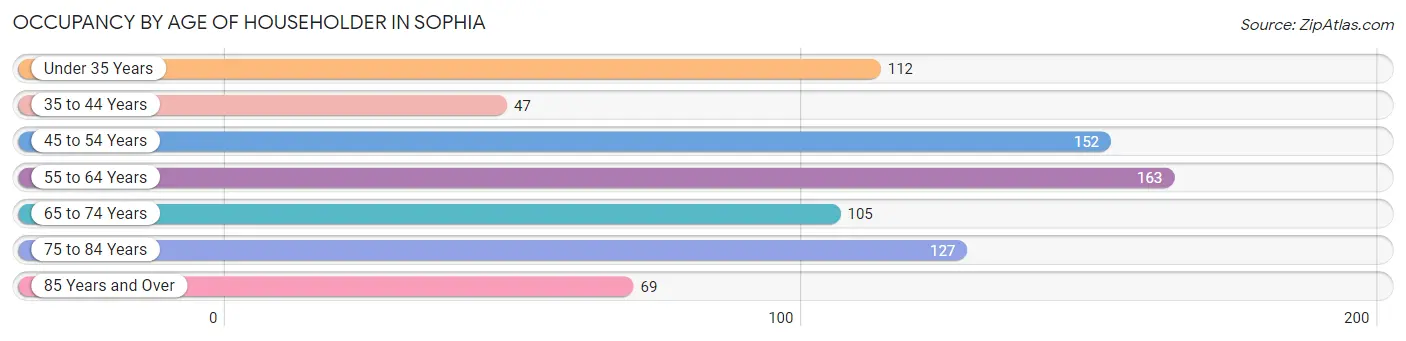
| Age Bracket | # Households | % Households |
| Under 35 Years | 112 | 14.4% |
| 35 to 44 Years | 47 | 6.1% |
| 45 to 54 Years | 152 | 19.6% |
| 55 to 64 Years | 163 | 21.0% |
| 65 to 74 Years | 105 | 13.6% |
| 75 to 84 Years | 127 | 16.4% |
| 85 Years and Over | 69 | 8.9% |
| Total | 775 | 100.0% |
Housing Finances in Sophia
Median Income by Occupancy in Sophia
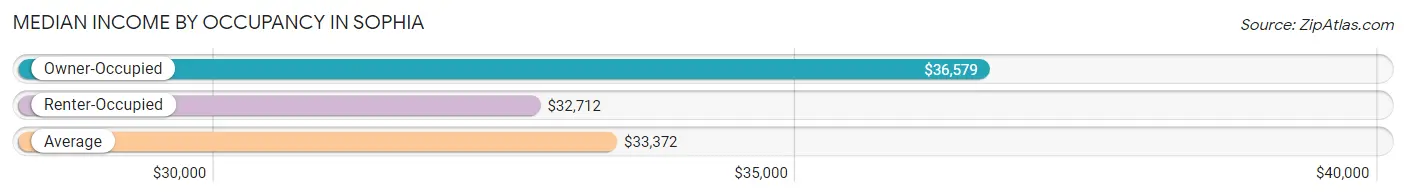
| Occupancy Type | # Households | Median Income |
| Owner-Occupied | 416 (53.7%) | $36,579 |
| Renter-Occupied | 359 (46.3%) | $32,712 |
| Average | 775 (100.0%) | $33,372 |
Occupancy by Householder Income Bracket in Sophia
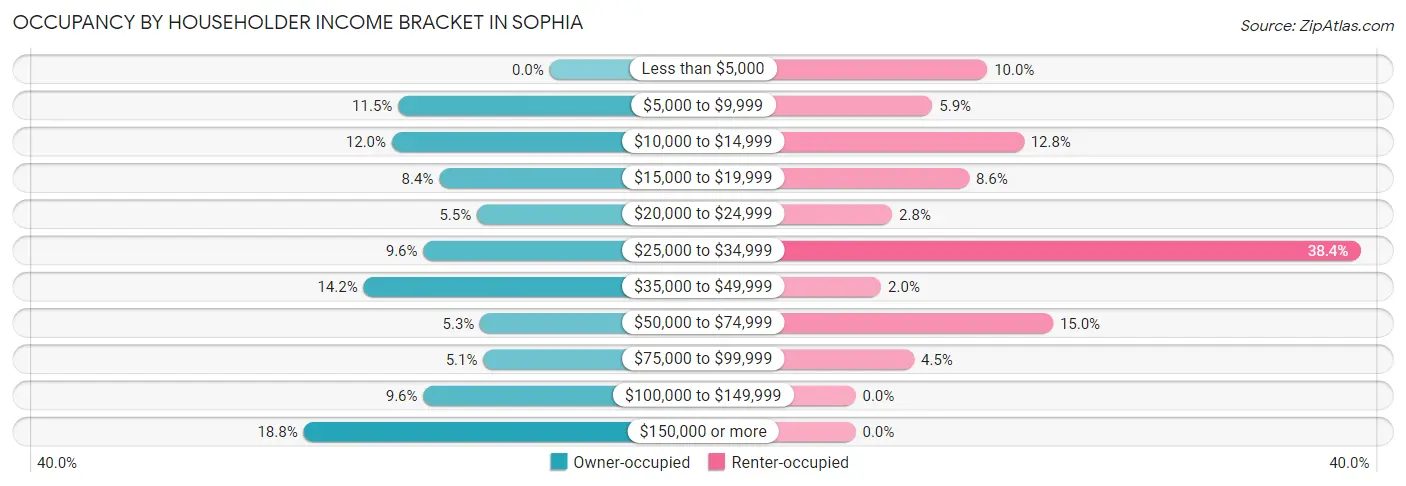
| Income Bracket | Owner-occupied | Renter-occupied |
| Less than $5,000 | 0 (0.0%) | 36 (10.0%) |
| $5,000 to $9,999 | 48 (11.5%) | 21 (5.9%) |
| $10,000 to $14,999 | 50 (12.0%) | 46 (12.8%) |
| $15,000 to $19,999 | 35 (8.4%) | 31 (8.6%) |
| $20,000 to $24,999 | 23 (5.5%) | 10 (2.8%) |
| $25,000 to $34,999 | 40 (9.6%) | 138 (38.4%) |
| $35,000 to $49,999 | 59 (14.2%) | 7 (1.9%) |
| $50,000 to $74,999 | 22 (5.3%) | 54 (15.0%) |
| $75,000 to $99,999 | 21 (5.1%) | 16 (4.5%) |
| $100,000 to $149,999 | 40 (9.6%) | 0 (0.0%) |
| $150,000 or more | 78 (18.8%) | 0 (0.0%) |
| Total | 416 (100.0%) | 359 (100.0%) |
Monthly Housing Cost Tiers in Sophia
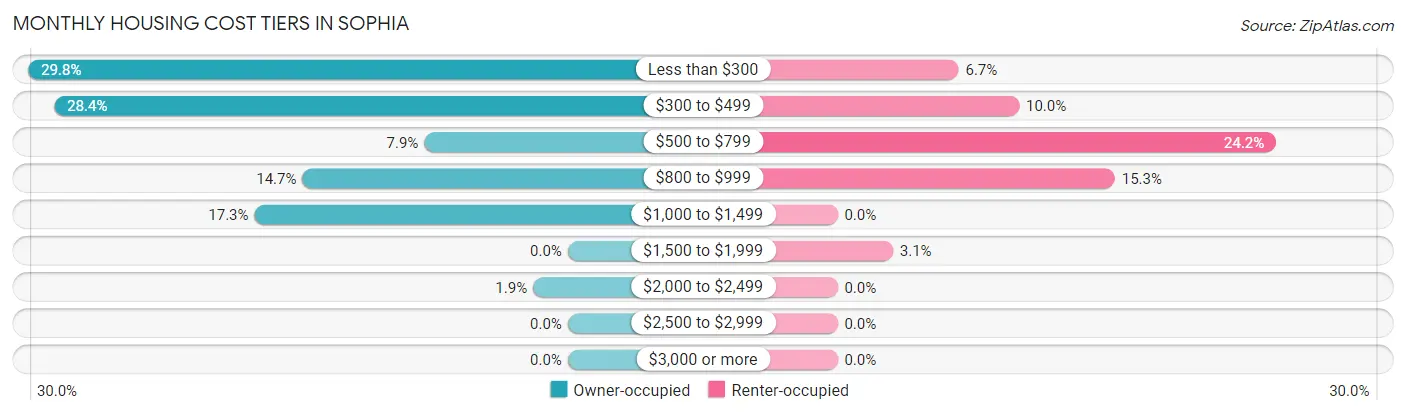
| Monthly Cost | Owner-occupied | Renter-occupied |
| Less than $300 | 124 (29.8%) | 24 (6.7%) |
| $300 to $499 | 118 (28.4%) | 36 (10.0%) |
| $500 to $799 | 33 (7.9%) | 87 (24.2%) |
| $800 to $999 | 61 (14.7%) | 55 (15.3%) |
| $1,000 to $1,499 | 72 (17.3%) | 0 (0.0%) |
| $1,500 to $1,999 | 0 (0.0%) | 11 (3.1%) |
| $2,000 to $2,499 | 8 (1.9%) | 0 (0.0%) |
| $2,500 to $2,999 | 0 (0.0%) | 0 (0.0%) |
| $3,000 or more | 0 (0.0%) | 0 (0.0%) |
| Total | 416 (100.0%) | 359 (100.0%) |
Physical Housing Characteristics in Sophia
Housing Structures in Sophia
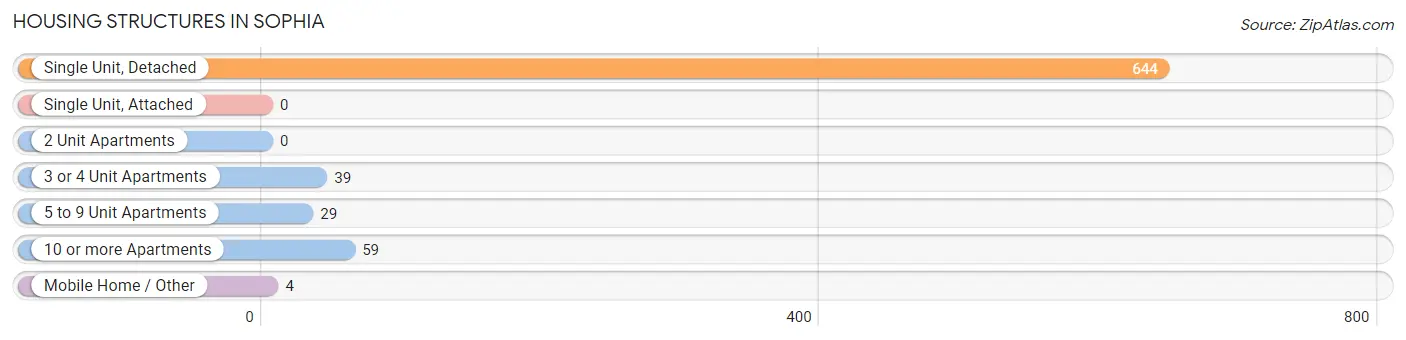
| Structure Type | # Housing Units | % Housing Units |
| Single Unit, Detached | 644 | 83.1% |
| Single Unit, Attached | 0 | 0.0% |
| 2 Unit Apartments | 0 | 0.0% |
| 3 or 4 Unit Apartments | 39 | 5.0% |
| 5 to 9 Unit Apartments | 29 | 3.7% |
| 10 or more Apartments | 59 | 7.6% |
| Mobile Home / Other | 4 | 0.5% |
| Total | 775 | 100.0% |
Housing Structures by Occupancy in Sophia
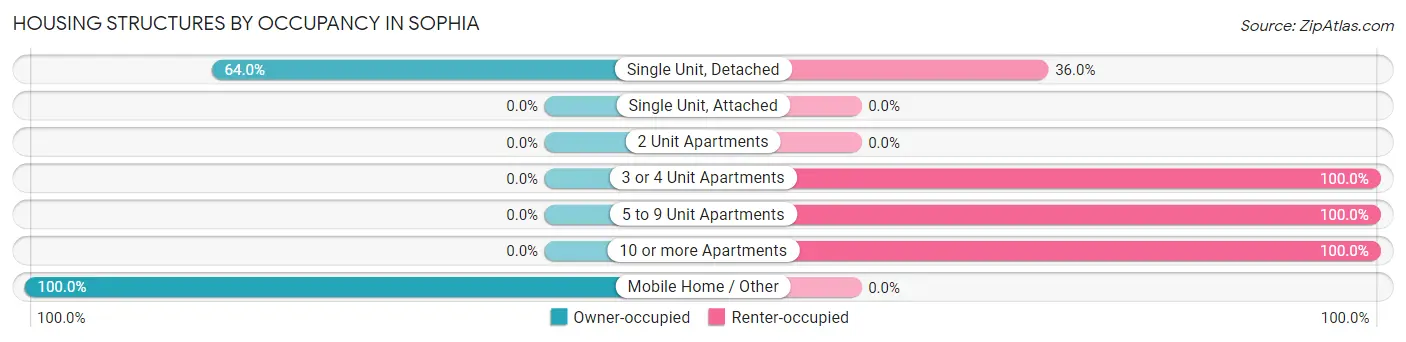
| Structure Type | Owner-occupied | Renter-occupied |
| Single Unit, Detached | 412 (64.0%) | 232 (36.0%) |
| Single Unit, Attached | 0 (0.0%) | 0 (0.0%) |
| 2 Unit Apartments | 0 (0.0%) | 0 (0.0%) |
| 3 or 4 Unit Apartments | 0 (0.0%) | 39 (100.0%) |
| 5 to 9 Unit Apartments | 0 (0.0%) | 29 (100.0%) |
| 10 or more Apartments | 0 (0.0%) | 59 (100.0%) |
| Mobile Home / Other | 4 (100.0%) | 0 (0.0%) |
| Total | 416 (53.7%) | 359 (46.3%) |
Housing Structures by Number of Rooms in Sophia
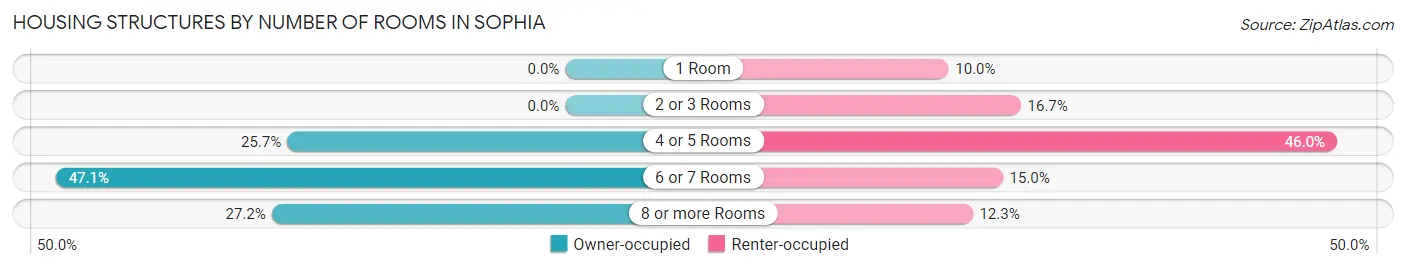
| Number of Rooms | Owner-occupied | Renter-occupied |
| 1 Room | 0 (0.0%) | 36 (10.0%) |
| 2 or 3 Rooms | 0 (0.0%) | 60 (16.7%) |
| 4 or 5 Rooms | 107 (25.7%) | 165 (46.0%) |
| 6 or 7 Rooms | 196 (47.1%) | 54 (15.0%) |
| 8 or more Rooms | 113 (27.2%) | 44 (12.3%) |
| Total | 416 (100.0%) | 359 (100.0%) |
Housing Structure by Heating Type in Sophia
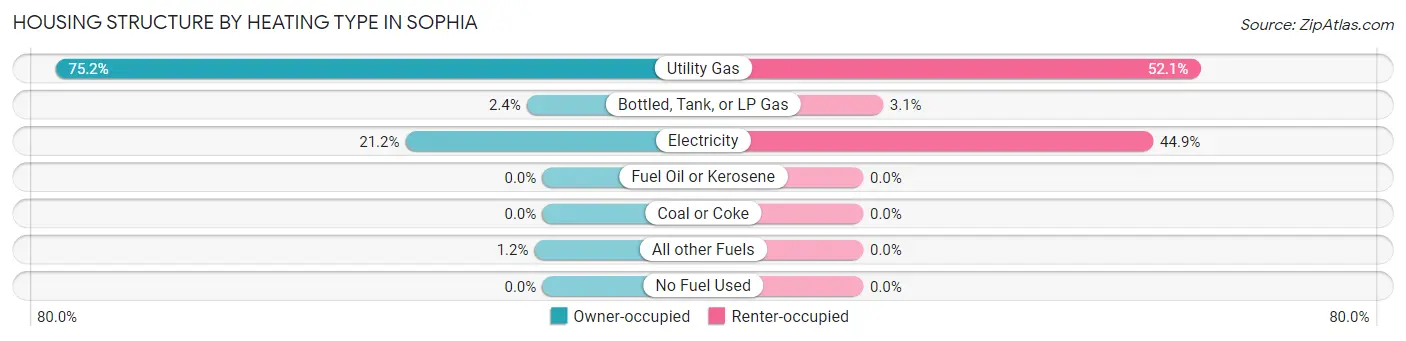
| Heating Type | Owner-occupied | Renter-occupied |
| Utility Gas | 313 (75.2%) | 187 (52.1%) |
| Bottled, Tank, or LP Gas | 10 (2.4%) | 11 (3.1%) |
| Electricity | 88 (21.1%) | 161 (44.9%) |
| Fuel Oil or Kerosene | 0 (0.0%) | 0 (0.0%) |
| Coal or Coke | 0 (0.0%) | 0 (0.0%) |
| All other Fuels | 5 (1.2%) | 0 (0.0%) |
| No Fuel Used | 0 (0.0%) | 0 (0.0%) |
| Total | 416 (100.0%) | 359 (100.0%) |
Household Vehicle Usage in Sophia
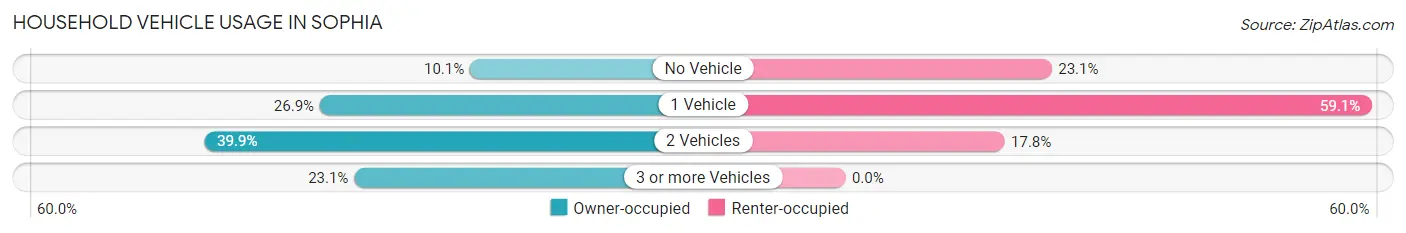
| Vehicles per Household | Owner-occupied | Renter-occupied |
| No Vehicle | 42 (10.1%) | 83 (23.1%) |
| 1 Vehicle | 112 (26.9%) | 212 (59.1%) |
| 2 Vehicles | 166 (39.9%) | 64 (17.8%) |
| 3 or more Vehicles | 96 (23.1%) | 0 (0.0%) |
| Total | 416 (100.0%) | 359 (100.0%) |
Real Estate & Mortgages in Sophia
Real Estate and Mortgage Overview in Sophia
| Characteristic | Without Mortgage | With Mortgage |
| Housing Units | 242 | 174 |
| Median Property Value | $98,100 | $129,800 |
| Median Household Income | $17,396 | $78 |
| Monthly Housing Costs | $297 | $0 |
| Real Estate Taxes | $556 | $22 |
Property Value by Mortgage Status in Sophia
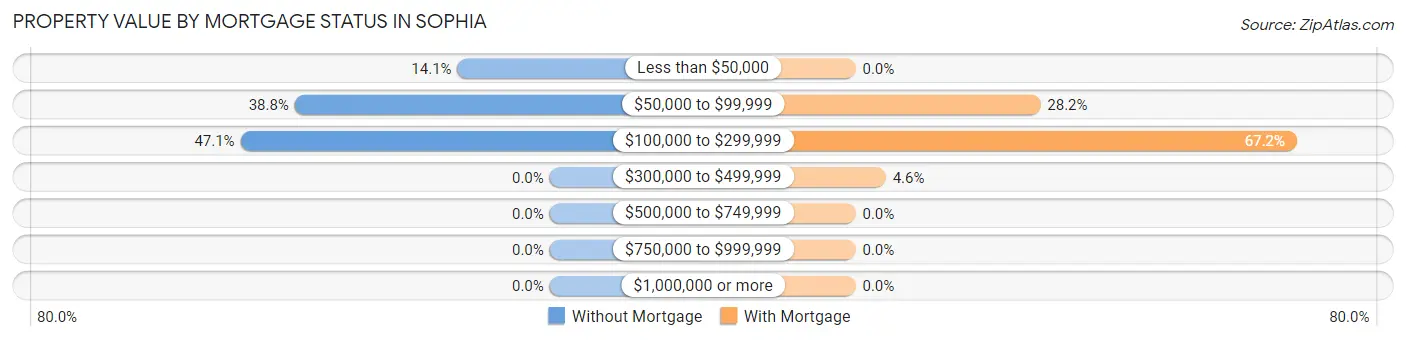
| Property Value | Without Mortgage | With Mortgage |
| Less than $50,000 | 34 (14.1%) | 0 (0.0%) |
| $50,000 to $99,999 | 94 (38.8%) | 49 (28.2%) |
| $100,000 to $299,999 | 114 (47.1%) | 117 (67.2%) |
| $300,000 to $499,999 | 0 (0.0%) | 8 (4.6%) |
| $500,000 to $749,999 | 0 (0.0%) | 0 (0.0%) |
| $750,000 to $999,999 | 0 (0.0%) | 0 (0.0%) |
| $1,000,000 or more | 0 (0.0%) | 0 (0.0%) |
| Total | 242 (100.0%) | 174 (100.0%) |
Household Income by Mortgage Status in Sophia
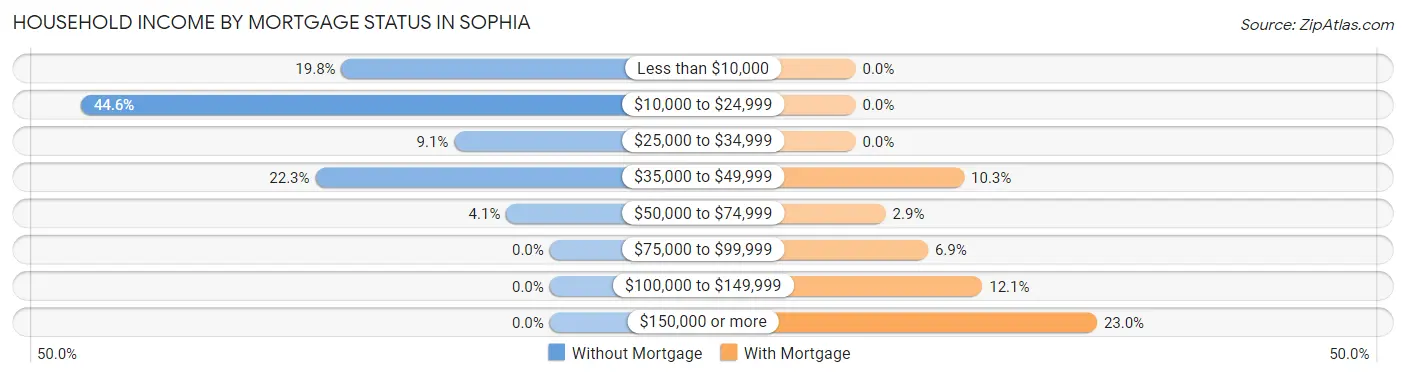
| Household Income | Without Mortgage | With Mortgage |
| Less than $10,000 | 48 (19.8%) | 0 (0.0%) |
| $10,000 to $24,999 | 108 (44.6%) | 0 (0.0%) |
| $25,000 to $34,999 | 22 (9.1%) | 0 (0.0%) |
| $35,000 to $49,999 | 54 (22.3%) | 18 (10.3%) |
| $50,000 to $74,999 | 10 (4.1%) | 5 (2.9%) |
| $75,000 to $99,999 | 0 (0.0%) | 12 (6.9%) |
| $100,000 to $149,999 | 0 (0.0%) | 21 (12.1%) |
| $150,000 or more | 0 (0.0%) | 40 (23.0%) |
| Total | 242 (100.0%) | 174 (100.0%) |
Property Value to Household Income Ratio in Sophia
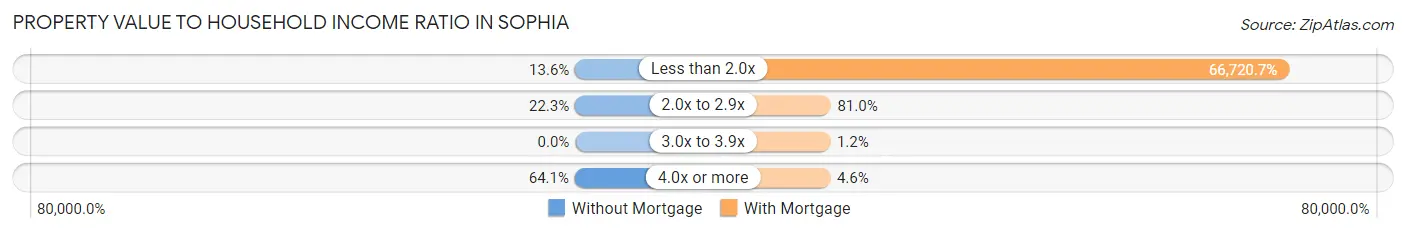
| Value-to-Income Ratio | Without Mortgage | With Mortgage |
| Less than 2.0x | 33 (13.6%) | 116,094 (66,720.7%) |
| 2.0x to 2.9x | 54 (22.3%) | 141 (81.0%) |
| 3.0x to 3.9x | 0 (0.0%) | 2 (1.1%) |
| 4.0x or more | 155 (64.0%) | 8 (4.6%) |
| Total | 242 (100.0%) | 174 (100.0%) |
Real Estate Taxes by Mortgage Status in Sophia
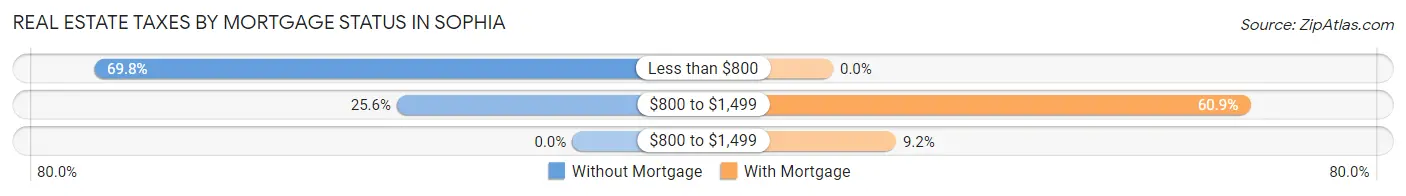
| Property Taxes | Without Mortgage | With Mortgage |
| Less than $800 | 169 (69.8%) | 0 (0.0%) |
| $800 to $1,499 | 62 (25.6%) | 106 (60.9%) |
| $800 to $1,499 | 0 (0.0%) | 16 (9.2%) |
| Total | 242 (100.0%) | 174 (100.0%) |
Health & Disability in Sophia
Health Insurance Coverage by Age in Sophia
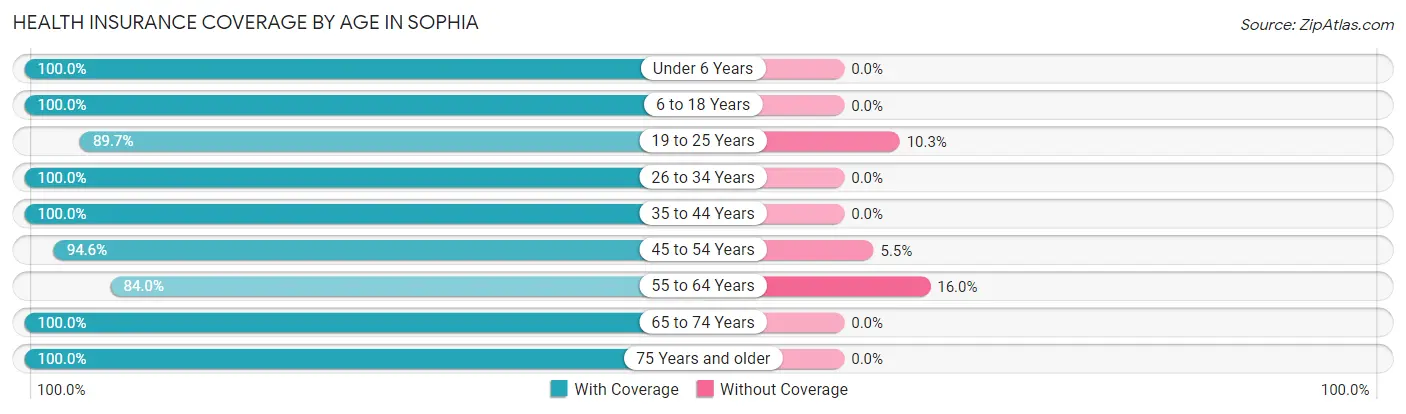
| Age Bracket | With Coverage | Without Coverage |
| Under 6 Years | 88 (100.0%) | 0 (0.0%) |
| 6 to 18 Years | 279 (100.0%) | 0 (0.0%) |
| 19 to 25 Years | 165 (89.7%) | 19 (10.3%) |
| 26 to 34 Years | 123 (100.0%) | 0 (0.0%) |
| 35 to 44 Years | 146 (100.0%) | 0 (0.0%) |
| 45 to 54 Years | 260 (94.6%) | 15 (5.4%) |
| 55 to 64 Years | 220 (84.0%) | 42 (16.0%) |
| 65 to 74 Years | 130 (100.0%) | 0 (0.0%) |
| 75 Years and older | 243 (100.0%) | 0 (0.0%) |
| Total | 1,654 (95.6%) | 76 (4.4%) |
Health Insurance Coverage by Citizenship Status in Sophia
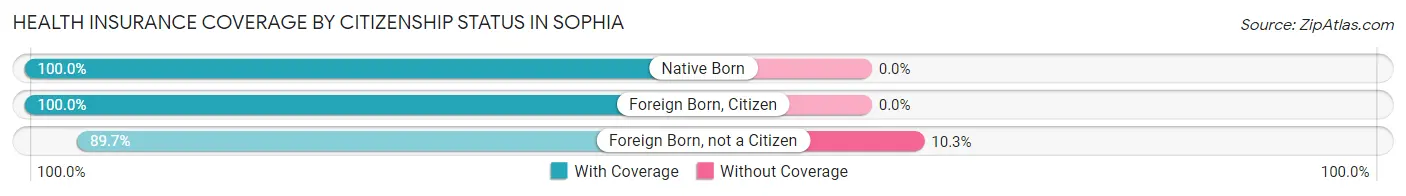
| Citizenship Status | With Coverage | Without Coverage |
| Native Born | 88 (100.0%) | 0 (0.0%) |
| Foreign Born, Citizen | 279 (100.0%) | 0 (0.0%) |
| Foreign Born, not a Citizen | 165 (89.7%) | 19 (10.3%) |
Health Insurance Coverage by Household Income in Sophia
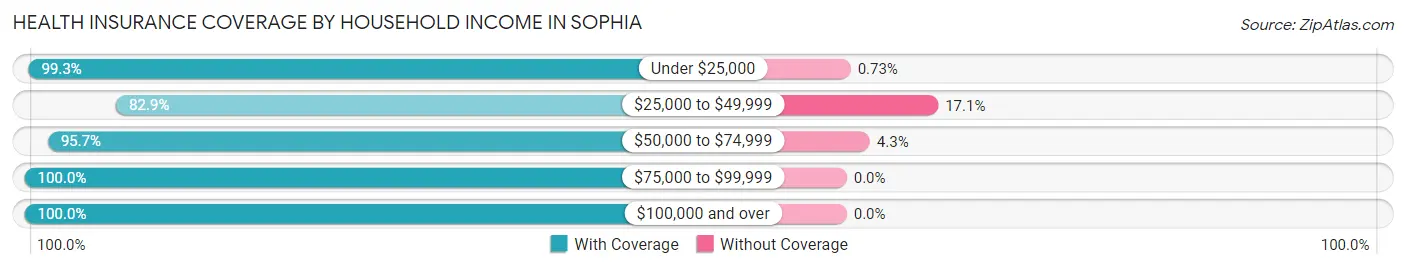
| Household Income | With Coverage | Without Coverage |
| Under $25,000 | 544 (99.3%) | 4 (0.7%) |
| $25,000 to $49,999 | 295 (82.9%) | 61 (17.1%) |
| $50,000 to $74,999 | 243 (95.7%) | 11 (4.3%) |
| $75,000 to $99,999 | 188 (100.0%) | 0 (0.0%) |
| $100,000 and over | 384 (100.0%) | 0 (0.0%) |
Public vs Private Health Insurance Coverage by Age in Sophia
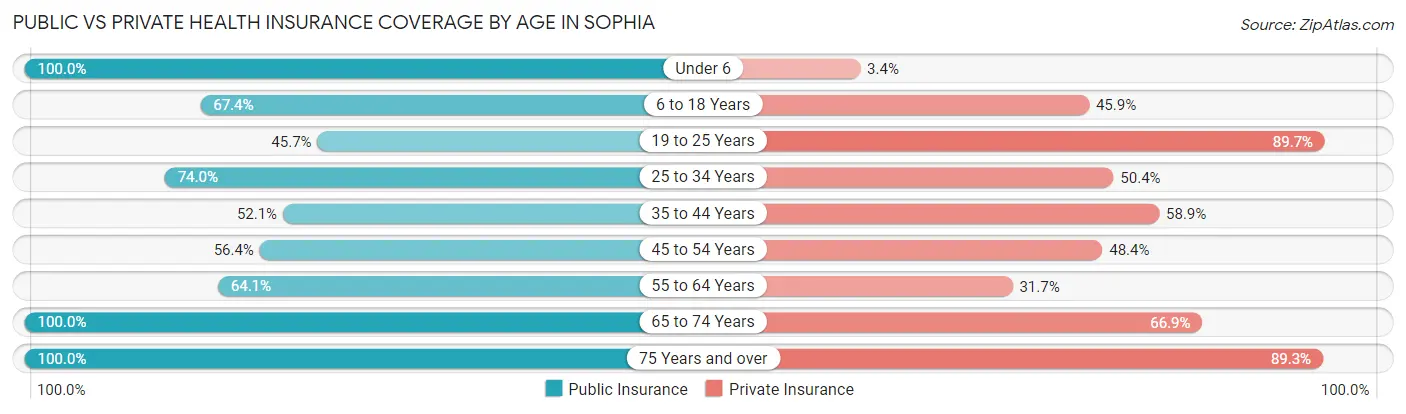
| Age Bracket | Public Insurance | Private Insurance |
| Under 6 | 88 (100.0%) | 3 (3.4%) |
| 6 to 18 Years | 188 (67.4%) | 128 (45.9%) |
| 19 to 25 Years | 84 (45.7%) | 165 (89.7%) |
| 25 to 34 Years | 91 (74.0%) | 62 (50.4%) |
| 35 to 44 Years | 76 (52.0%) | 86 (58.9%) |
| 45 to 54 Years | 155 (56.4%) | 133 (48.4%) |
| 55 to 64 Years | 168 (64.1%) | 83 (31.7%) |
| 65 to 74 Years | 130 (100.0%) | 87 (66.9%) |
| 75 Years and over | 243 (100.0%) | 217 (89.3%) |
| Total | 1,223 (70.7%) | 964 (55.7%) |
Disability Status by Sex by Age in Sophia
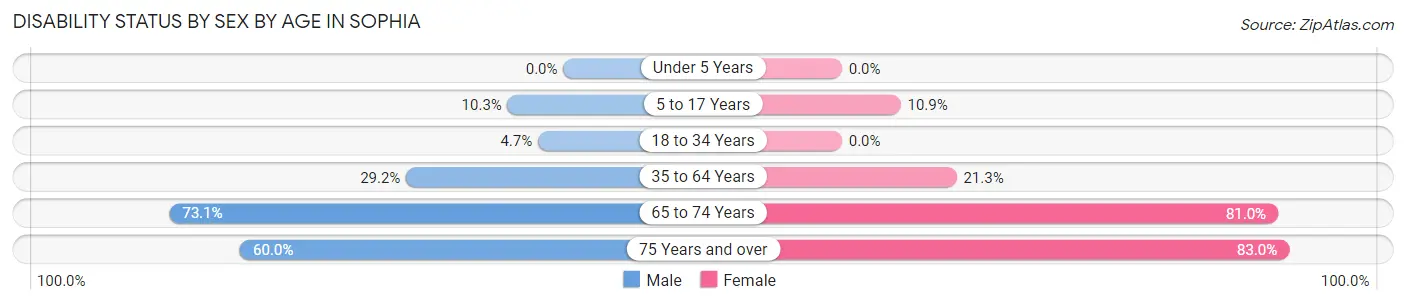
| Age Bracket | Male | Female |
| Under 5 Years | 0 (0.0%) | 0 (0.0%) |
| 5 to 17 Years | 12 (10.3%) | 12 (10.9%) |
| 18 to 34 Years | 9 (4.7%) | 0 (0.0%) |
| 35 to 64 Years | 91 (29.2%) | 79 (21.3%) |
| 65 to 74 Years | 49 (73.1%) | 51 (80.9%) |
| 75 Years and over | 54 (60.0%) | 127 (83.0%) |
Disability Class by Sex by Age in Sophia
Disability Class: Hearing Difficulty
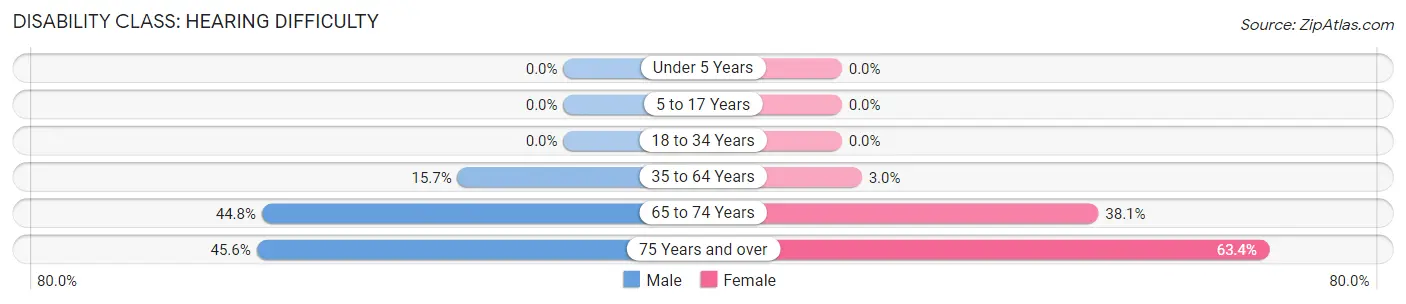
| Age Bracket | Male | Female |
| Under 5 Years | 0 (0.0%) | 0 (0.0%) |
| 5 to 17 Years | 0 (0.0%) | 0 (0.0%) |
| 18 to 34 Years | 0 (0.0%) | 0 (0.0%) |
| 35 to 64 Years | 49 (15.7%) | 11 (3.0%) |
| 65 to 74 Years | 30 (44.8%) | 24 (38.1%) |
| 75 Years and over | 41 (45.6%) | 97 (63.4%) |
Disability Class: Vision Difficulty
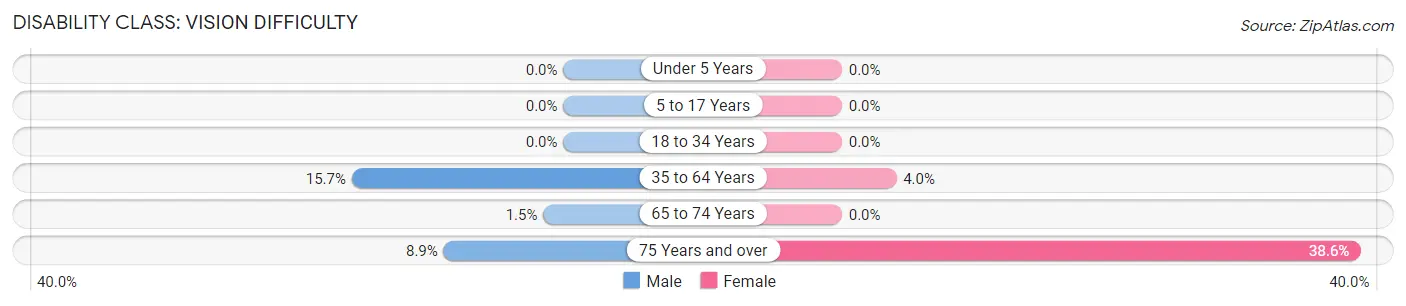
| Age Bracket | Male | Female |
| Under 5 Years | 0 (0.0%) | 0 (0.0%) |
| 5 to 17 Years | 0 (0.0%) | 0 (0.0%) |
| 18 to 34 Years | 0 (0.0%) | 0 (0.0%) |
| 35 to 64 Years | 49 (15.7%) | 15 (4.0%) |
| 65 to 74 Years | 1 (1.5%) | 0 (0.0%) |
| 75 Years and over | 8 (8.9%) | 59 (38.6%) |
Disability Class: Cognitive Difficulty
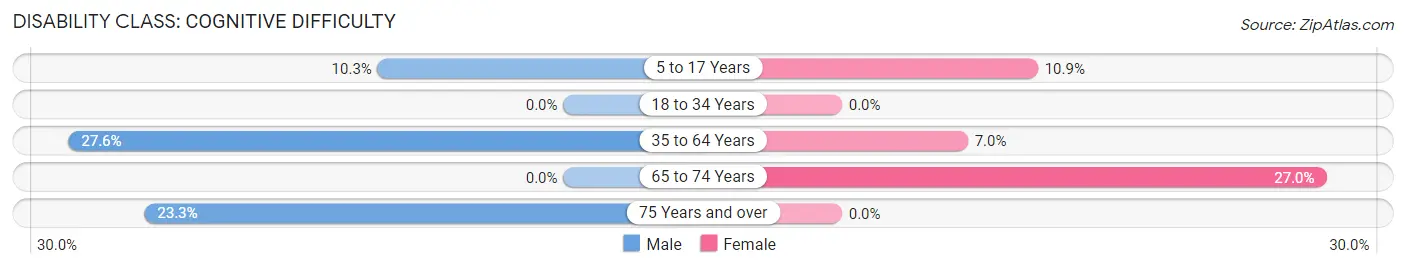
| Age Bracket | Male | Female |
| 5 to 17 Years | 12 (10.3%) | 12 (10.9%) |
| 18 to 34 Years | 0 (0.0%) | 0 (0.0%) |
| 35 to 64 Years | 86 (27.6%) | 26 (7.0%) |
| 65 to 74 Years | 0 (0.0%) | 17 (27.0%) |
| 75 Years and over | 21 (23.3%) | 0 (0.0%) |
Disability Class: Ambulatory Difficulty
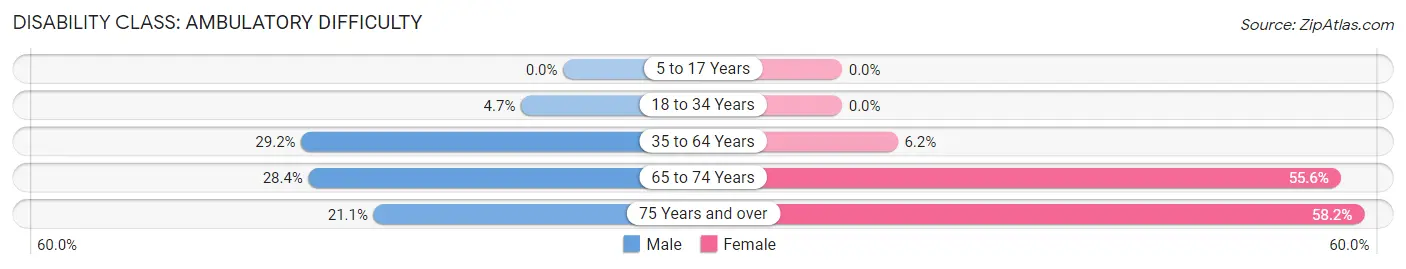
| Age Bracket | Male | Female |
| 5 to 17 Years | 0 (0.0%) | 0 (0.0%) |
| 18 to 34 Years | 9 (4.7%) | 0 (0.0%) |
| 35 to 64 Years | 91 (29.2%) | 23 (6.2%) |
| 65 to 74 Years | 19 (28.4%) | 35 (55.6%) |
| 75 Years and over | 19 (21.1%) | 89 (58.2%) |
Disability Class: Self-Care Difficulty
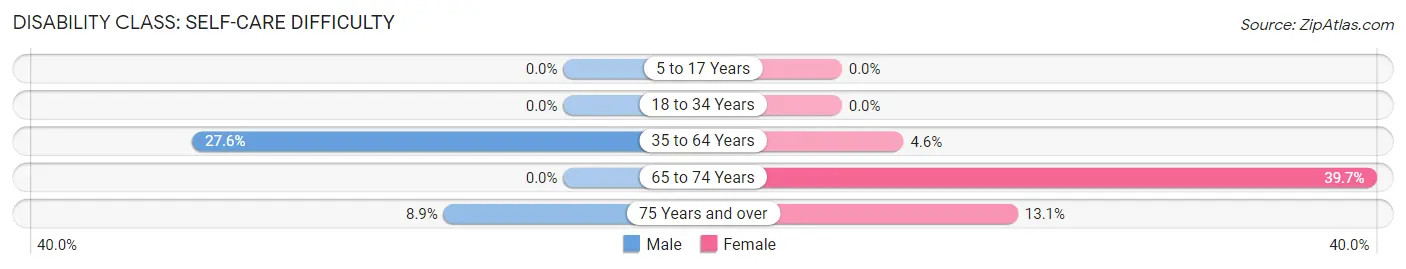
| Age Bracket | Male | Female |
| 5 to 17 Years | 0 (0.0%) | 0 (0.0%) |
| 18 to 34 Years | 0 (0.0%) | 0 (0.0%) |
| 35 to 64 Years | 86 (27.6%) | 17 (4.6%) |
| 65 to 74 Years | 0 (0.0%) | 25 (39.7%) |
| 75 Years and over | 8 (8.9%) | 20 (13.1%) |
Technology Access in Sophia
Computing Device Access in Sophia
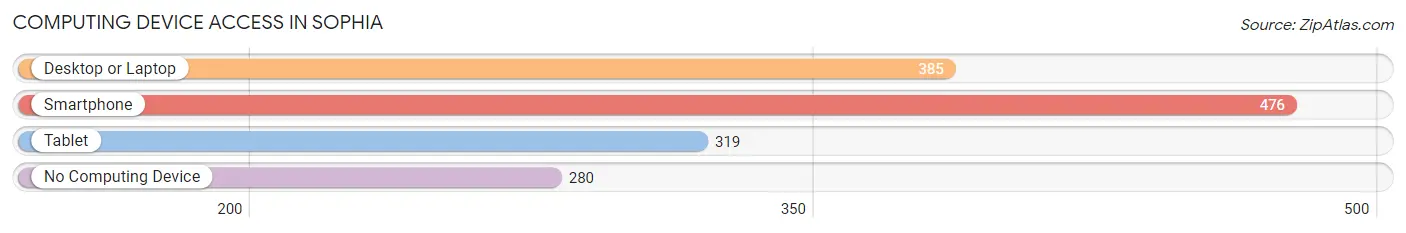
| Device Type | # Households | % Households |
| Desktop or Laptop | 385 | 49.7% |
| Smartphone | 476 | 61.4% |
| Tablet | 319 | 41.2% |
| No Computing Device | 280 | 36.1% |
| Total | 775 | 100.0% |
Internet Access in Sophia
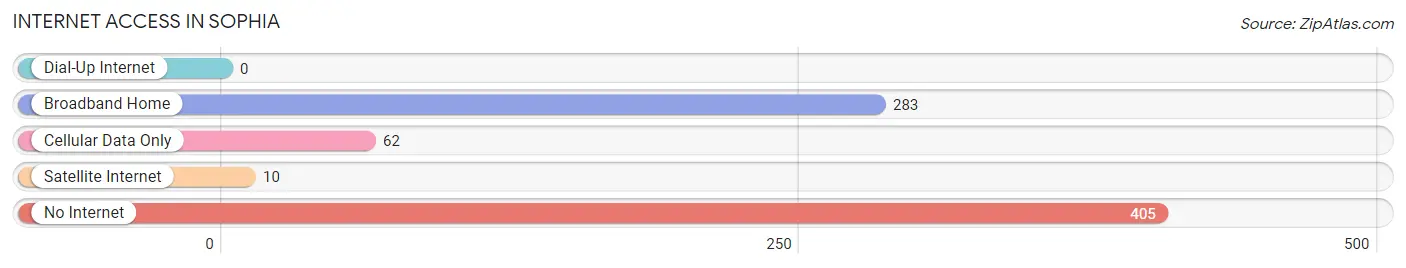
| Internet Type | # Households | % Households |
| Dial-Up Internet | 0 | 0.0% |
| Broadband Home | 283 | 36.5% |
| Cellular Data Only | 62 | 8.0% |
| Satellite Internet | 10 | 1.3% |
| No Internet | 405 | 52.3% |
| Total | 775 | 100.0% |
Sophia Summary
Sophia is a small town located in the Appalachian Mountains of West Virginia. It is situated in the Raleigh County, and is part of the Beckley-Raleigh County Metropolitan Statistical Area. The town has a population of 1,845 people, according to the 2010 census.
History
Sophia was founded in 1891 by the Raleigh County Coal and Coke Company. The town was named after the daughter of the company's president, John T. McGraw. The town was originally a coal mining town, and the coal industry was the main source of employment for the residents. The town was incorporated in 1895.
In the early 1900s, Sophia was a thriving coal mining town. The town had a post office, a bank, a hotel, a school, and several stores. The town was also home to several churches, including the First Baptist Church, which was founded in 1895.
In the 1950s, the coal industry began to decline in Sophia. The town's population began to decline as well, and by the 1970s, the town had become a ghost town. In the 1980s, the town began to experience a revival, and the population began to increase.
Geography
Sophia is located in the Appalachian Mountains of West Virginia. The town is situated in the Raleigh County, and is part of the Beckley-Raleigh County Metropolitan Statistical Area. The town is located at an elevation of 1,845 feet above sea level.
The town is located in a valley, surrounded by mountains. The town is located near the New River, which is a tributary of the Kanawha River. The town is located about 25 miles south of Beckley, the county seat of Raleigh County.
Economy
The economy of Sophia is largely based on the coal industry. The town is home to several coal mines, and the coal industry is the main source of employment for the residents. The town is also home to several small businesses, including restaurants, stores, and other services.
Demographics
According to the 2010 census, Sophia has a population of 1,845 people. The town has a median household income of $30,938, and a median family income of $37,917. The town has a poverty rate of 22.3%, and the unemployment rate is 8.2%.
The town is predominantly white, with 92.3% of the population being white. The town also has a small African American population, with 4.2% of the population being African American. The town also has a small Hispanic population, with 1.2% of the population being Hispanic.
Conclusion
Sophia is a small town located in the Appalachian Mountains of West Virginia. The town has a population of 1,845 people, and the economy is largely based on the coal industry. The town is predominantly white, with 92.3% of the population being white. The town also has a small African American population, with 4.2% of the population being African American. The town also has a small Hispanic population, with 1.2% of the population being Hispanic. The town has a median household income of $30,938, and a median family income of $37,917. The town has a poverty rate of 22.3%, and the unemployment rate is 8.2%.
Common Questions
What is Per Capita Income in Sophia?
Per Capita income in Sophia is $25,065.
What is the Median Family Income in Sophia?
Median Family Income in Sophia is $34,978.
What is the Median Household income in Sophia?
Median Household Income in Sophia is $33,372.
What is Inequality or Gini Index in Sophia?
Inequality or Gini Index in Sophia is 0.60.
What is the Total Population of Sophia?
Total Population of Sophia is 1,730.
What is the Total Male Population of Sophia?
Total Male Population of Sophia is 850.
What is the Total Female Population of Sophia?
Total Female Population of Sophia is 880.
What is the Ratio of Males per 100 Females in Sophia?
There are 96.59 Males per 100 Females in Sophia.
What is the Ratio of Females per 100 Males in Sophia?
There are 103.53 Females per 100 Males in Sophia.
What is the Median Population Age in Sophia?
Median Population Age in Sophia is 45.8 Years.
What is the Average Family Size in Sophia
Average Family Size in Sophia is 2.7 People.
What is the Average Household Size in Sophia
Average Household Size in Sophia is 2.2 People.
How Large is the Labor Force in Sophia?
There are 568 People in the Labor Forcein in Sophia.
What is the Percentage of People in the Labor Force in Sophia?
39.5% of People are in the Labor Force in Sophia.
What is the Unemployment Rate in Sophia?
Unemployment Rate in Sophia is 12.7%.