Farmington, WV Map & Demographics
Farmington Map
Farmington Overview
$25,429
PER CAPITA INCOME
$67,000
AVG FAMILY INCOME
$54,750
AVG HOUSEHOLD INCOME
48.3%
WAGE / INCOME GAP [ % ]
51.7¢/ $1
WAGE / INCOME GAP [ $ ]
0.37
INEQUALITY / GINI INDEX
422
TOTAL POPULATION
199
MALE POPULATION
223
FEMALE POPULATION
89.24
MALES / 100 FEMALES
112.06
FEMALES / 100 MALES
37.1
MEDIAN AGE
3.6
AVG FAMILY SIZE
3.2
AVG HOUSEHOLD SIZE
218
LABOR FORCE [ PEOPLE ]
65.1%
PERCENT IN LABOR FORCE
5.0%
UNEMPLOYMENT RATE
Farmington Zip Codes
Farmington Area Codes
Income in Farmington
Income Overview in Farmington
Per Capita Income in Farmington is $25,429, while median incomes of families and households are $67,000 and $54,750 respectively.
| Characteristic | Number | Measure |
| Per Capita Income | 422 | $25,429 |
| Median Family Income | 108 | $67,000 |
| Mean Family Income | 108 | $81,639 |
| Median Household Income | 132 | $54,750 |
| Mean Household Income | 132 | $76,118 |
| Income Deficit | 108 | $0 |
| Wage / Income Gap (%) | 422 | 48.35% |
| Wage / Income Gap ($) | 422 | 51.65¢ per $1 |
| Gini / Inequality Index | 422 | 0.37 |
Earnings by Sex in Farmington
Average Earnings in Farmington are $34,167, $51,957 for men and $26,838 for women, a difference of 48.3%.
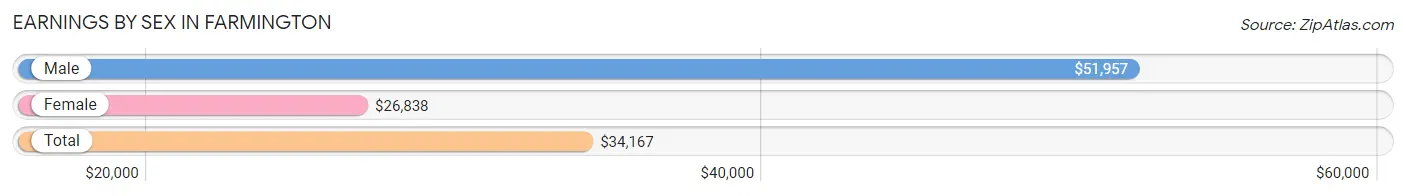
| Sex | Number | Average Earnings |
| Male | 98 (47.1%) | $51,957 |
| Female | 110 (52.9%) | $26,838 |
| Total | 208 (100.0%) | $34,167 |
Earnings by Sex by Income Bracket in Farmington
The most common earnings brackets in Farmington are $75,000 to $99,999 for men (28 | 28.6%) and $25,000 to $29,999 for women (44 | 40.0%).
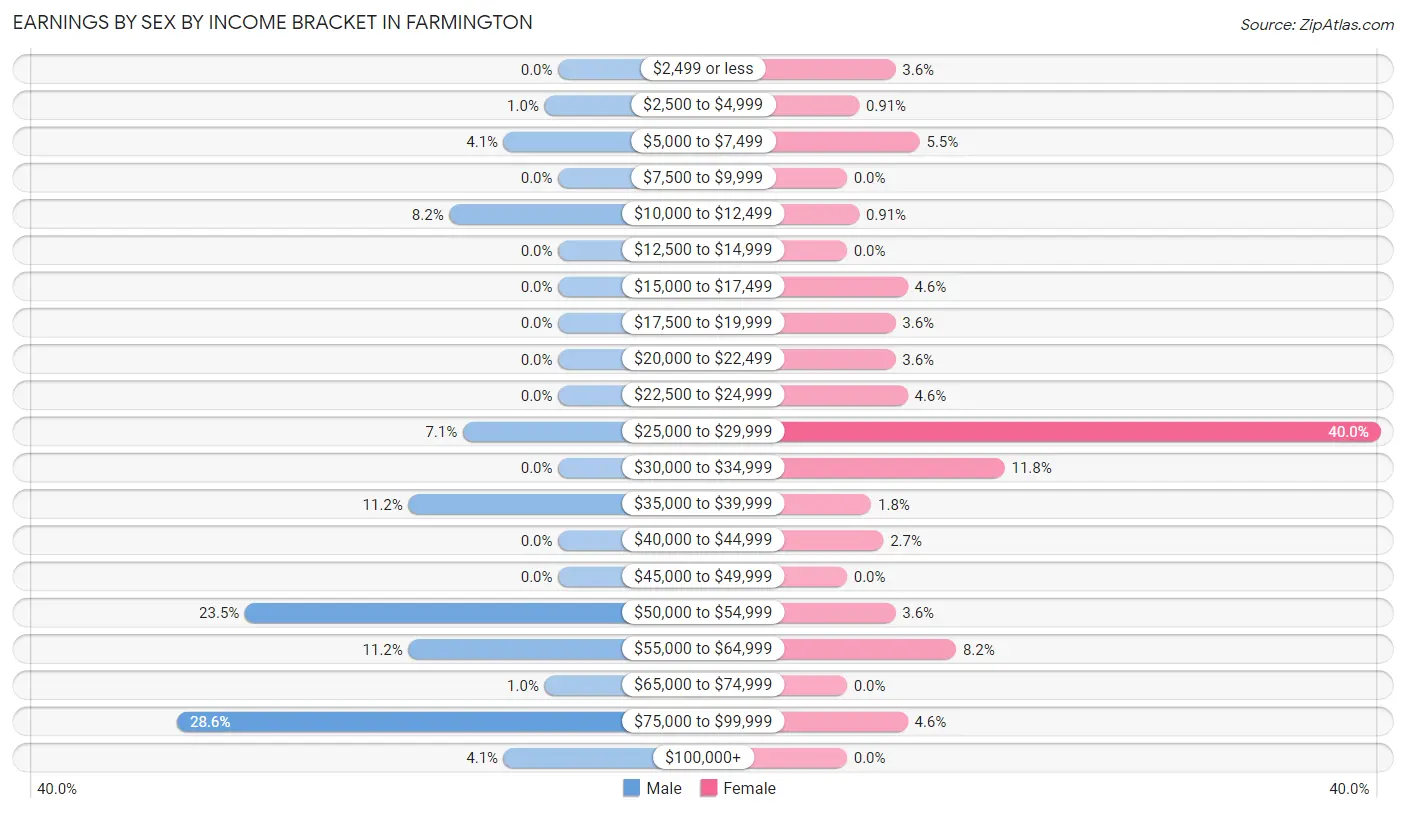
| Income | Male | Female |
| $2,499 or less | 0 (0.0%) | 4 (3.6%) |
| $2,500 to $4,999 | 1 (1.0%) | 1 (0.9%) |
| $5,000 to $7,499 | 4 (4.1%) | 6 (5.4%) |
| $7,500 to $9,999 | 0 (0.0%) | 0 (0.0%) |
| $10,000 to $12,499 | 8 (8.2%) | 1 (0.9%) |
| $12,500 to $14,999 | 0 (0.0%) | 0 (0.0%) |
| $15,000 to $17,499 | 0 (0.0%) | 5 (4.5%) |
| $17,500 to $19,999 | 0 (0.0%) | 4 (3.6%) |
| $20,000 to $22,499 | 0 (0.0%) | 4 (3.6%) |
| $22,500 to $24,999 | 0 (0.0%) | 5 (4.5%) |
| $25,000 to $29,999 | 7 (7.1%) | 44 (40.0%) |
| $30,000 to $34,999 | 0 (0.0%) | 13 (11.8%) |
| $35,000 to $39,999 | 11 (11.2%) | 2 (1.8%) |
| $40,000 to $44,999 | 0 (0.0%) | 3 (2.7%) |
| $45,000 to $49,999 | 0 (0.0%) | 0 (0.0%) |
| $50,000 to $54,999 | 23 (23.5%) | 4 (3.6%) |
| $55,000 to $64,999 | 11 (11.2%) | 9 (8.2%) |
| $65,000 to $74,999 | 1 (1.0%) | 0 (0.0%) |
| $75,000 to $99,999 | 28 (28.6%) | 5 (4.5%) |
| $100,000+ | 4 (4.1%) | 0 (0.0%) |
| Total | 98 (100.0%) | 110 (100.0%) |
Earnings by Sex by Educational Attainment in Farmington
Average earnings in Farmington are $52,411 for men and $28,250 for women, a difference of 46.1%. Men with an educational attainment of bachelor's degree enjoy the highest average annual earnings of $64,625, while those with college or associate's degree education earn the least with $26,458. Women with an educational attainment of bachelor's degree earn the most with the average annual earnings of $40,000, while those with college or associate's degree education have the smallest earnings of $26,154.
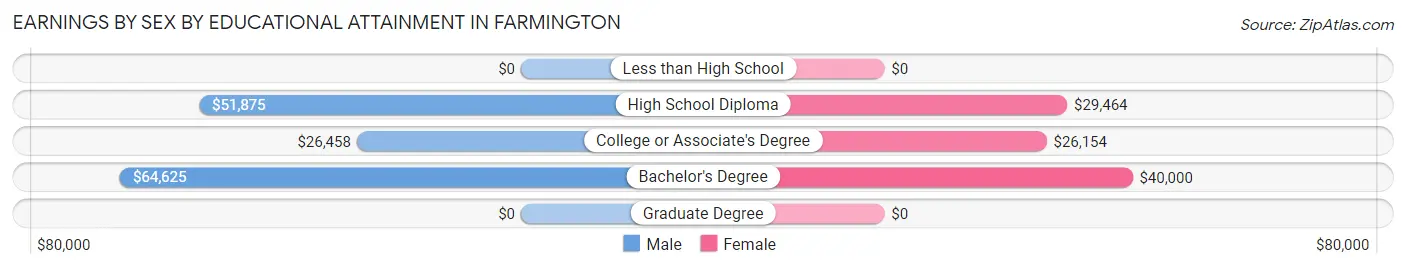
| Educational Attainment | Male Income | Female Income |
| Less than High School | - | - |
| High School Diploma | $51,875 | $29,464 |
| College or Associate's Degree | $26,458 | $26,154 |
| Bachelor's Degree | $64,625 | $40,000 |
| Graduate Degree | - | - |
| Total | $52,411 | $28,250 |
Family Income in Farmington
Family Income Brackets in Farmington
According to the Farmington family income data, there are 33 families falling into the $100,000 to $149,999 income range, which is the most common income bracket and makes up 30.6% of all families.
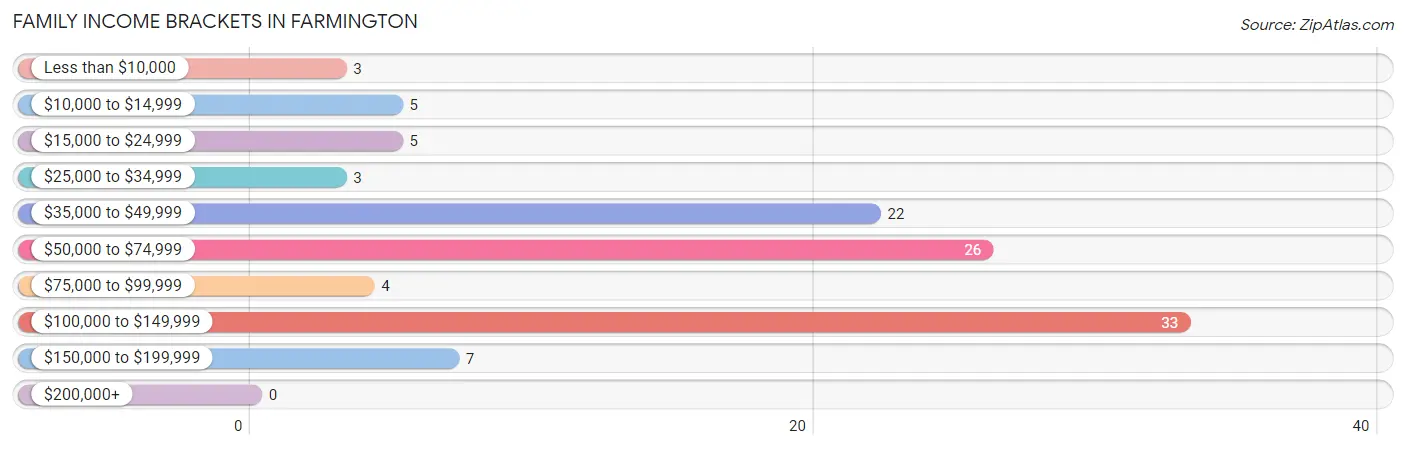
| Income Bracket | # Families | % Families |
| Less than $10,000 | 3 | 2.8% |
| $10,000 to $14,999 | 5 | 4.6% |
| $15,000 to $24,999 | 5 | 4.6% |
| $25,000 to $34,999 | 3 | 2.8% |
| $35,000 to $49,999 | 22 | 20.4% |
| $50,000 to $74,999 | 26 | 24.1% |
| $75,000 to $99,999 | 4 | 3.7% |
| $100,000 to $149,999 | 33 | 30.6% |
| $150,000 to $199,999 | 7 | 6.5% |
| $200,000+ | 0 | 0.0% |
Family Income by Famaliy Size in Farmington
4-person families (28 | 25.9%) account for the highest median family income in Farmington with $128,750 per family, while 4-person families (28 | 25.9%) have the highest median income of $32,188 per family member.
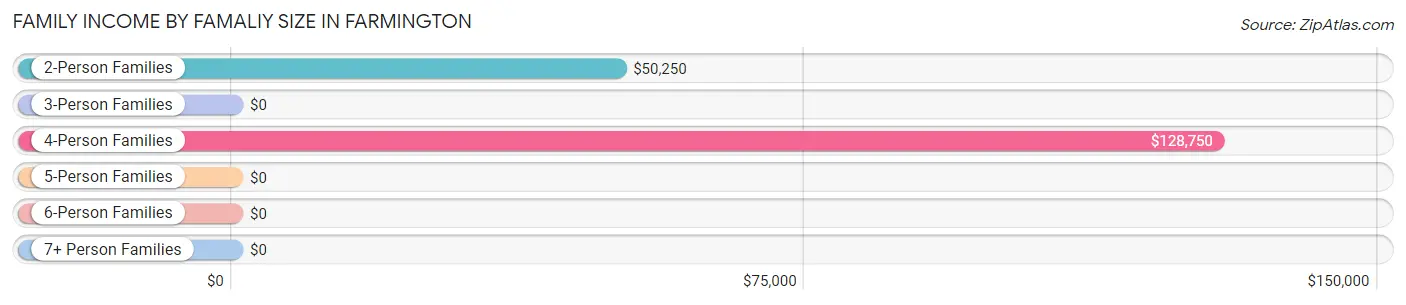
| Income Bracket | # Families | Median Income |
| 2-Person Families | 43 (39.8%) | $50,250 |
| 3-Person Families | 25 (23.2%) | $0 |
| 4-Person Families | 28 (25.9%) | $128,750 |
| 5-Person Families | 12 (11.1%) | $0 |
| 6-Person Families | 0 (0.0%) | $0 |
| 7+ Person Families | 0 (0.0%) | $0 |
| Total | 108 (100.0%) | $67,000 |
Family Income by Number of Earners in Farmington
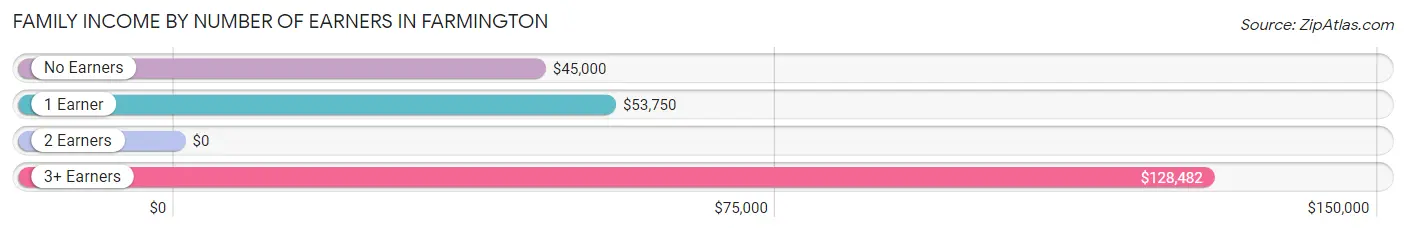
| Number of Earners | # Families | Median Income |
| No Earners | 18 (16.7%) | $45,000 |
| 1 Earner | 41 (38.0%) | $53,750 |
| 2 Earners | 18 (16.7%) | $0 |
| 3+ Earners | 31 (28.7%) | $128,482 |
| Total | 108 (100.0%) | $67,000 |
Household Income in Farmington
Household Income Brackets in Farmington
With 40 households falling in the category, the $100,000 to $149,999 income range is the most frequent in Farmington, accounting for 30.3% of all households.
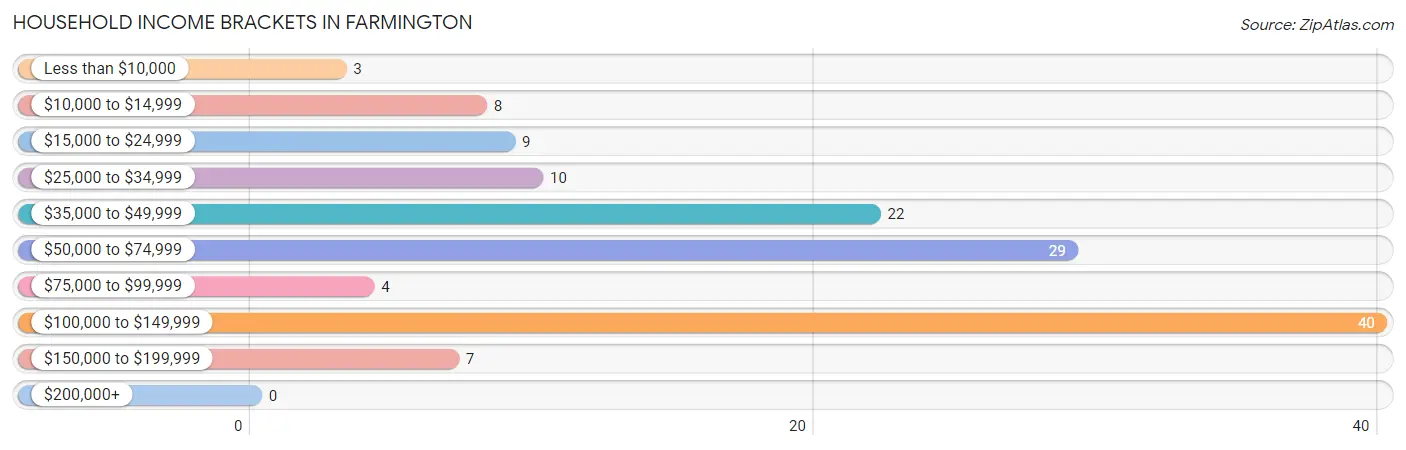
| Income Bracket | # Households | % Households |
| Less than $10,000 | 3 | 2.3% |
| $10,000 to $14,999 | 8 | 6.1% |
| $15,000 to $24,999 | 9 | 6.8% |
| $25,000 to $34,999 | 10 | 7.6% |
| $35,000 to $49,999 | 22 | 16.7% |
| $50,000 to $74,999 | 29 | 22.0% |
| $75,000 to $99,999 | 4 | 3.0% |
| $100,000 to $149,999 | 40 | 30.3% |
| $150,000 to $199,999 | 7 | 5.3% |
| $200,000+ | 0 | 0.0% |
Household Income by Householder Age in Farmington
The median household income in Farmington is $54,750, with the highest median household income of $74,821 found in the 45 to 64 years age bracket for the primary householder. A total of 55 households (41.7%) fall into this category. Meanwhile, the 15 to 24 years age bracket for the primary householder has the lowest median household income of $0, with 7 households (5.3%) in this group.
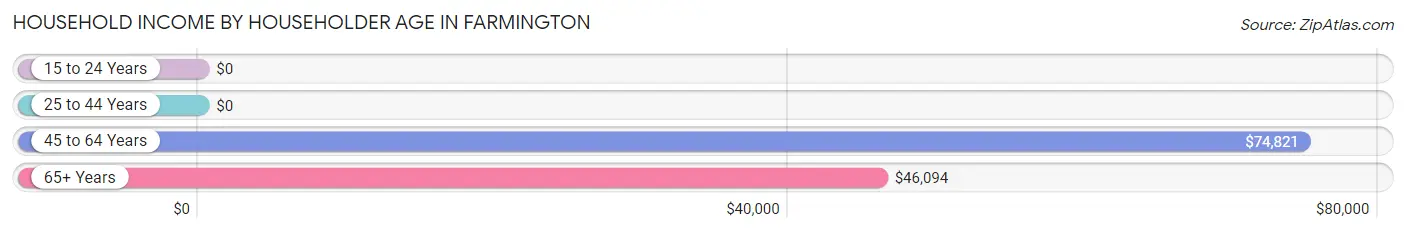
| Income Bracket | # Households | Median Income |
| 15 to 24 Years | 7 (5.3%) | $0 |
| 25 to 44 Years | 33 (25.0%) | $0 |
| 45 to 64 Years | 55 (41.7%) | $74,821 |
| 65+ Years | 37 (28.0%) | $46,094 |
| Total | 132 (100.0%) | $54,750 |
Poverty in Farmington
Income Below Poverty by Sex and Age in Farmington
With 9.6% poverty level for males and 15.7% for females among the residents of Farmington, 15 year old males and 6 to 11 year old females are the most vulnerable to poverty, with 5 males (100.0%) and 9 females (75.0%) in their respective age groups living below the poverty level.
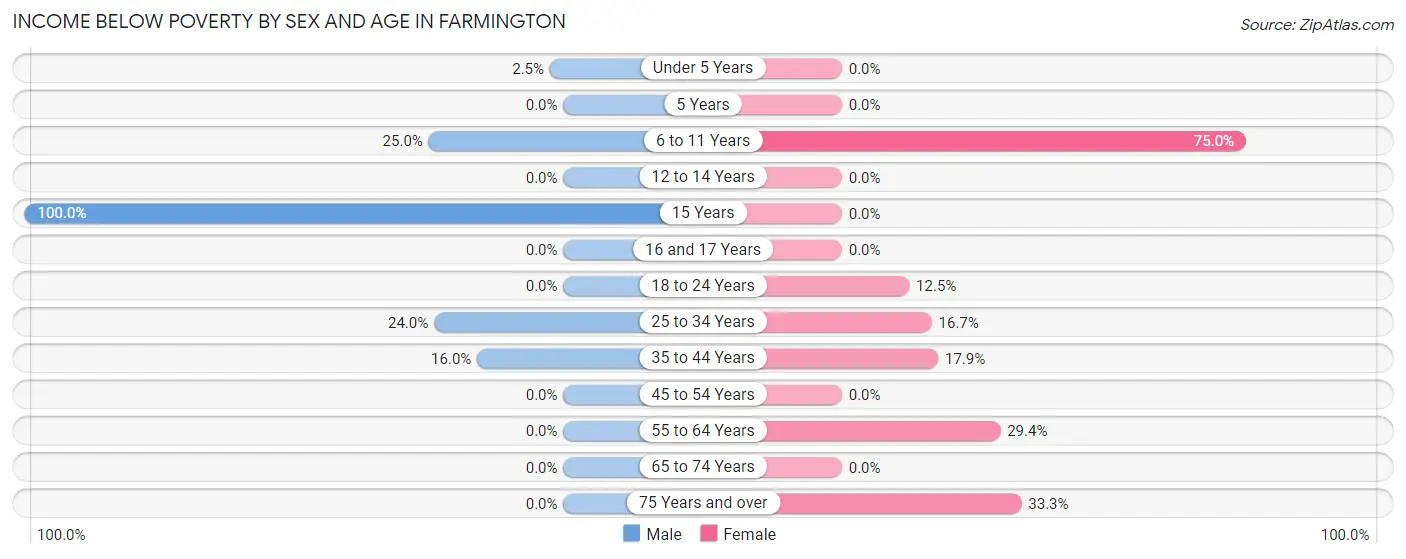
| Age Bracket | Male | Female |
| Under 5 Years | 1 (2.5%) | 0 (0.0%) |
| 5 Years | 0 (0.0%) | 0 (0.0%) |
| 6 to 11 Years | 3 (25.0%) | 9 (75.0%) |
| 12 to 14 Years | 0 (0.0%) | 0 (0.0%) |
| 15 Years | 5 (100.0%) | 0 (0.0%) |
| 16 and 17 Years | 0 (0.0%) | 0 (0.0%) |
| 18 to 24 Years | 0 (0.0%) | 5 (12.5%) |
| 25 to 34 Years | 6 (24.0%) | 3 (16.7%) |
| 35 to 44 Years | 4 (16.0%) | 5 (17.9%) |
| 45 to 54 Years | 0 (0.0%) | 0 (0.0%) |
| 55 to 64 Years | 0 (0.0%) | 5 (29.4%) |
| 65 to 74 Years | 0 (0.0%) | 0 (0.0%) |
| 75 Years and over | 0 (0.0%) | 8 (33.3%) |
| Total | 19 (9.6%) | 35 (15.7%) |
Income Above Poverty by Sex and Age in Farmington
According to the poverty statistics in Farmington, males aged 18 to 24 years and females aged under 5 years are the age groups that are most secure financially, with 100.0% of males and 100.0% of females in these age groups living above the poverty line.
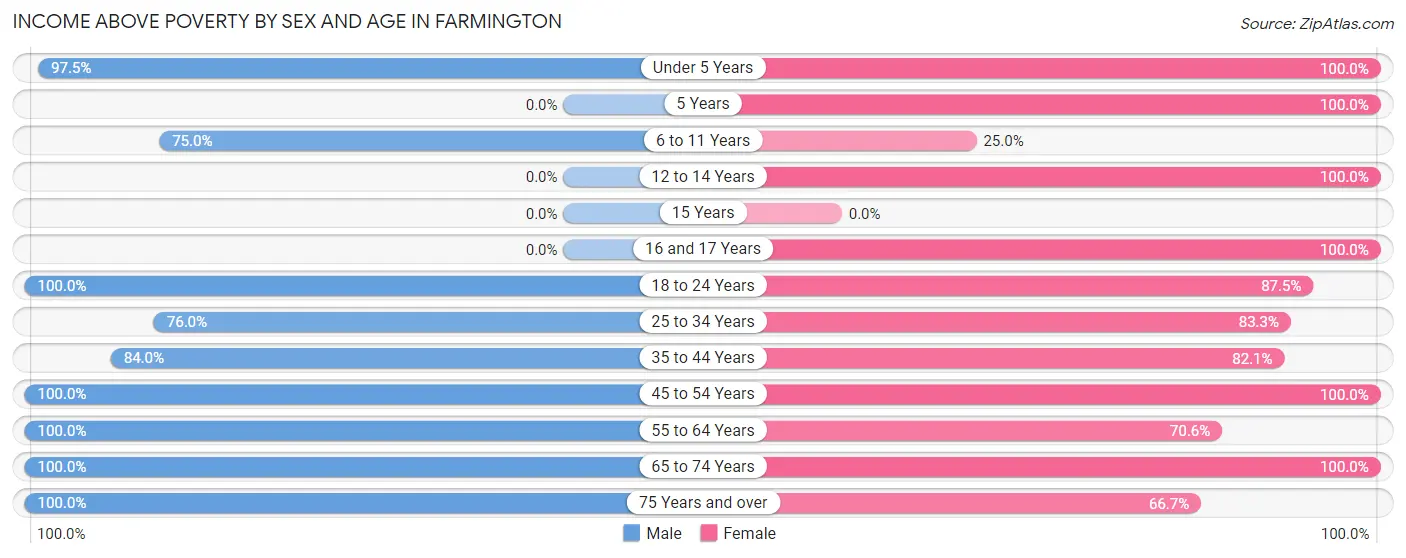
| Age Bracket | Male | Female |
| Under 5 Years | 39 (97.5%) | 9 (100.0%) |
| 5 Years | 0 (0.0%) | 4 (100.0%) |
| 6 to 11 Years | 9 (75.0%) | 3 (25.0%) |
| 12 to 14 Years | 0 (0.0%) | 5 (100.0%) |
| 15 Years | 0 (0.0%) | 0 (0.0%) |
| 16 and 17 Years | 0 (0.0%) | 19 (100.0%) |
| 18 to 24 Years | 11 (100.0%) | 35 (87.5%) |
| 25 to 34 Years | 19 (76.0%) | 15 (83.3%) |
| 35 to 44 Years | 21 (84.0%) | 23 (82.1%) |
| 45 to 54 Years | 24 (100.0%) | 29 (100.0%) |
| 55 to 64 Years | 32 (100.0%) | 12 (70.6%) |
| 65 to 74 Years | 15 (100.0%) | 18 (100.0%) |
| 75 Years and over | 10 (100.0%) | 16 (66.7%) |
| Total | 180 (90.4%) | 188 (84.3%) |
Income Below Poverty Among Married-Couple Families in Farmington
The poverty statistics for married-couple families in Farmington show that 1.2% or 1 of the total 84 families live below the poverty line. Families with 1 or 2 children have the highest poverty rate of 2.6%, comprising of 1 families. On the other hand, families with no children have the lowest poverty rate of 0.0%, which includes 0 families.
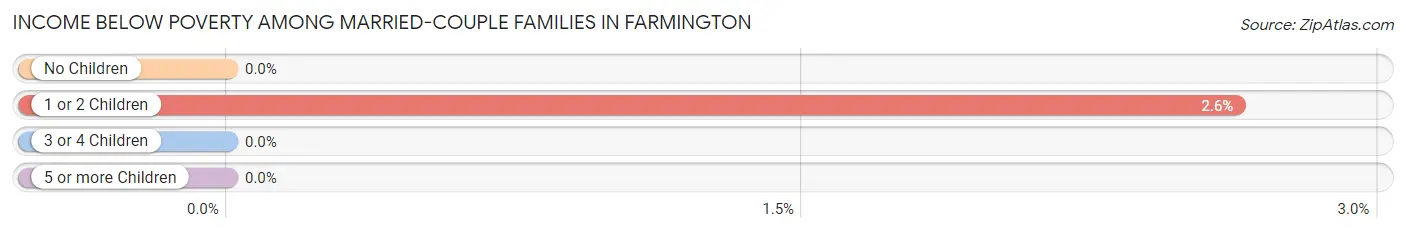
| Children | Above Poverty | Below Poverty |
| No Children | 46 (100.0%) | 0 (0.0%) |
| 1 or 2 Children | 37 (97.4%) | 1 (2.6%) |
| 3 or 4 Children | 0 (0.0%) | 0 (0.0%) |
| 5 or more Children | 0 (0.0%) | 0 (0.0%) |
| Total | 83 (98.8%) | 1 (1.2%) |
Income Below Poverty Among Single-Parent Households in Farmington
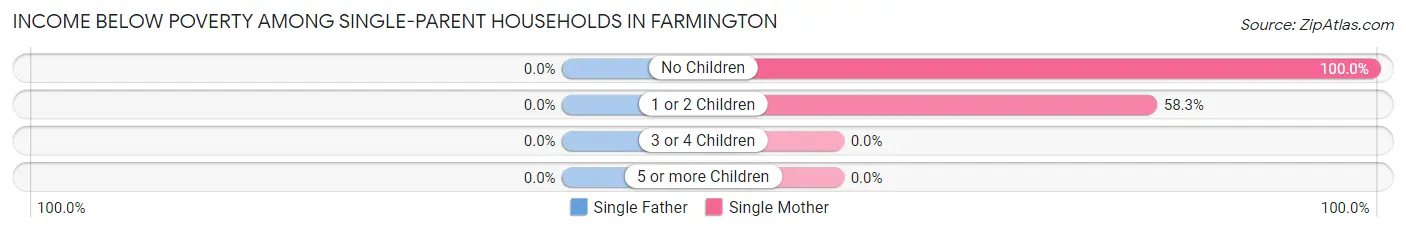
| Children | Single Father | Single Mother |
| No Children | 0 (0.0%) | 5 (100.0%) |
| 1 or 2 Children | 0 (0.0%) | 7 (58.3%) |
| 3 or 4 Children | 0 (0.0%) | 0 (0.0%) |
| 5 or more Children | 0 (0.0%) | 0 (0.0%) |
| Total | 0 (0.0%) | 12 (70.6%) |
Income Below Poverty Among Married-Couple vs Single-Parent Households in Farmington
The poverty data for Farmington shows that 1 of the married-couple family households (1.2%) and 12 of the single-parent households (50.0%) are living below the poverty level. Within the married-couple family households, those with 1 or 2 children have the highest poverty rate, with 1 households (2.6%) falling below the poverty line. Among the single-parent households, those with 1 or 2 children have the highest poverty rate, with 7 household (53.8%) living below poverty.
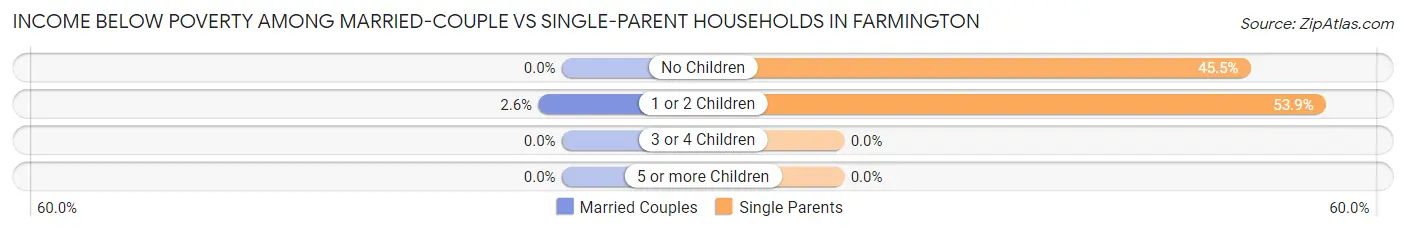
| Children | Married-Couple Families | Single-Parent Households |
| No Children | 0 (0.0%) | 5 (45.5%) |
| 1 or 2 Children | 1 (2.6%) | 7 (53.8%) |
| 3 or 4 Children | 0 (0.0%) | 0 (0.0%) |
| 5 or more Children | 0 (0.0%) | 0 (0.0%) |
| Total | 1 (1.2%) | 12 (50.0%) |
Race in Farmington
The most populous races in Farmington are , and White / Caucasian (422 | 100.0%).
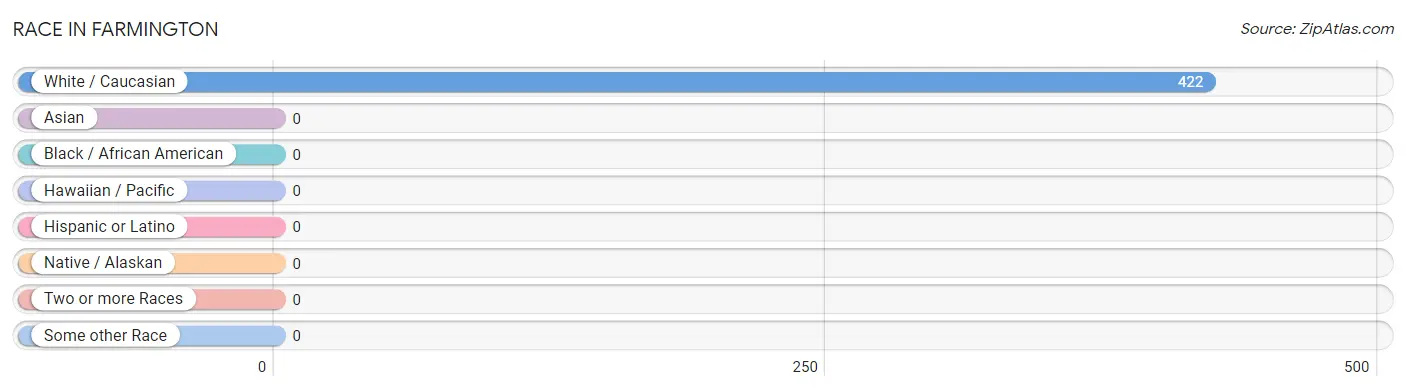
| Race | # Population | % Population |
| Asian | 0 | 0.0% |
| Black / African American | 0 | 0.0% |
| Hawaiian / Pacific | 0 | 0.0% |
| Hispanic or Latino | 0 | 0.0% |
| Native / Alaskan | 0 | 0.0% |
| White / Caucasian | 422 | 100.0% |
| Two or more Races | 0 | 0.0% |
| Some other Race | 0 | 0.0% |
| Total | 422 | 100.0% |
Ancestry in Farmington
The most populous ancestries reported in Farmington are German (144 | 34.1%), Irish (80 | 19.0%), Italian (51 | 12.1%), Scotch-Irish (43 | 10.2%), and English (24 | 5.7%), together accounting for 81.0% of all Farmington residents.
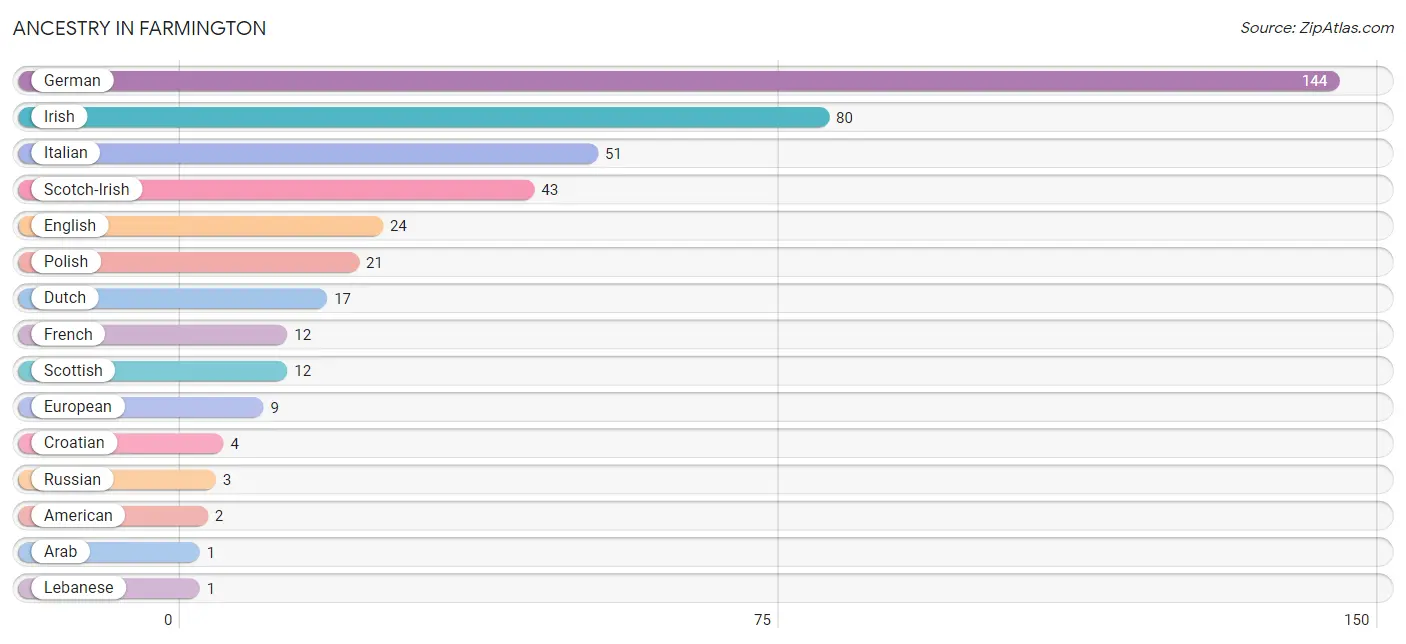
| Ancestry | # Population | % Population |
| American | 2 | 0.5% |
| Arab | 1 | 0.2% |
| Croatian | 4 | 0.9% |
| Dutch | 17 | 4.0% |
| English | 24 | 5.7% |
| European | 9 | 2.1% |
| French | 12 | 2.8% |
| German | 144 | 34.1% |
| Irish | 80 | 19.0% |
| Italian | 51 | 12.1% |
| Lebanese | 1 | 0.2% |
| Polish | 21 | 5.0% |
| Russian | 3 | 0.7% |
| Scotch-Irish | 43 | 10.2% |
| Scottish | 12 | 2.8% | View All 15 Rows |
Immigrants in Farmington

| Immigration Origin | # Population | % Population | View All 0 Rows |
Sex and Age in Farmington
Sex and Age in Farmington
The most populous age groups in Farmington are Under 5 Years (40 | 20.1%) for men and 20 to 24 Years (30 | 13.5%) for women.
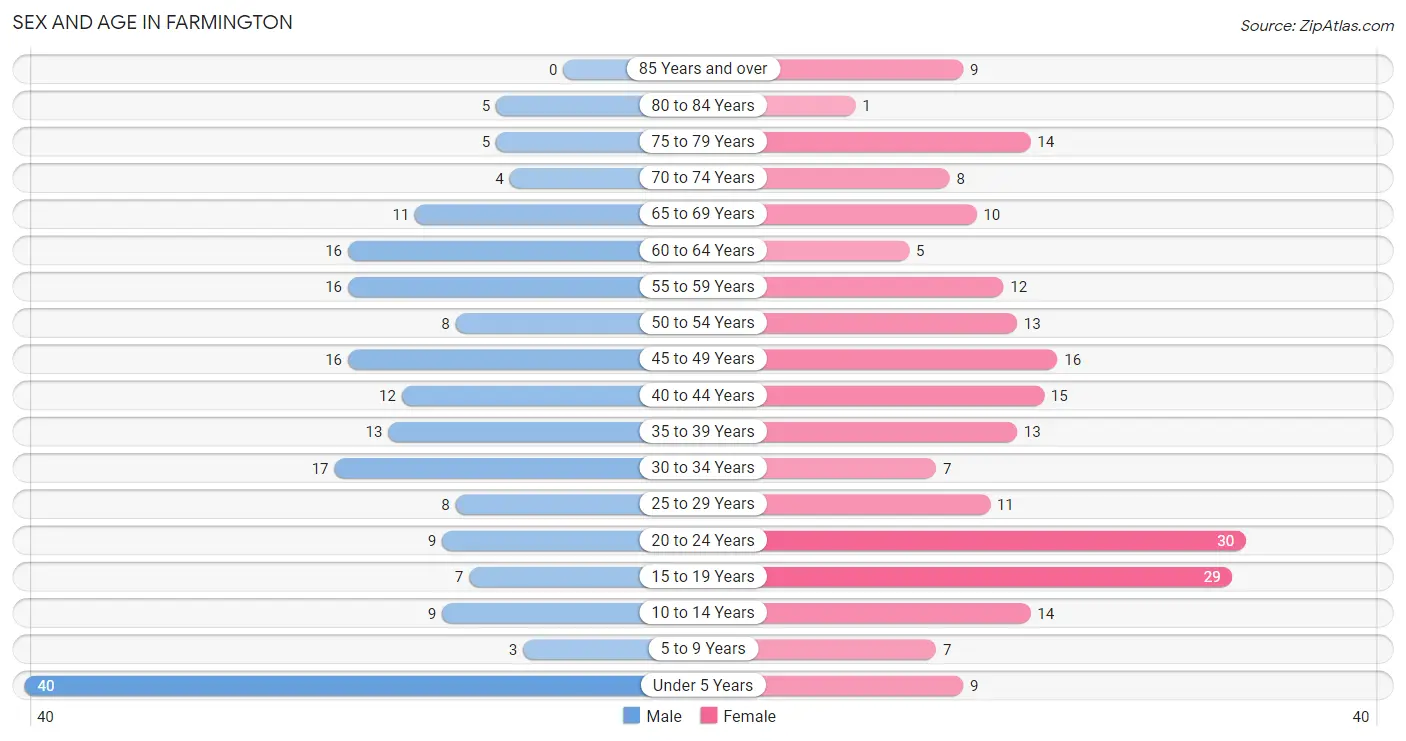
| Age Bracket | Male | Female |
| Under 5 Years | 40 (20.1%) | 9 (4.0%) |
| 5 to 9 Years | 3 (1.5%) | 7 (3.1%) |
| 10 to 14 Years | 9 (4.5%) | 14 (6.3%) |
| 15 to 19 Years | 7 (3.5%) | 29 (13.0%) |
| 20 to 24 Years | 9 (4.5%) | 30 (13.5%) |
| 25 to 29 Years | 8 (4.0%) | 11 (4.9%) |
| 30 to 34 Years | 17 (8.5%) | 7 (3.1%) |
| 35 to 39 Years | 13 (6.5%) | 13 (5.8%) |
| 40 to 44 Years | 12 (6.0%) | 15 (6.7%) |
| 45 to 49 Years | 16 (8.0%) | 16 (7.2%) |
| 50 to 54 Years | 8 (4.0%) | 13 (5.8%) |
| 55 to 59 Years | 16 (8.0%) | 12 (5.4%) |
| 60 to 64 Years | 16 (8.0%) | 5 (2.2%) |
| 65 to 69 Years | 11 (5.5%) | 10 (4.5%) |
| 70 to 74 Years | 4 (2.0%) | 8 (3.6%) |
| 75 to 79 Years | 5 (2.5%) | 14 (6.3%) |
| 80 to 84 Years | 5 (2.5%) | 1 (0.4%) |
| 85 Years and over | 0 (0.0%) | 9 (4.0%) |
| Total | 199 (100.0%) | 223 (100.0%) |
Families and Households in Farmington
Median Family Size in Farmington
The median family size in Farmington is 3.61 persons per family, with married-couple families (84 | 77.8%) accounting for the largest median family size of 3.86 persons per family. On the other hand, single male/father families (7 | 6.5%) represent the smallest median family size with 2.43 persons per family.
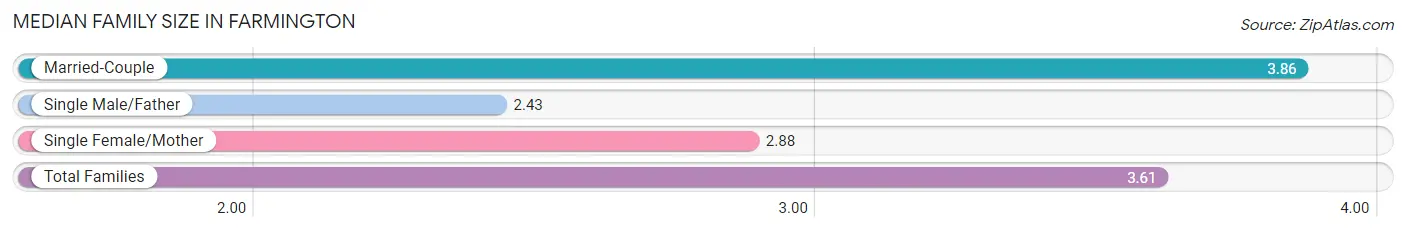
| Family Type | # Families | Family Size |
| Married-Couple | 84 (77.8%) | 3.86 |
| Single Male/Father | 7 (6.5%) | 2.43 |
| Single Female/Mother | 17 (15.7%) | 2.88 |
| Total Families | 108 (100.0%) | 3.61 |
Median Household Size in Farmington
The median household size in Farmington is 3.20 persons per household, with married-couple households (84 | 63.6%) accounting for the largest median household size of 3.86 persons per household. non-family households (24 | 18.2%) represent the smallest median household size with 1.17 persons per household.
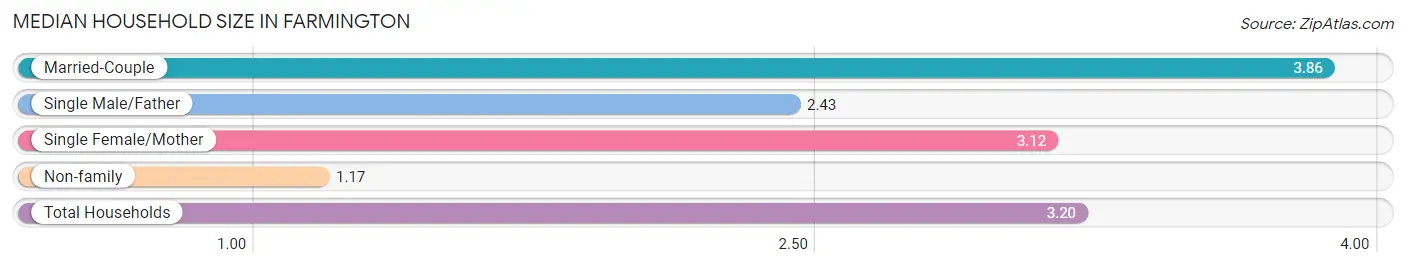
| Household Type | # Households | Household Size |
| Married-Couple | 84 (63.6%) | 3.86 |
| Single Male/Father | 7 (5.3%) | 2.43 |
| Single Female/Mother | 17 (12.9%) | 3.12 |
| Non-family | 24 (18.2%) | 1.17 |
| Total Households | 132 (100.0%) | 3.20 |
Household Size by Marriage Status in Farmington
Out of a total of 132 households in Farmington, 108 (81.8%) are family households, while 24 (18.2%) are nonfamily households. The most numerous type of family households are 2-person households, comprising 40, and the most common type of nonfamily households are 1-person households, comprising 19.
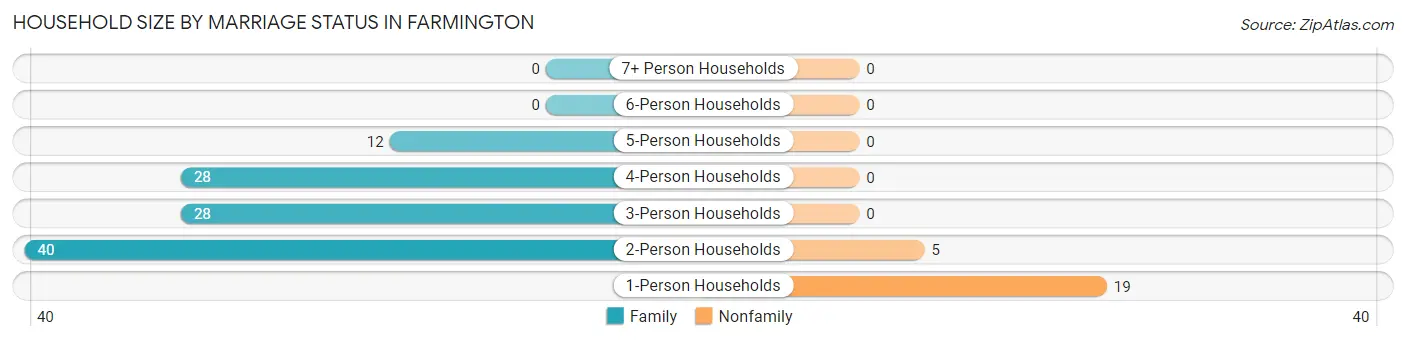
| Household Size | Family Households | Nonfamily Households |
| 1-Person Households | - | 19 (14.4%) |
| 2-Person Households | 40 (30.3%) | 5 (3.8%) |
| 3-Person Households | 28 (21.2%) | 0 (0.0%) |
| 4-Person Households | 28 (21.2%) | 0 (0.0%) |
| 5-Person Households | 12 (9.1%) | 0 (0.0%) |
| 6-Person Households | 0 (0.0%) | 0 (0.0%) |
| 7+ Person Households | 0 (0.0%) | 0 (0.0%) |
| Total | 108 (81.8%) | 24 (18.2%) |
Female Fertility in Farmington
Fertility by Age in Farmington
Average fertility rate in Farmington is 58.0 births per 1,000 women. Women in the age bracket of 20 to 34 years have the highest fertility rate with 83.0 births per 1,000 women. Women in the age bracket of 20 to 34 years acount for 57.1% of all women with births.
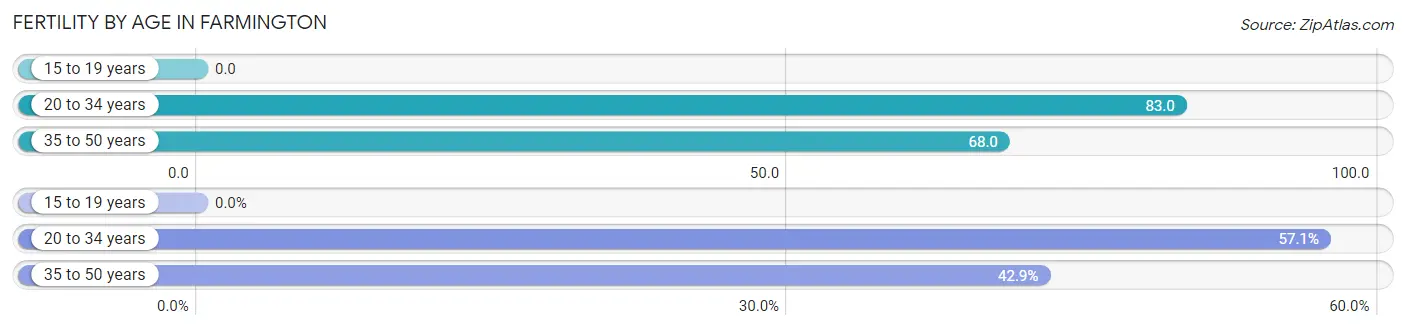
| Age Bracket | Women with Births | Births / 1,000 Women |
| 15 to 19 years | 0 (0.0%) | 0.0 |
| 20 to 34 years | 4 (57.1%) | 83.0 |
| 35 to 50 years | 3 (42.9%) | 68.0 |
| Total | 7 (100.0%) | 58.0 |
Fertility by Age by Marriage Status in Farmington
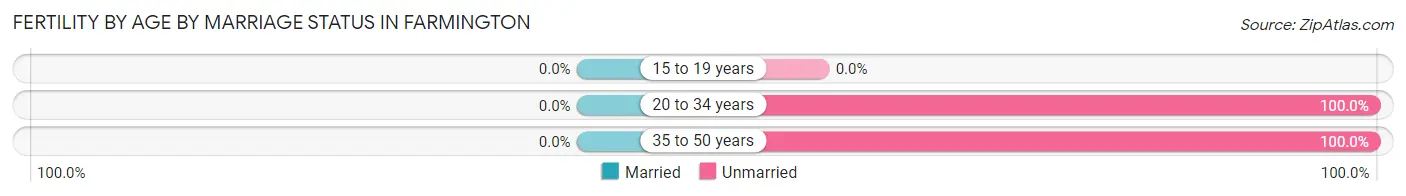
| Age Bracket | Married | Unmarried |
| 15 to 19 years | 0 (0.0%) | 0 (0.0%) |
| 20 to 34 years | 0 (0.0%) | 4 (100.0%) |
| 35 to 50 years | 0 (0.0%) | 3 (100.0%) |
| Total | 0 (0.0%) | 7 (100.0%) |
Fertility by Education in Farmington
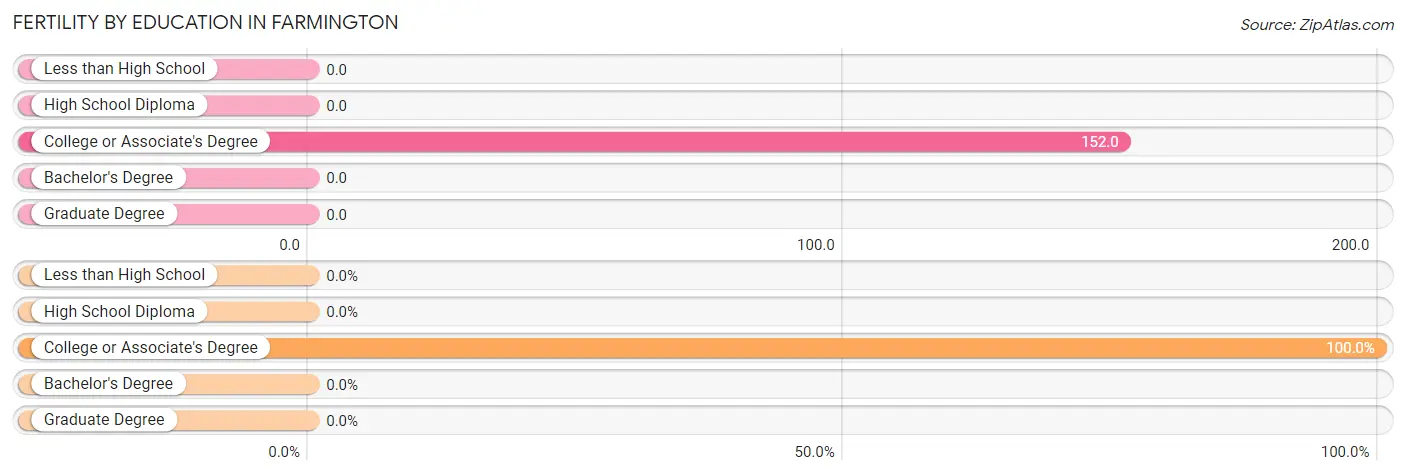
| Educational Attainment | Women with Births | Births / 1,000 Women |
| Less than High School | 0 (0.0%) | 0.0 |
| High School Diploma | 0 (0.0%) | 0.0 |
| College or Associate's Degree | 7 (100.0%) | 152.0 |
| Bachelor's Degree | 0 (0.0%) | 0.0 |
| Graduate Degree | 0 (0.0%) | 0.0 |
| Total | 7 (100.0%) | 58.0 |
Fertility by Education by Marriage Status in Farmington
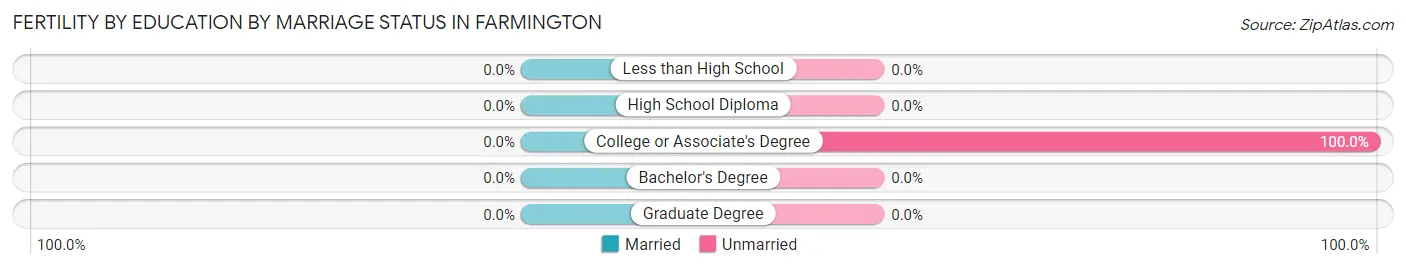
| Educational Attainment | Married | Unmarried |
| Less than High School | 0 (0.0%) | 0 (0.0%) |
| High School Diploma | 0 (0.0%) | 0 (0.0%) |
| College or Associate's Degree | 0 (0.0%) | 7 (100.0%) |
| Bachelor's Degree | 0 (0.0%) | 0 (0.0%) |
| Graduate Degree | 0 (0.0%) | 0 (0.0%) |
| Total | 0 (0.0%) | 7 (100.0%) |
Employment Characteristics in Farmington
Employment by Class of Employer in Farmington
Among the 203 employed individuals in Farmington, private company employees (175 | 86.2%), local government employees (9 | 4.4%), and self-employed (not incorporated) (7 | 3.5%) make up the most common classes of employment.
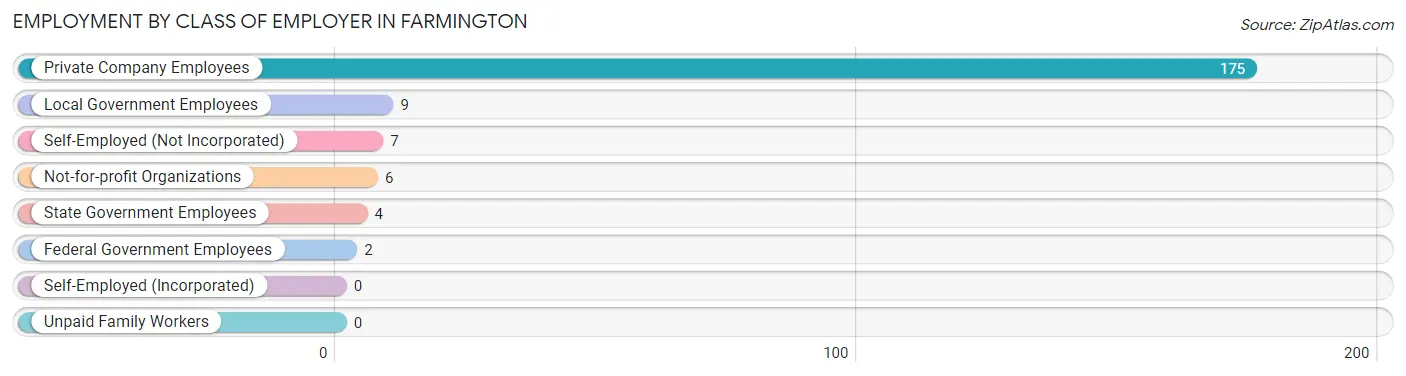
| Employer Class | # Employees | % Employees |
| Private Company Employees | 175 | 86.2% |
| Self-Employed (Incorporated) | 0 | 0.0% |
| Self-Employed (Not Incorporated) | 7 | 3.5% |
| Not-for-profit Organizations | 6 | 3.0% |
| Local Government Employees | 9 | 4.4% |
| State Government Employees | 4 | 2.0% |
| Federal Government Employees | 2 | 1.0% |
| Unpaid Family Workers | 0 | 0.0% |
| Total | 203 | 100.0% |
Employment Status by Age in Farmington
According to the labor force statistics for Farmington, out of the total population over 16 years of age (335), 65.1% or 218 individuals are in the labor force, with 5.0% or 11 of them unemployed. The age group with the highest labor force participation rate is 25 to 29 years, with 100.0% or 19 individuals in the labor force. Within the labor force, the 55 to 59 years age range has the highest percentage of unemployed individuals, with 36.4% or 8 of them being unemployed.
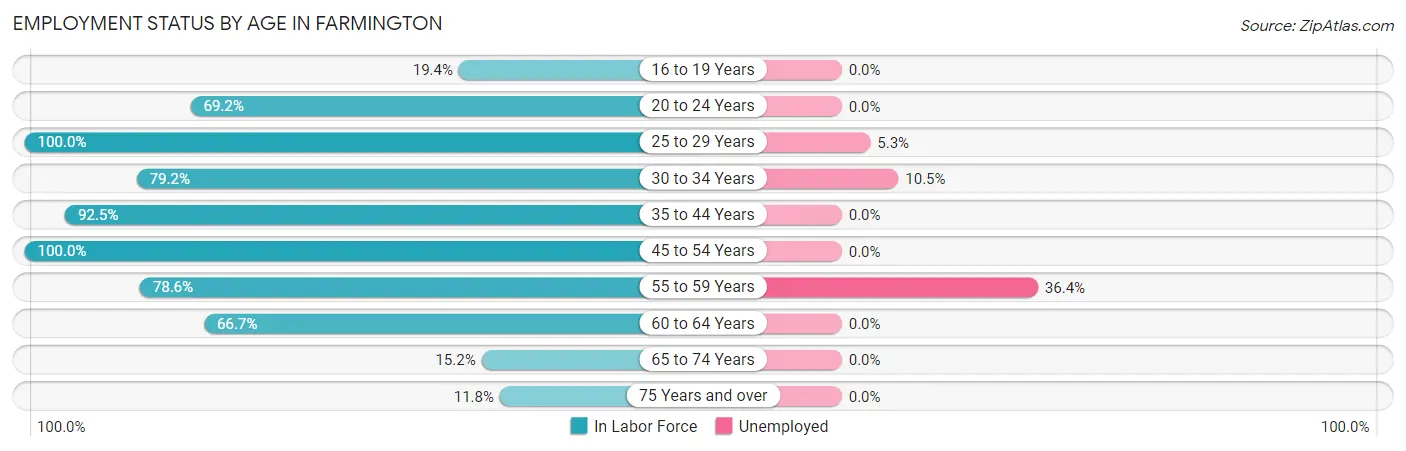
| Age Bracket | In Labor Force | Unemployed |
| 16 to 19 Years | 6 (19.4%) | 0 (0.0%) |
| 20 to 24 Years | 27 (69.2%) | 0 (0.0%) |
| 25 to 29 Years | 19 (100.0%) | 1 (5.3%) |
| 30 to 34 Years | 19 (79.2%) | 2 (10.5%) |
| 35 to 44 Years | 49 (92.5%) | 0 (0.0%) |
| 45 to 54 Years | 53 (100.0%) | 0 (0.0%) |
| 55 to 59 Years | 22 (78.6%) | 8 (36.4%) |
| 60 to 64 Years | 14 (66.7%) | 0 (0.0%) |
| 65 to 74 Years | 5 (15.2%) | 0 (0.0%) |
| 75 Years and over | 4 (11.8%) | 0 (0.0%) |
| Total | 218 (65.1%) | 11 (5.0%) |
Employment Status by Educational Attainment in Farmington
According to labor force statistics for Farmington, 88.9% of individuals (176) out of the total population between 25 and 64 years of age (198) are in the labor force, with 6.3% or 11 of them being unemployed. The group with the highest labor force participation rate are those with the educational attainment of high school diploma, with 93.3% or 98 individuals in the labor force. Within the labor force, individuals with high school diploma education have the highest percentage of unemployment, with 8.2% or 8 of them being unemployed.
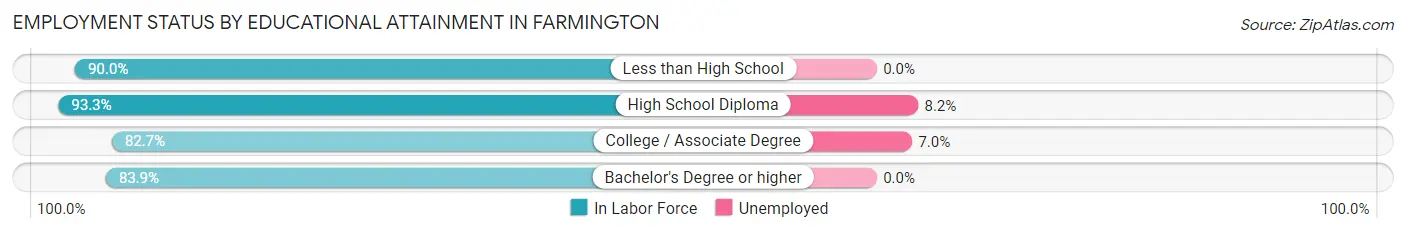
| Educational Attainment | In Labor Force | Unemployed |
| Less than High School | 9 (90.0%) | 0 (0.0%) |
| High School Diploma | 98 (93.3%) | 9 (8.2%) |
| College / Associate Degree | 43 (82.7%) | 4 (7.0%) |
| Bachelor's Degree or higher | 26 (83.9%) | 0 (0.0%) |
| Total | 176 (88.9%) | 12 (6.3%) |
Employment Occupations by Sex in Farmington
Management, Business, Science and Arts Occupations
The most common Management, Business, Science and Arts occupations in Farmington are Health Diagnosing & Treating (20 | 9.7%), Health Technologists (18 | 8.7%), Community & Social Service (6 | 2.9%), Management (5 | 2.4%), and Computers, Engineering & Science (5 | 2.4%).
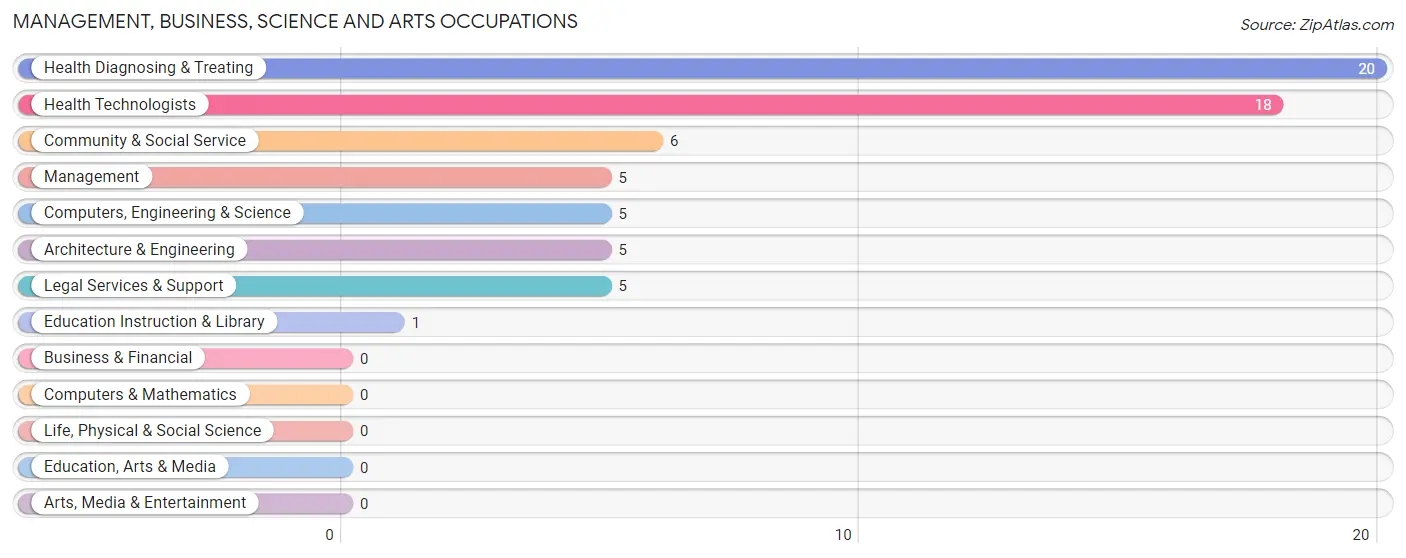
Management, Business, Science and Arts Occupations by Sex
Within the Management, Business, Science and Arts occupations in Farmington, the most male-oriented occupations are Computers, Engineering & Science (100.0%), Architecture & Engineering (100.0%), and Health Technologists (55.6%), while the most female-oriented occupations are Management (100.0%), Community & Social Service (100.0%), and Legal Services & Support (100.0%).
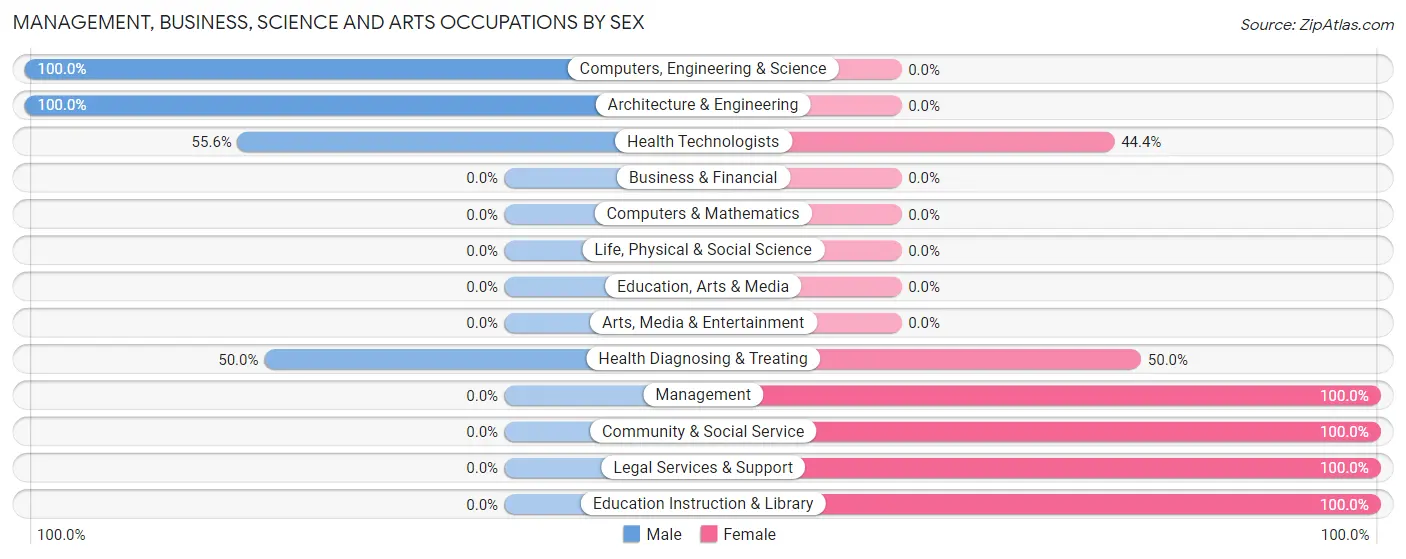
| Occupation | Male | Female |
| Management | 0 (0.0%) | 5 (100.0%) |
| Business & Financial | 0 (0.0%) | 0 (0.0%) |
| Computers, Engineering & Science | 5 (100.0%) | 0 (0.0%) |
| Computers & Mathematics | 0 (0.0%) | 0 (0.0%) |
| Architecture & Engineering | 5 (100.0%) | 0 (0.0%) |
| Life, Physical & Social Science | 0 (0.0%) | 0 (0.0%) |
| Community & Social Service | 0 (0.0%) | 6 (100.0%) |
| Education, Arts & Media | 0 (0.0%) | 0 (0.0%) |
| Legal Services & Support | 0 (0.0%) | 5 (100.0%) |
| Education Instruction & Library | 0 (0.0%) | 1 (100.0%) |
| Arts, Media & Entertainment | 0 (0.0%) | 0 (0.0%) |
| Health Diagnosing & Treating | 10 (50.0%) | 10 (50.0%) |
| Health Technologists | 10 (55.6%) | 8 (44.4%) |
| Total (Category) | 15 (41.7%) | 21 (58.3%) |
| Total (Overall) | 97 (46.9%) | 110 (53.1%) |
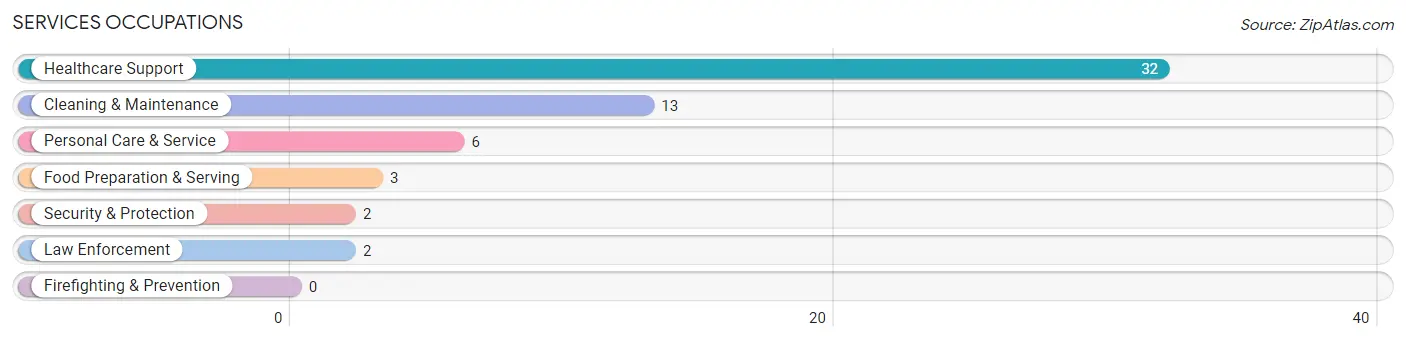
Services Occupations
The most common Services occupations in Farmington are Healthcare Support (32 | 15.5%), Cleaning & Maintenance (13 | 6.3%), Personal Care & Service (6 | 2.9%), Food Preparation & Serving (3 | 1.5%), and Security & Protection (2 | 1.0%).
Services Occupations by Sex
Within the Services occupations in Farmington, the most male-oriented occupations are Security & Protection (100.0%), Law Enforcement (100.0%), and Cleaning & Maintenance (69.2%), while the most female-oriented occupations are Healthcare Support (100.0%), Food Preparation & Serving (100.0%), and Personal Care & Service (100.0%).
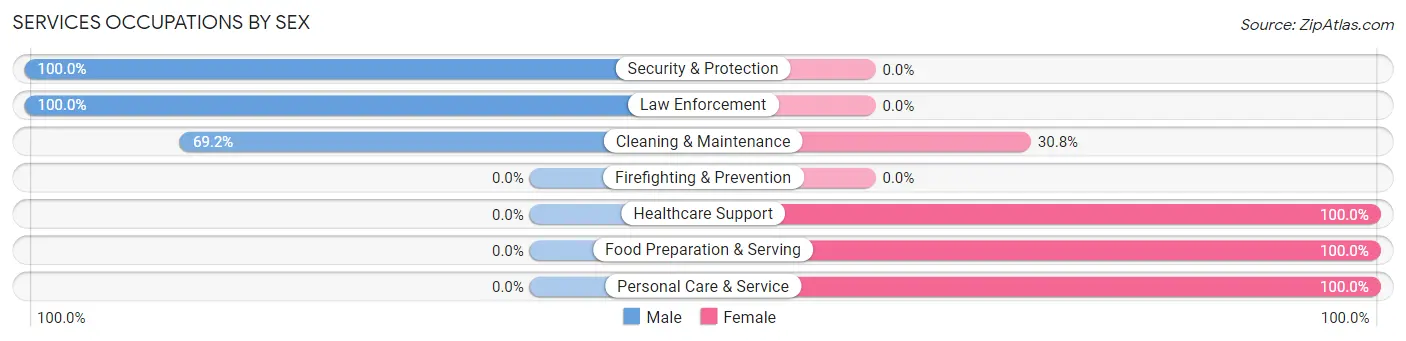
| Occupation | Male | Female |
| Healthcare Support | 0 (0.0%) | 32 (100.0%) |
| Security & Protection | 2 (100.0%) | 0 (0.0%) |
| Firefighting & Prevention | 0 (0.0%) | 0 (0.0%) |
| Law Enforcement | 2 (100.0%) | 0 (0.0%) |
| Food Preparation & Serving | 0 (0.0%) | 3 (100.0%) |
| Cleaning & Maintenance | 9 (69.2%) | 4 (30.8%) |
| Personal Care & Service | 0 (0.0%) | 6 (100.0%) |
| Total (Category) | 11 (19.6%) | 45 (80.4%) |
| Total (Overall) | 97 (46.9%) | 110 (53.1%) |
Sales and Office Occupations
The most common Sales and Office occupations in Farmington are Office & Administration (26 | 12.6%), and Sales & Related (17 | 8.2%).

Sales and Office Occupations by Sex
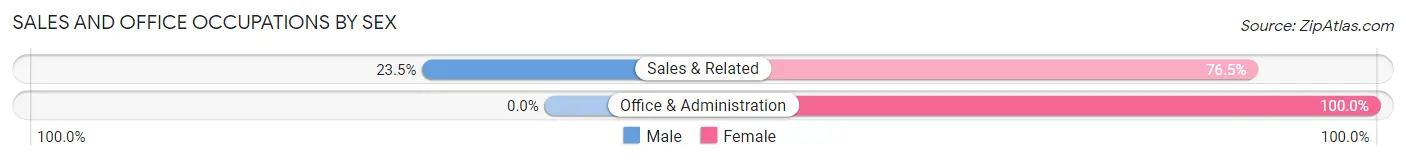
| Occupation | Male | Female |
| Sales & Related | 4 (23.5%) | 13 (76.5%) |
| Office & Administration | 0 (0.0%) | 26 (100.0%) |
| Total (Category) | 4 (9.3%) | 39 (90.7%) |
| Total (Overall) | 97 (46.9%) | 110 (53.1%) |
Natural Resources, Construction and Maintenance Occupations
The most common Natural Resources, Construction and Maintenance occupations in Farmington are Construction & Extraction (26 | 12.6%), and Installation, Maintenance & Repair (5 | 2.4%).
Natural Resources, Construction and Maintenance Occupations by Sex
| Occupation | Male | Female |
| Farming, Fishing & Forestry | 0 (0.0%) | 0 (0.0%) |
| Construction & Extraction | 26 (100.0%) | 0 (0.0%) |
| Installation, Maintenance & Repair | 0 (0.0%) | 5 (100.0%) |
| Total (Category) | 26 (83.9%) | 5 (16.1%) |
| Total (Overall) | 97 (46.9%) | 110 (53.1%) |
Production, Transportation and Moving Occupations
The most common Production, Transportation and Moving occupations in Farmington are Production (19 | 9.2%), Material Moving (14 | 6.8%), and Transportation (8 | 3.9%).
Production, Transportation and Moving Occupations by Sex
| Occupation | Male | Female |
| Production | 19 (100.0%) | 0 (0.0%) |
| Transportation | 8 (100.0%) | 0 (0.0%) |
| Material Moving | 14 (100.0%) | 0 (0.0%) |
| Total (Category) | 41 (100.0%) | 0 (0.0%) |
| Total (Overall) | 97 (46.9%) | 110 (53.1%) |
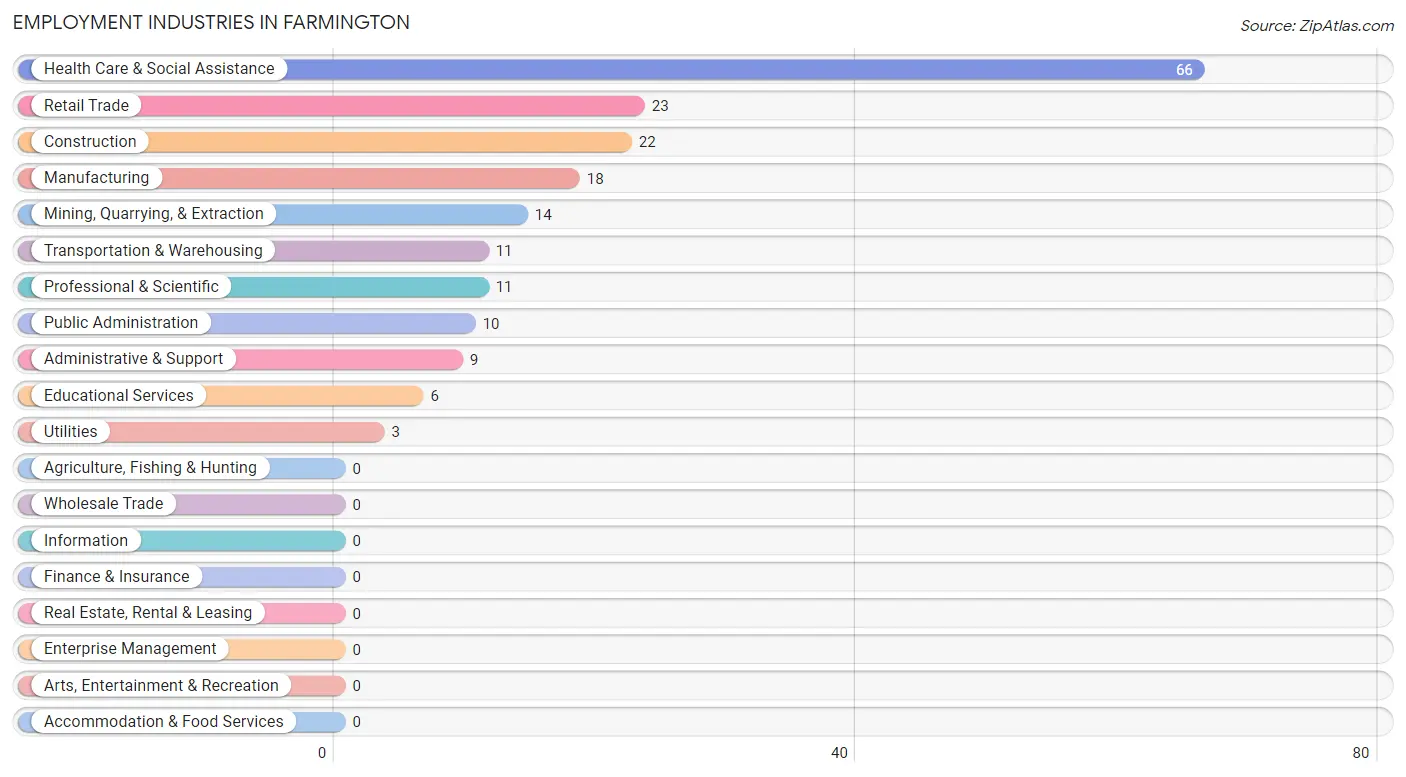
Employment Industries by Sex in Farmington
Employment Industries in Farmington
The major employment industries in Farmington include Health Care & Social Assistance (66 | 31.9%), Retail Trade (23 | 11.1%), Construction (22 | 10.6%), Manufacturing (18 | 8.7%), and Mining, Quarrying, & Extraction (14 | 6.8%).
Employment Industries by Sex in Farmington
The Farmington industries that see more men than women are Construction (100.0%), Manufacturing (100.0%), and Transportation & Warehousing (100.0%), whereas the industries that tend to have a higher number of women are Professional & Scientific (100.0%), Health Care & Social Assistance (84.9%), and Educational Services (83.3%).
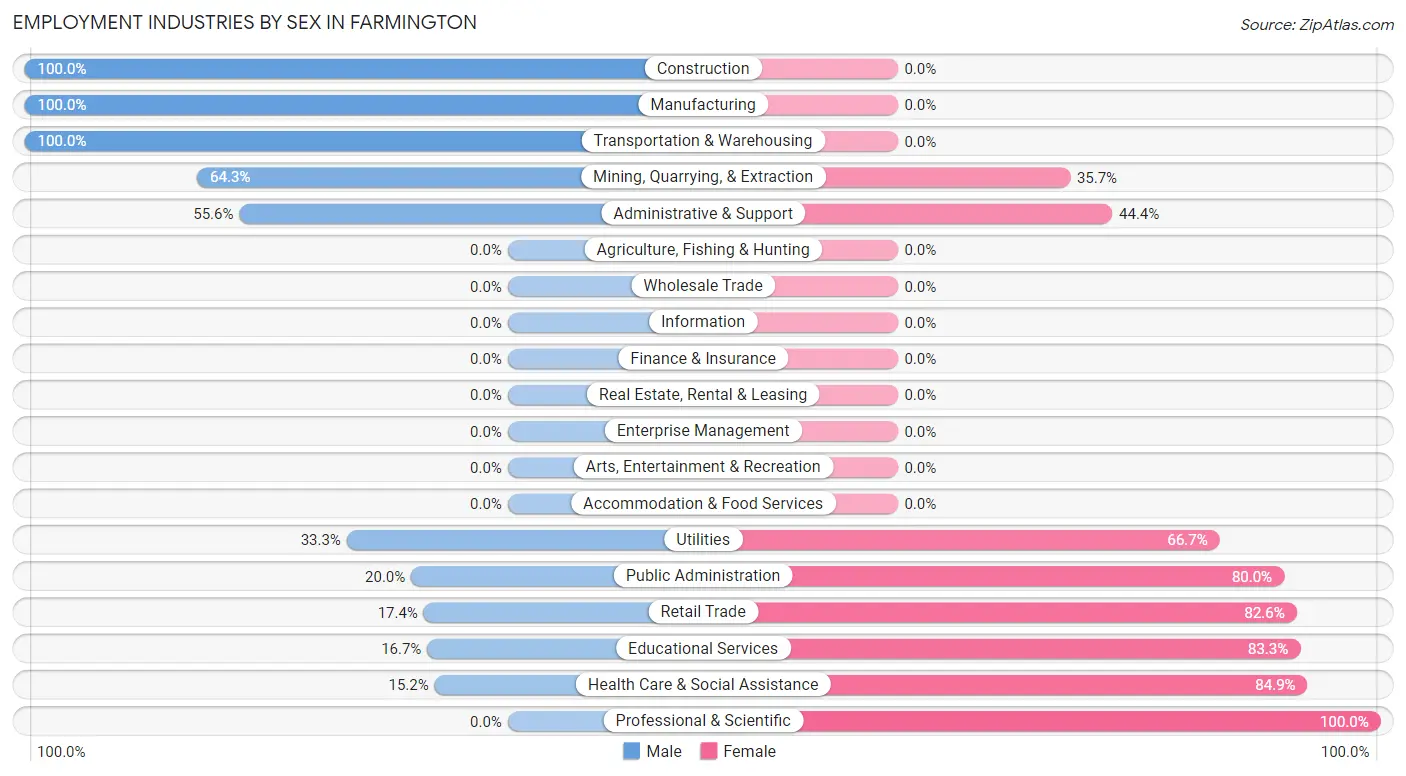
| Industry | Male | Female |
| Agriculture, Fishing & Hunting | 0 (0.0%) | 0 (0.0%) |
| Mining, Quarrying, & Extraction | 9 (64.3%) | 5 (35.7%) |
| Construction | 22 (100.0%) | 0 (0.0%) |
| Manufacturing | 18 (100.0%) | 0 (0.0%) |
| Wholesale Trade | 0 (0.0%) | 0 (0.0%) |
| Retail Trade | 4 (17.4%) | 19 (82.6%) |
| Transportation & Warehousing | 11 (100.0%) | 0 (0.0%) |
| Utilities | 1 (33.3%) | 2 (66.7%) |
| Information | 0 (0.0%) | 0 (0.0%) |
| Finance & Insurance | 0 (0.0%) | 0 (0.0%) |
| Real Estate, Rental & Leasing | 0 (0.0%) | 0 (0.0%) |
| Professional & Scientific | 0 (0.0%) | 11 (100.0%) |
| Enterprise Management | 0 (0.0%) | 0 (0.0%) |
| Administrative & Support | 5 (55.6%) | 4 (44.4%) |
| Educational Services | 1 (16.7%) | 5 (83.3%) |
| Health Care & Social Assistance | 10 (15.1%) | 56 (84.9%) |
| Arts, Entertainment & Recreation | 0 (0.0%) | 0 (0.0%) |
| Accommodation & Food Services | 0 (0.0%) | 0 (0.0%) |
| Public Administration | 2 (20.0%) | 8 (80.0%) |
| Total | 97 (46.9%) | 110 (53.1%) |
Education in Farmington
School Enrollment in Farmington
The most common levels of schooling among the 59 students in Farmington are high school (30 | 50.8%), middle school (22 | 37.3%), and nursery / preschool (4 | 6.8%).
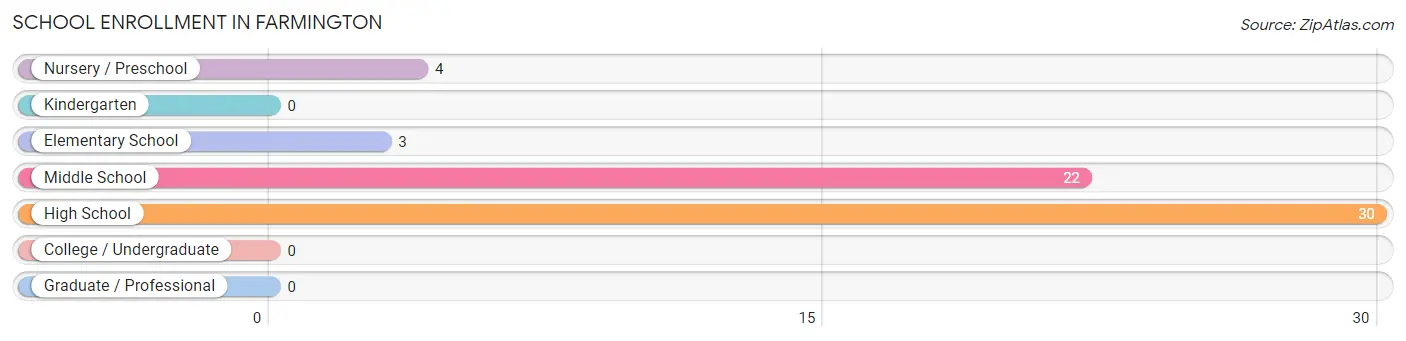
| School Level | # Students | % Students |
| Nursery / Preschool | 4 | 6.8% |
| Kindergarten | 0 | 0.0% |
| Elementary School | 3 | 5.1% |
| Middle School | 22 | 37.3% |
| High School | 30 | 50.8% |
| College / Undergraduate | 0 | 0.0% |
| Graduate / Professional | 0 | 0.0% |
| Total | 59 | 100.0% |
School Enrollment by Age by Funding Source in Farmington
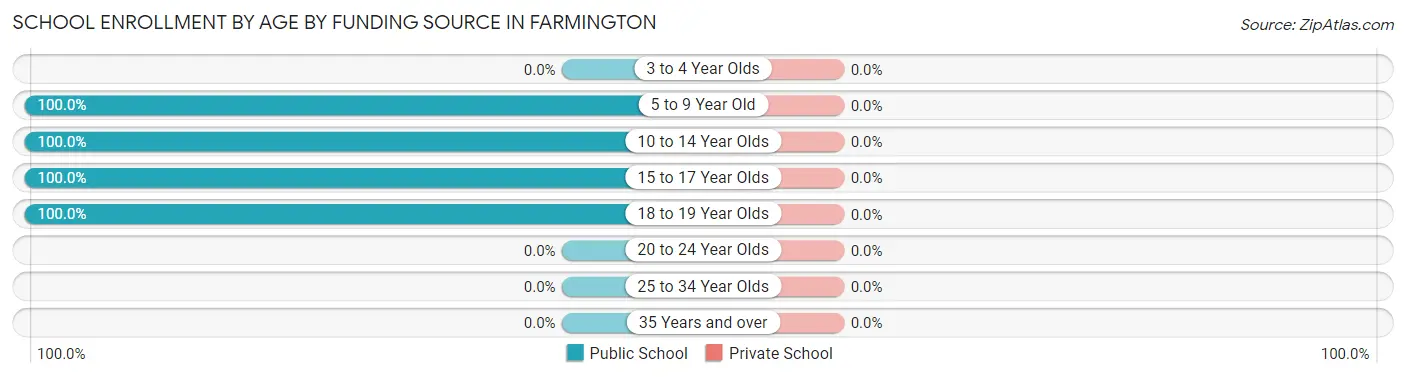
| Age Bracket | Public School | Private School |
| 3 to 4 Year Olds | 0 (0.0%) | 0 (0.0%) |
| 5 to 9 Year Old | 7 (100.0%) | 0 (0.0%) |
| 10 to 14 Year Olds | 22 (100.0%) | 0 (0.0%) |
| 15 to 17 Year Olds | 24 (100.0%) | 0 (0.0%) |
| 18 to 19 Year Olds | 6 (100.0%) | 0 (0.0%) |
| 20 to 24 Year Olds | 0 (0.0%) | 0 (0.0%) |
| 25 to 34 Year Olds | 0 (0.0%) | 0 (0.0%) |
| 35 Years and over | 0 (0.0%) | 0 (0.0%) |
| Total | 59 (100.0%) | 0 (0.0%) |
Educational Attainment by Field of Study in Farmington
Science & technology (11 | 28.2%), bio, nature & agricultural (10 | 25.6%), engineering (5 | 12.8%), arts & humanities (5 | 12.8%), and business (3 | 7.7%) are the most common fields of study among 39 individuals in Farmington who have obtained a bachelor's degree or higher.
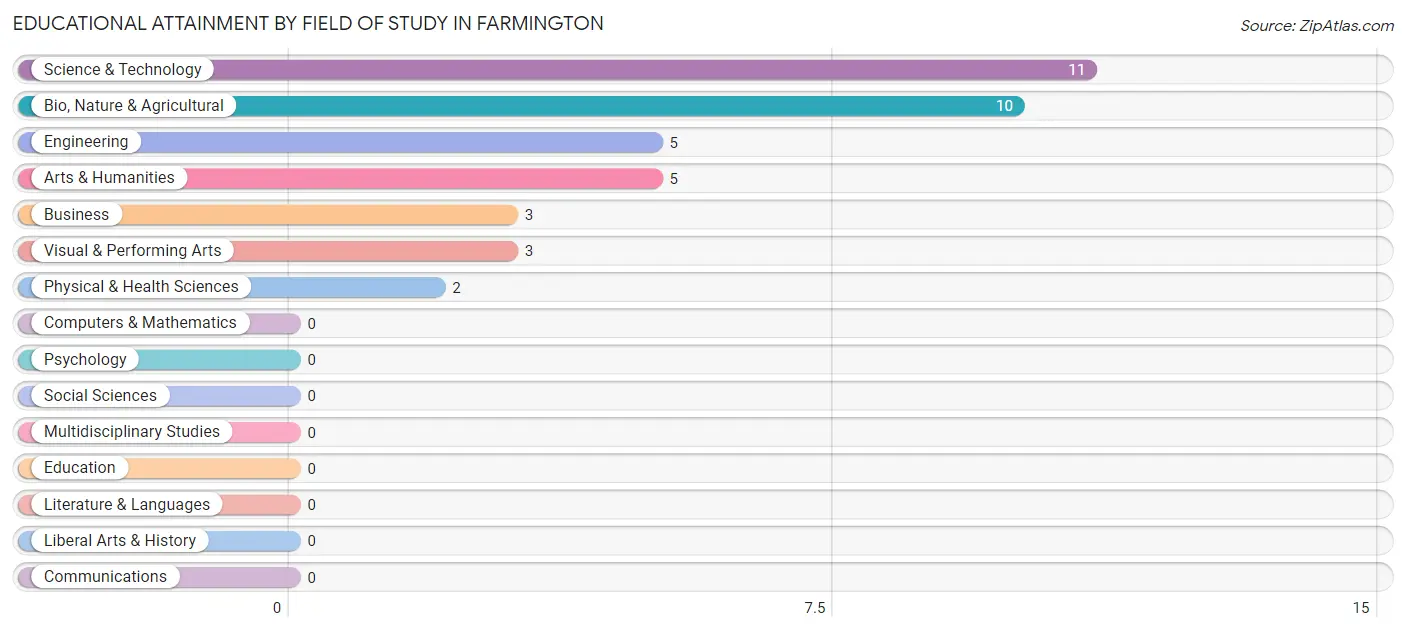
| Field of Study | # Graduates | % Graduates |
| Computers & Mathematics | 0 | 0.0% |
| Bio, Nature & Agricultural | 10 | 25.6% |
| Physical & Health Sciences | 2 | 5.1% |
| Psychology | 0 | 0.0% |
| Social Sciences | 0 | 0.0% |
| Engineering | 5 | 12.8% |
| Multidisciplinary Studies | 0 | 0.0% |
| Science & Technology | 11 | 28.2% |
| Business | 3 | 7.7% |
| Education | 0 | 0.0% |
| Literature & Languages | 0 | 0.0% |
| Liberal Arts & History | 0 | 0.0% |
| Visual & Performing Arts | 3 | 7.7% |
| Communications | 0 | 0.0% |
| Arts & Humanities | 5 | 12.8% |
| Total | 39 | 100.0% |
Transportation & Commute in Farmington
Vehicle Availability by Sex in Farmington
The most prevalent vehicle ownership categories in Farmington are males with 2 vehicles (43, accounting for 46.2%) and females with 2 vehicles (31, making up 39.1%).
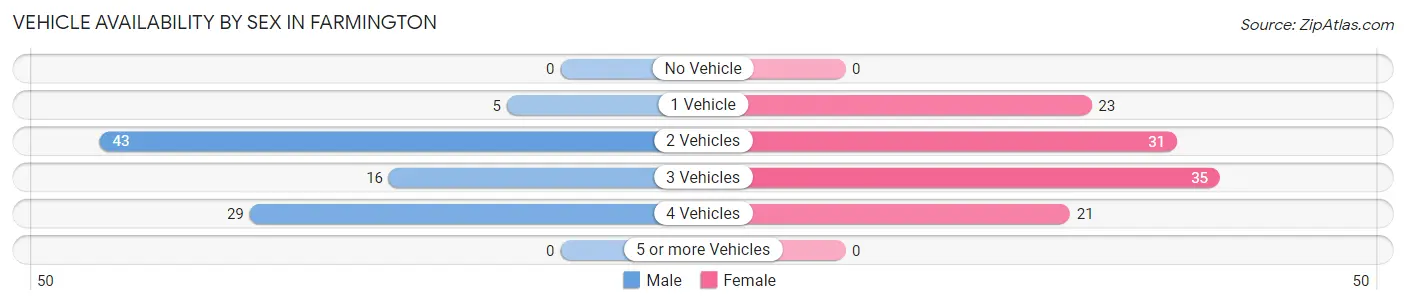
| Vehicles Available | Male | Female |
| No Vehicle | 0 (0.0%) | 0 (0.0%) |
| 1 Vehicle | 5 (5.4%) | 23 (20.9%) |
| 2 Vehicles | 43 (46.2%) | 31 (28.2%) |
| 3 Vehicles | 16 (17.2%) | 35 (31.8%) |
| 4 Vehicles | 29 (31.2%) | 21 (19.1%) |
| 5 or more Vehicles | 0 (0.0%) | 0 (0.0%) |
| Total | 93 (100.0%) | 110 (100.0%) |
Commute Time in Farmington
The most frequently occuring commute durations in Farmington are 20 to 24 minutes (66 commuters, 32.8%), 30 to 34 minutes (35 commuters, 17.4%), and 45 to 59 minutes (25 commuters, 12.4%).
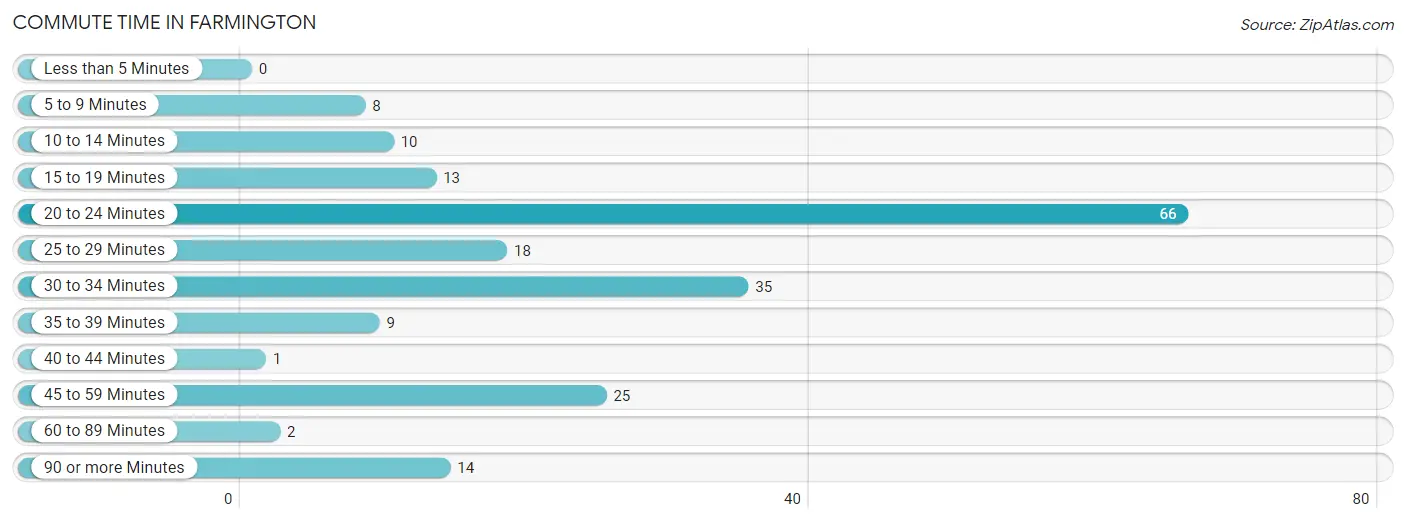
| Commute Time | # Commuters | % Commuters |
| Less than 5 Minutes | 0 | 0.0% |
| 5 to 9 Minutes | 8 | 4.0% |
| 10 to 14 Minutes | 10 | 5.0% |
| 15 to 19 Minutes | 13 | 6.5% |
| 20 to 24 Minutes | 66 | 32.8% |
| 25 to 29 Minutes | 18 | 9.0% |
| 30 to 34 Minutes | 35 | 17.4% |
| 35 to 39 Minutes | 9 | 4.5% |
| 40 to 44 Minutes | 1 | 0.5% |
| 45 to 59 Minutes | 25 | 12.4% |
| 60 to 89 Minutes | 2 | 1.0% |
| 90 or more Minutes | 14 | 7.0% |
Commute Time by Sex in Farmington
The most common commute times in Farmington are 20 to 24 minutes (20 commuters, 21.5%) for males and 20 to 24 minutes (46 commuters, 42.6%) for females.
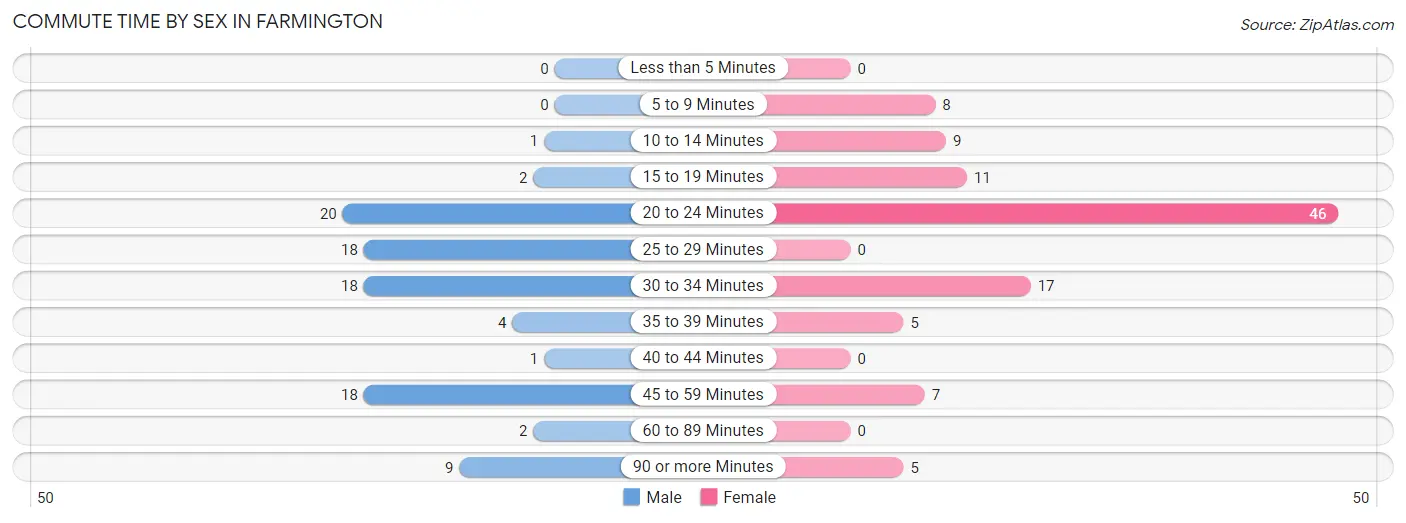
| Commute Time | Male | Female |
| Less than 5 Minutes | 0 (0.0%) | 0 (0.0%) |
| 5 to 9 Minutes | 0 (0.0%) | 8 (7.4%) |
| 10 to 14 Minutes | 1 (1.1%) | 9 (8.3%) |
| 15 to 19 Minutes | 2 (2.1%) | 11 (10.2%) |
| 20 to 24 Minutes | 20 (21.5%) | 46 (42.6%) |
| 25 to 29 Minutes | 18 (19.4%) | 0 (0.0%) |
| 30 to 34 Minutes | 18 (19.4%) | 17 (15.7%) |
| 35 to 39 Minutes | 4 (4.3%) | 5 (4.6%) |
| 40 to 44 Minutes | 1 (1.1%) | 0 (0.0%) |
| 45 to 59 Minutes | 18 (19.4%) | 7 (6.5%) |
| 60 to 89 Minutes | 2 (2.1%) | 0 (0.0%) |
| 90 or more Minutes | 9 (9.7%) | 5 (4.6%) |
Time of Departure to Work by Sex in Farmington
The most frequent times of departure to work in Farmington are 5:30 AM to 5:59 AM (27, 29.0%) for males and 7:30 AM to 7:59 AM (49, 45.4%) for females.
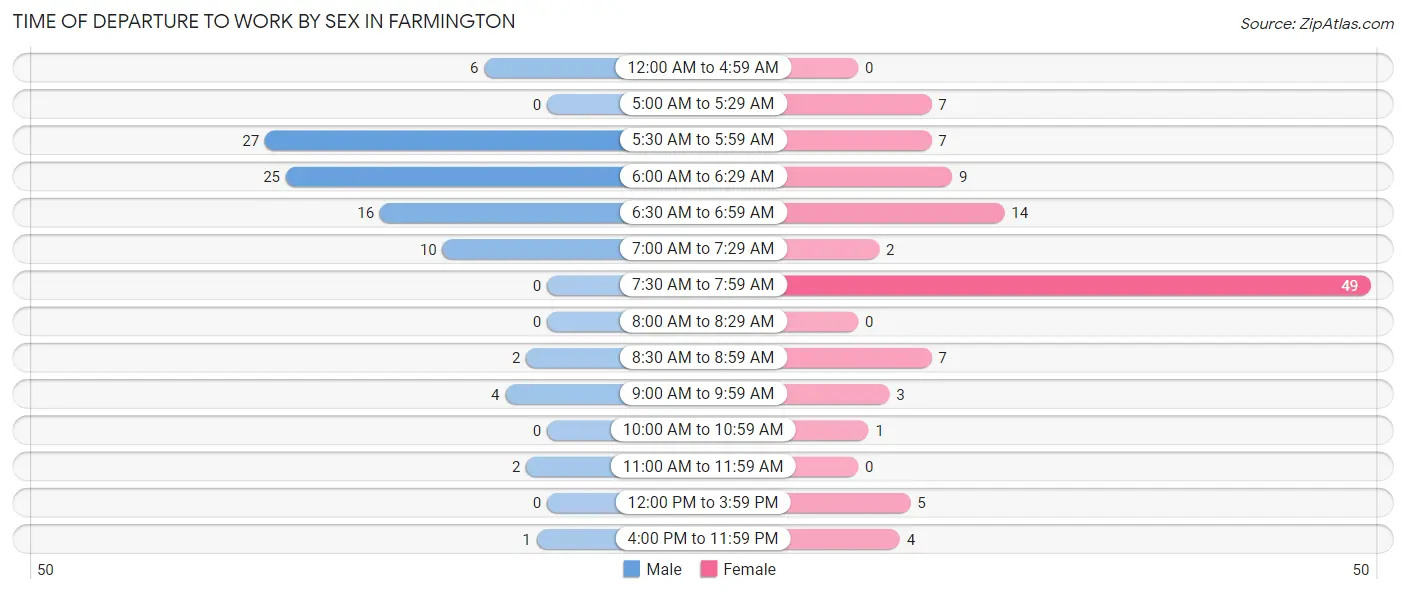
| Time of Departure | Male | Female |
| 12:00 AM to 4:59 AM | 6 (6.5%) | 0 (0.0%) |
| 5:00 AM to 5:29 AM | 0 (0.0%) | 7 (6.5%) |
| 5:30 AM to 5:59 AM | 27 (29.0%) | 7 (6.5%) |
| 6:00 AM to 6:29 AM | 25 (26.9%) | 9 (8.3%) |
| 6:30 AM to 6:59 AM | 16 (17.2%) | 14 (13.0%) |
| 7:00 AM to 7:29 AM | 10 (10.7%) | 2 (1.8%) |
| 7:30 AM to 7:59 AM | 0 (0.0%) | 49 (45.4%) |
| 8:00 AM to 8:29 AM | 0 (0.0%) | 0 (0.0%) |
| 8:30 AM to 8:59 AM | 2 (2.1%) | 7 (6.5%) |
| 9:00 AM to 9:59 AM | 4 (4.3%) | 3 (2.8%) |
| 10:00 AM to 10:59 AM | 0 (0.0%) | 1 (0.9%) |
| 11:00 AM to 11:59 AM | 2 (2.1%) | 0 (0.0%) |
| 12:00 PM to 3:59 PM | 0 (0.0%) | 5 (4.6%) |
| 4:00 PM to 11:59 PM | 1 (1.1%) | 4 (3.7%) |
| Total | 93 (100.0%) | 108 (100.0%) |
Housing Occupancy in Farmington
Occupancy by Ownership in Farmington
Of the total 132 dwellings in Farmington, owner-occupied units account for 105 (79.5%), while renter-occupied units make up 27 (20.4%).
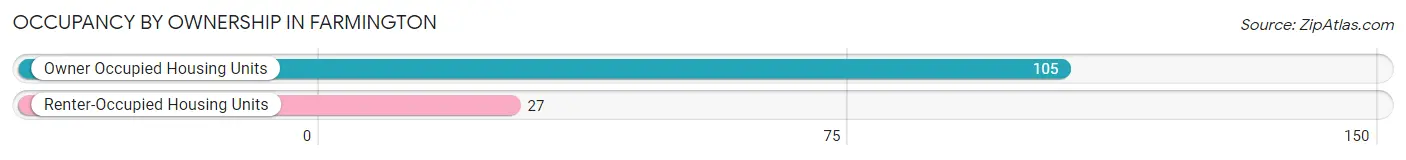
| Occupancy | # Housing Units | % Housing Units |
| Owner Occupied Housing Units | 105 | 79.5% |
| Renter-Occupied Housing Units | 27 | 20.4% |
| Total Occupied Housing Units | 132 | 100.0% |
Occupancy by Household Size in Farmington
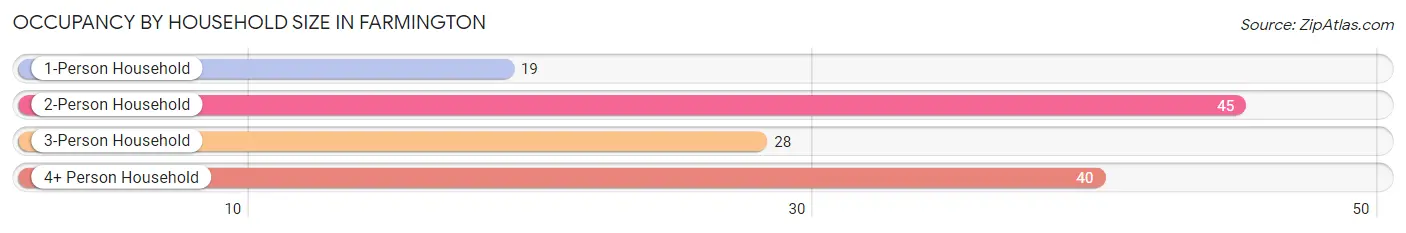
| Household Size | # Housing Units | % Housing Units |
| 1-Person Household | 19 | 14.4% |
| 2-Person Household | 45 | 34.1% |
| 3-Person Household | 28 | 21.2% |
| 4+ Person Household | 40 | 30.3% |
| Total Housing Units | 132 | 100.0% |
Occupancy by Ownership by Household Size in Farmington
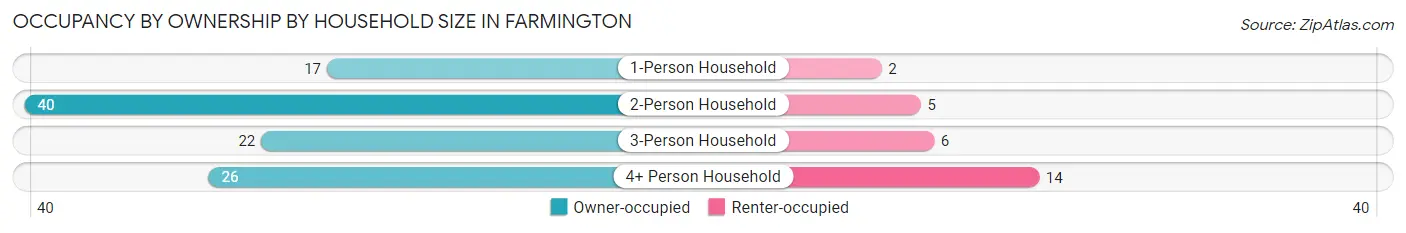
| Household Size | Owner-occupied | Renter-occupied |
| 1-Person Household | 17 (89.5%) | 2 (10.5%) |
| 2-Person Household | 40 (88.9%) | 5 (11.1%) |
| 3-Person Household | 22 (78.6%) | 6 (21.4%) |
| 4+ Person Household | 26 (65.0%) | 14 (35.0%) |
| Total Housing Units | 105 (79.5%) | 27 (20.4%) |
Occupancy by Educational Attainment in Farmington
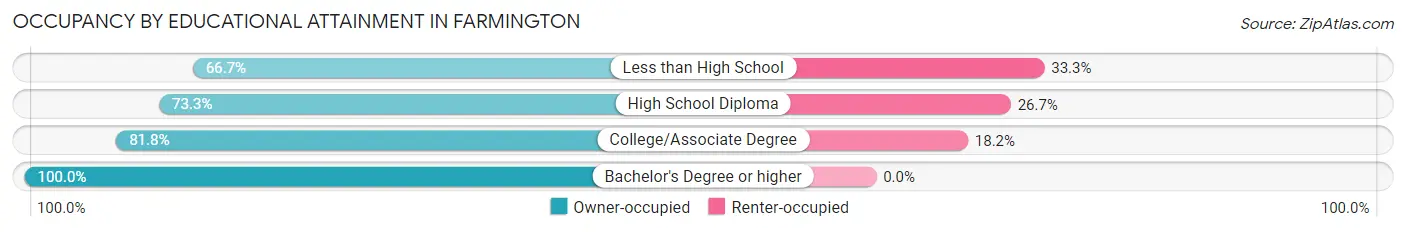
| Household Size | Owner-occupied | Renter-occupied |
| Less than High School | 10 (66.7%) | 5 (33.3%) |
| High School Diploma | 44 (73.3%) | 16 (26.7%) |
| College/Associate Degree | 27 (81.8%) | 6 (18.2%) |
| Bachelor's Degree or higher | 24 (100.0%) | 0 (0.0%) |
Occupancy by Age of Householder in Farmington
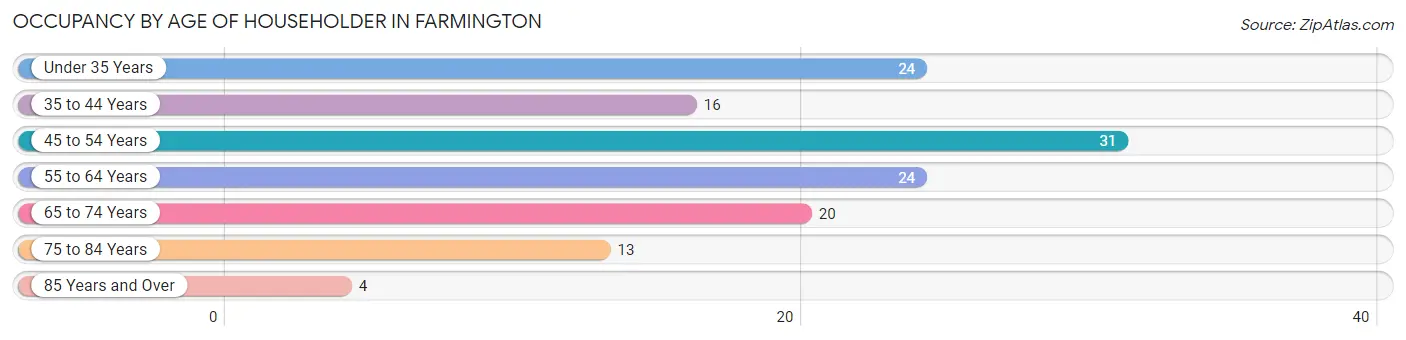
| Age Bracket | # Households | % Households |
| Under 35 Years | 24 | 18.2% |
| 35 to 44 Years | 16 | 12.1% |
| 45 to 54 Years | 31 | 23.5% |
| 55 to 64 Years | 24 | 18.2% |
| 65 to 74 Years | 20 | 15.1% |
| 75 to 84 Years | 13 | 9.9% |
| 85 Years and Over | 4 | 3.0% |
| Total | 132 | 100.0% |
Housing Finances in Farmington
Median Income by Occupancy in Farmington
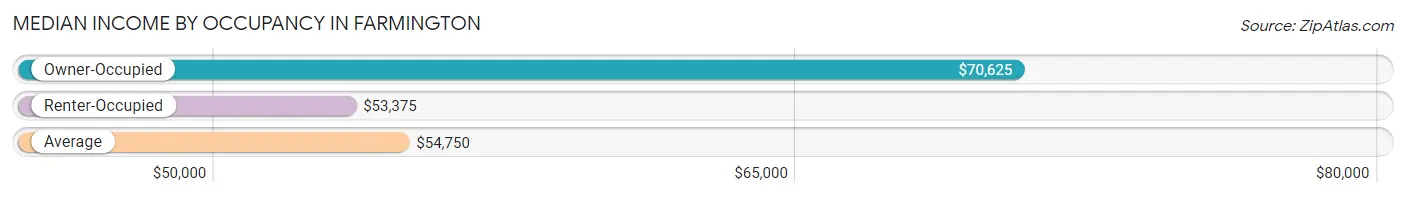
| Occupancy Type | # Households | Median Income |
| Owner-Occupied | 105 (79.5%) | $70,625 |
| Renter-Occupied | 27 (20.4%) | $53,375 |
| Average | 132 (100.0%) | $54,750 |
Occupancy by Householder Income Bracket in Farmington
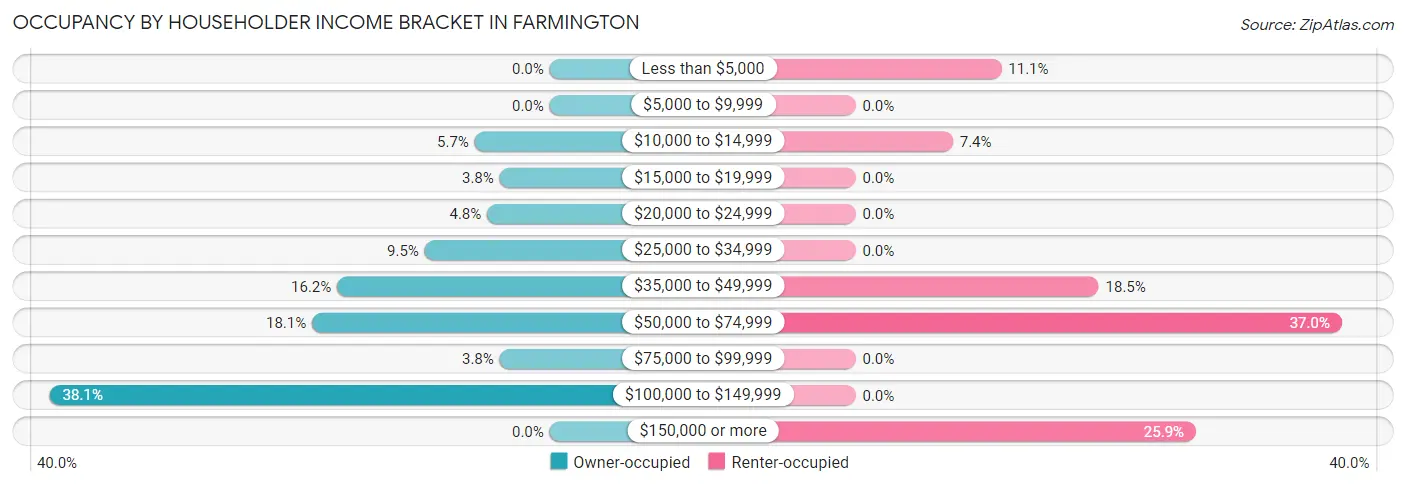
| Income Bracket | Owner-occupied | Renter-occupied |
| Less than $5,000 | 0 (0.0%) | 3 (11.1%) |
| $5,000 to $9,999 | 0 (0.0%) | 0 (0.0%) |
| $10,000 to $14,999 | 6 (5.7%) | 2 (7.4%) |
| $15,000 to $19,999 | 4 (3.8%) | 0 (0.0%) |
| $20,000 to $24,999 | 5 (4.8%) | 0 (0.0%) |
| $25,000 to $34,999 | 10 (9.5%) | 0 (0.0%) |
| $35,000 to $49,999 | 17 (16.2%) | 5 (18.5%) |
| $50,000 to $74,999 | 19 (18.1%) | 10 (37.0%) |
| $75,000 to $99,999 | 4 (3.8%) | 0 (0.0%) |
| $100,000 to $149,999 | 40 (38.1%) | 0 (0.0%) |
| $150,000 or more | 0 (0.0%) | 7 (25.9%) |
| Total | 105 (100.0%) | 27 (100.0%) |
Monthly Housing Cost Tiers in Farmington
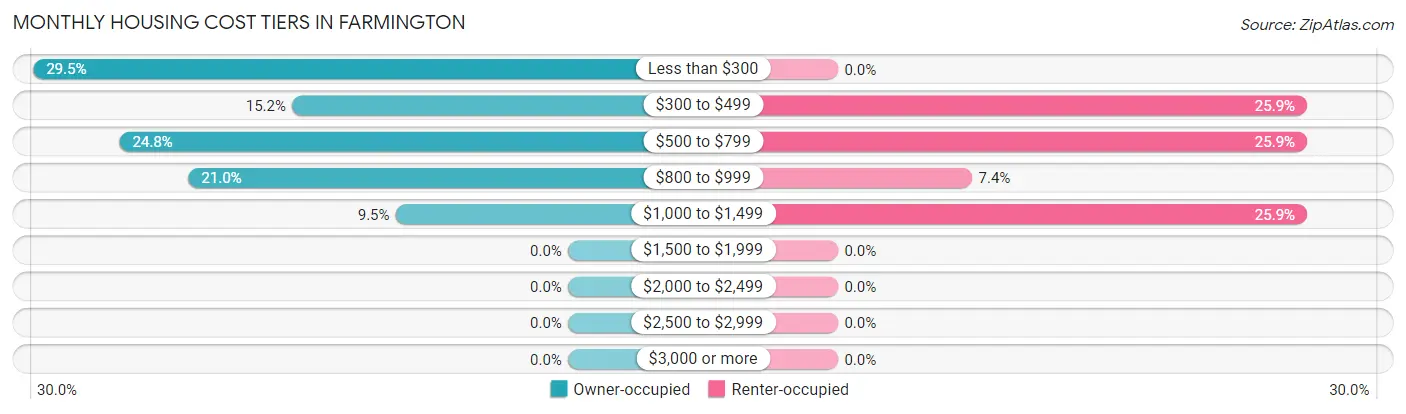
| Monthly Cost | Owner-occupied | Renter-occupied |
| Less than $300 | 31 (29.5%) | 0 (0.0%) |
| $300 to $499 | 16 (15.2%) | 7 (25.9%) |
| $500 to $799 | 26 (24.8%) | 7 (25.9%) |
| $800 to $999 | 22 (20.9%) | 2 (7.4%) |
| $1,000 to $1,499 | 10 (9.5%) | 7 (25.9%) |
| $1,500 to $1,999 | 0 (0.0%) | 0 (0.0%) |
| $2,000 to $2,499 | 0 (0.0%) | 0 (0.0%) |
| $2,500 to $2,999 | 0 (0.0%) | 0 (0.0%) |
| $3,000 or more | 0 (0.0%) | 0 (0.0%) |
| Total | 105 (100.0%) | 27 (100.0%) |
Physical Housing Characteristics in Farmington
Housing Structures in Farmington
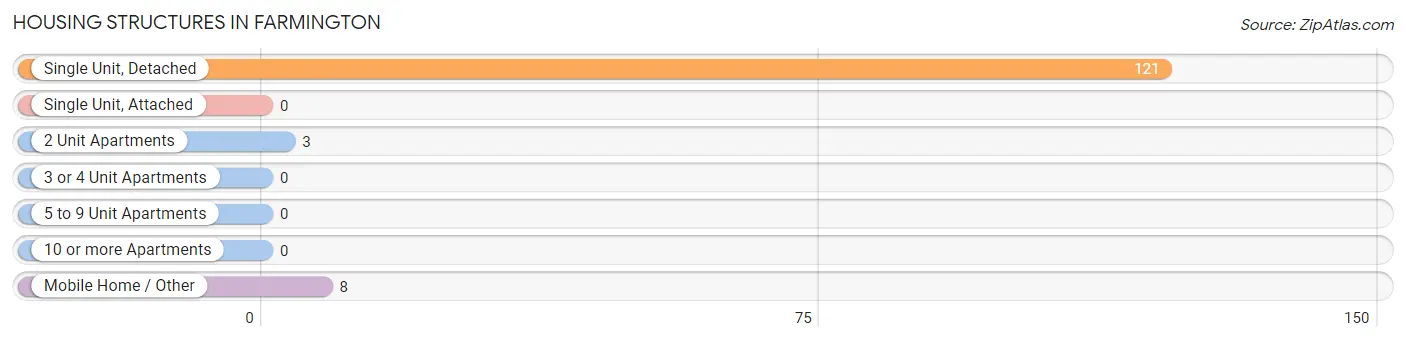
| Structure Type | # Housing Units | % Housing Units |
| Single Unit, Detached | 121 | 91.7% |
| Single Unit, Attached | 0 | 0.0% |
| 2 Unit Apartments | 3 | 2.3% |
| 3 or 4 Unit Apartments | 0 | 0.0% |
| 5 to 9 Unit Apartments | 0 | 0.0% |
| 10 or more Apartments | 0 | 0.0% |
| Mobile Home / Other | 8 | 6.1% |
| Total | 132 | 100.0% |
Housing Structures by Occupancy in Farmington
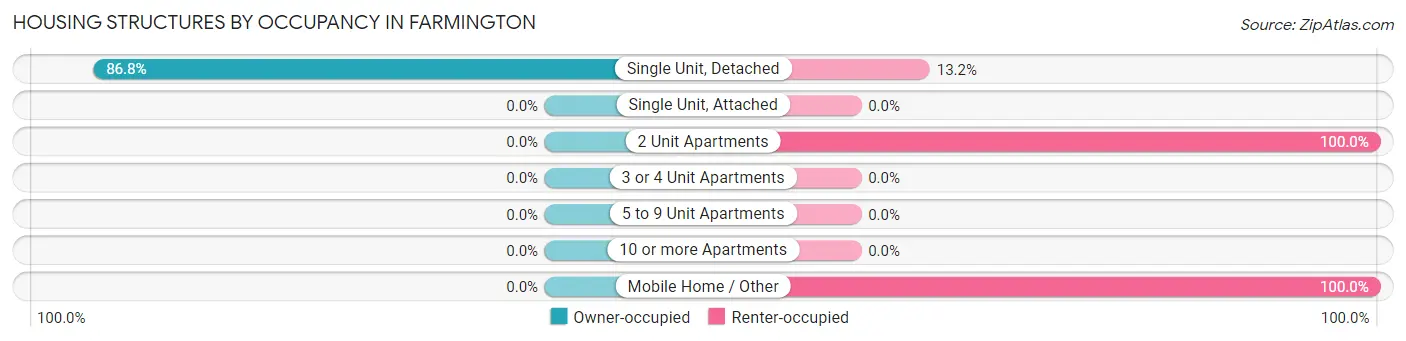
| Structure Type | Owner-occupied | Renter-occupied |
| Single Unit, Detached | 105 (86.8%) | 16 (13.2%) |
| Single Unit, Attached | 0 (0.0%) | 0 (0.0%) |
| 2 Unit Apartments | 0 (0.0%) | 3 (100.0%) |
| 3 or 4 Unit Apartments | 0 (0.0%) | 0 (0.0%) |
| 5 to 9 Unit Apartments | 0 (0.0%) | 0 (0.0%) |
| 10 or more Apartments | 0 (0.0%) | 0 (0.0%) |
| Mobile Home / Other | 0 (0.0%) | 8 (100.0%) |
| Total | 105 (79.5%) | 27 (20.4%) |
Housing Structures by Number of Rooms in Farmington
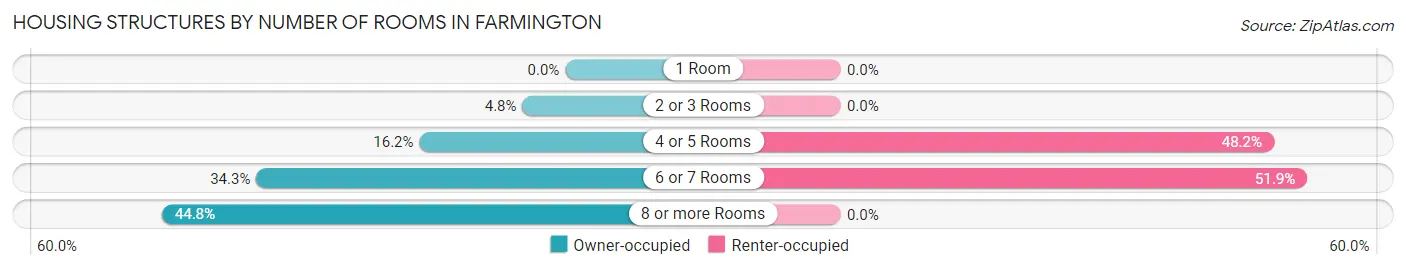
| Number of Rooms | Owner-occupied | Renter-occupied |
| 1 Room | 0 (0.0%) | 0 (0.0%) |
| 2 or 3 Rooms | 5 (4.8%) | 0 (0.0%) |
| 4 or 5 Rooms | 17 (16.2%) | 13 (48.1%) |
| 6 or 7 Rooms | 36 (34.3%) | 14 (51.8%) |
| 8 or more Rooms | 47 (44.8%) | 0 (0.0%) |
| Total | 105 (100.0%) | 27 (100.0%) |
Housing Structure by Heating Type in Farmington
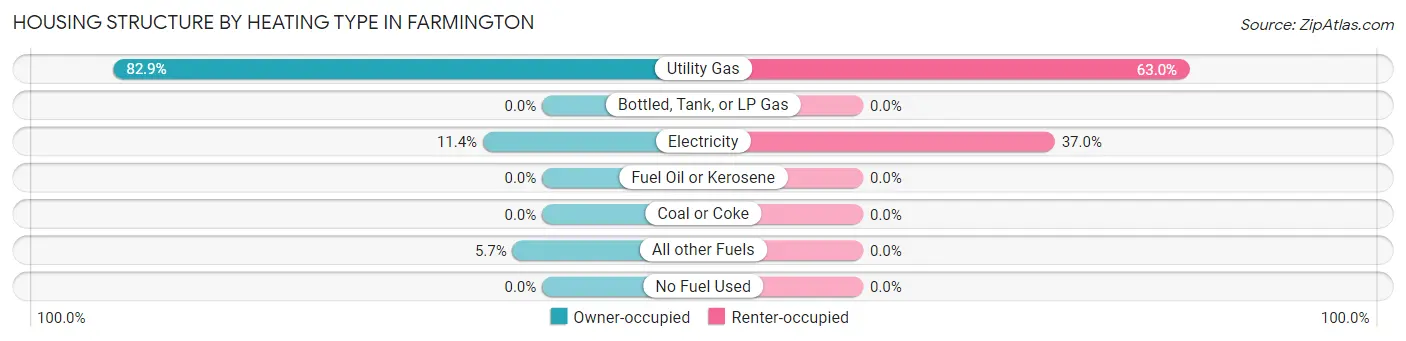
| Heating Type | Owner-occupied | Renter-occupied |
| Utility Gas | 87 (82.9%) | 17 (63.0%) |
| Bottled, Tank, or LP Gas | 0 (0.0%) | 0 (0.0%) |
| Electricity | 12 (11.4%) | 10 (37.0%) |
| Fuel Oil or Kerosene | 0 (0.0%) | 0 (0.0%) |
| Coal or Coke | 0 (0.0%) | 0 (0.0%) |
| All other Fuels | 6 (5.7%) | 0 (0.0%) |
| No Fuel Used | 0 (0.0%) | 0 (0.0%) |
| Total | 105 (100.0%) | 27 (100.0%) |
Household Vehicle Usage in Farmington
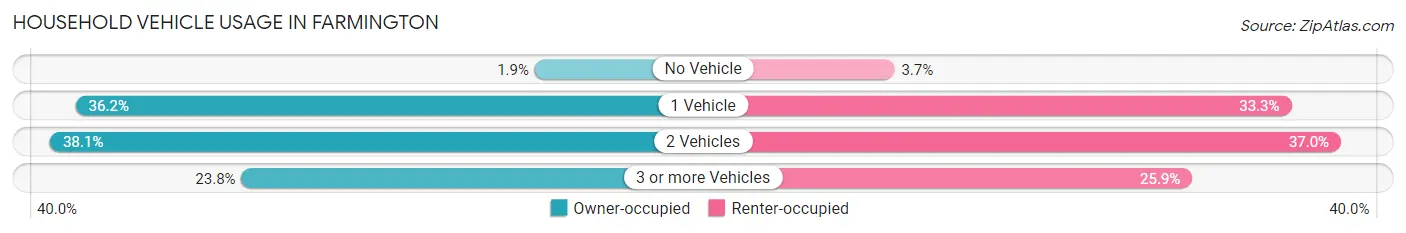
| Vehicles per Household | Owner-occupied | Renter-occupied |
| No Vehicle | 2 (1.9%) | 1 (3.7%) |
| 1 Vehicle | 38 (36.2%) | 9 (33.3%) |
| 2 Vehicles | 40 (38.1%) | 10 (37.0%) |
| 3 or more Vehicles | 25 (23.8%) | 7 (25.9%) |
| Total | 105 (100.0%) | 27 (100.0%) |
Real Estate & Mortgages in Farmington
Real Estate and Mortgage Overview in Farmington
| Characteristic | Without Mortgage | With Mortgage |
| Housing Units | 52 | 53 |
| Median Property Value | $70,000 | $73,900 |
| Median Household Income | $46,875 | $0 |
| Monthly Housing Costs | $287 | $0 |
| Real Estate Taxes | $638 | $0 |
Property Value by Mortgage Status in Farmington
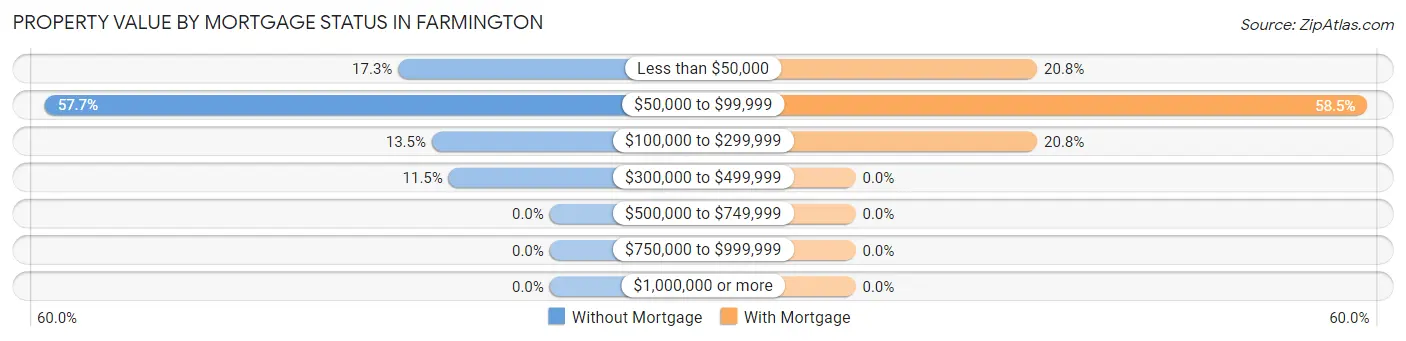
| Property Value | Without Mortgage | With Mortgage |
| Less than $50,000 | 9 (17.3%) | 11 (20.7%) |
| $50,000 to $99,999 | 30 (57.7%) | 31 (58.5%) |
| $100,000 to $299,999 | 7 (13.5%) | 11 (20.7%) |
| $300,000 to $499,999 | 6 (11.5%) | 0 (0.0%) |
| $500,000 to $749,999 | 0 (0.0%) | 0 (0.0%) |
| $750,000 to $999,999 | 0 (0.0%) | 0 (0.0%) |
| $1,000,000 or more | 0 (0.0%) | 0 (0.0%) |
| Total | 52 (100.0%) | 53 (100.0%) |
Household Income by Mortgage Status in Farmington
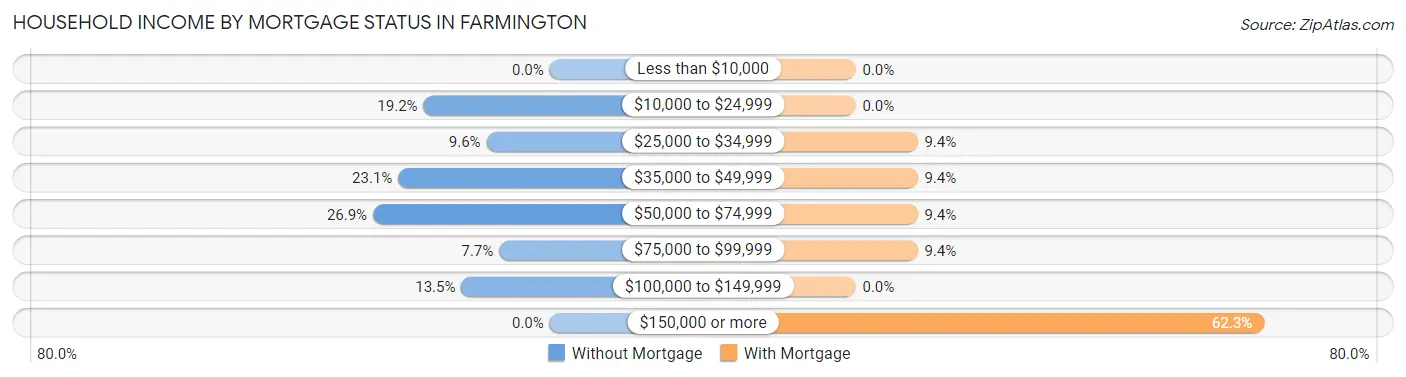
| Household Income | Without Mortgage | With Mortgage |
| Less than $10,000 | 0 (0.0%) | 0 (0.0%) |
| $10,000 to $24,999 | 10 (19.2%) | 0 (0.0%) |
| $25,000 to $34,999 | 5 (9.6%) | 5 (9.4%) |
| $35,000 to $49,999 | 12 (23.1%) | 5 (9.4%) |
| $50,000 to $74,999 | 14 (26.9%) | 5 (9.4%) |
| $75,000 to $99,999 | 4 (7.7%) | 5 (9.4%) |
| $100,000 to $149,999 | 7 (13.5%) | 0 (0.0%) |
| $150,000 or more | 0 (0.0%) | 33 (62.3%) |
| Total | 52 (100.0%) | 53 (100.0%) |
Property Value to Household Income Ratio in Farmington
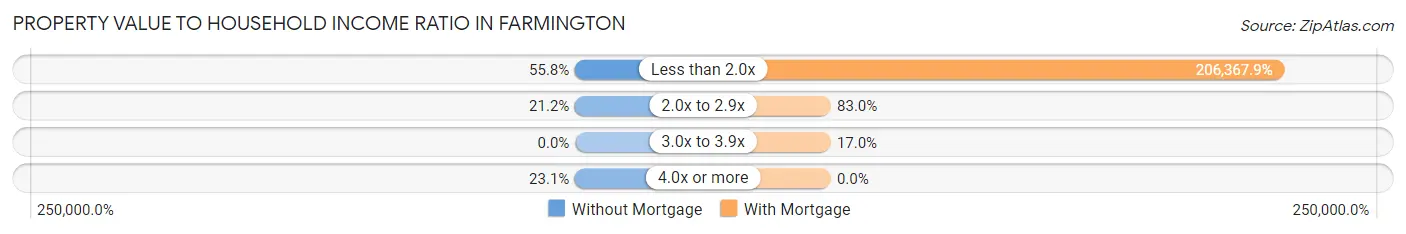
| Value-to-Income Ratio | Without Mortgage | With Mortgage |
| Less than 2.0x | 29 (55.8%) | 109,375 (206,367.9%) |
| 2.0x to 2.9x | 11 (21.1%) | 44 (83.0%) |
| 3.0x to 3.9x | 0 (0.0%) | 9 (17.0%) |
| 4.0x or more | 12 (23.1%) | 0 (0.0%) |
| Total | 52 (100.0%) | 53 (100.0%) |
Real Estate Taxes by Mortgage Status in Farmington
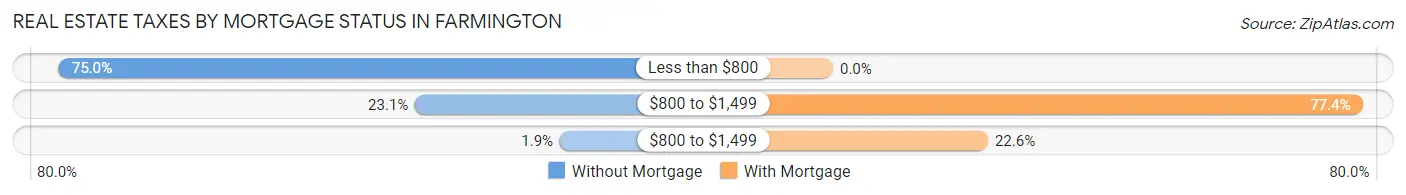
| Property Taxes | Without Mortgage | With Mortgage |
| Less than $800 | 39 (75.0%) | 0 (0.0%) |
| $800 to $1,499 | 12 (23.1%) | 41 (77.4%) |
| $800 to $1,499 | 1 (1.9%) | 12 (22.6%) |
| Total | 52 (100.0%) | 53 (100.0%) |
Health & Disability in Farmington
Health Insurance Coverage by Age in Farmington
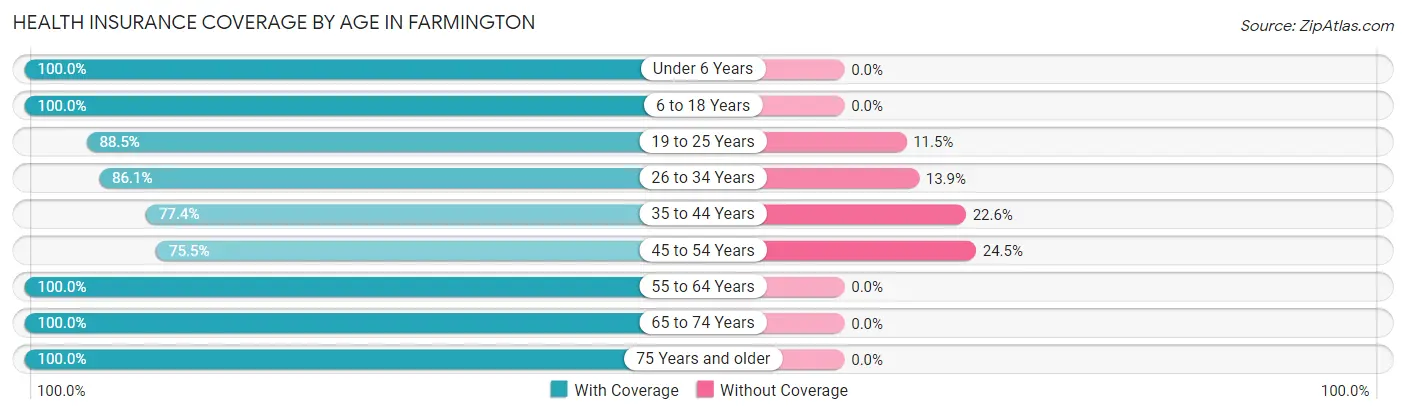
| Age Bracket | With Coverage | Without Coverage |
| Under 6 Years | 53 (100.0%) | 0 (0.0%) |
| 6 to 18 Years | 59 (100.0%) | 0 (0.0%) |
| 19 to 25 Years | 46 (88.5%) | 6 (11.5%) |
| 26 to 34 Years | 31 (86.1%) | 5 (13.9%) |
| 35 to 44 Years | 41 (77.4%) | 12 (22.6%) |
| 45 to 54 Years | 40 (75.5%) | 13 (24.5%) |
| 55 to 64 Years | 49 (100.0%) | 0 (0.0%) |
| 65 to 74 Years | 33 (100.0%) | 0 (0.0%) |
| 75 Years and older | 34 (100.0%) | 0 (0.0%) |
| Total | 386 (91.5%) | 36 (8.5%) |
Health Insurance Coverage by Citizenship Status in Farmington
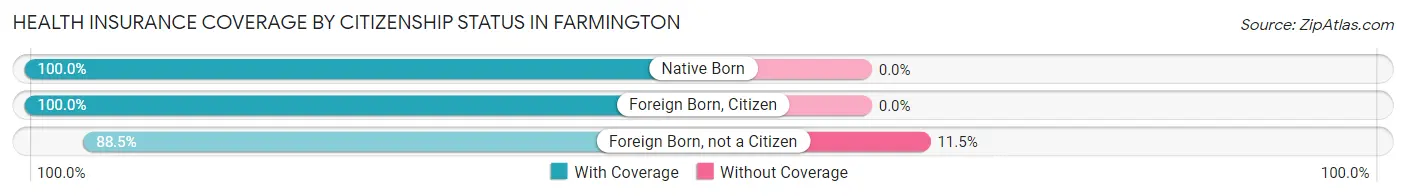
| Citizenship Status | With Coverage | Without Coverage |
| Native Born | 53 (100.0%) | 0 (0.0%) |
| Foreign Born, Citizen | 59 (100.0%) | 0 (0.0%) |
| Foreign Born, not a Citizen | 46 (88.5%) | 6 (11.5%) |
Health Insurance Coverage by Household Income in Farmington
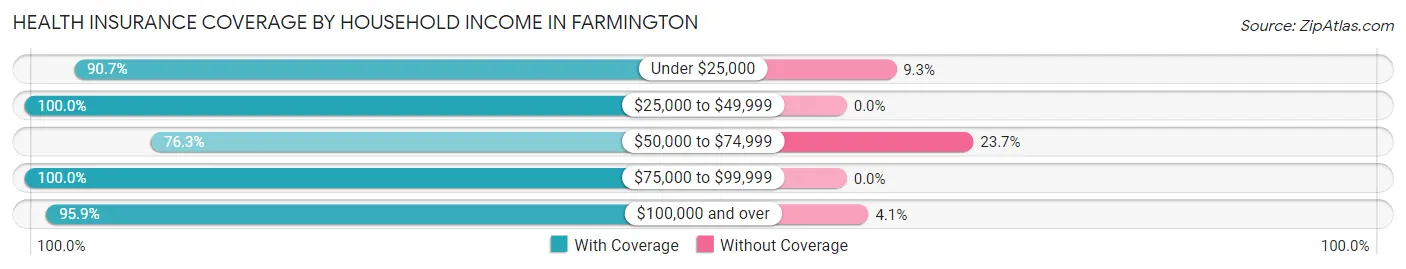
| Household Income | With Coverage | Without Coverage |
| Under $25,000 | 49 (90.7%) | 5 (9.3%) |
| $25,000 to $49,999 | 63 (100.0%) | 0 (0.0%) |
| $50,000 to $74,999 | 74 (76.3%) | 23 (23.7%) |
| $75,000 to $99,999 | 11 (100.0%) | 0 (0.0%) |
| $100,000 and over | 189 (95.9%) | 8 (4.1%) |
Public vs Private Health Insurance Coverage by Age in Farmington
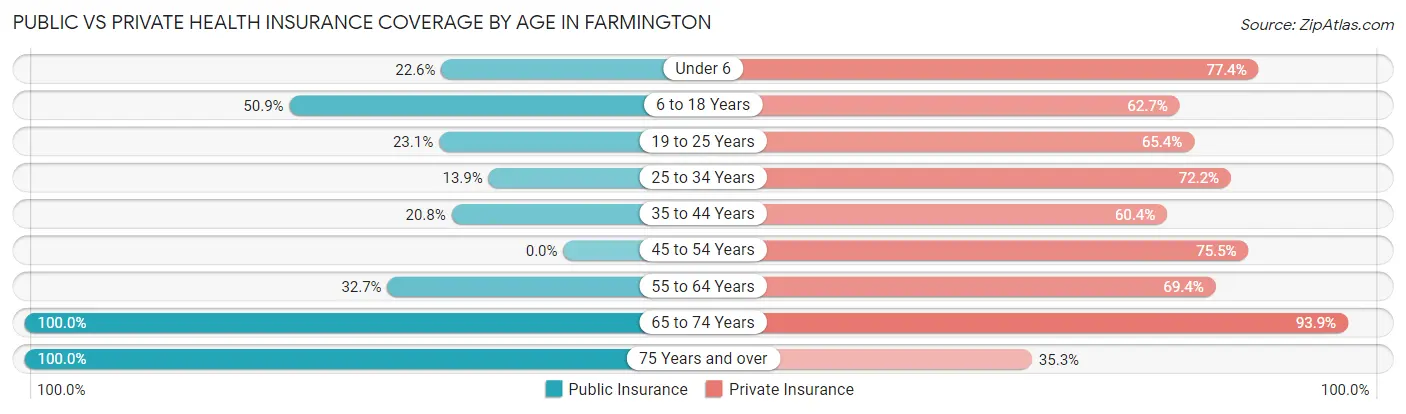
| Age Bracket | Public Insurance | Private Insurance |
| Under 6 | 12 (22.6%) | 41 (77.4%) |
| 6 to 18 Years | 30 (50.8%) | 37 (62.7%) |
| 19 to 25 Years | 12 (23.1%) | 34 (65.4%) |
| 25 to 34 Years | 5 (13.9%) | 26 (72.2%) |
| 35 to 44 Years | 11 (20.7%) | 32 (60.4%) |
| 45 to 54 Years | 0 (0.0%) | 40 (75.5%) |
| 55 to 64 Years | 16 (32.7%) | 34 (69.4%) |
| 65 to 74 Years | 33 (100.0%) | 31 (93.9%) |
| 75 Years and over | 34 (100.0%) | 12 (35.3%) |
| Total | 153 (36.3%) | 287 (68.0%) |
Disability Status by Sex by Age in Farmington
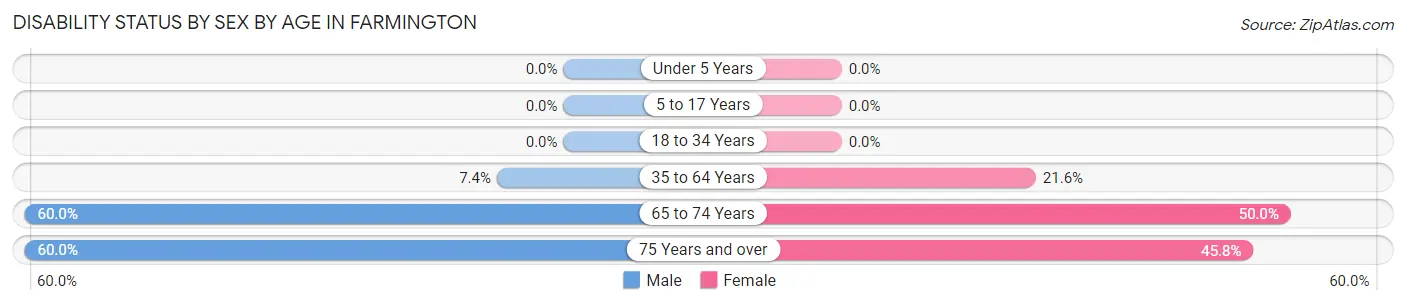
| Age Bracket | Male | Female |
| Under 5 Years | 0 (0.0%) | 0 (0.0%) |
| 5 to 17 Years | 0 (0.0%) | 0 (0.0%) |
| 18 to 34 Years | 0 (0.0%) | 0 (0.0%) |
| 35 to 64 Years | 6 (7.4%) | 16 (21.6%) |
| 65 to 74 Years | 9 (60.0%) | 9 (50.0%) |
| 75 Years and over | 6 (60.0%) | 11 (45.8%) |
Disability Class by Sex by Age in Farmington
Disability Class: Hearing Difficulty
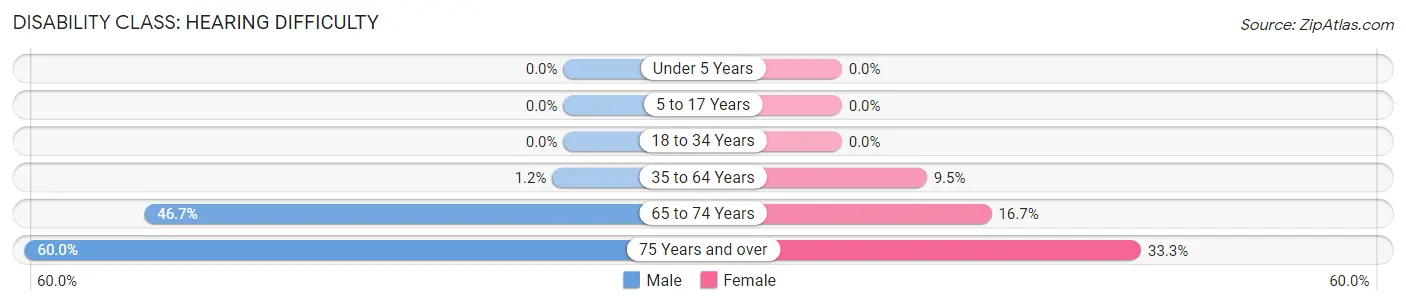
| Age Bracket | Male | Female |
| Under 5 Years | 0 (0.0%) | 0 (0.0%) |
| 5 to 17 Years | 0 (0.0%) | 0 (0.0%) |
| 18 to 34 Years | 0 (0.0%) | 0 (0.0%) |
| 35 to 64 Years | 1 (1.2%) | 7 (9.5%) |
| 65 to 74 Years | 7 (46.7%) | 3 (16.7%) |
| 75 Years and over | 6 (60.0%) | 8 (33.3%) |
Disability Class: Vision Difficulty
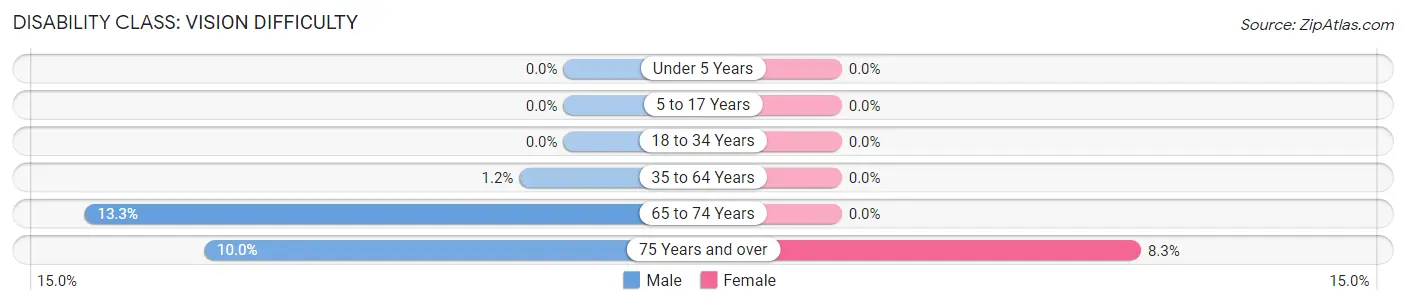
| Age Bracket | Male | Female |
| Under 5 Years | 0 (0.0%) | 0 (0.0%) |
| 5 to 17 Years | 0 (0.0%) | 0 (0.0%) |
| 18 to 34 Years | 0 (0.0%) | 0 (0.0%) |
| 35 to 64 Years | 1 (1.2%) | 0 (0.0%) |
| 65 to 74 Years | 2 (13.3%) | 0 (0.0%) |
| 75 Years and over | 1 (10.0%) | 2 (8.3%) |
Disability Class: Cognitive Difficulty
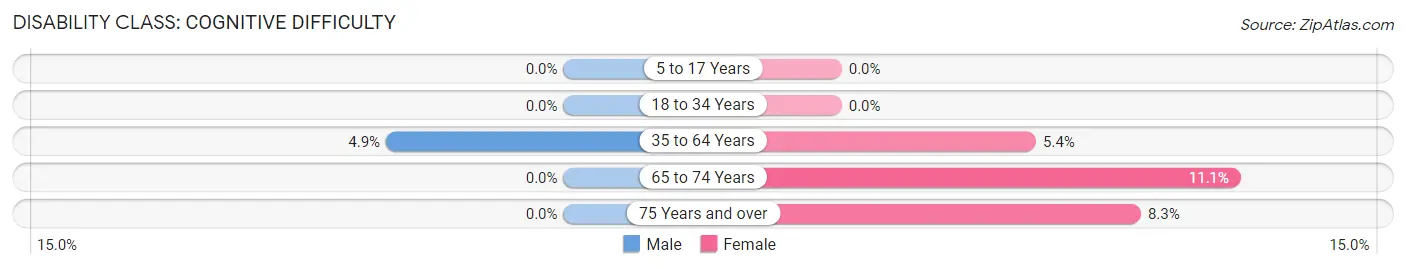
| Age Bracket | Male | Female |
| 5 to 17 Years | 0 (0.0%) | 0 (0.0%) |
| 18 to 34 Years | 0 (0.0%) | 0 (0.0%) |
| 35 to 64 Years | 4 (4.9%) | 4 (5.4%) |
| 65 to 74 Years | 0 (0.0%) | 2 (11.1%) |
| 75 Years and over | 0 (0.0%) | 2 (8.3%) |
Disability Class: Ambulatory Difficulty
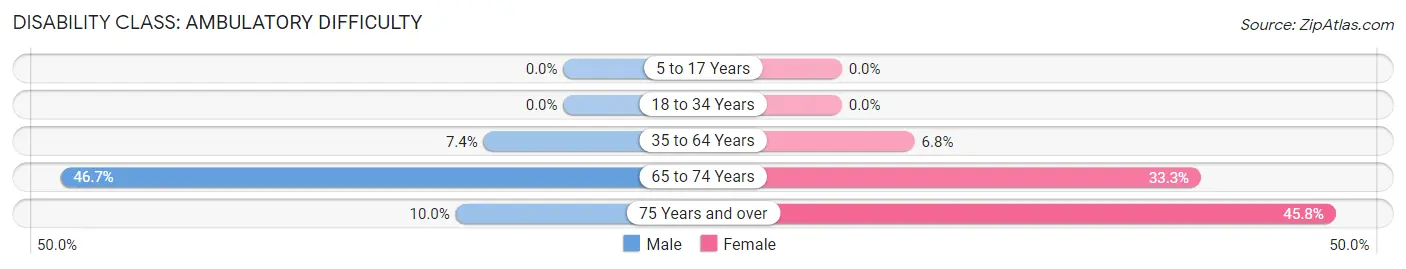
| Age Bracket | Male | Female |
| 5 to 17 Years | 0 (0.0%) | 0 (0.0%) |
| 18 to 34 Years | 0 (0.0%) | 0 (0.0%) |
| 35 to 64 Years | 6 (7.4%) | 5 (6.8%) |
| 65 to 74 Years | 7 (46.7%) | 6 (33.3%) |
| 75 Years and over | 1 (10.0%) | 11 (45.8%) |
Disability Class: Self-Care Difficulty
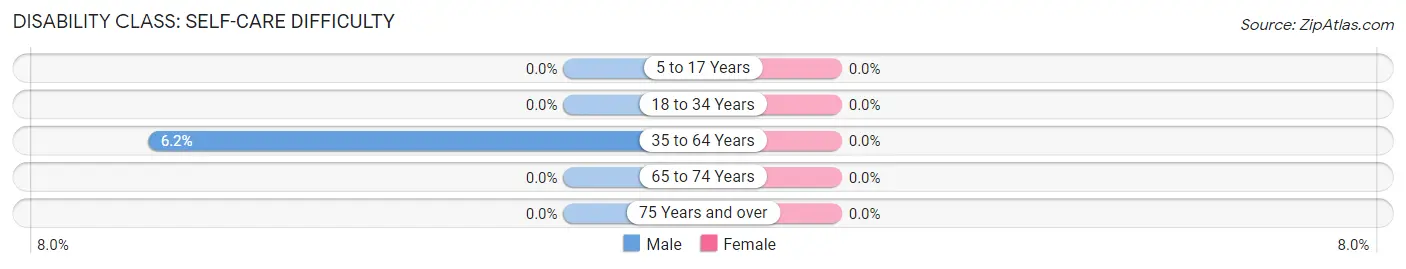
| Age Bracket | Male | Female |
| 5 to 17 Years | 0 (0.0%) | 0 (0.0%) |
| 18 to 34 Years | 0 (0.0%) | 0 (0.0%) |
| 35 to 64 Years | 5 (6.2%) | 0 (0.0%) |
| 65 to 74 Years | 0 (0.0%) | 0 (0.0%) |
| 75 Years and over | 0 (0.0%) | 0 (0.0%) |
Technology Access in Farmington
Computing Device Access in Farmington
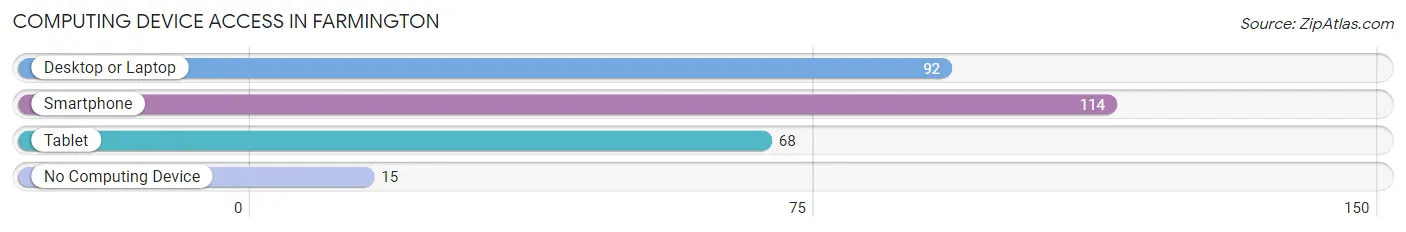
| Device Type | # Households | % Households |
| Desktop or Laptop | 92 | 69.7% |
| Smartphone | 114 | 86.4% |
| Tablet | 68 | 51.5% |
| No Computing Device | 15 | 11.4% |
| Total | 132 | 100.0% |
Internet Access in Farmington
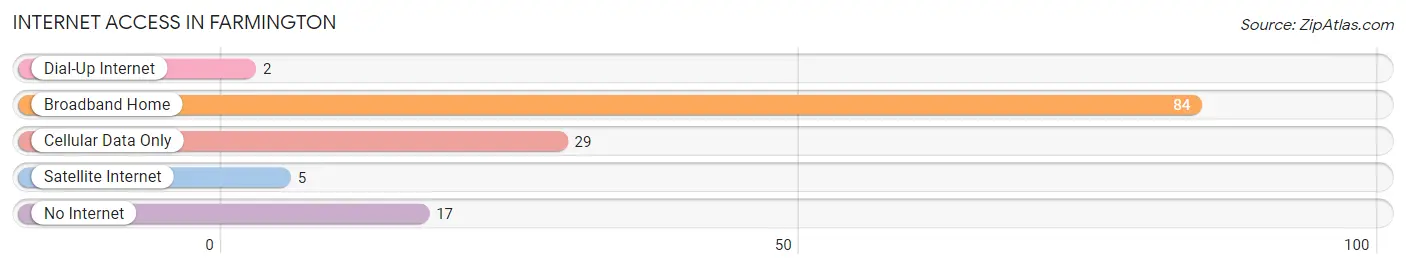
| Internet Type | # Households | % Households |
| Dial-Up Internet | 2 | 1.5% |
| Broadband Home | 84 | 63.6% |
| Cellular Data Only | 29 | 22.0% |
| Satellite Internet | 5 | 3.8% |
| No Internet | 17 | 12.9% |
| Total | 132 | 100.0% |
Farmington Summary
History
The town of Farmington, West Virginia is located in the northern part of the state in Marion County. It is situated along the Monongahela River, which is a major tributary of the Ohio River. The town was founded in 1817 by a group of settlers from Pennsylvania and Virginia. The town was named after the nearby town of Farmington, Pennsylvania.
The town of Farmington was an important stop on the National Road, which was the first federally funded highway in the United States. The road was built in the early 19th century to connect the eastern states with the western states. The town was also an important stop on the Baltimore and Ohio Railroad, which was built in the mid-19th century.
The town of Farmington was an important center of industry in the late 19th and early 20th centuries. The town was home to several coal mines, brickyards, and other industries. The town was also home to several large factories, including the Farmington Glass Works, which produced glass bottles and jars.
The town of Farmington was also an important center of education in the late 19th and early 20th centuries. The town was home to several schools, including the Farmington Academy, which was founded in 1845. The town was also home to several churches, including the First Presbyterian Church, which was founded in 1848.
Geography
Farmington is located in the northern part of West Virginia in Marion County. The town is situated along the Monongahela River, which is a major tributary of the Ohio River. The town is located at an elevation of 845 feet above sea level.
The town of Farmington is located in a hilly region of the Appalachian Mountains. The town is surrounded by several small mountains, including the Allegheny Mountains to the east and the Monongahela Mountains to the west. The town is located in a temperate climate, with hot summers and cold winters.
Economy
The economy of Farmington is largely based on agriculture and tourism. The town is home to several farms, which produce a variety of crops, including corn, soybeans, wheat, and hay. The town is also home to several wineries, which produce a variety of wines.
The town of Farmington is also home to several small businesses, including restaurants, shops, and other services. The town is also home to several manufacturing companies, which produce a variety of products, including furniture, clothing, and electronics.
Demographics
The population of Farmington was 1,845 in the 2010 census. The town has a population density of 1,072 people per square mile. The median age of the population is 43.7 years. The median household income is $37,941.
The town of Farmington is predominantly white, with 92.3% of the population identifying as white. The town is also home to a small African American population, with 4.2% of the population identifying as African American. The town is also home to a small Hispanic population, with 1.7% of the population identifying as Hispanic or Latino.
Common Questions
What is Per Capita Income in Farmington?
Per Capita income in Farmington is $25,429.
What is the Median Family Income in Farmington?
Median Family Income in Farmington is $67,000.
What is the Median Household income in Farmington?
Median Household Income in Farmington is $54,750.
What is Income or Wage Gap in Farmington?
Income or Wage Gap in Farmington is 48.3%.
Women in Farmington earn 51.7 cents for every dollar earned by a man.
What is Inequality or Gini Index in Farmington?
Inequality or Gini Index in Farmington is 0.37.
What is the Total Population of Farmington?
Total Population of Farmington is 422.
What is the Total Male Population of Farmington?
Total Male Population of Farmington is 199.
What is the Total Female Population of Farmington?
Total Female Population of Farmington is 223.
What is the Ratio of Males per 100 Females in Farmington?
There are 89.24 Males per 100 Females in Farmington.
What is the Ratio of Females per 100 Males in Farmington?
There are 112.06 Females per 100 Males in Farmington.
What is the Median Population Age in Farmington?
Median Population Age in Farmington is 37.1 Years.
What is the Average Family Size in Farmington
Average Family Size in Farmington is 3.6 People.
What is the Average Household Size in Farmington
Average Household Size in Farmington is 3.2 People.
How Large is the Labor Force in Farmington?
There are 218 People in the Labor Forcein in Farmington.
What is the Percentage of People in the Labor Force in Farmington?
65.1% of People are in the Labor Force in Farmington.
What is the Unemployment Rate in Farmington?
Unemployment Rate in Farmington is 5.0%.